1
Tutorial #3: Procedures
NetLogo 3.1 User Manual
In Tutorial #2, you learned how to use command centers and agent monitors to inspect
and modify agents and make them do things. Now you're ready to learn about the real
heart of a NetLogo Model: the Procedures tab. This tutorial leads you through the process
of building a complete model, built up stage by stage, with every step explained along the
way.
You've already been exposed to the three types of agents you can give commands to in
NetLogo: turtles, patches, and the observer. As you start to write your own procedures, it'll
be helpful to keep in mind how people usually think of these three different kinds of agents.
The turtles and patches usually don't use information about the whole world. They mostly
use information about what's close to them. The observer, on the other hand, typically
uses and accesses the whole world. Also, while patches can't move and often represent
some sort of environment, turtles can move around in the world.
Setup and Go
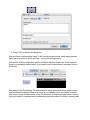
To start a new model, select "New" from the the File menu. Then begin making your model
by creating a once button called 'setup'.
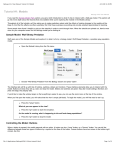
Here's how to make the button:
1. Click on the button icon in the Toolbar
2. Click where you want the button to be in the empty white area of the Interface tab
3. When the dialog box for editing the properties of the button opens, type setup in the
box labeled "Code"
4. Press "OK" to dismiss the dialog box
Now you have a button called 'setup'. It will execute the procedure 'setup' when pressed,
which once we define it, will do just that -- set up the NetLogo world.
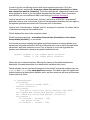
At this point, both the new button and the Interface tab have turned red. That's because
there is no procedure called 'setup'! If you want to see the actual error message, click on
the button:
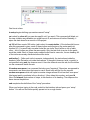
Now switch to the Procedures Tab and create the 'setup' procedure shown below. Notice
that the lines are indented different amounts. A lot of people find it very helpful to indent
their code in a way at least similar to how it's done here. It helps them keep track of where
they're at inside of a procedure and makes what they write easier for others to read as well.
One line at a time:
to setup begins defining a procedure named "setup".
ca is short for clear-all (you can also spell it out if you want). This command will blank out
the view, initialize any variables you might have to 0, and remove all turtles. Basically, it
wipes the slate clean for a new run of the project.
crt 100 will then create 100 turtles. (crt is short for create-turtles.) If the turtles didn't move
after this command is given, each of these turtles would begin on the center patch (at
location 0,0). You would only see what looks like one turtle; they'd all be on top of each
other -- lots of turtles can share the same patch. Only the last turtle to arrive on the patch
would be visible. Each of these newly-created turtles has its own color, its own heading. All
of the turtles are evenly distributed around the circle.
ask turtles [ ... ] tells each turtle to execute, independently, the instructions inside the
brackets. Note that crt is not inside the brackets. If the agent (observer, turtle, or patch) is
not specified using ask, the observer runs it. Here the observer runs the ask, but the turtles
run the commands inside the ask.
fd random max-pxcor is a command that also uses "reporters". Reporters, as opposed to
commands, are instructions that report a result. Each turtle will first run the reporter
random max-pxcor which will report a random integer at least 0 but less than 'max-pxcor'
(the largest patch coordinate in the x direction). It then takes this number, and goes fd
(short for forward) that number of steps, in the direction of its heading. The steps are the
same size as the patches.
end completes the definition of the "setup" procedure.
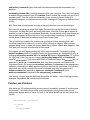
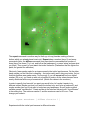
When you're done typing in the code, switch to the Interface tab and press your 'setup'
button . You will see the turtles quickly spread out in a rough cluster:
Notice the density distribution of the turtles in the view. Press 'setup' a couple more times,
and watch how the turtles' arrangement changes. Keep in mind that some turtles may be
right on top of each other.
Can you think of other ways to randomly distribute the turtles around the world? Note that if
a turtle moves off the edge of the view, it "wraps", that is, comes in the other side. (this is
the default behavior, it can be modified, see the Topology section of the Programming
Guide for more information)
Make a forever button called 'go'. Again, begin by creating a button, but this time check the
"forever" checkbox in the edit dialog.
Then add its procedure to the Procedures tab:
to go
move-turtles
end
But what is move-turtles? Is it a primitive (in other words, built-in to NetLogo), like fd is?
No, it's a procedure that you're about to write, right after the go procedure:
to move-turtles
ask turtles [
set heading random 360
fd 1
]
end
Be careful of the spacing around the "-". In Tutorial #2 we used red - 2, with spaces, in
order to subtract two numbers, but here we want move-turtles, without spaces. The "-"
combines 'move' and 'turtles' into one word.
Line by line:
ask turtles [ commands ] says that each turtle should execute the commands in the
brackets.
set heading random 360 is another command that uses a reporter. First, each turtle picks
a random integer between 0 and 359 (random doesn't include the number you give it as a
possible result). Then the turtle sets its heading to the number it picked. Heading is
measured in degrees, clockwise around the circle, starting with 0 degrees at twelve o'clock
(north).
fd 1: Each turtle moves forward one step in the new direction it just set its heading to.
Why couldn't we have just written that in go? We could, but during the course of building
your project, it's likely that you'll add many other parts. We'd like to keep go as simple as
possible, so that it is easy to understand. Eventually, it could include many other things you
want to have happen as the model runs, such as calculating something or plotting the
results. Each of these sub-procedures could have its own name.
The 'go' button you made in the Interface tab is a forever button, meaning that it will
continually execute its code until you shut it off (by clicking on it again). After you have
pressed 'setup' once, to create the turtles, press the 'go' button. Watch what happens. Turn
it off, and you'll see that all turtles stop in their tracks.
We suggest you start experimenting with other turtle commands. You might try typing
turtles> pendown into the Command Center and then pressing go. Another thing to try is
changing set heading random 360 to rt random 360 inside of move-turtles. ("rt" is short
for "right turn".) Also, you can try changing set heading random 360 to lt random 45
inside of move-turtles. Type commands into the Command Center (like set colorred), or
add them to setup, go, or move-turtles. Note that when you enter commands in the
Command Center, you must choose turtles>, patches>, or observer> in the popup menu
on the left, depending on which agents are going to execute the commands. You can also
use the tab key, which you might find more convenient than using the popup menu.
turtles>commands is identical to observer> ask turtles [ commands ], and
patches>commands is identical to O> ask patches [ commands ].
Play around. It's easy and the results are immediate and visible -- one of NetLogo's many
strengths. Regardless, the tutorial project continues...
Patches and Variables
Now we've got 100 turtles aimlessly moving around, completely unaware of anything else
around them. Let's make things a little more interesting by giving these turtles a nice
background against which to move. Go back to the 'setup' procedure. We can rewrite it as
follows:
patches-own [elevation]
to setup
ca
setup-patches
setup-turtles
end
The line at the top, patches-own [elevation] declares that we have a variable for the
patches, called elevation. Our 'setup-patches' procedure that we haven't defined yet will
then use this variable. We also still need to define 'setup-turtles' as well, but, for now,
here's how to define setup-patches:
to setup-patches
ask patches
[ set elevation random 10000 ]
diffuse elevation 1
ask patches
[ set pcolor scale-color green elevation 1000 9000 ]
end
The setup-patches procedure sets the elevation and color of every patch. First, each
patch picks a random integer between 0 and 9999 and sets its elevation variable to that
number.
We then use an observer primitive, diffuse, that smoothes out the distribution of this
variable over the neighboring patches. Remember that primitives are built in procedures in
NetLogo, as opposed to procedures that you define.
Scale-color is a reporter that uses the different values of elevation to assign colors to the
patches. In this case, we're assigning different shades of green to all the patches. (Don't
worry about the numbers given to diffuse and scale-color just yet...) The larger elevation
is, the lighter the shade of green. Low values of elevation will result in darker shades.
The only part remaining in our new 'setup' that is still undefined is setup-turtles:
to setup-turtles
crt 100
ask turtles
[ fd random max-pxcor ]
end
Setup-turtles is exactly what we were doing in the old setup procedure.
After typing all of this in, press the 'setup' button back in the Interface tab. Voila! A lush
NetLogo landscape complete with turtles and green patches appears. After seeing the new
'setup' work a few times, you may find it helpful to read through the procedure definitions
again.
Here's a way for you to see what diffuse does. Return to the Procedures tab, and use a
semicolon to 'deactivate' the diffuse command like this:
;diffuse elevation 1
Semicolons are very useful in writing procedures. They can be used as above to save you
from having to delete code to try something else out and then having to rewrite them. Also,
they can be used to add some explanatory text to your procedures. A lot of people like to
do this to make their procedures more readable to others. Notice that all the text to the right
of a semicolon becomes gray.
Press 'setup' again -- looks different, doesn't it? This is because, as mentioned above,
diffuse has each patch share its value of elevation with all its neighbors, by having every
patch reset its value of elevation to a new value that depends on the value of elevation all
around it. For further explanation of how diffuse works, go to the Primitives Dictionary if
you'd like. Also, it may help to toy with the values being passed to it and see what happens.
We're now prepared to create some kind of dialog between the turtles and the patches. In
fact, we even have an idea for a project here. Notice that we called the patch variable
'elevation', and that our landscape sort of looks topographical? We're going to have our
turtles do what is called 'hill-climbing', where every turtle seeks to find the highest elevation
it can.
In order to do this, we will learn how to write more complex instructions. Go to the
Command Center, and type O> show max values-from patches [elevation] and show
min values-from patches [elevation]. These two reporters will, respectively, search over
all the patches to return to you the highest elevation and the lowest. These commands
work like this (you can read about them in the NetLogo Primitives Dictionary):
Look up 'values-from' in the dictionary. It shows "values-from AGENTSET [expression]"
and says it returns a list. In this case, it looks at the expression (elevation) for each agent in
the agentset (patches) and returns all of these as a list of elevations.
Look up 'min' in the dictionary. It shows "min list " and says it's a reporter. So it takes the list
of elevations and reports the smallest value.
'Show' displays this value in the command center.
We will use these reporters -- max values-from patches [elevation] and min valuesfrom patches [elevation] -- in our model.
Just in case we end up needing the highest and lowest elevation in several places in our
procedures, let's make a shortcut. We'll do a little extra work now so that if we need these
values later, we'll have a shortcut to use. First, at the top of your code (right after the
'patches-own' declaration), declare two global variables as such:
globals [highest ;; the highest patch elevation
lowest] ;; the lowest patch elevation
(Notice the use of semicolons here. Although the names of the global variables are
descriptive, the semicolons allow us to describe the variables even more.)
Global variables can be used by all the agents in the model. In particular, patches can use
highest and lowest in the setup-patches procedure. We need to store the highest and
lowest elevations in these global variables once, and then everyone will have quick access
to them after that. Write:
to setup-patches
ask patches
[ set elevation random 10000 ]
diffuse elevation 1
ask patches
[ set pcolor scale-color green elevation 1000 9000 ]
set highest max values-from patches [elevation]
set lowest min values-from patches [elevation]
ask patches [
if elevation > (highest - 100)
[set pcolor white]
if elevation < (lowest + 100)
[set pcolor black] ]
end
Now we have saved the highest and lowest points in our terrain and displayed them
graphically.
Look at the last two commands, the if commands. Each patch, when it runs these
commands, compares its own value of elevation to our global variables highest and
lowest. If the comparison reports 'true', the patch executes the commands inside the
brackets. In this case, the patch changes its color. If the comparison reports 'false', the
patch skips over the commands inside the brackets.
These ifs cause all patches whose value of elevation is NEAR to the highest (within about
1% for our values) change their color to white, and all patches whose values are NEAR to
the lowest become black. We want this so that they'll be easier to see. You can make a
couple of quick changes here if you wish -- they won't affect the rest of the model. For
example, instead of saying 'set pcolor white' and 'set pcolor black', you can say 'set pcolor
blue' and 'set pcolor red' (or whatever other colors you may wish). Also, you can change
the range of 'highest peaks' and 'lowest peaks' by changing the number 100 to some other
number.
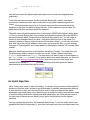
After this, create two monitors in the Interface tab with the Toolbar. (You make them just
like buttons and sliders, using the monitor icon on the Toolbar.) Name one of them
highest and the other one lowest. The reporters you'll want in each of them happen to
be highest and lowest as well. (If you want to learn more about reporters, you can look
them up in the NetLogo Programming Guide). Now every time you click 'setup' and
redistribute the values of elevation, you'll know exactly what the highest and lowest
elevations are, and where they can be found.
An Uphill Algorithm
Okay. Finally we're ready to start hill-climbing. To rehash: we've got some turtles randomly
spread out from the origin; and we've got a landscape of patches, whose primary attribute
is their elevation. Lastly, we have two kinds of tools to help us understand the patch
landscape: each patch has a color, depending on its value of elevation, and we have a pair
of monitors telling us what the highest peak and lowest valley are. What we need now is
for the turtles to wander around, each trying to get to the patch that has the highest
elevation.
Let's try a simple algorithm first. We'll assume three things: 1), that the turtles cannot see
ahead farther than just one patch; 2), that each turtle can move only one square each turn;
and 3), that turtles are blissfully ignorant of each other. Before, we had a procedure moveturtles like this:
to move-turtles
ask turtles [
set heading random 360
fd 1
]
end
But now we don't want them to move randomly about. We want each turtle to look at the
elevation of each patch directly around it, and move to the patch with the highest elevation.
If none of the patches around it have a higher elevation than the patch it is on, it'll stay put.
This new procedure should replace 'move-turtles' inside of 'go'. Type in the following code
and run it once or twice:
;; each turtle goes to the highest elevation in a radius of one
to move-to-local-max
ask turtles [
set heading uphill elevation
if (elevation-of patch-ahead 1) > elevation
[ fd 1 ]
]
end
Now that you've seen the uphill algorithm work in the model, let's go through the new
primitives involved. (If you haven't run the model yet since writing 'move-to-local-max', give
it a try.) There are three new primitives here: 'uphill', '-of', and 'patch-ahead'. 'uphill
elevation' finds the heading to the patch with the highest value of elevation in the patches in
a one-patch radius of the turtle. Then through the use of the command 'set heading', the
turtle sets its heading to that direction. 'elevation-of patch-ahead 1' has each turtle look at
the variable elevation in the patch on which the turtle would be if it went forward 1. If the
test reports true, the turtle moves itself forward 1. (The test is necessary because if the
turtle is already on the peak, we don't want it to move off it!)
Go ahead and type that in, but before you test it out by pressing the 'go' button, ask
yourself this question: what do you think will happen? Try and predict how a turtle will
move, where it will go, and how long it'll take to get there. When you're all set, press the
button and see for yourself.
Surprised? Try to understand why the turtles converge to their peaks so quickly. Maybe
you don't believe the algorithm we've chosen works 'correctly'. There's a simple procedure
you can make to test it. write a procedure recolor-patches so that it says:
to recolor-patches
ask patches
[
set elevation pycor
set pcolor scale-color green elevation
min-pycor max-pycor
]
end
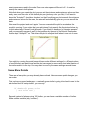
Press 'setup'. The model looks the same as it did before because recolor-patches hasn't
been run yet. Instead of making a button that calls your testing procedure, let's do
something different. Type observer>recolor-patches into the command center, the
procedure gets called. Now, when you press 'go', see that the turtles all head for the
highest elevation -- the top of the screen.
Another common tool to see what's going on is to write turtles> pd in the Command
Center. Then each turtle traces its path with its color. This will show you where the turtle
has been.
Our turtles rapidly arrive at local maxima in our landscape. Local maxima and minima
abound in a randomly generated landscape like this one. Our goal is to still get the turtles
to find an 'optimal maximum', which is one of the white patches.
Part of the problem is that our terrain is terribly lumpy. Every patch picked a random
elevation, and then we diffused these values one time. This really doesn't give us a
continuous spread of elevation across the view, as you might have noticed. We can
correct this problem to an arbitrary degree by diffusing more times. Replace the line:
diffuse elevation 1
with:
repeat 5 [ diffuse elevation 1 ]
The repeat command is another way for NetLogo to loop (besides making a forever
button, which you already know how to do). Repeat takes a number (here, 5) and some
commands (here, the diffuse command), and executes the commands that number of
times (here, five times). Try it out, and look at the landscape (i.e. press 'setup' and see what
you think). Then, press 'go' and watch the turtles' behavior. (Remember that the lighter the
patch, the greater the elevation.)
Obviously, fewer peaks make for an improvement in the turtles' performance. On the other
hand, maybe you feel like this is cheating -- the turtles really aren't doing any better, it's just
that their problem was made easier. True enough. If you call repeat with an even higher
number (20 or so), you'll end up with only a handful of peaks, as the values become more
evenly distributed with every successive call. (Watch the values in the monitors.)
In order to specify how 'smooth' you want your world to be, let's make it easier to try
different values. Maybe one time you'll want the turtles to try and 'solve a hard world', and
maybe another time you'll just want to look at an easy landscape. So we'll make a global
variable named "smoothness". Create a slider in the Interface tab and call it "smoothness"
in the editing box. The minimum can be 0, and the maximum can be 25 or so. Then
change your code to:
repeat smoothness [ diffuse elevation 1 ]
Experiment with the turtles' performance in different terrains.
We still haven't even begun to solve the problem of getting all the turtles to the highest
elevation, though. So far we've just been getting the turtles to the highest point that's near
them. If a turtle starts off in one corner of the world on a hill and there's a mountain in a
different corner, the turtle will never find the mountain. To find the mountain, the turtle
would have to go down off the hill first, but in our model, turtles only move up. Notice that
the individual turtles don't use 'highest' anywhere. The turtles just look at elevations close
to them and go the highest point they can see.
Before trying something else, it'd be nice if we could have some other, more precise
method for evaluating the turtles' performance. Fortunately, NetLogo allows us to plot data
as we go along.
To make plotting work, we'll need to create a plot in the Interface tab, and set some
settings in it. Then we'll add one more procedure to the Procedures tab, which will update
the plot for us.
Let's do the Procedures tab part first. Change go to call the new procedure we're about to
add:
to go
move-to-local-max
do-plots
end
Now add the new procedure. What we're plotting is the number of turtles who've reached
our 'peak-zone' (within 1% of the highest elevation) at some given time.
to do-plots
set-current-plot "Turtles at Peaks"
plot count turtles with
[ elevation >= (highest - 100) ]
end
Note that we use the plot primitive to add the next point to a plot, but before doing that, we
need to tell NetLogo which plot we want, since later our model might have more than one
plot.
Thus we're plotting the number of turtles within 100 units of our maximum elevation at
some given point in time. The plot command moves the current plot pen to the point that
has x- coordinate equal to 1 greater than the old x- coordinate and y-coordinate equal to
the value given in the plot command (in this case, the number of turtles whose elevation is
within 100 of highest). Then the plot command draws a line from the current position of the
plot pen to the last point it was on.
In order for set-current-plot "Turtles at Peaks" to work, you'll have to add a
plot to your model in the Interface tab, then edit it so its name is "Turtles at Peaks", the
exact same name used in the code. Even one extra space will throw it off -- it must be
exactly the same in both places.
Note that when you create the plot you can set the minimum and maximum values on the x
and y axes, and the color of the default plot pen (pick any color you like). You'll want to
leave the "Autoplot?" checkbox checked, so that if anything you plot exceeds the minimum
and maximum values for the axes, the axes will automatically grow so you can see all the
data.
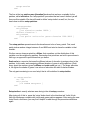
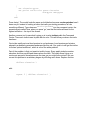
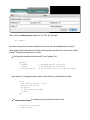
Now reset the project and run it again. You can now watch the plot be created as the
model is running. If you notice that your plot doesn't look exactly like the picture below, try
to think about why it doesn't look the same. If you think it's because 'go' remains pressed
until you manually unpress it, we'll fix that problem by the end of the tutorial. Remember
that we kept "Autoplot?" on. This allows the plot to readjust itself when it runs out of room.
You might try running the model several times under different settings (i.e. different values
of smoothness) and watch how fast the plot converges to some value, and what fraction of
the turtles make it to the top. You may want to even try the same settings several times.
Some More Details
There are a few quirks you may already have noticed. Here are some quick changes you
can make.
First, we have a green landscape -- a naturally green turtle is going to be hard to see. In the
ask turtles block in 'setup-turtles', you can say:
if shade-of? green color
[ set color red ]
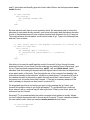
Second, instead of always using 100 turtles, you can have a variable number of turtles.
Make a slider variable (say, 'number'):
Then, inside of setup-turtles, instead of 'crt 100', you can type:
crt number
How does using more or fewer turtles affect the success value displayed by the plot?
Third, when all the turtles have found their local maxima, wouldn't it be nice for the model
to stop? This requires a few lines of code.
Add a global variable turtles-moved? to the "globals" list:
globals [
highest
lowest
turtles-moved?
]
;; maximum patch elevation
;; minimum patch elevation
;; so we know when to stop the model
At the end of the go procedure, add a test to see if any turtles have moved.
to go
set turtles-moved? false
move-to-local-max
do-plots
if not turtles-moved?
[ stop ]
end
In move-to-local-max if a turtle moves, set turtles-moved? to true.
to move-to-local-max
ask turtles [
set heading uphill elevation
if elevation-of patch-ahead 1 > elevation
[
fd 1
set turtles-moved? true
]
]
end
Finally, what rules can you think of that would help turtles escape from lower peaks and all
get to the highest ones? Try writing them.
What's Next?
So now you have a nice framework for exploring this problem of hill-climbing, using all
sorts of NetLogo modeling features: buttons, sliders, monitors, plots, and the view. You've
even written a quick procedure to give the turtles something to do. And that's where this
tutorial leaves off.
If you'd like to look at some more documentation about NetLogo, the Interface Guide
section of the manual walks you through every element of the NetLogo interface in order
and explains its function. For a detailed description and specifics about writing procedures,
refer to the NetLogo Programming Guide.
Also, You can continue with this model if you'd like, experimenting with different variables
and algorithms to see what works the best (what makes the most turtles reach the peaks).
Alternatively, you can look at other models (including the many models in the Code
Examples section of the Models Library) or even go ahead and build your own model. You
don't even have to model anything. It can be pleasant just to watch patches and turtles
forming patterns, or whatever. Hopefully you will have learned a few things, both in terms
of syntax and general methodology for model- building. The entire code that was created
above is shown below.
Appendix: Complete Code
The complete model is also available in NetLogo's Models Library, in the Code Examples
section. It's called "Tutorial 3".
patches-own [ elevation ]
globals [
highest
lowest
turtles-moved?
]
;; elevation of the patch
;; maximum patch elevation
;; minimum patch elevation
;; so we know when to stop the model
;;
;;
;;
;;
We also have two slider variables, 'number' and
'smoothness'. 'number' determines the number of
turtles, and 'smoothness' determines how erratic
terrain becomes during diffusion of 'elevation'.
;; resets everything
to setup
ca
setup-patches
setup-turtles
end
;; creates a random landscape of patch elevations
to setup-patches
ask patches [set elevation random 10000 ]
repeat smoothness [diffuse elevation 1 ]
ask patches
[ set pcolor scale-color green elevation 1000 9000 ]
set highest max values-from patches [elevation]
set lowest min values-from patches [elevation]
ask patches [
if elevation > (highest - 100)
[set pcolor white]
if elevation < (lowest + 100)
[set pcolor black]
]
end
;; initializes the turtles
to setup-turtles
crt number
ask turtles [
if shade-of? green color [ set color red ]
fd random max-pxcor
]
end
;; RUN-TIME PROCEDURES
;; main program control
to go
set turtles-moved? false
move-to-local-max
do-plots
if not turtles-moved?
[ stop ]
end
;; each turtle goes to the highest elevation in a radius of one
to move-to-local-max
ask turtles [
set heading uphill elevation
if (elevation-of patch-ahead 1) > elevation
[
fd 1
set turtles-moved? true
]
]
end
to do-plots
set-current-plot "Turtles at Peaks"
plot count turtles with
[ elevation >= (highest - 100) ]
end