1
BLOOD GLUCOSE MEASUREMENT THROUGH URINE STRIP
USING A PHOTOSENSOR
NG JIUN WOEI
UNIVERSITI TEKNOLOGI MALAYSIA
PSZ 19:16 (Pind. 1/07)
UNIVERSITI TEKNOLOGI MALAYSIA
DECLARATION OF THESIS / UNDERGRADUATE PROJECT PAPER AND COPYRIGHT
Author’s full name :
NG JIUN WOEI
Date of birth
:
23 JUNE 1986
Title
:
BLOOD GLUCOSE MEASUREMENT THROUGH URINE STRIP
USING A PHOTOSENSOR
Academic Session :
2009/2010
I declare that this thesis is classified as:
√
CONFIDENTIAL
(Contains confidential information under the Official Secret
Act 1972)*
RESTRICTED
(Contains restricted information as specified by the
organisation where research was done)*
OPEN ACCESS
I agree that my thesis to be published as online open access
(full text)
I acknowledged that Universiti Teknologi Malaysia reserves the right as follows :
1. The thesis is the property of Universiti Teknologi Malaysia.
2. The Library of Universiti Teknologi Malaysia has the right to make copies for
the purpose of research only.
3. The Library has the right to make copies of the thesis for academic
exchange.
Certified by :
SIGNATURE
860623-59-5267
(NEW IC NO. /PASSPORT NO.)
Date: 25 APRIL 2010
NOTES
:
*
SIGNATURE OF SUPERVISOR
En. Wan Mohd Fatihil Kamal
NAME OF SUPERVISOR
Date : 25 APRIL 2010
If the thesis is CONFIDENTIAL or RESTRICTED, please attach with the
letter from the organisation with period and reasons for
confidentiality or restriction.
Date: 7 MAY 2009
MAY 2009
Date : 7
"We declare that we have read this work and in
our opinion this work is adequate in terms of scope and
quality for the purpose of awarding a degree of
Bachelor of Engineering (Electrical – Medical Electronics)"
Signature
:
Name of Supervisor 1 :
Date
:
Signature
:
Name of Supervisor 2 :
Date
:
MR WAN MOHD FATIHIL KAMAL
26 APRIL 2010
IR. DR-ING. EKO SUPRIYANTO
26 APRIL 2010
BLOOD GLUCOSE MEASUREMENT THROUGH URINE STRIP USING A
PHOTOSENSOR
NG JIUN WOEI
Submitted to the Faculty of Electrical Engineering
in partial fulfillment of the requirements for the award of the
Bachelor of Engineering (Electrical – Medical Electronics)
Faculty of Electrical Engineering
University of Technology Malaysia
APRIL 2010
ii
I declare that this thesis entitled “Blood Glucose Measurement Through Urine Strip
Using A Photosensor” is the result of my own research except as cited in the
references. The thesis has not been accepted for any degree and is not concurrently
submitted in candidature of any other degree.
Signature
:
Author‟s Name
:
NG JIUN WOEI
Date
:
25 APRIL 2010
iii
Dedicated, in thankful appreciation for support, encouragement and understandings
to my beloved father, mother, brother, sister, lecturers and friends.
iv
ACKNOWLEDGEMENTS
First and foremost, I would like to express my sincere appreciation to both of
my Final Year Project supervisors Mr Wan Mohd Fatihil Kamal and Dr. Eko
Supriyanto for their continuous guidance, encouragement and thought that has given
to me through completing this project.
My appreciation also goes to my beloved family for their understanding,
endless love and support, emotionally and financially all these years.
I would also like to thank CLEANER LAB team (staff and students) for their
co-operations, guidance, help and invaluable assistance in this project.
Special thanks also goes to Mohd Najeb bin Jamaludin for his kindly help and
supports. And for those who give me support directly or indirectly to finish my final
year project and throughout my 8 semesters in UTM, thank you very much.
v
ABSTRACT
There are nearly about 1.2 million people in Malaysia who have diabetes.
And it is known that diabetes can be diagnosed in human body with normally 2 ways
which through blood and urine. The measurement of glucose concentration in the
blood is an invasive method whereas the measurement of urine glucose value is a
non-invasive method. So, the aim of this project is to develop another method of
blood glucose concentration measurement by just using urine of a person only. It is a
non-invasive method which only taking the urine sample instead of blood sample.
This method is done with finding the relationship between the outputs (in kHz) from
the photosensor with the blood glucose values (in mmol/L) obtained from the blood
analyzer. A linear relationship has successfully obtained and the blood glucose
concentration value will be shown on the personal computer (pc). A system used for
blood glucose measurement through urine strip using a photosensor has been
successfully developed and the range of measurement is from 0 to 22mmol/L.
vi
ABSTRAK
Di Malaysia, terdapat hampir sebanyak 1.2 juta penduduk yang menghidapi
diabetes. Dua kaedah yang biasa digunakan untuk memantau kandungan glukosa di
tubuh badan adalah melalui darah dan juga kandungan air kencing. Pemantauan
kandungan glukosa melalui darah adalah kaedah secara dalaman manakala melalui
kencing adalah kaedah secara luaran. Jadi, satu kaedah yang lain telah ditemui dalam
projek ini adalah memantau kandungan glukosa di dalam darah dengan hanya
menggunakan sampel kencing seseorang sahaja. Sementara itu,satu hubungan terus
antara kandungan glukosa dalam darah dengan hasil keluaran (dalam kHz) melalui
photosensor telah ditemui. Dan angka untuk setiap kandungan glukosa dalam darah
yang didapati akan dipaparkan dalam sistem komputer. Dengan itu, satu sistem untuk
mengukur glukosa darah melalui jalur air kencing dengan menggunakan satu
photosensor telah berjaya diciptakan dan julat pengukuran sistem ini adalah bermula
dari 0 hingga 22 mmol/L.
vii
TABLE OF CONTENTS
CHAPTER
1
TITLE
PAGE
DECLARATION
ii
DEDICATION
iii
ACKNOWLEDGEMENTS
iv
ABSTRACT
v
ABSTRAK
vi
TABLE OF CONTENTS
vii
LIST OF TABLES
x
LIST OF FIGURES
xi
LIST OF ABBREVIATIONS
xiii
LIST OF APPENDICES
xiv
INTRODUCTION
1
1.1
Background
1
1.2
Problem Statement
2
1.3
Objective of Project
2
1.4
Scope of Project
3
1.5
Work Breakdown
3
1.6
Work Flow
4
1.7
Gantt Chart
6
1.8
Thesis Outline
7
viii
2
LITERATURE REVIEW
9
2.1
Formation of Urine
9
2.2
Types of Diabetes
10
2.3
Diagnostic Devices Used to Detect Glucose
11
Level
2.3.1 Blood Glucose Meter
11
2.3.2 Urisys 1100
13
2.4
Urine Strips
14
2.5
Unit Used for Glucose Concentration in
16
Human Body
2.6
Principles of Reflective Color Sensor
17
2.7
Microcontroller
21
2.8
Serial Port Interface-UC00A Method (USB
22
to UART Convertor)
2.9
SK40C Enchanced 40 Pins PIC Start-Up Kit
24
2.10
Toggle Switch Single Pole Double Throw
24
(SPDT)
2.11
3
Visual Basic.NET (VB.NET)
26
DESIGN AND IMPLEMENTATION
27
3.1
Introduction
27
3.2
Hardware Implementation
28
3.2.1 Photosensor used: Reflective Color
28
Sensor Assembly OPT780Z
3.2.2 Printed Circuits Board (PCB) Design
29
for Photosensor
3.2.3 Switches
3.2.3.1 For 4 Variable Logical Inputs
30
31
of Photosensor
3.2.3.2 For Portable Power Supply
3.2.4 Troubleshooting by Making a
31
32
Portable Power Supply
3.2.5 Embedded ADC in PIC16F877A
32
ix
Microcontroller
3.3
3.2.6 Photosensor Box
33
Software Implementation
34
3.3.1 Analog to Digital (A/D) Converter
35
(ADC) of PIC18F452
3.4
4
3.3.2 Graphical User Interface (GUI)
36
Hardware and Software Implementation
37
RESULT AND ANALYSIS
39
4.1
Introduction
39
4.2
Testing the Functionality of the Photosensor
39
4.2.1 Procedures
40
4.3
Samples Collection and Testing
41
4.4
Results Obtained From Samples Testing
41
4.4.1 For Red Filter Selected As Input of
42
Phosensor
4.4.2 For Green Filter Selected As Input of
42
Photosensor
4.4.3 For Blue Filter Selected As Input of
43
Photosensor
4.4.4 For Clear Filter Selected As Input of
44
Photosensor
4.5
5
Discussions
45
CONCLUSION
47
5.1
Conclusion
47
5.2
Recommendation
47
REFERENCES
Appendices A - E
48
50 - 75
x
LIST OF TABLES
TABLE
TITLE
PAGE
1.1
Gantt Chart of the project schedule for semester 1
6
1.2
Gantt Chart of the project schedule for semester 2
7
3.1
Components that Build Up Photosensor circuit
30
3.2
Table of Variable Inputs of Photosensor
30
4.1
Result Analysis
46
xi
LIST OF FIGURES
FIGURE NO.
TITLE
PAGE
1.1
Work Breakdowns for the Project
4
1.2
Work flow of This Project
5
2.1
Formation of Urine
10
2.2
Blood Glucose Meter
12
2.3
Flow of Blood Glucose Testing
12
2.4
Urisys 1100
13
2.5
Flow System of Urisys 1100
14
2.6
Examples of Urine Strips
15
2.7
Examples of Reference Color Chart
15
2.8
Chemical Reactions for Glucose Test inside a
16
Urine Strip
2.9
A Light to Analog Voltage Colorsensor with an
18
Array of Photodiodes behind Color Filters and an
Integrated Current to Voltage Conversion Circuit
2.10
Color of Reflected Light Depends On the Colors
18
that A Surface Reflects and Absorbs
2.11
The Red, Green and Blue Output of Color Sensor
19
2.12
Non-overlapping Spectral Response
19
2.13
Overlapping Spectral Response
20
2.14
Sensor Spectral Overlaps With Reflected Light
20
Not Captured By Sensor
2.15
Sensor Spectral Overlaps With Reflected Light
20
Captured By Sensor
2.16
Traditional Method of Serial Port for PC
23
2.17
Serial Port for PC Using USB
23
xii
2.18
Serial Port for PC Using UC00A Method
23
2.19
SK40C Enhanced 40 Pins PIC Start-up Kit
24
2.20
Basic Toggle Switch Structure
25
2.21
Symbols and Example of Toggle Switch SPDT
25
3.1
Block Diagram of the Design System
28
3.2
Reflective Color Sensor Assembly OPT780Z
28
3.3
PCB Design And Connection for Photosensor
29
Output
3.4
Switch 1(Left) and Switch 2(Right) Connections
31
for Photosensor Inputs
3.5
Switch Connections for Portable Power Supply
31
3.6
Schematic Diagram for Portable Power Supply
32
3.7
Image and Pin Connections of PIC18F452
33
3.8
External (Left) and Internal (Right) Look of
33
Photosensor Box
3.9
Photosensor Construction
34
3.10
Target Distance
34
3.11
Flow Chart of A/D Converter
35
3.12
Flow Chart of GUI Display
36
3.13
Form 1
37
3.14
The Overall System
38
4.1
Block Diagram to Test the Functionality of
39
Photosensor
4.2
Output Signal (kHz) of the Photosensor
40
4.3
Roche 902 Blood Analyzer
41
4.4
Graph of Blood Glucose Value (mmol/L) versus
42
Red Filter Output Value (kHz)
4.5
Graph of Blood Glucose Value (mmol/L) versus
43
Green Filter Output Value (kHz)
4.6
Graph of Blood Glucose Value (mmol/L) versus
44
Blue Filter Output Value (kHz)
4.7
Graph of Blood Glucose Value (mmol/L) versus
Clear Filter Output Value (kHz)
45
xiii
LIST OF ABBREVATION
ADC
-
Analog to Digital Converter
GUI
-
Graphical User Interface
I.C
-
Integrated Circuit
I/O
-
Input/output
PC
-
Personal Computer
VB
-
Visual basic
xiv
LIST OF APPENDICES
APPENDIX
TITLE
PAGE
A
UCOOA (USB to UART Converter)
50
B
SK40C Enhanced 40 PINS PIC START-UP KIT
55
C
Data Sheet Of Reflective Color Sensor Assemble
60
(OPB780Z)
D
Full Source Codes of PIC 18F452 Microcontroller
66
E
Full Source Code of Graphical User Interface
73
(GUI) in VB.NET
CHAPTER 1
INTRODUCTION
1.1
Background
Diabetes is a chronic disease in which the body does not produce or properly
use insulin, a hormone that is needed to convert starches, and other food into energy
needed for daily life. In recent years, the number of diabetic in Malaysia is increasing
and we should beware of this silent killer as it leads to many problems like blindness,
kidney disease, amputations, heart disease, stroke and many other.
There are many ways can be used to detect our glucose level in our body
which using invasive method or non-invasive method. The diagnosis of diabetes is
usually done by using invasive method where in this case the sugar level for the premeal blood sugar is in a range of 80 to 120 mg/dl whereas the bedtime blood levels
are in a range of 100 to 140 mg/dl. The method of this type of detection is by using
blood glucose monitoring. By using this method, the person needs to prick a finger in
order to get the blood so that testing can be done using the blood.
By the way, the glucose concentration in the body can be checked by using
non-invasive method through urine. A detection of glucose concentration is
developed by using dipstick urinalysis where a test strip is dipped inside a container
contained of a person‟s urine and then a detection of the glucose can be read on
differ in color appear on the test strip.
2
The amount of concentration of glucose found in urine based on the color
changes on urine strip. The glucose concentration in urine for normal physiological
range is below 30 mg/dl whereas the abnormal range is above 40 mg/dl. So, it‟s
important for us to check our blood glucose level in our body in an easier and faster
way without using any invasive method.
1.2
Problem Statement
It is found out that currently available market products of blood glucose
meter cannot be connected to the online system through personal computer.
Moreover, most of the measurements for blood glucose concentration tests are done
manually by using the invasive method like blood drop and test. So, another
approach with non-invasive method is developed to measure blood glucose
concentration by just testing on urine using a photosensor.
1.3
Objectives of Project
The main objective of this project is to develop a system that can be used to
measure blood glucose concentration using a photosensor. Besides that, the glucose
concentration value will be displayed on the screen of personal computer in a
quantitative way.
3
1.4
Scope of Project
In order to achieve the objective of the project, there are several scope had
been outlined. The scope of this project includes:
i.
Search and buy a suitable photosensor, urine strips, microcontroller, serial PC
port and other materials needed in this project.
ii. Design circuit connestions for the photosensor and do testings on it.
iii. Meanwhile, do programming on microcontroller and GUI for the software pat
at the same time.
iv. After that, do data collections after the testing and experiments and analysis
the results obtained.
v. Improving the results so that more accurate results can be obtained
1.5
Work Breakdown
In order to achieve the objective of this project, there are several tasks that
need to be done as shown in Figure 1.1 below. These tasks are divided into three
main categories that are study, design and implementation.
The related items that need to study in detail are the principle of the
photosensor, urine strips, analog to digital converter, microcontroller architecture,
programming for microcontroller and programming for graphical user interface.
Other than that, for this system it is needed to design the system block
diagram, hardware circuit, software algorithm and software programming.
Following the design is the implementation of the hardware, software and
system integration.
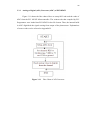
4
Figure 1.1
1.6
Work Breakdowns for the Project
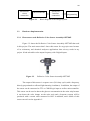
Work Flow
The summary of work flow for this project is simplified into block diagram as
shown in the Figure 1.2 below. The starting point of this project is the literature
review and theoretical study. But, these actions are continuous as new information
must be gathered from time to time in order to proceed with this project.
After having an overview of the component to include in this project, the
suitable components were selected based on the scope and limitation of this project.
Hardware implementations begin after the components were available. On the other
hand, software implementations begin with algorithm for the analog to digital
5
converter and continue with the graphical user interface.
After that, the whole
system was integrated for testing and optimization before the real demo and
presentation to the panel of the final year project.
Literature review and
theoritical study
Selection of hardware
components
Hardware Implementation
Software Implementation
Hardware and Software
Integration
Testing and Optimization
Presentation and Demo
Report Writing
Figure 1.2
Work flow of This Project
Meanwhile, the project schedule or Gantt chart of this project is included in
the section 1.7. Gantt chart of Figure 1.3 and Figure 1.4 shows the detail of the
works done with the time spending on it for the duration of two semesters.
6
1.7
Gantt Chart
Implementation and works of the project are summarized as shown in Gantt
charts as shown in Table 1.1 and Table 1.2. They show the detail of the works of the
project that had been done in the first semester and implement action during second
semester.
Activities
1
2
3
4
5
6
7
8
9
1
1
1
1
1
1
0
1
2
3
4
5
16
17
Exam week
Week
Study week
Table 1.1 : Gantt Chart of the Project Schedule for Semester 1
1.Literature
review
2.Study on
microcontroller
3.Study on
Photosensor
4.Experimental
setup
5.Data analysis
6.Presentation
7.Report writing
7
1
2
3
4
5
6
7
Activities
8
9
1
1
1
1
1
1
0
1
2
3
4
5
16
17
Exam week
Week
Study week
Table 1.2 : Gantt Chart of the Project Schedule for Semester 2
1.Circuit
implementation
2.Software
implementation
3.Testing and
optimization of
system
4.Presentation
5.Demo
6.Report writing
1.8
Thesis Outline
This thesis is a report of a final year project of title “Blood Glucose
Concentration Measurement through Urine Strip Using a Photosensor”. There are
five main chapters explained in detail within this thesis.
Chapter 1 explain in detail the information about the project background,
problem statement, objectives, scope, work flow, Gantt chart, thesis content and
work breakdown. In this chapter, the reader could find out the overview of this
project and also the significant of this project.
Next in chapter 2, the related literature to this project is provided in detail.
The topic explained in this chapter included medical ultrasound, therapeutic
ultrasound, thermal effect of ultrasound and basic of hardware involve.
Chapter 3 is about design and implementation. In this chapter, the design and
implementation step is explained in detail.
8
Chapter 4 contains the information about the results and discussion and the
last, Chapter 5 summarizes this project and with recommendations.
CHAPTER 2
LITERATURE REVIEW
This chapter presents the fundamental of photosensor and the principle used
to construct the detection of glucose in urine using a photosensor. This chapter also
describes the content of urine, types of diabetes, urine strips, color sensor and other
relevant fundamentals and components used in the project.
2.1
Formation of Urine
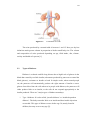
Figure 2.1 below shows the formation of urine on a human being. The
production of urine starts from the 2 kidneys by filtration process of blood. After
that, it goes to urinary bladder following the 2 ureters. When the volume exceeds the
maximum, the urine will be excreted out through urethra. In urine, there are 96% of
water and 4% of solutes chemical that are dissolved in the water. The solutes are
composed of waste like urea, uric acid and creatinine, sodium, potassium, calcium,
magnesium, phosphates, sulphates, nitrites, chlorides and hydrogen carbonate,
organic acids, ammonia as ammonium salts, drugs and hormone metabolites. Some
of these solutes are produced as the results of normal biochemical activity within the
cells of human body whereas the other solutes may be due to chemicals that come
from outside of the body like pharmaceutical drugs. The solutes inside the urine as
ions or organic molecules can be classified.
10
Figure 2.1
Formation of Urine
The urine produced by a normal adult is between 1 and 1.5 litres per day but
infant has much greater volume in proportion to his/her small body size. The volume
and composition of urine produced depending on age, fluid intake, diet, climate,
activity and health of a person [1].
2.2
Types of Diabetes
Diabetes is a chronic and life-long disease due to high levels of glucose in the
blood that caused by too little insulin (a hormone produced by pancreas to control the
blood glucose), resistance to insulin or both. In simple words, when normal people
eat, the pancreas will automatically produce the right amount of insulin to move
glucose from blood into the cells whereas in people with diabetes, the pancreas will
either produce little or no insulin, or the cells do not respond appropriately to the
insulin produced. There are 3 major types of diabetes nowadays:
i.
Type 1 diabetes: It is also called „juvenile diabetes‟ or „insulin-dependent
diabetes‟. The body can make little or no insulin and thus insulin injections
are needed. This type of diabetes occurs before age 30, mostly found in
children, but may occur at any age [2].
11
ii. Type 2 diabetes: Most common form of diabetes and most often associated
with older age, obesity, family history, previous history of gestational
diabetes, certain ethnicities and physical inactivity. The body does not
respond well to the insulin and the pancreas does not make enough insulin to
keep the blood glucose level in normal range [3].
iii. Gestational diabetes: It is found for the first time when a woman is pregnant
who does not have diabetes before that and due to changing hormones and
weight gain during pregnancy causing high blood glucose level. These
changes make the body hard to keep up with the need of insulin. It is
temporary only as it will mostly go away after the baby is born by managing
diet and exercise. It is also called glucose intolerance in pregnancy [4].
2.3
Diagnostic Devices Used To Detect Glucose Level
2.3.1 Blood Glucose Meter
A glucose meter (or glucometer) is a portable medical device used to
determine the approximate concentration of glucose in the blood wherever and
whenever we are. We can test for glucose by placing a small sample of blood on a
disposable test strip and then place the strip in the meter. The test strips are coated
with chemicals like glucose oxidase, dehydrogenase, or hexokinase that will combine
with glucose in blood. The meter will read, calculate and display the blood glucose
level in mg/dl or mmol/dl.
Different meter will detect the glucose level in different ways. Some of them
measure the amount of electricity that can pass through the sample whereas others
measure how much light reflects from the sample.
Most of the meter are able to measure and display the glucose level from a
range of as low as 0 to as high as 600mg/dl. We can convert mmol/dl of glucose to
mg/dl, multiply by 18 or convert mg/dl of glucose to mmol/dl, divide by 18 or
12
multiply by 0.055. Calibrations needed to be done for the glucose meter if there the
readings are extremely low or high in value.
Figure 2.2
Figure 2.3
Blood Glucose Meter
Flow of Blood Glucose Testing
These are some examples of blood glucose meters as shown in Figure 2.2.
There are many types of blood glucose meters available in the markets with different
brand and specifications that will suit user‟s needs. Figure 2.3 shows the flow of
testing the glucose level in the blood using the test strips. Patients can monitor their
blood glucose level at home everyday so that they can be aware and know better of
their blood glucose levels.
13
2.3.2 Urysis 1100
Another apparatus that is commonly used to detect glucose level in our body
is by using Urisys 1100 as shown in Figure 2.4 [5]. This is a different method
compared to blood glucose meter as the sample used to detect glucose level in Urisys
1100 is urine but not blood. It is a reflectance photometer designed to read and
evaluate the urine test strips Combur10Test UX, Combur7Test and Combur5Test
from Roche Diagnostics. It reads the strips under standardized conditions, saves the
results to memory and outputs them via its own inbuilt printer and/or serial interface.
This instrument is designed for In Vitro Diagnostic (IVD) used by qualified
physicians and laboratory staffs. The test strip is placed on a sliding tray, and a
stepping motor moves it under the reading head, which remains stationary. The
analyzer reads the reference pad, followed by each of the test pad on the strip.
Figure 2.4
Urisys 1100
The reading head contains LEDs that emit light at various wavelengths.
Reading is done electro-optically, as shown in Figure 2.5 as follows:
14
Figure 2.5
Flow System of Urisys 1100
The LED (1) emits light of a defined wavelength on to the surface of the test
pad (2) at an optimum angle. The light hitting the test zone is reflected more or less
intensely depending on the color produced on the test pad, and is picked up by the
detector, a phototransistor (3) positioned directly above the test zone. The
phototransistor sends an analogue electrical signal to an A/D converter (4), which
changes it to digital form. The microprocessor (5) then converts this digital reading
to a relative reflectance value by referring it to a calibration standard. Finally, the
system compares the reflectance value with the defined range limits (reflectance
values that are programmed into the analyzer for each parameter) and outputs a semiquantitative result (6). Each test pad is read photo metrically after a lead (incubation)
time of about 55–65 seconds. In strongly alkaline urine samples, Urisys 1100
automatically corrects the result of the Specific Gravity test.
2.4
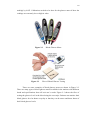
Urine Strips
There is a wide range of urine reagent strip tests available in the markets with
many types of parameters can be tested. Range of parameters that is available in the
markets nowadays can be from 1 to 11 parameters. These parameters are glucose,
ascorbic acid, ketones, protein, pH-value, blood, nitrite, leukocytes, specific gravity,
bilirubin and urobilinogen.
15
The Roche and Bayer reagent strips that can be used to test glucose in urine
are Clinistix, Diabur-Test 5000, Diastix, Uristix, Keto-Diabur-Test, Combur 3 Test
E, Keto-Diastix, Combur 3 Test, Combur 4 Test (or with N), Combur 5 Test (or N),
Lobtix (or with N), Combur 6 Test, Lobstix SG, Combur 7 Test, Multistix SG,
Combur 9 Test, N-Mustistix SG, Combur 10 Test, Multistix 8 SG and Multistix 10
SG [6].
Figure 2.6
Figure 2.7
Examples of Urine Strips
Examples of Reference Color Chart
These are some types of urine strips with different parameters found in the
markets as shown in Figure 2.6 and Figure 2.7 shows some examples of reference
color chart that can be used for visual test. The chemical reactions involved in the
urine strip for glucose test is shown in Figure 2.8
16
Figure 2.8
2.5
Chemical Reactions for Glucose Test inside a Urine Strip
Unit Used for Glucose Concentration In Human Body
There are two main methods of describing concentrations: by weight, and by
molecular count. Weights are in grams, molecular counts in moles (a mole is
6.023×10²³ molecules). In both cases, the unit is usually modified by milli- or microor other prefix, and is always "per" some volume, often a liter.
Mmol/l is millimoles/liter, and is the world standard unit for measuring
glucose in blood. Specifically, it is the designated SI (System International) unit.
"World standard", of course, means that mmol/L is used everywhere in the world
except in the US.
Mg/dl (milligrams/deciliter) is the traditional unit for measuring bG (blood
glucose). All scientific journals are moving quickly toward using mmol/L
exclusively. mg/dl won't disappear soon, and some journals now use mmol/L as the
primary unit but quote mg/dl in parentheses, reflecting the large base of health care
providers and researchers (not to mention patients) who are already familiar with
mg/dl.
17
To convert mmol/l of glucose to mg/dl, multiply by 18 whereas to convert
mg/dl of glucose to mmol/l, divide by 18 or multiply by 0.055. [8]
2.6
Principle of Reflective Colorsensor
Color produced is due to the result of interaction between a light source, an
object and an observer. In the case of reflected light, light falling on an object will be
reflected or absorbed depending on surface characteristics such as reflectance and
transmittance. For example, red paper will absorb most of the greenish and bluish
part of the spectrum while reflecting the reddish part of the spectrum, making it
appear reddish to the observer. For self-illuminated objects, the light will reach the
human eye and will be processed by the eye's receptors, and interpreted by the
nervous system and brain. There are three types of color sensors: a) light to
photocurrent, b) light to analog voltage and c) light to digital. Reflective color
sensing is typically realized through photodiodes with multiple illuminant or
photodiodes coated with color filters with single illuminant. Three important
elements in reflective sensing:
i.
Detector- It‟s a device that captures light reflected from an object.
ii. Target- It‟s an object whose color is measured, like colored paper or paint. It
is typically non-emissive, reflects and absorbs different amounts of light at
different wavelengths.
iii. Illuminant- It‟s a light source whose spectrum covers the visible wavelengths,
like sunlight.
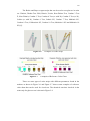
Figure 2.9 shows a light to analog voltage Colorsensor with an array of
photodiodes behind color filters and an integrated current to voltage conversion
circuit. Besides that, Figure 2.10 shows the color of reflected light depends on the
colors that a surface reflects and absorbs.
18
Figure 2.9
A Light to Analog Voltage Colorsensor With An Array of
Photodiodes Behind Color Filters And An Integrated Current to Voltage Conversion
Circuit
Figure 2.10
Color of Reflected Light Depends On the Colors that A Surface
Reflects And Absorbs
The human visual system can detect the electromagnetic spectrum from about
400nm (violet) to about 700nm (red). In addition, human visual system can adapt to
widely varying illumination levels and amounts of color saturation (the proportion of
pure color to white).
There are three sets of cones with peak sensitivities at wavelengths that can
be identified as red (580nm), green (540nm) and blue (450nm) and light at any
19
wavelength in the visual spectrum will excite one or more of these three types of
cone cells to varying degrees, with our perception of the color being that information
as processed by our optic nerve and brain.
Generally, colorimetric and photometric are two types of measuring
instruments. By using the colorimetric method, the device measures light from an
object using a sensor with three filters. Normally, the sensor profile is optimized so
that it will closely resemble the human eye response. The photometric method uses a
multiplicity of sensors to measure color over a large number of narrow wavelength
ranges. The instrument's microcomputer then calculates the tristimulus values by
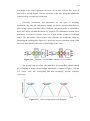
integrating the resulting data. Figure 2.11 shows the red, green and blue ouputs of the
sensor are determined by the color of light falling on the sensor.
Figure 2.11
The Red, Green and Blue Outputs of Color Sensor
The spectral response of the individual Red, Green and Blue channel should
be overlapping to ensure all wavelength information is captured. Figures 2.12 and
2.13 below show the overlapping and non-overlapping spectral responses
respectively.
Figure 2.12
Non-overlapping Spectral Response
20
Figure 2.13
Figure 2.14
Overlapping Spectral Rsponse
Sensor Spectral Overlaps With Reflected Light Not Captured By
Sensor
Figure 2.15
Sensor Spectral Overlaps With Reflected Light Captured By Sensor
In a mathematical way, sensor output is directly proportional to the
overlapping area of the reflected signal and sensor spectral profile. Figure 2.14
shows there are two non-overlapping areas which mean the information in that
region will not be captured by the sensor. Figure 2.15 shows the information of the
21
reflected signal is properly captured by the sensor with an overlapping spectral
response.
So, light falling on each of the photodiodes is converted into a photocurrent,
the magnitude of which is dependent on both the brightness and, due to the color
filter, wavelength of the incident light. In addition, without a color filter, a typical
silicon photodiode responds to wavelengths ranging from the ultraviolet region
through the visible, with a peak response region between 800nm and 950nm in the
near-IR part of the spectrum. The red, green and blue transmissive color filters will
reshape and optimize the photodiode's spectral response.
In reflective sensing, the color sensor detects light reflected from a surface or
object, with both the light source and the color sensor placed close to the target
surface. Light from the light source bounces off the surface, and is measured by the
color sensor. The color of the light reflected off the surface is a function of the color
of the surface. For instant, white light incident onto a red surface is reflected as red.
The reflected red light collides on the color sensor producing red, green and blue
output voltages. By interpreting the three voltages, the color can be determined.
Since the three output voltages increase linearly with the intensity of the reflected
light, the color sensor also measures the reflectivity of the surface or object. [9]
2.7
Microcontroller
A microcontroller is a small computer on a single integrated circuit consisting
of a relatively simple CPU combined with support functions such as a crystal
oscillator, timers, watchdog, serial and analog I/O. Program memory in the form of
NOR flash or OTP ROM is often also included on chip, as well as a typically small
read/write memory. It is design for small applications compare to microprocessors
and are used in automatically controlled products and devices, such as automobile
engine, control systems, remote control, and many other applications.
22
Since embedded processors are usually used to control devices, they
sometimes need to accept input from the device they are controlling. This is the
purpose of the analog to digital converter. Since processors are built to interpret and
process digital data, such as 1s and 0s, they won‟t be able to do anything with the
analog signals that may be being sent to it by a device.
So the analog to digital converter is used to convert the incoming data into a
form that the processor can recognize. There is also a digital to analog converter that
allows the processor to send data to the device it is controlling.
2.8
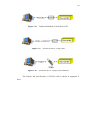
Serial Port Interface-UC00A Method (USB to UART Convertor)
Serial communication is the most popular interface between device and this
applies to microcontroller and computer. UART (Universal Asynchronous Receiver
Transmitter) is one of those serial interfaces. Classically, most serial interface from
microcontroller to computer is done through serial port (DB9). However, since
computer serial port used RS232 protocol and microcontroller used TTL UART, a
level shifter is needed between these interfaces. Recently, serial port of computer
have been phase out, it have been replaced with USB. Of course most developers
choose USB to serial converter to obtain virtual serial port. The level shifter is still
necessary for UART interface. A USB to UART converter is developed which offers
USB plug and play, direct interface with microcontroller and is provided with low
current 5V supply from USB port. Figure 2.16 shows the traditional method of serial
port interface for PC whereas Figure 2.17 shows serial port for PC by using a USB.
Now, an easier, cost-saving and much convenient method of serial port is developed
by using UC00A method. [10]
23
Figure 2.16
Traditional Method of Serial Port for PC
Figure 2.17
Figure 2.18
Serial Port for PC Using USB
Serial Port for PC Using UC00A Method
The features and specifications of UCOOA will be shown in Appendix A
there.
24
2.9
SK40C ENHANCED 40 PINS PIC START-UP KIT
SK40C as shown in Figure 2.19 is another enhanced version of 40 pins PIC
microcontroller start up kit. It is designed to offer an easy-to-start board for PIC user.
However, all interfaces and program should be developed by user. This board comes
with basic element for user to begin project development. It offer plug and use
features. More features and specifications can refer to Appendix B.
Figure 2.19
2.10
SK40C Enhanced 40 Pins PIC Start-up Kit
Toggle Switch Single Pole Double Throw (SPDT)
Since there are four possible variable inputs for different filter need to be
selected which are red filter, green filter, blue filter and clear filter, so it‟s necessary
to use switches for selecting wanted inputs. I have chosen toggle switches SPDT as
my input selector in my project. The number of poles indicates how many
completely independent circuits are controlled by the switch. The number of throws
indicates the number of positions that will result in an electrical connection.
Figure 2.20 shows the basic structure of toggle switch SPDT. The green color
line in Figure 2.20 shows the path that the current will follow and the power source
can be connected to any of the terminals. If the power source is connected to the
centre terminal, it can go to either of the other 2 terminals but if the power source is
connected to either of the outside terminals, it can only be switched to the centre
25
terminal. This means that one terminal will always be dead (no connection to the
power source). Figure 2.21 shows the symbol of toggle switch and its example. [11]
Contacts
Insulating
Material
External
Terminals
Figure 2.20
Figure 2.21
Basic Toggle Switch Structure
Symbols and Example of Toggle Switch SPDT
26
2.11
Visual Basic.NET (VB.NET)
VB.NET is an extension of Visual Basic (VB) programming language with
many new features in it and the changes from VB to VB.NET are huge, ranging from
the change in syntax of the language to the types of project we create now and the
way we design applications.
VB.NET was designed to take advantages of the .NET Framework base
classes and runtime environment. It comes with power packed features that simplify
application development. The industry is focusing on critical distributed computing
with web services capabilities. At this moment VB.NET is definitely a powerful tool
to provide all these solutions in integrated environment of .NET technology. Below
are the major problems with VB 6.0, which has been creating troubles for VB
developers for a long time. [12]
Problems with VB 6.0:
i.
Poor error handling capabilities
ii.
No capabilities for multithreading.
iii.
Lack of implementation inheritance and other object oriented features.
iv.
No effective user interface for Internet based applications.
v.
Poor integration with other languages such as C++.
Improvement found in VB.NET:
i.
Full support for object oriented programming.
ii.
Better database programming approach with ADO.NET.
iii.
Access to .NET Framework.
iv.
Powerful unified Integrated Development Environment (IDE).
v.
Inherent support for XML & Web Services.
vi.
Better windows applications with Windows Forms.
vii.
New Console capabilities of VB.NET.
viii.
New Web capabilities with Web Forms.
ix.
Structured error handling capabilities
x.
Immense power of tools & controls (including Server Controls).
xi.
Interoperatibility with other .NET compiled languages.
CHAPTER 3
DESIGN AND IMPLEMENTATION
This chapter describes the design and implementation for the blood glucose
measurement through urine strip using a photosensor.
3.1
Introduction
Figure 3.1 shows the block diagram of main system design. Basically, there
were hardware and software need to be implemented in this project.
Hardware part consists of photosensor circuit connection including PCB
design, photosensor box design and serial port interface connection like USB
converter that connected from PIC to personal computer.
Meanwhile, the software part includes microcontroller as analog to digital
converter that read the analog urine glucose value measured by the photosensor and
converts it to digital number has been developed in PIC using Assembly Language
programming. Besides that, graphical unit interface (GUI) using Visual Basic was
programmed to display the calculated blood glucose value on the personal computer.
28
Photosensor
circuit
connection
Microcontroller
Figure 3.1
3.2
Serial Port
Interface
connection
GUI
programming
Block Diagram of the Design System
Hardware Implementation
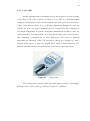
3.2.1 Photosensor used: Reflective Color Sensor Assembly OPT780Z
Figure 3.2 shows the Reflective Color Sensor Assembly OPT780Z that used
in this project. The main reason that I chose this sensor for my project was because
of its colormetry and chemical analyzers applications that suit my needs in my
project. It had selectable color output frequency with 2 digital inputs.
Figure 3.2
Reflective Color Sensor Assembly OPT780Z
The output of this sensor is a square wave (50% duty cycle) with a frequency
directly proportional to reflected light intensity (irradiance). In addition, the output of
the sensor can be connected to TTL or CMOS logic input as well as microcontroller.
This sensor can be used to detect the glucose concentration in the urine strip because
it can detect the color change on the urine strip and a frequency output will be
produced with a certain value measured in kHz. In addition, more details of this
sensor can refer to the Appendix C.
29
3.2.2 Printed Circuit Board (PCB) Design for Photosensor
Since the photosensor is the main part of this system as it is used to detect the
color change on the urine strip, so i need to choose appropriate materials and
electronic components to connect this photosensor. At first, I connected the outputs
of photosensor into a designed and made printed circuit board (PCB).
Figure 3.3 shows the PCB design using software and the connections for
photosensor output before the photosensor can be implemented by connecting it into
the protoboard. There were 8 outputs from the photosensor that need to be connected
to different another outputs.
Pin5: To LED i/p
(2.7 V)
Pin6: To switch 2
Pin4: To switch 1
Pin 7 & 8:
To Ground
Pin3: To RB3 of
PIC
Pin 1 & 2: To 5V
Figure 3.3
PCB Design And Connection for Photosensor Output
The listings of components used to connect the whole photosensor circuit
were shown in Table 3.1. The photosensor used is OPB780Z.
30
Table 3.1 : Components that build up photosensor circuit
Number
Components
Description
1.
2 Toggle Switches SPDT
As digital inputs for the photosensor
2.
1 Toggle Switch SPDT
Used for battery switch
3.
Battery
9V
4.
Zener Diode
0.5W 2.7V
5.
Resistor
¼ Watt 560Ω
6.
Voltage Regulator
KA7805
7.
Microcontroller
PIC18F452
8.
USB to UART Convertor
UC00A
9.
SK40C
PIC START-UP KIT
ENHANCED 40 PINS
3.2.3 Switches
Three switches were used in this project: 2 for inputs of photosensor and 1 for
portable power supply. There were four variable logical inputs in the photosensor
which red, green, blue and clear filters that shown in Table 3.2. Each filter or input of
the photosensor controlled by two separately toggle twitches SPDT in Low (L) or
High (H) conditions. For instant, a clear filter or input selected when switch 1 is set
High (H) and switch 2 is set Low (L). High (H) means 5V and Low (L) means
Ground (GRD).
Table 3.2 : Table of Variable Inputs of Photosensor
Filter type
Switch 1
Switch 2
Red
L
L
Green
H
H
Blue
L
H
Clear
H
L
31
3.2.3.1 For 4 Variable Logical Inputs of Photosensor
Figure 3.4 shows the switch 1 and switch 2 connections for input selecting
from the four variable logical inputs of the photosensor.
Figure 3.4
Switch 1(Left) and Switch 2(Right) Connections for Photosensor
Inputs
3.2.3.2 For Portable Power Supply
The portable power supply (9V battery) was controlled by switching on and
off through a toggle switch SPDT and the switch connections shown in Figure 3.5.
To Positive of
Voltage Regulator
Figure 3.5
To Positive of Portable
Power Supply
Switch Connections for Portable Power Supply
32
3.2.4 Troubleshooting by Making a Portable Power Supply
A portable power supply was designed and implemented due to the
conveniences on doing samples testing at Pusat Kesihatan UTM. The schematic
diagram of the portable power supply shown on Figure 3.6 and it was simulated
using Multisim software before it was implemented in real circuit. The main reasons
for implementing this circuit are regulating the 9V battery to 5V (will be connected
to pin 1 & 2) and 2.7V (will be connected to pin 5) respectively.
To Switch of Portable Power Supply
2.7V (Connected to pin 5)
5V (connected to pin 1 & 2)
Figure 3.6
Schematic Diagram for Portable Power Supply
3.2.5 Embedded ADC in PIC16F877A Microcontroller
In this project, embedded ADC in PIC16F877A was used. Figure 3.7 shows
the image and the pin diagram of the microcontroller used. RB3 pin was connected to
pin 3, VDD pin was connected to pin 1 & 2 and VSS pin was connected to pin 7 & 8
of the photosensor pins respectively. Output from the ADC was connected to
personal computer through serial port interface.
33
To Pin 3
To Pin 1 & 2
To Pin 7 & 8
Figure 3.7
Image and Pin Connections of PIC18F452
3.2.6 Photosensor Box
A box with length of 24cm and width of 14cm was built to provide a dark
environment for the photosensor so that accurate testing of samples can be assured.
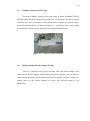
Figure 3.8 shows the external look and internal look of photosensor box.
Figure 3.8
External (Left) and Internal (Right) Look of Photosensor Box
Besides that, the photosensor was constructed as shown in Figure 3.9 so that
it can stand still alone. A distance of approximately 0.6cm was set and measured
from below of the photosensor to the ground of the photosensor box as shown in
Figure 3.10.
34
Figure 3.9
Photosensor Construction
Target distance
= 0.6cm
Figure 3.10
3.3
Target Distance
Software Implementation
For software implementation, PIC Programmer was used to write and
compile the program of the microcontroller.
Meanwhile, PIC kit (SK40C
ENHANCED 40 PINS PIC START-UP KIT) was used to load the hex file from the
PIC Programmer to the microcontroller and then transferred the data from PIC to PC
through a UC00A connection. Other than that, VB.NET was used for programming
the user interface and displayed the data which received from PIC through UC00A
into the screen of PC.
35
3.3.1 Analog to Digital (A/D) Converter (ADC) of PIC18F452
Figure 3.11 shows the flow chart of how to setup ADC and read the value of
ADC from the PIC 18F452 Microcontroller. The written code that compiled by PIC
Programmer were loaded into PIC18F452 in hex file format. Then, the internal build
in ADC digitalized the signal coming from output of the photosensor. Explanations
of source codes can be referred to Appendix D.
Figure 3.11
Flow Chart of A/D Converter
36
3.3.2 Graphical Unit for User Interface (GUI)
Graphical user interface for this project were developed in VB.NET. The
purpose of this graphical user interface was to display the blood glucose
concentration value (mmol/L). The flow of this GUI was shown in Figure 3.12. All
the detail on VB.NET code been applied were elaborated in Appendix E.
Figure 3.12
Flow Chart of GUI Display
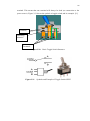
Figure 3.13 illustrates the window where it contains of buttons, text boxes
and message box. At Form 1, the function of „Get Data‟ button was to receive data
from the output of photosensor to PIC and then to PC through UC00A, meanwhile
the function of „Convert‟ button was used to automatically convert the output (kHz)
received from PIC to blood glucose concentration value (mmol/L) according to the
set equation.
37
Message Box
Text Box
Figure 3.13
3.4
Button
Form 1
Hardware and Software Implementation
Figure 3.14 illustrates the overall system for blood glucose measurement
through urine strip using a photosensor. The input of photosensor was selected
according to desired filter by switching the two switches on the photosensor box.
Then the output (kHz) of the photosensor was transferred into PIC18F452 and the
value of the output was digitalized by the microcontroller. After that, the output
value was displayed by the GUI window through a UC00A (USB Converter). These
overall systems model implemented due to performance testing and in term of
troubleshooting to improve the accuracy and quality of the measurement.
38
GUI
Shown on
PC
Oscilloscope
PIC Kit with
PIC18F452
UC00A
Photosensor
Box with Circuit
Inside
Figure 3.14
Switches
The Overall System
Urine Strip
CHAPTER 4
RESULT AND ANALYSIS
4.1
Introduction
This chapter discussed the testing, results and analysis of the system. I tested
the functionality of the photosensor first before I started the main testing on samples.
The sample testing had taken a long time to be completed. Then, the data collected
were plotted on graph for further analyzed. After that, analysis had been made based
on the testing results.
4.2
Testing the Functionality of the Photosensor
Figure 4.1 shows block diagram to test the functionality of photosensor using
different color papers.
Figure 4.1
Block Diagram to Test the Functionality of Photosensor
40
4.2.1 Procedures
i.
The experiment was set up as Figure 4.1.
ii.
The input supply voltage must set to less than 5.5V for the pin 1 and 2 of the
photosensor.
iii.
The LED input voltage must set to less than 3.9V at pin 5 of photosensor.
iv.
A square wave form output signal of photosensor was obtained from the
oscilloscope before testing.
v.
Papers with different types of color were prepared for each testing.
vi.
The input from the switches was selected and each color paper with 4
different variable inputs was tested.
vii.
Outputs (in kHz) of photosensor can be taken from oscilloscope.
viii.
Steps 4, 5, 6 and 7 were repeated for different color paper with 4 different
types of inputs from the photosensor.
Figure 4.2 shows the square wave output signal (kHz) of the photosensor
taken from oscilloscope. From the testing results obtained, it can be concluded that
the photosensor is functioning well and outputs obtained for each color paper with 4
different variable inputs were within the specifications of the photosensor as stated in
datasheet there. The photosensor can only be used for further urine samples testing
after being tested successfully.
Figure 4.2
Output Signal (kHz) of the Photosensor
41
4.3
Samples Collection and Testing
The whole samples testing process was taken at Pusat Kesihatan UTM as
both the blood and urine sample were needed for every patient. The blood sample
collection was done by laboratory staff and the blood samples were tested using a
Roche 902 blood analyzer as shown in figure 4.3. At the same time, urine sample
was taken for the same person and it was tested using the photosensor.
Figure 4.3
4.4
Roche 902 Blood Analyzer
Results Obtained From Samples Testing
Total of 42 patients being tested and their urine and blood samples were
collected and tested. Results obtained from the blood analyzer and oscilloscope
collected and then being put into Microsoft Excel for further analysis. Graphs were
plotted based on the results obtained for these four different inputs of the
photosensor.
42
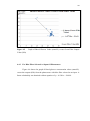
4.4.1 For Red Filter Selected As Input of Photosensor
Figure 4.4 shows the graph of blood glucose concentration values (mmol/L)
versus the outputs (kHz) from the photosensor with red filter selected as an input. A
linear relationship was obtained with an equation of y = -0.6809x + 19.616.
Figure 4.4
Graph of Blood Glucose Value (mmol/L) versus Red Filter Output
Value (kHz)
4.4.2 For Green Filter Selected As Input Of Photosensor
Figure 4.5 shows the graph of blood glucose concentration values (mmol/L)
versus the outputs (kHz) from the photosensor with green filter selected as an input.
A linear relationship was obtained with an equation of y = -0.5739x + 21.61.
43
Figure 4.5
Graph of Blood Glucose Value (mmol/L) versus Green Filter Output
Value (kHz)
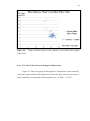
4.4.3 For Blue Filter Selected As Input Of Photosensor
Figure 4.6 shows the graph of blood glucose concentration values (mmol/L)
versus the outputs (kHz) from the photosensor with blue filter selected as an input. A
linear relationship was obtained with an equation of y= -0.9301x + 24.899.
44
Figure 4.6
Graph of Blood Glucose Value (mmol/L) versus Blue Filter Output
Value (kHz)
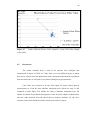
4.4.4 For Clear Filter Selected As Input Of Photosensor
Figure 4.7 shows the graph of blood glucose concentration values (mmol/L)
versus the outputs (kHz) from the photosensor with clear filter selected as an input. A
linear relationship was obtained with an equation of y= -0.2034 x + 22.497.
45
Figure 4.7
Graph of Blood Glucose Value (mmol/L) versus Clear Filter Output
Value (kHz)
4.5
Discussions
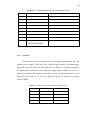
The results obtained from a total of 42 patients were analyzed and
summarized as shown in Table 4.1. Since there were four different types of inputs
that can be selected from the photosensor and i determined and fixed the considered
most accurate filter as our input for our future blood glucose measurement.
Clear filter was selected to be the fixed input for future blood glucose
measurement as it had the least absolute maximum error which was only 1.1348
compared to other filters. The smaller the value of absolute maximum error, the
smaller deviation of calculated blood glucose value from the output of photosensor
with the value obtained from the blood glucose analyzer machine. So, the more
accurate of the result obtained from the selected clear filter as input.
46
Besides that, it‟s only 0.064 difference of mean error between the clear filter
and red filter (least mean error value). It showed that not much different for the mean
error of clear filter with other filters. These were the reasons why clear filter was
selected as a fixed input and its linear equation of y= -0.2034 x + 22.497 were used
for software programming including PIC Programming and GUI using VB.NET as
well.
Table 4.1 : Result Analysis
Data Total Error = Mean Error = Absolute Max Absolute Min
Analysis ∑(Blood
glucose
Total Error/42
value
Error
Error
= |mean error- = |mean error-
from machine-
max error|
min error|
Blood glucose
value
Input
from
graph) mmol/L
Selection
Red Filter
29.1267
0.6935
1.5508
0.6883
Green Filter
30.9576
0.7371
1.9451
0.7262
Blue Filter
49.4749
1.1780
4.1440
1.1728
Clear Filter
31.8142
0.7575
1.1348
0.7508
CHAPTER 5
CONCLUSION AND RECOMMENDATION
This chapter described the conclusion and the recommendation of this project
5.1
Conclusion
An instrument used to measure blood glucose concentration value through
urine strip using a photosensor has been developed. This system consists of
photosensor circuit, analog to digital converter, serial port interface and graphical
user interface. This measurement range for blood glucose concentration value in this
system is from 0 to 22 mmol/L.
5.2
Recommendation
Although this project is successfully developed and met the objective,
however it is found that this system can be further improved by integrating it into
mobile medical system such as PDA.
48
REFERENCES
[1]
Christine Brooker. Human structure and function: nursing applications in
clinical practice. 2nd ed. 1997
[2]
Ragnar Hanas. Type 1 diabetes in children, adolescents and young adults:
how to become an …3th ed. Uddevalla, Sweden: 2007
[3]
Patrick English, Gareth Williams. Type 2 Diabetes. London,UK: Martin
Dunitz Ltd. 2001
[4]
Helen Varney, Jan M. Kriebs, Carolyn L. Gegor. Varney's midwifery. Fourth
ed. America: Jones and Bartlett. 2004
[5]
Gebrauchsanweisung. “User Manual Urysis 1100” Roche
[6]
Monica Cheesbrough. District Laboratory Practice in Tropical Countries,
Volume 1. 6th ed. 2009
[7]
Kenneth D. McClatchey. Clinical Laboratory Medicine. 2nd ed. Philadelphia:
Lippincott Williams & Wilkins. 2002
[8]
Globe Diagnostics. Enzymatic colorimetric method for the quantitative
determination of Glucose in serum, plasma and urine.
[9]
Avago, Avago Technologies (2007). Reflective Color Sensing with Avago
Technologies’ RGB Color Sensor .Unites States and other countries.
[10]
Cytron Technologies Sdn. Bhd. UIC00A User Manual. Johore, Malaysia.
49
[11]
Dan O'Sullivan and Tom Igoe. Physical computing: sensing and controlling
the physical world with computers. Thomson Course Technology PTR. 2004
[12]
Jesse Liberty (2003). Learning Visual Basic.NET. United States of America:
O‟Reilly & Associates,Inc.
APPENDIX A
UCOOA (USB to UART Converter)
51
Features:
This development offer low cost, easy to use USB to UART converter to user.
It has been designed with capabilities and features of:
• Develop low cost USB to UART converter
• Easy to use USB to UART converter, aiming development between computer and
microcontroller, 5V logic.
• USB powered, no external source is required to use this converter
• 5V from USB port is available for user.
• Configurable for 5V UART interface.
• Easy to use 4 pin interface: Tx, Rx, Gnd and 5V.
• CTS, RTS, DTR and DSR is pull out to standard 2x5 header pin solder able PCB
pad.
• Plug and Play
Packing List:
1. 1 x UC00A.
2. 1 x 2510 4 ways connector.
3. 4 x 2510 iron pins.
4. USB driver and User‟s Manual should be downloaded from Cytron Website.
52
Cautions: “+” on UC00A is 5V supply directly from USB port of computer; it is
advised not to use this power source to power application circuit or device. Wrong
connection such as wrong polarity, wrong voltage, shorted might permanently
damage computer.
UC00A is designed to ease communication between microcontroller and PC. The
specifications are as listed below:
53
Absolute Maximum Rating
Software Installation
UC00A used USB to UART chip and it require USB driver to be installed (1 time)
on computer. Thus, this section, user may refer to document name “Windows XP
Installation Guide” which provides users a simple procedure for installing drivers for
this device driver under Windows XP.
Hardware Installation
For interface with hardware or microcontroller, user needs a cable to plug between
UC00A and hardware. Below are the picture and method of making 4 ways cable.
For step 6, repeat step 1 to 5 for the other end of cable. Please start with the same
side done in step (yellow on bottom and the iron pin is facing up). For step 10
(second side of cable), nodes in pin 1 and 2 are switch with first side.
54
APPENDIX B
SK40C ENHANCED 40 PINS PIC START-UP KIT
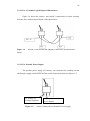
56
Features:
Industrial grade PCB
Compact, powerful, flexible and robust start-up platform
Save development and soldering time
No extra components required for the PIC to function
All 33 I/O pins are nicely labeled to avoid miss-connection by users
Connector for UIC00A (low cost USB ICSP PIC Programmer) - simple and fast
method to load program
No more frustrated work plugging PIC out and back for re-programming
Perfectly fit for 40 pins 16F and PIC18F PIC
With UIC00A, program can be loaded in less than 5 seconds
Maximum current is 1A.
Dimension: 85mm x 55mm
2 x Programmable switch
2 x LED indicator
Turn pin for crystal. User may use others crystal provided.
LCD display (optional)
UART communication
And all the necessities to eliminate users difficulty in using PIC
57
Note: Only 1 power supply should be provided to SK40C.
Figure below shown pin connection for ‘Label P’ (2x16 LCD Display).
58
Absolute Maximum Rating
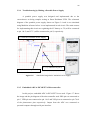
INSTALLATION (HARDWARE)
SK40C come with UIC00A USB programmer connector to offer simple way for
downloading program.UIC00A programmer is very easy and save plenty of
development time.
Loading Program Using UIC00A Programmer
After plug in 40 pin PIC MCU (make sure the orientation is correct), SK40C should
be powered by DC adaptor. Now, the hex code is ready to be loaded to SK40C.
Extend the I/O port to another board using jumper wire as below:
59
For UART Interface Connections:
Connect to other microcontroller using cable connector
Connect to computer/laptop using UC00A (communication between SK40C and PC)
APPENDIX C
DATA SHEET OF REFLECTIVE COLOR SENSOR ASSEMBLE (OPB780Z)
61
Features:
• High-resolution conversion of light intensity to frequency
• Selectable color output frequency
• Communicates directly with a microcontroller
• Sensor power supply operation (2.7 V to 5.5 V)
• LED power separate input
• Includes LED, Sensor and interface cable
Description:
The OPB780Z colour sensor uses a light-to-frequency converter that combines 64
configurable silicon photodiodes (on a 144 um centre and measuring 120 um x 120
um each), with a white LED in a small, lightweight package that makes it ideal for
using in miniature applications. The output is a square wave (50% duty cycle) with a
frequency directly proportional to reflected light intensity (irradiance). The light-tofrequency converter reads an 8 x 8 array of photodiodes that consists of four groups
of 16 photodiodes each, segregated by colour: 16 photodiodes with red filters, 16
photodiodes with green filters, 16 photodiodes with blue filters and 16 clear
photodiodes with no filters. Each colour‟s group of 16 photodiodes is inter-digitized
to minimize the effect of non-uniformity of the incident irradiance. Each colour‟s
group is also connected in parallel. The type of photodiode used during operation is
pin-selectable. The output of the device is designed to drive a standard TTL or
CMOS logic input over short distances. The internal photodiode used by the device
is controlled by two logic inputs, S2 and S3.
Applications:
• Photographic equipment
• Colormetry
62
• Chemical analyzers
• Display contrast controls
• High resolution digital measurement of light intensity
Notes:
(1) Stresses beyond those linked under “absolute maximum rating” may cause
permanent damage to device. These are only stress ratings, and functional operating
of the device at these (or any other) conditions beyond those indicated in the
63
Recommended Operating Conditions table shown above may affect the device‟s
reliability.
(2) All voltage values are with respect to GND.
(3) Full-scale frequency is the maximum operating frequency of the device without
saturation.
(4) Output interface of device is designed to drive a standard TTL or CMOS logic
input over short distances. If lines greater than 12 inches are used on output, a buffer
or line driver is recommended.
64
65
Target Range = 0.225 inch= 0.5715cm
APPENDIX D
Full Source Codes of PIC 18F452 Microcontroller
67
LIST P=18F452
;directive to define processor
#include <P18F452.INC> ;processor specific variable definitions
; Oscillator Selection:
CONFIG
OSC = HS
; LP
CONFIG
BOR = OFF
CONFIG
WDT = OFF
CONFIG
LVP = OFF
CONFIG
PWRT = ON
CONFIG
OSCS = OFF
; Variable definitions
; These variables are only needed if low priority interrupts are used.
; More variables may be needed to store other special function registers used
; in the interrupt routines.
CBLOCK
0x080
WREG_TEMP ;variable used for context saving
STATUS_TEMP ;variable used for context saving
BSR_TEMP
;variable used for context saving
ENDC
CBLOCK
0x000
EXAMPLE
;example of a variable in access RAM
d1
d2
d3
STORE1
STORE2
STORE3
VAR920US
NumH
NumL
TenK
Thou
Hund
Tens
Ones
ENDC
;EEPROM data
; Data to be programmed into the Data EEPROM is defined here
ORG 0xf00000
DE
"Test Data",0,1,2,3,4,5
;Reset vector
; This code will start executing when a reset occurs.
ORG 0x0000
goto
Main
;go to start of main code
;High priority interrupt vector
; This code will start executing when a high priority interrupt occurs or
; when any interrupt occurs if interrupt priorities are not enabled.
ORG 0x0008
bra
HighInt
;go to high priority interrupt routine
;Low priority interrupt vector and routine
; This code will start executing when a low priority interrupt occurs.
; This code can be removed if low priority interrupts are not used.
ORG 0x0018
movff STATUS,STATUS_TEMP ;save STATUS register
movff WREG,WREG_TEMP
;save working register
movff BSR,BSR_TEMP
;save BSR register
68
; low priority interrupt code goes here
movff
BSR_TEMP,BSR
;restore BSR register
movff
WREG_TEMP,WREG
;restore working register
movff
STATUS_TEMP,STATUS ;restore STATUS register
retfie
;High priority interrupt routine
; The high priority interrupt code is placed here to avoid conflicting with
; the low priority interrupt vector.
HighInt:
;high priority interrupt code goes here
retfie FAST
;Start of main program
; The main program code is placed here.
Main:
; main code goes here
CLRF PORTB ; Initialize PORTB by
; clearing output
; bsf
STATUS, RPO
; data latches
CLRF LATB ; Alternate method
; to clear output
; data latches
MOVLW 0x08 ; Value used to initialize data
; direction
MOVWF TRISB ; Set RB<3:0> as inputs
; RB<5:4> as outputs
; RB<7:6> as inputs
bcf
TRISC,6
bsf
TRISC,7
clrf
TenK
clrf
Thou
clrf
Hund
clrf
Tens
clrf
Ones
; goto
movlw
movwf
bsf
movlw
movwf
movlw
movwf
testloc
0x081
SPBRG
; before send serial com, init with this
RCSTA,SPEN
0x080
RCSTA
0x0A4
TXSTA
XYZ
bsf
btfss
goto
movf
RCSTA,CREN
PIR1,RCIF
XYZ
;back1
RCREG,w
ABC
clrf
clrf
NumL
NumH
69
cntloopA
btfsc PORTB,3
goto cntloopA
;da start kire ;kire semasa high
cntloop
btfss PORTB,3
goto cntloop
;da start kire ;kire semasa high
cntloop1
incf
NumL,f
;1 / 1
btfsc STATUS,Z
;2 / 1
incf
NumH,f
;0 / 1
btfsc PORTB,3 ; looping 1 cycle, exit loop 2 cycle
goto cntloop1 ; 2 cycle
cntloop2
incf
NumL,f
btfsc STATUS,Z
incf
NumH,f
btfss PORTB,3
goto cntloop2
;kire semasa low
;1 / 1
;2 / 1
;0 / 1
movlw
movwf
bsf
movlw
movwf
movlw
movwf
0x081 ; before send serial com, init with this
SPBRG
RCSTA,SPEN
0x080
RCSTA
0x0A4
TXSTA
back1
movlw
movwf
movf
addlw
movwf
movlw
movwf
call
0x80
PORTB
TenK,w
0x30
TXREG
0x40
PORTB
DELAY
back2
movf
movlw
movwf
movf
addlw
movwf
movlw
movwf
call
RCREG,w
0x80
PORTB
Thou,w
0x30
TXREG
0x40
PORTB
DELAY
back3
movf
movlw
movwf
movf
addlw
movwf
movlw
RCREG,w
0x80
PORTB
Hund,w
0x30
TXREG
0x40
;da stop kire
70
movwf PORTB
call
DELAY
back4
movf
movlw
movwf
movf
addlw
movwf
movlw
movwf
call
RCREG,w
0x80
PORTB
Tens,w
0x30
TXREG
0x40
PORTB
DELAY
back5
movf
movlw
movwf
movf
addlw
movwf
movlw
movwf
call
goto
RCREG,w
0x80
PORTB
Ones,w
0x30
TXREG
0x40
PORTB
DELAY
XYZ
Loop
btfsc
goto
goto
PORTB,1
ONN
OFF
ONN
movlw 0xC0
movwf PORTB
goto
Loop
OFF
movlw 0x00
movwf PORTB
goto
Loop
DELAY
movlw 1
movwf d3
LPD3
movlw 10
movwf d2
LPD2
movlw 57
movwf d1
LPD1
decfsz d1,f
goto
LPD1
decfsz d2,f
goto
LPD2
decfsz d3,f
71
goto
return
LPD3
DELAY2
MOVLW
MOVWF
10
STORE2
LP2
MOVLW
MOVWF
131
STORE1
LP
DECFSZ
GOTO LP
DECFSZ
GOTO LP2
;4ms selang atr beat
STORE1, F
STORE2, F
RETURN
;SUBROUTINE HEX to DECIMAL
H2d:
; Takes number in NumH:NumL
; Returns decimal in
; TenK:Thou:Hund:Tens:Ones
swapf NumH, w
iorlw B'11110000'
movwf Thou
addwf Thou,f
addlw 0XE2
movwf Hund
addlw 0X32
movwf Ones
movf NumH,w
andlw 0X0F
addwf Hund,f
addwf Hund,f
addwf Ones,f
addlw 0XE9
movwf Tens
addwf Tens,f
addwf Tens,f
swapf NumL,w
andlw 0X0F
addwf Ones,f
rlcf
Tens,f
rlcf
Ones,f
comf
Ones,f
rlcf
Ones,f
movf
NumL,w
andlw 0X0F
addwf Ones,f
rlcf
Thou,f
movlw 0X07
movwf TenK
; At this point, the original number is equal to
: TenK*10000+Thou*1000+Hund*100+Tens*10+Ones
; if those entities are regarded as two's complement binary. To be precise, all of
; them are negative except TenK. Now the number needs to be normalized, but this can
; all be done with simple byte arithmetic.
72
movlw 0X0A
Lb1:
decf
addwf
btfss
goto
Tens,f
Ones,f
STATUS,C
Lb1
Lb2:
decf
addwf
btfss
goto
Hund,f
Tens,f
STATUS,C
Lb2
Lb3:
decf
addwf
btfss
goto
Thou,f
Hund,f
STATUS,C
Lb3
Lb4:
decf
addwf
btfss
goto
retlw
TenK,f
Thou,f
STATUS,C
Lb4
0x00
; Ten
;
END SUBROUTINE HEX to DECIMAL
;End of program
END
APPENDIX E
Full Source Code of Graphical User Interface (GUI) in VB.NET
74
FORM 1
Private Sub Button1_Click(ByVal sender As System.Object, ByVal e As System.EventArgs) Handles
Button1.Click
Dim mmol As String
Dim freq As Double
Dim yO As Double
Dim rxdata(5) As Byte
Dim dataSer As Byte
Dim Total As Integer
Dim c As String
SerialPort1.DiscardInBuffer()
SerialPort1.Write("A")
'SerialPort1.Read(rxdata, 0, 5)
'dataSer = SerialPort1.ReadByte()
'TextBox3.Text = ChrW(dataSer)
'dataSer = SerialPort1.ReadByte()
'TextBox1.Text = ChrW(dataSer)
'SerialPort1.Read(rxdata, 0, 5)
'dataSer = SerialPort1.ReadByte()
'dataSer = rxdata(1)
'TextBox3.Text = ChrW(dataSer)
'TextBox4.Text = ChrW(rxdata(2))
'SerialPort1.Write("A")
'dataSer = SerialPort1.ReadByte()
'TextBox1.Text = ChrW(dataSer)
'SerialPort1.Write("A")
'dataSer = SerialPort1.ReadByte()
'TextBox1.Text = ChrW(dataSer)
'SerialPort1.Write("A")
'dataSer = SerialPort1.ReadByte()
'TextBox1.Text = ChrW(dataSer)
'SerialPort1.Write("A")
'dataSer = SerialPort1.ReadByte()
'TextBox1.Text = ChrW(dataSer)
End Sub
Private Sub Label3_Click(ByVal sender As System.Object, ByVal e As System.EventArgs)
Handles Label3.Click
End Sub
Private Sub TextBox2_TextChanged(ByVal sender
System.EventArgs) Handles TextBox2.TextChanged
As
System.Object,
ByVal
End Sub
Private Sub Button3_Click(ByVal sender As System.Object, ByVal e As System.EventArgs)
SerialPort1.Close()
End Sub
e
As
75
Private Sub Button4_Click(ByVal sender As System.Object, ByVal e As System.EventArgs)
Handles Button4.Click
Dim mmol As String
Dim freq As Double
Dim yO As Double
Dim rxdataq(5) As Byte
Dim tenthou As Double
Dim thou As Double
Dim hund As Double
Dim ten As Double
Dim one As Double
Dim HzValue As Double
Dim HzStr As String
Dim timeCount As Double
SerialPort1.Read(rxdataq, 0, 5)
TextBox3.Text = ChrW(rxdataq(0))
TextBox4.Text = ChrW(rxdataq(1))
TextBox5.Text = ChrW(rxdataq(2))
TextBox6.Text = ChrW(rxdataq(3))
TextBox7.Text = ChrW(rxdataq(4))
tenthou = Conversion.Val(TextBox3.Text)
thou = Conversion.Val(TextBox4.Text)
hund = Conversion.Val(TextBox5.Text)
ten = Conversion.Val(TextBox6.Text)
one = Conversion.Val(TextBox7.Text)
timeCount = tenthou * 10000 + thou * 1000 + hund * 100 + ten * 10 + one
HzValue = (1 / (timeCount * 0.0000011875)) / 1000
HzStr = Conversion.Str(HzValue)
TextBox1.Text = HzStr
freq = Conversion.Val(TextBox1.Text)
'yO = (-1) * 0.2034 * freq + 22.497
yO = 22.497 - 0.2034 * freq
mmol = Conversion.Str(yO)
TextBox2.Text = mmol
End Sub
Private Sub Form1_Deactivate(ByVal sender As Object, ByVal e As System.EventArgs) Handles
Me.Deactivate
End Sub
Private Sub Form1_Leave(ByVal sender As Object, ByVal e As System.EventArgs) Handles
Me.Leave
SerialPort1.Close()
End Sub
Private Sub Form1_Load(ByVal sender As Object, ByVal e As System.EventArgs) Handles
Me.Load
SerialPort1.Open()
End Sub
Private Sub Form1_Shown(ByVal sender As Object, ByVal e As System.EventArgs) Handles
Me.Shown
End Sub
End Class