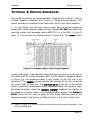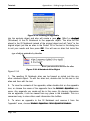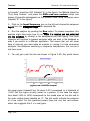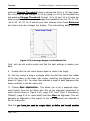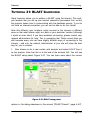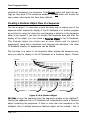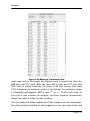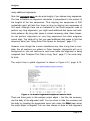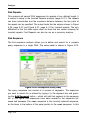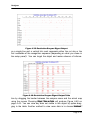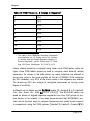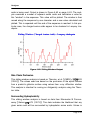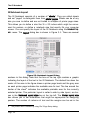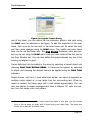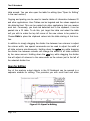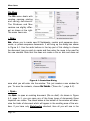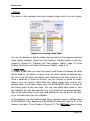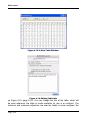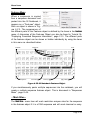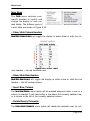
1
GENE
INSPECTOR® 2.0
Tutorials &
User Manual
Textco BioSoftware, Inc.
27 Gilson Road
West Lebanon,
New Hampshire 03784
U.S.A.
April 2012, First Edition
Gene Inspector® 2.0 Manual is Copyright © Textco BioSoftware, Inc. 2003-2012. All rights reserved.
Textco BioSoftware, Inc.
27 Gilson Road
West Lebanon,
New Hampshire 03784 U.S.A.
voice/FAX: 603-643-1471
email: [email protected]
URL: http://www.textco.com/
TABLE OF CONTENTS
Getting Started with Gene Inspector®
About This Manual... . . . . . . . . . . . . . . . . . . . . . . . . . . . . . . . . . . . . . . . . 1-1
Installing the Gene Inspector . . . . . . . . . . . . . . . . . . . . . . . . . . . . . . . . . 1-2
Updating Gene Inspector . . . . . . . . . . . . . . . . . . . . . . . . . . . . . . . . . 1-3
System Requirements (Mac): . . . . . . . . . . . . . . . . . . . . . . . . . . . . . . . . . 1-4
System Requirements (Windows): . . . . . . . . . . . . . . . . . . . . . . . . . . . . . 1-4
Overall Design Philosophy . . . . . . . . . . . . . . . . . . . . . . . . . . . . . . . . . . . . 1-4
Three Main Parts of the Application . . . . . . . . . . . . . . . . . . . . . . . . . . . . 1-4
Sequence Editor . . . . . . . . . . . . . . . . . . . . . . . . . . . . . . . . . . . . . . . . . . . . 1-5
Analysis Setups . . . . . . . . . . . . . . . . . . . . . . . . . . . . . . . . . . . . . . . . . . . . 1-6
GI Notebook . . . . . . . . . . . . . . . . . . . . . . . . . . . . . . . . . . . . . . . . . . . . . . . 1-6
Tutorials
About the Tutorials . . . . . . . . . . . . . . . . . . . . . . . . . . . . . . . . . . . . . . . . . . 2-1
Selection vs. Target . . . . . . . . . . . . . . . . . . . . . . . . . . . . . . . . . . . . . . . . . 2-1
Sequences . . . . . . . . . . . . . . . . . . . . . . . . . . . . . . . . . . . . . . . . . . . . . . . . 2-2
Tour of a Gene Inspector Notebook. . . . . . . . . . . . . . . . . . . . . . . . . . . . . 2-3
Editing Sequences . . . . . . . . . . . . . . . . . . . . . . . . . . . . . . . . . . . . . . . . . . 2-9
Using Analysis Setups . . . . . . . . . . . . . . . . . . . . . . . . . . . . . . . . . . . . . . . 2-14
Hotlinking Analysis Results. . . . . . . . . . . . . . . . . . . . . . . . . . . . . . . . . . . 2-19
Multiple Sequence Alignments. . . . . . . . . . . . . . . . . . . . . . . . . . . . . . . . 2-24
Running Summary Analyses. . . . . . . . . . . . . . . . . . . . . . . . . . . . . . . . . . 2-27
Aligning Analysis Objects . . . . . . . . . . . . . . . . . . . . . . . . . . . . . . . . . . . . 2-31
Customizing Gene Inspector Menus . . . . . . . . . . . . . . . . . . . . . . . . . . . 2-34
Taking Notes Using Background Text . . . . . . . . . . . . . . . . . . . . . . . . . . 2-36
Creating and Using Style Sheets . . . . . . . . . . . . . . . . . . . . . . . . . . . . . . 2-38
Adding More Analyses to a Setup . . . . . . . . . . . . . . . . . . . . . . . . . . . . . 2-40
Appendices – Hiding Large Amounts of Data . . . . . . . . . . . . . . . . . . . . 2-43
Customizing and Saving Analysis Setup Suites . . . . . . . . . . . . . . . . . . 2-46
Using Predefined Analysis Suites. . . . . . . . . . . . . . . . . . . . . . . . . . . . . . 2-48
Restriction Enzyme Digests . . . . . . . . . . . . . . . . . . . . . . . . . . . . . . . . . . 2-49
Displaying Formatted Sequence Information . . . . . . . . . . . . . . . . . . . . 2-51
Testcode – An Interactive Analysis . . . . . . . . . . . . . . . . . . . . . . . . . . . . 2-55
Dot Matrix Analysis – Another Interactive Analysis. . . . . . . . . . . . . . . . 2-58
page 1
TABLE OF CONTENTS
Using Bookmarks in the GI Notebook . . . . . . . . . . . . . . . . . . . . . . . . . .2-62
Creating Your Own Analysis Tables . . . . . . . . . . . . . . . . . . . . . . . . . . . . 2-63
BLAST Searching . . . . . . . . . . . . . . . . . . . . . . . . . . . . . . . . . . . . . . . . . . . 2-65
The GI Sequence Editor
Introduction to the Sequence Editor . . . . . . . . . . . . . . . . . . . . . . . . . . . . 3-1
The Overview Pane . . . . . . . . . . . . . . . . . . . . . . . . . . . . . . . . . . . . . . . . . . 3-1
The Editing Pane . . . . . . . . . . . . . . . . . . . . . . . . . . . . . . . . . . . . . . . . . . . . 3-2
Manipulating A Sequence . . . . . . . . . . . . . . . . . . . . . . . . . . . . . . . . 3-4
Formatting A Sequence Within the Sequence Editor . . . . . . . . . . . 3-5
Drag and Drop Sequence Editing . . . . . . . . . . . . . . . . . . . . . . . . . . . . . . 3-6
Entering and Checking Sequences . . . . . . . . . . . . . . . . . . . . . . . . . . . . . 3-7
Mapping the Keyboard . . . . . . . . . . . . . . . . . . . . . . . . . . . . . . . . . . . 3-7
Defining Speech Preferences (Mac only) . . . . . . . . . . . . . . . . . . . . 3-7
Confirming Sequences . . . . . . . . . . . . . . . . . . . . . . . . . . . . . . . . . . . 3-9
Multiple Sequence Alignments . . . . . . . . . . . . . . . . . . . . . . . . . . . . . . . 3-10
Enhancing Aligned Sequence Displays . . . . . . . . . . . . . . . . . . . . . . . . . 3-12
Sequence Adornments . . . . . . . . . . . . . . . . . . . . . . . . . . . . . . . . . . 3-13
Using Custom Score Adornments . . . . . . . . . . . . . . . . . . . . . . . . . 3-14
Creating a Features Object View of a Sequence . . . . . . . . . . . . . . . . . 3-16
Importing Sequences . . . . . . . . . . . . . . . . . . . . . . . . . . . . . . . . . . . . . . . 3-19
Generating Sequences . . . . . . . . . . . . . . . . . . . . . . . . . . . . . . . . . . . . . . 3-20
Analyses
Starting an Analysis . . . . . . . . . . . . . . . . . . . . . . . . . . . . . . . . . . . . . . . . . 4-1
The Analysis Setup Window . . . . . . . . . . . . . . . . . . . . . . . . . . . . . . . . . . . 4-2
The Analysis Monitor . . . . . . . . . . . . . . . . . . . . . . . . . . . . . . . . . . . . . . . . 4-3
Input Sequence Panel . . . . . . . . . . . . . . . . . . . . . . . . . . . . . . . . . . . . . . . 4-4
The Output Location Panel . . . . . . . . . . . . . . . . . . . . . . . . . . . . . . . . . . . . 4-7
Adding Analyses to an Analysis Setup Window . . . . . . . . . . . . . . . . . . . . 4-8
Adding Analysis Setups to the Menu . . . . . . . . . . . . . . . . . . . . . . . . . . . . 4-8
Modifying Output Objects . . . . . . . . . . . . . . . . . . . . . . . . . . . . . . . . . . . . . 4-9
Style Sheets . . . . . . . . . . . . . . . . . . . . . . . . . . . . . . . . . . . . . . . . . . . . . . . 4-9
page 2
TABLE OF CONTENTS
Frames . . . . . . . . . . . . . . . . . . . . . . . . . . . . . . . . . . . . . . . . . . . . . . . . . . 4-11
Median Sieving (Data-Sieving) . . . . . . . . . . . . . . . . . . . . . . . . . . . . . . . . 4-11
Editing Translation and Codon Preference Tables . . . . . . . . . . . . . . . . 4-13
Nucleic Acid Analysis . . . . . . . . . . . . . . . . . . . . . . . . . . . . . . . . . . . . . . . 4-16
Align 2 Sequences (Global) . . . . . . . . . . . . . . . . . . . . . . . . . . . . . . 4-16
Align Multiple Sequences . . . . . . . . . . . . . . . . . . . . . . . . . . . . . . . 4-20
Base Composition . . . . . . . . . . . . . . . . . . . . . . . . . . . . . . . . . . . . . 4-21
Base Distribution . . . . . . . . . . . . . . . . . . . . . . . . . . . . . . . . . . . . . . 4-21
CodonPreference . . . . . . . . . . . . . . . . . . . . . . . . . . . . . . . . . . . . . . 4-23
Dot Matrix . . . . . . . . . . . . . . . . . . . . . . . . . . . . . . . . . . . . . . . . . . . . 4-26
Find Inverted Repeats . . . . . . . . . . . . . . . . . . . . . . . . . . . . . . . . . . 4-31
Find Repeats . . . . . . . . . . . . . . . . . . . . . . . . . . . . . . . . . . . . . . . . . . 4-34
Find Sequence . . . . . . . . . . . . . . . . . . . . . . . . . . . . . . . . . . . . . . . . 4-34
GC Coding Prediction . . . . . . . . . . . . . . . . . . . . . . . . . . . . . . . . . . . 4-37
Open Reading Frames . . . . . . . . . . . . . . . . . . . . . . . . . . . . . . . . . . 4-39
Restriction Enzyme Digest . . . . . . . . . . . . . . . . . . . . . . . . . . . . . . . 4-42
TestCode . . . . . . . . . . . . . . . . . . . . . . . . . . . . . . . . . . . . . . . . . . . . . 4-44
BLAST Search . . . . . . . . . . . . . . . . . . . . . . . . . . . . . . . . . . . . . . . . . 4-47
Protein Analyses . . . . . . . . . . . . . . . . . . . . . . . . . . . . . . . . . . . . . . . . . . . 4-48
Accessible Surface Area . . . . . . . . . . . . . . . . . . . . . . . . . . . . . . . . 4-48
Align 2 Sequences (Global) . . . . . . . . . . . . . . . . . . . . . . . . . . . . . . 4-49
Align Multiple Sequences . . . . . . . . . . . . . . . . . . . . . . . . . . . . . . . 4-52
Amino Acid Composition . . . . . . . . . . . . . . . . . . . . . . . . . . . . . . . . 4-53
Antigenicity . . . . . . . . . . . . . . . . . . . . . . . . . . . . . . . . . . . . . . . . . . . 4-54
CF Structure Prediction . . . . . . . . . . . . . . . . . . . . . . . . . . . . . . . . . 4-54
Dot Matrix . . . . . . . . . . . . . . . . . . . . . . . . . . . . . . . . . . . . . . . . . . . . 4-54
Find Repeats . . . . . . . . . . . . . . . . . . . . . . . . . . . . . . . . . . . . . . . . . . 4-55
Find Sequence . . . . . . . . . . . . . . . . . . . . . . . . . . . . . . . . . . . . . . . . 4-56
Find Sequence (Prosite-style) . . . . . . . . . . . . . . . . . . . . . . . . . . . . 4-56
GOR Structure Prediction . . . . . . . . . . . . . . . . . . . . . . . . . . . . . . . . 4-58
Helical Wheel . . . . . . . . . . . . . . . . . . . . . . . . . . . . . . . . . . . . . . . . . 4-59
Hydropathy . . . . . . . . . . . . . . . . . . . . . . . . . . . . . . . . . . . . . . . . . . . 4-60
Hydration Potential . . . . . . . . . . . . . . . . . . . . . . . . . . . . . . . . . . . . . 4-62
Membrane Buried Regions . . . . . . . . . . . . . . . . . . . . . . . . . . . . . . 4-63
Optimal Matching Hydrophobicity . . . . . . . . . . . . . . . . . . . . . . . . . 4-63
page 3
TABLE OF CONTENTS
pH/pI . . . . . . . . . . . . . . . . . . . . . . . . . . . . . . . . . . . . . . . . . . . . . . . . 4-63
Physical Characteristics . . . . . . . . . . . . . . . . . . . . . . . . . . . . . . . . . 4-63
Prosite Motif Search . . . . . . . . . . . . . . . . . . . . . . . . . . . . . . . . . . . .4-64
Protein Cleavage . . . . . . . . . . . . . . . . . . . . . . . . . . . . . . . . . . . . . . . 4-67
Protein Interior . . . . . . . . . . . . . . . . . . . . . . . . . . . . . . . . . . . . . . . . 4-67
Side Chain Flexibility . . . . . . . . . . . . . . . . . . . . . . . . . . . . . . . . . . . . 4-67
Signal Sequence . . . . . . . . . . . . . . . . . . . . . . . . . . . . . . . . . . . . . . . 4-68
Sliding Window . . . . . . . . . . . . . . . . . . . . . . . . . . . . . . . . . . . . . . . . 4-68
Side Chain Protrusion . . . . . . . . . . . . . . . . . . . . . . . . . . . . . . . . . . . 4-69
Surrounding Hydrophobicity . . . . . . . . . . . . . . . . . . . . . . . . . . . . . . 4-69
Temperature Factor . . . . . . . . . . . . . . . . . . . . . . . . . . . . . . . . . . . . 4-70
Transmembrane Helices . . . . . . . . . . . . . . . . . . . . . . . . . . . . . . . . . 4-70
BLAST Search . . . . . . . . . . . . . . . . . . . . . . . . . . . . . . . . . . . . . . . . . 4-70
The GI Notebook
Overview of the GI Notebook . . . . . . . . . . . . . . . . . . . . . . . . . . . . . . . . . . 5-1
Conditional Text . . . . . . . . . . . . . . . . . . . . . . . . . . . . . . . . . . . . . . . . . 5-2
Style Sheets . . . . . . . . . . . . . . . . . . . . . . . . . . . . . . . . . . . . . . . . . . . . 5-3
GI Notebook Layout . . . . . . . . . . . . . . . . . . . . . . . . . . . . . . . . . . . . . 5-4
Bookmarks . . . . . . . . . . . . . . . . . . . . . . . . . . . . . . . . . . . . . . . . . . . . 5-5
GI Notebook Objects . . . . . . . . . . . . . . . . . . . . . . . . . . . . . . . . . . . . . . . . . 5-6
Selecting vs. Targeting . . . . . . . . . . . . . . . . . . . . . . . . . . . . . . . . . . . 5-6
Drawing Tools . . . . . . . . . . . . . . . . . . . . . . . . . . . . . . . . . . . . . . . . . . 5-7
Preferred Size for Objects . . . . . . . . . . . . . . . . . . . . . . . . . . . . . . . . . 5-8
Framing GI Notebook Objects . . . . . . . . . . . . . . . . . . . . . . . . . . . . . 5-8
Text Flow Around Objects . . . . . . . . . . . . . . . . . . . . . . . . . . . . . . . . 5-10
Aligning Objects . . . . . . . . . . . . . . . . . . . . . . . . . . . . . . . . . . . . . . . . 5-10
Getting Information About Objects . . . . . . . . . . . . . . . . . . . . . . . . 5-11
Text Objects (Sidebar Text) . . . . . . . . . . . . . . . . . . . . . . . . . . . . . . .5-12
Table Objects (User Tables) . . . . . . . . . . . . . . . . . . . . . . . . . . . . . . 5-12
Open for Editing . . . . . . . . . . . . . . . . . . . . . . . . . . . . . . . . . . . . . . . . . . . 5-14
Analysis Output Objects . . . . . . . . . . . . . . . . . . . . . . . . . . . . . . . . . . . . . 5-15
Features Objects . . . . . . . . . . . . . . . . . . . . . . . . . . . . . . . . . . . . . . . . . . . 5-16
Appendix Objects . . . . . . . . . . . . . . . . . . . . . . . . . . . . . . . . . . . . . . . . . . 5-16
Tool Extensions . . . . . . . . . . . . . . . . . . . . . . . . . . . . . . . . . . . . . . . . . . . . 5-17
page 4
TABLE OF CONTENTS
Uses for Tool Extensions . . . . . . . . . . . . . . . . . . . . . . . . . . . . . . . . 5-18
Menu Items
File Menu . . . . . . . . . . . . . . . . . . . . . . . . . . . . . . . . . . . . . . . . . . . . . . . . . 6-2
New... . . . . . . . . . . . . . . . . . . . . . . . . . . . . . . . . . . . . . . . . . . . . . . . . . 6-2
Open... . . . . . . . . . . . . . . . . . . . . . . . . . . . . . . . . . . . . . . . . . . . . . . . . 6-2
Close . . . . . . . . . . . . . . . . . . . . . . . . . . . . . . . . . . . . . . . . . . . . . . . . . 6-3
Save . . . . . . . . . . . . . . . . . . . . . . . . . . . . . . . . . . . . . . . . . . . . . . . . . . 6-3
Save As... . . . . . . . . . . . . . . . . . . . . . . . . . . . . . . . . . . . . . . . . . . . . . . 6-3
Save a Copy . . . . . . . . . . . . . . . . . . . . . . . . . . . . . . . . . . . . . . . . . . . 6-4
Revert to Saved . . . . . . . . . . . . . . . . . . . . . . . . . . . . . . . . . . . . . . . . 6-4
Import . . . . . . . . . . . . . . . . . . . . . . . . . . . . . . . . . . . . . . . . . . . . . . . . 6-5
Export . . . . . . . . . . . . . . . . . . . . . . . . . . . . . . . . . . . . . . . . . . . . . . . . 6-6
Page Setup... . . . . . . . . . . . . . . . . . . . . . . . . . . . . . . . . . . . . . . . . . . . 6-7
Print... . . . . . . . . . . . . . . . . . . . . . . . . . . . . . . . . . . . . . . . . . . . . . . . . 6-7
Print Notebook and Appendices . . . . . . . . . . . . . . . . . . . . . . . . . . . 6-8
Choose GI Data Folder (Windows only) . . . . . . . . . . . . . . . . . . . . . . 6-8
Set Alias Resolution Rules... (Mac only) . . . . . . . . . . . . . . . . . . . . . 6-8
Quit (Mac)/Exit (Windows) . . . . . . . . . . . . . . . . . . . . . . . . . . . . . . . . 6-8
Edit Menu . . . . . . . . . . . . . . . . . . . . . . . . . . . . . . . . . . . . . . . . . . . . . . . . . 6-9
Undo . . . . . . . . . . . . . . . . . . . . . . . . . . . . . . . . . . . . . . . . . . . . . . . . . 6-9
Cut . . . . . . . . . . . . . . . . . . . . . . . . . . . . . . . . . . . . . . . . . . . . . . . . . . . 6-9
Copy . . . . . . . . . . . . . . . . . . . . . . . . . . . . . . . . . . . . . . . . . . . . . . . . . . 6-9
Paste . . . . . . . . . . . . . . . . . . . . . . . . . . . . . . . . . . . . . . . . . . . . . . . . . 6-9
Special Paste . . . . . . . . . . . . . . . . . . . . . . . . . . . . . . . . . . . . . . . . . 6-10
Clear . . . . . . . . . . . . . . . . . . . . . . . . . . . . . . . . . . . . . . . . . . . . . . . . 6-10
Select All . . . . . . . . . . . . . . . . . . . . . . . . . . . . . . . . . . . . . . . . . . . . . 6-10
Show Selection . . . . . . . . . . . . . . . . . . . . . . . . . . . . . . . . . . . . . . . . 6-11
Find & Replace . . . . . . . . . . . . . . . . . . . . . . . . . . . . . . . . . . . . . . . . 6-11
Drag & Drop Options… . . . . . . . . . . . . . . . . . . . . . . . . . . . . . . . . . . 6-13
Show Clipboard . . . . . . . . . . . . . . . . . . . . . . . . . . . . . . . . . . . . . . . . 6-14
Show/Hide Page Breaks . . . . . . . . . . . . . . . . . . . . . . . . . . . . . . . . 6-14
Windows Menu . . . . . . . . . . . . . . . . . . . . . . . . . . . . . . . . . . . . . . . . . . . . 6-15
Stack Windows . . . . . . . . . . . . . . . . . . . . . . . . . . . . . . . . . . . . . . . . 6-15
Current Window Names . . . . . . . . . . . . . . . . . . . . . . . . . . . . . . . . . 6-15
Format Menu . . . . . . . . . . . . . . . . . . . . . . . . . . . . . . . . . . . . . . . . . . . . . 6-16
Fill . . . . . . . . . . . . . . . . . . . . . . . . . . . . . . . . . . . . . . . . . . . . . . . . . . 6-16
Lines . . . . . . . . . . . . . . . . . . . . . . . . . . . . . . . . . . . . . . . . . . . . . . . . 6-16
Font . . . . . . . . . . . . . . . . . . . . . . . . . . . . . . . . . . . . . . . . . . . . . . . . . 6-17
page 5
TABLE OF CONTENTS
Style . . . . . . . . . . . . . . . . . . . . . . . . . . . . . . . . . . . . . . . . . . . . . . . . . 6-17
Size . . . . . . . . . . . . . . . . . . . . . . . . . . . . . . . . . . . . . . . . . . . . . . . . . 6-17
Color . . . . . . . . . . . . . . . . . . . . . . . . . . . . . . . . . . . . . . . . . . . . . . . . . 6-18
Frames . . . . . . . . . . . . . . . . . . . . . . . . . . . . . . . . . . . . . . . . . . . . . . . 6-18
Numeric Format . . . . . . . . . . . . . . . . . . . . . . . . . . . . . . . . . . . . . . . 6-19
Paragraph . . . . . . . . . . . . . . . . . . . . . . . . . . . . . . . . . . . . . . . . . . . . 6-19
Style Sheets . . . . . . . . . . . . . . . . . . . . . . . . . . . . . . . . . . . . . . . . . . . 6-20
Analysis Menu . . . . . . . . . . . . . . . . . . . . . . . . . . . . . . . . . . . . . . . . . . . . . 6-21
New Analysis... . . . . . . . . . . . . . . . . . . . . . . . . . . . . . . . . . . . . . . . . 6-21
Previous Setup... . . . . . . . . . . . . . . . . . . . . . . . . . . . . . . . . . . . . . . . 6-21
Show/Hide Analysis Monitor . . . . . . . . . . . . . . . . . . . . . . . . . . . . . 6-21
Tables . . . . . . . . . . . . . . . . . . . . . . . . . . . . . . . . . . . . . . . . . . . . . . . . 6-23
Add Another Analysis... . . . . . . . . . . . . . . . . . . . . . . . . . . . . . . . . . . 6-25
Remove Analysis... . . . . . . . . . . . . . . . . . . . . . . . . . . . . . . . . . . . . . 6-25
Update Setup . . . . . . . . . . . . . . . . . . . . . . . . . . . . . . . . . . . . . . . . . 6-25
Add Setup To Menu... . . . . . . . . . . . . . . . . . . . . . . . . . . . . . . . . . . .6-26
Remove Setup From Menu... . . . . . . . . . . . . . . . . . . . . . . . . . . . . . 6-26
Custom Analysis Setups . . . . . . . . . . . . . . . . . . . . . . . . . . . . . . . . . 6-26
Notebook Menu . . . . . . . . . . . . . . . . . . . . . . . . . . . . . . . . . . . . . . . . . . . 6-27
Get Info... . . . . . . . . . . . . . . . . . . . . . . . . . . . . . . . . . . . . . . . . . . . . . 6-27
Tools . . . . . . . . . . . . . . . . . . . . . . . . . . . . . . . . . . . . . . . . . . . . . . . . . 6-27
Reduction . . . . . . . . . . . . . . . . . . . . . . . . . . . . . . . . . . . . . . . . . . . .6-28
Tool Extensions . . . . . . . . . . . . . . . . . . . . . . . . . . . . . . . . . . . . . . . .6-28
Open For Editing... . . . . . . . . . . . . . . . . . . . . . . . . . . . . . . . . . . . . . . 6-29
Make Alias... . . . . . . . . . . . . . . . . . . . . . . . . . . . . . . . . . . . . . . . . . . 6-29
Find Original... . . . . . . . . . . . . . . . . . . . . . . . . . . . . . . . . . . . . . . . . . 6-30
Bookmarks . . . . . . . . . . . . . . . . . . . . . . . . . . . . . . . . . . . . . . . . . . . 6-30
Text Flow . . . . . . . . . . . . . . . . . . . . . . . . . . . . . . . . . . . . . . . . . . . . . 6-30
Arrangement . . . . . . . . . . . . . . . . . . . . . . . . . . . . . . . . . . . . . . . . . . 6-31
Display . . . . . . . . . . . . . . . . . . . . . . . . . . . . . . . . . . . . . . . . . . . . . . . 6-32
Appendices . . . . . . . . . . . . . . . . . . . . . . . . . . . . . . . . . . . . . . . . . . . 6-33
Links . . . . . . . . . . . . . . . . . . . . . . . . . . . . . . . . . . . . . . . . . . . . . . . . 6-34
Page Break . . . . . . . . . . . . . . . . . . . . . . . . . . . . . . . . . . . . . . . . . . . 6-37
Notebook Layout... . . . . . . . . . . . . . . . . . . . . . . . . . . . . . . . . . . . . . 6-37
Features Menu . . . . . . . . . . . . . . . . . . . . . . . . . . . . . . . . . . . . . . . . . . . .6-39
Mark Sites… . . . . . . . . . . . . . . . . . . . . . . . . . . . . . . . . . . . . . . . . . . 6-39
Translate… . . . . . . . . . . . . . . . . . . . . . . . . . . . . . . . . . . . . . . . . . . . . 6-40
Define Intron . . . . . . . . . . . . . . . . . . . . . . . . . . . . . . . . . . . . . . . . . . 6-40
Undefine Intron(s) . . . . . . . . . . . . . . . . . . . . . . . . . . . . . . . . . . . . . . 6-40
Display . . . . . . . . . . . . . . . . . . . . . . . . . . . . . . . . . . . . . . . . . . . . . . . 6-40
page 6
TABLE OF CONTENTS
Grouping . . . . . . . . . . . . . . . . . . . . . . . . . . . . . . . . . . . . . . . . . . . . . 6-42
Adjust Size To Contents . . . . . . . . . . . . . . . . . . . . . . . . . . . . . . . . . 6-43
Sequences Menu . . . . . . . . . . . . . . . . . . . . . . . . . . . . . . . . . . . . . . . . . . 6-44
Sequence Info… . . . . . . . . . . . . . . . . . . . . . . . . . . . . . . . . . . . . . . . 6-44
Format Sequences… . . . . . . . . . . . . . . . . . . . . . . . . . . . . . . . . . . . 6-44
Display . . . . . . . . . . . . . . . . . . . . . . . . . . . . . . . . . . . . . . . . . . . . . . . 6-44
Consensus . . . . . . . . . . . . . . . . . . . . . . . . . . . . . . . . . . . . . . . . . . . 6-44
Sequence Menu . . . . . . . . . . . . . . . . . . . . . . . . . . . . . . . . . . . . . . . . . . . 6-45
Sequence Info... . . . . . . . . . . . . . . . . . . . . . . . . . . . . . . . . . . . . . . . 6-45
New Sequence... . . . . . . . . . . . . . . . . . . . . . . . . . . . . . . . . . . . . . . . 6-45
Insert Xs…/Insert Ns… . . . . . . . . . . . . . . . . . . . . . . . . . . . . . . . . . . 6-45
Generate Random... . . . . . . . . . . . . . . . . . . . . . . . . . . . . . . . . . . . . 6-46
Go To Position... . . . . . . . . . . . . . . . . . . . . . . . . . . . . . . . . . . . . . . . 6-46
Speak Typing . . . . . . . . . . . . . . . . . . . . . . . . . . . . . . . . . . . . . . . . . . 6-46
Speech Prefs... . . . . . . . . . . . . . . . . . . . . . . . . . . . . . . . . . . . . . . . . 6-47
Map Keys... . . . . . . . . . . . . . . . . . . . . . . . . . . . . . . . . . . . . . . . . . . . 6-47
Show/Hide Sequence Monitor . . . . . . . . . . . . . . . . . . . . . . . . . . . 6-47
Display . . . . . . . . . . . . . . . . . . . . . . . . . . . . . . . . . . . . . . . . . . . . . . . 6-47
Manipulate . . . . . . . . . . . . . . . . . . . . . . . . . . . . . . . . . . . . . . . . . . . 6-48
Alignment . . . . . . . . . . . . . . . . . . . . . . . . . . . . . . . . . . . . . . . . . . . . 6-49
Consensus . . . . . . . . . . . . . . . . . . . . . . . . . . . . . . . . . . . . . . . . . . . 6-49
Format Sequence... . . . . . . . . . . . . . . . . . . . . . . . . . . . . . . . . . . . . 6-51
Use Extra Caution… . . . . . . . . . . . . . . . . . . . . . . . . . . . . . . . . . . . . 6-51
Sidebar Menu . . . . . . . . . . . . . . . . . . . . . . . . . . . . . . . . . . . . . . . . . . . . . 6-52
Adjust Size To Contents . . . . . . . . . . . . . . . . . . . . . . . . . . . . . . . . . 6-52
Table Menu . . . . . . . . . . . . . . . . . . . . . . . . . . . . . . . . . . . . . . . . . . . . . . . 6-53
Show/Hide Column Headers . . . . . . . . . . . . . . . . . . . . . . . . . . . . . 6-53
Show/Hide Row Headers . . . . . . . . . . . . . . . . . . . . . . . . . . . . . . . . 6-53
Insert Row/Column . . . . . . . . . . . . . . . . . . . . . . . . . . . . . . . . . . . . 6-53
Delete Row(s)/Column(s) . . . . . . . . . . . . . . . . . . . . . . . . . . . . . . . . 6-53
Add Column(s) At Right . . . . . . . . . . . . . . . . . . . . . . . . . . . . . . . . . 6-54
Add Row(s) At Bottom . . . . . . . . . . . . . . . . . . . . . . . . . . . . . . . . . . . 6-54
Adjust Size To Contents . . . . . . . . . . . . . . . . . . . . . . . . . . . . . . . . . 6-54
Tips For Using The Gene Inspector
Using Extra Disk Space for Analyses . . . . . . . . . . . . . . . . . . . . . . . . . . . . 7-1
Analyses That Take a Long Time . . . . . . . . . . . . . . . . . . . . . . . . . . . . . . . 7-3
Temporarily Pausing Long Running Analyses . . . . . . . . . . . . . . . . . . . . . 7-3
page 7
TABLE OF CONTENTS
About GI Notebook Size . . . . . . . . . . . . . . . . . . . . . . . . . . . . . . . . . . . . . . 7-4
Sharing Setups With Colleagues . . . . . . . . . . . . . . . . . . . . . . . . . . . . . . . 7-4
Printing and Viewing Large Objects . . . . . . . . . . . . . . . . . . . . . . . . . . . . . 7-5
Appendix
Tables . . . . . . . . . . . . . . . . . . . . . . . . . . . . . . . . . . . . . . . . . . . . . . . . . . . . A-1
Argos, et al. . . . . . . . . . . . . . . . . . . . . . . . . . . . . . . . . . . . . . . . . . . . . A-1
Bull & Breese . . . . . . . . . . . . . . . . . . . . . . . . . . . . . . . . . . . . . . . . . . A-1
Eisenberg, et al. . . . . . . . . . . . . . . . . . . . . . . . . . . . . . . . . . . . . . . . . A-1
Emini, et al. . . . . . . . . . . . . . . . . . . . . . . . . . . . . . . . . . . . . . . . . . . . . A-1
Engelman & Steitz . . . . . . . . . . . . . . . . . . . . . . . . . . . . . . . . . . . . . . A-1
Engelman, et al. . . . . . . . . . . . . . . . . . . . . . . . . . . . . . . . . . . . . . . . . A-2
Fauchere & Pliska . . . . . . . . . . . . . . . . . . . . . . . . . . . . . . . . . . . . . . . A-2
Fraga . . . . . . . . . . . . . . . . . . . . . . . . . . . . . . . . . . . . . . . . . . . . . . . . . A-2
GES . . . . . . . . . . . . . . . . . . . . . . . . . . . . . . . . . . . . . . . . . . . . . . . . . . A-2
Hopp and Woods . . . . . . . . . . . . . . . . . . . . . . . . . . . . . . . . . . . . . . . . A-2
Janin . . . . . . . . . . . . . . . . . . . . . . . . . . . . . . . . . . . . . . . . . . . . . . . . . . A-3
Kyte and Doolittle . . . . . . . . . . . . . . . . . . . . . . . . . . . . . . . . . . . . . . . A-3
Manavalan & Ponnuswamy . . . . . . . . . . . . . . . . . . . . . . . . . . . . . . . A-3
Parker, et al. . . . . . . . . . . . . . . . . . . . . . . . . . . . . . . . . . . . . . . . . . . . A-3
Sweet and Eisenberg . . . . . . . . . . . . . . . . . . . . . . . . . . . . . . . . . . . . A-3
Thornton, et al. . . . . . . . . . . . . . . . . . . . . . . . . . . . . . . . . . . . . . . . . . A-4
von Heijne . . . . . . . . . . . . . . . . . . . . . . . . . . . . . . . . . . . . . . . . . . . . . A-4
Welling, et al. . . . . . . . . . . . . . . . . . . . . . . . . . . . . . . . . . . . . . . . . . . . A-4
Wolfenden, et al. . . . . . . . . . . . . . . . . . . . . . . . . . . . . . . . . . . . . . . . . A-4
Prosite Language Definitions . . . . . . . . . . . . . . . . . . . . . . . . . . . . . . . . . . A-5
Protein Cleavage Sites . . . . . . . . . . . . . . . . . . . . . . . . . . . . . . . . . . . . . . . A-6
IUPAC Standard Nucleic Acid Codes . . . . . . . . . . . . . . . . . . . . . . . . . . . . A-7
IUPAC Standard Amino Acid Codes . . . . . . . . . . . . . . . . . . . . . . . . . . . . . A-8
Vectors by Supplier . . . . . . . . . . . . . . . . . . . . . . . . . . . . . . . . . . . . . . . . . . A-9
Amersham . . . . . . . . . . . . . . . . . . . . . . . . . . . . . . . . . . . . . . . . . . . . . A-9
Boehringer . . . . . . . . . . . . . . . . . . . . . . . . . . . . . . . . . . . . . . . . . . . . . A-9
BRL . . . . . . . . . . . . . . . . . . . . . . . . . . . . . . . . . . . . . . . . . . . . . . . . . . . A-9
Clontech . . . . . . . . . . . . . . . . . . . . . . . . . . . . . . . . . . . . . . . . . . . . . . A-10
page 8
TABLE OF CONTENTS
IBI . . . . . . . . . . . . . . . . . . . . . . . . . . . . . . . . . . . . . . . . . . . . . . . . . . A-12
In Vitrogen . . . . . . . . . . . . . . . . . . . . . . . . . . . . . . . . . . . . . . . . . . . . A-12
New England Biolabs (NEB) . . . . . . . . . . . . . . . . . . . . . . . . . . . . . . A-13
NovaGen . . . . . . . . . . . . . . . . . . . . . . . . . . . . . . . . . . . . . . . . . . . . . A-14
Phage . . . . . . . . . . . . . . . . . . . . . . . . . . . . . . . . . . . . . . . . . . . . . . . A-16
Pharmacia . . . . . . . . . . . . . . . . . . . . . . . . . . . . . . . . . . . . . . . . . . . . A-16
Promega . . . . . . . . . . . . . . . . . . . . . . . . . . . . . . . . . . . . . . . . . . . . . A-18
Sigma . . . . . . . . . . . . . . . . . . . . . . . . . . . . . . . . . . . . . . . . . . . . . . . A-19
Stratagene: . . . . . . . . . . . . . . . . . . . . . . . . . . . . . . . . . . . . . . . . . . . A-20
U.S. Biochemicals (USB) . . . . . . . . . . . . . . . . . . . . . . . . . . . . . . . . A-21
List of all Vectors Included With Gene Inspector: . . . . . . . . . . . . . . . . A-22
Index
page 9
TABLE OF CONTENTS
page 10
Getting Started with Gene Inspector®
Chapter 1
Getting Started with
Gene Inspector®
About This Manual...
This manual contains a number of sections describing the Gene Inspector®.
Because the program was designed from the very beginning to function the
way a molecular biologist would think, it often does things that other programs
fail to do, or else might do things differently from the way other programs do.
To get started with Gene Inspector and to get an overall feel for the program,
we strongly urge you to go through the Tutorials. They will point out some of
the differences between the Gene Inspector and other programs and provide
you with an overview of the general philosophy of the application.
The Analyses chapter of the manual (Chapter 4) describes what each analysis does and how the analysis results can be used for biological insight. It
also describes how you can run analyses.
The chapter on the GI Notebook (Chapter 5) discusses how you can use the
GI Notebook to record and discuss experimental results and how the GI
Notebook can be used as the repository for analysis results. In addition, the
GI Notebook can also be used to design and print posters.
The Sequence Editor chapter (Chapter 3) discusses in detail how you can
create, align, and modify sequences. Each sequence editor document can
hold one or more sequences. These sequences are used as the starting
points for analyses. Multiple sequence alignments also reside in sequence
editor documents. Extensive capabilities have been built into the sequence
Page 1-1
Getting Started with Gene Inspector®
editor to enable the display of multiple aligned sequences with tremendous
flexibility.
The Menu Items chapter (Chapter 6) lists and discusses every menu option
available in the program, starting with the File menu on the left and going
through the specific menus that appear on the right. It can be used as a
handy reference.
Finally, the Tips chapter (Chapter 7) covers some useful ways of dealing with
different aspects of the program, offers some suggestions on how you might
work more efficiently with your data, and answers some frequently asked
questions (FAQs).
In many locations throughout the manual you will be asked to select items in
menus. To make your choices as clear as possible, all menu selections are
indicated as hierarchical choices such as Edit ⎜ Select All. This particular case
means to locate the Edit menu and then choose Select All under the Edit menu.
Throughout the manual figures alternate between Windows and Macintosh
images.
Installing the Gene Inspector
The initial Gene Inspector installation requires about 14 megabytes of disk
space. This includes all the files and databases need to run GI and carry out
the tutorials. All the files are stored in a folder on your Gene Inspector CD
and need to be installed on your hard disk from this CD.
We have tried to make the installation of Gene Inspector as simple as possible.
On the Macintosh:
1. Insert the Gene Inspector CD and locate the Gene Inspector folder.
2. Drag this folder to your hard disk. Note that it is important to drag the
entire folder from the CD to ensure that the application will run properly.
Dragging just the application from the CD to your hard disk will not work. If
Page 1-2
Getting Started with Gene Inspector®
you have a previous version of Gene Inspector and have files that you would
like to keep with the application, you can place them into the new Gene
Inspector folder once you have dragged that folder from the CD.
3. With the CD still in the computer, start up the Gene Inspector application
you just installed. Enter the personalization information (name and organization). The first time you run the new Gene Inspector , you will be asked to
insert the original CD (unless it is already in the CD drive). This is the only
time you will need to do this unless you reformat your hard disk.
4.You are finished installing the software. Please read the notes below and
enjoy using Gene Inspector.
On Windows:
1.Insert the Gene Inspector CD and run the installer application. Follow the
steps that are presented on screen.
Updating Gene Inspector
Updates will be made available for Gene Inspector 2.0 from our web site as
they are needed. Check <http://www.textco.com/downloads/
updates.html> to see if there is a newer version. To run the newer version of the application, download it from the web site and put it into the Gene
Inspector folder on your hard disk. After checking that it works, discard the
older version of Gene Inspector 2.0. There is no need to type in 20-30 characters to activate the new version.
We have included a demo version of Gene Construction Kit® on the Gene
Inspector CD. This is Textco’s DNA manipulation, presentation, and cloning
program that complements Gene Inspector. You can install the demo version
by dragging the entire ‘Gene Construction Kit Demo’ folder to your hard disk
(Mac) or running the installer found in the ‘Gene Construction Kit demo’
folder on Windows.
Please call us if you have any questions or problems.
Page 1-3
Getting Started with Gene Inspector®
We hope you enjoy your new software.
System Requirements (Mac):
• System 10.5 (or later)
• 8 megabytes of RAM available for the application
• 14 megabytes of disk space depending on what is installed
System Requirements (Windows):
• Windows 7, XP sp3, or Vista
• 8 megabytes of RAM available for the application
• 14 megabytes of disk space depending on what is installed
Overall Design Philosophy
The Gene Inspector provides an electronic notebook that functions as a counterpart to the paper version you are used to using in the laboratory. At the
same time the GI Notebook provides additional capabilities only available in
an electronic medium, such as rapid searching through your notes for key
words and easy navigation within your notes. An integral part of the application is the built-in capability to carry out comprehensive nucleic acid and protein sequence analyses. Defining a sequence analysis is straightforward and
intuitive and provides a reproducible way for users to share analysis parameters. We firmly believe that you should spend most of your time doing analyses rather than trying to figure out how to run the program. This has been
our guiding philosophy.
Three Main Parts of the Application
There are three main parts to the Gene Inspector application: the Sequence
Editor, the Analysis Setups, and the GI Notebook. These parts work together
to provide a well defined interface between the user and the entire set of
analyses. The Sequence Editor provides a means to enter and edit
sequences and to make them available for analyses. Analyses are defined
using Analysis Setups and the results of the analyses are placed into a GI
Notebook. The following sections in this chapter examine these components
Page 1-4
Getting Started with Gene Inspector®
briefly. The Sequence Editor (Chapter 3), Analyses (Chapter 4), and the GI
Notebook (Chapter 5) are discussed in more detail in their own chapters.
Sequence Editor
The sequence editor provides a window that can be used to hold one or
more sequences. Either nucleic acid or protein sequences are allowed, but
the two types of sequences cannot reside in the same sequence document.
Each sequence window corresponds to a single file and may contain a single
sequence or a collection of sequences. Sequences that reside in sequence
editor documents are the starting point for virtually all analyses, as well as the
generation of formatted sequence displays in the GI Notebook (see “Creating
a Features Object View of a Sequence”, page 3-16).
The Sequence Editor can contain multiple sequences which you might want
to store grouped together. For example, you might have a file of globin
sequences containing globins from a number of different organisms, or different globins from the same organism. You might also choose to group all of
your vector sequences together in a single Sequence Editor document for
easy reference. This has been done in the vector sequence files provided
with Gene Inspector – all vectors from a given vendor are grouped into a single file.
At a more advanced level, you can take advantage of the Sequence Editor’s
ability to contain multiple sequences to generate calculated sequences, such
as a consensus sequence and to perform multiple sequence alignments (see
“Align Multiple Sequences”, page 4-20 and page 4-52).
Hotlinks (see “Links”, page 6-34) enable a sequence to be actively connected directly to one or more analyses. By hotlinking a contig or a consensus sequence to a set of analyses, it is possible automatically to generate
new and up-to-date analyses from these generated sequences as your contig
grows or as you refine the consensus sequence.
Page 1-5
Getting Started with Gene Inspector®
Analysis Setups
Analysis Setups provide a container in which single or multiple analyses on
one or more sequences can be defined. Through the ability to install new
Analysis Setup Windows as menu items, you can assemble a set of custom
analyses (an analysis suite) having all the parameters defined in a way which
works best for your purposes. The entire analysis suite can be reused simply
by selecting the item from a menu.
Because of it’s similarity to the way you are used to working in other applications and operating systems, you already know how to use Gene Inspector’s
Analysis Setup Window. There is a scrollable list of icons on left representing
different functions. When an icon is selected from this list, relevant information
about the selected icon’s function is displayed in a panel on the right.
Through this mechanism, you can choose an Analysis icon, define analysis
parameters, specify sequences to be analyzed, and define output locations.
Each analysis has its own icon and corresponding panel.
The Input icon allows you to define which sequence or sequences are to be
used in the analyses. You can choose sequences from one or more files.
Every sequence chosen will be analyzed by every analysis listed in the Analysis Setup Window.
The Output icon gives you the ability to decide which GI Notebook will be
used to receive the analysis results. You may also specify where within a
given GI Notebook the results should be placed.
Because an Analysis Setup Window can be named and added to the Analysis
menu, once a set of parameters has been optimized for your particular needs
and output styles have been defined, it can be accessed by anyone in the lab
– even new members of your group who may not be all that familiar with
what is important to your particular analyses.
GI Notebook
The GI Notebook is designed to serve three main functions:
• It can serve as a day-to-day electronic laboratory notebook.
Page 1-6
Getting Started with Gene Inspector®
• It is the place where output from analyses is placed.
• It can be used to design and produce illustrations for publication or presentation.
In addition to being a receptacle for analysis output, the GI Notebook is a
capable word processor having special functions enhancing its use as a laboratory notebook. The background text of the GI Notebook can be used to discuss experimental strategies and to take notes on the experimental results.
User tables allow you to set up repeatedly used information (e.g. lanes on a
gel, buffer recipes, assay setups, etc.) in a convenient and readily accessible
way.
Conditional text can be used in the GI Notebook. This is a special kind of
“style” that allows the text to either be shown or hidden. Conditional text can
be used to take notes that you might not want to show when you design a
poster, or it might contain information that is parenthetical to the main discussion.
The drawing and text tools in the GI Notebook can be used for assembling
posters or slides for presentations. The size of a GI Notebook sheet is not
restricted to printer page size and can be set to correspond to your particular
needs. If you need to have 16 x 20 inch panels for a poster, set the sheet
size to 16 x 20 and define the number of columns of text you want to have.
Navigation is made simple in the GI Notebook through the use of bookmarks
and aliases. Bookmarks identify specific locations in the GI Notebook and can
be attached to any GI Notebook object. Each bookmark appears by name in
the Notebook menu. An alias functions in a way similar to the way Finder
aliases work. It can serve as a hypertext linka to any object in the GI Notebook and can point to Appendix objects (see below) that are not directly visible in the notebook window or even to objects in a different notebook.
Any output object in the GI Notebook can be used as a starting point to
recalculate an analysis. All the original analysis parameters are stored with
a.
The alias can be use to go instantly to another location in the notebook. Hypertext links
like this allow you to navigate through a document in a non-linear way – you can find
information that is of interest to you at any time by following the link (alias).
Page 1-7
Getting Started with Gene Inspector®
each analysis output object. Since the output object can be copied and
pasted, several copies of the analysis can be generated, recalculated with
slightly different parameters, and then displayed adjacent to each other. If you
choose to hotlink an analysis, it can be updated for you automatically each
time the analyzed sequence changes.
In addition to the drawing tools provided, user definable tools, called tool
extensions, provide a rapid means to store often used objects. Tool extensions may include graphical objects, analyses, text, and tables. This provides
great flexibility in organizing and displaying information. It functions as a very
powerful “scrapbook”.
Appendices are separate windows that are associated with a GI Notebook. An
appendix window can be visible or hidden. Appendix markers (aliases to
appendices which are attached to a GI Notebook) can contain a great deal of
data (e.g. a table, a long list of matches from a database search, references,
etc.). Any GI Notebook object can be converted into an appendix and multiple
locations in the GI Notebook can point to the same appendix. This allows
large amounts of information to remain available for occasional viewing, but
does not interfere with displaying information and reading the GI Notebook.
One use might be to store buffer recipes as appendix objects and then refer
to the appendix whenever the buffer is discussed by using an alias to the
appendix containing the buffer.
Page 1-8
Tutorials
Chapter 2
Tutorials
This chapter contains a number of tutorials introducing you to Gene Inspector®. Although you should not feel obligated to going through all the tutorials,
you should do as many of the tutorials as you can because they are designed
to provide an overview of how the program works. Doing the tutorials now will
save you many hours in the future. The Gene Inspector has a number of
unique features you might not have seen in any other application – the tutorials provide a way for you to learn about these unique capabilities.
In many locations in this chapter and throughout the manual you will be
asked to select items in menus. To make your choices as clear as possible,
all menu selections are indicated as hierarchical choices using a “menu” font,
such as Edit > Select All. This particular case means to locate the Edit menu and
then choose Select All under the Edit menu.
About the Tutorials
There are three major parts of Gene Inspector: the GI Notebook, the
sequence editor, and the analysis setups. These three parts are dealt with
individually in the first three tutorials. If you do not have time to do any other
tutorials, you should at least complete the first three which illustrate these
components of Gene Inspector. Tutorial 4: “Hotlinking Analysis Results” is
also important in demonstrating how the analysis results in your notebook are
alive and connected to the original sequences used for the analysis. Other
tutorials help explain different capabilities of Gene Inspector and demonstrate
ways in which the program might be of special use to you.
Selection vs. Target
The difference between choosing an object as a selection or a target within
Page 2-1
Tutorials
the Gene Inspector is important. The terms are specific and each will allow
Selected Object
Targeted Object
Figure 2.1: Selection vs. Target
you to perform a different set of specific functions on an object. These terms
are used throughout the manual and are important for you to know. The two
choices are shown in Figure 2.1.
Clicking once on a GI Notebook object makes it the selection and causes the
appearance of eight “handles” (little black squares at the corners and midway
along each side) around the edges of the object (Figure 2.1, left). You can
resize the object using these handles in the same way you would within a
standard drawing program.
Double-clicking on a GI Notebook analysis object makes it the target and
causes the appearance of a gray border around the object (Figure 2.1, right).
Once an object is targeted, you can modify components within the object and
can use the features available in the Object menu which appears when an
object is targeted.
Sequences
You will be using a number of DNA and protein sequences in these tutorials.
They are all saved in a folder called “GI Seqs” which was placed in the “Gene
Inspector folder” folder during installation. Within the GI Seqs folder, there is a
peptide folder and a DNA folder. Each file may contain multiple sequences
(for example, see Figure 2.6, page 2-12).
Page 2-2
Tutorials
Tour of a Gene Inspector Notebook
TUTORIAL 1: TOUR OF A GENE INSPECTOR NOTEBOOK
One of the central components of the Gene Inspector is the GI Notebook.
The notebook is a file created by the Gene Inspector that serves as a place
for you to take notes about experiments, design posters or slides for presentations, and as a receptacle for output from sequence analyses performed by
Gene Inspector. This tutorial will take you through some of the features of a
GI notebook and together with Tutorial 2: “Editing Sequences”, page 2-9 and
Tutorial 3: “Using Analysis Setups”, page 2-14 will serve as an introduction to
the program.
1. Double-click on the Gene Inspector® to start the program. You will see a
new empty notebook window called Untitled. This empty notebook can be used
to hold any new analyses you do. We will not use it right now but will use a
previously created notebook.
2. Choose File > Open… which will allow you to open a Gene Inspector file.
The checkboxes and other details of the dialog box will be discussed in other
tutorials. For now, choose the notebook file in the Gene Inspector® folder
which is named “GI Notebook Tour” and press the Open button to open the
document. It might take a bit of time for the notebook to open as it sets up all
the bookmarks and other navigation tools used in this particular notebook.
You will see Figure 2.2.
3. This special notebook is designed to demonstrate the kinds of uses you
might have for the GI Notebook in your own research. The GI Notebook is
basically a word processor with many special features designed to facilitate its
use in research. Background text (starting with the word “OBJECTIVES” in this
case) can be entered and edited just as in a standard word processing program. Using the Format menu in combination with the items in the GI Notebook’s ruler allows you to do many of the standard manipulations you expect
in a word processor. The Notebook menu has many special features unique to
the Gene Inspector. Since this tutorial is meant to be an overview, it will illustrate some of these features but will not go into details of how to create them
– see elsewhere in the manual for that.
Page 2-3
Tutorials
Tour of a Gene Inspector Notebook
Figure 2.2: The “Tour” Notebook
4. The title with the colorful border across the top of the notebook is a text
object, into which the title text was typed. Text objects (sometimes called
sidebar text) are extra blocks of text you can create in addition to what is in
the background (body) text of your notebook. Text objects can be located any
place on a notebook sheet and can be any size, from tall and skinny to short
and wide, like the text object containing the title here. We have placed a red,
blue, and green frame around the text object to make it stand out.
5. The small elliptical object to the left of the word “OBJECTIVES” is a graphic
object that was created in another program and pasted into the notebook to
serve as a recognizable marker - in this case as a graphic that can easily
identify the location of a bookmark. Graphic objects like this one can be
stored within the notebook for easy access. Choose Notebook > Tool Extensions >
dot marker. The mouse cursor will change to an
(tool extension pointer).
Click the mouse button on the notebook sheet to the right of the background
text. A new “dot marker” appears. You can add tool extensions of your own
creation easily as a means of storing graphics (and other objects) you might
want to use repeatedly.
6. Bookmarks can be used to navigate to different locations in the notebook.
Choose Notebook > Bookmarks > Analyzing the Peptide. This bookmark will take you to
a location in the notebook which contains peptide analysis results. These
analyses were generated by the Gene Inspector and represent the results of
analyses of a peptide coded for by the DNA being cloned in the cloning projPage 2-4
Tutorials
Tour of a Gene Inspector Notebook
ect that is the subject of this notebook. Performing analyses is discussed in
Tutorial 3: “Using Analysis Setups”, page 2-14. For this tutorial we are focusing just on the GI Notebook.
7. Let’s return to the top of the notebook again by choosing Notebook > Bookmarks > Objectives . Since bookmarks can be given meaningful names and
attached to any object in the notebook, they can be used as a very convenient way to navigate through a great deal of information. You might even
choose to create a bookmark called “current” and place it where you are currently entering notes. This bookmark can then be moved at the end of each
day and still be accessible through the bookmark menu where it will transport
you to the last location you were working.
8. In addition to the standard styles you find in most word processors (like
Bold, Italic, etc.), the Gene Inspector has additional styles, including one
called Conditional Text (see the Format > Style menu). This text can be shown
or hidden. Choose Notebook > Display > Show Conditional Text. Previously hidden text
is now displayed. In this particular notebook, we set the conditional text to
have green, bold, and strikethru attributes. Conditional text can be hidden or
shown whenever you want to do so by choosing the appropriate menu items.
Leave the conditional text showing for the remainder of this tutorial.
9. The Gene Inspector also allows you to define your own styles and add
them to the Format menu. Style Sheets can be used to define the appearance
of text as well as the appearance of analysis objects in the GI Notebook.
Note that the word “Objectives” at the start of the background text has its own
unique style, which suggests that it is a section title. You can duplicate this
style for any other text in the notebook because a “Section Title” style has
previously been defined. Choose a different word in the background text and
then select Format > Style Sheets > Section Title to convert the selected text into the
new style. Once you have created a style sheet it can be used from within
any notebook you open – it becomes part of the application’s menus. Creating style sheets is described in Tutorial 10: “Creating and Using Style
Sheets”, page 2-38.
10. Use the vertical scrollbar on the right side of the notebook window to
scroll down to the next notebook sheet that says SEQUENCING SUBCLONED
SEGMENT OF PBG123. The descriptive text on the left side of the notebook
Page 2-5
Tutorials
Tour of a Gene Inspector Notebook
page discusses the current set of experiments, while the CodonPreference
data analysis on the right indicates a possible problem in the sequencing
project (see the January 28th notes). The ability to mix your notes with analysis results and other notebook objects provides a convenient way to keep a
running commentary on your experiments – just as in a paper lab notebook,
but with added flexibility and convenience.
11. Scroll down the page further and you will see a scanned image of a
restriction digest gel. Note also that lane 11 in the legend has conditional text
which is actually part of this text object. This is another use of a text object
(the notebook title was the first example). Also note that the figure legends
for the figures in this notebook are actually text objects. Text that is in a text
object will not flow with the background text when the background text is
edited.
12. Scroll down to Figure 3 (or use the Notebook > Bookmark menu to go to the
Figure 3 bookmark). Notice how specific parts of a figure can be indicated
and referred to from within the background text.
13. Scroll down to notebook sheet 4a (or use the “Subcloning the Coding
Sequence” bookmark) to see how restriction digests were used to identify an
appropriate region of the DNA for subcloning.
14. Looking further down on sheet 4 of the notebook will show you Figure
2.3. These are aliases. Just like the Finder’s aliases, they point to another
Figure 2.3: Notebook Aliases
location. In this case the aliases point to appendix objects, which can contain
large amounts of data that you might not want directly in your notebook, but
do not want to discard either. Double-click on the icon in the left part of the
a.
The sheet number is indicated in the bottom left corner of the notebook window.
Page 2-6
Tutorials
Tour of a Gene Inspector Notebook
alias which says “Features of pBG123-2”. It will open up a new window containing
the appendix to which the alias points. This appendix contains a “features
view” of the sequence being cloned. A features view is a kind of notebook
object the Gene Inspector uses to display formatted sequence information.
Scroll down the sequence to see how different features can be labelled and
highlighted in different ways. Close the appendix by clicking in the close box
at the top left corner of the appendix window.
15. Appendices, like bookmarks, are also available through a menu. Choose
Notebook > Appendices > Assaying CAT Activity . This appendix is really just a text
object (yes! another use for a text object) that has been moved to the
appendices for this notebook. The advantage of placing a protocol like this in
the appendices instead of just leaving it in the notebook is that it can now be
accessed from anywhere in the notebook by choosing it from the menu. You
might also choose to store buffer recipes in the same way. Putting commonly
used information in appendices makes the information available from anyplace
in the notebook. Look at some of the other appendices to get an idea of how
you might be able to use appendices. Close this appendix window when you
are done looking at it.
16. Choose Notebook > Bookmarks > Define Promoter Behavior. This section of the
notebook contains a table that was created using the notebook’s table tool to
create the table. Tables present a useful way to organize experimental information. In this case the table is displaying the data from a particular experiment.
17. You might create a table for repeated use (e.g. for identifying lanes in
gels) and add it as a tool extension, as explained elsewhere in the manual.
To see how this works, choose Notebook > Tool Extensions > gel table and click the
mouse in the notebook to place a new gel table. The table will be placed with
its top left corner at the location of the mouse click. Tool extensions provide
an easy way to keep frequently used objects, whether they be graphic
objects, tables, or even analyses.
18. Feel free to explore other aspects of this notebook to see how they might
be useful to you in your work. Notice how the Gene Inspector sequence analyses are integrated with the discussion and experimental results. This provides an easy way to keep track of all your work in one place, rather than
Page 2-7
Tutorials
Tour of a Gene Inspector Notebook
having to run multiple applications, each with its own purpose.
When you are finished exploring the notebook, close it by choosing File > Close
or by clicking the close box in the top left corner of the window. When asked
if you want to save changes, just say Don’t Save, so that others can go
through this tutorial in the future.
Page 2-8
Tutorials
Editing Sequences
TUTORIAL 2: EDITING SEQUENCES
This tutorial focuses on the sequence editor. Together with Tutorial 1: “Tour of
a Gene Inspector Notebook” and Tutorial 3: “Using Analysis Setups”, this
tutorial provides an overview of the three main parts of the Gene Inspector.
1. In this tutorial, you will learn how to open and manipulate sequences
stored within Gene Inspector sequence files. Choose File > Open and select and
open the nucleic acid sequence called pBR322 (it is in the DNA ƒ in the GI
Seqs ƒ). You will see the window shown in Figure 2.4. The name column
Figure 2.4: Sequence Editor with a Single Sequence
contains the name of the sequence being displayed in the line to the right of
the name itself. For single sequence files, like the pBR322 sequence shown
in Figure 2.4, the sequence name is only shown on the first line of the
sequenceb. The position column contains the position of the first nucleotide
(or amino acid) in each line. The overview pane at the top of the window
shows a graphical representation of the sequence. Within the overview pane,
the dotted rectangle, called the segment indicator, indicates the segment of
the sequence currently visible in the sequence editor window. The Sequence >
Display menu can be used to show or hide these different parts of the
sequence window. Feel free to try different items in this menu at this time.
b.
Figure 2.6, page 2-12 shows a sequence editor document with multiple sequences – this
will be discussed later.
Page 2-9
Tutorials
Editing Sequences
2. Scroll down the sequence by using the scroll bar on the right of the window. Notice how the segment indicator in the overview pane moves along as
you scroll and indicates exactly where you are in the sequence.
3. You can also navigate to different positions within the sequence by clicking with the mouse in the overview pane. The sequence editor will automatically scroll to the location in the sequence that was clicked in the overview
and will also select the clicked sequence. You can even drag the segment
indicator to navigate within the sequence part of the window. Try clicking in
the overview pane of the window to navigate. Try dragging the mouse in the
overview pane.
4. Select 20-30 nucleotides by clicking and dragging the mouse over the
nucleotides, just as you would in a standard text processor. Choose Format >
Color > Red and notice the change. Now choose Format > Style > Bold. Notice that
the sequences stay aligned even after making them bold – if at all possible,
the Gene Inspector will keep your sequences aligned automatically.
5. Select the entire sequence by choosing “pBR322” in the name column
(on the left) and change the font to Times using Format > Font > Timesc. Notice
how all the characters still line up appropriately even though you are using a
proportional font (Times) instead of a monospaced font (Courier). You can
deselect the sequence by clicking anywhere in the sequence itself, just like in
a word processor.
6. Select Sequence > Show Sequence Monitor, which will bring up a palette like the
one shown in Figure 2.5, page 2-11. The Sequence Monitord shows relevant
information about the sequence you are working with in the sequence window, it allows you to set some speech properties, and it provides two ways
for confirming a sequence. The first way is simply to have the program speak
the sequence to you (it will start reading at the beginning of the current
selection in the sequence editor). The second way is to confirm by re-entry.
c.
d.
Depending on your current configuration, you may see an “extra cautions” dialog. See
the text describing Figure 3.5, page 3-6 for more information.
Being a “palette”, the Sequence Monitor always remains in front of other windows. It will
reflect information about the active sequence window (the one containing the selection or
insertion point). If a different sequence window is brought to the front, the information in
the Sequence Monitor will change.
Page 2-10
Tutorials
Editing Sequences
Figure 2.5: Sequence Monitor
With this method, as you type in the sequence a second time, the program
will compare it with the characters you entered the first time. Any differences
will be brought to your attention with a beep. The Map Keys… button allows
you to redefine the keyboard for entering sequences more conveniently. The
default values for the keyboard map are shown in Figure 2.5. The top of the
figure shows the options for Windows XP, while the bottom figure shows
options for Macintosh OS X. For more details see Chapter 3.
7. Select 5-10 lines of the pBR322 DNA sequence and then choose
Specify a translation table (the E. coli
table might be appropriate for pBR322) and click OK. A new sequence window will be created containing a translation of the segment of DNA selected
in the pBR322 window. Note that this is not the same as looking for an open
reading framee but simply represents a translation of the selected nucleic acid
sequence. Note that the DNA is translated in groups of three starting with the
first nucleotide in the selected segment; any stop codon is indicated as “•”.
Click on the name of the new peptide sequence in the new window and
choose Sequence > Sequence Info…. This shows information about the generated
sequence and provides a text field for storing comments. Because the proSequence > Manipulate Sequence > Translate.
e.
To identify the locations of open reading frames, see “Open Reading Frames”, page 439.
Page 2-11
Tutorials
Editing Sequences
gram generated the sequence for you, it also placed some appropriate comments in the sequence info box for you. Close the dialog box.
8. Close the Sequence Monitor and then close the pBR322 sequence file
and the generated “untitled” peptide window. Choose File > Open… and open the
peptide file called rhodopsins – it is in the Peptide Sequences folder inside
Figure 2.6: Sequence Editor with Multiple Sequence File
the GI Seqs folder. This file contains multiple sequences and is shown in Figure 2.6f. Note the overview pane of the sequence window. It now displays
multiple sequences and indicates their relative lengths. The segment indicator
box indicates which segment of each peptide is being displayed in the window. In this particular case, the first three sequences have four lines displayed and the last two sequences (Octopus and Xenopus rhodopsins) have
only three lines displayed in the sequence pane. Scroll the window through
the sequence file using the scrollbar on the right side of the window and note
how the segment indicator indicates the visible sequences.
9. Click in the overview. Note how the position of the segment indicator
changes and how the sequence that is the target of the click in the overview
pane is now selected in the sequence editor part of the window. This navigational tool becomes more useful as you put more and longer sequences into
the a single sequence file.
10. You can try other formatting options in this window using available items
in the Format menu (for example, you can change the color or style). To
f.
Your display might look slightly different from this figure.
Page 2-12
Tutorials
Editing Sequences
select an entire sequence, click on the name of the sequence in the name
column. Note that in the multiple sequence file, each sequence line has a
name next to it so that you are never confused about what you are viewing.
This concludes this tutorial. You may quit or continue on to the next tutorial.
If you choose to continue, close all open windows now.
Page 2-13
Tutorials
Using Analysis Setups
TUTORIAL 3: USING ANALYSIS SETUPS
This tutorial focuses on running analyses. Together with Tutorial 1: “Tour of a
Gene Inspector Notebook” and Tutorial 2: “Editing Sequences” this tutorial
provides an overview of the three main parts of the Gene Inspector.
1. Analysis Setups are a key concept in the Gene Inspector. They are how
you initiate an analysis and they provide a way for you to create and later
return to a specific analysis or set of analyses. Choose Analysis > New Analysis….
This will bring up the Analysis Chooser shown in Figure 2.7. At this point you
Figure 2.7: The Analysis Chooser
could choose to do either a protein or nucleic acid analysis. For this tutorial
press the radio button at the top of the dialog to specify that you will be doing
a Protein Analysis. The text area on the right of this window always provides information about the analysis that is selected in the list on the left side
of the window, in this case Transmembrane Helices. Also, note that the list
can be displayed as a text list (as in Figure 4.1, page 4-2) or as an icon list
shown here by using the draw icons check box.
2. Select Transmembrane Helices from the list on the left and press the OK
button. This will create a new Analysis Setup. Analysis Setups contain a
number of different panels, each represented by an icon on the left of the
window. The Analysis Setup panel for Transmembrane Helices is shown in
Figure 2.8, page 2-15.
Page 2-14
Tutorials
Using Analysis Setups
Figure 2.8: The Analysis Setup Panel
3. Notice the popup menus on the right of the Analysis Setup Panel. The
Table popup menu offers choices for the tables of values to be used in the
analysis calculations. Choose the Argos, et al. table. The Style popup menu
allows you to set a style for the output. We will talk about style sheets later
(Tutorial 10: “Creating and Using Style Sheets”, page 2-38); for now leave it
at the default value.
4. Click on Input Sequences on the left of the Analysis Setup Window, and
press the Add… button (Figure 2.9, page 2-16). This will bring up the
sequence chooser window shown in Figure 2.10, page 2-16. Find the “Peptide Sequences” folder which is inside the GI Seqs folder and click on the “rhodopsins” file. This file contains a number of rhodopsin sequences, which will
appear in the bottom left list as soon as you click on the file in the top left
list. Note that the list on the top left is a list of files, similar to what you see
in other applications when you choose to open a file. However, because the
Gene Inspector allows you to store multiple sequences in a single file, you
need to specify not only the name of the file, but the name of the
sequence(s) within the file with which you wish to work. This is the reason
for having the more detailed dialog box shown here. If you press the Add
‘rhodopsins’ >> button (or double-click the file name in the top left list), the
entire file will be added to the Chosen files and sequences list in the bottom
Page 2-15
Tutorials
Using Analysis Setups
Figure 2.9: The Input Sequence Panel
Figure 2.10: The Sequence Chooser
right. For this tutorial, just double-click on the octopus rhodopsin sequence in
Page 2-16
Tutorials
Using Analysis Setups
the bottom left. Octopus rhodopsin will appear in the bottom right list of Chosen files and sequences. One or more sequences can be chosen from one or
more sequence files. The analysis will be performed on every sequence in
this list on the right. Also choose Lamprey rhodopsin and add it to the Chosen
files and sequences list on the right. Press the Done button to indicate that
you have no more sequences to be analyzed.
5. Finally, you need to specify a location for the output from the analysis.
Figure 2.11: Output Location Panel
This is done using the Output Location panel which can be selected from the
icon list on the left and is shown in Figure 2.11. Using the popup menu in this
panel, you can specify that the output generated will be placed in a new
notebook, or added to any currently open notebook (all of which are listed in
the popup menu).
6. Before you run the analyses, note that at the top of the Analysis Setup
you have selected two sequences (inputs) and one analysis – therefore, you
will have two output objects. The information at the top of the window always
lets you know how many output objects you will be generating. The High
Priority option is discussed elsewhere (see “Analyses That Take a Long
Time”, page 7-3 and the text around Figure 4.3, page 4-4) – leave it
unchecked for now.
Page 2-17
Tutorials
Using Analysis Setups
7. To start the analysis running and close the Analysis Setup Window,
choose the Run button (the Close button would just close the panel without
starting the analysis).
8. Once the analyses have been launched, they will appear in the Analysis
Monitor. You can see the analysis monitor by choosing Analysis > Show Analysis
Monitor. The Analysis Monitor shows the status of each analysis being run and
will also show the order in which analyses are to be run. The Analysis Monitor will indicate the progress of each analysis as it is run. Most analyses will
run so quickly that unless you already have the Analysis Monitor open when
the analysis starts, you will not be able to see the analysis listed in the Analysis Monitor because it will be done before the window opens.
9. Each completed analysis becomes an object in the GI Notebook. Click
once on an output object to make it the selection and note the appearance of
8 black square dots (called “handles”) along the edges of the object. The
selected object can be moved around on the page by dragging with the
mouse. The handles can be used to resize the object by clicking and dragging one of the handles with the mouse. This is similar to the way objects
behave in many drawing programs.
10. Save the notebook in a location on your hard disk that you will remember
by choosing File > Save As… and give it a name you will remember. You will
need the notebook to continue with the tutorial “Aligning Analysis Objects”,
page 2-31.
This concludes this tutorial. You may quit or continue on to the next tutorial.
Page 2-18
Tutorials
Hotlinking Analysis Results
TUTORIAL 4: HOTLINKING ANALYSIS RESULTS
It is often desirable to have the results of an analysis directly connected to
the sequence being analyzed in such a way that if the sequence is changed,
the output object is recalculated automatically without you having to remember to do it manually. The sequence might represent one that you are refining
in the lab, a multiple aligned consensus sequence, or a contig. The Gene
Inspector provides this ability through hotlinks as described in this tutorial.
1.
Open the DNA sequence file called rhodopsins.
2. Choose File > Save As… and save this sequence document as rhodopsins2 in
a location on your hard disk that you will remember. You will be making some
changes in the sequences in this document and do not want to accidentally
change the original sequences.
3. Click on the sequence name lamprey rhodopsin in this sequence window
to select that sequence.
Figure 2.12: Simple Base Composition Setup
4. Hold down the shift key and then click on the xenopus rhodopsin
Page 2-19
Tutorials
Hotlinking Analysis Results
sequence name. This is a standard method for extending a selection; in this
case we are extending our selection from just being lamprey rhodopsin to
being lamprey, octopus, and xenopus rhodopsin.
5. Leave these three sequences selected in the sequence document and
choose Analysis > New Analysis… to start a new analysis. Choose to perform a
nucleic acid analysis and then select Base Composition. If you are not sure
how to do this, refer to Tutorial 3: “Using Analysis Setups”, page 2-14. For
our purposes in this tutorial, we will do only a simple mononucleotide composition as a graph, as shown in Figure 2.12, page 2-19.
6. Because the sequences were selected in the sequence editor document,
they are already entered as sequences to be analyzed, as shown in Figure
Figure 2.13: Sequences Are Already Chosen
2.13. If you had selected a range of nucleotides in a sequence, that range
would be indicated and the Segment button would be “on”.
7. Run the analyses by pressing the Run button.
8. Arrange and resize the three analysis objects to all fit on the screen for
easy viewing and then select them all by selecting one and choosing Edit >
Page 2-20
Tutorials
Hotlinking Analysis Results
Select All.
9. With the three analysis objects selected, choose Notebook > Links > Automatic.
You will see the appearance of a small green circular “adorner” icon in the
top right corner of each output object indicating that it is now hotlinked (see
Figure 2.14, page 2-21). They should all be green, indicating that no
sequences have been changed since the analysis was initially run.
Figure 2.14: Hotlinked – No Updating Needed
10. Bring the rhodopsins2 sequence window to the front again (you can use
the Windows menu to do this). Click in the Xenopus sequence and type in a
few characters. This changes the sequence and will notify the corresponding
output object in the GI notebook that it needs to be updated.
11. Bring the notebook window to the front and notice the change in the
hotlink adorner for the analysis that depends on the Xenopus rhodopsin
sequence. The adorner now is red and yellow containing an exclamation point
as shown in Figure 2.15. Notice that only the analysis object which is dependent on the altered sequence needs to be updated. The other two analyses
remain OK.
12. To update the analysis, choose Notebook > Links > Perform Auto Recalc Now….
You should then see the dialog shown in Figure 2.16. Click the Recalculate Now.
13. Save the notebook and close it. This will save all of the analyses in their
current state, including the Xenopus base composition based on the
sequence in the currently open rhodopsins2 sequence file.
Page 2-21
Tutorials
Hotlinking Analysis Results
Figure 2.15: Hotlinked Object Needs Updating
Figure 2.16: An Auto Recalculate Dialog
14. Close the rhodopsins2 sequence document but do not save the changes.
This will save the sequences in the state they were in before any changes
were made during this session.
15. Open the notebook you just saved. You should see a dialog like the one
shown in Figure 2.16. This happens because the analysis object in question
was created using the changed Xenopus sequence, but the rhodopsins2
sequence file was saved without the changes made while the document was
open. Thus, the version of the sequence used in the analysis is different from
the version of the sequence saved in the file. This means that an update is
needed.
Hotlinks can be very useful. For example, you might create a notebook containing
Page 2-22
Tutorials
Hotlinking Analysis Results
many analyses all hotlinked to a specific sequence. When you want to perform this
set of analyses on a new sequence, just paste in the new sequence in place of the
original sequence and then perform the auto recalc. For more see “Links”, page 634.
This concludes this tutorial. If you choose to continue to the next tutorial,
close all open windows now.
Page 2-23
Tutorials
Multiple Sequence Alignments
TUTORIAL 5: MULTIPLE SEQUENCE ALIGNMENTS
In addition to storing and displaying sequences, the sequence editor is also a
convenient place from which to launch multiple sequence alignments and to
fine tune the alignments once they are generated. Multiple sequence alignments can also be created as a new analysis (see “Multiple Sequence Alignments”, page 3-10). In this tutorial, we focus on performing multiple sequence
Figure 2.17: Align Multiple Sequences from Sequence Editor
alignments directly within the sequence editor document.
1.
Open the peptide sequence file called “rhodopsins”.
2. Choose Sequence > Alignment > Align All Sequences…g. This will bring up Figure
2.17. The parameters displayed in this dialog are described in more detail
elsewhere (“Multiple Sequence Alignments”, page 3-10) and represent values
needed by the algorithm to perform the alignment. For now choose the
BLOSUM62 table and leave all the parameters at their default values. The
analysis table is chosen using a popup menu. Press and hold the mouse button down on the word None next to the word Table: at the top left of the analysis panel. This will cause the appearance of a popup menu. Choose Standard
> BLOSUM62.
3. Press the Align button to start the process of aligning all the sequences
g.
You can align a subset of sequences in a given file or sequences from multiple files by
performing a multiple sequence analysis (“Multiple Sequence Alignments”, page 3-10).
Page 2-24
Tutorials
Multiple Sequence Alignments
in the document. Progress is indicated in the upper left corner of the
sequence window, just above the column of sequence names.
4. After the alignment is complete, you will see the sequences aligned in the
sequence document window. Our goal will be to use the Gene Inspector features to change the view to look like that shown in Figure 2.18.
5. Choose Sequence > Display > Hide Overview. This will hide the overview “pane”
at the top of the sequence window which is no longer helpful because all
sequences being displayed are now the same length.
Figure 2.18: Aligned Sequences
6. Choose Sequence > Consensus > Show Consensus Row. This will add a new row
above the sequences showing the consensus sequence – the most common
character in that particular position of the alignment.
7. Choose Sequence > Consensus > Show Scoring Row. This will add a row containing a histogram indicating how good the match is at each position.
8. Finally, choose Sequence > Consensus > Show Shading. This will add shading to
the document which should now look similar to Figure 2.18. The shading indicates which residues match the consensus sequence residue. The more residues that match the consensus residue, the more intense the shading will be.
9. Click on the word “SCORE” in the name column to select the entire scoring row. Try choosing different colors and patterns using the Format menu.
Notice how the shading changes to reflect your choices.
10. You can also choose to place custom adornments on the aligned
sequences. Choose Sequence > Consensus > Custom Score Adornments... and try some
of the options for depicting the aligned sequences in the exact arrangement
you want. For more details on custom score adornments, see “Sequence
Page 2-25
Tutorials
Multiple Sequence Alignments
Adornments”, page 3-13
11. Choose Sequence > Consensus > Automatic Updating. This instructs Gene
Inspector to automatically update the score (top left corner of the window)
each time you edit one or more of the sequences. Note that this does not
automatically realign the sequences, it just updates the score. Automatic
updating places some demands on the computer, so it might slow down your
typing if you are using an older (slower) computer.
12. Try editing the sequences to see if you can increase the score. The
Clustal algorithm is quite good and it will be difficult to better the alignment
generated by the algorithm.
This concludes this tutorial. You may quit or continue on to the next tutorial. If
you choose to continue, close all open windows now.
Page 2-26
Tutorials
Running Summary Analyses
TUTORIAL 6: RUNNING SUMMARY ANALYSES
Gene Inspector allows you to run Summary Analyses on multiple sequences
at once and it will present the results in a single output object. From within
the resulting output object it is possible to see explore details of any of the
individual sequence analyses it contains. Summary Analyses are described in
this tutorial. Summary Analyses are available only for appropriate analyses.
1. Choose Analyses > New Analysis and then choose to do a Protein Analysis;
finally select the “Find Sequence” analysis and press OK.
2. You will see a dialog like that shown in Figure 2.19. Notice that there is
Figure 2.19: Find Sequence Dialog
a “Show Summary Results” checkbox circled in the figure. You should click in
this box to turn it on. Type aaaa into the Sequence field as the sequence to
search for and then click on the <empty segment 1> text in the list box above
to enter that sequence. For the number of allowable mismatches, enter a 1.
There is no need to enter anything in the other fields. For more information
about the Find Sequence analysis see “Find Sequence”, page 4-34.
Page 2-27
Tutorials
Running Summary Analyses
3. Now click on the Input Sequences icon to choose the sequences you will
Figure 2.20: Input Sequence Dialog
be using in this analysis. For this analysis you will examine all of the acetylcholine receptors. You should see something resembling Figure 2.20. Click
the Add... button to bring up the sequence chooser dialog.
4. After pressing the add button you will see the dialog box shown in Figure
2.21, page 2-29. This allows you to choose which sequences will be analyzed. Find the Peptide Sequences folder in your GI sequences folder and
click once on the file acetylcholine recpts. This will place the names of all the
sequences in this file into the list in the lower left of the dialog box. Now
press the Add ‘acetylcholine recpts’ >> button to add this file (containing
the 9 sequences) to the Chosen files and sequences list in the lower right of
this window. After adding these sequences, press the Done button to return
to the analysis setup panel.
5. Press Run to run the analyses.
6. You will see the summary result object appear in the notebook as shown
in Figure 2.22, page 2-29. This object lists the 9 sequences examined, the
number of matches found within each of them, and indicates on a linear map
where the matches exist. This object is a summary of the search results for
the query sequence. It provides you with a graphic overview of the matches
found and serves as a starting point for further analysis. Without using the
Summary Analysis option in the setup panel, the results would have been displayed as nine separate Find Sequence analyses.
Page 2-28
Tutorials
Running Summary Analyses
Figure 2.21: Choosing Sequences for Summary Analysis
Figure 2.22: Summary Result Output Object
7. Double-click on the output object to target it and then click on the Chick
musc Ach Recpt item. Now choose the Object > Search Selected Sequences... menu
item to launch the detailed (single sequence) analysis on the chosen
sequence. You will see the analysis setup panel open with all appropriate
parameters already filled in for you. Press Run to conduct the analysis. The
results will be seen as a new object in the notebook as shown in Figure
2.23.
This concludes this tutorial. You may quit or continue on to the next tutorial.
If you choose to continue, close all open windows now.
Page 2-29
Tutorials
Running Summary Analyses
Figure 2.23: Find Sequence analysis
Page 2-30
Tutorials
Aligning Analysis Objects
TUTORIAL 7: ALIGNING ANALYSIS OBJECTS
1. This tutorial will describe how to align and automatically resize objects.
To do this you must first generate some output objects to be aligned. For this
tutorial, choose to do the “Accessible Surface Area” analysis on lamprey,
octopus, and xenopus rhodopsins (they are in the peptide sequences folder).
Accept all the default parameters and choose Run as described earlier in this
chapter.
2. Click on the top output object and make it wide and short as shown in
Figure 2.24: Output Objects Before Alignment
the top analysis in Figure 2.24.
3. Select all of the analysis objects by clicking on one of them once and
then choosing Edit > Select All. This will select all GI Notebook objects (two in
Page 2-31
Tutorials
Aligning Analysis Objects
Figure 2.25: Notebook Object Alignment
this case). Choose Notebook > Arrangement > Align Objects…. You will see the alignment dialog shown in Figure 2.25, page 2-32. The ability to adjust sizes and
align objects as shown in the figure is very useful for making all analyses
have the same width, for example, so that the X-axes align and graph results
can be compared. Set the items in the window to match what is shown in
Figure 2.25. This will cause the objects to line up along their left edges and
to be as wide as the widest object and as short as the shortest object. Press
the OK button.
4. After alignment, the analysis objects will look like Figure 2.26, page 233. Note that the objects are all aligned on the left as defined in the object
alignment dialog. Since we did not specify any vertical alignment, the tops of
each object remain the same as they were before the alignment. This results
in vertical space between the object.
5. This same alignment dialog can be used to superimpose graphs to see
how different plots compare. One use might to make one protein plot red and
another blue - then superimpose them for a direct comparison. To superimpose the plots, one needs to align objects at their tops and at their left edges
while defining the same widths and heights for all objects.
6. Save the notebook using File ?Save. You will need the notebook for a later
tutorial (see “Taking Notes Using Background Text”, page 2-36).
This concludes this tutorial. If you choose to continue to the next tutorial,
close all open windows now.
Page 2-32
Tutorials
Aligning Analysis Objects
Figure 2.26: Output Objects After Alignment
Page 2-33
Tutorials
Customizing Gene Inspector Menus
TUTORIAL 8: CUSTOMIZING GENE INSPECTOR
MENUS
1.
Choose Format > Color > Add Color To Menu…. This will bring up the dialog
Figure 2.27: Add Color Dialog
shown in Figure 2.27. This dialog allows you to type in a name for a color
you wish to create.
2. You may choose to name colors by using the names of the colors –
orange, bright green, purple, gold, etc. Another possibility is to name the colors using a descriptive name, such as “Lisa’s Text”, “Important”, or “Weak
Data”. In this way, when you see a specific color used in the GI Notebook, it
will tell you something about that particular text. After typing in a name, press
the OK button and specify the color using the standard “color picker”.
3. Press OK to add this color to the Format > Color menu. You can look to
see if it has been successfully added once you have pressed OK by selecting
Format > Color >.
4. Note that in Figure 2.27, only the Choose color from palette button
was enabled. This is because nothing was selected in the GI Notebook. If you
see a color in the notebook that you want to use again, but this color is not
one of the colors in the menu, select the item which has the color you want
to add, and then choose Format > Color > Add Color To Menu….
5. As you will see in subsequent tutorials, a number of other menu items
can be customized (Style Sheets, Frames, Analyses, etc.). In this tutorial we
will do one more to give you a familiarity with how the customizable menus
work. Choose Format > Numeric Format > Add Format To Menu…. You will see a dialog
like the one in Figure 2.27. It should look familiar. Type in “two decimal
Page 2-34
Tutorials
Customizing Gene Inspector Menus
places” as the name, and press OK.
6. You will now see Figure 2.28, page 2-35. This dialog allows you to
Figure 2.28: Numeric Format Dialog
define the format to be used. In this case, we want to use two decimal
places. Choose the Fixed decimal notation button and type a 2 into the
text field labelled Minimum decimal places. Try other items in this dialog and
see how they change the sample text (circled in the figure).
7. Once you have configured the formatting the way you want, press OK to
add it to the menu.
8. To remove a custom numeric format from the menu, choose Format >
Numeric Format > Remove Format From Menu…. You will see the dialog shown in Figure
2.29. Choose the format(s) you wish to remove and press OK. Other custom
menu items are removed in a similar way.
Figure 2.29 Removing a Custom Menu Item
This concludes this tutorial. You may quit or continue on to the next tutorial.
If you choose to continue, close all open windows now.
Page 2-35
Tutorials
Taking Notes Using Background Text
TUTORIAL 9: TAKING NOTES USING BACKGROUND
TEXT
1. Open the notebook you saved in Tutorial 7: “Aligning Analysis Objects”,
page 2-31. Click in the background white area outside the output objects and
begin typing. You should see text appear in the background in the first available free space. The background text flows around objects and can be used
to describe and track experiments within the GI Notebook. It can also be used
to discuss analysis results. Type in some descriptive text in this notebook.
You can generate several pages of text quickly by typing in a paragraph and
then copying and pasting this paragraph back into the notebook.
2. Choose Notebook > Display > Set Display Preferences…. You will see Figure 2.30.
Figure 2.30: Set Display Preferences
This allows you to specify the way different boundaries are indicated on the
GI Notebook page. Set colors for the text border and for the printable area
border by pressing the Set button next to the item to be set. These borders
will let you see how items are placed on the notebook sheet relative to the
borders.
3. Select an output object and choose Notebook > Get Info…. This provides you
with information about the particular object. You can enter comments here
that you might like to refer back to in the future. Close the Get Info window.
4. While one of the objects is still selected, look at the Notebook > Text Flow
submenu. By choosing one of the items from this submenu, it is possible to
specify how the background text will flow around or through the selected
object(s). Try a few of the options and move the object around on the notebook page to see how the text flows around (or through) the object.
Page 2-36
Tutorials
Taking Notes Using Background Text
5. Save the notebook by choosing File > Save. You will need the notebook to
continue with Tutorial 10: “Creating and Using Style Sheets”, page 2-38.
This concludes this tutorial. You may quit or continue on to the next tutorial.
Page 2-37
Tutorials
Creating and Using Style Sheets
TUTORIAL 10: CREATING AND USING STYLE
SHEETS
1. If it is not already open, choose the notebook created in Tutorial 9: “Taking Notes Using Background Text”, page 2-36.
2. Select a word of background text in the notebook and change it to 14
point Helvetica, bold, condensed and magenta (use choices in the Format
menu to make these changes). Add this style to the Style Sheet menu for future
use by selecting the text whose style you just changed and then choosing Format > Style Sheets > Add Style Sheet…. In the dialog box that appears give the style
sheet the name “Magenta Text”. Press the OK button to add the style sheet
to the Format > Style Sheets menu.
3. Click once on the first analysis output object in the notebook to select it.
Now choose Format > Style Sheets > Magenta Text. Note that all the text in the output
object changes to match the style you just defined. The style sheet defined
the style of text and when applied to the output object, it caused all of the
text in the object to take the new style.
4. Double-click on the second output object to make it the target. Let’s
change the styles of some of the other parts of the graph. Click once on the
part of the targeted object you want to alter (e.g. the title or an axis label)
and then use the Format menu to try font, style and color combinations. You
can select multiple items in the targeted object by shift-clicking (click on one
object and then hold down the shift key while clicking on additional objects –
all objects clicked will be selected). Once you have the graph looking the way
you like, choose Format > Style Sheets > Add Style Sheet… and, if presented with a
choiceh, use the entire object button to define a style sheet named “Graph
Format”. This style sheet represents all the formatting information of all the
items in the output object.
5. Select a different graph object (click-once) and then apply the new style
sheet you just created by choosing it from the Style Sheets submenu, as before.
h.
If any part of the targeted object is currently selected you will be given a choice of adding styles corresponding to the selection or to the entire object. If nothing is selected in
the targeted object, you can only create a style sheet corresponding to the entire object.
Page 2-38
Tutorials
Creating and Using Style Sheets
Notice that the styles of all the parts in the selected object change because
they were all defined in the style sheet.
Defined style sheets are also available when you start an analyses as part of
the Styles popup menu.
This concludes this tutorial. You may quit or continue on to the next tutorial.
If you choose to continue, close all open windows now.
Page 2-39
Tutorials
Adding More Analyses to a Setup
TUTORIAL 11: ADDING MORE ANALYSES TO A
SETUP
1.
Choose Analysis > New Analysis… and create a new protein analysis. Select
Helical Wheel and choose OK . Each new analysis you add will have
parameters associated with it. With Helical Wheel icon selected in the left
list, choose the Kyte & Doolittle table from the Table popup menu on the right.
2. Click on Input Sequences icon on the left, open the peptide rhodopsins file and select the sequence Lamprey rhodopsin. Click on the Lamprey
rhodopsin sequence as shown in Figure 2.31. Press the Segment button on
the bottom right of this panel and specify that you want to analyze residues
75-100 as shown in the figure. The segment selector always refers to the
sequence that is highlighted in the list in the top part of the panel. Run the
Analysis Setup.
Figure 2.31: Selecting a Sequence Segment for Analysis
3. Double-click on the resulting Helical Wheel output object in the notebook
to make it the target and try some of the options under the Object menu. This
analysis shows how the amino acid side chains would be distributed if you
were to look down the central axis of an alpha helical segment of a peptide.
Functions that are specific to each analysis output object will always be found
under the Object menu.
Page 2-40
Tutorials
Adding More Analyses to a Setup
4. Choose Object > Recalculate… and rerun the analysis using a different table
(Sweet and Eisenberg). Note that you can also create your own tables for
use in any appropriate analysis (Use the Analysis > Tables… option to create your
own tables). Creating tables is discussed in the Tutorial 20: “Creating Your
Own Analysis Tables”, page 2-63.
5. Double-click on the Helical Wheel output object and choose Object > Recalculate again. Remove the Helical Wheel analysis from the Analysis Setup by
clicking on the Helical Wheel icon in the list on the left and then choosing
Analysis > Remove Analysis . [In the Windows version of Gene Inspector, the
Remove Analysis selection is accessible through the right-mouse button
menu.]
6. Choose Analysis > Add Another Analysis…. [In the Windows version of Gene
Inspector, the Add Another Analysis selection is accessible through the rightmouse button menu.] Add the Amino Acid Composition analysis and then add
the analysis called pH/pI. Notice that the top of the pane now shows two
analyses, as shown in Figure 2.32.
Figure 2.32. Adding Analyses
7. You can add and remove analyses from any Analysis Setup using the
approach described in this tutorial. It does not matter how the Analysis Setup
Page 2-41
Tutorials
Adding More Analyses to a Setup
was opened – as a new analysis, from a recalculation, or from the Setup
Menu option.
8. Press the Run button to start the analyses.
This concludes this tutorial. You may quit or continue on to the next tutorial. If
you choose to continue, close all open windows now.
Page 2-42
Tutorials
Appendices – Hiding Large Amounts of Data
TUTORIAL 12: APPENDICES – HIDING LARGE
AMOUNTS OF DATA
Sometimes analyses produce a large amount of data that you might not want
to keep displayed in the GI Notebook at all times. Yet, it would be nice to be
able to keep the data and refer to it as needed. You can do this by creating
an Appendix. Each appendix object resides in its own window which is hidden
within the notebook, but can be made visible when you want to see it.
1. Choose Analysis > New Analysis… and choose to do a protein analysis that
is called Align 2 Sequences (global). If you are not sure how to do this, see
Tutorial 3: “Using Analysis Setups”, page 2-14.
2. In the setup panel for this analysis press the button to use scoring
table and select the PAM120 table in the Table popup menu. Leave the rest
of the settings in this panel at their default values.
3. For input sequences, choose the peptide file Drosophila Hsps and select
both Dros hsp26 and Dros hsp27 for the alignment. Please refer to previous
tutorials if you are not sure how to do this.
4. Run the analysis by pressing the Run button.
5. The output object that gets placed into your notebook is rather large to
begin with and some of the alignment is invisible because it is below the bottom edge of the object. Double-click on the output object to select it. Hold
down the option key (Mac) or alt key (Windows) and drag the mouse vertically over the alignment object. The cursor changes to a hand and allows you
to move the contents of the object around within the object’s borders.
Option/alt-dragging will work in any output object that has more data than is
visible within the object boundary.
6. One alternative to option/alt-dragging is to put the object into an appendix windowi. Select the alignment object and then choose Notebook > Appendices
> Move Object to Appendices. The dialog shown in Figure 2.33, page 2-44 will
appear. The action you are taking will create a new appendix window to coni.
Another way to do this is to open the object in its own window (see “Open for Editing”,
page 5-14).
Page 2-43
Tutorials
Appendices – Hiding Large Amounts of Data
Figure 2.33: Creating an Appendix
tain the analysis object and also will create a new alias (Mac) or shortcut
(Windows) in the GI Notebook to the appendix object. The alias will be
placed in the GI Notebook instead of the original object and will “point” to the
original object just like an alias in the Finder. Fill in the text in the dialog box
to suit your needs and then press OK. You will see an alias that looks like
type of object pointed to by the alias
text you entered to describe the alias
Figure 2.34.
Figure 2.34: A Notebook Alias Object
7. The resulting GI Notebook alias can be framed or styled just like any
other notebook object. To edit the alias text, double-click on the text in the
alias and then edit the text.
8. To view the contents of the appendix, either double-click on the appendix
icon, or choose the name of the appendix from the Notebook > Appendices submenu. Any appendix you create will be in this menu. By placing information
into an appendix, it can be viewed from any place in the notebook. This is a
convenient way to store often used information like buffers.
9. To return an appendix to the GI Notebook and remove it from the
“appendix” area, choose Notebook > Appendices > Return Appendix to Notebook….
Page 2-44
Tutorials
Appendices – Hiding Large Amounts of Data
10. You can make an alias to any notebook object (not just an appendix
object), including graphics that you import from other programs. This provides
a convenient way to refer to the same analysis or object from multiple locations in the notebook. You might also put buffers at specific locations and
have aliases to them from anywhere in the notebook. Putting buffers into an
appendix is a convenient way to do this.
This concludes this tutorial. You may quit or continue on to the next tutorial.
If you choose to continue, close all open windows now.
Page 2-45
Tutorials
Customizing and Saving Analysis Setup Suites
TUTORIAL 13: CUSTOMIZING AND SAVING ANALYSIS SETUP SUITES
1. Select Analysis > New Analysis…, choose the Nucleic Acid Analysis button,
choose Base Composition, and then press the OK button. Select Dinucleotides
from the popup menu and choose to Display results as Number of occurrences. Specify the output type as Graph. Do not run this analysis yet!
2. Choose Analysis > Add Another Analysis… and add Base Distribution. [In the
Windows version of Gene Inspector, the Add Another Analysis selection is
accessible through the right-mouse button menu.] Do a purine distribution by
checking just the A and G boxes. Set the parameters to a window of 20 with
an offset of 2. Do not run this setup panel yet!j
3. Choose Analysis > Add Another Analysis… again and add Restriction Enzyme
Digests. [In the Windows version of Gene Inspector, the Add Another Analysis selection is accessible through the right-mouse button menu.] Use the
Enzyme list popup to choose the Commercial list. Select in the left list all the
enzymes starting with the letter ‘A’ by selecting AatI, using the scroll bar to
scroll down to the last ‘A’ enzyme (AxyI as of this writing) and then holding
down the shift key and selecting this last ‘A’ enzyme (this is called shift-clicking and is a standard way of extending a selection). Move all the selected
enzymes to the right list (of sites to be marked) by pressing the Move>>
button.
4. Select Input Sequences on the left of the analysis setup and add the
DNA sequence “bovine LDH” which is in the lactate dehydrogenases DNA file.
5. This Analysis Setup you have just defined might be something you will
use in the future, so let’s add it to the Analysis menu. Choose Analysis > Add
Setup to Menu… and name the setup “DNA Analysis Suite.” [In the Windows version of Gene Inspector, the Add Setup to Menu selection is accessible
through the right-mouse button menu.] Any time you want to run this set of
analyses on a new DNA sequence, you can do so by selecting the DNA Analysis
Suite analysis setup from the Analysis menu and then changing the sequences
to be analyzed in the input panel.
j.
Remember – patience is a virtue.
Page 2-46
Tutorials
Customizing and Saving Analysis Setup Suites
6. Run this entire set of analyses by pressing the Run button.
7. Save the notebook using a name you will remember because you will
need it again in Tutorial 15: “Restriction Enzyme Digests”, page 2-49.
This concludes this tutorial. You may quit or continue on to the next tutorial.
If you choose to continue, close all open windows now.
Page 2-47
Tutorials
Using Predefined Analysis Suites
TUTORIAL 14: USING PREDEFINED ANALYSIS
SUITES
1. We have provided you with several predefined suites of analyses in the
Gene Inspector. These suites provide an easy way to setup a number of
common analyses. The predefined suites can be modified or discarded and
are meant to serve as an example of how analysis setups can be used.
2. Choose Analysis > Hydropathy Analyses. This analysis suite contains 10 different hydropathy analyses, one using each of the available tables in the popup
menu. To use this suite select the input sequence panel and choose the peptide sequence you want to analyze.
3. After choosing the sequence to be analyzed, press the Run button.
4. A new notebook will be created and your analyses will be started. While
the analyses are running choose Analysis > Show Analysis Monitor. This shows you
all the analyses that are scheduled to be run and the order in which they will
be run. As each one is completed it is removed from the list and the next one
in line starts up.
5. To see that all of the analyses really did run, choose Notebook > Reduction >
Reduce to Fit in Window. This will shrink the “magnification” of the image so that
the entire notebook will fit on the screen.
6. Choose Notebook > Notebook Layout… and set the display to be side by side.
7. While still in reduced mode, move the different analysis output objects to
fit on the notebook sheets the way you want them to.
8. Now choose Notebook > Reduction > Enlarge To Full Size so that you can view the
graphic results.
This concludes this tutorial. You may quit or continue on to the next tutorial. If
you choose to continue, close all open windows now.
Page 2-48
Tutorials
Restriction Enzyme Digests
TUTORIAL 15: RESTRICTION ENZYME DIGESTS
1. Open the GI Notebook you saved in Tutorial 13: “Customizing and Saving
Analysis Setup Suites”, page 2-46, and select the restriction enzyme analysis
output object. Make it bigger by dragging the lower right corner handle down
and to the right.
2. Double-click it to make it the target and then select Object > Edit Display
Parameters… . This will bring up Figure 2.35. Set the display to show only
Figure 2.35: Restriction Enzyme Display Parameters
unique cutters by checking the two check boxes at the bottom of the window
and then placing a 1 in each text box (as in Figure 2.35). Press OK. This
will display only those enzyme which cut exactly once.
3. Click on the AatI enzyme name to select it. Hold down the shift key and
click on the name AvrII to select all the enzymes that are unique cutters.
Now, while the digests are still highlighted, use the Format menu to change the
color to green and the style to bold.
4. Choose Object > Edit Display Parameters again and now enter a 100 into the
“no more than” text field. This specifies that you want to see all enzymes that
cut at least once but not more than 100 times. Press the OK button. Note
that the color/style of the unique cutters is preserved, but all other digests
are in their original color of red.
5. Choose Object > View as Table to see the digests shown in tabular form. Note
that when displayed as a table, you can change the font attributes. The filtering (allowable number of cuts) of which enzymes to display applies to both
the table and graphic views. To switch back to the graphical view, choose
Page 2-49
Tutorials
Restriction Enzyme Digests
Object > View as Graphic.
This concludes this tutorial. You may quit or continue on to the next tutorial. If
you choose to continue, close all open windows now.
Page 2-50
Tutorials
Displaying Formatted Sequence Information
TUTORIAL 16: DISPLAYING FORMATTED
SEQUENCE INFORMATION
Although the sequence editor is ideal for manipulating sequences and displaying alignments, there is often a need to display formatted sequences
including translations and restriction sites. This can be done by creating a
features object in the notebook.
1.
Open the DNA sequence file pBR322.
2. Select nucleotides 1 through 150 and Copy them to the clipboard by
choosing Edit > Copy. Note that if you select these nucleotides and drag them to
the notebook, the sequence itself will be placed in the notebook as text.
3. Bring the Untitled GI Notebook window to the frontk by clicking on it or
choosing Window > Untitled.
4. Paste the DNA sequence into the notebook (Edit > Paste). This creates a
new notebook object called a Features object.l
5. Double-click on the new features object to target it. You will see the
appearance of a new Features menu added at the right.
6. Select nucleotides 18 through 96 and then choose Features > Define Intron.
The selected segment of DNA is displayed in inverse colors to indicate that it
is an intronm.
7. Select the entire DNA sequence from 1 through 150 and then translate it
by choosing Features > Translate…. When asked for a translation table, choose
the E. coli translation table.
8. Choose Features > Adjust Size To Contents to force the size of the object to
expand to include all of the DNA sequence as well as the amino acid
k.
If you do not have an untitled notebook window, create a new notebook window by using
the File > New > Notebook menu.
l. Note that another menu item (Edit > Special Paste >) allows you to paste the sequence
into the notebook’s background text.
m. Obviously this is not a true biological intron, but is being used here just to illustrate the
functioning of the Features object.
Page 2-51
Tutorials
Displaying Formatted Sequence Information
sequence.
9. Your display should now look like figure like that in Figure 2.36, page 2-
Figure 2.36: Features Object with Translation
52. Notice how the translation skips over the intron and how, even though the
codon is interrupted by the intron, it is reconstructed by the program.
10. We need to adjust the grouping of the DNA sequence characters to align
better with the translation. Select nucleotides 1-17 and choose Features > Grouping > Groups Of Three. Notice how the intron grouping is adjusted to remain in
groups of ten, but now the grouping starts with the first character of the
intron.
11. Select nucleotides 98-150 (in the second “exon”) and group it by threes
as you did in the previous step.
12. Select the peptide sequence by clicking on it once. Using the Format
menu, change the peptide sequence to Arial 9 point italic and color it red.
Notice that the numbering style is set to match the actual peptide sequence.
This is the only way the peptide numbering style can be changed.
13. Now let’s add some restriction site markers. Choose Features > Mark Sites….
Select the Commercial_4 enzyme list and move the first six enzymes in the
list (all start with ‘A’) to the right hand Sites to Mark list by pressing the
Move >> button. Your dialog box should look like Figure 2.37. Press Find
to mark all sites for the enzymes you have selected.
14. Select one of the site markers by clicking on it once. Choose Edit > Select
select all the site markers. Using the Format menu, change the selected
site marker text to Times 10 point bold and color blue.
All to
15. Choose Features > Adjust Size To Contents to expand the features object again.
You should now have something that looks like Figure 2.38.
16. Try using some of the other options in the Features menu to adjust the
Page 2-52
Tutorials
Displaying Formatted Sequence Information
Figure 2.37: Features – Mark Sites
Figure 2.38: Features object – Completed
display to look exactly the way you want it to. You might select the Box Around
style to highlight a specific segment or use the Upper Case or Lower Case styles
to indicate other features.
17. Let’s take a look at a features object containing a multiple sequence
alignment. Open the peptide sequence file called rhodopsins. Choose Sequence
> Display > Hide Overview. Align all the sequences by Choosing Sequence > Alignment
> Align All Sequences... and perform the alignment with the BLOSUM30 table. Use
the Sequence > Consensus > menu to show the consensus row and to show the
scoring row.
18. Now click on one of the names in the left column of the sequence window and then choose Edit > Select All to select all the sequences. Make sure
you have an open notebook window visible and then drag the sequences
from the sequence editor window into the notebook with the mouse. A features object will appear in the notebook with the same alignment as you saw
in the sequence editor window.
Page 2-53
Tutorials
Displaying Formatted Sequence Information
19. Double-click on the new features object and a Sequences menu will
appear. You may use the items in this menu to alter the display of the
aligned sequences in this window. Note, however, that you cannot perform
any new alignments within this object. It is for displaying the results only. To
perform a new alignment you must start from the sequence editor window or
else perform a multiple sequence alignment from the Analysis menu.
This concludes this tutorial. You may quit or continue on to the next tutorial. If
you choose to continue, close all open windows now.
Page 2-54
Tutorials
Testcode – An Interactive Analysis
TUTORIAL 17: TESTCODE – AN INTERACTIVE
ANALYSIS
The Gene Inspector is an interactive application. This means that you can
perform almost any function at almost any time. It also means that you can
interact with some output objects to alter their appearance, rerun an analysis
or even continue the analytical process as described in this tutorial for Testcode, and in Tutorial 18: “Dot Matrix Analysis – Another Interactive Analysis”,
page 2-58.
1. The output from the TestCode analysis can be used to generate additional information or to launch further analyses. This ability is in addition to
the ability to recalculate each analysis. Choose Analysis > New Analysis… and
select the nucleic acid analysis called TestCode.
2. TestCode is used to determine if an open reading frame is likely to actually code for a protein. More details about the analysis can be found in “TestCode”, page 4-44. The TestCode panel is shown in Figure 2.39. We will not
Figure 2.39: The TestCode Setup Panel
examine this panel in depth now. The “Minimum Length Open Reading Frame
Page 2-55
Tutorials
Testcode – An Interactive Analysis
to Consider” should be 200 (labelled ‘A’ in the figure), the Method should be
“Only Stop Codons”, and press the ORFs and rare codons button and
choose Drosophila melanogaster as the standard table using the popup menu
(labelled ‘B’ in the figure).
3. Click on the Input Sequence icon on the left and choose the sequence
hsp70 from the Drosophila Hsps DNA sequence file.
4. Run the analysis by pressing the Run button. On slower computers, this
analysis might take some time to run. While it is running you can enter text
into the notebook by clicking in the background and then typing. The Gene
Inspector will continue to process analyses while you work in the notebook or
even if you switch to a different application. This means that you will never
have to interrupt your work while an analysis is running. For time consuming
analyses, like database searching or sequence comparisons, this can be a
real time saver.
5. You will get a plot like the one shown in Figure 2.40. Any points above
A
Figure 2.40: TestCode Output
the upper green threshold line (at about 0.95) correspond to a likelihood of
>95% that the region actually codes for a protein. In this case the region
from about 1600 to 3600 corresponds to the raised area on the plot and to
the open reading frame labelled as ‘A’. The tick marks indicate the presence
of a rare codon. For this predicted protein there are very few rare codons,
which also suggests that it is a real gene.
Page 2-56
Tutorials
Testcode – An Interactive Analysis
6. The output suggests that the reading frame ‘A’ codes for a protein and it
might be of interest to create a protein sequence corresponding to that region
of the DNA. This can be done easily in the Gene Inspector. Double-click on
the output object to make it the target.
7. Now select the ORF of interest by clicking once on the arrow ‘A’ itself.
Once the ORF is selected, choose Object > Translate DNA for Selected ORF. The
Gene Inspector will read that segment of DNA, translate it using the table you
specified in the analysis, and place the generated peptide sequence into a
new sequence window.
8. Click on the name ORF1 in the new sequence window and then choose
Note that the program automatically generated appropriate text to help identify the source of the protein.
Sequence > Sequence Info….
This is a good example of how the Gene Inspector presents you with intuitive
ways of following up on your natural thought process. Once you have examined a DNA sequence for possible coding regions and have identified one,
you are likely to want to create a corresponding peptide sequence for further
analysis.
This concludes this tutorial. You may quit or continue on to the next tutorial.
If you choose to continue, close all open windows now.
Page 2-57
Tutorials
Dot Matrix Analysis – Another Interactive Analysis
TUTORIAL 18: DOT MATRIX ANALYSIS –
ANOTHER INTERACTIVE ANALYSIS
1.
The dot matrix analysis deserves some special attention. Choose Analysis
> New Analysis…, choose to do a protein analysis, select the Dot Matrix analysis, and click the OK button.
2. Click on the Input Sequence icon along the left of the setup panel. As
your two sequences, select the proteins Drosophila hsp22 and Drosophila
hsp23 (they are both in the Dros Hsps peptide file).
3. Select Dot Matrix on the left of the Analysis Setup Window and examine the panel that appears (Figure 2.41). Window size is the length of the
Figure 2.41: Dot Matrix Setup Panel
sequence segments that will be compared – set this to 20. Select the PAM40
table in the Table popup. This table is a scoring table that indicates how similar two amino acids are to each other (see “Dot Matrix”, page 4-54 for more
details). In the Threshold box, enter 40 and then press the Add Threshold
button. Repeat this procedure to add thresholds of 20, 0, -20 and -40 by
typing in the number in the Threshold box and then pressing the Add
Threshold button. These values appear in the Thresholds list at the right.
Page 2-58
Tutorials
Dot Matrix Analysis – Another Interactive Analysis
4. Set the Dot size to 2 x 2 using the small popup menu in the lower right.
This sets the size of the dots to be drawn in the plot to be 2 pixels on a side.
5. Colors now need to be defined for each threshold. Select the 40 in the
threshold list and make it red using the Format > Color menu. Next choose the
20 and make it magenta. Make 0 green, -20 cyan, and -40 blue. Note how
the Color Ranges “thermometer” on the right reflects your changes. Start the
analysis by choosing Run.
6. When the dot matrix analysis is run, the actual comparison data is saved
Figure 2.42: Initial Dot Matrix Output
with the output object, so changes in the display can be made easily and
quickly after the analysis is completed. This allows you to fine tune the display to show exactly what you want. Your initial output should look like Figure
2.42. Each dot represents a point of similarity between the two sequences.
7. Double-click on the dot matrix analysis object to make it the target and
then choose Object > Reformat…. Select the Threshold Settings icon on the left to
see a panel similar to what you saw in the initial setup (similar to Figure
2.41, page 2-58). You cannot change window size, but you can change the
thresholds and/or their colors. By redefining the thresholds, you can present
the data differently. This is useful for reducing the noise level in the plot and
highlighting the data of interest.
8. Select the 20 in the threshold list and type a 30 into the threshold box;
Page 2-59
Tutorials
Dot Matrix Analysis – Another Interactive Analysis
press the Change Threshold button to change the 20 to a 30. Next select
the 0 from the list and change it to 20 by typing in a 20 in the threshold box
and pressing Change Threshold. Convert -20 to 10 and -40 to 0 using the
same procedure. You have now changed the thresholds from 40, 20, 0, -20,
-40 to 40, 30, 20, 10, 0 and left your color scheme intact. Press Reformat
and notice how this changes the display. This reformatting ability lets you
Figure 2.43: Selecting a Region in a Dot Matrix Plot
“play” with the dot matrix results and find the best settings to display your
data.
9. Double-click the dot matrix output object to make it the target.
10. Use the mouse to drag a rectangle within the plot from about the middle
of the plot down to the lower right corner, selecting the diagonal line, as
shown in Figure 2.43. You have now selected a range of each sequence that
shows similarity in the dot matrix plot.
11. Choose Object > Align Selection…. This allows you to do a sequence alignment directly from the dot matrix plot. Set up the alignment parameters to
match those shown in Figure 2.44, page 2-61 (see “Align 2 Sequences
(Global)”, page 4-16 for more detail) and then Run the alignment. This will
generate an alignment of the regions of the two sequences you selected in
the dot matrix plot.
Note that you have just used an output object to define and launch another
Page 2-60
Tutorials
Dot Matrix Analysis – Another Interactive Analysis
Figure 2.44: Dot Matrix Alignment Setup
analysis. With this approach, you can explore your results in an intuitive and
flexible way. A number of analyses allow you to use the displayed data as
the starting point for other analyses.
This concludes this tutorial. You may quit or continue on to the next tutorial.
If you choose to continue, close all open windows now.
Page 2-61
Tutorials
Using Bookmarks in the GI Notebook
TUTORIAL 19: USING BOOKMARKS IN THE GI
NOTEBOOK
Bookmarks can be attached to selected objects and used to remember specific locations in a GI notebook. Bookmarks are automatically added to the
Notebook menu. Selecting a bookmark from the menu takes you to the location
of that bookmark in the notebook.
1. Open the GI Notebook called “Sample Notebook”, which should be in
your Gene Inspector® folder. Select the title object in the notebook – it is the
box that says “A Sample Gene Inspector Notebook” at the very beginning of
the notebook. Select Notebook > Bookmarks > Attach Bookmark…. Name the bookmark
“Start of Notebook”.
2. Select Notebook > Bookmarks > End of Notebook. This bookmark has already
been added to the notebook and is accessible from the Bookmarks menu.
Selecting the item will take you to the end of the notebook and bring a rectangle into view that is the actual object to which the “End of Notebook” bookmark is attached.
3. Try selecting the Start of Notebook and End of Notebook menu items (in the Booksubmenu). You can use bookmarks in this way to remember the location of specific analyses that might be key to your experiments.
marks
4. Specific locations in the notebook can be defined as bookmarks by placing a small graphical object into the notebook at the desired location and
attaching the bookmark to that object, as was done in Tutorial 1: “Tour of a
Gene Inspector Notebook”.
This concludes this tutorial. You may quit or continue on to the next tutorial. If
you choose to continue, close all open windows now.
Page 2-62
Tutorials
Creating Your Own Analysis Tables
TUTORIAL 20: CREATING YOUR OWN ANALYSIS
TABLES
The Gene Inspector allows you to create a number of different kinds of tables
for use in analyses. The Gene Inspector’s built-in table editor makes it easyn.
1.
Choose Analysis > Tables > Create New… and you will see a dialog
like that
Figure 2.45: Creating a New Table
shown in Figure 2.45. For this tutorial choose to create an empty nucleic acid
table by selecting the items shown in the figure. In this case we will be creating a scoring table for aligning 2 sequences. The table we are creating is for
nucleic acids, but the same procedure would be followed for amino acid
tables as well. Press the New button when you are ready. If you had
selected the Nucleotide Identity table in the list on the right, the values from
the Nucleotide Identity table would be entered into the new table for you to
modify. An <empty> table will be filled with zeros.
2. Pressing the New button generates a nucleotide comparison table. This
table contains all pairwise comparisons between nucleotide characters. We
will create a table in which identities score 1 and matches between pyrimin.
You can also use copy and paste to move a table from other applications into the GI
Table editor.
Page 2-63
Tutorials
Creating Your Own Analysis Tables
Figure 2.46: Nucleic Acid Table Editor
dines or between purines score 0.5. Mismatches will score 0.
3. The GI table editor is designed to allow you to press the tab key to move
through the table and enter values. As you type a value in one cell of the
table and then tab to move to the next cell in the table, the same value is
placed in the symmetrically located corresponding cell. In the figure, the
selected cell is row 2, column 4, while the corresponding symmetric cell is
row 4, column 2. Fill in the table to match that shown in Figure 2.46 by
entering values and tabbing to the next cell.
4. You can adjust the width of any of the columns by placing the mouse
cursor over one of the vertical table lines (the cursor will change shape) and
then dragging left or right to move the dividing line. If you hold down the shift
key when you drag the line, all columns in the table will be made the same
width as the column just to the left of the line you are dragging. If you hold
down the option/alt key while you drag to adjust the width, all columns in the
table will be adjusted by the same amount (i.e. - the same number of pixels
will be added to or removed from the width of each column in the table).
5. Press the Edit Info button to enter a Title for this new table. The new
title you enter in the Info Dialog will appear in the title bar of the window.
6. Pressing OK will create a new table in the User Table folder which is
found in the GI Data folder. This User Table will be available in any analysis
for which the table is appropriate.
Page 2-64
Tutorials
BLAST Searching
TUTORIAL 21: BLAST SEARCHING
Gene Inspector allows you to perform a BLAST using the Internet. This analysis requires that you set up your internet connection parameters first, so that
the program knows how to communicate with the database servers. If you do
not have an internet connection, you will not be able to do this tutorial.
Note that different user locations might connect to the internet in different
ways so that what follows might not work at your particular location (although
it works at most sites). If you have problems connecting, please contact your
network administrator for help. This is something that Textco cannot help you
with because every site can have slightly different ways of connecting to the
internet – and only the network administrator at your site will know the best
way for you to connect.
1. Now choose to do a new nucleic acid analysis and select BLAST Search
as the analysis (note that this is at the end of the analysis list). You will see
the BLAST setup panel, Figure 2.47. You can learn more about the various
Figure 2.47: BLAST setup panel
options in this dialog elsewhere in this manual (“BLAST Search”, page 4-47).
Page 2-65
Tutorials
BLAST Searching
For now, enter parameters as shown in Figure 2.47, page 2-65.
2. Click on the Input Sequences icon and choose the Drosophila 5S
sequence (or one of your own if you prefer).
3. Make sure you are connected to the Internet, either directly or through a
modem. Press the Run button to send the query to the BLAST server. The
query will be sent and GI will monitor for results at regular intervals.
4. You will see notification of what GI is doing in the BLAST output object
that appears in your GI notebook. When results are returned from the BLAST
server, they will open in your web browser.
This concludes the tutorials.
Page 2-66
The GI Sequence Editor
Chapter 3
The GI Sequence Editor
Introduction to the Sequence Editor
A sequence editor window is shown in Figure 3.1. The editor is the part of
Figure 3.1: The Sequence Editor
the Gene Inspector where sequences can be displayed and edited. The
sequence editor has been designed to make editing one or multiple
sequences as simple as possible. The overview pane (top of window) shows
a graphical view of all the sequences in the context of the whole document
(window), while the editing pane (bottom of window) allows you to do
sequence manipulation and editing. Tools are available for confirming
sequence entries and reassigning keys to facilitate easy sequence editing.
The Overview Pane
The overview area displays all the sequences in the document and indicates
their relative lengths. The scale of the overview pane is based on the length
of the longest sequence in the document, which will span the entire width of
the pane. All other sequences are drawn as a proportion of that length.
Page 3-1
The GI Sequence Editor
The segment indicator is an area in the overview pane surrounded by a dotted line. This area indicates the segments of each sequences that are currently visible in the sequence editing pane. The segment indicator does not
have to be rectangular and accurately indicates different ranges for different
sequence when appropriate (see Figure 3.1, page 3-1). Scrolling the
sequence editing pane will result in the overview pane being updated automatically to match the displayed range.
The overview pane can also be used to navigate within a sequence document. Clicking on an arrow in the overview pane will do two things. First, it
will move the segment indicator to include the point that was just clicked and
will scroll the editing pane to the same location. Second, it will select the
sequence that was clicked in both the overview and editing panes. This can
be useful if you have a large number of sequences.
The overview pane therefore provides a graphical overview of sequences in
the document in addition to being a navigation tool for moving around the
document.
The Editing Pane
There are three areas in the editing pane: the name column, the position column, and the sequence. In addition there is a ruler to indicate the position of
characters in the sequence (other features are available for displaying multiple aligned sequences – see “Multiple Sequence Alignments”, page 3-10).
Clicking on the name of a sequence will select the entire sequence and will
allow you to perform whole sequence manipulations – like copying and pasting an entire sequence to a another sequence window. You can also get
information about a sequence when its name is selected. This is shown for a
nucleic acid sequence in Figure 3.2, page 3-3. This window gives you information about the sequence and allows you to type in text as comments and
redefine the position of the first nucleotide. For nucleic acids, you can choose
to display the sequence as either DNA or RNA (show Us instead of Ts). You
can also define the sequence as being circular or linear which will affect how
some analyses are run. For example, if a DNA is defined as circular, restriction enzyme digests will find sequences that cross the origin (like the Eco RI
Page 3-2
The GI Sequence Editor
Figure 3.2: Nucleic Acid Sequence Information
site in pBR322).
The protein information is shown in Figure 3.3. This contains essentially the
Figure 3.3: Peptide Sequence Get Info…
same information as that shown for the nucleic acid sequences, except that
you can not make a sequence circular because there are no circular proteins
(yet).
Sequences can be re-ordered within the sequence document by holding the
option key down, clicking on a name, and dragging the sequence name up or
down the column of sequence names. As the sequence is option-dragged
you will see an indicator of where the sequence will be placed when the
Page 3-3
The GI Sequence Editor
mouse button is released.
New sequences can be added to a sequence document by selecting Sequence
> New Sequence…. This will present you with a dialog box allowing you to enter a
name for the new sequence. This sequence will be created below the last
sequence in the sequence editor document. You can then paste in a new
sequence from elsewhere or begin to type in the new sequence.
Selecting a range of characters within the sequence itself is also possible by
dragging with the mouse just as you would in a word processing program.
However, note that unlike a word processor as you extend your selection by
dragging the mouse vertically only the sequence you clicked in initially is
selected; none of the other interleaved sequences are selected.
A number of different operations can be performed on the selected residues
(nucleotides or amino acids). If a segment is selected and you start an analysis, the selected range of characters in the selected sequence is used as the
default sequence for the input panel in the analysis setup. This enables you
to be working on a sequence, select a range of characters and then conveniently analyze that range of characters.
You can also create a detailed view of the sequence for displaying restriction
sites and translations in a Feature Object (see page 3-16).
Manipulating A Sequence
The Sequence > Manipulate submenu contains operations which can be performed on selected sequence segments. For nucleic acid sequences, the
choices are Invert… and Translate…. Invert will take the current DNA strand and
“flip it over” to show the complementary DNA strand in the 5’ to 3’ direction
(for example, the sequence ACCCGT, when inverted will become ACGGGT).
The strand will be inverted in place and therefore replace the current selection. This allows you to perform manipulations like inverting an insert in a
vector. To invert the sequence and also maintain the original sequence, you
first need to copy the sequence you want to invert and paste it into a new
sequence window or a new sequence within the same window – then choose
Page 3-4
The GI Sequence Editor
Invert.
A new sequence editor document can be created by choosing File > New…
and a new sequence within the same document can be created by choosing
Sequence > New Sequence….
Choosing Sequence > Manipulate > Translate… will translate the current selected
nucleic acid sequence characters. The Gene Inspector will ask you to choose
a translation table and then it will create a new peptide sequence window
containing the translation of the selected nucleic acid segment.
For peptide sequences, you can choose Sequence > Manipulate > Reverse Translate….
With this option, you are asked to choose a codon preference table and the
Gene Inspector will use the frequencies found in the table to create a DNA
sequence which could code for the given peptide. The codon frequencies in
the generated DNA will match the codon frequencies for the organism you
specified.
Formatting A Sequence Within the Sequence Editor
A number of options are available for defining the format for displaying
sequences in the sequence editor. Choosing Sequence > Format Sequence… will
bring up the dialog shown in Figure 3.4. The Groups box allows you to spec-
Figure 3.4: Format Sequence Dialog
ify whether characters should be grouped or not and to define the group size
if grouping is active. The Spaces box allows you to set the spacing between
groups. Spacing can be defined as a fixed number of pixels or as a percent
of the standard character width. Note that the sequence editor allows you to
use proportional fonts like Times, Helvetica, Palatino, and Bookman to display
your sequences. The characters will still appear uniformly spaced in the window even if they do not have uniform width. However, in order to display proPage 3-5
The GI Sequence Editor
portional fonts in this way, the program has to calculate the position of each
character individually before drawing it on the screen; this will slow down the
display of sequences. This does not represent a problem on new computers,
but may be slow on older computers. If you find that updating the display is
too slow, change the font to a monospaced font (like Monaco or Courier)
which eliminates the extra calculations.
You can also change the font, size, and styling of the sequences by using the
items under the Format menu. Some of the commands which alter the
Figure 3.5: Using Extra Caution
sequence display operate only on the all sequences in the document (for displaying sequences with full features see “Creating a Features Object View of
a Sequence”, page 3-16). If you would like to be alerted to such events,
choose Sequence > Use Extra Caution…. This will bring up the dialog box shown in
Figure 3.5. If you know your way around the program and do not want to be
disturbed with these dialogs, choose the No button. If you want to be made
aware of what the program is about to do, choose the Yes button.
Drag and Drop Sequence Editing
Sequence data can be moved within the sequence editor window using standard copy and paste operations. However, if you have enabled Drag & Drop
editing (“Drag & Drop Options…”, page 6-13), you will be able to manipulate
sequences using this faster method. To utilize Drag & Drop editing you must
first make a selection. If you select a sequence name by clicking once
(mouse down -> mouse up), when you click on the selected sequence name
again, you can drag (mouse down -> drag) it to a different location in the
sequence editor window (up or down). You can even drag the selected
sequence to a different sequence window (where it will become a new
Page 3-6
The GI Sequence Editor
sequence in that window), or to a GI Notebook (where it will become a Features object in that GI Notebook).
You can also select a piece of a sequence and drag it elsewhere as well. If
you drag a sequence segment to a different sequence window, you will be
able to drop it into any sequence in the target sequence window. Drag &
Drop of a segment into the same sequence is like Cut & Paste; Drag and
Drop of a segment into a different sequence is like Copy & Paste.
Entering and Checking Sequences
Entering a sequence into the Gene Inspector is done through the keyboard or
by importing files saved on disk in other formats. Once a sequence is
entered, there are two ways to verify it: by reentering the sequence, or by
having the Gene Inspector read the sequence back to you.
Mapping the Keyboard
To facilitate sequence entry for DNA, you can reconfigure the keyboard to use
additional keys for entering nucleotides. Choose Sequence > Map Keys… to bring
Figure 3.6: Mapping Keys
up Figure 3.6. In this case the keyboard has been reconfigured so that typing
a 1 (or an A) will enter an A in the active sequence document, a 2 will generate a C, 3 a G; 4 a T (U in RNA), and 5 an N. This makes it easier to
enter sequences without making mistakes and without straining your fingers.
This option is not available for entering peptide sequences.
Defining Speech Preferences (Mac only)
You can also have aural feedback as you enter sequences (this is a Mac
only feature because there is no built-in speech generator on Windows).
Choose Sequence > Speak Typing to have the program speak each character as
Page 3-7
The GI Sequence Editor
you enter it. By using this approach, you can concentrate on reading the
Figure 3.7: Speech Preferences Dialog
sequence by eye from your gel or printed sequence and entering it without
having to view the screen to see if you have made any mistakes. If you err,
the program will either beep at you (for pressing an illegal character) or will
speak the (wrong) character you entered to make you aware of the error.
The speech parameters can be changed by choosing Sequence > Speech Prefs….
This will bring up Figure 3.7. The bottom part of the window allows you to
Figure 3.8: Recording a Sound
define the reading speed the program will use to read sequences. You can
choose either Slow, Medium, or Fast by pressing the corresponding radio
button. When a sequence is being read back directly from the sequence window (see “Confirming Sequences”, page 5-9) it will pause between each
group. The length of the pause can also be set in this dialog. The top part of
the window allows you to either Review or to Edit the sounds associated
with each letter. Selecting the Review radio button and then pressing any of
the keys using the mouse will speak that particular character. If you select the
Edit radio button and then press a character you will see Figure 3.8, page
3-8. Using this dialog and a microphone hooked up to your Mac, you can
Page 3-8
The GI Sequence Editor
record your own sound to be played back when that particular character is
pressed.
Confirming Sequences
As mentioned above, sequences can be confirmed either by speech (Mac
only) or by retyping. To do this requires opening the Sequence Monitor by
choosing Sequence > Show Sequence Monitor. This will show Figure 3.9 - the left
figures is what would be seen on Windows and the right is what would be
seen on a Mac. This windoida provides information about the file that is being
used (acetylcholine receptors), the sequence selected in the file (chick musc
Figure 3.9: Sequence Monitor
AchRec) and the range of characters selected in that particular sequence
(chick musc AchRec, nucleotides 5 through 64). The information in the
sequence monitor may be of value to you often so you might choose to have
the sequence monitor open whenever you are editing a sequence. Keyboard
mapping is shown for nucleic acid sequences and a number of shortcuts are
available using the sequence monitor instead of the Sequence menu. Also, it is
possible to map keys and to turn speaking on or off using the buttons in
the sequence monitor.
The bottom two buttons in the sequence monitor (Figure 3.9, page 3-9)
allow you to verify the current sequence. Pressing Read Sequence will
cause the program to start speaking the sequence from the position of the
insertion point in the sequence. As the Gene Inspector reads each residue in
the sequence, the position is updated in the sequence monitor and the india.
a special kind of window that cannot be hidden
Page 3-9
The GI Sequence Editor
vidual character in the sequence editor is highlighted as it is spoken.
Pressing Confirm Re-entry will allow you to type the sequence into the
computer a second time. As you type each character, it will be compared with
what you entered the first time. If there is agreement between what you typed
the first and second times, the program moves on to the next character. A
disagreement will result in the computer beeping at you and keeping the
character selected in the sequence editor.
Using either of these procedures makes it easy to enter and confirm any
sequence by typing. However, if you already have a sequence in a file on a
disk, you can import it easily as shown in “Importing Sequences”, page 3-19.
Multiple Sequence Alignments
The sequence editor is also the window for the results of multiple sequence
alignments. Multiple sequence alignments can be created as an analysis
using the normal Analysis Setup windows, or they can be created directly
within a sequence editor document itself. This is the subject of the tutorial:
“Multiple Sequence Alignments”, page 2-24.
To align all the sequences in the current sequence editor window choose
Sequence > Alignment > Align All Sequences…. This will bring up the dialog box shown
Figure 3.10: Multiple Sequence Align Setup
Page 3-10
The GI Sequence Editor
in Figure 3.10, page 3-10 for protein alignment. In this case, there are a
number of parameters you can enter. The multiple alignment algorithm used
by the Gene Inspector is called Clustal V [Higgins, D.G., A.J. Bleasby, and
R. Fuchs, Comp. Appl. Biol. Sci. 8(2):189 (1992)]. The code for doing the
alignment was a generous gift from Dr. Des Higgins at EMBL.
To do a complete multiple alignment, there is a need to know which
sequences are most similar to each other. This is done progressively by calculating a crude “guide” tree. The guide tree is then used as a guide to align
larger and larger groups of sequences during the multiple alignment. The final
multiple sequence alignment is then accomplished by aligning the various
alignments of similar sequences with each other.
You must first choose a table to use for comparing the different sequences.
This is done using the popup Table menu in the same way you would choose
a table for any analysis.
Unless you really know what you are doing or are interested in experimenting,
we suggest that you leave intact the default values for the other parameters
in the panel. Improper use of the parameters may yield misleading results,
especially for the step 1 parameters – so be careful. Varying the step 2
parameters may lead to different alignments and might alter the score of the
alignment. What follows is a brief description of what each parameter means
based on the documentation accompanying the Clustal V code.
Step one: pairwise grouping
• k-tuple (word) size: Can be 1 or 2 for proteins; 1 to 4 for DNA. Increase
this to increase the speed of the analysis; decrease the word size to
improve sensitivity (detect sequences more distantly related).
• maximum gap length: The number of diagonals around each “top” diagonal
that are considered. Decrease for speed of analysis; increase to improve
sensitivity.
• gap penalty: The number of matching residues that must be found in order
to introduce a gap. This should be larger than the k-tuple size. This has little effect on speed or sensitivity but will dramatically change the number of
gaps introduced.
Page 3-11
The GI Sequence Editor
• # of top diagonals to use: The number of best diagonals in the imaginary
dot-matrix plot that are considered. Decrease (but not less than zero) to
increase speed of analysis; increase to improve sensitivity.
Step two: multiple sequence alignment
• gap creation: Reduce this to encourage gaps of all sizes; increase it to discourage them. Terminal gaps are penalized the same as all others. Beware
of making the gap creation penalty too small (ð5); if the penalty is too
small, the program may prefer to align each sequence opposite one long
gap.
• gap extension: Reduce this to encourage longer gaps; increase it to shorten
them. As for gap creation, terminal gaps are penalized same as all others
and the same warning applies about making this value too small.
Enhancing Aligned Sequence Displays
Once a multiple sequence alignment has been created, the display can be
enhanced in a number of different ways. These items are available under the
Sequence > Consensus menu.
will show (or hide) an additional
sequence row at the top of the current sequences. This row will show the
character that is present more than any other character at that position in the
aligned sequences. If no character is more frequent than any other, an x is
placed in protein alignments or an n is placed in nucleic acid alignments.
Sequence > Consensus > Show/Hide Consensus Row
will show (or hide) an additional row
at the top of the current sequences. Instead of showing actual sequence data,
the scoring row will show a histogram of how good the match is between the
consensus and the contributing sequences at each location along the consensus sequence.
Sequence > Consensus > Show/Hide Scoring Row
Finally, Sequence > Consensus > Show/Hide Shading will highlight characters in the
aligned sequences that match the consensus character. This is shown in Figure 3.11. The intensity of the shading is directly proportional to the fraction of
characters at that position which match the consensus character. If all the
aligned sequences have the same character at a given position, the highlightPage 3-12
The GI Sequence Editor
Figure 3.11: Shading to Examine Sequence Similarities
ing will be the same color and intensity as in the scoring row. If half the characters match, the intensity of the highlighting will only be half that of the
scoring row.
Sequence Adornments
To change the color or pattern of the shading, you must change the color or
pattern of the scoring row, which is the basis for the shading. To do this,
select the name “SCORE” and then use the Format menu to change color and
pattern.
If you want to capture a part of the multiple sequence alignment to display in
the GI Notebook as a picture, you can do so. Identify the area of the alignment that you wish to capture and make sure it is all visible in the sequence
view. Hold down the option key, click at the top left corner of the sequence
area you want to capture, and then (keeping the option key depressed) drag
the mouse until you have selected the region of the sequence window you
Page 3-13
The GI Sequence Editor
Figure 3.12: Alignment Picture in Notebook
want to capture. Let go of the mouse button (and the option key) and you will
see the selected area outlined. Choose File > Copy to copy a picture (PICT) of
the selected region to the clipboard. You can now paste this into other applications or into the GI Notebook. Figure 3.12 shows the result of this operation. Note that this technique just captures a picture of the selection – it does
not contain any actual sequence data.
Using Custom Score Adornments
Custom Score Adornments are display properties that can be adjusted to
highlight important information in multiple sequence alignments. Figure 3.13
shows the dialog box you can use to change the multiple sequence display.
There are five separate kinds of adornments (in addition to the shading discussed on page 3-13).
• “Grade background color of characters that…” will place a background
behind each of the characters that either match or do not match the consensus sequence. The intensity of the background color will be higher
when higher fractions of the residue in that column actually match (or
don’t match) the consensus sequence. This is basically the same as
shading the alignments (page 3-13) but it has the option to shade nonmatching characters as well, depending on which radio button is chosen.
• “Fill behind characters that…” allows you to define a color to use as background for all characters that match and/or do not match the consensus
character. Note that you can choose to create a background color for
matches as well as non-matches by using the checkboxes in this section
of the window.
• “Invert the characters that…” will invert the colors of the characters matching the consensus character (or not matching, depending on which radio
Page 3-14
The GI Sequence Editor
Figure 3.13: Custom Sequence Adornments Dialog
•
•
button is chosen) characters. Inverting, in this case, means the complementary color. Thus red becomes cyan, green becomes magenta, black
becomes white, etc.
“Replace the Characters that…” will replace any character that matches
the consensus character (or does not match, depending on which radio
button is chosen) with the character that is chosen from the popup menu.
The characters that are available in the popup are those that cannot be
found in the sequence itself.
“Draw boxes around the characters that…” will draw an enclosing line
around all the characters that match the consensus character (or do not
match, depending on which radio button is chosen). The bounding line will
include all adjacent character that qualify as match (or non-match).
The last check box, “Include sequence gaps with non-matching characters”
allows you to specify if the gaps should be considered as part of the matching characters or as part of the non-matching characters. The Try Out button
will apply your choices temporarily to the sequence window. The Match
Adornments window will remain in front so you can experiment with different
Page 3-15
The GI Sequence Editor
methods of displaying your sequence. The Cancel button will leave the settings as they were in the sequence window. The OK button will accept the
new custom adornments that have been defined.
Creating a Features Object View of a Sequence
The text on page 3-13 describes a quick and easy way to capture part of the
sequence editor window for display in the GI Notebook or in another program
as a picture by using the option key and dragging a selection in the sequence
editor to be copied. If you want to actually use sequence data and alter the
display of the output, you can create a Features Object in the GI Notebook.
This Features object can contain one or more nucleic acid (or protein)
sequence(s) along with a translation and cleavage site indicators. Like other
GI Notebook objects, its appearance can be altered.
The first step is to select in the sequence editor window the sequence segment you want to display in the GI Notebook as a Features object. Choose
translation
left positions
marked sites
line dividers
intron
boxed style
right positions
Figure 3.14: A Features Object
to copy the sequence from the sequence window to the clipboardb.
Pasting the sequence into a GI Notebook will automatically create a Features
object containing the sequence. If there is more than one sequence in the
clipboard, then a multiple sequence Features object will be created – this is
Edit > Copy
Page 3-16
The GI Sequence Editor
discussed later.
Features objects can be moved around in the GI Notebook with the mouse
like other GI Notebook objects. Targeting the Features object by double-clicking will add a Features menu to the menubar if there is only a single sequence
in the object. If there is more than one sequence in the Features object, a
Sequences menu will appear. The different parts of a DNA Features object are
shown in Figure 3.14.
A Features object cannot be edited, but its display can be altered. Once
placed into a GI Notebook, the sequence cannot be changed (it is no longer
a true sequence but it is an object containing a string of characters representing a sequence). The Features object is not connected to the original
sequence in any way once it is part of the Gi Notebook. The Features object
is used to create a display for your sequence highlighting the specific features
you want to emphasize in the sequence.
The Features menu can be used to perform a number of operations on the
sequence in the Features object. The Mark Sites… menu option will mark either
restriction sites on DNA or chemical/enzymatic cleavage sites on proteins.
The choices are the same as if you had chosen to do a restriction enzyme
digest (page 4-42) or protein cleavage (page 4-67) analysis. The Translate…,
Define Intron, and Undefine Intron(s) choices are available only for DNA Features
objects. Translate… will create an amino acid sequence below the DNA
sequence using any translation table you specify. If a segment of the DNA
has been defined as an intron, that segment is skipped in the translation of
the DNAc. You can define a segment of DNA as an intron by selecting the
segment and then choosing Features > Define Intron. Any number of introns can
b.
c.
You can also select a whole sequence (click on the sequence name) and then drag it
directly from the sequence window to the notebook. This will automatically create a Features object in the GI Notebook. If you select only a part of a sequence and drag it to
the GI Notebook it will be treated as text and placed as part of the background text.
Once an amino acid sequence is generated in a Features object by translation, it can be
copied and pasted as plain text into a sequence editor for manipulation. Note that the
features translation should be shown as one letter amino acids before you copy it to the
sequence window.
Page 3-17
The GI Sequence Editor
be defined in the DNA sequence. You can also have multiple translations of
the same DNA, for example, in different reading frames.
The Features > Display submenu allows you to specify exactly what the Features
object will look like. You can show or hide Site Markers (restriction sites or protein cleavage sites), Left Positions (numbering), Right Positions (numbering), and
Line Dividers (which separate adjacent lines of sequence from each other). In
addition, for the DNA Features object with translations, you can Show or Hide
Translations and choose to show the translation as either One Letter AA Code or
Three Letter AA Code. Line Spacing determines how much space is placed between
lines of sequence.
To change the font characteristics for the position indicators, select the position numbers and use the Format menu. For translated sequence position indicators in DNA sequence (numbering of amino acid positions), the amino acid
number formatting is set to match the formatting of the closest amino acid
character. You cannot change the amino acid numbering font characteristics
through the Format menu.
Features > Display > Features Margins…
will bring up Figure 3.15. With this dialog you
Figure 3.15: Define Features Margins
can set the minimum space between the edge of the sequence characters
and the border of the Features object itself. You can also set the space
between the sequence and the position indicators.
Features > Grouping can
be used to set the organization of the characters in the
sequence listing. With this submenu, you can define the size of the group in
which sequence segments are organized and can insert or remove line
Page 3-18
The GI Sequence Editor
breaks.
In addition to the possibilities discussed above, you can also fine tune the
formatting by using options under the Format menu. Of particular use is the Format > Style > Box Around item which will place a simple box around any selected
segment of sequence. This is useful for bringing attention to a particular
sequence within the Features object. Box Around works just like any other item
in the Style submenu.
If you create a multiple sequence Features object in the GI Notebook, you will
see a Sequences menu. You will not be able to Mark Sites… as was possible
when only a single sequence is present, but you will have the ability to apply
custom adornments to the multiple sequence alignment. Custom Adornments
are discussed on page 3-13
The sequence editor window is designed for manipulating sequences while
the Features object is designed for displaying sequences.
Importing Sequences
Choosing File > Import > Import DNA Sequences… will bring up a dialog like the one
Figure 3.16: Import DNA Sequence
shown in Figure 3.16. In this case, the figure shows importing a GCG
sequence. Using the “Interpret As” popup menu, you can define what kinds of
Page 3-19
The GI Sequence Editor
documents will be displayed in the file list. Clicking Text Files in the “Files
of type” popup will list all files of type TEXT. TEXT files can be created by
many applications including all word processors and other applications that
deal with sequences, so choosing this means that the Gene Inspector will
have to take a guess at the format of a specific file. This is done using either
our own code or using ReadSeq code written by Don Gilbert at Indiana University and available through FTP at ftp.bio.indiana.edu (thanks Don!). Don
has made this code available to the community so that sequence analysis
programs can be made to read each other’s files and we are using it with his
permission. Currently, you can import the following 10 Text file formats (in
addition to the Gene Construction Kit and DNA Inspector IIe formats):
DNAStrider, EMBL, Fitch, GCG, GenBank/GB, IG/Stanford, NBRF, Pearson/Fasta, PIR/CODATA, and Plain Text.
Note that it is also possible to import sequence that are just plain text DNA or
protein sequences using this method – they count as plain text in the Plain
TEXT category.
When sequences are imported, all inappropriate characters are filtered out.
Note also that if you have the wrong format you might end up with some
characters from comments as part of the sequence. So… if you are unsure of
the format of your sequence file, edit it first with a word processor and just
save it as a text file and then import it.
Sequences that are imported can be placed into a new sequence document
or can be added to existing sequence documents. Use the radio buttons at
the bottom of the dialog (Figure 3.16, page 3-19) to define what the program
will do with the sequence information it imports.
Generating Sequences
There are two methods of generating sequences in a sequence editor document. The first one is to insert Ns into a nucleic acid sequence or to insert Xs
into an amino acid sequence. This is accomplished by choosing Sequence >
Insert Ns (or Insert Xs). You will be asked to enter a number for the length of the
insert, after which the Gene Inspector will place the extra characters into your
Page 3-20
The GI Sequence Editor
sequence at the site of the insertion point.
The other method of generating sequences is to select the menu item
Sequence > Generate Random. Again, you will be asked to provide a length for the
insert after which the Gene Inspector will generate a random sequence at the
location of your insertion point.
Page 3-21
The GI Sequence Editor
Page 3-22
Analyses
Chapter 4
Analyses
The Gene Inspector provides a large number of sequence analysis options.
Running analyses requires you to select one or more sequences to be analyzed and one or more analyses to be performed on those sequences. This
process is carried out using Analysis Setup Windows.
The result of each analysis is placed into the GI notebook as an analysis output objecta. The format of an output object can be altered after the analysis is
run and the analysis output object can be used as a starting point for recalculating the analysis or launching additional analyses.
This chapter explains the mechanics of how to run and edit analyses as well
as providing some information about the algorithms used – what the analysis
is actually doing. Descriptions accompanying these discussions also should
help you interpret the analysis output.
Starting an Analysis
New analyses are started by choosing Analysis > New Analysis…. You will see the
Analysis Chooser, shown in Figure 4.1, page 4-2. By using the Nucleic
Acid Analyses and Protein Analyses radio buttons on the top of the
window, you can see a list of either the nulceic acid analyses or a list of the
protein analyses that are available in the Gene Inspector. A few analyses
(like sequence alignment and dot matrix analysis) appear in both lists; most
are unique to each list. As different analyses are selected in the list on the
a.
The exception is multiple sequence alignments which direct their outputs to a sequence
editor document (see “Multiple Sequence Alignments”, page 3-10 and “Align Multiple
Sequences”, page 4-20).
Page 4-1
Analyses
Figure 4.1: The Analysis Chooser
left, a brief description of the analysis is shown on the right in the Information
about selected analysis section of the window. This provides you with an idea
of what each analysis can do to aid you in finding an appropriate method to
answer biological questions about your sequence. The Draw icons check
box to the right of the list will present the lists of analyses as icons rather
than as a text list (Figure 2.7, page 2-14 shows what an icon list looks like).
To perform an analysis, first select it in the list on the left and then press the
OK button to continue (or double-click on the analysis name).
The Analysis Setup Window
After choosing an analysis, you will see the Gene Inspector’s Analysis Setup
Window as shown in Figure 4.2, page 4-3 for Transmembrane Helices).
Selecting an item in the list on the left of the window will present you with a
panel on the right of the window which is used to enter information needed by
the icon on the left.
Three kinds of panels can be found in the Analysis Setup Window. An Input
Sequence panel allows you to choose which sequence(s) to use in the analyses. Every sequence chosen will be analyzed by each of the analyses in the
Analysis Setup Window. The Output Location panel allows you to define
where the results of the analyses are to be placed. In general, there will be
Page 4-2
Analyses
Figure 4.2: An Analysis Setup Window
one analysis output object generated for each analysis of each sequence,
although some analyses can use more than one sequence. Analysis panels
represent the third kind of panel. There is one analysis panel for each analysis listed in the Analysis Chooser. The different analyses and their analysis
panels are discussed later in the chapter. Each analysis chosen for a given
Analysis Setup Window will have an icon (or text name) in the list on the left
of the Analysis Setup Window.
Along the top of the window is information about the set of options in the current Analysis Setup Window. This includes the number of analyses chosen,
the number of input sequences, and the number of output objects that would
be generated by this analysis setup. These were discussed in Tutorial 3:
“Using Analysis Setups”, page 2-14.
The Analysis Monitor
The analysis monitor provides information about the analysis you are running,
and is shown in Figure 4.3, page 4-4. You can view the analysis monitor by
choosing Analysis > Show Analysis Monitor. This window provides information about
the state of the analysis, the name of the analysis in the queue, the percentPage 4-3
Analyses
Figure 4.3: The Analysis Monitor
age complete and whether the analysis is High or Low priority.
The High Priority button in the setup panel can be used to temporarily
pause any running low priority analysis and start running the high priority
analysis defined in the current Analysis Setup (see also “Analyses That Take
a Long Time”, page 7-3). Pressing Run with the high priority button checked
will create a situation like that shown in the Analysis Monitor in Figure 4.3. In
this case the low priority dot matrix analyses are put on Pause while the high
priority base composition analysis is being run. As soon as the high priority
analysis finishes, the low priority analyses will resume.
Input Sequence Panel
Figure 4.4, page 4-5 shows the Input Sequence panel in the Analysis Setup
Window. Because the Input Sequence icon is selected in the list at the left,
information relevant to selecting a sequence is shown on the right. The panel
contains a list of sequences chosen for analysis (just pBR322 in this figure)
and can also be used to define segments of the whole sequence for analysis.
This is done using the Entire sequence and Segment radio buttons in the
Range section of the panel. When a sequence is selected in the top list, the
Segment button can be chosen and then the to and from fields can be
used to define which range of nucleotides or amino acids are to be included
in the analyses. For circular DNA sequences, it is possible to select a segments of DNA that spans the origin. Whether the sequence is linear or circular is indicated in the Range section shown in Figure 4.4.
Page 4-4
Analyses
Figure 4.4: Input Sequence Panel
To add a sequence to the Chosen files and sequences list, press the Add button, which will bring up the Sequence Chooser (Figure 4.5, page 4-6).
Sequences can be added one at a time, or as an entire file (containing multiple sequences). In this case, the user has previously chosen the chick musc
AchRec sequence and added it to the list in the bottom right of the window.
Then the user clicked on the Drosophila Hsps file in the top left. This file,
when clicked once in the top left will put the list of all the sequences in the
file into the bottom left corner list. Clicking on the Add ‘Drosophila Hsps’
>> buttonb will add the entire file to the list in the bottom right (as was done
here). To add a single sequence, just click on the sequence you wish to add
in the bottom left list and press the Add >> button (or double-click on the
sequence in the bottom left to add it to the list on the bottom right). One or
more sequences can be chosen from any number of files. All analyses will be
performed on each sequence in this list. This method of choosing sequences
involves an extra step compared to the standard way of opening files because
you need to specify not only a file, but a particular sequence in that file (see
also Tutorial 3: “Using Analysis Setups”, page 2-14).
b.
Note that the same result could be achieved by double-clicking on the file name.
Page 4-5
Analyses
Figure 4.5: The Sequence Chooser
The Open Sequences and Saved Sequences buttons/icons in the upper
right of the Sequence Chooser window allow you to perform analyses on
sequences selected in different ways. Pressing the Open Sequences button
will present a list of all sequences in open Sequence Editor windows. If you
have a range of nucleotides selected in a Sequence Editor window, that
range will be the default segment for that sequence in the Input Sequence
panel. The Saved Sequences button allows you to select sequences for
analysis from files on disk which are not currently opened in the Sequence
Editor. Note that if you plan to rerun the analysis at a later time, or to hot link
(see “Links”, page 6-34 or “Hotlinking Analysis Results”, page 2-19) the
analysis, you should work with the saved sequences because Gene Inspector
might not be able to find the Open Sequences at a later date.
Page 4-6
Analyses
Pressing the Done button returns you to the Input Sequence panel (Figure
4.4, page 4-5) with all the sequences you chose now appearing in the Chosen files and sequences list. Pressing the Cancel button, returns to the Input
Sequences panel without any sequences being added. Note that in Figure
4.4, the Chosen files and sequences list contains not only the name of the
sequence but the name of the file which contains the sequence, which is indicated as “Path: Working Files:GI ƒ:GI Seqs:DNA ƒ:pBR322 [pBR322]”. The
name in brackets at the end of the path is the actual sequence name, while
the last part of the path name which is not in brackets is the name of the file
containing the sequence chosen. In this case, they are both called pBR322.
The length of the sequence is also shown.
The Output Location Panel
The output location panel allows you to specify where the results of the analysis will be placed. This is shown in Figure 4.6. In this particular instance, the
Figure 4.6: Output Location Panel
output will be placed into an open notebook called “untitled”. The popup menu
will show a list of all the open notebooks and also let you specify that you
want to create a new notebook for the output. The grayed radio button would
be active if the analysis setup is being shown through a recalculation of an
Page 4-7
Analyses
existing output object. One exception to the output location indicator is for
multiple sequence alignment analyses. In this analysis, the aligned sequences
are placed in a new sequence window.
Adding Analyses to an Analysis Setup Window
This topic was the focus of Tutorial 11: “Adding More Analyses to a Setup”,
page 2-40. After an Analysis Setup Window is created and is still open, additional analyses can be added to it. This is done using the Analysis > Add Another
Analysis… menu item. Additional analyses are added using the Analysis
Chooser just as for creating a new analysis. Analyses can be removed from
the analysis setup by selecting the analysis icon to be removed on the left of
the Analysis Setup Window and then using the Analysis > Remove Analysis… menu
item. As analyses (and sequences) are added to or removed from the Analysis Setup Window, the total number of analyses, total number of input
sequences, and total number of analysis output objects are continually displayed in a box at the top of the Analysis Setup Window (see Figure 4.4,
page 4-5).
Adding Analysis Setups to the Menu
This topic was discussed in Tutorial 13: “Customizing and Saving Analysis
Setup Suites”, page 2-46. Once you have defined all the parameters for a
given Analysis Setup Window and all its panels, you can add the entire Setup
to the Analysis menu where it will be easily available for future access. Choose
Analysis > Add Setup to Menu As… and then name the Analysis Setup when prompted
to do so. You can later recall the entire Analysis Setup with all the parameters you have defined by choosing that item from the Analysis menu. This provides a convenient way to save entire suites of analyses with the parameters
you want to use for these particular analyses. Other users in your lab group
can then access this “standard” analysis set and just put in their own DNA or
protein sequences for analysis. Analysis Setups are stored on your hard disk
and can be shared with other users of the Gene Inspectorc. Analysis Setups
can be removed from the Analysis menu by using Analysis > Remove Setup From
c.
They can be found in a folder called Analysis Setups within the GI Data folder.
Page 4-8
Analyses
Menu….
Modifying Output Objects
Once an analysis is run, it creates an analysis output object in the GI Notebookd. The analysis output object can be modified and used to recalculate an
analysis. This is discussed in detail in “Analysis Output Objects”, page 5-15.
Object > Reformat… and Object > Recalculate… are menu options that are shared by
all analysis output objects. These menu options are available when the object
is targeted by double-clicking on it (see “Selection vs. Target”, page 2-1).
Reformat… allows editing of the axis ranges, tick marks, divisions, labels, and
object title. Recalculate… actually allows you to recalculate the analysis while
keeping the GI Notebook as the active document. You may change parameters for the analysis and/or change the sequence(s) being analyzed. You
can even add or remove analyses in the Setup Window when you choose to
recalculate an analysis. The options which are unique to each output object
are discussed in the context of that analysis later in this chapter.
Style Sheets
Style sheets were the subject of Tutorial 10: “Creating and Using Style
Sheets”, page 2-38. Individual components of an output object can be formatted enabling you to modify the output object to appear the way you want.
The complete set of display options can be saved as a Style Sheet. A Style
Sheet contains information about the color, font, and style of each text item in
the object, as well as specific formatting information about the data display
itself. For example, a style sheet for a sliding window analysis (“Sliding Window”, page 4-68) might specify that the title be in blue 24 point Helvetica
italic and underlined, the x- and y-axis labels should be in green 10 point
Times bold, the axis numbering should be in green 7 point Courier, and the
plot itself should be red with a dotted pen pattern for the graph. Once saved
as a Style Sheet, all the stylistic information can be applied to other output
objects.
d.
The exception to this is multiple sequence alignments, whose output goes into a
sequence editor document.
Page 4-9
Analyses
When an output object is selected, its style can be added to the Format menu
by choosing Format > Style Sheets > Add Style Sheet…. After you provide a name, a
Style Sheet will be added to the Style Sheets… submenu where it can be applied
to any GI Notebook output object.
Any Style Sheet can be applied to any output object, but only the common
Figure 4.7: Creating a Style Sheet for Part of an Object
attributes will be modified. If a sliding window Style Sheet is applied to a base
distribution plot, almost all the attributes are comparable (both have x- and yaxes, titles, and a plot). However, applying a sliding window Style Sheet to a
GOR protein squiggles plot will only affect the title. It is also possible to add
Style Sheets corresponding to specific parts of an analysis object by making
the analysis a target (double-click on it), selecting the part whose style you
wish to copy, and then choosing Format > Style Sheets > Add Style Sheet…. You may
add a Style Sheet corresponding to the entire object or just to the selected
part(s) as shown in Figure 4.7.
Once a Style Sheet has been added to the menu, it can be used from within
an Analysis Setup Panel. Each Analysis Setup Panel has a popup menu to
allow you to choose a specific style for the output object. In addition to a
default style (set by Textco before shipping the Gene Inspector), the popup
menu will contain all of the Style Sheets you have defined. Because of this,
you should name your Style Sheets carefully so that you can recognize them
easily later on.
Finally, note that Style Sheets can be used to specify properties for background text. For example, you might define a Style Sheet called “headline”
that is blue 18 point bold Helvetica, one called “Figure” that is red 12 point
Page 4-10
Analyses
bold Times, and another one called “main text” that is black 12 point Times.
These Style Sheets can also be applied to analysis output objects where they
will affect all the text in that object; applying “main text” to a sliding window
analysis will change the title, axis labels, and axis numbering to 12 point
Times, but will not alter the plot itself.
Frames
Each object in the GI Notebook can have a frame. This is a rectangle (or
rectangles) framing an object which is used to distinguish the object from the
surrounding background text. Frames consist of one, two, or three concentric
rectangles separated from each other and from the object they are framing by
a user defined distance (measured in pixels). The thickness, color and pattern of each line can be set. As shown in Figure 5.6, page 5-9, a drop
shadow boxe can also be defined. As is the case for Style Sheets, Frames
can be added to and removed from the Format menu by choosing items in the
Format > Frame… submenu (see “Framing GI Notebook Objects”, page 5-8). A
style sheet for an object contains information about the frame (if any), so you
can create style sheets that have specific frames you may find useful.
Median Sieving (Data-Sieving)
Many of the analyses can use a process called median sieving, also referred
to as data-sieving. This unique way of filtering data uses medians instead of
means when performing sliding window kinds of analyses, such as hydropathy
and surface probability [J.A. Bangham, Anal. Biochem. 174:142-145
(1988)]. Using a standard sliding window that calculates a mean tends to
smooth out the results and therefore lose details (see “Sliding Window”, page
4-68). In sliding window analyses, each position in the sequence (each
amino acid or nucleotide) has a value assigned to it by looking it up in a
table designed for that analysis. A segment of characters of defined length (a
window) is moved along the sequence and a mean value for the residues in
e.
A drop shadow box consists of dark thick lines to the right and below the object. These
lines are meant to look like shadows cast by the object when a light source is in the
upper left corner of the screen..
Page 4-11
Analyses
that window are calculated. The results are plotted.
Think about two adjacent residues having values of 10 contained within a
region of 8 other residues having values of 1 – the mean will be only 2.8
which is not a significant peak. Using median sieving, however, the 10s will
stand out. Median sieving is not just a sliding median, though, and really represents a sieve that emphasizes features of certain size. A sliding median is
good at presenting rapid transitions within long term events in signals in a
noisy background. However, sometimes a median window can distort the data
and present results in a misleading way by presenting sharp peaks that just
represent an anomalous high value. Median sieving addresses this problem
by looking at segments in a way in which multiple high values will keep their
values and not be averaged, while at the same time requiring more than one
high point to cause a peak in the plot.
Bangham states this by saying that there are two disadvantages to sliding
means: “First, peculiar residues that do not share the properties of most of
the amino acids in the domain may prevent its identification. Second, as a
low-pass frequency filter the running mean smooths sudden transitions from
one domain, or phase, to another. Data-sieving is based on a running median
and is characterized by a single parameter, the mesh size, which controls its
resolution”. Data-sieving is very good at smoothing noisy data while maintain-
Figure 4.8: Median Sieving
ing an ability to detect domains of specified length. This lends itself particularly well to picking out regions in various protein analyses that might be of a
length needed to span a membrane, for example. As shown in Figure 4.8 on
Page 4-12
Analyses
page 4-12, peaks are more clearly resolved and ambiguities are often clarified when compared to the standard sliding window mean. Figure 4.8 is a
standard hydropathy analysis of a chick muscarinic acetylcholine receptor,
with the standard sliding window on the top and median-sieving on the bottom. Note how much more defined the peaks are in the median-sieved version of the analysis and how well the different peaks are resolved.
The mesh size is used to define how the median-sieving is carried out. As a
starting point a value should be used which is about half of the size of the
sliding window. You can try to use other mesh sizes slightly larger or smaller
than this value to see if it helps better define what you are looking for. When
you do find an appropriate mesh size that presents data of interest, you can
calculate the size of the window it corresponds to by doubling the mesh value
and adding one. For example, if a mesh size of 9 brings out some interesting
feature of your peptide, then you are seeing a feature corresponding to
regions that are 19 amino acids long (= 2*9 + 1). A mesh of four corresponds to regions of 9 amino acids length (= 2*4 + 1), etc.
Editing Translation and Codon Preference Tables
Both translation tables and codon preference tables contain information about
the translation of codons into amino acids for a given organism. The codon
Figure 4.9: Creating a New Translation Table
Page 4-13
Analyses
preference tables contain additional information dealing with the relative frequency of occurrence of each codon in an organism’s DNA (for those genes
already sequenced). If you are working with an organism for which you do
not already have a table, you will need to create one. This section explains
how to do this.
You cannot edit the built-in tablesf, but you can create new ones by choosing
Analysis > Tables > Create New…. This will produce the dialog shown in Figure 4.9.
The list on the left of the dialog shows the different kinds of analyses for
which tables are used. Clicking on an item in the left list (Open reading frames
in this case) will bring up a list of tables currently available for the particular
analysis. The table selected on the right will be used to fill in values in newly
created table – it serves as a starting point for editing.
Pressing New will bring up a table like the one shown in Figure 4.10, page
4-15. This standard translation table contains a mapping of codons to amino
acids in the first two columns. When the cursor is moved over the Start or
Stop column it turns to a check mark (?), indicating that you can specify any
codon to be either a start or stop codon by clicking in that table cell. Stop
codons are indicated by a red dot in the stop column and the absence of an
amino acid in the second column. Start codons are indicated by a green dot
in the start column.
Codon preference tables contain additional information as shown in Figure
4.11 on page 4-16. The first two columns and the last two columns contain
information just as for the translation tables. The weight and total columns
contain information about the frequency of use for each codon and the total
usage for all codons for a given amino acid. In the case shown, isoleucine
codon usage is highlighted. Clicking in the weight column for ATA, selects
that cell but also selects all cells in the total column that correspond to the
same amino acid. Thus, ATA, ATC, and ATT are all selected because they all
code for isoleucine. The weight value is the number of times that particular
f.
Built-in tables are in the “Standard Tables” folder within the GI Data folder. Tables you
create will be in the “User Tables” folder in the GI Data folder. Any table you create can
be moved into the Standard Tables Folder where it will become uneditable. To edit a
standard table, make a copy of it and move it into the User Tables folder.
Page 4-14
Analyses
Figure 4.10: Editing a Translation Table
codon was used in the sample set of genes used to compile the table. So,
ATA was used 975 times, ATC was used 3013 times, and ATT was used
1985 times to specify isoleucine. As shown in the total column, there were
5973 occurrences of isoleucine codons in the data set. For isoleucine codons
in Drosophila melanogaster, ATT is used 3013/5973 = 50.4% of the time. As
you type in new numbers for weights, the Gene Inspector automatically
adjusts the totals to reflect the new numbers.
You can update the tables supplied with Gene Inspector as more comprehensive data becomes available for each organism or you can create totally new
Page 4-15
Analyses
Figure 4.11: Editing a CodonPreference Table
tables for organisms that are not yet well characterized but will be in the
future. Finally, you may wish to create tables for highly expressed gene products vs. infrequently expressed gene products. These often can have different
codon preferences.
Nucleic Acid Analysis
Align 2 Sequences (Global)
This routine will provide the best alignment between two sequences using the
entire lengths of the sequences (a global alignment). The analysis will generate the alignment containing the highest “score” possible. The score is calculated by adding points for each matched nucleotide and subtracting points for
gaps and mismatches. You define these values in the panel shown in Figure
4.12. There are a number of parts to this setup panel.
The top part of the panel specifies the way in which scoring will be conducted. This can be through a previously defined scoring table or through an
identity table. You can use the Table Editor within the Gene Inspector to create a scoring table or your own, although GI comes with most of the standard
scoring tables (see “Creating Your Own Analysis Tables”, page 2-63 and
“Tables”, page 6-23). In a scoring table, you define the value to be added to
Page 4-16
Analyses
Figure 4.12: Global Alignment Panel for Nucleic Acids
the alignment score for each comparison. One possibility is to define all
matches as having a score of 1, but also give a score of 0.5 for purine
matching purine or pyrimidine matching pyrimidine. Using the identity table
option allows you to specify the value to be added for an identical match and
the value to be subtracted for a mismatch (just enter a negative value for the
mismatch score as shown).
Gap scoring allows you to define how the score should be adjusted to compensate for creating and elongating gaps. The gap creation penalty is the
value subtracted from the score for the creation of a single nucleotide gap in
one of the sequences. The gap extension penalty is the value subtracted from
the score for each nucleotide in the gap. Depending on the underlying biology, sometimes it makes more sense to have a gap extension penalty of zero
(an insertion or deletion of a segment of DNA that occurs as one event rather
than a series of individual nucleotide insertions or deletions), and at other
times it might be more appropriate for the gap penalty to have a non-zero
value.
If you want the two sequences to be aligned along their entire lengths, starting and ending at the ends of each DNA, then choose to Treat unaligned
Page 4-17
Analyses
ends as gaps. Placing an “x” in this checkbox will cause a gap penalty to
be subtracted from the alignment score if one sequence starts (or ends)
before the other. In other words, the non-aligned end segment will be treated
as a gap. If this option is not checked, then ends will not be forced to be
aligned.
Usually it is possible to generate several alignments having the same score.
By choosing a different traceback path (either upper or lower traceback
paths) you can see either of the two most different alignments capable of
generating this maximum score. The traceback path is a technical term that
corresponds to the way the program actually generates an alignment.
Finally, you have the option of calculating a Z-score. This is a time consuming process but it provides an indication of the significance of an alignment
score. When the two sequences are aligned, a score is calculated based on
the scoring table chosen and the resulting alignment produced by the analysis. The score is shown in the output object, but often it is difficult to assess
the significance of the alignment based on the score (e.g. what does 247.4
mean?). To address this problem and to provide some statistical information
about the alignment, Gene Inspector provides a way to calculate a Z-score.
To generate a Z-score, several steps are performed. First, one of the
sequences (call it sequence A) is “shuffled” – the bases in the sequence are
scrambled into a random order. This preserves the base composition, but not
the sequence. An alignment is now done between the shuffled sequence, A,
and the non-shuffled sequence, B, and an alignment score is calculated. The
process is repeated again, with a new version of a shuffled A being compared
to a non-shuffled B. The process is repeated a number of times and a mean
score and a standard deviation of these alignment scores is calculated. The
Z-score is the number of standard deviations the true alignment score is
away from the mean for the score of the shuffled alignments. Gene Inspector
also shows the number of alignments with the shuffled sequence that had a
better score than the true alignment using the unshuffled sequences. Using
the input panel (Figure 4.12, page 4-17) you can decide whether or not to
calculate a Z-score and how many iterations should be done. Calculating a
Z-score can take quite a bit of time because the program needs to perform
Page 4-18
Analyses
many additional alignments.
Note that alignment times can be quite lengthy if you choose long sequences.
The time to perform an alignment calculation is proportional to the product of
the lengths of the two sequences. Thus aligning two sequences of 200
nucleotides each will take four times as long as aligning two sequences of
100 each. Although there are no limitations in the Gene Inspector code to
perform very long alignments, you might need additional disk space and additional patience. By using disk space to contain temporary date, Gene Inspector can perform alignments on very long sequences that other programs
cannot align. The trade-off is that you need additional disk space to hold the
temporary data (see “Using Extra Disk Space for Analyses”, page 7-1).
However, even though the z-score calculations may take a long time to complete, like all analyses you perform in Gene Inspector, alignments will run in
background so you can continue to work even while the alignment is being
computed. See “Analyses That Take a Long Time”, page 7-3 for some helpful hints.
The output from a global alignment is shown in Figure 4.13, page 4-19.
Figure 4.13: Global Alignment Output for Nucleic Acids
There are three parts to this analysis output object – the title, the summary,
and the body of the alignment itself. You can show or hide the summary and
the body by choosing the appropriate menu item under the Object menu when
the output object is targeted. You can also choose to show or hide alignment
Page 4-19
Analyses
indicators in the same wayg. Alignment indicators are characters that indicate
something about the relationship between the two aligned characters. For
example, “|” might indicate a score of 1, “:” a score of 0.5, and “.” a score of
0. You can choose which characters you would like to use as alignment indicators as well as defining the color code for indicating scores by choosing
Object > Edit Thresholds…. You will see the window shown in Figure 4.14. To
Figure 4.14: Editing Alignment Thresholds
change a character just click in the “Char” box and type a new character into
the box on the right. To change the color, select the Char and use Format >
Color. To change the thresholds that are used for each character or color, type
in a new value in the High, Mid, or Low threshold box on the left. Alignment
indicators are of more use in peptide alignments.
Align Multiple Sequences
Multiple sequence alignments can be initiated either as an analysis or directly
from within the sequence editor. See the Tutorial “Multiple Sequence Alignments”, page 2-24, and, for more details. This is also discussed in the
Sequence Editor Chapter: “Multiple Sequence Alignments”, page 3-10. Multiple sequence alignments initiated with an Analysis Setup Window can contain
any number of sequences from any number of files. Starting a multiple
sequence alignment from within a sequence document can only be done on
all the sequences in that document.
g.
Alignment indicators are not shown in Figure 4.13, but are shown in peptide Figure 4.48,
page 4-52.
Page 4-20
Analyses
Base Composition
Base Composition analysis determines the composition of mono-, di-, or trinucleotides in the sequences being analyzed. The setup panel is shown in
Figure 4.15: Base Composition Panel
Figure 4.15. The upper popup menu allows you to specify whether the Gene
Inspector should calculate information about mononucleotide, dinucleotide, or
trinucleotide composition. The results of the analysis can be displayed either
as a table or as a graph. The output graph can plot either the number of
occurrences of the mono- di-, or trinucleotides or it can plot the percentage of
all occurrences of each specific mono-, di-, or trinucleotide. The table output
lists both kinds of data. Output from a (dinucleotide) base composition analysis is shown in Figure 4.16.The relative heights of the different bars on the
histogram will remain the same but the values along the Y-axis will change
when the output is shown as either a percentage or number of occurrences
Base Distribution
The Base Distribution analysis determines the distribution of any particular
base or combination of bases as a function of position along the DNA. The
setup panel is shown in Figure 4.17, page 4-22. Using this panel you can
Page 4-21
Analyses
Figure 4.16: Base Composition Output
Figure 4.17: Base Distribution Panel
specify any single base or any combination of bases. In this figure, the G and
C boxes are checked so the analysis will display the distribution of G+C base
content along the length of sequence. A window of 20 is chosen with an offset of 1. This is illustrated in the picture at the top of the panel. Nucleotides
1-20 (a window of 20) will be examined for G+C content and the number of
Gs plus Cs plotted for this window. Next, the window is moved by 1 (an offset
of 1) and nucleotides 2-21 are evaluated. This process is repeated using a
window of 20 and an offset of 1 until the end of the DNA sequence is
reached. This analysis is useful for showing local regions of DNA which might
have noteworthy base composition. The result is shown in Figure 4.18, page
Page 4-22
Analyses
Figure 4.18: Base Distribution Output
4-23. Notice how easy it is to pick out the region rich in A+T (low G+C)
around position 250. This analysis is very useful because it points out DNA
features not visible through other analyses.
CodonPreference
This analysis, which is based on the paper by Gribskov, M. et al. [Nucl.
Acids Res. 12(1):539 (1984)] is used to find coding regions in DNA. The
Figure 4.19: CodonPreference Panel
codon preference plot that is produced is useful for identifying genes and
exons and for detecting DNA sequencing errors resulting from insertions or
deletions. The setup panel is shown in Figure 4.19, page 4-23. The analysis
Page 4-23
Analyses
requires the use of codon frequency tablesh to specify codon usage for the
organism being studied. A codon frequency table is a table containing a list of
each codon and the frequency at which that codon is used for specifying a
particular amino acid. For example, there are 4 possible codons for glycine
but they are not likely to each be used 25% of the time in any one organism.
Each of the four codons will be used at a different frequency in different
organisms. Available codon frequency tables are chosen in the bottom of the
analysis setup panel using the popup menu. This popup contains the 48 Standard tables supplied with the Gene Inspector along with any User tables you
might have defined on your own (see Tutorial 20: “Creating Your Own Analysis Tables”, page 2-63 and “Editing Translation and Codon Preference
Tables”, page 4-13). Any User table of the correct type that resides in the
User Table folder in the GI Data folder will be available in the popup menu. If
your organism is not listed, you can try using a codon preference table from a
related organism, but there is no guarantee that the codon frequency tables
for your organism and for the one you have chosen are similar. If your organism is not listed, try the Testcode analysis (“TestCode”, page 4-44) which
does not depend on codon preference tables, or create a new codon preference table using your own coding data.
Because the analysis relies on the ability to recognize specific codons and
look up values in a table corresponding to those codons, any ambiguous
characters found in the sequence can cause problems in generating a meaningful output. Ambiguous character handling is discussed in the “TestCode”
section on page 4-44. That discussion also pertains to the CodonPreference
analysis being discussed here. You can specify how the analysis should handle ambiguous characters using the setup panel in Figure 4.19, page 4-23.
A default (standard) window size of 25 codons is recommended by the
authors. It represents the segment size of the DNA that will be examined for
its codon usage. The codon usage in this sliding window will be compared to
h.
Note that many species use the same genetic code but might have significantly different
codon preference tables. Translation tables contain information about which amino acid is
coded for by each codon, while codon preference tables contain codon usage information.
Page 4-24
Analyses
the frequencies in the codon frequency table for that organism. The closer the
actual usage is to the values in the table, the higher the value will be for the
plot. The output from a CodonPreference analysis is shown in Figure 4.20.
One curve is drawn for each reading frame. Any values present above the
cutoff line are likely to be coding regions with a 95% confidence level. In this
case, a nice coding region can be seen in reading frame 3 stretching from
about 1600 to about 3700 nts.
Other options are also available to be displayed in the CodonPreference plot.
Figure 4.20: CodonPreference Output
Some codons are used only rarely in an organism (usually less than 10% of
the time for any set of synonymous codons). These codons are likely to be
found only infrequently in any real coding region. By plotting rare codon
appearance along the length of the plot, one can often identify likely coding
regions. Notice how the rare codon frequency tick marks are much sparser
within the actual coding region in reading frame 3 than anywhere else in the
plot. This provides an additional indication that the region is a true coding
region. You can specify that you want to plot rare codons in the setup panel
(Figure 4.19, page 4-23).
Finally, the plot draws actual open reading frames (ORFs) as arrows. ORFs
represent segments of DNA that do not contain any stop codons. You can
Page 4-25
Analyses
specify the minimum length that an ORF has to be in order for that ORF to
be drawn in the analysis output by using the setup panel on Figure 4.19,
page 4-23. You can also specify whether all ORFs must start with a “start”
codon (probably true for prokaryotes) or can start with any codon, which can
occur as the result of introns in eukaryotic genes. ORFs are indicated as horizontal arrows as shown in Figure 4.20, page 4-25.
You can select an ORF arrow with the mouse if the CodonPreference output
object is targetedi. Once and ORF is selected, it is possible to extract either
the corresponding DNA or peptide sequence into a new sequence editor window. This is discussed in more detail in “Open Reading Frames”, page 4-39
and was the subject of Tutorial 17: “Testcode – An Interactive Analysis”, page
2-55.
Using the CodonPreference analysis and showing rare codons and ORFs provides three independent methods of identifying a coding region – all in the
same output object. Notice how the three pieces of information agree in identifying the true coding region for Drosophila hsp70 in Figure 4.20 on page 425.
Dot Matrix
This was the central topic of Tutorial 18: “Dot Matrix Analysis – Another Interactive Analysis”, page 2-58. A dot matrix analysis is used to compare two
sequences for regions of similarity. The result is a two dimensional plot indicating graphically the regions of similarity between the two sequences. This
method gives a very intuitive way to identify regions of similarity. It is the best
way to start your comparisons between sequences. The input panel is shown
in Figure 4.21. It is a panel with many options, so each component will be
discussed individually.
The basic algorithm is a sliding window comparison between two sequences.
If a window of 10 is chosen for the analysis, nucleotides 1-10 of sequence#1
i.
If the object is not targeted, you can hold down the option key and click the mouse on
the ORF to select it. The option key can be used in combination with the mouse to select
parts of an object.
Page 4-26
Analyses
Figure 4.21: Nucleic Acid Dot Matrix Panel
will be compared to 1-10 of sequence#2. If the two segments meet the
defined scoring criterion, a dot will be place in the plot at coordinates representing the two segments being compared. Next, 1-10 of sequence#1 are
compared to 2-11 of sequence#2, then 3-12 of sequence#2, then 4-13 of
sequence#2, etc. until the entire length of sequence#2 is compared to the
segment of sequence#1. Next nucleotides 2-11 of sequence#1 are used to
compare to sequence#2 and the process is repeated. In this way, a plot can
be generated which indicates graphically those regions of the two sequences
which are similar (they will show up as a diagonals on the plot). The values
you enter in the input panel will determine when a dot will be drawn, and
what that dot will look like (color & size).
The first thing you should do is define a window size by typing in a number
in the window size box – this specifies the size of the segment that will be
used in the sequence comparison. The smaller the window, the more sensitive the analysis will be to local changes in sequence. The increased sensitivity, however, will also increase noise level. For nucleic acids, a window of at
least 10 is recommended but 20 is probably better. Each pair of sequences
will have its own best window as it will depend on how similar the sequences
Page 4-27
Analyses
are and how the similarity is distributed along the length of the sequences.
You also need to choose a table to use for scoring. For nucleic acids, an
identity table makes the most sense – it will give a score of 1 for each match
and 0 for each mismatch. This is one of the standard tables. Once the table
is chosen a range of possible scores is indicated at the top and bottom of the
Color Range indicator. In Figure 4.21, page 4-27 the range is from 0 (none
of the 20 nucleotides match) to 20 (all twenty match). If a different scoring
table or window size were chosen, the range indicator would display different
values.
To specify how the plot is drawn, you need to define thresholds for plotting.
Thresholds are scoring values above which a specific color is used. This is a
two step process: first define the threshold values and then define the colors
for each threshold you have defined. Threshold values are entered by typing
a value (this can be no greater than the maximum score) in the threshold
box and pressing the Add Threshold button. Add all the threshold values
you would like to use as cutoffs for displaying the matching data (this is discussed in Tutorial 18: “Dot Matrix Analysis – Another Interactive Analysis”,
page 2-58). Now click on one of the values in the Thresholds list and use the
Format > Color menu to define a color for it. As colors are defined for each
threshold, they are indicated in the Color Range Indicator thermometer on the
right of the panel.
The last item to be defined is the dot size. This popup menu specifies the
size of the dot to be drawn for each match. The numbers represent the size
in pixels for each square dot. For plots that are to be used for posters or
slides, it is often more visible to use larger dot sizes so the image can be
seen easily from a distance.
Running the analysis will give results as one shown in Figure 4.22. You can
change axis parameters and other items in this output object just as you can
in other graphical outputs. However, the dot matrix output provides a number
of additional and interactive features. Because the actual comparison data is
stored with the output object, you can target the dot matrix output and change
thresholds by choosing Object > Reformat… and then choosing the “Threshold”
Page 4-28
Analyses
Figure 4.22: DNA Dot Matrix Output
icon in the reformat window. In this way, you can fine tune the display to
show only the data you are interested in displaying. By experimenting with
different thresholds, it is possible to maximize your signal to noise ratio.
One consequence of storing all the data with each plot is that it can take time
to write all the data to disk and the resulting analysis output can be very
large. In order to provide the flexibility of allowing changes in thresholds in
Figure 4.23: Discard Data Dialog
the output object, all the data needs to be stored with the output object. If
you decide that you don’t need the stored data any longer and you are happy
with your plot, you can choose Object > Discard Data… and just save the picture of
Page 4-29
Analyses
the analysis. You will see a dialog like the one shown in Figure 4.23. As
described in the dialog, once you dispose of the data you will not be able to
alter thresholds and the image will not be changeable, but you will still be
able to recalculate the analysis. The dialog also shows you how much disk
Figure 4.24: Selecting a Subrange in a Dot Matrix Plot
space you will save by discarding the data.
The dot matrix window also comes with the ability to launch related analyses
by using the mouse to select a subrange in the plot that can be used as a
starting point for another analysis. As seen in Figure 4.24 on page 4-30,
when the dot matrix plot is targeted, you can use mouse to select a region on
the plot by dragging the mouse over that region of the plot (place the cursor
at the top left corner of the region, press the mouse button down, drag to the
bottom right corner, and then let the mouse button up). Once this region is
selected, you can use the Object menu to either perform an alignment of the
sequences in that selected region or to zoom in to that region and see a
more detailed plot of the region. This is discussed in detail in the tutorial
Tutorial 18: “Dot Matrix Analysis – Another Interactive Analysis”, page 2-58.
Page 4-30
Analyses
The dot matrix analysis therefore provides a very good starting point for comparing sequences. Regions of similarity that are of interest can be investigated in more detail directly from the dot matrix plot. Selecting the region of
interest and zooming in or aligning the sequences provides more detail about
the matching regions of the sequences.
Find Inverted Repeats
This analysis will search DNA sequences for inverted repeats of any defined
length. The analysis can be used to identify regions of potential secondary
Figure 4.25: Inverted Repeats Panel
structure in DNA or in the transcribed RNA. The setup panel is shown in Figure 4.25, page 4-31. The window size is the size of the segment for which
you are looking for an inverted repeat. The maximum number of mismatches is the maximum number of nucleotides that will be allowed to be
mismatched between the first segment and the second (inverted) segment.
Use the text boxes on the bottom to define the minimum and maximum number of nucleotides between the two parts of the inverted repeat. The output is
shown in Figure 4.26, page 4-32. This output object displays each inverted
repeat as a short horizontal line, the ends of which (as vertical tick marks)
Page 4-31
Analyses
Figure 4.26: Inverted Repeats Graphic Output
represent the start point for each segment of the inverted repeat.
The graphical output object can be targeted and the output changed to a tabular form by choosing Object > View As Table. The table form is shown in Figure
4.27. The table output contains additional information not found in the graphical view. Each row in the table represents an inverted repeat. Seq. #1 Start
indicates the position of the first nucleotide in the first part of the inverted
repeat. The actual sequence is shown in the second column, labeled Seq.
#1. The column labeled Seq. #2 Start shows the first nucleotide of the start
of the inverted repeat. The position is given from the 5’ end of the “top”
strand, the one containing Seq. #1. The fourth column, Seq. #2, is the
sequence of nucleotides in the top strand corresponding to the inverted
repeated. Any mismatches are shown in lower case, like the “c” in row 1. To
make it easier to follow the sequences after inversion, the inverse of the
sequence in column 4 is shown in column 5, labeled Seq. #2’. The mismatch information in this table may be of some use in your analyses, while
the graphical view (Figure 4.26, page 4-32), provides a more comprehensive
picture of the patterns of the inverted repeats.
The Show summary results checkbox in Figure 4.25 on page 4-31 will
create a single output containing the inverted repeat results of all the
Page 4-32
Analyses
Figure 4.27: Inverted Repeats Table Output
sequences you have chosen. The output from a summary inverted repeat
Figure 4.28: Inverted repeat summary analysis
analysis is shown in Figure 4.28. For this analysis, the summary results are
presented in table format. To see the result of an individual sequence analysis in the format shown in Figure 4.26, page 4-32, first target the summary
output object, select the sequence(s) you want to examine, and then choose
Object > Search Selected Sequences…. You will see an analysis setup panel with just
the one sequence entered. Running this analysis will show the single
sequence inverted repeat analysis. This is a convenient way to rapidly examine a number of sequence analysis in one output object.
Page 4-33
Analyses
Find Repeats
This analysis will search DNA sequences for repeats of any defined length. It
is similar in setup to the Inverted Repeats analysis (page 4-31). The repeats
can have mismatches and the maximum distance between the two parts of
the repeat can be specified. The output looks like the outputs shown in Figure
4.26, page 4-32 and Figure 4.27, page 4-33 for inverted repeats. The only
difference is that the table output does not have the last column showing for
inverted repeats. Find Repeats can also be run as a summary analysis.
Find Sequence
The find sequence analysis allows you to define and search for a complex
query sequence in a target DNA. The setup panel is shown in Figure 4.29.
Figure 4.29: Find Sequence Panel (DNA)
The query sequence can consist of a number of segments. The sequence
you want to search for is entered by typing it in the segment box and pressing the Add Segment button – which will add that segment to the sequence
list. In this figure, two sequences have been entered in the sequence list:
caat and tataaa. The caat sequence is the currently selected sequence,
so the items in the bottom of the panel pertain to the caat sequence. In this
Page 4-34
Analyses
case, it has been specified that an exact match must occur (0 mismatches)
and there must be from 10 to 40 nucleotides before the next segment in the
query sequence is found. Similarly, 0 mismatches are allowed in the tataaa
sequence.
If you enter a sequence that you would like to search with again in the future,
you can save it by pressing the Edit Find Menu button in the top right of
the panel. The current entry might be saved under the name “promoter”. The
ability to save search sequences might be useful if you have binding motifs or
other sequences you are interested in for your research.
The output is shown in Figure 4.30. Matches were found with this query
Figure 4.30: Find Sequence Output
sequence at three locations. The initial output object is shown in the top part
of this figure which is a graphical display of the location of the two parts of
the search sequence displayed along the DNA. The start of each part of the
query sequence is shown as a tick mark along the horizontal line. By choosing Object > View As Table you can see the data in tabular form as shown in the
bottom part of Figure 4.30. This reveals that the search sequence is found
on the “bottom” strand of the DNA because the First nucleotide column has a
higher number than the Last nucleotide column. The first and last nucleotides
in this case refer to the first and last nucleotides that match the search
sequence.
Page 4-35
Analyses
In this search, no mismatches were allowed. As seen in the setup panel (Figure 4.29, page 4-34), however, it is possible to allow mismatches in any one
or more of the search segments. If a single mismatch is allowed in the
Figure 4.31: Find Sequence Output With Mismatches (DNA)
tataaa sequence and the analysis is recalculated, the results shown in Figure 4.31, page 4-36 are obtained. Notice that the positions with mismatches
are shown in lower case letters in the table output, while the exact matches
are in upper case letters, the same convention used in the Find Repeats
panel.
If you enter a query sequence in both upper and lower case letters and then
you allow mismatches to occur, the mismatches will only be allowed to occur
in the lower case characters. For example, if the search sequence for the
tataaa were entered as TATAaa and one mismatch was allowed, the
matches discovered in Figure 4.31 would only consist of the match starting at
Page 4-36
Analyses
572 – the only one having a mismatch in the last two characters.
Two other points should be mentioned about the output object. Notice that the
output position indicators are shaped like golf clubs (or hockey sticks if you
are from a colder climate). The horizontal part of the output indicator corresponds to the length of the search sequence segment. The vertical part of the
indicator is the actual site of the match. As with other outputs in the Gene
Inspector, if the entire table or graphical output does not fit in the output
object box, you can drag the data within the output box by holding the option
key down and dragging with the mouse.
The Show summary results checkbox in Figure 4.29 on page 4-34 will
create a single output containing the found matches in all the sequences you
have chosen. The output from a summary inverted repeat analysis is shown
Figure 4.32: Find sequence summary analysis
in Figure 4.32. For this analysis, the summary results are presented in table
format. To see the result of an individual sequence analysis in the format
shown in Figure 4.31, page 4-36, first target the summary output object,
select the sequence(s) you want to examine, and then choose Object > Search
Selected Sequences…. You will see an analysis setup panel with just the one
sequence entered. Running this analysis will show the single sequence
inverted repeat analysis. This is a convenient way to rapidly examine a number of sequence analysis in one output object.
GC Coding Prediction
The GC Analysis uses the algorithm described by Bibb, et al. [Gene 30:157
(1984)]. This analysis takes advantage of the fact that organisms prefer to
Page 4-37
Analyses
Figure 4.33: GC Coding Prediction Setup
use some codons over other synonymous codons (see “CodonPreference”,
page 4-23). The result of this bias is that in the third position of the codons
in a specific reading frame, there is often an extreme skewing of the G+C
content. The GC Analysis setup panel is shown in Figure 4.33, page 4-38.
The analysis output shows the distribution of G+C in different positions of the
DNA as shown in Figure 4.34, page 4-39. The first curve represents G+C
content in every third nucleotide starting at position 1 (reading frame#1), the
second curve represents the G+C content of every third nucleotide starting at
position 2 (reading frame#2), and the third curve starting at position 3 (reading frame#3). In this case there is a clear plateau in reading frame 1 corresponding to the ORF from 750-2700. Because of its ability to be specific for
a single reading frame, a GC Analysis can be used to identify sequencing
errors which cause frame shifts. A sequencing error in a coding region could
result in a shift in the reading frame; this would show up as two separate elevated regions in the GC Analysis output plot.
Along the bottom of the plot are illustrated the actual open reading frames
and rare codon usage if requested (Figure 4.33). This area of the plot was
discussed in Tutorial 17: “Testcode – An Interactive Analysis”, page 2-55.
Page 4-38
Analyses
Figure 4.34: GC Analysis Output
Open Reading Frames
Open reading frames (ORFs) represent stretches along a DNA sequence in
which there are no stop codons. The setup panel is shown in Figure 4.35 on
page 4-40. The Method box lets you choose to determine open reading
frames (ORFs) as stretches of DNA between start and stop codons, or just
between stop codons. For eukaryotic organisms with introns, it is best to
choose just stop codons, but for prokaryotes it might be useful tochoose both
start and stop codons. The Display box lets you show either ORFs alone or
ORFs and rare codons. Rare codons are those codons in a synonymous
codon set that occur below the defined threshold level. Rare codons are not
found often in true coding regions and can sometimes be used to confirm a
region as being an actual coding region. The results of an Open Reading
Frame analysis are shown in Figure 4.36 on page 4-40. All six reading
frames are shown and arrows indicate the direction of the coding region. In
Page 4-39
Analyses
Figure 4.35: Open Reading Frame Panel
Figure 4.36: Open Reading Frame Output
this case, there is a long ORF in reading frame #3 from about 250-2700.
Notice how in this reading frame there are not very many rare codons (tick
marks), which suggests that this ORF may truly be a coding region.
This in an interactive output object which allows you to extract either the DNA
or the peptide sequence corresponding to an ORF. To do this, target the
Page 4-40
Analyses
analysis output by double-clicking on it and then click once on the ORF of
interest. This is shown in Figure 4.37, page 4-41. Once the ORF is selected,
two menu
Figure 4.37: ORF Selected In Output Object
choices become available. Object ?Extract DNA for Selected ORF
and Object
?Translate DNA for Selected ORF. As these names suggest, Gene Inspector can cre-
ate a new DNA sequence window containing the DNA corresponding to the
selected ORF or it can create a new peptide sequence window containing the
translated sequence from this ORF. By providing this capability, the Gene
Inspector makes it easy for you to follow the logical path of examining the
peptide after seeing the ORF without forcing you to go through multiple intermediate steps to generate the peptide sequence. The ORF indicators in the
CodonPreference (page 4-23), GC Coding Prediction (page 4-37), and TestCode (page 4-44) analyses are also interactive in this same way and are
discussed in Tutorial 17: “Testcode – An Interactive Analysis”, page 2-55.
If there are several ORFs you would like to translate (or extract DNA from),
you can select additional ORFs by holding down the shift key and clicking on
the ORFs you want to add (shift-clicking). With several ORFs selected, the
extract and translate menu items will create documents containing multiple
sequences.
Page 4-41
Analyses
Restriction Enzyme Digest
This analysis will create restriction maps using enzymes chosen from a list.
Figure 4.38: Restriction Enzyme Digest Setup Panel
The setup panel is shown in Figure 4.38 on page 4-42. Using the Enzyme List
popup menu, you can specify the list you wish to work with. A comprehensive
set of lists of enzymes is provided with the Gene Inspector, containing all
commercially available enzymes in several lists. The enzyme list in this figure
is for commercially available enzymes which recognize 4 nucleotide
sequences (commonly called “four cutters”).
For enzymes to be used in the search, they must be moved from the left list
(Available enzymes) to the right list (Sites to mark) in this setup panel. This
can be done either by double-clicking on the enzyme name on the left to
move it, or by selecting one or more names from the list on the left and then
pressing the Move >> button. To transfer all enzymes to the Sites to mark list
press the All >> button. The Mark cut sites or Mark recognition Sites
radio buttons will do as their names suggest, placing the position indicator in
the output at either the cut site or the first nucleotide in the recognition site.
The output is shown in Figure 4.39, page 4-43. Each enzyme is represented
Page 4-42
Analyses
Figure 4.39: Restriction Enzyme Digest Output
on a single line and a vertical tick mark represents either the cut site or the
first nucleotide of the recognition sequence (depending on what you chose in
the setup panel). .You can target the object and resize columns of informa-
Figure 4.40: Restriction Enzyme Digest Output Table
tion by dragging the border between the enzyme name and the actual map
using the mouse Choosing Object ?View as Table will produce Figure 4.40 on
page 4-43. You can view any data not visible in this object by option-dragging in the table. Another method to view more data is to choose Notebook ?
Page 4-43
Analyses
(also see page 6-29). This will open up the output object in a
separate window that can be scrolled and manipulated as if it were a separate document window.
Open for Editing…
There is often a need to filter the amount of information in the digest output to
display only a subset of all the enzymes. This is done using Object ?Edit Display
Parameters….
Figure 4.41: Restriction Digest Edit Display Parameters
The dialog is shown in Figure 4.41, page 4-44. Using the check
boxes at the top of the window, you can choose to show any combination of
enzymes that cut to leave 3’ overhangs, 5’ overhangs, or blunt ends. The
bottom part of the box allows you to define how frequently an enzyme must
cut to be displayed. In this instance, the parameters are set to show enzymes
that produce at least 1 but not more than 5 cuts in this case.
TestCode
This analysis is based on that of Fickett [Nucl. Acids Res. 17(10):5303
(1982)]. The algorithm, called TestCode, takes advantage of the fact that
codons for the same amino acid (synonymous codons) are used with different
frequencies in coding regions of DNA. This leads to an asymmetry in the distribution of nucleotides in every third position along DNA containing a coding
sequence compared to the distribution to be found in non-coding DNA. Fickett
defines eight numerical parameters that can be used to evaluate the likelihood
of a segment of DNA actually coding for a peptide. One advantage of using
TestCode compared to CodonPreference is that it does not require the use of
a codon preference table so TestCode analysis can be performed on any
DNA, not only those for which a codon preference table is known.
Page 4-44
Analyses
Figure 4.42: TestCode Setup Panel
Figure 4.43: TestCode Output
The setup panel is shown in Figure 4.42, page 4-45. The default window
size is 200 nucleotides, which is the value recommended by Fickett. Using
shorter windows will give more localized results and may reflect local biases
Page 4-45
Analyses
in the base composition – not something you are likely to want to do in order
to find ORFs. The ORF settings and Display options are discussed in
“CodonPreference”, page 4-23.
The output is shown in Figure 4.43. Parts of the curve that are above the
upper (green) line have a 95% chance of actually coding for a protein. Parts
of the curve below the lower (red) line have only a 5% likelihood of actually
being a coding region. In between the two lines it is safest to assume that the
region is not a protein coding region based on the TestCode output alone. To
evaluate how likely a region is to be a coding region, you need to look at
ORFs and rare codon plots in the lower part of the output object. The plotted
Figure 4.44: Testcode Output With Ambiguous Characters
TestCode values are statistical attributes so you must be careful in your interpretation. Just because a value is above the green line does not mean that
the particular region is definitely a coding region and conversely, if the curve
is below the red line it does not mean that it cannot code for a protein.
This analysis does not have any built-in way of handling ambiguous characters (e.g. Y, R, N) so you are given an opportunity of specify what to do
when an ambiguous character is encountered in the sequence being analyzed
(this can be done in the top part of the setup panel – Figure 4.42, page 4Page 4-46
Analyses
45). In Figure 4.44, a few ambiguous characters were introduced into the
Hsp70 sequence and the analysis was rerun by substituting A for each
ambiguous character. The positions of the ambiguous characters are indicated
as tick marks in the plot. Notice that the curve dips down at about 2400 and
that the ORF in reading frame#3 is broken up as the result of an ambiguous
character at about 2500.
The ORF indicator at the bottom of the output object behaves in the same
way as the ORF indicator for the ORF analysis (page 4-39) so you can
extract DNA and generate corresponding peptide sequences directly from the
ORF arrows.
BLAST Search
The BLAST analysis is based on Altschul, et al, J. Mol. Biol. 215(3):403
(1990). You can compare your query sequence to the universe of other
sequences and ask if there are any other sequences related to yours. The
BLAST analysis is designed for speed and the results are returned with a well
defined statistical interpretation. The BLAST server is located at <http://
www.ncbi.nlm.nih.gov/BLAST/>.
The query popup allows you to choose the database to be searched. Figure
Figure 4.45: BLAST DNA search
4.45 shows the dialog for the nucleic acid BLAST search. The Query popup
Page 4-47
Analyses
menu allows you to define the database that is to be searched. Align best
matches will, in addition to a list of top matches, present a number of alignments of these top matches. Filter out low complexity matches will perform filtering as described on the BLAST web site – it basically removes
matches with sequences that occur frequently in the database. These may or
may not be important to your search. Matrix is currently not use in nucleic
acid blast searches. The Number of hits to keep determines how many
matches are returned to you.
Once you start the analysis, a new object is placed into your notebook. When
results are returned, your web browser will automatically open to display
those results. The object in your notebook can be used to launch another
BLAST search with the same parameters in the future.
Protein Analyses
The analyses discussed in this section all deal with proteins. One aspect that
many of the analyses share is the ability to view the output using median
sieving instead of the more common sliding window mean. This powerful
alternate calculation method is discussed in “Median Sieving (Data-Sieving)”,
page 4-11.
Accessible Surface Area
This analysis is based on values in Janin [Nature 277:491 (1979)] which
determined the surface accessibility of amino acids. The ratio of buried to
accessible values in the paper (Table 1, column 4) were converted to the
fraction accessible for this analysis. This analysis is identical to the Antigenicity analysis using the Janin table. The setup panel is shown in Figure 4.46,
page 4-49. This is a typical sliding window analysis (“Sliding Window”, page
4-68) that presents a property of the peptide as a function of position along
the peptide sequence. The output is shown in Figure 4.47. This plot indicates
that segments around 170 and 220 are not very accessible, while the segment at about 250 is accessible. Surface accessibility is thought to be related
to the antigenicity of the segment of the peptide.
Page 4-48
Analyses
Figure 4.46: Accessible Surface Area Setup
Figure 4.47: Accessible Surface Area Output
Align 2 Sequences (Global)
This routine will provide the best alignment between two sequences using
their entire lengths (a global alignment). Alignment parameters can be
Page 4-49
Analyses
defined for matching, mismatching, inserting a gap, and extending a gap. This
routine is best used for aligning two sequences that are known to be related
closely, like two globins. Penalties for “end gaps” are optional and a Z-score
can be calculated to determine how significant the alignment is. See the
nucleic acid section “Align 2 Sequences (Global)”, page 4-16 for more information about Z-scores, end gaps, and other parameters.
One difference between the protein and nucleic acid global alignments is the
existence of several well defined scoring tables for protein alignments that are
based upon evolutionary models. These tables are called PAM and BLOSUM
tables.
The PAM tables were derived originally from the data of Dayhoff, et al. [in
“Atlas of Protein Sequence and Structure”, vol 5 supplement 3, ed. M.O.
Dayhoff, NBRF, Washington D.C., (1978), p345]. A number of sets of
closely related proteins were examined to determine the frequency of change
of one amino acid into another amino acid during evolution. Based on the
number of changes observed in these closely related proteins, a procedure
was developed to estimate how many changes could be observed over larger
evolutionary distances, where successive changes might occur at the same
site in a protein sequence. A PAM1 table is a table of probabilities that one
amino acid will be converted to another amino acid given a single change per
100 amino acids in the protein. Since this is a probability table, comparisons
accepting 40 point mutations per 100 amino acids can be obtained by multiplying the PAM1 matrix by itself 40 times to give the PAM40 matrix. The
Gene Inspector provides PAM tables of PAM40, PAM120, and PAM250. It is
actually possible to recognize sequences that are related even after 250
amino acid changes for every 100 amino acids in the sequence! Sequences
Table 22: PAM Values vs. % Change in Sequence*
Evolutionary Distance
in PAMs
Observed Percent
Difference
1
1%
5
5%
Page 4-50
Analyses
Table 22: PAM Values vs. % Change in Sequence*
11
10%
17
15%
23
20%
38
30%
56
40%
80
50%
112
60%
159
70%
246
80%
*. This table is from “Molecular Sequence Comparison
and Alignment” by J.F. Collins and A.F.W. Coulson
in “Nucleic Acid and Protein Sequence Analysis: A
Practical Approach”, ed M.J. Bishop and C.F. Rawlings, IRL Press, Washington, D.C.(1987), p323.
closely related should be compared using lower value PAM tables, while the
higher value PAM tables should be used to compare more distantly related
sequences. As shown in the table above, as more mutations are allowed to
accrue they recur in the same position so that at a PAM246 (246 mutations
per 100 residues), only 80% of the amino acids in the sequence are altered.
The remaining 20% are enough to recognize sequences as having some
degree of similarity.
A different set of tables are the BLOSUM tables [S. Henikoff & J.G. Henikoff,
Proc. Nat. Acad. Sci. USA 89:10915 (1992)]. The BLOSUM tables are
based on blocks of aligned sequence segments from over 500 groups of proteins known to be related. It has been demonstrated that BLOSUM62 provides one of the best ways to compare sequences and yields results superior
to comparisons using the PAM matrices [Henikoff & Henikoff, Proteins 17:49
Page 4-51
Analyses
(1993)]. BLOSUM tables have proven to be more accurate than projecting
similarities of distantly related proteins based on known similarities of closely
related proteins, which is how the PAM matrices were developed. In general,
it is best to start off using a BLOSUM62 matrix for your comparisons. As with
the PAM tables, the closer related the sequences are the lower value BLOSUM table you should use. Sequences that are more distantly related should
be compared using higher value BLOSUM tables.
The output from this alignment is shown in Figure 4.48. In this instance,
Figure 4.48: Global Sequence Alignment
alignment indicators are shown and indicate regions of highest similarity.
Align Multiple Sequences
The parameters for this analysis are similar to those in the section on multiple
sequence alignments in nucleic acid sequences (page 4-20) and are discussed in detail in “Multiple Sequence Alignments”, page 3-10. The only difference between running a multiple sequence alignment as a sequence
analysis (Analysis ?New analysis…) and initiating the multiple sequence alignment
within a sequence editor is the way in which you are allowed to choose
sequences for the analysis. Doing a multiple sequence alignment as an analysis will let you choose to align any number of sequences from any number
of sequence files. Running the alignment from within the sequence editor only
works on the entire set of sequences in the sequence editor document – you
Page 4-52
Analyses
Figure 4.49: Amino Acid Composition Setup
can not add any additional sequences nor can you use a subset of the
sequences in the sequence editor document.
Amino Acid Composition
The amino acid composition analysis determines the number (or percentage)
of each amino acid in the peptide(s) being analyzed. The setup panel is
shown in Figure 4.49. Results can be displayed either as a histogram or a
table and can be shown as a raw number or as a percentage of the number
Figure 4.50: Amino Acid Composition Output
of amino acids in the peptide (Figure 4.50). The table output lists the results
as both an amount and a percentage (not shown).
Page 4-53
Analyses
Antigenicity
There are six Antigenicity Analyses available in the Gene Inspector. In general, these analyses are based on the likelihood of a given domain of a peptide residing on the surface of the peptide. The analysis is a standard sliding
window analysis (“Sliding Window”, page 4-68) in most cases. The following
tables are available for use in the Antigenicity analysis: Emini, et al. (page A1); Hopp and Woods (page A-2); Janin (page A-3); Parker, et al. (page A3); Thornton, et al. (page A-4); and Welling, et al. (page A-4). Each of
these tables were created by the authors based on different physical properties of amino acids and peptides.
CF Structure Prediction
This analysis uses the algorithm originally developed by Chou and Fasman
[ Biochemistry 13:222 (1974); J. Mol. Biol. 115:135 (1977)] and later
updated [in “Prediction of Protein Structure and the Principles of Protein Conformation”, ed. G.D. Fasman, Plenum Press, New York, 1989, p391]. Unlike
the GOR algorithm (“GOR Structure Prediction”, page 4-58), this approach
looks for nucleation sites to start the formation of alpha helical, beta sheet, or
turn structures and then tries to extend the structure from the nucleation site.
There are no parameters to be entered by the user for this analysis.
One view of the output is shown in Figure 4.51 on page 4-55. There are
three plots indicating the probabilities of being alpha, beta, or turn structures.
These three plots are used to calculate the structures predicted in the bottom
part of the analysis output object. The blocks in lower part of the figure indicate the predicted structures. After targeting the object, you can view the output as a “Squiggles” plot instead of a graph. In the squiggles plot, any
segment of the protein not being defined as alpha, beta, or turn is called a
coil. This will give you an output similar to that for the GOR analysis, Figure
4.56, page 4-59.
Dot Matrix
A dot matrix analysis is used to compare two sequences for regions of similarity. The result is a two dimensional plot indicating graphically the regions of
Page 4-54
Analyses
Figure 4.51: Chou-Fasman Structure Prediction
similarity between the two sequences. Scoring tables can be used to specify
similarity criteria. The setup and output are discussed in detail in the nucleic
acid section on “Dot Matrix”, page 4-26. Protein scoring tables can play a
significant role in defining your output. These tables are discussed in “Align 2
Sequences (Global)”, page 4-49.
Find Repeats
This analysis will search peptide sequences for repeats of any defined length.
The repeats can have some mismatches and the maximum distance between
the two parts of the repeat can be specified. See the nucleic acid analysis
“Find Repeats”, page 4-34 for more details. This analysis can be run as a
summary analysis. See page 4-32 for more details.
Page 4-55
Analyses
Find Sequence
This allows you to define a query sequence and find it in a target peptide.
The query sequence can be in multiple parts and each part can be allowed to
have up to a user defined number of mismatches. The minimum and maximum distance between any two parts of the query sequence can also be
specified. Results are presented graphically or as a table. See “Find
Sequence”, page 4-34 for more details. This analysis can be run as a summary analysis. See page 4-37 for more details.
Find Sequence (Prosite-style)
This powerful search routine uses the Prosite language to define a query
sequence. Very sophisticated query strings can be constructed to design a
Figure 4.52: Find Sequence (Prosite style) Setup
very precise search. This analysis is not the same as searching the Prosite
database for matches with a given peptide sequence (see “Prosite Motif
Search”, page 4-64). IIt is an alternative to the Find Sequence analysis. The
setup is shown in Figure 4.52. In this setup panel you can define query
sequences using the language shown in the window [see also Prosite Language Definitions (page A-5)].n the example shown here, the search is for
Page 4-56
Analyses
Figure 4.53: Find Sequence (Prosite Style) Graphic Output
[RKDE](2,5). This means that we are looking for a stretch of 2 to 5
charged amino acids (Arg, Lys, Asp, Glu). As the other examples given in
this window illustrate, you can be very specific in your search criteria. As
shown in Figure 4.53, the output indicates positions of the matches.
By choosing Object ?View As Table you can see the positions as shown in Figure
Figure 4.54: Find Sequence (Prosite style) Table Output
4.54. The query sequence is shown at the top of the second column and
every subsequent line shows a match with that query sequence.
This analysis can be run as a summary analysis. See page 4-37 for more
details.
Page 4-57
Analyses
GOR Structure Prediction
The GOR analysis is based on the paper by Garnier, Osguthorpe, and Robson [J. Mol. Biol. 120:97-120 (1978)] which describes a method of predicting protein secondary structure using statistical measures. Standard output is
Figure 4.55: GOR Output as Graph
shown in Figure 4.55. The accuracy of this structure prediction algorithm is
on the order of 60-65% (as is true for the Chou-Fasman algorithm, page 454) so you should interpret the predicted structures with some caution. Targeting this object and choosing Object ?View As Squiggles will show you Figure
4.56, page 4-59. This is a representation of the structure prediction in a different way. You can change back to the graph view by choosing Object ?View As
Graph.
At the bottom of Figure 4.56, page 4-59 is a legend. You can use this legend to change the appearance of the squiggles plot. First, target the output
object by double-clicking on it. Now click on one of the legend items, for
Page 4-58
Analyses
Figure 4.56: GOR Output as Squiggles
example the beta label. Once the label is selected, you can make changes to
the line thickness, color and pattern using the items under the Format menu.
You can also change the font and size of the legend text. Any changes you
make will be reflected in the drawing of the squiggles plot. The squiggles and
the graph plots indicate the same information about the sequence.
Helical Wheel
The helical wheel analysis projects a view of a peptide segment looking down
the axis of an alpha helix. The distribution of side chains, which stick out from
the helix axis, is readily apparent in this view. This analysis is described by
Schiffer & Edmundson [Biophys. J. 7:121 (1967)]. The setup panel is shown
in Figure 4.57, page 4-60. The only information you need to supply here is
the table to be used in calculating the properties of the side chains. The output for this analysis on lamprey rhodopsin amino acids 230-250 is shown in
Figure 4.58, page 4-61. Notice that since the analysis is meant to look down
an alpha helical segment of a peptide, you should limit the segment length
you are examining to a reasonable size for an alpha helical structure – perPage 4-59
Analyses
Figure 4.57: Helical Wheel Setup Panel
haps by first running a Chou-Fasman (page 4-54) or GOR (page 4-58)
analysis on the peptide to determine α-helical regions. Although the output for
a helical wheel analysis on a whole sequence might look impressive, it will
not convey much in the way of useful information. The diameters of the spots
indicate the degree of hydrophobicity or hydrophilicity. Using the Object menu
you can choose to show or hide the legend, the guide circles, or numbering
of the amino acid positions. This particular example uses the Kyte and Doolittle values to indicate hydrophobic and hydrophilic amino acids.
When you make up your own tables, the text you enter into the minimum and
maximum fields will be displayed as the labels for this plot and others.
Hydropathy
Hydropathy analyses, in general, examine peptide sequences for regions of
hydrophobic and hydrophilic residues using a sliding window approach (page
4-68). The Gene Inspector offers ten different types of hydropathy analyses
based on tables of values from various authors. As shown in Figure 4.59,
page 4-61 you can use a popup menu to define which table you would like to
use. As each table is chosen, you will see a text description of the table in
Page 4-60
Analyses
Figure 4.58: Helical Wheel Output
Figure 4.59: Hydropathy Analysis Setup Panel
the “About the analysis” box. In addition to any tables you might create, the
standard supplied tables are: Bull & Breese (page A-1); Engelman & Steitz
Page 4-61
Analyses
(page A-1); GES or Engelman, et al. (page A-2); Fauchere & Pliska (page
Figure 4.60: Hydropathy Analysis with Median Sieving
A-2); Hopp and Woods (page A-2); Kyte and Doolittle (page A-3); Manavalan & Ponnuswamy (page A-3); Sweet and Eisenberg (page A-3); von Heijne (page A-4); and Wolfenden, et al. (page A-4).
A sample output from a Hydropathy analysis is shown in Figure 4.60, page
4-62. As labeled, this analysis was done using the Kyte and Doolittle table.
The top part of the figure shows the standard analysis output using a sliding
mean, while the bottom plot is an analysis of the same data but using median
sieving (page 4-11). Median sieving can be applied to any of the sliding window analyses by choosing Object ?Apply Sieving…. The median sieving will often
resolve peaks that can not be resolved by any other method.
Hydration Potential
The Hydration Potential analysis is a sliding window analysis based on the
Page 4-62
Analyses
free energy of transfer between vapor phase and solution for amino acid side
chain analogs. [Wolfenden, et al., Science 206:575-577 (1979)]. The
higher the hydration potential, the more likely it is that a particular region of
the peptide will be on the outside of the peptide (is hydrophilic). This analysis
is identical to the Hydropathy analysis using the Wolfenden table.
Membrane Buried Regions
The Membrane Buried sliding window analysis is based on the statistical distribution of specific amino acids in membrane vs. non-membrane segments
for a sample set of proteins [Argos, et al., Eur J. Biochem. 128:55 (1982)].
The analysis is identical to a Transmembane Helix analysis using the Argos
table [Argos, et al. (page A-1)].
Optimal Matching Hydrophobicity
The Optimal Matching Hydrophobicity analysis is a sliding window analysis
based on data from Sweet & Eisenberg, [J. Mol. Biol. 171:479 (1983)]. This
table of data is derived by correlating data from a number of other hydropathy
tables and from observed amino acid replacement rates. This analysis is
identical to a Hydropathy analysis using the Sweet & Eisenberg table.
pH/pI
The pH/pI analysis presents the charge on a peptide as a function of pH.
There are no parameters to enter in the setup panel. The output is shown in
Figure 4.61, page 4-64. Total positive charge, total negative charge, and net
charge are each plotted as a function of pH. The exact pI can be obtained by
selecting this object and choosing Notebook ?Get Info…. You can customize the
output by targeting the plot and then selecting the legend item you wish to
modify. Once the legend item is selected, you can change its color, font, and
pattern by using the various options available under the Format menu.
Physical Characteristics
This analysis calculates a number of physical properties of the selected peptides. There are no user definable parameters in the setup panel. The results
Page 4-63
Analyses
Figure 4.61: pH/pI Output Plot
Figure 4.62: Physical Characteristics Output
are shown in Figure 4.62.
Prosite Motif Search
This analysis will search through the Prosite database of sequence motifs for
any sites that might be present in the protein(s) you have chosen to be analyzed. The setup panel is shown in Figure 4.63. Protein recognition sites with
known functions are included in this comprehensive database, which is broken into a number of categories. Clicking with the mouse on an item in the
Page 4-64
Analyses
Figure 4.63: Prosite Setup Panel
Figure 4.64: Prosite Graphical Output
list will place a check mark next to that category. All checked items will be
searched.
The results are shown in Figure 4.64. The site names are on the left and
vertical tick marks along the horizontal lines are used to identify the locations
of sites. A row can be selected by clicking with the mouse after targeting the
object (as shown for CAMP_PHOSP in Figure 4.64, page 4-65) and the
information about the motif obtained by choosing Object ?Get Info About Selection….
This brings up Figure 4.65, describing what is known about the particular
motif. You can also view the output as a table by choosing Object ?View as Table
when the output is targeted. This is shown in Figure 4.66. The position of the
Page 4-65
Analyses
Figure 4.65: Prosite Get Info About Selection…
match is indicated as the first amino acid of the query sequence and the
matching sequence is shown at each position. Notice that the query sequence
Figure 4.66: Prosite Tabular Output
is shown for each site using the Prosite language [see Prosite Language
Definitions (page A-5) and Figure 4.52, page 4-56].
If you want to refer to PROSITE in a publication you can do so by citing: Bairoch A. and Bucher P., “PROSITE: recent developments”, Nucleic Acids Res.
22:3583 (1994).
Page 4-66
Analyses
Protein Cleavage
Proteins can be cleaved by a variety of chemical and enzymatic treatments.
This analysis displays either cut sites or recognition sites for treatments chosen from a list. The setup panel, shown in Figure 4.67, is similar to the one
Figure 4.67: Protein Cleavage Setup
for restriction enzyme digests of DNA (page 4-42). The sites that are used in
this analysis are listed in the Appendix in Protein Cleavage Sites (page A-6).
The output can be displayed either graphically or as a table and is similar to
the restriction enzyme digest output (Figure 4.39, page 4-43).
Protein Interior
This sliding window analysis uses data from Engelman and Steitz [ Cell
23:411 (1981)], which indicates the likelihood that an amino acid will lie in
the interior of a protein. This analysis is identical to a Hydropathy analysis
using the Engelman and Steitz table.
Side Chain Flexibility
This analysis uses the algorithm of Karplus & Schultz (Naturwissenschafter
72:212 (1985) which examines the side chain flexibility of a peptide segment.
Page 4-67
Analyses
The flexibility is an indication of antigenicity. Flexibility of peptide segments
were determined by examining crystal structures of 31 different proteins.
Signal Sequence
This is a type of sliding window hydropathy analysis designed to reflect
regions of a sequence that have potential for lipid-protein interactions. It is
best used to examine membrane proteins and signal sequences on peptides.
The analysis is based on values from von Heijne [Eur. J. Biochem. 116:419
(1981)]. The Gene Inspector does not limit matches to amino terminal ends
of proteins, but will find matches in any location along the peptide.
Sliding Window
A sliding window analysis scans along the length of a sequence and evalu-
Figure 4.68: Sliding Window Setup
ates the residues for a specific property. The property being determined is
based on the values in a user defined table. Thus, the analysis displays a
property of a peptide as a function of position along the length of the peptide.
The setup panel is shown in Figure 4.68 on page 4-68. In this case, a table
containing a value of 1 for each charged amino acid and 0 for all other amino
Page 4-68
Analyses
acids is being used. Output is shown in Figure 4.69 on page 4-69. The analysis examines a number of adjacent amino acids and calculates a value for
this “window” in the sequence. This value will be plotted. The window is then
moved along the sequence by one character and a new value calculated and
plotted. This is repeated until the end of the sequence is reached. In this particular case, the charged amino acids appear to be clustered in Lamprey rhodopsin.
Figure 4.69: Sliding Window Output
Side Chain Protrusion
This sliding window analysis is based on Thornton, et al. [EMBO J. 5(2):409
(1986)]. The values used are based on the protrusion of the alpha carbons
from a protein’s globular surface using values from x-ray diffraction studies.
This analysis is identical to running an Antigenicity analysis using the Thornton table.
Surrounding Hydrophobicity
This sliding window analysis is based on data from Manavalan & Ponnuswamy [Nature 275:673 (1978)]. This data indicates the likelihood that any
given amino acid will be surrounded by hydrophobic amino acids. Values in
Page 4-69
Analyses
Table 1, col 2 of the paper were “standardized” to glutamine as suggested by
the authors. This analysis is identical to a Hydropathy analysis using the
Manavalan & Ponnuswamy table.
Temperature Factor
This sliding window analysis is based on atomic mobilities (also called temperature factors) for amino acids in proteins whose structure is known through
x-ray diffractions studies. It is a good indication of antigenicity. See Tainer, et
al., Nature 312:127 (1984).
Transmembrane Helices
Transmembrane helix analyses are designed to identify hydrophobic alpha
helical or beta regions of proteins that are likely candidates to be membrane
spanning domains. This sliding window analysis uses the following tables of
values: Argos, et al. (page A-1), Eisenberg, et al. (page A-1), and Engelman,
et al. (page A-2). The best window size to use for a membrane spanning
domain is 19-20 amino acids.
BLAST Search
For information on using this analysis, see the DNA BLAST discussion on
page 4-47. The only difference is that you will need to choose a comparison
table (a “matrix” to use for scoring the matches in the database.
Page 4-70
The GI Notebook
Chapter 5
The GI Notebook
Overview of the GI Notebook
The Gene Inspector Notebook can be used the same way an ordinary paper
lab notebook can be used – for notes about experiments that are being done,
to record ideas you might have for future research, to paste in the results of
current experiments, and to discuss those results.
But the GI Notebook does a great deal more than your paper notebook. In
addition to serving as a container for GI analysis output, the GI Notebook can
be used to archive information and analysis results, and to design and print
posters and illustrations. Aids to navigation, such as bookmarks and aliases
allow you to maintain notes pertaining to several projects in the same notebook and to cross-reference them through hypertext links. Appendices allow
large amounts of data to be stored and retrieved without interfering with the
flow of discussion in the GI Notebook.
Text is entered into the GI Notebook by typing just as in a word processor.
The text can be formatted by choosing Font, Style, Size, Color, and Justification
submenus under the Format menu. Rulers and tabs behave in the standard
way (see Figure 5.1, page 5-2). Just drag a tab out of the tab icon in the
ruler to a location along the ruler at which you want the tab to reside. You
can specify left, right, center, and decimal tabs. The Gene Inspector displays
the whole notebook sheet so you can see what the actual output will look
like. You can choose to show (or hide) text margins, printable area, and page
breaks using the Notebook ?Display… ?Set Display Preferences… dialog shown in Figure 5.2, page 5-3. Using this dialog, you can decide which “adornments” to
show and also define the color to use for each border. None of these adornPage 5-1
The GI Notebook
ments will be printed.
Figure 5.1: GI Notebook Window
Conditional Text
One interesting capability available in the Gene Inspector is called Conditional
Text. It is available under Format ?Style ?Conditional Text. Conditional text (which
can be shown or hidden) is embedded in the normal notebook background
Page 5-2
The GI Notebook
text. It can be used for keeping notes that you might not necessarily want to
print out but would like to keep available for viewing on screen. You can also
Figure 5.2: Notebook Display Preferences Dialog
use it for detailing extra information about posters or slides you are making.
For example, you might have designed a diagram with some text to use in
making a slide, but would also like to keep some extra comments about the
figure for storage in the notebook or for printing as lecture notes. You can
create the extra notes and then define them as conditional text. When you
want to print your slide, hide the conditional text. When you want to view (or
print) your notes, show the conditional text. Conditional text might also be
useful for discussions that you want to record, but which might not be germane to the section of the notebook in which the comments reside. You
might also think of conditional text as “Post-It” notes that can be hidden.
Style Sheets
Once you have formatted a bit of text in a way that you might like to use
again at a later time (font, size, color, style), you can create a style sheet
corresponding to the styled text. The style sheet contains information about
text characteristics and can be applied to any other selected text. To create a
style sheet, select the text containing the style you wish to use (it can be as
small as a single character) and then choose the Format ?Style Sheet ?Add Style
Sheet… menu option. You will be asked to provide a name, which will then be
added to the Format ?Style Sheet menu. To use the style sheet, just select the
text you want to style and choose the style from the Format ?Style Sheet menu.
Style sheets can also be used to entirely define the style of output objects,
including axis format. This is covered in Tutorial 10: “Creating and Using Style
Sheets”, page 2-38.
Page 5-3
The GI Notebook
GI Notebook Layout
The GI Notebook consists of a number of “sheets”. They are called sheets
and not “pages” to distinguish them from printer pages. Sheets can be of any
size you care to define and are not limited to multiples of printer page sizes.
This allows you to define a size like 16 x 20 inches which might be convenient for posters, or define a notebook size that exactly fits your computer
screen. You can specify the layout of the GI Notebook using the Notebook ?Layout… menu. The Layout dialog box is shown in Figure 5.3. There are several
Figure 5.3: Notebook Layout Dialog
sections to this dialog. Note that the box on the top right contains a graphic
indicating the layout of the text in the GI Notebook. The dashed line down the
center of this area in the figure shows a printer page break and the gray area
on each printer page indicates the available area for text. The line around the
border of the sheeta indicates the available printable area for the currently
selected printer. This particular layout is called a side by side layout, as chosen in the Notebook layout style box at the top left. The Poster layout size
box allows you to set dimensions that might be appropriate for designing
posters. The number of columns of text and the margins can be set in the
a.
The printed area is defined by using File ? Page Setup dialog.
Page 5-4
The GI Notebook
Columns box and Margins box, respectively.
You can change these settings even after you have entered text and objects
into the GI Notebook. The text will re-wrap around any objects and the
objects will be placed appropriately on the sheet.
The Save as default page layout button in the bottom left of the dialog
allows you to save the current configuration for notebook layout (as defined in
this window) as the default configuration for all new GI Notebooks that you
create.
Note that after making changes in the layout parameters, you need to click in
the box in the upper right to see the new layout as a graphic view. Clicking in
that area tells the program to update the display. This is necessary to prevent
the display from updating automatically after you enter each parameter and
before you have completely redefined the new layout.
Bookmarks
Bookmarks are designed to help you navigate to different locations within the
GI notebook. GI bookmarks function in the same way that paper bookmarks
function – you can use them to mark specific locations in the GI Notebook.
Each bookmark is anchored to its location in the notebook by being attached
to a notebook object – any object can have a bookmark attached to it.
To create a bookmark, select an object to use as the anchor for the bookmark and then choose Notebook ?Bookmarks ?Attach Bookmark…. You will be asked
to name the bookmark. Once the bookmark is named, it will appear in the
Bookmarks submenu with its own name. Simply choosing the bookmark from
the Bookmarks menu will take you to that location in the notebook. This is illustrated in Tutorial 19: “Using Bookmarks in the GI Notebook”, page 2-62.
One useful approach for using bookmarks is to create a bookmark graphic
object using the drawing tools in the notebook. This might be a rectangle of a
specific color or pattern. We have provided you with a default graphic object
named “bookmarker” as a tool extension (“Tool Extensions”, page 5-17). To
use this object as a bookmark, just place the “bookmarker” object on the
Page 5-5
The GI Notebook
page and attach a bookmark to it. You can also paste in pictures from other
applications that could serve as a bookmarker icon.
You might want to attach bookmarks to locations that you refer to often, perhaps a restriction map or database search list.
GI Notebook Objects
In addition to the descriptive background text which can be used for storing
comments about experiments and discussing results, several different kinds of
objects can be placed into the GI Notebook. Objects can be pasted in from
other programs, can be generated as analysis objects by the Gene Inspector
itself, or can be drawn using the drawing tools in the Gene Inspector. All GI
Notebook object share some properties and behaviors. These common features are discussed first, followed by a description of each of the GI Notebook
object types.
Selecting vs. Targetingb
Clicking once on an object makes it the selection and causes the appearance
of eight “handles” (little boxes) around the edges of the object, as shown in
Selected Object
Targeted Object
Figure 5.4:Selection vs. Targeting
the left part of Figure 5.4 on page 5-6. You can resize the object using these
handles in the same way you would within a drawing program. Click and drag
a handle to change the size of the object. An object can be moved on a page
once it is selected simply by clicking inside the object with the mouse and
dragging it.
Many GI Notebook objects can also be edited. Double-clicking on an object
b.
This is also discussed in “Selection vs. Target”, page 2-1.
Page 5-6
The GI Notebook
makes it the target and causes the appearance of a gray border around the
object as shown in the right of Figure 5.4. Once an object is targeted, you
can edit component parts of the object. This might mean changing the font,
color, or pattern of an axis label, but might also mean editing the text of a
table, changing the color of a plot, changing the line thickness of a squiggles
plot, or changing the parameters of an analysis object and recalculating the
analysis.
The difference between making an object a selection or a target is important.
The terms are specific and will each allow you to perform a set of specific
operations on the object.
Drawing Tools
Graphics can be drawn directly in the GI Notebook using the drawing tools
provided under Notebook ?Tools. A palette of the Tools is shown in Figure 5.5,
Figure 5.5: The Tools Palette
page 5-7. The tools palette can be accessed directly from the Notebook menu
. Any tool extensions you may have added will be available in the Tool
Extensions menu (see “Tool Extensions”, page 5-17). The tool extension
shows up in the bottom part of the palette when the name of the extension is
selected in the popup menu.
Once a graphic object is drawn, its color, line thickness, and fill pattern can
be set using the Format menu. As in all standard drawing programs, first select
Page 5-7
The GI Notebook
an object and then choose the operation to be done on the object using the
Format menu – only appropriate menu items will be enabledc.
Graphic objects that you draw can be framed using the Format ?Frames menu
(see “Framing GI Notebook Objects”, page 5-8). By framing a simple graphic
object, you can produce such effects as a red rectangular frame around a
blue rectangle filled with a pattern of lines. You can make the rectangle which
is being framed have a 0 width border (use Format ?Lines ?Pick Line Width…) so the
frame will appear to be the border of the rectangle because it is the only visible line around the object.
Multiple objects can be grouped and manipulated as one by using the Notebook ?Arrangement ?Group menu item. Once objects are grouped they can be
handled as a single object but individual components of the grouped object
cannot be edited individually. To edit the components of a grouped object,
you must first ungroup the object by choosing the Notebook ?Arrangement ?Ungroup
menu item.
Preferred Size for Objects
When an object is first created or placed into the GI Notebook it will appear
at a specific size which is called the preferred size. The preferred size dimensions are stored with the object so that if the object is resized, it can always
be returned to its preferred size. To return an object to its preferred size, use
the Notebook ?Arrangement ?Restore Preferred Size menu item. The preferred size for
an object can be set to the size the object currently has by selecting the
object and then using the Notebook ?Arrangement ?Save Preferred Size menu item.
Framing GI Notebook Objects
Any GI Notebook object can have a graphic frame placed around it. To create
a frame, first select the object and then select the Format ?Frames ?Edit Frame…
menu itemd. You will see the dialog shown in Figure 5.6. Frames can contain
up to three concentric framing rectangles. For each framing rectangle that is
c.
Note that these simple objects cannot be targeted (“Selecting vs. Targeting”, page 5-6)
because there are no internal components to be edited.
Page 5-8
The GI Notebook
Figure 5.6: Graphic Frames Dialog
part of the frame, you can define the line thickness, pattern, and color using
the Format menu as indicated in the figure. To edit the properties of the inner
frame, click once on the line next to the inner frame text (to select the line)
and then make changes using the Format menu. The middle and outer frame
lines can be set the same way. The Drop Shadow thickness, color and pattern can be set using the Format menu once you have selected the line next to
the Drop Shadow text. You can also define the space between any two of the
framing rectangles (a gap).
Frame definitions can be added to the menu by selecting a framed object and
choosing Format ?Frame ?Add Frame To Menu…. A frame can be applied, by selecting
an object and choosing the desired frame to be applied using the Format ?Frame
submenu.
Simple frames, such as a 1 pixel wide black border, can serve to separate an
analysis output object or a user table from the surrounding text. When an
object is resized, the frame stays with it and resizes appropriately. You can
also use frames to create rectangles that have a different “fill” color and pattern from the border color and pattern.
d.
Even though there is no visible frame around the object to start with, you can actually
think of this as being an object with a frame having zero width lines. The menu item
allows you to edit this (invisible) frame.
Page 5-9
The GI Notebook
Text Flow Around Objects
Background text will flow around objects in the GI Notebook. You can specify
exactly how the text will flow around an object by first selecting the object and
then using the Notebook ?Text Flow submenu item. The available options are:
• Flow Through – text does not recognize that an object is present and overwrites the whole width of the text column – completely running through the
object.
• Both Sides – text “jumps across” the object and is placed on both the right
side and the left side of the object.
• Left Side – text only will be placed to the left side of the object
• Right Side – text only will be placed to the right side of the object
• Widest Side – text only will be placed to the side of the object that has the
greatest distance between the object and the border of the text column. If
the object is moved, the text will flow only to the widest site.
• Neither Side – text is not placed on either side of the object and “jumps”
from above the object to below the objects.
Figure 5.7: Setting Text Standoff Distance
can be used to set the number of pixels that
will be maintained between the object and the surrounding background text –
both vertically and horizontally, as shown in Figure 5.7, page 5-10.
Notebook ?Text Flow ?Set Text Standoff…
Aligning Objects
When more than one object is selected in the notebook (by shift-clicking, for
example) it is possible to align the selected objects by using the Notebook ?
Arrangement ?Align Objects… menu item. This presents the dialog shown in Figure
5.8. Objects can be aligned vertically and/or horizontally and can be made to
have the same height and/or width. Aligning objects is also discussed in
Tutorial 7: “Aligning Analysis Objects”, page 2-31.
Page 5-10
The GI Notebook
Figure 5.8: Align Objects Dialog
Getting Information About Objects
Each object in the GI Notebook has information associated with it. Different
objects may contain different amounts of information associated with them. At
the very minimum, each object can have a name and textual information
associated with it. The information is viewed by selecting the object and then
choosing the Notebook ?Get Info… menu item. A Get Info box for an Antigenicity
Figure 5.9: Get Info Dialog
analysis is shown in Figure 5.9, page 5-11. For analysis output objects like
this one, you can see the analysis name, the sequence analyzed, and information about any table used in the analysis. Comments can be typed directly
Page 5-11
The GI Notebook
into the Comments box and the Title can be changed by typing in the Title
box.
Text Objects (Sidebar Text)
Text objects are separate text boxes into which you can type text. This text is
separate from the background text, will not flow with the background text, and
represents a separate GI Notebook object. These kinds of objects are sometimes called sidebar text in other programs. To create a text object, select the
“T” tool from the Notebook ?Tools menu (Figure 5.5, page 5-7), and use the
mouse to drag a rectangle in the GI Notebook corresponding to the area into
which you want to type; let go of the mouse button and then type in the text.
Text objects are useful for creating titles for figures or titles for whole GI
Notebook sheets. They can span multiple printer pages and can serve as
titles for multiple columns of text. Text objects can also be used to annotate
specific figures with descriptive text – this avoids the possible problem of having text describing a figure move when you edit background text. Text objects
will remain at the same location on a GI Notebook sheet, just like other GI
Notebook objects, even if the background text is edited.
Table Objects (User Tables)
The Gene Inspector can create Tables in the GI Notebook. To do this,
choose the table tool (Figure 5.5, page 5-7) and then either click in the GI
Notebook at the location you wish to insert the table or drag a rectangle to
contain the table. If you just click in the GI Notebook (rather than drag), you
will be prompted to enter the number of rows and columns to use in the new
table. If you drag to create a table, you will see an indication of the number
of rows and columns being created as you drag the mouse to enlarge the
table size. In either case, the table size can be altered after it is created by
using the Table menu that appears when a table is the target.
A GI Notebook table is shown in Figure 5.10. Values have been entered into
each of the cells in the table and correspond to the amount of radioactivity in
a transcription reaction at different NaCl concentrations. Using the Format
Page 5-12
The GI Notebook
click here to select row headers
click here to select column headers
column headers
row headers
Figure 5.10: A User Table
menu, it is possible to set the justification, style, size, color, and numeric format for any item in the table. Column headers are the cells at the top of each
column; row headers are the cells at the left of each row. By clicking at the
locations indicated in Figure 5.10 in the top left corner of the table, you can
select either all the column headers or all the row headers to set their text
properties.
Tables may be useful for listing lanes in an electrophoresis gel, recipes for
buffers, results of assays, or other data you want to format as a table. You
might also want to create tables containing buffer recipes and then place the
tables into appendices (see “Appendix Objects”, page 5-16). This will allow
the buffers to be recalled at any time from any location in the GI Notebook.
Once a table is created, you can shrink the size of the table object to a size
smaller than the space required by the table columns and rows. To do this,
select the table (click once with the mouse on the table object) and then
resize it by dragging one of the object’s handles with the mouse. This is useful for very large tables. To view information in the table that is “cropped” out
of the viewing area hold down the option key, and drag the mouse to scroll
the table cells within the table object area. Note that with the option key held
down, the mouse cursor turns to a hand, indicating that you can “push” the
Page 5-13
The GI Notebook
table around. You can also open the table for editing (see “Open for Editing”
in the next section).
Copying and pasting can be used to transfer tables of information between GI
and other applications. User Tables can be targeted and the values copied as
tab delimited text. This can be pasted into other applications that can receive
such text. Conversely, you have tab delimited text in the clipboard, it can be
pasted into a GI table. To do this, just target the table and select the table
cell you with to make the top left corner of the new values to be pasted in.
Choose Paste to place the clipboard values into the table starting at that location.
In addition to simply dragging the divider line between two columns to adjust
the column width, two special commands can be used to adjust the width of
all table columns simultaneously. Holding down the option key while dragging
the divider line between columns will change the widths of all table columns
by the same amount. Holding down the shift key while dragging the divider
line will adjust all columns to the same width as the column just to the left of
the selected divider line.
Open for Editing
Any of the analysis output objects in the GI Notebook can be opened in a
separate window for editing. This provides you with scroll bars and other
Figure 5.11: Open For Editing
Page 5-14
The GI Notebook
capabilities that are not available for the object within the notebook itself. This
is done by selecting the output object and then choosing Notebook ?Open For Editing…. An example is shown in Figure 5.11, which shows the Transmembrane
Helix analysis from the Sample Notebook. Note that the analysis is placed in
a separate window and the original object in the notebook is not visible as an
analysis, but is labeled with text indicating the name of the analysis which is
currently opened. This object does not have scroll bars because it is all visible in the window. For large tables or sequence alignments, having the ability
to scroll through the table or alignment is quite useful. Changes made in the
open window will be preserved in the object once it is returned to the notebook. Any open for editing windows will be closed automatically when the
notebook is closed.
Analysis Output Objects
Each time you perform an analysis in the Gene Inspector, it will create an
analysis output object in the GI Notebooke. These objects are similar to the
other GI Notebook objects discussed previously in this chapter in that they
can be moved around the notebook sheet and can be resized. Once they are
targeted, however, they acquire new properties. Extra options for analysis
objects can be accessed through the Object menu that appears when any
analysis output object is targeted.
The Object menu will contain at least two items: Reformat… and Recalculate…. The
Reformat… item will let you change the formatting of different parts of the display, such as changing the range of nucleotides or amino acids to be displayed along an x-axis, changing the placement of axis tick marks, changing
the names of the x- and y-axes, changing the font styles for axis labels and
titles, etc. Different analyses may also allow you to reformat different parts of
the display. For example, in the dot matrix analysis, you can change the
thresholds for different colors in the output display.
Recalculate…
e.
gives you the ability to adjust analysis parameters and then recal-
The exception to this is that multiple sequence alignments will create new sequence editor documents for their outputs.
Page 5-15
The GI Notebook
culate the analysis. Choosing recalculate will give you an Analysis Setup Window (see “The Analysis Setup Window”, page 4-2) which contains all the
parameters used to run the analysis initially. This window can be used to
make any changes you want, even allowing you to change the sequence
being analyzed. Once you have made a change(s) in the analysis setup, the
analysis will be rerun and will be placed back in the GI Notebook in the same
location and size it originally occupied when it was first selected. Thus, any
analysis output object can be used to rerun the analysis.
If you copy and paste an analysis output object, you can change the parameters of the copy and rerun the analysis for comparison with the original analysis output object. Analysis output objects can also be stored as tool
extensions (see page 5-17).
Features Objects
Features objects are designed to enable the display of annotated sequence
information within the GI Notebook. One or more protein or DNA sequences
can be display and then enhanced. This object is discussed in detail in “Creating a Features Object View of a Sequence”, page 3-16. If you have multiple
sequences in your features object you will see a Sequences menu (“Sequences
Menu”, page 6-44), while a single sequence features object has a Features
menu (“Features Menu”, page 6-39).
Appendix Objects
Any GI Notebook object can be moved into an appendix. When the object is
moved to an appendix, an alias to the appendix is created in the notebook.
The alias in the notebook can be used to access the appendix. An appendix
contains the full object in a separate window which is associated with the
notebook. Double-clicking on the alias will open the corresponding appendix
in the same way an alias can open a file in the Finderf.
An object can be moved to an appendix by selecting the object and then
choosing Notebook ?Appendices ?Move Object to Appendices…. A list of all appendices
will be available as part of the Notebook ?Appendices menu. Selecting the appenPage 5-16
The GI Notebook
dix name in the Appendices menu will open that appendix windowg. This process is described in more detail in Tutorial 12: “Appendices – Hiding Large
Amounts of Data”, page 2-43.
Appendices can be used to store large objects, such as lists of cut sites in a
sequence or perhaps aligned sequences or database search results. You can
also use it to store buffer recipes or other often needed information. Collapsing large objects into appendices will therefore save space in the GI Notebook and make the background text more readable. At the same time, you
will still have access to the information in the appendix if you need it later on.
Appendices are also useful because they are available from any location in
the notebook.
Tool Extensions
The Gene Inspector allows you to create your own custom items to paste into
the GI Notebook. This is done in the form of a tool extension. Once a notebook object is selected, it can be added to the Tools menu as an extension by
choosing the Notebook ?Tool Extensions ?Add Extension menu item. You will be asked
to provide a name for the extension, after which it will become available
through a menu (the original object is still left in the notebook). As seen in
Figure 5.5, page 5-7, when the Tools menu is torn off to create a Tools Palette, the tool extensions appear as a popup menu in the palette. In this particular case, the tool extension called “Bookmarker” is being shown in the
palette.
Selecting a tool extension from the Tools menu or Tools Palette will enable
you to place a copy of the tool extension in a notebook. Clicking the mouse
f.
g.
Gene Inspector’s aliases behave similarly to the Finder’s aliases. It is not an actual
object but is rather a “pointer” to an object that is not visible. GI Notebook aliases can
point to objects in an Appendix or to any other object in the notebook. Aliases can be
used as navigational tools. For more information about aliases, see “Make Alias...”, page
6-29.
The Appendix windows are almost identical to the Open For Editing windows (page 514). Both can be edited, but closing the appendix will make it invisible, while closing the
editing window will return the object to the notebook. Appendix windows are also listed
under the Appendices menu.
Page 5-17
The GI Notebook
in the GI Notebook will transfer a copy of the tool extension into the GI Notebook at its original (preferred) size with the top left corner of the object being
placed at the location of the mouse click. If instead of clicking the mouse button, you hold it down and drag out a rectangle, the tool extension will be
scaled to fit into the rectangle.
Uses for Tool Extensions
Because tool extensions can contain any GI Notebook object, they have many
uses. For example, you could draw a complex graphic consisting of a number
of shapes (rectangles, circles, etc.), group them together, and then create a
tool extension from them. You could then use the complex object as an icon
for use as a bookmark, or an indicator of a new experiment, or as an indicator of important data, or any other point you want to highlight. Graphic objects
from other programs can also be saved as tool extensions (e.g a microfuge
tube, a small image of your face, etc.).
If you often create tables of the same type, it pays to store a template of the
table as a tool extension. Thus, if you run an 18 lane gel repeatedly, you
might store a table with eighteen rows and one column as a tool extension.
Each time you run a new gel, just use the tool extension to place an empty
table into the GI Notebook and fill in the current list of samples.
You are not just limited to graphic objects and tables for use as tool extensions, however, because any analysis output object can also be used as a
tool extension. Analysis output object tool extensions can be placed back into
the GI Notebook and used to run analyses. This is an alternative way to store
analysis setups in addition to being able to add them to the Analysis menu as
analysis setups (see Chapter 4).
Page 5-18
Menu Items
Chapter 6
Menu Items
This chapter details all of the menu choices available within the Gene Inspector. Some of the menus are only available when specific conditions are met
(e.g. – an object is targeted so the Object menu appears).
Page 6-1
Menu Items
File Menu
The File menu deals with
creating, opening, printing
and saving documents.
The Windows and Mac
versions are slightly different as shown at the right.
The menu items are:
• New...
allows you to create new GI Notebooks, nucleic acid sequence documents, or protein sequence documents. It will bring up the dialog box shown
in Figure 6.1. Use the radio buttons in the top part of this dialog to choose
the document type you wish to create and then enter the name to be used for
the new window. Note that this does not create a file on disk and does not
New…
Figure 6.1: Create New Dialog
save what you will enter into the window. This just creates a new window for
you. To save the contents, choose File ?Save As… (“Save As...”, page 6-3).
• Open...
Use Open… to open an existing document (file on disk). As shown in Figure
6.2, page 6-3, you can open any of the three types of documents Gene
Inspector can create. The check boxes at the bottom of the window will determine the kinds of document which will appear in the scrolling area of the window. If you have only Notebooks checked, then all you will see in the
Page 6-2
Menu Items
Figure 6.2: Opening a Document
scrollable area are folders and GI Notebook documents. Peptide
Sequences and Nucleic Acid Sequences check boxes work the same
way.
• Close
will close the active (frontmost) window. If changes have been made to
the window, you will be given an opportunity to save the changes before the
file is closed.
Close
• Save
will save any changes that have been made to the currently active document. The Save menu will not be enabled unless you have made some
changes to the open document. If a document has never been saved before,
this option will behave identically to the Save As... option discussed below. Saving a document will also reset the “Revert to Saved” condition (Revert to Saved,
page 6-4). If you make changes to a document, you can always return to the
most recent saved version.
Save
• Save As...
will allow you to save the current active document under a different
name (see Figure 6.3, page 6-4). This operation will leave the original document (having the “old” name) untouched and will create a new document
corresponding to the current state of the window. After doing a Save As..., the
window will correspond to the newly created file on disk and any changes will
be made to this new file.
Save As…
Page 6-3
Menu Items
Figure 6.3: Save As… Dialog
• Save a Copy
is similar to the Save As... option discussed in the previous section
with one important difference. In contrast to Save As... which creates a new window/document and makes it the active window, Save a Copy will create a new
document but will not close the current window – you can continue to work on
the original document. The Save a Copy option, in effect, will create a snapshot
of the current state of the open window.
Save a Copy
• Revert to Saved
will restore the current window to the state it was in the last time
the document was saved. If you have made any changes, you will be asked
if you want to lose all the changes made since the last Save. The Revert to Saved
option is a convenient way to restore a file to its original state after you might
have accidently made unwanted changes. It is a kind of “super-undo”.
Revert to Saved
Page 6-4
Menu Items
Figure 6.4: Importing Into a Notebook
• Import
provides a means to bring information in files created in other programs
into Gene Inspector. There are three kinds of importing that you can do. GI
cannot import files directly from other application’s formats, such as DNA
Strider. You must first export the sequences from the other program as a
TEXT or ASCII file. This can then be imported into GI.
Import
— Import Text Into Notebook…
When you have text information that you would like to import into a GI Notebook, or would just like to examine, this is the option that can do it. As shown
in Figure 6.4, you can import the text into a new notebook, or you can
choose to append it to the end of an open notebook.
Figure 6.5: Import Sequence Dialog
— Import Peptide Sequence…
The dialog that appears when you choose this option is shown in Figure 6.5,
Page 6-5
Menu Items
page 6-5. In this case, there was no open sequence window in the Gene
Inspector, so the Append sequences to… option was not available. Using
the Enable popup menu specifies which files are shown in the files to open
list. The popup menu allows you to define the format of the file to be
imported. Importing is discussed in detail in “Importing Sequences”, page 319.
If you are unsure about the format of the contents of a file, you can select it
in the scrollable list and then press the File Info button (Mac) or just look at
the bottom of the dialog box (Windows). The Gene Inspector will attempt to
read the file in the format indicated and will provide you with appropriate
information about the file contents. In the case shown in this figure, a GCG
sequence file was being viewed.
— Import Nucleic Acid Sequence…
Selecting this choice will provide the same dialog box as for Import Peptide
Sequence…. You can import text sequence files into a new sequence window,
or add them to sequence windows already open.
— About Importing Sequences
Please note that Textco BioSoftware has obtained information about the file
formats from a number of sources and has used that information to design
the import functionality in Gene Inspector. However, any other vendor has a
right to change their file formats (as does Textco) to better suit their applications. We do our best to keep up with changes but sometimes we might miss
a change. If you find an incompatibility in the importing please let Textco
know about it. By far the safest way to import and export sequences is
through one of the more standard formats: GCG, EMBL, FASTA and GenBank.
• Export
Choosing Export provides you with two choices of what to export. You can
export the entire document or just the selected part(s) if you are in a
sequence document.
— Export Selected Items…
If you have a notebook open, this option will be disabled. In a sequence document, if you have one or more sequences selected, then this option is available. The export options possible here are described in the next section.
Page 6-6
Menu Items
Figure 6.6: Export Sequence Dialog
— Export Entire Document…
Exporting a GI Notebook will export all the background text into a text file.
This file can be opened by any word processor. You cannot export graphic
objects or analyses – you should use the clipboard to do that. The export
dialog is shown in Figure 6.6. When sequences are exported, each sequence
will be exported in its own file, which is named with the exported sequence
name. All exported sequence files will be placed into a single folder.
The popup menu is used to define the format for the sequence output files.
Choose one of these formats to define how the sequence will be formatted
when it is exported.
• Page Setup...
This is the standard dialog put up by the operating system. The characteristics of the printer are determined and used to format the display within the
Gene Inspector when you choose Page Setup…. The characteristics are used to
set page borders, text margins, and other Gene Inspector features based on
printer characteristics. If you are having problems printing, make sure you use
the Page Setup... option to help the program understand the characteristics of
the printer that is being used.
• Print...
This is the standard dialog put up by the operating system which allows you
to print the current document.
Page 6-7
Menu Items
• Print Notebook and Appendices
In the Gene Inspector it is possible to have parts of a GI Notebook contained
in an appendix. When you print the notebook using the standard Print option
the appendix objects are not printed. To print appendices, you need to
choose Print Notebook and Appendices. This provides you with the opportunity to
print both appendices and the notebook itself.
• Choose GI Data Folder (Windows only)
The GI Data folder contains all the lists, tables, style sheets, and other information that the program needs during its operation. By default, GI looks for
the GI Data folder that resides in the same folder as the application. However, you might want to access your own GI Data folder while running the
program from a different computer. This menu option allows you to choose
the GI Data folder to be used. If you quit the program and start it again, it will
use the GI Data folder that was in effect the last time the program was run.
• Set Alias Resolution Rules... (Mac only)
Many users on the Macintosh store files remotely. When the Operating System tries to find a file on a remote volume and the volume is not readily
found, the OS will try a number of ways of accessing the volume. Sometimes
this can take a long time. This dialog will allow you to specify how hard the
Mac should try to find the wayward volume.
• Quit (Mac)/Exit (Windows)
Quits the application and closes all open windows. If any changes have been
made, you will be offered an opportunity to save them before closing them.
Page 6-8
Menu Items
Edit Menu
The items in the Edit menu are
standard operating system options.
• Undo
allows you to “undo” the last
operation you performed.
Undo
• Cut
transfers the current selection to
the clipboard. Once on the clipboard it can be pasted elsewhere. If pasted
into a document from an application other than Gene Inspector, you will be
able to retrieve either the text of the clipboard object or a picture of the clipboard object, depending on the receiving application. Other applications do
not understand the information that is used internally within the Gene Inspector – how to format a sequence, parameters for running analyses, style
sheets, etc. – and so can only accept the standard TEXT and picture information.
Cut
• Copy
Copy transfers a copy of the current selection to the clipboard. Once on the
clipboard it can be pasted elsewhere with the same caveats as mentioned in
the previous section, Cut.
• Paste
Places what is on the clipboard into a Gene Inspector document at the location of the insertion point. If no insertion point is available and a GI Notebook
is the frontmost (active) window, the clipboard information is placed in the
center of the visible area. The GI Notebook can accept text or picture objects
from other applications. Text from the clipboard will be placed into the notebook at the location of the insertion point in the background text. If no insertion point exists (e.g. an object is selected) when you paste in the text, it will
be placed into its own sidebar located in the center of the visible area. Picture objects will be place in the notebook as their own objects.
Page 6-9
Menu Items
Pasting sequence information from other programs into the Gene Inspector’s
sequence editor is handled in a special way. The Gene Inspector removes
any control characters (line feeds, carriage returns, etc.) and any non-nucleotide characters (for nucleic acid files) or non-amino acid characters (for
peptide files) before pasting any information from the clipboard into a
sequence document. You can check the clipboard contents by choosing Edit ?
Show Clipboard (page 6-14).
• Special Paste
This menu option allows you to specify how information in the clipboard will
be placed into the GI notebook. Information can be placed into the notebook
in three different formats: picture, text, and sequence. If you copy a sequence
from the sequence editor and paste it into the notebook, it will create a “Features Object” allowing you to annotate the sequence (see “Creating a Features Object View of a Sequence”, page 3-16). But what if you want to paste
the actual sequence into the notebook background text? You can do this with
Edit ?Special Paste ?Paste Text. The Paste Text menu item forces any information on
the clipboard to be pasted into the GI Notebook as just plain text information.
Some applications, like Textco BioSoftware’s Gene Construction Kit, place
both graphical and text information on the clipboard. In these cases, choosing
Edit ?Special Paste ?Paste Text will past in the sequence information, while choosing
Edit ?Special Paste ?Paste Picture will paste in the actual graphic.
• Clear
functions the same as pressing the delete key. It will delete the current
selection.
Clear
• Select All
selects all objects of the same kind as the current object. If the insertion point is in the background text of a GI Notebook, the entire background
text will be selected. If the insertion point is in a sidebar text, then all text in
that sidebar will be selected. If a notebook object is selected, then all the
objects in the GI Notebook will be selected. For a sequence editor document,
if the insertion point is in a sequence, Select All will select all of the residues of
that sequence. If a sequence name is selected, then Select All will select all
Select All
Page 6-10
Menu Items
sequences in the document. If the selection is within a targeted object, Select
All will behave according to the rules of that particular object.
• Show Selection
Sometimes if you have a large amount of information, or some of the material
in the window is not on screen, it is difficult to find out where the cursor or
selection is. Choosing this option will bring the selected information, or the
cursor (if nothing is selected) into view. If possible the selection will be centered in the window.
• Find & Replace
— Find…
Find allows you to search either a sequence document or a GI Notebook. For
notebooks, the search dialog is shown in Figure 6.7. The check boxes allow
Figure 6.7: Notebook Find Dialog
you to be specific to the case of the matching words (Case sensitive), to
continue to search after the end of the document is reached by continuing the
search at the beginning of the document (Wrap around), and to search
starting at the current site and working towards the beginning of the document
(Search backwards). When a match is found, the match is highlighted
and scrolled into view. Find… works in conjunction with Find Next (page 6-13) to
allow you to rapidly go through a document and find each instance of a
search string.
For sequence documents, the dialog looks like Figure 6.8, page 6-12. There
are some extra options in this dialog. The top section of the dialog allows you
to define criteria for the searching. You can define a query sequence and
Page 6-11
Menu Items
Figure 6.8: Sequence Editor Find Dialog
allow mismatches up to a specified maximum number of characters. You can
enter ambiguous characters like X for proteins or N for nucleic acids, so you
also need to tell the search routine what it should do with these characters. If
you want X (N) to match only the character X (N) in the target sequence (the
sequence that is being searched), then choose Match ambiguous chars
exactly. If you want X (N) to match anything, then choose Interpret
ambiguous chars. The last choice, Find the next ambiguous char, will
find the next occurrence of X in a protein sequence, or one of the ambiguous
nucleotide characters in a nucleic acid sequence (including Y, R, N).
The bottom part of the dialog allows you to define what is to be searched.
You can choose to search the active sequence in the current window,
meaning the sequence in which the insertion point currently resides. You
could alternatively choose to search all sequences in the current file. Also,
for nucleic acid sequences, you can specify that you would like to Search
bottom strand (as well as top strand).
The check boxes at the bottom of the dialog allow you to continue to search
after the end of the document is reached by continuing the search at the
beginning of the document (Wrap around), and to search starting at the
current site and working towards the beginning of the document (Search
backwards).
Page 6-12
Menu Items
— Find Next
Find Next its keyboard equivalent (š-G) will find the next occurrence of the key
word(s) specified in the Find… dialog. It is a very convenient way to quickly go
through a notebook or a sequence document and find each occurrence of the
key word(s). Use Find Next in conjunction with Find for rapid searching.
— Find Selection
Find Selection initiates a Find… operation using the text that is currently selected.
This is an easy way to look for the next occurrence of any text or sequence
you highlight. It is equivalent to copying the selected text, opening the Find…
dialog, pasting in the text and then starting the search.
— Replace…
The Replace… option will perform a search to find a given key word and then
will replace that text with a new string of characters. The Replace All button
will replace all occurrences of the search text. You should use this option with
caution because it is not undoable. The Replace, Find Next button will
replace the current selected match and then find and highlight the next
match.
• Drag & Drop Options…
This menu item allows you to define how you want drag & drop to work
within Gene Inspector. As shown in Figure 6.9, you can specify which opera-
Figure 6.9: Drag & Drop Editing Dialog
tions will utilize drag & drop within Gene Inspector. To use drag & drop, first
select the item you which to move and then click and drag the selected object
to the new location.
Page 6-13
Menu Items
• Show Clipboard
opens a new window that will display the current clipboard contents. This is viewed through the Gene Inspector application. When you leave
the Gene Inspector, only TEXT or picture information gets passed along to
other applications because other applications cannot recognize the Gene
Inspector’s internal parameters.
Show Clipboard
• Show/Hide Page Breaks
It is possible to create GI Notebook sheets that are larger than one printer
page in size. If you would like to see how the objects in a notebook sheet will
be distributed over a printer page boundary, you can Show Page Breaks. With
page breaks displayed, you can arrange objects on the GI Notebook sheet in
such a way as to minimize the number of objects that actually cross the
printer page boundary. The placement of the printer page indicators is calculated using the information provided to the Gene Inspector through the Page
Setup… dialog (page 6-7).
Page breaks in sequence documents are also useful to determine where a
sequence will be broken when you print it. By changing font and font size in
a sequence document and monitoring the location of page breaks, you can
get exactly what you want to print.
Page 6-14
Menu Items
Windows Menu
• Stack Windows
will organize all open windows within the Gene Inspector and
stack them neatly with all their title bars visible. This is sometimes desirable
when many windows are open to help you find windows easily.
Stack Windows
• Current Window Names
After the Stack Windows item will be a list of all currently open windows. Selecting one of the window names will bring that window to the front to be edited.
Page 6-15
Menu Items
Format Menu
The Format menu contains formatting options
that pertain to the formatting of a large number of objects or parts of objects. Some of
the Format submenus may not be available at
any given time because they might not pertain to the current selection. For example,
when a rectangle is selected, the Font submenu will not be available.
• Fill
Fill
contains a number of patterns that can be used to fill in currently selected
Figure 6.10: The Fill Submenu
objects. It is shown in Figure 6.10. The No Fill selection will make the “filled”
portion of the object transparent.
• Lines
allows you to set properties of lines. It is shown in Figure 6.11, page 617. When your selection contains a linea, you can choose line thickness using
the different thickness lines in this menu or using the Pick Line Width… choice.
For simple lines, the arrowhead options are also available. You can choose to
place an arrowhead on one or both ends of the line(s). The Size Arrowhead…
option will give you an opportunity to adjust the appearance of the arrowheads on any selected lines containing arrowheads.
Lines
a.
This includes not only simple lines, but rectangles, ellipses and other graphic objects.
The line thickness is equivalent to the pen width.
Page 6-16
Menu Items
Figure 6.11: The Lines Submenu
If the selected object is a rectangle or other more complex graphic object,
then the arrowhead options are grayed. You can still pick line widths for these
objects. If the object is a rounded rectangle, you can set the Corner Curvature to
define the extent of roundness in the rounded corners.
• Font
The Font menu lists all of the available fonts for use in Gene Inspector.
• Style
The Style menu list all the styles that can be applied to text. One that is not
very common in other programs is Conditional Text. Conditional text can be
shown or it can be hidden. You can use conditional text to keep comments
for yourself that you do not want to be part of the regular notebook text. Conditional text is discussed under “Conditional Text”, page 5-2. Another useful
option is Box Around. This is especially useful in displaying sequence information.
• Size
Size
allows you to set the size of any selected text.
Page 6-17
Menu Items
• Color
lists the colors that are currently defined in the Gene Inspector. In addition to the standard colors, additional possibilities are available through the
submenus listed below.
Color
— Pick a Color…
Pick a Color… presents you with a standard Color Picker dialog supplied by the
operating system. You can choose any color your computer can produce.
— Add Color To Menu…
Add Color To Menu… can add a new color to the Color menu. You name the color
menu item and then define its color using either the Color Picker or by using
the color of the currently selected object. This is discussed in Tutorial 8:
“Customizing Gene Inspector Menus”, page 2-34.
— Remove Color From Menu…
Remove Color From Menu… allows you to remove any custom colors you had previously added to the Color menu. If you have not added any custom colors, this
menu option will be disabled.
• Frames
Frames are “adornments” that can be attached to any GI Notebook object.
Adornments modify the appearance of objects they adorn. Frames consist of
one or more borders and optionally a shadow. The items in this menu allow
you to create and modify frames. See “Framing GI Notebook Objects”, page
5-8 for more details.
— Edit Frame…
Edit Frame… provides a means to edit the frame of a selected object. Note that
it is possible to have no visible frame on an object and still edit the frame. In
this case the object could be considered to have a frame that consists of no
border and no shadow. The dialog is shown in Figure 5.6, page 5-9.
— Add Frame To Menu…
Once you have designed a Frame you would like to use again in the future,
you can add it to the menu using this option. If you have an object selected
and choose Add Frame To Menu…, the dialog will allow you to add the frame from
the selected object to the Frames menu. If you do not have an object selected,
this option will be disabled. Once you have provided a name the custom
Page 6-18
Menu Items
frame will then be appended to the Frames menu. The bottom radio button will
present the same dialog as Edit Frame.
— Remove Frame From Menu…
If you no longer have a use for a custom frame, you can remove it from the
Frames menu with Remove Frame From Menu….
• Numeric Format
Numeric formats can be set for numbers that are displayed in user tables.
This provides you with a way to have all the numbers in a table formatted
consistently. This menu works similarly to the Color and Frames menus.
— Set Format…
Set Format… brings up the numeric formatting dialog as shown in Figure 2.28,
page 2-35. You can specify the number of decimals, scientific notation, or
even add degrees or % to the numbers.
— Add Format To Menu…
Add Format To Menu… allows you to add a custom numeric format to the Numeric
Format menu.
— Remove Format From Menu…
Remove Format From Menu… allows you to remove a custom numeric format from
the Numeric Format menu. If you do not have any custom numeric formats then
this option will be disabled.
• Paragraph
The Paragraph formatting menu item applies to any text that is not background
text, such as text found in sidebars. Background text is formatted using the
icons in the GI Notebook ruler (see Figure 5.1, page 5-2).
— Left Justify
Aligns the left end of each line of text. The right ends can be uneven as each
line of text will have a different length.
— Center
Centers the text horizontally for each line.
— Right Justify
Aligns the right end of each line of text. The left ends can be uneven as each
Page 6-19
Menu Items
line of text will have a different length.
— Full Justify
Adjusts text display so that both the left and right ends text lines are aligned.
This is accomplished by adding pixels between letters and between words.
— Single Spacing
Sets the vertical spacing between lines of text to be equal to the height
defined for the tallest font displayed in that line(s).
— 1 1/2 Spacing
Sets the vertical spacing between lines of text to be equal to the 1.5 times
the height defined for the tallest font displayed in that line(s).
— Double Spacing
Sets the vertical spacing between lines of text to be equal to the 2 times the
height defined for the tallest font displayed in that line(s).
— Other Line Spacing…
Other Line Spacing… allows you to set the vertical line spacing.
• Style Sheets
Style sheets are discussed in detail in Tutorial 10: “Creating and Using Style
Sheets”, page 2-38. This menu can be customized to contain any style sheet
you create.
— Add Style Sheet To Menu…
Add Style Sheet To Menu… will add the style information from the currently selected
object to the Style Sheets menu. The name you provide will be used to identify
the style as a menu choice.
— Remove Style Sheet From Menu…
If you have custom style sheets you no longer need, you can use Remove Style
Sheet From Menu… to remove them from the Style Sheets menu.
Page 6-20
Menu Items
Analysis Menu
The Analysis Menu deals with
starting, modifying, and storing analyses and the tables
used in these analyses. The
four items at the bottom of
the Mac menu shown at the
right represent custom analysis setups (see “Custom
Analysis Setups”, page 626).
• New Analysis...
is the starting point for launching analyses. You will be presented
with a dialog that allows you to choose to do either a nucleic acid analysis or
a peptide analysis. This was discussed in Tutorial 3: “Using Analysis Setups”,
page 2-14 and in “Starting an Analysis”, page 4-1. You should examine those
sections for more information.
New Analysis
• Previous Setup...
will bring up the Setup Window which was used last. It will
include all the analyses in the window as well as any sequences or sequence
segments. Note that if you ran an analysis on a sequence from an open
sequence document and that document was never saved, the Previous Setup...
will not be able to retrieve the sequence. Because the rest of this panel will
be as it was originally, however, all you need to do is select a new sequence
for analysis. If no analysis has been run, this menu option will not be
enabled.
Previous Setup…
• Show/Hide Analysis Monitor
allows you to either show or hide the Analysis Monitor. The Analysis Monitor is shown in Figure 6.12, page 6-22. It contains a
list of the analyses which are currently scheduled to run. The top item in the
list is the analysis currently in progress. The percentage complete is also indiShow/Hide Analysis Monitor
Page 6-21
Menu Items
Figure 6.12: The Analysis Monitor
cated. One can click on an analysis name to select it and then press Cancel
to remove that analysis from the queue.
Analyses can be classified as low or high priority. By default all analyses
enter the list as low priority analyses. Starting an analysis as high priority can
be done as shown in Figure 6.13. When the high priority analysis is Run it
will enter the analysis queue at the top and will start to execute immediately.
Any running or pending low priority analyses will be put on pause and will
Figure 6.13: Setting High Priority for an Analysis
wait to execute until the high priority analysis is completed (see also “Temporarily Pausing Long Running Analyses”, page 7-3).
This capability might be useful if you are running a time consuming analysis
(alignment or dot matrix on large sequences) but have a quicker analysis you
would like to see without waiting. Starting the quick analysis as a high priority
analysis will let it run and then the slower analysis will resume without having
to start over again.
Page 6-22
Menu Items
• Tables
The items in this submenu deal with analysis tables which you can create.
Figure 6.14: Creating a New Table
You are not allowed to edit the tables that are built into the program because
these contain standard values from the literature. Creating tables is also discussed in Tutorial 20: “Creating Your Own Analysis Tables”, page 2-63 and
“Editing Translation and Codon Preference Tables”, page 4-13.
— Create New…
To create a new table you must first specify what kinds of analyses the table
will be used for. As shown in Figure 6.14, you must choose an analysis from
the list on the left which will specify what dimensions the table needs to be.
Once a selection is made on the left, you can choose to create an empty
table or you can create a table filled with values copied from another preexisting table. In the case shown here, the BLOSUM100 table is chosen as
the starting point for the new table. You may also paste table values in from
the clipboard. Any tab delimited text (e.g. from Excel) will be placed appropriately in the table using the cell you have selected as the top left cell for pasting in the table data from the clipboard.
In this instance, the new table window that is created is given a default name
of BLOSUM100 Copy because the BLOSUM100 table was used to fill in the
values in the table. This is shown in Figure 6.15. The Edit Info button brings
Page 6-23
Menu Items
Figure 6.15: A New Table Window
Figure 6.16: Editing Table Info
up Figure 6.16, page 6-24. You can change the title of the table, which will
be used whenever the table is made available for use in an analysis. The
minimum and maximum adjectives are used as labels in some analyses, like
Page 6-24
Menu Items
Helical Wheel (page 4-59).
The Cancel button will close the table window without saving any changes
while the OK button will create a new table and store it in the folder called
User Tables in the GI Data folder.
— Open For Editing…
Open For Editing… will allow you to edit a table that you have created using Create
New… from the Analysis ?Table submenu. You cannot edit the standard tables
supplied with the program.
— Remove…
Remove… will provide an opportunity to remove any analysis tables you may
have created. The dialog is similar in appearance to the create table dialog
(Figure 6.14, page 6-23).
• Add Another Analysis...
Add Another Analysis… provides an opportunity to add additional analyses to an
Analysis Setup Window. This option is only enabled when an Analysis Setup
window is open. In the Windows version of Gene Inspector this selection is
accessible through the right-mouse button menu. It is discussed in Tutorial 11:
“Adding More Analyses to a Setup”, page 2-40.
• Remove Analysis...
complements the Add Another Analysis... option discussed in the
previous section. Remove Analysis... is only available when and Analysis Setup
Window is active and a specific analysis is selected in the window. In the
Windows version of Gene Inspector, the Remove Analysis selection is accessible through the right-mouse button menu. Selecting Remove Analysis... will
remove the selected analysis from the active Analysis Setup Window. If no
analysis is selected this menu item will be disabled.
Remove Analysis…
• Update Setup
If you have opened and Analysis Setup from the Analysis menu (see Add Setup
below) and have made some changes to the Setup, you can update
the saved Analysis Setup Window by using this menu option. In the Windows
To Menu...,
Page 6-25
Menu Items
version of Gene Inspector, this selection is accessible through the rightmouse button menu. The current set of parameters and sequences will
replace the ones that were stored with the Setup when it was selected from
the Analysis menu.
• Add Setup To Menu...
This menu option is enabled whenever you have an Analysis Setup window
as the active window. In the Windows version of Gene Inspector, this selection is accessible through the right-mouse button menu. Choosing Add Setup To
Menu... will ask you for a name for the current setup and then will add it to the
Analysis menu as a custom setup (Custom Analysis Setups, below). The entire
setup window will be added including all analysis parameters, the suite of
analyses, and the sequences used (if any).
• Remove Setup From Menu...
complements the previous one. It allows you to remove
a Custom Analysis Setup from the Analysis menu. In the Windows version of
Gene Inspector, this selection is accessible through the right-mouse button
menu. You will be presented with a list of the current Custom Analysis Setups
and can chose which to delete.
Remove Setup From Menu…
• Custom Analysis Setups
After the Analysis menu items listed above, will be a list of all the Custom
Analysis Setups you have added to the application. Custom Analysis Setups
actually are stored on your hard disk as files in the Analysis Setups folder
inside the GI Data folder. Because they are just simple files, you can share
your custom analysis setups with other users, just by giving them your setup
files.
Page 6-26
Menu Items
Notebook Menu
The Notebook menu deals with the
editing, arrangement, and behavior
of objects in the GI Notebook.
• Get Info...
The Get Info... menu item presents
information about the currently
selected object(s). The information
shown differs for different objects.
Using this option, you can enter
and edit comments to save with the
object.
• Tools
The Tools submenu is shown in Figure 6.17. There are seven kinds of tools in
Figure 6.17: The Tools Submenu
this menu.
The arrow in the top left is used to select objects in the GI Notebook.
The Text tool will create a text object – see “Text Objects (Sidebar
Text)”, page 5-12.
The table tool will create a table in the notebook – see “Table
Objects (User Tables)”, page 5-12.
The Line tool will create lines that optionally can contain arrowheads
on one or both ends.
Page 6-27
Menu Items
The tools on the bottom row will create rectangles,
rounded rectangles, or ellipses.
• Reduction
— Set Reduction…
As shown in Figure 6.18, Set Reduction… brings up a dialog that allows you to
Figure 6.18: Set Reduction Dialog
define the extent of the reduction.
— Enlarge
Enlarge is enabled only if the GI Notebook is actually reduced. You cannot
enlarge to greater than original size. This option complements the Reduce
option and will enlarge the notebook to have twice the area (multiply each
dimension by 2 ).
— Enlarge To Full Size
Enlarge To Full Size removes any reduction and restores the notebook to full size.
— Reduce
This option complements the Enlarge option and will reduce the area of the GI
Notebook to half the area of what it was (multiply each dimension by 1 ⁄ 2 ).
— Reduce to Fit In Window
Reduce to Fit In Window reduces the entire GI Notebook to fit in a single window
on the screen. This option is best used to shrink a whole sheet down to the
size of a window. You might want to do this if you are creating a poster of a
size larger than that which can fit on your screen. If you have a notebook with
many sheets, this option will reduce the size of each sheet to a very tiny size
that will prove to be of very little use.
• Tool Extensions
Tool extensions were discussed in “Tool Extensions”, page 5-17. This menu
will allow manipulation of tool extensions.
Page 6-28
Menu Items
— Add Extension To Menu…
Add extension To Menu… provides a way to add a new extension to the Tool Extensions menu. After naming the extension, it will be added to the end of this
menu. Most GI Notebook objects can be added as tool extensions.
— Remove Extension From Menu…
Remove Extension From Menu… will remove a custom tool extension from the menu.
If you do not have any custom extension which have been added to the
menu, this option will be disabled.
— Custom Extensions
After the Add and Remove options will be a list of all the custom extension
which have been defined in the application.
• Open For Editing...
is available whenever a notebook analysis object is selected. It
is similar to targeting an object (see “Selection vs. Target”, page 2-1, and
page 5-6), but instead of letting you edit the object in place in the notebook
itself, the object is opened for editing in its own window. The advantage of
doing this is that you can use scrollbars to move around the object and
review its component parts. Closing the editing window will return the object
to its place in the GI Notebook. See also “Open for Editing”, page 5-14. This
is a very useful way to view large objects such as sequence alignments that
might not fit on a single notebook sheet (“Printing and Viewing Large
Objects”, page 7-5).
Open For Editing…
• Make Alias...
This is similar to making an alias in the Finder. The aliases that are created
are quite useful and can even be used between notebooks. Let’s say that you
have a recipe for a buffer in a table in notebook#1. You can create an alias
to this table and then copy the alias and paste it into notebook#2. In the
future, when you are in notebook#2, you could double-click on the alias and
it will open notebook#1 and select the table of interest. Aliases can also be
used to point to other locations in the same notebook. See also “Appendix
Objects”, page 5-16.
Page 6-29
Menu Items
• Find Original...
When an alias is selected, Find Original... will bring the object pointed to by the
alias to the front. If the notebook containing the original is closed, it will be
opened.
• Bookmarks
A bookmark may be named and attached to any object in the notebook. Its
name will be added to the Bookmarks menu and can be used to navigate to
specific locations in the notebook. See Tutorial 19: “Using Bookmarks in the
GI Notebook”, page 2-62.
— Attach Bookmark…
When an object is selected, Attach Bookmark… will attach a bookmark to the
selected object. You will be asked to name the bookmark, which will then be
appended to this menu as a custom bookmark.
— Remove Bookmarks…
If you have added any bookmarks to the menu, this option will allow you to
remove them.
— Custom Bookmarks
After the Attach and Remove options will be a list of all the bookmarks you have
created in the currently active notebook. Selecting one of these items will
bring you to the bookmark location in the notebook.
• Text Flow
Since each object in the GI Notebook can be placed anywhere on the page,
it is important to be able to define how text should flow around the object.
This is the function of the Text Flow menu. This has been discussed in “Text
Flow Around Objects”, page 5-10.
— Flow Through
Flow Through – text does not recognize that an object is present and overwrites the whole width of the text column – completely running through the
object.
— Both Sides
Both Sides – text “jumps across” the object and is placed on both the right
Page 6-30
Menu Items
side and the left side of the object.
— Left Side
Left Side – text only will be placed to the left side of the object
— Right Side
Right Side – text only will be placed to the right side of the object
— Widest Side
Widest Side – text only will be placed to the side of the object that has the
greatest distance between the object and the border of the text column. If the
object is moved, the text will flow only to the widest site.
— Neither Side
Neither Side – text is not placed on either side of the object and “jumps” from
above the object to below the objects.
— Set Text Standoff…
This item can be used to set the number of pixels that will be maintained
Figure 6.19: Setting the Text Standoff Distance
between the object and the surrounding background text. The dialog is shown
in Figure 6.19. Note that the vertical and horizontal standoffs can be set independently.
• Arrangement
This menu deals with arranging objects in the GI Notebook.
— Send To Back
When an object is selected and Send To Back is chosen, the selected object is
sent “behind” all other objects on the sheet.
— Bring To Front
When an object is selected and Bring To Front is chosen, the selected object is
Page 6-31
Menu Items
placed “in front of” all other objects on the sheet.
— Group
When more than one object is selected and Group chosen, all of the selected
objects will be joined together as a group. The group of objects can be
manipulated as a single object instead of many individual objects.
— Ungroup
When a grouped object is selected and Ungroup chosen, the grouped objects
will be converted into individual objects, each of which can be manipulated
separately. The menu is not enabled if not grouped object is selected.
— Align Objects…
This menu item provides a means to align and adjust the sizes of a collection
of selected objects. Aligning has been discussed in Tutorial 7: “Aligning Analysis Objects”, page 2-31 and in “Aligning Objects”, page 5-10.
— Save Preferred Size
The preferred size of an object is a defined size for an object that can be
recalled later on. Each window will open at a preferred size. You may enlarge
the window with the “grow box” at the top right corner, but clicking on the
grow box again returns the window to its preferred size. Save Preferred Size
defines a preferred size for the selected object(s). It is used in conjunction
with Restore Preferred Size.
— Restore Preferred Size
Restore Preferred Size will restore the size of any selected object(s) to its preferred size as set in Save Preferred Size. If no preferred size has been defined,
the object will revert to the size it had when it was originally created.
• Display
The Display menu deals with how the notebook and its contents are displayed.
You can customize the appearance of the notebook by showing or hiding different components of the notebook window.
— Show/Hide Ruler
Show/Hide Ruler will show or hide the text ruler which appears at the top of
each notebook window. The ruler also contains tab and justification icons.
Page 6-32
Menu Items
— Show/Hide Invisibles
Invisibles are characters that indicate tabs, returns, spaces, page breaks, etc.
Normally these characters are not visible, but you can make them visible by
choosing Show Invisibles.
— Show/Hide Conditional Text
Conditional Text is text that can be hidden. This is discussed in “Conditional
Text”, page 5-2.
— Show/Hide Page Breaks
Page breaks are lines drawn in the GI Notebook indicating the location of the
edges of printer pages. Because Gene Inspector can create sheets that are
larger than one printer page, it is important to be able to identify the location
of printer page breaks within a notebook sheet.
— Show/Hide Text Margins
Text margins indicate the borders on the notebook sheet that will contain the
background text.
— Show/Hide Print Area
The print area is the area on the notebook sheet that will be printed on the
currently selected printer. This area is determined through the information
obtained through the Page Setup... menu option.
— Show/Hide Paper Binding
If you will be printing the GI Notebook for binding in a hardcover book or in a
looseleaf, you might want to introduce a paper binding (sometimes called a
gutter). Paper binding is an extra area added to the side of the sheet nearest
the binding edge (left side of sheet for odd numbered sheets, right side of
sheet for even numbered sheets). You can set the size of the paper binding
using “Notebook Layout...”, page 6-37. This dialog is shown in Figure 5.3,
page 5-4.
— Set Display Preferences
Set Display Preferences can be used to specify which “adornments” are displayed
in the notebook and what colors they will have. Page breaks, text margins,
printable area, and paper binding can be adjusted.
• Appendices
Appendices are separate windows containing information that might normally
Page 6-33
Menu Items
be found in a GI Notebook. In fact, all appendices start their lives as notebook objects and get moved to an appendix using choices in this menu.
Appendices are discussed in Tutorial 12: “Appendices – Hiding Large
Amounts of Data”, page 2-43 and in “Appendix Objects”, page 5-16.
— Move Object To Appendices…
Move Object To Appendices… will take the selected object and move it to an appendix window of its own. You will be given an opportunity to create an alias in
the notebook that can point to the appendix. The named appendix will also be
added to the Appendices menu.
— Discard Appendices…
Discard Appendices… will give you a way to dispose of appendices you no longer
need. You will be presented with a list of appendices in the current notebook
from which to choose.
— Return Appendix To Notebook…
Return Appendix To Notebook… will bring an appendix object back into the GI Notebook and remove it from the list of appendices.
— Custom Appendices
After the menu items above, there will be a list of all the appendices in the
notebook. Selecting a name from this list will cause the corresponding appendix to open.
• Links
The Links menu is enabled when an output object is selected. Each analysis
output object is the result of analyzing a specific sequence(s). There remains
a link between the output object and the sequence which was analyzed to
generated the output object. The Links menu provides a way for you to specify
how the output object is (or is not) affected when the original sequence is
changed. See Tutorial 4: “Hotlinking Analysis Results”, page 2-19 for more
details on how to use links.
— Automatic
Automatic updating make the connection between the sequence and the output object into a hot link. Hot linked objects will have a small symbol in their
upper right corner indicating the state of the output object. If no updating is
needed, a plain green circle appears as shown in Figure 6.20. If the
Page 6-34
Menu Items
Figure 6.20: Hot Link (No Update Needed)
Figure 6.21: Hot Link (Updating Needed)
sequence has changed since the output object was created, the symbol will
change from the plain circle to red and yellow exclamation point as shown in
Figure 6.21. You can choose to update the object as described in “Perform
Auto Recalc Now…”, page 6-35.
You can define an object as one that is automatically updated (hot linked) by
selecting the object and then choosing this menu item.
— Manual
Even if no automatic linking is turned on, the original sequence is still connected to the output object. You can manually recalculate the analysis by
choosing Object ?Recalculate. No symbols are visible in the output object as they
are in the Automatic linked object. You can define and object as one that is
manually updated by selecting the object and then choosing this menu item.
— Perform Auto Recalc Now…
Perform Auto Recalc Now… will update all of the hot linked notebook output objects
that need to be updated. You will get a list of all the analyses in the notebook
Page 6-35
Menu Items
Figure 6.22: Autorecalc Dialog
that need to be updated (Figure 6.22). Pressing Recalculate Now will
start the updating. Each analysis will be placed into the Analysis Monitor and
will be run in turn.
— Recalc Selected Items…
Recalc Selected Items… provides a shortcut to selecting each output object individually and choosing to recalculate each one individually. Selecting Recalc
Selected Items… is equivalent to targeting an object and choosing Object ?Recalculate without changing any of the parameters. If you only want to update a few
hot linked objects in the notebook instead of performing an autorecalc on the
whole notebook, this is the best way to do it.
— Show Dependencies…
Each analysis output object is linked to a sequence, but it is often easy to
lose track of which sequence is connected to which analysis object. By
Figure 6.23: Show Dependencies Dialog
selecting an output object and choosing the Show Dependencies… menu item, the
dialog box shown in Figure 6.23 will appear. The dialog lists the full pathname to the sequence that is linked to the output object. It also lists the date
Page 6-36
Menu Items
the sequence was last modified (September 4, 1995; 7:23 PM in this case).
• Page Break
The Page Break menu item will place a page break at the location of the insertion point in the background text. This is indicated by an omega (Ω) symbol
if “show invisibles” (page 6-33) is turned on. The text following the page
break will start on a new printer page. Note that a new printer page is not
necessarily the same as a new notebook sheet. See “Notebook Layout...”
below for more details.
• Notebook Layout...
The Notebook Layout dialog allows you to set the way in which text is
arranged on the notebook sheet. Note that the notebook sheet size does not
necessarily correspond to the size of a printer page. Notebook sheets can
contain any number (or fraction) of printer pages. The notebook sheet is
used to define how large the printed output will be and how many printer
pages it will contain. Using the File > Page Setup... menu option to select a printer
will automatically define the printer page size for you.
The layout was discussed previously in “GI Notebook Layout”, page 5-4. The
dialog box is also shown in Figure 6.24. In this case the dialog is set to produce poster panels of 16” x 20” containing three columns of text.
Page 6-37
Menu Items
Figure 6.24: Notebook Layout (Poster)
Page 6-38
Menu Items
Features Menu
When a sequence is copied
from a sequence document and
pasted into the GI Notebook, it
appears as a “Features” object.
Such an object is shown in Figure 6.25. The appearance of
the different parts of the Features object is defined by the items in the Features
menu. A discussion of the Features Object can also be found in Tutorial 16:
“Displaying Formatted Sequence Information”, page 2-51. The different parts
of the features object can be shown or hidden individually by using the items
in this menu as described below.
translation
left positions
marked sites
line dividers
intron
boxed style
right positions
Figure 6.25: GI Notebook Features Object
If you simultaneously paste multiple sequences into the notebook, you will
create a multiple sequence features object. This is discussed in “Sequences
Menu”, page 6-44.
• Mark Sites…
The Mark Sites… menu item will mark restriction enzyme sites for the sequence
in the features object if it is a DNA sequence and will mark chemical or enzyPage 6-39
Menu Items
matic cleavage sites if the sequence is a protein sequence. These operations
are very similar to the analyses which mark sites: “Restriction Enzyme
Digest”, page 4-42 for DNA sequences and “Protein Cleavage”, page 4-67
for protein sequences. In the features object you will see the site names listed
above the sequence. The first letter of the site name is directly over the first
character of the recognition site.
• Translate…
The Translate… menu item will ask you for a translation table to use, and will
then translate the nucleic acid sequence which is selected. This menu item is
only available for nucleic acid sequences.
• Define Intron
The Define Intron menu item will invert the colors of the selected nucleic acid
sequence to indicate the presence of an intron and will cause the selected
segment to be ignored when the nucleic acid is translated. By defining
introns, it is possible to translate a nucleic acid sequence across the intron
and keep the reading frame intact. This option is only available for nucleic
acid sequences.
• Undefine Intron(s)
The Undefine Intron(s) menu item will remove the indication of any introns from
the selected segment of nucleic acid. This does not remove any sequence
from the display; it just changes the display so that no introns are defined in
the selected sequence.
• Display
The items in the Display submenu define how the features object is displayed.
This is accomplished by showing or hiding different parts of the features
object and by defining other characteristics of the display.
— Show/Hide Double Strands
The Show/Hide Double Strands menu item is only available for nucleic acid
sequences and will toggle to either show the sequence in double stranded
format or to show it in single stranded format.
Page 6-40
Menu Items
— Show/Hide Site Markers
The Show/Hide Site Markers menu item will determine if the restriction enzyme
(nucleic acid sequence) or cleavage (protein sequence) markers will be displayed. Hiding the markers does not remove them from the features object –
it just causes them not to be displayed. To remove markers, first select them
and then press the Delete key.
— Show/Hide Translations
The Show/Hide Translation menu item will determine if the translated sequence is
displayed along with the nucleic acid sequence. Hiding the translation does
not remove it from the features object – it just causes it not to be displayed.
To create a new translation see “Translate…”, page 6-40.
— Show/Hide Left Positions
The Show/Hide Left Positions menu item will either show or hide the sequence
position indicators at the left side of the sequence lines. This includes both
nucleic acid and translated amino acid positions.
— Show/Hide Right Positions
The Show/Hide Right Positions menu item will either show or hide the sequence
position indicators at the right side of the sequence lines. This includes both
nucleic acid and translated amino acid positions.
— Show/Hide Line Dividers
The Show/Hide Line Dividers menu item will either show or hide the line dividers
which can be used to keep different sequence lines clearly separated.
— Feature Margins…
The Feature Margins… menu item allows you to specify spacing between the
Figure 6.26: Feature Margins
sequence and the position markers and between the sequence and the edge
of the features object. The dialog is shown in Figure 6.26. The left margin
Page 6-41
Menu Items
and the right margin values define the minimum space between the sequence
itself and the edge of the feature object. The gap margin specifies the spacing between the position indicators and the sequence.
— Line Spacing…
The Line Spacing menu item allows extra space to be added between each line
Figure 6.27: Features Line Spacing
of sequence displayed. Using the dialog box in Figure 6.27, a value can be
entered for the number of extra pixels to be placed between each line of
sequence.
— One Letter AA Code
The One Letter AA Code menu item will alter the display of translated sequences to
show a one letter amino acid code. This item works only on translated
sequences.
— Three Letter AA Code
The Three Letter AA Code menu item will alter the display of translated sequences
to show a three letter amino acid code. This item works only on translated
sequences.
• Grouping
The Grouping menu item specifies how the letters in the nucleic acid or protein
sequence will be organized. A group is the number of characters in the
sequence that are drawn on the screen before a space is inserted. Grouping
makes the sequence easier to read. Groups of ten work well for nucleic acid
sequences and for proteins sequences. If the nucleic acid sequence is translated, then groups of three will allow the nucleic acid sequence to line up with
the translated sequence.
— Groups of Three
The Groups of Three menu item will organize the selected sequence into groups
of three characters starting with the first character selected.
Page 6-42
Menu Items
— Groups of Ten
The Groups of Ten menu item will organize the selected sequence into groups of
ten characters starting with the first character selected.
— No Grouping
The No Grouping menu item will remove all grouping from the selected
sequence..
— Other Group Size…
The Other Group Size… menu item will allow you to specify any group size and will
then organize the selected sequence into groups of that size.
— Insert Line Break
The Insert Line Break menu item will insert a line break at the insertion point in
the sequence. The means that character immediately after the insertion point
will become the start of the next line. If a segment of sequence is selected
when Insert Line Break is chosen, a line break is inserted just before the first
character in the selected sequence and another line break is inserted just
after the last character in the selected sequence.
— Remove Line Break(s)
The Remove Line Break(s) menu item will remove all line breaks from the selected
segment of sequence.
• Adjust Size To Contents
The Adjust Size To Contents menu item will adjust the size of the features object
so that it will exactly contain the entire contents. This is a useful command if
the editing operations you perform on the features object causes it to shrink
or grow.
Page 6-43
Menu Items
Sequences Menu
This menu appears when you target a multiple sequence Features Object. For
single sequence Features Objects, you will see a Features menu, which is discussed as “Features Menu”, page 6-39.
• Sequence Info…
Selecting a sequence in the multiple sequence Features Object, and then
choosing this menu item will display information about the selected seqeunce.
This is the same information that would be displayed in the sequence editor
window (see Figure 3.2, page 3-3 for nucleic acids and Figure 3.3, page 33 for proteins).
• Format Sequences…
This option is the same as the Format Sequence option in the sequence editor window - see Figure 3.4, page 3-5.
• Display
This is the same as “Display”, page 6-47.
• Consensus
This provides the same flexibilities as in the sequence editor window. See
“Consensus”, page 6-49.
Page 6-44
Menu Items
Sequence Menu
The Sequence menu is enabled
whenever you have a sequence
document as the active document.
It allows for manipulation of
sequences.
• Sequence Info...
When a sequence is selected in
the sequence editor, you can
obtain information about that
sequence by choosing the
Sequence Info… menu item. Slightly different “information windows” are seen for
nucleic acid (Figure 3.2, page 3-3) and for peptide sequences (Figure 3.3,
page 3-3). The information windows allow you to set a nucleic acid sequence
to linear or circular or to DNA or RNA. For peptide or nucleic acid sequences
you can enter comments about the sequence and can specify the starting
position of the first residue.
• New Sequence...
Choosing the New Sequence… menu item will create a new empty sequence in
the currently active sequence window. You will be given an opportunity to
name the new sequence.
• Insert Xs…/Insert Ns…
will allow you to insert ambiguous characters into your
sequences (Ns into nucleic acid sequences and Xs into peptide sequences).
Insert Xs…/Insert Ns…
Figure 6.28: Inserting Ambiguous Characters
Page 6-45
Menu Items
After a warning notice telling you that the operation is not undoable, you will
see the dialog box shown (for nucleic acids sequences) in Figure 6.28. You
can specify the number of characters to be inserted. Inserting characters is a
convenient way of putting in “placeholder” sequences. For example, you might
know that there are 2300 nucleotides between two restriction sites in a DNA
but the sequence itself is not known. By inserting 2300 Ns in the sequence,
the overall proportions of the sequence are maintained (and the known
restriction map is preserved) even though you do not know the actual
sequence. Of course, sequence analysis on this sequence will not be all that
informative.
• Generate Random...
The Generate Random... menu item is similar to the menu “Insert Xs…/Insert
Ns…” command in that it inserts new characters into a sequence. However,
the Generate Random... command will insert a randomly generated sequence of
valid nucleotide or amino acid characters instead of just inserting Xs or Ns.
• Go To Position...
The Go To Position... menu item presents a dialog box (Figure 6.29) into which
Figure 6.29: Go To Position Dialog
you can type a location. This menu item is only active when the cursor is
actually within a sequence. After pressing OK, the character at the position
you indicated will be visible in the window and will be selected. Cancel will
close the dialog box without moving the current cursor location.
• Speak Typing
The Speak Typing menu item will either be checked or not. If it is checked, each
character that you type into the sequence window will be spoken by the computer as it is entered. The speed of speech and other parameters can be set
Page 6-46
Menu Items
using “Speech Prefs...” as described in the next section.
• Speech Prefs...
The Speech Prefs... menu item allows you to set the way in which speech is
handled by the program. This was discussed in “Defining Speech Preferences
(Mac only)”, page 3-7. You can set the speed, the time to pause between
groups, and even record your own sounds.
• Map Keys...
was discussed in “Mapping the Keyboard”, page 3-7. For nucleic
acid sequences it provides a way to assign specific keys, in addition to the
standard ones, to specific nucleotide characters.
Map Keys…
• Show/Hide Sequence Monitor
The Show/Hide Sequence Monitor menu item will either open the sequence monitor
which will stay visible as a palette in front of other windows, or it will hide the
sequence monitor. The sequence monitor was discussed on page 3-9
• Display
The Display menu item allows you to define how the sequence window is displayed – what information is shown and what information is hidden. The
sequence window and its parts is shown in Figure 3.1, page 3-1. Display of
each part of the window is controlled by the submenus under the Display
menu.
— Show/Hide Overview
Show/Hide Overview will toggle the appearance of the overview “pane” to be
shown or hidden. If your sequence file contains only a single sequence or if
you are viewing a multiple sequence alignment where all the sequences are
the same length, you might want to hide the overview pane to make more
room for the sequence(s) itself. Note that the overview pane can also be
used as a navigation tool (see “The Overview Pane”, page 3-1 for more
details).
— Show/Hide Ruler
The ruler is the position indicator along the top of the sequence. Show/Hide
Page 6-47
Menu Items
Ruler
will toggle the appearance of the ruler to be shown or hidden.
— Show/Hide Names
Show/Hide Names will toggle the appearance of the names of the sequences
along the left side of the window to be shown or hidden.
— Show/Hide Positions
This option will toggle the appearance of the positioning numbers at the start
of each line to be shown or hidden.
• Manipulate
The Manipulate submenu deals with simple manipulations that can be performed directly on sequences within the sequence editor rather than going
through an analysis setup. Invert and Translate are available only for nucleic
acid sequence, while Reverse Translate is available only for peptide sequences.
— Invert
To invert a sequence is to “flip it over” so that the opposite DNA strand is
shown in the 5’ to 3’ direction. The option is only available when a segment
of DNA is selected. Note that the inversion operation takes place in the context of the sequence you are editing and will change the original sequence by
inverting the selected segment in place.
— Translate
Like Invert , Translate is only available when a segment of nucleic acid is
selected. You can choose the translation table to use, and then the selected
segment will be translated. The newly generated peptide sequence will be
placed in a new peptide sequence window.
— Reverse Translate
The Reverse Translate option is only available for peptide sequences. You can
Figure 6.30: Reverse Translation Dialog
choose the table you wish to use for the reverse translation using the dialog
Page 6-48
Menu Items
shown in Figure 6.30. Gene Inspector will use the table to generate a DNA
sequence from the protein sequence. The resulting sequence will have a
codon bias that is appropriate for the organism specified in the translation
table.
• Alignment
The items in the Alignment submenu are designed to allow you to perform multiple sequence alignments directly from within a sequence editor document.
This is an alternative to performing multiple sequence alignments as an analysis. The pros and cons of the two approaches to multiple sequence alignments are discussed in “Multiple Sequence Alignments”, page 3-10.
— Align All Sequences…
The Align All Sequences… option will align all the sequences in the currently
active sequence window using the Clustal V algorithm. Refer to “Multiple
Sequence Alignments”, page 3-10 for a detailed discussion.
— Unalign All Sequences
Unalign All Sequences will remove all the gaps and spaces from all of the
sequences in the document. To remove spaces and gaps from a subset of
the sequences in the document use the Remove Gaps and Spaces command.
— Remove Gaps and Spaces
The Remove Gaps and Spaces command removes all gaps and spaces in a
selected sequence. It is different from the Unalign All Sequences command, which
removes gaps and spaces from each sequence in the document.
• Consensus
The Consensus submenu determines which adornments will be displayed to
Figure 6.31: Aligned Sequences
Page 6-49
Menu Items
help illustrate sequence alignments. The parts of the consensus window are
shown in Figure 6.31, page 6-49. The consensus row shows the most common character in that position. The scoring row presents a histogram of the
extent of matching in each position to the consensus sequence. Shading is
illustrated in Figure 3.11, page 3-13.
— Show/Hide Consensus Row
Show/Hide Consensus Row will toggle the appearance of the consensus row
between visible and hidden.
— Show/Hide Scoring Row
Show/Hide Scoring Row will toggle the appearance of the scoring row between
visible and hidden.
— Show/Hide Shading
Show/Hide Shading will toggle the appearance of shading between visible and
hidden.
— Update Scores
The score for the alignment is shown in the upper left corner of the window.
This score is the per cent of characters matching the consensus sequence.
Only identical characters count as a match. Selecting Update Scores will make
any adjustment needed to the score to compensate for editing changes that
may have been made. Note that this does not cause any realignment of the
sequences – it just recalculates the score.
— Automatic Updating
Turning on Automatic Updating will cause the score to be updated constantly.
This might be a convenient way to fine tune a multiple sequence alignment by
hand. However, automatic updating requires some CPU time and might be
slow on older computers. You will need to try this on your own system to see
if it is acceptable for your use.
— Custom Score Adornments…
This option is used for adjusting the display of multiple sequences. It allows
you to display aligned or non-aligned characters using highlighting of the
characters or the backgrounds behind the characters. This is discussed in
detail in “Using Custom Score Adornments”, page 3-14 and in Tutorial 5:
“Multiple Sequence Alignments”, page 2-24.
Page 6-50
Menu Items
• Format Sequence...
is discussed in “Formatting A Sequence Within the Sequence
Editor”, page 3-5.
Format Sequence…
• Use Extra Caution…
Use Extra Caution…
is discussed in the text around Figure 3.5, page 3-6.
Page 6-51
Menu Items
Sidebar Menu
• Adjust Size To Contents
The Adjust Size To Contents menu item will adjust the vertical height of the sidebar
text object so that it will exactly contain the entire contents. This is a useful
command if the editing operations you perform on the sidebar text causes it
to shrink or grow.
Page 6-52
Menu Items
Table Menu
The Table menu contains commands needed to modify and
change the display of user created tables. The different parts of
a user table are shown in Figure 6.32.
• Show/Hide Column Headers
Show/Hide Column Headers
will toggle the display to either show or hide the col-
Figure 6.32: A User Table
umn headers – the top horizontal row.
• Show/Hide Row Headers
will toggle the display to either show or hide the row
headers – the left vertical column.
Show/Hide Row Headers
• Insert Row/Column
The Insert Row/Column menu option will be enabled whenever either a row or a
column is selected. It will insert either a row above the currently selected row,
or a column to the left of the currently selected column.
• Delete Row(s)/Column(s)
The Delete Row(s)/Column(s) menu option will delete the selected rows (or colPage 6-53
Menu Items
umns).
• Add Column(s) At Right
The Add Column(s) At Right menu option will place additional columns at the far
right end of the table. This is not the same as inserting a row or a column
internally in the table.
• Add Row(s) At Bottom
The Add Row(s) At Bottom menu option will place additional rows at the very bottom of the table. This is not the same as inserting a row or a column internally in the table.
• Adjust Size To Contents
The Adjust Size To Contents menu item will adjust the size of the table object so
that it will exactly contain the entire contents. This is a useful command if the
editing operations you perform on the table causes it to shrink or grow.
Page 6-54
Tips For Using The Gene Inspector
Chapter 7
Tips For Using The Gene
Inspector
Using Extra Disk Space for Analyses
The Gene Inspector has been designed to allow you to work with very large
sequencesa. We have done this in anticipation of results from the Human
Genome Project. Many other sequence analysis packages limit you to working
with what fits in the RAM (memory) of your computer. To handle analysis of
sequences larger than your available memory requires storing sequences on
disk and storing temporary data on disk while the analysis is being run. Some
analyses, like dot matrix and global sequence alignment, require a significant
amount of disk space (roughly proportional to the product of the length of
each sequence). As a consequence of using disk space instead of RAM
space for storing files during analysis, some of the analyses (those which
require alot of reading and writing of information) will be slower in the Gene
Inspector than in other programs. This is a trade-off for allowing you to work
with large sequences.
The Gene Inspector stores its temporary working files in the GI Data folder
(in a folder called Scratch Data). The GI Data folder needs to be in the same
folder as the Gene Inspector itself. All temporary files are stored in the
Scratch Data folder during an analysis. If you have alot of extra disk space on
the disk which contains the Gene Inspector, you should not encounter any
limitations. However, if you are doing analyses with large sequences (e.g. a
a.
There is no built in limitation to the size of sequences which can be analyzed by the
Gene Inspector – it is limited only by your disk space.
Page 7-1
Tips For Using The Gene Inspector
dot matrix comparing two sequences each of 5,000 characters – requiring
more than 25 megabytes of data storage) you might run out of disk space. If
you have a different volume (disk) that contains adequate space you can use
that space for the scratch data. The extra volume might be a removable
media drive (e.g. SyQuest, Zip, CD-RW, etc.) or a different permanently connected hard drive.
You can tell the Gene Inspector to use a new “scratch volume” by creating an
alias to a Scratch Data folder which you create on a new scratch volume. Do
the following steps:
1. Locate and open the folder named GI Data. It is in the same folder as
your Gene Inspector application.
2. Locate the folder called Scratch Data (inside the GI Data folder) and drag it to
the volume you want to use as your scratch volumeb.
3. Drag your original Scratch Data folder into the Trash. After doing this you
should have a GI Data folder without a Scratch Data folder inside it.
4. Select (click once) the Scratch Data folder located on the new Scratch
Volume.
5. Choose Make Alias from the File menu to create an alias to the new Scratch
Data folder. It will be named “Scratch Data Alias”.
6. Drag the Scratch Data Alias icon you just created on the new Scratch
Volume into the original GI Data folder (the one in the same location as
the Gene Inspector application).
7. Rename the alias that you just moved into the GI Data folder in step 6 to
“Scratch Data”. You will now have a GI Data folder containing a Scratch
Data icon that is an alias to the Scratch Data folder on the new Scratch
Volume. The Gene Inspector will now use the Scratch Data folder on the
new Scratch Volume to store the temporary files during analyses.
8. Discard the “Scratch Data Alias” from the Scratch Volume. It is not
needed any longer.
To return to the previous state and discontinue using the scratch volume for
b.
The Scratch Volume should contain the extra hard disk space you want to use for holding temporary files during analyses. You can use any local disk that is mounted on your
desktop, including removable media disks. You should not use a remote file server volume because it will be extremely slow due to the large amount of data that needs to be
transferred to and from the scratch folder.
Page 7-2
Tips For Using The Gene Inspector
temporary data, just remove the Scratch Data alias from the GI Data folder.
The next time Gene Inspector is run, it will create a new Scratch Data folder
to be used for analyses.
Analyses That Take a Long Time
The Gene Inspector is an interactive program. This means that you are free
to do whatever you want whenever you want to do it. For example, when an
analysis is running, you can continue to take notes or draw in the GI Notebook. You can launch additional analyses, or even switch to another application while Gene Inspector continues to run the analyses you already started.
This provides you with a great deal of flexibility in how you work with the program. You are never locked out from doing something else because an analysis is running.
The trade-off for having an interactive program is that some of the operations
are slower because the computer must constantly be watching the keyboard
and the mouse for any user inputc. To work effectively with the Gene Inspector, you should learn to start analyses and then continue with other work – in
GI or in other applications. This might take some getting used to because
there is a natural tendency to watch an analysis run. Because GI does not
prevent you from doing other work, you are never slowed down by its operation.
Temporarily Pausing Long Running Analyses
Sometimes you might have a time-consuming analysis executing and realize
that you need to get some other result before waiting for the running analysis
to complete – yet you do not want to cancel the analysis that has been running for a while. You can do this by taking advantage of the High Priority
option (see also page 4-3). This allows you to put on hold any running analysis (and all low priority analyses in the queue to be run) while you run a
high priority analysis. After the high priority analysis is complete, the queue
c.
Other programs often completely take over the CPU while they are doing their tasks.
This other “modal” approach gives the user no flexibility to perform other operations while
the application is running.
Page 7-3
Tips For Using The Gene Inspector
will resume with the next analysis in line.
This is another example of a way in which the Gene Inspector can conduct
analyses and let you continue to work without waiting for the program to complete its current activity.
About GI Notebook Size
The size of a GI Notebook is determined by the contents of the notebook. All
background text and notebook objects contribute to the notebook size. Again,
because of the extreme interactivity of the Gene Inspector, the program stores
a great deal of information about how to rerun analyses, and information
about the analysis parameters, and hotlinked sequences/analyses. For most
analyses, the extra information does not amount to much extra size. You can
see how much disk space is required for a particular object by selecting the
object and then choosing Notebook ?Get Info… (see Figure 5.9, page 5-11).
For the dot matrix analysis, a large amount of disk space is used for sharing
all the similarity values at each position in the matrix. This information is
needed to allow you to reset the formatting information for displaying the
analysis output. If the amount of disk space is large and you are finished
experimenting with the thresholds, you can choose to discard data as discussed in the text related to Figure 4.23, page 4-29. This will leave a picture
of the output in the notebook and will allow you to recalculate the analysis but
you will not be able to alter the thresholds for this particular output object.
Sharing Setups With Colleagues
You may find that you have defined a number of Analysis Setups that work
well for your purposes and contains all the parameters you find to be most
useful. If you would like to share this setup with a colleague, it is easy to do.
Each Analysis Setup is stored as a file on your hard disk. The setups are
stored in the “Analysis Setups” folder that resides in the GI Data folder. The
GI Data folder is in the same folder as your Gene Inspector application. To
send the Setup to a colleague, just copy the setup file from the Analysis Setups folder and give it to your colleague. When your colleague receives it, he/
Page 7-4
Tips For Using The Gene Inspector
she should place it into the Analysis Setups folder on his/her hard disk. The
next time Gene Inspector is started, the analysis setup will be available under
the Analysis menu along with all the other stored Setups.
Printing and Viewing Large Objects
Very often you might have large objects such as long lists of restriction sites
or other tables of data. If these objects are larger than one printer page, you
can define your GI Notebook sheet to be much larger than a single printer
page (see “GI Notebook Layout”, page 5-4), and can print the object as part
of the notebook in this way. Alternatively, you can open the object for editing
(see “Open for Editing”, page 5-14) and print it from within its own “private”
window.
Large objects can be viewed by choosing Notebook ?Open For Editing. This will
place the object in its own window along with scroll bars. By choosing
“Show/Hide Page Breaks”, page 5-14, you can see where the printer page
breaks will occur.
Page 7-5
Tips For Using The Gene Inspector
Page 7-6
Appendix
Tables
Appendix
Tables
Argos, et al.
This table is based on the statistical distribution of specific amino acids in
membrane vs. non-membrane segments for a sample set of proteins [Argos,
et al., Eur. J. Biochem. 128:55 (1982)]. This Transmembrane Helix analysis
is identical to the Membrane Buried Regions analysis.
Bull & Breese
This table is based on variations in surface tension as a function of amino
acid concentration. This is related to the free energy of transfer between surface and solution. Arch. Biochem. Biophys. 161:665 (1974).
Eisenberg, et al.
This table is based on consensus values obtained in a number of ways optimized for alpha-helical membrane domains. These values are often used
in hydrophobic moment analyses. J. Mol. Biol. 179:125 (1984).
Emini, et al.
Based on paper by Emini, et al., J. Virol. 55(3):836 (1985), this paper uses
the values in Janin, et al. J. Mol. Biol. 125:357 (1978). To indicate surface
accessibility, the values in column 5 of table 1 are subtracted from 1. This
analysis is different from the Surface Probability analysis which uses a different calculation method.
Engelman & Steitz
Data from Engelman and Steitz, Cell 23:411 (1981). These data indicate the
likelihood that an amino acid will lie in the interior of a protein. This HydropaPage A-1
Appendix
Tables
thy analysis is identical to the Protein Interior analysis.
Engelman, et al.
This hydropathy table is based on Engelman et al. [Ann. Rev. Biophys. Biophys. Chem. 15:321 (1986)]. This is identical to the Hydropathy analysis with
the same table.
Fauchere & Pliska
This hydropathy table is based on free energy changes in amino acid side
chain analogs between water and 1-octanol. Eur. J. Med. Chem. - Chim.
Ther. 18:369 (1983).
Fraga
Based on the data from Fraga, Can. J. Biochem. 60:2606 (1982). These
values are modified from the original Hopp-Woods table to include recognition
factors. This represents the ability of an amino acid to be recognized by other
amino acids.
GES
From Engelman, Steitz, and Goldman, Ann. Rev. Biophys. Biophys. Chem.
15:321 (1986). This is sometimes called the GES scale. It is designed to
show transbilayer helices. This hydropathy analysis is identical to the
Engelman, et al. Transmembrane Helix analysis.
Hopp and Woods
This analysis is based on free energy changes in amino acid side chains
between water and ethanol [Proc. Nat. Acad. Sci. USA 78:3824 (1981)]. It
was designed to determine antigenicity but has become popular as a standard
hydropathy analysis. The Antigenicity and Hydropathy analyses using this
table are identical.
Page A-2
Appendix
Tables
Janin
Based on values in Janin, Nature 277:491 (1979) which determined the surface accessibility of amino acids. The ratio of buried:accessible values in the
paper (Table 1, column 4) were converted to the fraction accessible. This
Antigenicity analysis is identical to the Accessible Surface Area analysis.
Kyte and Doolittle
This hydropathy analysis table is based on an aggregate scale obtained by
several methods and fine tuned manually. The original paper recommends a
window of 7, but 19-21 is also useful for determining membrane spanning
segments. J. Mol. Biol. 157:105 (1982).
Manavalan & Ponnuswamy
Based on data from Manavalan & Ponnuswamy, Nature 275:673 (1978).
This data indicates the likelihood that an amino acid will be surrounded by
hydrophobic amino acids. Values in Table 1, col 2 were “standardized” to Gln
as suggested by the authors. This Hydropathy analysis is identical to the Surrounding Hydrophobicity analysis.
Parker, et al.
This hydropathy or antigenicity analysis is based on the partitioning of model
peptides on an HPLC column. Based on Parker, et al. [ Biochemistry
25:5425 (1986)]. The Hydropathy and Antigenicity analyses using this table
are identical.
Sweet and Eisenberg
Based on data from Sweet & Eisenberg [J. Mol. Biol. 171:479 (1983)]. This
table of data is derived by correlating data from a number of other hydropathy
tables and from observed amino acid replacement rates. This Hydropathy
analysis is identical to the Optimal Matching Hydrophobicity analysis.
Page A-3
Appendix
Tables
Thornton, et al.
This antigenicity table is based on side chain protrusion from the protein
backbone. This is based on Thornton, et al. [EMBO J. 5(2):409 (1986)].
The Antigenicity analysis with the Thornton table is identical to the Side Chain
Protrusion analysis.
von Heijne
Based on data from von Heijne [Eur. J. Biochem. 116:419 (1981)]. This table
is based on the known occurrences of specific amino acids in both prokaryotic
and eukaryotic signal sequences. This Hydropathy analysis is identical to the
Signal Sequence analysis.
Welling, et al.
This antigenicity table is based on known antigenic regions in a sample protein set. See Welling, et al. [FEBS Letts. 188(2):215 (1985)].
Wolfenden, et al.
This hydropathy analysis is based on free energy of transfer between vapor
phase and solution for amino acid side chain analogs. [Wolfenden, et al.,
Science 206:575 (1979)]. This Hydropathy analysis is identical to the
Hydration Potential Analysis.
Page A-4
Appendix
Prosite Language Definitions
Prosite Language Definitions
The Prosite language was developed to enable searching of databases for
very specific patterns. It has the elegance of being very specific yet general.
Prosite patterns are described using the following conventions:
• The standard IUPAC one-letter codes for the amino acids are used.
• The symbol ‘x’ is used for a position where any amino acid is accepted.
• Inclusive ambiguities are indicated by listing acceptable amino acids for a
given position between square parentheses ‘[ ]’. For example: [ALT]
stands for Ala or Leu or Thr.
• Exclusive ambiguities are indicated between a pair of curly brackets ‘{ }’.
The amino acids that are not accepted at a given position are placed in the
brackets. For example: {AM} stands for any amino acid except Ala and
Met.
• Each element in a pattern is separated from its neighbor by a ‘-’.
• Repetition of an element of the pattern can be indicated by following that
element with a numerical value or a numerical range between parenthesis.
Examples: x(3) corresponds to x-x-x; x(2,4) corresponds to x-x or
x-x-x or x-x-x-x.
• When a pattern is restricted to either the N- or C-terminal of a sequence,
that pattern either starts with a ‘<‘ symbol or ends with a ‘>’ symbol,
respectively.
• A period ends the pattern.
Examples:
[AC]-X-V-X(4)-{ED}
This pattern is interpreted as: [Ala or Cys]-any-Val-any-any-anyany-{any but Glu or Asp}
<A-X-[ST](2)-X(0,1)-V
This pattern, which must be at the N-terminus of the sequence (‘<‘), is
translated as: Ala-any-[Ser or Thr]-[Ser or Thr]-(any or none)-Val
Page A-5
Appendix
Protein Cleavage Sites
Protein Cleavage Sites
Table 1: Protein Cleavage Sites
name
recog seq
comments
acid
D'P
armillaria mellea protease
'K
chymotrypsin
[FWY]'
clostripain
R'
cyanogen bromide
M'
endopeptidase LysC
K'
hydroxylamine
N'G
2M hydroxylamine, pH 9.0
NBS(1)
'[WY]
N-bromo-succinimide, short incubation
NBS(2)
'[HWY]
N-bromo-succinimide, long incubation
NTCB
'C
2-nitro-5-thiobenzoic acid + Ni
pancreatic elastase
'[AGSV]
pepsin
'[FWY]
proendopeptidase
P'
thermolysin
'[ILV]
trypsin
[KR]'
V8(1)
E'
staphylococcal protease V8,
ammonium acetate, pH 4
V8(2)
'[DE]
staphylococcal protease V8,
phosphate buffer, pH 7.8
Page A-6
pH 2.5, mild acid hydrolysis
Appendix
IUPAC Standard Nucleic Acid Codes
IUPAC Standard Nucleic Acid Codes
Table 2: Nucleic Acid Codes
Code
Bases
Mnemonic
A
A
Adenine
C
C
Cytosine
G
G
Guanine
T (U)
T (U)
Thymine (Uracil)
R
A or G
puRine
Y
C or T
pYrimidine
S
G or C
Strong bonding
W
A or T
Weak bonding
K
G or T
Keto
M
A or C
aMino
B
C or G or T
not A
D
A or G or T
not C
H
A or C or T
not G
V
A or C or G
not T
N
any base
aNy
Page A-7
Appendix
IUPAC Standard Amino Acid Codes
IUPAC Standard Amino Acid Codes
Table 3: Amino Acid Codes
Amino Acid
1 Letter Code
3 Letter Code
alanine
A
ala
cysteine
C
cys
aspartic acid
D
asp
glutamic acid
E
glu
phenylalanine
F
phe
glycine
G
gly
histidine
H
his
isoleucine
I
ile
lysine
K
lys
leucine
L
leu
methionine
M
met
asparagine
N
asn
proline
P
pro
glutamine
Q
gln
arginine
R
arg
serine
S
ser
threonine
T
thr
valine
V
val
tryptophan
W
trp
tyrosine
Y
tyr
Page A-8
Appendix
Vectors by Supplier
Vectors by Supplier
Amersham
1.
2.
3.
4.
5.
M13mp10
M13tg130
M13tg131
pAT153
pUEX2
Boehringer
1. M13BM20
2. M13BM21
3. M13mp8
4. M13mp9
5. pBR322
6. pBR328
7. pBTac2
8. pEX2
9. pEX3
10. pHT3T7bm(+)
11. pHT3T7bm(-)
12. pSPT18
13. pSPT19
14. pSPTbm20
15. pSPTbm21
16. pUCbm20
17. pUCbm21
18. pXa1
BRL
1.
2.
3.
4.
5.
6.
pAMP1
pAMP10
pAMP18
pAMP19
pAMP2
pHC79
Page A-9
Appendix
7. pHSV-106
8. pSP18
9. pSP19
10. pSP6-T3
11. pSP6-T7-19
12. pSPORT1
13. pSPORT2
14. pSV-SPORT1
15. pT712
16. pT713
17. pT7T3-18
18. pT7T3-19
19. pT7T3alpha-19
Clontech
1. EMBL3-LeftArm
2. EMBL3-RightArm
3. EMBL3-S6/T7-LeftArm
4. EMBL3-S6/T7-RightArm
5. pAcUW31
6. pADbeta
7. pBacPAK1
8. pBacPAK8
9. pBacPAK9
10. pbetagal-Basic
11. pbetagal-Control
12. pbetagal-Enhancer
13. pbetagal-Promoter
14. pBI101
15. pBI101.2
16. pBI101.3
17. pBin19
18. pCMVbeta
19. pDIRECT
20.pDR2
21. pEUK-C1
22.pEX1
Page A-10
Vectors by Supplier
Appendix
Vectors by Supplier
23.pGAD10
24.pGAD424
25.pGBT9
26.pGFP
27.pGFP-1
28.pGFP-C1
29.pGFP-C2
30.pGFP-C3
31. pGFP-N1
32.pGFP-N2
33.pGFP-N3
34.pGUSN358-S
35.pKK388-1
36.pMAM
37.pMAMneo
38.pMAMneo-Blue
39.pMAMneo-Cat
40.pMAMneo-LUC
41. pNASSbeta
42.pNOM102
43.pPUR
44.pRAJ275
45.pSEAP-Basic
46.pSEAP-Control
47.pSEAP-Enhancer
48.pSEAP-Promoter
49.pSV2neo
50.pSVbeta
51. pT3T7-luc
52.pTKbeta
53.pUC118
54.pUC119
55.pYACneo
56.pYEUra3
57.rpDR2
58.rpSE937
Page A-11
Appendix
IBI
1.
2.
3.
4.
5.
pIBI24
pIBI25
pIBI30
pIBI31
pSTneo
In Vitrogen
1. p2Bac
2. pA0815
3. pAC360
4. pAL-781
5. pBlueBac4
6. pBlueBac4CAT
7. pBlueBacHis2CAT
8. pCDM8
9. pcDNA3
10. pcDNA3CAT
11. pcDNAI
12. pcDNAIAmp
13. pcDNAIAmpCAT
14. pcDNAII
15. pCEP4
16. pCEP4CAT
17. pCMV-EBNA
18. pCR3
19. pCR3-Uni
20.pCRII
21. pEBVHIS-LacZ
22.pEBVHisCAT
23.pHIL-D2
24.pHIL-S1
25.pLambdaPop6
26.pLEX
27.pMelBacB
28.pMEP4
29.pPIC9
Page A-12
Vectors by Supplier
Appendix
Vectors by Supplier
30.pPIC9K
31. pRcCMV
32.pRcRSV
33.pREP10
34.pREP4
35.pREP4CAT
36.pREP7
37.pREP7CAT
38.pREP8
39.pREP8CAT
40.pREP9
41. pSE280
42.pSE380
43.pSE420
44.pSL301
45.pTrcHisA
46.pTrcHisB
47.pTrcHisC
48.pTrcHisCAT
49.pTrx
50.pTrxFus
51. pVL1392
52.pVL1393
53.pYES2
54.pZeoSV
55.pZeoSVLacZ
56.pZErO
New England Biolabs (NEB)
1.
2.
3.
4.
5.
6.
7.
8.
pACYC177
pACYC184
pIAN7
pLITMUS28
pLITMUS29
pLITMUS38
pLITMUS39
pMAL-c
Page A-13
Appendix
9. pMAL-c2
10. pMAL-cRI
11. pMAL-p
12. pMAL-p2
13. pNEB193
14. Yep24
15. Yip5
NovaGen
1. M13mp18
2. pBlueSTAR1
3. pCITE-3a(+)
4. pCITE-3b(+)
5. pCITE-3c(+)
6. pCITE-4a(+)
7. pCITE-4b(+)
8. pCITE-4c(+)
9. pCITE1
10. pCITE2b
11. pCITE2c
12. pET11
13. pET11a
14. pET11b
15. pET11c
16. pET11d
17. pET12a
18. pET12b
19. pET12c
20.pET14b
21. pET15b
22.pET16b
23.pET17b
24.pET17xb
25.pET19b
26.pET20b(+)
27.pET21(+)
28.pET21a(+)
Page A-14
Vectors by Supplier
Appendix
Vectors by Supplier
29.pET21b(+)
30.pET21c(+)
31. pET21d(+)
32.pET22b(+)
33.pET23(+)
34.pET23a(+)
35.pET23b(+)
36.pET23c(+)
37.pET23d(+)
38.pET24(+)
39.pET24a(+)
40.pET24b(+)
41. pET24C(+)
42.pET24d(+)
43.pET25b(+)
44.pET26b(+)
45.pET27b(+)
46.pET28a(+)
47.pET28b(+)
48.pET28c(+)
49.pET29a(+)
50.pET29b(+)
51. pET29c(+)
52.pET3
53.pET30a(+)
54.pET30b(+)
55.pET30c(+)
56.pET31b(+)
57.pET32a
58.pET32b
59.pET32c
60.pET3a
61. pET3b
62.pET3c
63.pET3d
64.pET3xa
65.pET3xb
Page A-15
Appendix
66.pET3xc
67.pET5
68.pET5a
69.pET5b
70.pET5c
71. pET7
72.pET9
73.pET9a
74.pET9b
75.pET9c
76.pET9d
77.pEXlox(+)
78.pLysE
79.pLysS
80.pOCUS1
81. pOCUS2
82.pOCUSlox
83.pSCREEN1b(+)
84.pSHlox1
85.pT7BlueR
86.pTOPE1b(+)
Phage
1.
2.
3.
4.
5.
6.
f1
fd
fd-478
fd-tet
lambda
M13
Pharmacia
1.
2.
3.
4.
5.
M13mp19
pBPV
pCANTAB5
pcDV1
pCH110
Page A-16
Vectors by Supplier
Appendix
Vectors by Supplier
6. pCM7
7. pDR540
8. pExCell
9. pEZZ18
10. pGEX-1lambdaT
11. pGEX-2TK
12. pGEX-3X
13. pGEX-4T1
14. pGEX-4T2
15. pGEX-4T3
16. pGEX-5X1
17. pGEX-5X2
18. pGEX-5X3
19. pKK223-3
20.pKK232-8
21. pKK233-2
22.pMC1871
23.pMDSG
24.pMSG-CAT
25.pNEO
26.pPL-lambda
27.pRIT2T
28.pSL1180
29.pSL1190
30.pSVK3
31. pSVL
32.pT7T3-18D
33.pT7T3-18U
34.pT7T3-19U
35.pT7T3alpha-A18
36.pTZ18R
37.pTZ19R
38.pUC18
39.pUC19
40.pUC4K
41. pXa2
42.pXa3
Page A-17
Appendix
Promega
1. PADVAntage
2. pALTCON
3. pALTER-1
4. pALTER-Ex1
5. pALTER-Ex2
6. pCAT-C
7. pCAT-E
8. pCAT-P
9. pCI
10. pCI-neo
11. pET-5b
12. pET-5c
13. pET-9a
14. pET-9b
15. pET-9c
16. pGEM-11Zf(+)
17. pGEM-11Zf(-)
18. pGEM-13Zf(+)
19. pGEM-15Zf(-)
20.pGEM-2
21. pGEM-3
22.pGEM-3Z
23.pGEM-3Zf(+)
24.pGEM-3Zf(-)
25.pGEM-4
26.pGEM-4Z
27.pGEM-5Zf(+)
28.pGEM-5Zf(-)
29.pGEM-7Zf(+)
30.pGEM-7Zf(-)
31. pGEM-9Zf(-)
32.pGEM-luc
33.pGEM1
34.pGEMEX-1
35.pGEMEX-2
36.pGL2-B
Page A-18
Vectors by Supplier
Appendix
Vectors by Supplier
37.pGL2-C
38.pGL2-E
39.pGL2-P
40.pGL3-B
41. pGL3-C
42.pGL3-E
43.pGL3-P
44.PhiX-174
45.PinPoint Xa-1
46.PinPoint Xa-2
47.PinPoint Xa-3
48.PinPoint-C
49.pSI
50.pSP64 (polyA)
51. pSP64
52.pSP65
53.pSP70
54.pSP71
55.pSP72
56.pSP73
57.pSPluc+
58.pSPluc+NF
59.pSV-B-GAL
Sigma
1. ColE1
2. pBK614
3. pBR325
4. pMB9
5. pTZ18U
6. pTZ19U
7. pUB110
8. pUC8
9. pUC9
10. pYAC4
11. pYAC55
Page A-19
Appendix
Stratagene:
1. M13 PhageScript
2. pBC KS(+)
3. pBC KS(-)
4. pBC SK(+)
5. pBC SK(-)
6. pBlueScribe KS(+)
7. pBlueScribe KS(-)
8. pBlueScribe M13
9. pBlueScribe M13(+)
10. pBlueScribe M13(-)
11. pBlueScribe SK(+)
12. pBlueScribe SK(-)
13. pBluescript II KS(+)
14. pBluescript II KS(-)
15. pBluescript II SK(+)
16. pBluescript II SK(-)
17. pBluescript KS(+)
18. pBluescript KS(-)
19. pBluescript SK(+)
20.pBluescript SK(-)
21. pBS
22.pBS(+)
23.PhageScript SK
24.pRS403
25.pRS404
26.pRS405
27.pRS406
28.pRS413
29.pRS414
30.pRS415
31. pRS416
32.pT3T7-lac
33.pT3T7BM
34.pWE15
Page A-20
Vectors by Supplier
Appendix
Vectors by Supplier
U.S. Biochemicals (USB)
1. pAX4a(+)
2. pAX4a(-)
3. pAX4b(+)
4. pAX4b(-)
5. pAX4c(+)
6. pAX4c(-)
7. pAX5(+)
8. pAX5(-)
9. pCF20
10. pMEX5
11. pMEX6
12. pMEX7
13. pMEX8
14. pT7-0
15. pT7-1
16. pT7-2
17. pTRXN(+)
18. pTRXN(-)
19. pXPRS(+)
20.pXPRS(-)
Page A-21
Appendix
List of all Vectors Included With Gene Inspector:
List of all Vectors Included With Gene Inspector:
Vector NameFile Name
1.
2.
3.
4.
5.
6.
7.
8.
9.
10.
11.
12.
13.
14.
15.
16.
17.
18.
19.
20.
21.
22.
23.
24.
25.
26.
27.
28.
29.
30.
31.
32.
33.
34.
35.
36.
37.
38.
39.
40.
ColE1
EMBL3-LeftArm
EMBL3-RightArm
EMBL3-S6/T7-LeftArm
EMBL3-S6/T7-RightArm
f1 phage
fd phage
fd-478 phage
fd-tet phage
lambda phage
M13 phage
M13 PhageScript
M13BM20
M13BM21
M13mp10
M13mp18
M13mp19
M13mp8
M13mp9
M13tg130
M13tg131
p2Bac
pA0815
pAC360
pAcUW31
pACYC177
pACYC184
pADbeta
PADVAntage
pAL-781
pALTCON
pALTER-1
pALTER-Ex1
pALTER-Ex2
pAMP1
pAMP10
pAMP18
pAMP19
pAMP2
pAT153
Page A-22
Sigma
Clontech
Clontech
Clontech
Clontech
Phage
Phage
Phage
Phage
Phage
Phage
Stratagene
Boehringer
Boehringer
Amersham
NovaGen
Pharmacia
Boehringer
Boehringer
Amersham
Amersham
In Vitrogen
In Vitrogen
In Vitrogen
Clontech
New England Biolabs
New England Biolabs
Clontech
Promega
In Vitrogen
Promega
Promega
Promega
Promega
BRL
BRL
BRL
BRL
BRL
Amersham
Appendix
41.
42.
43.
44.
45.
46.
47.
48.
49.
50.
51.
52.
53.
54.
55.
56.
57.
58.
59.
60.
61.
62.
63.
64.
65.
66.
67.
68.
69.
70.
71.
72.
73.
74.
75.
76.
77.
78.
79.
80.
81.
82.
83.
pAX4a(+)
pAX4a(-)
pAX4b(+)
pAX4b(-)
pAX4c(+)
pAX4c(-)
pAX5(+)
pAX5(-)
pBacPAK1
pBacPAK8
pBacPAK9
pBC KS(+)
pBC KS(-)
pBC SK(+)
pBC SK(-)
pbetagal-Basic
pbetagal-Control
pbetagal-Enhancer
pbetagal-Promoter
pBI101
pBI101.2
pBI101.3
pBin19
pBK614
pBlueBac4
pBlueBac4CAT
pBlueBacHis2CAT
pBlueScribe KS(+)
pBlueScribe KS(-)
pBlueScribe M13
pBlueScribe M13(+)
pBlueScribe M13(-)
pBlueScribe SK(+)
pBlueScribe SK(-)
pBluescript II KS(+)
pBluescript II KS(-)
pBluescript II SK(+)
pBluescript II SK(-)
pBluescript KS(+)
pBluescript KS(-)
pBluescript SK(+)
pBluescript SK(-)
pBlueSTAR1
List of all Vectors Included With Gene Inspector:
U.S. Biochemicals
U.S. Biochemicals
U.S. Biochemicals
U.S. Biochemicals
U.S. Biochemicals
U.S. Biochemicals
U.S. Biochemicals
U.S. Biochemicals
Clontech
Clontech
Clontech
Stratagene
Stratagene
Stratagene
Stratagene
Clontech
Clontech
Clontech
Clontech
Clontech
Clontech
Clontech
Clontech
Sigma
In Vitrogen
In Vitrogen
In Vitrogen
Stratagene
Stratagene
Stratagene
Stratagene
Stratagene
Stratagene
Stratagene
Stratagene
Stratagene
Stratagene
Stratagene
Stratagene
Stratagene
Stratagene
Stratagene
NovaGen
(USB)
(USB)
(USB)
(USB)
(USB)
(USB)
(USB)
(USB)
Page A-23
Appendix
84.
85.
86.
87.
88.
89.
90.
91.
92.
93.
94.
95.
96.
97.
98.
99.
100.
101.
102.
103.
104.
105.
106.
107.
108.
109.
110.
111.
112.
113.
114.
115.
116.
117.
118.
119.
120.
121.
122.
123.
124.
125.
126.
pBPV
pBR322
pBR325
pBR328
pBS
pBS(+)
pBTac2
pCANTAB5
pCAT-C
pCAT-E
pCAT-P
pCDM8
pcDNA3
pcDNA3CAT
pcDNAI
pcDNAIAmp
pcDNAIAmpCAT
pcDNAII
pcDV1
pCEP4
pCEP4CAT
pCF20
pCH110
pCI
pCI-neo
pCITE-3a(+)
pCITE-3b(+)
pCITE-3c(+)
pCITE-4a(+)
pCITE-4b(+)
pCITE-4c(+)
pCITE1
pCITE2b
pCITE2c
pCM7
pCMV-EBNA
pCMVbeta
pCR3
pCR3-Uni
pCRII
pDIRECT
pDR2
pDR540
Page A-24
List of all Vectors Included With Gene Inspector:
Pharmacia
Boehringer
Sigma
Boehringer
Stratagene
Stratagene
Boehringer
Pharmacia
Promega
Promega
Promega
In Vitrogen
In Vitrogen
In Vitrogen
In Vitrogen
In Vitrogen
In Vitrogen
In Vitrogen
Pharmacia
In Vitrogen
In Vitrogen
U.S. Biochemicals (USB)
Pharmacia
Promega
Promega
NovaGen
NovaGen
NovaGen
NovaGen
NovaGen
NovaGen
NovaGen
NovaGen
NovaGen
Pharmacia
In Vitrogen
Clontech
In Vitrogen
In Vitrogen
In Vitrogen
Clontech
Clontech
Pharmacia
Appendix
127.
128.
129.
130.
131.
132.
133.
134.
135.
136.
137.
138.
139.
140.
141.
142.
143.
144.
145.
146.
147.
148.
149.
150.
151.
152.
153.
154.
155.
156.
157.
158.
159.
160.
161.
162.
163.
164.
165.
166.
167.
168.
169.
pEBVHIS-LacZ
pEBVHisCAT
pET-5b
pET-5c
pET-9a
pET-9b
pET-9c
pET11
pET11a
pET11b
pET11c
pET11d
pET12a
pET12b
pET12c
pET14b
pET15b
pET16b
pET17b
pET17xb
pET19b
pET20b(+)
pET21(+)
pET21a(+)
pET21b(+)
pET21c(+)
pET21d(+)
pET22b(+)
pET23(+)
pET23a(+)
pET23b(+)
pET23c(+)
pET23d(+)
pET24(+)
pET24a(+)
pET24b(+)
pET24C(+)
pET24d(+)
pET25b(+)
pET26b(+)
pET27b(+)
pET28a(+)
pET28b(+)
List of all Vectors Included With Gene Inspector:
In Vitrogen
In Vitrogen
Promega
Promega
Promega
Promega
Promega
NovaGen
NovaGen
NovaGen
NovaGen
NovaGen
NovaGen
NovaGen
NovaGen
NovaGen
NovaGen
NovaGen
NovaGen
NovaGen
NovaGen
NovaGen
NovaGen
NovaGen
NovaGen
NovaGen
NovaGen
NovaGen
NovaGen
NovaGen
NovaGen
NovaGen
NovaGen
NovaGen
NovaGen
NovaGen
NovaGen
NovaGen
NovaGen
NovaGen
NovaGen
NovaGen
NovaGen
Page A-25
Appendix
170.
171.
172.
173.
174.
175.
176.
177.
178.
179.
180.
181.
182.
183.
184.
185.
186.
187.
188.
189.
190.
191.
192.
193.
194.
195.
196.
197.
198.
199.
200.
201.
202.
203.
204.
205.
206.
207.
208.
209.
210.
211.
212.
pET28c(+)
pET29a(+)
pET29b(+)
pET29c(+)
pET3
pET30a(+)
pET30b(+)
pET30c(+)
pET31b(+)
pET32a
pET32b
pET32c
pET3a
pET3b
pET3c
pET3d
pET3xa
pET3xb
pET3xc
pET5
pET5a
pET5b
pET5c
pET7
pET9
pET9a
pET9b
pET9c
pET9d
pEUK-C1
pEX1
pEX2
pEX3
pExCell
pEXlox(+)
pEZZ18
pGAD10
pGAD424
pGBT9
pGEM-11Zf(+)
pGEM-11Zf(-)
pGEM-13Zf(+)
pGEM-15Zf(-)
Page A-26
List of all Vectors Included With Gene Inspector:
NovaGen
NovaGen
NovaGen
NovaGen
NovaGen
NovaGen
NovaGen
NovaGen
NovaGen
NovaGen
NovaGen
NovaGen
NovaGen
NovaGen
NovaGen
NovaGen
NovaGen
NovaGen
NovaGen
NovaGen
NovaGen
NovaGen
NovaGen
NovaGen
NovaGen
NovaGen
NovaGen
NovaGen
NovaGen
Clontech
Clontech
Boehringer
Boehringer
Pharmacia
NovaGen
Pharmacia
Clontech
Clontech
Clontech
Promega
Promega
Promega
Promega
Appendix
213.
214.
215.
216.
217.
218.
219.
220.
221.
222.
223.
224.
225.
226.
227.
228.
229.
230.
231.
232.
233.
234.
235.
236.
237.
238.
239.
240.
241.
242.
243.
244.
245.
246.
247.
248.
249.
250.
251.
252.
253.
254.
255.
pGEM-2
pGEM-3
pGEM-3Z
pGEM-3Zf(+)
pGEM-3Zf(-)
pGEM-4
pGEM-4Z
pGEM-5Zf(+)
pGEM-5Zf(-)
pGEM-7Zf(+)
pGEM-7Zf(-)
pGEM-9Zf(-)
pGEM-luc
pGEM1
pGEMEX-1
pGEMEX-2
pGEX-1lambdaT
pGEX-2TK
pGEX-3X
pGEX-4T1
pGEX-4T2
pGEX-4T3
pGEX-5X1
pGEX-5X2
pGEX-5X3
pGFP
pGFP-1
pGFP-C1
pGFP-C2
pGFP-C3
pGFP-N1
pGFP-N2
pGFP-N3
pGL2-B
pGL2-C
pGL2-E
pGL2-P
pGL3-B
pGL3-C
pGL3-E
pGL3-P
pGUSN358-S
PhageScript SK
List of all Vectors Included With Gene Inspector:
Promega
Promega
Promega
Promega
Promega
Promega
Promega
Promega
Promega
Promega
Promega
Promega
Promega
Promega
Promega
Promega
Pharmacia
Pharmacia
Pharmacia
Pharmacia
Pharmacia
Pharmacia
Pharmacia
Pharmacia
Pharmacia
Clontech
Clontech
Clontech
Clontech
Clontech
Clontech
Clontech
Clontech
Promega
Promega
Promega
Promega
Promega
Promega
Promega
Promega
Clontech
Stratagene
Page A-27
Appendix
256.
257.
258.
259.
260.
261.
262.
263.
264.
265.
266.
267.
268.
269.
270.
271.
272.
273.
274.
275.
276.
277.
278.
279.
280.
281.
282.
283.
284.
285.
286.
287.
288.
289.
290.
291.
292.
293.
294.
295.
296.
297.
298.
pHC79
pHIL-D2
pHIL-S1
PhiX-174
pHSV-106
pHT3T7bm(+)
pHT3T7bm(-)
pIAN7
pIBI24
pIBI25
pIBI30
pIBI31
PinPoint Xa-1
PinPoint Xa-2
PinPoint Xa-3
PinPoint-C
pKK223-3
pKK232-8
pKK233-2
pKK388-1
pLambdaPop6
pLEX
pLITMUS28
pLITMUS29
pLITMUS38
pLITMUS39
pLysE
pLysS
pMAL-c
pMAL-c2
pMAL-cRI
pMAL-p
pMAL-p2
pMAM
pMAMneo
pMAMneo-Blue
pMAMneo-Cat
pMAMneo-LUC
pMB9
pMC1871
pMDSG
pMelBacB
pMEP4
Page A-28
List of all Vectors Included With Gene Inspector:
BRL
In Vitrogen
In Vitrogen
Promega
BRL
Boehringer
Boehringer
New England
IBI
IBI
IBI
IBI
Promega
Promega
Promega
Promega
Pharmacia
Pharmacia
Pharmacia
Clontech
In Vitrogen
In Vitrogen
New England
New England
New England
New England
NovaGen
NovaGen
New England
New England
New England
New England
New England
Clontech
Clontech
Clontech
Clontech
Clontech
Sigma
Pharmacia
Pharmacia
In Vitrogen
In Vitrogen
Biolabs
Biolabs
Biolabs
Biolabs
Biolabs
Biolabs
Biolabs
Biolabs
Biolabs
Biolabs
Appendix
299.
300.
301.
302.
303.
304.
305.
306.
307.
308.
309.
310.
311.
312.
313.
314.
315.
316.
317.
318.
319.
320.
321.
322.
323.
324.
325.
326.
327.
328.
329.
330.
331.
332.
333.
334.
335.
336.
337.
338.
339.
340.
341.
pMEX5
pMEX6
pMEX7
pMEX8
pMSG-CAT
pNASSbeta
pNEB193
pNEO
pNOM102
pOCUS1
pOCUS2
pOCUSlox
pPIC9
pPIC9K
pPL-lambda
pPUR
pRAJ275
pRcCMV
pRcRSV
pREP10
pREP4
pREP4CAT
pREP7
pREP7CAT
pREP8
pREP8CAT
pREP9
pRIT2T
pRS403
pRS404
pRS405
pRS406
pRS413
pRS414
pRS415
pRS416
pSCREEN1b(+)
pSE280
pSE380
pSE420
pSEAP-Basic
pSEAP-Control
pSEAP-Enhancer
List of all Vectors Included With Gene Inspector:
U.S. Biochemicals (USB)
U.S. Biochemicals (USB)
U.S. Biochemicals (USB)
U.S. Biochemicals (USB)
Pharmacia
Clontech
New England Biolabs
Pharmacia
Clontech
NovaGen
NovaGen
NovaGen
In Vitrogen
In Vitrogen
Pharmacia
Clontech
Clontech
In Vitrogen
In Vitrogen
In Vitrogen
In Vitrogen
In Vitrogen
In Vitrogen
In Vitrogen
In Vitrogen
In Vitrogen
In Vitrogen
Pharmacia
Stratagene
Stratagene
Stratagene
Stratagene
Stratagene
Stratagene
Stratagene
Stratagene
NovaGen
In Vitrogen
In Vitrogen
In Vitrogen
Clontech
Clontech
Clontech
Page A-29
Appendix
342.
343.
344.
345.
346.
347.
348.
349.
350.
351.
352.
353.
354.
355.
356.
357.
358.
359.
360.
361.
362.
363.
364.
365.
366.
367.
368.
369.
370.
371.
372.
373.
374.
375.
376.
377.
378.
379.
380.
381.
382.
383.
384.
pSEAP-Promoter
pSHlox1
pSI
pSL1180
pSL1190
pSL301
pSP18
pSP19
pSP6-T3
pSP6-T7-19
pSP64
pSP64 (polyA)
pSP65
pSP70
pSP71
pSP72
pSP73
pSPluc+
pSPluc+NF
pSPORT1
pSPORT2
pSPT18
pSPT19
pSPTbm20
pSPTbm21
pSTneo
pSV-B-GAL
pSV-SPORT1
pSV2neo
pSVbeta
pSVK3
pSVL
pT3T7-lac
pT3T7-luc
pT3T7BM
pT7-0
pT7-1
pT7-2
pT712
pT713
pT7BlueR
pT7T3-18
pT7T3-18D
Page A-30
List of all Vectors Included With Gene Inspector:
Clontech
NovaGen
Promega
Pharmacia
Pharmacia
In Vitrogen
BRL
BRL
BRL
BRL
Promega
Promega
Promega
Promega
Promega
Promega
Promega
Promega
Promega
BRL
BRL
Boehringer
Boehringer
Boehringer
Boehringer
IBI
Promega
BRL
Clontech
Clontech
Pharmacia
Pharmacia
Stratagene
Clontech
Stratagene
U.S. Biochemicals (USB)
U.S. Biochemicals (USB)
U.S. Biochemicals (USB)
BRL
BRL
NovaGen
BRL
Pharmacia
Appendix
385.
386.
387.
388.
389.
390.
391.
392.
393.
394.
395.
396.
397.
398.
399.
400.
401.
402.
403.
404.
405.
406.
407.
408.
409.
410.
411.
412.
413.
414.
415.
416.
417.
418.
419.
420.
421.
422.
423.
424.
425.
426.
427.
pT7T3-18U
pT7T3-19
pT7T3-19U
pT7T3alpha-19
pT7T3alpha-A18
pTKbeta
pTOPE1b(+)
pTrcHisA
pTrcHisB
pTrcHisC
pTrcHisCAT
pTrx
pTrxFus
pTRXN(+)
pTRXN(-)
pTZ18R
pTZ18U
pTZ19R
pTZ19U
pUB110
pUC118
pUC119
pUC18
pUC19
pUC4K
pUC8
pUC9
pUCbm20
pUCbm21
pUEX2
pVL1392
pVL1393
pWE15
pXa1
pXa2
pXa3
pXPRS(+)
pXPRS(-)
pYAC4
pYAC55
pYACneo
pYES2
pYEUra3
List of all Vectors Included With Gene Inspector:
Pharmacia
BRL
Pharmacia
BRL
Pharmacia
Clontech
NovaGen
In Vitrogen
In Vitrogen
In Vitrogen
In Vitrogen
In Vitrogen
In Vitrogen
U.S. Biochemicals
U.S. Biochemicals
Pharmacia
Sigma
Pharmacia
Sigma
Sigma
Clontech
Clontech
Pharmacia
Pharmacia
Pharmacia
Sigma
Sigma
Boehringer
Boehringer
Amersham
In Vitrogen
In Vitrogen
Stratagene
Boehringer
Pharmacia
Pharmacia
U.S. Biochemicals
U.S. Biochemicals
Sigma
Sigma
Clontech
In Vitrogen
Clontech
(USB)
(USB)
(USB)
(USB)
Page A-31
Appendix
428.
429.
430.
431.
432.
433.
434.
pZeoSV
pZeoSVLacZ
pZErO
rpDR2
rpSE937
Yep24
Yip5
Page A-32
List of all Vectors Included With Gene Inspector:
In Vitrogen
In Vitrogen
In Vitrogen
Clontech
Clontech
New England Biolabs
New England Biolabs
[A]
Index
A
about this manual ..............................................................................................1-1
absorption coefficient - see “protein physical characteristics”
accessible surface area ..................................................................................4-48
Add Another Analysis… (Analysis Menu) .......................................................6-25
Add Column(s) at Right (Table Menu) ..........................................................6-54
Add Row(s) at Bottom (Table Menu) ............................................................6-54
Add Setup to Menu… (Analysis Menu) ..........................................................6-26
Adjust Size to Contents (Features Menu) ......................................................6-43
Adjust Size to Contents (Sidebar Menu) ........................................................6-52
Adjust Size to Contents (Table Menu) ...........................................................6-54
adjusting table column width ........................................................................... 5-14
adornments ............................................................................................2-21, 6-18
aliases ................................................................................................. 2-44, 6-29
aligning multiple sequences ................................................................. 4-20, 4-52
in sequence editor ......................................................................................2-24
aligning objects ............................................................................................... 5-10
menu item ...................................................................................................6-32
tutorial ............................................................................................... 2-31–2-32
aligning sequences
BLOSUM tables .......................................................................................... 4-51
DNA ............................................................................................................ 4-16
editing thresholds ........................................................................................4-20
gap scoring ................................................................................................. 4-17
PAM tables .................................................................................................4-50
protein .............................................................................................. 2-43, 4-49
Z-score ....................................................................................................... 4-18
Alignment (Sequence Menu) ..........................................................................6-49
ambiguous characters .....................................................................................4-46
amino acid codes table ....................................................................................A-8
amino acid composition ..................................................................................4-53
analyses
also see “nucleic acid analyses”
Index-1
[A]
also see “protein analyses”
analysis chooser ........................................................................................... 4-1
high priority ........................................................................................ 4-4, 6-22
new analysis ............................................................................................... 2-14
pausing .........................................................................................................7-3
recalculating an analysis ............................................................................... 1-7
starting an analysis ....................................................................................... 4-1
analyses that take a long time .........................................................................7-3
analysis chooser
discussion ..................................................................................................... 4-1
draw icons ....................................................................................................4-2
figure ........................................................................................................... 2-14
Analysis Menu
add another analysis .................................................................................. 6-25
add setup to menu ..................................................................................... 6-26
new analysis ............................................................................................... 6-21
previous setup ............................................................................................. 6-21
remove analysis… ...................................................................................... 6-25
remove setup from menu ........................................................................... 6-26
show/hide analysis monitor ........................................................................ 6-21
update setup .............................................................................................. 6-25
analysis monitor ...................................................................................... 4-3, 6-21
analysis setups
adding analyses ............................................................................................4-8
adding analyses (tutorial) .................................................................2-40–2-42
analysis panels .............................................................................................4-3
customizing suites (tutorial) ....................................................................... 2-46
discussion ..................................................................................................... 1-6
input sequence panel ....................................................................................4-2
output location panel .....................................................................................4-2
overview (tutorial) ..............................................................................2-14–2-18
predefined suites (tutorial) ......................................................................... 2-48
analysis tables
creating ...................................................................................................... 6-23
creating (tutorial) ..............................................................................2-63–2-66
antigenicity analyses ...................................................................................... 4-54
appendices ................................................................................... 1-8, 5-16, 6-33
Appendices (Notebook Menu) ....................................................................... 6-33
appendices (tutorial) .............................................................................2-43–2-45
Argos, et al. table ............................................................................................. A-1
Index-2
[B]
Arrangement (Notebook Menu) ...................................................................... 6-31
automatic links - see “hotlinks”
B
background text flow .......................................................................................6-30
base composition .................................................................................. 2-20, 4-21
base distribution ............................................................................................. 4-21
BLAST searching ................................................................................. 2-65, 4-47
BLOCKS search .............................................................................................4-48
bookmarks ............................................................................................. 5-5, 6-30
Bookmarks (Notebook Menu) .........................................................................6-30
box around ................................................................................. 2-53, 3-19, 6-17
bring to front ................................................................................................... 6-31
Bull & Breese table .......................................................................................... A-1
C
Choose GI Data Folder (File Menu) ................................................................6-8
Chou-Fasman structure prediction ..................................................................4-54
Clear (Edit Menu) .......................................................................................... 6-10
Close (File Menu) ............................................................................................6-3
Clustal V algorithm ..........................................................................................3-11
codon frequency tables ...................................................................................4-24
codon preference ............................................................................................4-23
editing codon preference tables .................................................................. 4-13
Color (Format Menu) ..................................................................................... 6-18
column headers .................................................................................... 5-13, 6-53
conditional text ......................................................................................... 1-7, 5-2
Consensus (Sequence Menu) ........................................................................6-49
Consensus (Sequences Menu) ......................................................................6-44
consensus row ...................................................................................... 2-25, 3-12
Copy (Edit Menu) ............................................................................................6-9
Current Window Names (Windows Menu) ...................................................... 6-15
Custom Analysis Setups (Analysis Menu) ......................................................6-26
Custom score adornments .................................................................... 2-25, 3-14
customizing GI menus
adding analysis setups ....................................................................... 4-8, 6-26
adding bookmarks .............................................................................. 5-5, 6-30
Index-3
[D]
adding
adding
adding
adding
adding
tutorial
Cut (Edit
colors ............................................................................................. 2-34
frames ..................................................................................... 5-9, 6-18
numeric formats ............................................................................... 6-19
style sheets ...........................................................................4-10, 6-20
tool extensions ......................................................................5-17, 6-29
...............................................................................................2-34–2-35
Menu) ...............................................................................................6-9
D
data sieving – see “median sieving”
Define Intron (Features Menu) ...................................................................... 6-40
Delete Row(s)/Column(s) (Table Menu) ..................................................... 6-53
dependencies ................................................................................................. 6-36
disk space ........................................................................................................ 7-1
Display (Features Menu) ............................................................................... 6-40
Display (Notebook Menu) .............................................................................. 6-32
Display (Sequence Menu) ............................................................................. 6-47
Display (Sequences Menu) ........................................................................... 6-44
display preferences ........................................................................................ 2-36
dot matrix ...................................................................................................... 4-54
thresholds ................................................................................................... 4-28
window size ............................................................................................... 4-27
Drag & Drop Options… (Edit Menu) .............................................................. 6-13
drag and drop sequence editing .......................................................................3-6
drawing tools ....................................................................................................5-7
E
edit display parameters .................................................................................. 4-44
Edit Menu
clear ............................................................................................................ 6-10
copy ..............................................................................................................6-9
cut .................................................................................................................6-9
drag & drop options… ................................................................................ 6-13
find & replace ..............................................................................................6-11
paste .............................................................................................................6-9
select all ..................................................................................................... 6-10
show clipboard ............................................................................................ 6-14
Index-4
[F]
show selection .............................................................................................6-11
show/hide page breaks .............................................................................. 6-14
special paste ............................................................................................... 6-10
undo .............................................................................................................6-9
editing sequences (tutorial) .................................................................... 2-9–2-13
Eisenberg, et al. table ...................................................................................... A-1
Emini, et al. table ............................................................................................. A-1
Engelman & Steitz table ................................................................................... A-1
Engelman, et al. table ......................................................................................A-2
Export (File Menu) ...........................................................................................6-6
extending a selection ......................................................................................2-20
extra caution .....................................................................................................3-6
extracting DNA from a selected ORF ............................................................. 4-41
F
Fauchere & Pliska table ...................................................................................A-2
Features Menu ............................................................................................... 3-17
adjust size to contents ................................................................................6-43
define intron ...................................................................................... 3-17, 6-40
display .............................................................................................. 3-18, 6-40
grouping ......................................................................................................6-42
mark sites ......................................................................................... 3-17, 6-39
translate ............................................................................................ 3-17, 6-40
undefine intron .................................................................................. 3-17, 6-40
features object – see “GI Notebook - Features Object”
figures, list of ....................................................................................................A-9
File Menu .........................................................................................................6-2
choose GI data folder ...................................................................................6-8
close .............................................................................................................6-3
export ............................................................................................................6-6
import ............................................................................................................6-5
new… ............................................................................................................6-2
open… ..........................................................................................................6-2
page setup… .................................................................................................6-7
print… ...........................................................................................................6-7
quit ................................................................................................................6-8
revert to saved ..............................................................................................6-4
save ..............................................................................................................6-3
Index-5
[G]
save a copy ..................................................................................................6-4
save as .........................................................................................................6-3
Fill (Format Menu) ......................................................................................... 6-16
Find & Replace (Edit Menu) ...........................................................................6-11
find inverted DNA repeats .............................................................................. 4-31
find nucleic acid sequence ............................................................................. 4-34
Find Original (Notebook Menu) ..................................................................... 6-30
find repeats
nucleic acid ................................................................................................ 4-34
protein ........................................................................................................ 4-55
find sequence (Prosite style) ......................................................................... 4-56
Font (Format Menu) ....................................................................................... 6-17
Format Menu
color ............................................................................................................ 6-18
fill ................................................................................................................ 6-16
font ............................................................................................................. 6-17
frames ......................................................................................................... 6-18
lines ............................................................................................................ 6-16
numeric format ............................................................................................ 6-19
paragraph .................................................................................................... 6-19
size ............................................................................................................. 6-17
style ............................................................................................................ 6-17
style sheets ................................................................................................ 6-20
Format Sequence… (Sequence menu) .......................................................... 6-51
Format Sequences… (Sequences menu) ...................................................... 6-44
Fraga table ...................................................................................................... A-2
frames ...........................................................................................4-11, 5-8, 6-18
Frames (Format Menu) .................................................................................. 6-18
G
GC coding prediction ..................................................................................... 4-37
Gene Inspector
installing ........................................................................................................ 1-2
three main parts ............................................................................................ 1-4
updating ........................................................................................................ 1-3
Generate Random… (Sequence Menu) ......................................................... 6-46
GES table ........................................................................................................ A-2
Get Info… (Notebook Menu) ......................................................................... 6-27
Index-6
[G]
GI Data folder ................................................................................................... 7-1
GI notebook
aliases ................................................................................................ 1-7, 2-44
aligning objects overview ............................................................................ 5-10
analysis outputs .......................................................................................... 5-15
appendices .................................................................................................. 5-16
attach bookmark ...........................................................................................5-5
background text (tutorial) ..................................................................2-36–2-37
background text justification ........................................................................ 6-19
bookmarks .................................................................................. 1-7, 2-62, 5-5
conditional text ..............................................................................................5-2
display preferences ............................................................................. 2-36, 5-1
drawing tools .................................................................................................5-7
features object ............................................................................................ 3-16
define intron .......................................................................................... 3-17
description ............................................................................................. 5-16
feature object margins ........................................................................... 3-18
grouping ................................................................................................ 3-18
marking sites ......................................................................................... 3-17
multiple sequence features object ......................................................... 3-19
show/hide site markers ........................................................................ 3-18
translate ................................................................................................ 3-17
undefine intron ...................................................................................... 3-17
features view
defining introns ...................................................................................... 2-51
grouping ................................................................................................2-52
marking sites .............................................................................. 2-52, 6-39
multiple sequences ...............................................................................6-44
peptide numbering style ........................................................................2-52
translating DNA ..................................................................................... 2-51
tutorial ......................................................................................... 2-51–2-54
frames ................................................................................................. 5-8, 6-18
GI appendices - see appendices
GI notebook aligning analysis objects - see “aligning analysis objects”
layout ..........................................................................................................6-37
moving objects to appendices ..................................................................... 5-16
navigation ...................................................................................................... 1-7
notebook layout ...........................................................................................2-48
open for editing ................................................................................. 4-44, 5-14
overview .................................................................................................1-6, 5-1
Index-7
[H]
preferred size for objects ..............................................................................5-8
reduce to fit ............................................................................................... 2-48
selection ........................................................................................................2-2
size ...............................................................................................................7-4
style sheets ...................................................................................................5-3
target ............................................................................................................2-2
text flow ............................................................................................2-36, 5-10
text standoff ................................................................................................ 5-10
tool extensions .................................................................1-8, 5-17, 5-18, 6-28
tools ........................................................................................................... 6-27
tutorial ........................................................................................................ 2-62
GI notebook objects
aligning ............................................................................................ 6-32, 6-49
analysis outputs .......................................................................................... 5-15
frames ................................................................................................. 4-11, 5-8
get info ....................................................................................................... 2-36
getting info ...................................................................................................5-11
grouping ............................................................................................. 5-8, 6-32
modifying .......................................................................................................4-9
preferred size ..................................................................................... 5-8, 6-32
recalculating .............................................................................. 2-41, 4-9, 5-15
reformatting ...................................................................................................4-9
selection versus target ..................................................................................2-2
show dependencies .................................................................................... 6-36
sidebar text ..................................................................................................5-11
tables .......................................................................................................... 5-12
Go To Position… (Sequence Menu) ............................................................. 6-46
GOR protein structure prediction .................................................................... 4-58
GRAIL analysis .............................................................................................. 4-48
Grouping (Features Menu) ............................................................................ 6-42
grouping objects ...............................................................................................5-8
H
helical wheel ........................................................................................ 2-40, 4-59
hiding large amounts of data ......................................................................... 2-43
high priority .................................................................................................... 6-22
Hopp and Woods table .................................................................................... A-2
hotlinks
Index-8
[I]
automatic ....................................................................................................6-34
menu ...........................................................................................................6-34
purpose ......................................................................................................... 1-5
tutorial ............................................................................................... 2-19–2-23
hydration potential ..........................................................................................4-62
hydropathy analyses ............................................................................ 2-48, 4-60
hypertext links .................................................................................................. 5-1
I
Import (File Menu) ...........................................................................................6-5
importing sequences ....................................................................................... 3-19
input sequence panel ....................................................................................... 1-6
Insert Row/Column (Table Menu) .................................................................6-53
Insert Xs…/Insert Ns… (Sequence Menu) ....................................................6-45
inserting rows/columns in tables ....................................................................6-53
installing Gene Inspector .................................................................................. 1-2
interactive analyses ........................................................................................2-55
inverted repeats .............................................................................................. 4-31
IUPAC standard amino acid codes ...................................................................A-8
IUPAC standard nucleic acid codes ..................................................................A-7
J
Janin table ........................................................................................................A-3
K
Kyte and Doolittle table ....................................................................................A-3
L
line width ........................................................................................................ 6-16
Lines (Format Menu) ..................................................................................... 6-16
Links (Notebook Menu) ..................................................................................6-34
Index-9
[M]
M
Make Aliases… (Notebook Menu) ................................................................. 6-29
Manavalan & Ponnuswamy table ..................................................................... A-3
Manipulate (Sequence Menu) ........................................................................ 6-48
Map Keys… (Sequence Menu) ..................................................................... 6-47
mapping the keyboard ........................................................................... 3-7, 6-47
Mark Sites… (Features Menu) ...................................................................... 6-39
median sieving .................................................................................................4-11
membrane buried regions .............................................................................. 4-63
mesh size (in median sieving) ....................................................................... 4-13
molecular weight - see “protein physical characteristics”
moving objects to appendices ...............................................................2-43, 5-16
multiple sequence alignment
custom score adronments .......................................................................... 2-25
parameters .................................................................................................. 3-10
tutorial ...............................................................................................2-24–2-26
multiple sequence features object ................................................................... 3-19
N
naming colors ................................................................................................ 2-34
new analysis ................................................................................................... 2-14
New Analysis… (Analysis Menu) .................................................................... 6-21
New Sequence… (Sequence Menu) ............................................................. 6-45
New… (File Menu) ...........................................................................................6-2
notebook – see GI notebook
notebook layout ................................................................................... 2-48, 6-37
Notebook Layout… (Notebook Menu) ............................................................ 6-37
Notebook Menu ............................................................................................. 6-27
appendices ................................................................................................. 6-33
arrangement ................................................................................................ 6-31
bookmarks .................................................................................................. 6-30
display ........................................................................................................ 6-32
find original ................................................................................................ 6-30
get info ....................................................................................................... 6-27
links ........................................................................................................... 6-34
make alias ................................................................................................. 6-29
notebook layout .......................................................................................... 6-37
open for editing .......................................................................................... 6-29
Index-10
[N]
page break ..................................................................................................6-37
reduction .....................................................................................................6-28
text flow ......................................................................................................6-30
tool extensions ............................................................................................6-28
tools ............................................................................................................6-27
nucleic acid analyses
align 2 sequences (global) ......................................................................... 4-16
align multiple sequences .............................................................................4-20
base composition .............................................................................. 2-20, 4-21
base distribution .......................................................................................... 4-21
BLOCKS search ..........................................................................................4-48
codon preference ........................................................................................4-23
dot matrix
color range ............................................................................................4-28
define thresholds ...................................................................................4-28
define window size ................................................................................4-27
discard data ..........................................................................................4-29
discussion .............................................................................................4-26
dot size .................................................................................................4-28
find inverted repeats ................................................................................... 4-31
find repeats .................................................................................................4-34
find sequence .............................................................................................4-34
GC coding prediction ..................................................................................4-37
GRAIL .........................................................................................................4-48
open reading frames ...................................................................................4-39
restriction enzyme digests
discussion .............................................................................................4-42
edit display parameters .........................................................................2-49
tutorial .........................................................................................2-49–2-50
view as graphic .....................................................................................2-50
view as table ........................................................................................2-49
testcode ......................................................................................................4-44
nucleic acid codes table ...................................................................................A-7
nucleic analyses
BLAST search .............................................................................................4-47
Numeric Format (Format Menu) ..................................................................... 6-19
numeric formats ..............................................................................................2-34
Index-11
[O]
O
open for editing ............................................................... 4-44, 5-14, 6-25, 6-29
Open For Editing… (Notebook Menu) ........................................................... 6-29
open reading frames ............................................................................ 4-25, 4-39
Open… (File Menu) .........................................................................................6-2
optimal matching hydrophobicity .................................................................... 4-63
option dragging .....................................................................................2-43, 5-13
output location panel ...................................................................... 1-6, 2-17, 4-7
overview pane .................................................................................................. 3-1
P
Page Break (Notebook Menu) ....................................................................... 6-37
Page Setup… (File Menu) ...............................................................................6-7
PAM Values vs. % Change in Sequence (table) ........................................... 4-50
Paragraph (Format Menu) .............................................................................. 6-19
Parker, et al. table ........................................................................................... A-3
Paste (Edit Menu) ............................................................................................6-9
paste picture ................................................................................................... 6-10
paste text ........................................................................................................ 6-10
pausing analyses ..............................................................................................7-3
peptide numbering style ................................................................................. 2-52
perform autorecalc .......................................................................................... 2-21
pH/pI ............................................................................................................ 4-63
preferred size ................................................................................................. 6-32
Previous Setup (Analysis Menu) .................................................................... 6-21
Print… (File Menu) ...........................................................................................6-7
printing large objects ........................................................................................7-5
Prosite language definitions ............................................................................. A-5
prosite motif search ....................................................................................... 4-64
protein analyses
accessible surface area .............................................................................. 4-48
align 2 sequences (global) .............................................................. 2-43, 4-49
align multiple sequences ............................................................................ 4-52
amino acid composition .............................................................................. 4-53
antigenicity ................................................................................................. 4-54
BLAST search ............................................................................................ 4-70
Chou-Fasman structure prediction .............................................................. 4-54
dot matrix
Index-12
[Q]
aligning sequences from within .............................................................2-60
description .............................................................................................4-54
dot size .................................................................................................2-59
reformatting ...........................................................................................2-60
thresholds .............................................................................................2-58
tutorial ......................................................................................... 2-58–2-61
find repeats .................................................................................................4-55
find sequence (Prosite-style) ......................................................................4-56
GOR structure prediction .............................................................................4-58
helical wheel .................................................................................... 2-40, 4-59
hydration potential .......................................................................................4-62
hydropathy ....................................................................................... 2-48, 4-60
membrane buried regions ...........................................................................4-63
optimal matching hydrophobicity ..................................................................4-63
pH/pI ..........................................................................................................4-63
physical characteristics ................................................................................4-63
prosite motif search ....................................................................................4-64
protein cleavage ..........................................................................................4-67
protein interior .............................................................................................4-67
side chain flexibility .....................................................................................4-67
side chain protrusion ...................................................................................4-69
signal sequence ..........................................................................................4-68
sliding window .............................................................................................4-68
surrounding hydrophobicity ..........................................................................4-69
temperature factor .......................................................................................4-70
testcode (tutorial) ..............................................................................2-55–2-57
transmembrane helices ..................................................................... 2-14, 4-70
protein cleavage .............................................................................................4-67
protein cleavage sites .......................................................................................A-6
protein interior ................................................................................................4-67
protein physical characteristics .......................................................................4-63
Q
Quit (File Menu) ...............................................................................................6-8
R
rare codons ....................................................................................................4-25
Index-13
[S]
reducing notebook view ................................................................................. 6-28
Reduction (Notebook Menu) .......................................................................... 6-28
Remove Analysis… (Analysis Menu) ............................................................. 6-25
Remove Setup From Menu… (Analysis Menu) ............................................. 6-26
removing custom menus ................................................................................ 2-35
Replace, Find Next ......................................................................................... 6-13
restriction enzyme digest
discussion .................................................................................................. 4-42
edit display parameters .............................................................................. 4-44
mark cut sites ............................................................................................ 4-42
mark recognition sites ................................................................................ 4-42
return appendix to notebook .......................................................................... 2-44
reverse translate ............................................................................................ 6-48
Revert to Saved (File Menu) ............................................................................6-4
row headers ..........................................................................................5-13, 6-53
S
sample sequences ............................................................................................2-2
Save (File Menu) .............................................................................................6-3
Save a Copy (File Menu) .................................................................................6-4
Save As… (File Menu) .....................................................................................6-3
scoring row ...........................................................................................2-25, 3-12
scratch files ...................................................................................................... 7-1
segment indicator .............................................................................................3-2
Select All (Edit Menu) .................................................................................... 6-10
selection vs. target ................................................................................... 2-1, 5-6
send to back ................................................................................................... 6-31
sequence chooser ........................................................................................... 2-15
open sequences ............................................................................................4-6
saved sequences ..........................................................................................4-6
sequence range selection ..............................................................................4-4
sequence editor
adding sequences .........................................................................................3-4
aligned sequence display ............................................................................ 3-12
aligning multiple sequences ....................................................................... 2-24
alignment picture in notebook ..................................................................... 3-13
confirm re-entry ........................................................................................... 3-10
confirming sequences ....................................................................................3-9
Index-14
[S]
consensus row .................................................................................. 2-25, 3-12
defining speech paramters ............................................................................3-7
description ..................................................................................................... 1-5
drag and drop editing ....................................................................................3-6
editing pane
name column ..........................................................................................3-2
overview ..................................................................................................3-2
position column .......................................................................................3-2
ruler ........................................................................................................3-2
entering sequences .......................................................................................3-7
extra caution .................................................................................................3-6
formatting a sequence ...................................................................................3-5
generating sequences .................................................................................3-20
importing sequences ................................................................................... 3-19
mapping the keyboard ...................................................................................3-7
multiple sequence alignment ....................................................................... 3-10
name column option dragging .......................................................................3-3
numbering .....................................................................................................3-2
overview of sequence editor ......................................................................... 3-1
overview pane
discussion ............................................................................................... 3-1
for navigating ..........................................................................................3-2
segment indicator ....................................................................................3-2
position indicators .........................................................................................2-9
read sequence ..............................................................................................3-9
re-ordering sequences ..................................................................................3-3
scoring row ....................................................................................... 2-25, 3-12
segment indicator ..........................................................................................2-9
sequence monitor ..........................................................................................3-9
sequence names ...........................................................................................2-9
shading ............................................................................................. 2-25, 3-12
speak typing .................................................................................................3-7
speech preferences .......................................................................................3-8
Sequence Info… (Sequence Menu) ...............................................................6-45
Sequence Info… (Sequences Menu) ..............................................................6-44
Sequence Menu .............................................................................................6-45
alignment ....................................................................................................6-49
consensus ...................................................................................................6-49
display ........................................................................................................6-47
format sequence ......................................................................................... 6-51
Index-15
[S]
generate random ........................................................................................ 6-46
go to position ............................................................................................. 6-46
insert Xs/Ns .............................................................................................. 6-45
manipulate .................................................................................................. 6-48
map keys ................................................................................................... 6-47
new sequence ............................................................................................ 6-45
sequence info ............................................................................................. 6-45
show/hide sequence monitor ..................................................................... 6-47
speak typing ............................................................................................... 6-46
speech prefs .............................................................................................. 6-47
use extra caution ........................................................................................ 6-51
sequence monitor .........................................................................2-10, 3-9, 6-47
sequence numbering .........................................................................................3-2
sequences
getting info .......................................................................................... 2-11, 3-2
inverting ........................................................................................................3-4
opening sequence files ....................................................................... 2-9, 2-15
reordering ......................................................................................................3-3
translating ........................................................................................... 2-11, 3-4
Sequences Menu ..................................................................................3-17, 6-44
consensus .................................................................................................. 6-44
display ........................................................................................................ 6-44
format sequences… .................................................................................... 6-44
sequence info… ......................................................................................... 6-44
shading .................................................................................................2-25, 3-12
shift-clicking ................................................................................................... 2-46
Show Clipboard (Edit Menu) .......................................................................... 6-14
Show Selection (Edit Menu) ............................................................................6-11
show summary results
find sequence ............................................................................................. 4-37
inverted repeats ......................................................................................... 4-32
Show/Hide Analysis Monitor (Analysis Menu) ............................................... 6-21
Show/Hide Column Headers (Table Menu) .................................................. 6-53
Show/Hide Page Breaks (Edit Menu) ........................................................... 6-14
Show/Hide Row Headers (Table Menu) ....................................................... 6-53
Show/Hide Sequence Monitor (Sequence Menu) ......................................... 6-47
side chain flexibility ........................................................................................ 4-67
side chain protrusion ..................................................................................... 4-69
Sidebar Menu
adjust size to contents ............................................................................... 6-52
Index-16
[S]
sidebar text ..............................................................................................2-4, 5-11
signal sequence ..............................................................................................4-68
site markers, show/hide in features object .................................................... 3-18
Size (Format Menu) ....................................................................................... 6-17
size arrowheads ............................................................................................. 6-16
sliding window
accessible surface area ..............................................................................4-48
antigenicity ..................................................................................................4-54
hydration potential .......................................................................................4-62
hydropathy ..................................................................................................4-60
membrane buried regions ...........................................................................4-63
optimal matching hydrophobicity ..................................................................4-63
overview ......................................................................................................4-68
protein interior .............................................................................................4-67
side chain protrusion ...................................................................................4-69
signal sequence ..........................................................................................4-68
surrounding hydrophobicity ..........................................................................4-69
temperature factor .......................................................................................4-70
transmembrane helices ...............................................................................4-70
slow analyses ...................................................................................................7-3
speak typing .....................................................................................................3-7
Speak Typing (Sequence Menu) ....................................................................6-46
Special Paste (Edit Menu) ............................................................................. 6-10
speech parameters, defining .............................................................................3-7
speech preferences ..........................................................................................3-7
Speech Prefs… (Sequence Menu) .................................................................6-47
Stack Windows (Windows Menu) ................................................................... 6-15
standard tables ............................................................................................... 4-14
Style (Format Menu) ...................................................................................... 6-17
style sheets
discussion .....................................................................................................4-9
overview ........................................................................................................5-3
tutorial ...............................................................................................2-38–2-39
Style Sheets (Format Menu) ..........................................................................6-20
summary analyses ..........................................................................................2-27
surrounding hydrophobicity .............................................................................4-69
Sweet and Eisenberg table ...............................................................................A-3
system requirements ......................................................................................... 1-4
Index-17
[T]
T
Table Menu ................................................................................................... 6-53
add column(s) at right ............................................................................... 6-54
add row(s) at bottom ................................................................................. 6-54
adjust size to contents ............................................................................... 6-54
delete row(s)/column(s) ........................................................................... 6-53
insert row/column ...................................................................................... 6-53
show/hide column headers ........................................................................ 6-53
show/hide row headers ............................................................................. 6-53
tables
editing ......................................................................................................... 4-13
standard ...................................................................................................... 4-14
translation ................................................................................................... 4-14
user ............................................................................................................. 4-14
Tables (Analysis Menu) ................................................................................. 6-23
tearing off menus ..............................................................................................5-7
temperature factor .......................................................................................... 4-70
temporary space ............................................................................................... 7-1
testcode ......................................................................................................... 4-44
text flow ................................................................................................5-10, 6-30
Text Flow (Notebook Menu) .......................................................................... 6-30
text object .........................................................................................................2-4
text standoff .................................................................................................... 5-10
Thornton, et al. table ....................................................................................... A-4
tool extensions ................................................................................................ 5-17
Tool Extensions (Notebook Menu) ................................................................ 6-28
Tools (Notebook Menu) ................................................................................. 6-27
transferring tables to and from GI ................................................................... 5-14
Translate… (Features Menu) ......................................................................... 6-40
translating DNA for a selected ORF ............................................................... 4-41
translation across introns ................................................................................ 3-17
translation tables ................................................................................... 4-13, 4-14
transmembrane helices .........................................................................2-14, 4-70
U
Undefine Intron (Features Menu) .................................................................. 6-40
Undo (Edit Menu) ............................................................................................6-9
Update Setup (Analysis Menu) ...................................................................... 6-25
Index-18
[V]
Updating Gene Inspector .................................................................................. 1-3
Use Extra Caution… (Sequence Menu) ......................................................... 6-51
user tables .............................................................................................4-14, 5-12
V
vectors
Amersham .....................................................................................................A-9
Boehringer ....................................................................................................A-9
BRL ..............................................................................................................A-9
Clontech ...................................................................................................... A-10
IBI ............................................................................................................... A-12
In Vitrogen .................................................................................................. A-12
New England Biolabs .................................................................................. A-13
NovaGen ..................................................................................................... A-14
Phage ......................................................................................................... A-16
Pharmacia ................................................................................................... A-16
Promega ..................................................................................................... A-18
Sigma ......................................................................................................... A-19
Stratagene ................................................................................................. A-20
USB ............................................................................................................ A-21
viewing large objectsllarge objects (printing and viewing) ................................7-5
von Heijne table ...............................................................................................A-4
W
Welling, et al. table ..........................................................................................A-4
Windows Menu
current window names ................................................................................ 6-15
stack windows ............................................................................................. 6-15
Wolfenden, et al. table .....................................................................................A-4
Z
Z-score ........................................................................................................... 4-18
Index-19
[Z]
Index-20