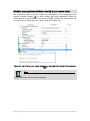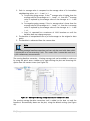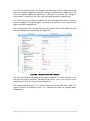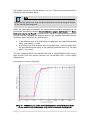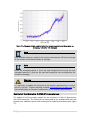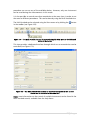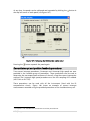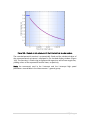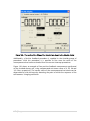
1
NOVA Release notes previous versions Table of Contents NOVA 1.10.1 Release notes (Released 08/05/2013) .............................................. 2 NOVA 1.10.2 Release notes (Released 24/07/2013) ............................................ 17 NOVA 1.10.3 Release notes (Released 18/10/2013) ............................................ 22 NOVA 1.10.4 Release notes (Released 01/05/2014) ............................................ 29 NOVA 1.10.5 Release notes (Released 15/10/2014) ............................................ 53 NOVA 1.9 Release notes (Released 26/11/2012) ................................................. 61 NOVA 1.8 Release notes (Released 01/12/2011) ................................................. 77 NOVA 1.7 Release notes (Released 01/04/2011) ............................................... 101 NOVA 1.6 Release notes (Released 01/06/2010) ............................................... 114 NOVA 1.5 Release notes (Released 01/06/2009) ............................................... 144 NOVA 1.4 Release notes (Released 14/09/2008) ............................................... 173 NOVA 1.3 Release notes (Released 01/04/2008) ............................................... 202 1|Page NOVA 1.10.1 Release notes (Released 08/05/2013) Introduction Thank you for installing this update of NOVA. These notes provide an overview of the new features introduced in NOVA 1.10.1 The following improvements have been added to NOVA: • • • • • • • • • • • • • • Support for 64 Bit versions of Windows for all instruments with USB control Support for the new Autolab PGSTAT204 New user interface for Autolab control command New user interface for Chrono methods and Chrono methods high speed command New user interface for FRA measurement command Phase out of the Timed procedure command Timing guide in procedure editor and managed timing Real time validation in procedure editor More detailed validation information Ignore warnings in validation Link to Windows Explorer for database Cutoff information displayed in options tooltip Cut/Copy/Paste option in procedure editor Manual control for external devices Support for 64 Bit versions of Windows for all instruments NOVA now includes support for 64 Bit versions of Windows for all instruments. This is an improvement with respect to the previous version of NOVA which provided support only for the latest generation of Autolab instruments. Warning The GPES compatible driver cannot be used in 64 Bit versions of NOVA. This choice is greyed out in the Driver manager application (see Figure 1). Warning Support for third party instrumentation (Metrohm and Avantes) is not 64 Bit compatible. 2|Page Figure 1 – The GPES compatible driver cannot be used in 64 Bit versions of Windows 3|Page Support for the new Autolab PGSTAT204 This version of NOVA provides support for the new Autolab PGSTAT204 (see Figure 2). Figure 2 – The Autolab PGSTAT204 This new compact instrument can be used stand alone or in combination with one of the following modules: • • • • • FRA32M – Electrochemical impedance analyzer module BA – Dual mode bipotentiostat module EQCM – Electrochemical quartz crystal microbalance module MUX – Multiplexer module pX1000 – pH and temperature measurement module New user interface for Autolab control command The editor for the Autolab control command has been redesigned and will now display the settings in well-defined areas of the interface (see Figure 3). Basic and advanced parameters are now shown in clearly separated sections. 4|Page Figure 3 – The Autolab control editor has been redesigned Additionally, a Summary has been added to the editor. The summary displays all the specified settings in one clear overview (see Figure 4). Figure 4 – A summary has been added to the Autolab control editor It is possible to quickly remove one or more of the settings indicated in the summary by clicking the icon, as shown in Figure 4. For more information on the use of the Autolab control command, please refer to the Autolab control tutorial, available from the Help menu in NOVA. 5|Page New user interface for the Chrono methods and Chrono methods high speed commands The Chrono methods and Chrono methods high speed command have been modified and a new user interface has been added to the commands. This dialog replaces the previous Chrono methods and Chrono methods high speed editor (see Figure 5). Figure 5 – A new user interface has been added to the chrono methods command This interface conveniently separates the basic and the advanced parameters. More information on the use of the Chrono methods command can be found in the Chrono methods tutorial, available from the Help menu. New user interface for the FRA measurement commands A new editor has been added to the FRA measurement commands to allow the specification of all relevant experimental parameters in a single form (see Figure 6). Figure 6 – A new user interface has been added to the FRA measurement commands 6|Page The new interface brings all the important parameters and settings into one location. The settings are specified in different sections, depending on the type (frequency scan, options, etc…). Where applicable, some of the parameters have been separated into basic and advanced parameters to simplify everyday use of these parameters and commands (see Figure 7). Figure 7 – Some parameters of settings are separated into basic and advanced More information on the use of the new user interface for FRA measurement commands can be found in the Impedance measurements tutorial, available from the Help menu in NOVA. Phase out of the Timed procedure command The Timed procedure command has been phased out in this version of NOVA. The command is no longer required to control the timing of the events programmed in the NOVA procedures. All procedures constructed using previous versions of NOVA are converted properly and pre-existing Timed procedure commands are replaced by Nested procedure commands. To indicate the timing, a new graphical indicator is used. Timing guide in procedure editor and managed timing In previous versions of NOVA, the Timed procedure command was used to indicate and control the timing of commands in a measurement sequence. To provide a more consistent user interface for the creation of procedures, a new timing guide system has been implemented in the current version of NOVA. When measurement commands are located in sequence, the timing will automatically adjusted in the same way as in the previous editions with a Timed procedure. No interruption will be observed in the measurement. This is indicated now by a green line guide on the left-hand side of the procedure editor (see Figure 8). 7|Page Figure 8 – The green timing guide located on the left-hand side of the procedure editor replaces the Timed procedure When non measurement commands are inserted anywhere in a procedure, an interruption of the timing must be introduced to execute the non-measurement command. This is indicated by a break in the timing guide located on the left-hand side of the procedure editor (see Figure 9). Figure 9 – Inserting non measurement commands in a measurement sequence creates a break in the timing and in the timing guide Furthermore, when measurements are carried out with a very large number of data points, the software may enforce mandatory timing breaks in a measurement sequence to allow the on-board memory of the instrument to be cleared. These breaks are indicated by a horizontal green break line across the procedure editor (see Figure 10). Note The enforced timing break is automatically handled by the NOVA software. 8|Page Figure 10 – A mandatory timing break is indicated by a horizontal green line Real time validation in procedure editor NOVA 1.10 now validates the procedures designed in the procedure editor in real time. Errors or warnings are indicated on the left-hand side of the procedure editor. These messages can be used to identify problems in the procedure quickly (see Figure 11). Figure 11 – The procedure is now validated in real time (warnings and errors are indicated on the left-hand side of the procedure editor) In the example shown in Figure 11, the warnings are provided because the cell is not switched on during the procedure. Since this is not an error, the warning symbol is shown ( ). If an error is detected, as shown in Figure 12, the error symbol is shown instead ( ). 9|Page Figure 12 – An error symbol is provided by the real time validation when errors are identified More detailed validation information This version of NOVA adds more information in the validation messages. Previous editions of NOVA only reported the nature of an error or warning. This version of NOVA now also adds troubleshooting information (see Figure 13). Figure 13 – Procedure validation in NOVA now displays possible solutions to an error or warning (displayed in the tooltip) Hiding warnings in the validation report It is now possible to indicate to the software to ignore warnings during validation. This can be useful for measurements which need to be carried out with parameters that fall outside of the normal operation specifications, for example with the cell 10 | P a g e off. In those cases, although the warning message is normal, the user can decide to ignore the message until further notice. To ignore a message in the validation screen, right-click the warning message and select the Hide warning option from the context menu (see Figure 14). Figure 14 – Right-click a warning in the validation screen to ignore it Note It is not possible to hide Error messages. It is also possible to reset the warning levels back to normal. This can be done by opening the NOVA Options (from the Tools – Options menu). In the NOVA options dialog, click the button located next to the Hidden warning – Reset option (see Figure 15). 11 | P a g e Figure 15 – Click the button to reset the hidden warnings Link to Windows Explorer for database A direct shortcut to the location of a procedure file or data file has been added to the right-click menu in NOVA. Right-clicking a procedure entry (in the Setup view) or a data entry (in the Analysis view), provides a Show in Windows Explorer option (see Figure 16). Figure 16 – A shortcut to the location in Windows Explorer is available from the right-click menu Using this option, it is possible to quickly locate the selected file on the computer (see Figure 17). 12 | P a g e Figure 17 – The Show in Windows Explorer option allows to quickly locate a file on the computer The link to the file location in Windows Explorer also provides the means to change the name of the .nox file. Cutoff information displayed in options tooltip The options tooltip now provides more detailed information about the cutoffs used in the procedure editor. The limits used in the cutoff option are now shown in tooltip (see Figure 18). Figure 18 – The limits defined in the Cutoff option are now shown in the tooltip Cut/Copy/Paste option in procedure editor A Cut/Copy/Paste option has been added to the procedure editor. Using the rightclick menu or the traditional keyboard shortcuts (CTRL-X, CTRL-C, CTRL-V for Cut, Copy and Paste, respectively), it is possible to cut or copy commands in the procedure editor and paste them in the procedure (see Figure 19). 13 | P a g e Figure 19 – A Cut/Copy/Paste option has been added to the right-click menu It is also possible to Cut/Copy and Paste a group of commands. Manual control of External devices Manual control of analog-controlled external devices is now available (like the Autolab RDE or the Autolab LED Driver). The parameters of the external device connected to the Autolab can be defined in the Hardware setup (see Figure 20). 14 | P a g e Figure 20 – The settings for the external devices are defined in the hardware setup Depending on the type of instrument, the control of the external device can be done through the connections provided by the DAC164 module on the front panel of the instrument or through a dedicated output (for the µAutolab II and III and for the PGSTAT101/M101 and PGSTAT204). The settings for each external device can be saved. Each setting is identified by a unique name. Saved settings can be selected from a drop-down list (see Figure 21). Figure 21 – The settings are defined and saved in the hardware setup The device defined in the hardware setup can then be controlled manually in NOVA (see Figure 22). 15 | P a g e Figure 22 – The External device defined in the hardware setup can be controlled manually 16 | P a g e NOVA 1.10.2 Release notes (Released 24/07/2013) Introduction The 1.10.2 NOVA release adds the following improvements: • • • • Support for Metrohm devices in 64 Bit versions of Windows (Dosino and Stirrers) Support for Avantes spectrometers in 64 Bit versions of Windows Convolution analysis method added to the Analysis – general group of commands Options added to the Build signal command Support for Metrohm devices in 64 Bit versions of Windows The 1.10.2 update of NOVA adds support for Metrohm devices in 64 Bit versions of Windows. The files required to work with all versions of Windows are installed in NOVA installation folder. All the Metrohm devices are supported, except the Sample Processors (814, 815 and 858). The warnings used in the External devices tutorial regarding incompatibility with 64 Bit versions of NOVA can be disregarded. Support for Avantes spectrometers in 64 Bit versions of Windows The 1.10.2 update of NOVA adds support for Avantes spectrometers in 64 Bit versions of Windows. The files required to work with all versions of Windows are installed in NOVA installation folder. The warnings used in the External devices tutorial regarding incompatibility with 64 Bit versions of NOVA can be disregarded. Convolution analysis method added to the Analysis – general group of commands The convolution analysis methods have been added to the Analysis – general group of commands. Convolution methods can be used to eliminate the effect of the decrease of the concentration gradient of the electroactive species from the total response of the electrode. For a general description of the use of the convolution methods in electrochemistry, we refer the user to the literature. A total of six methods are available: • Time semi-derivative: this algorithm uses a semi-derivative transformation of a time dependent function, 𝑓𝑓(𝑡𝑡), according to: 17 | P a g e 𝑑𝑑 • 1� 2 𝑑𝑑𝑑𝑑 1� 𝑓𝑓(𝑡𝑡) 2 Time semi-integral: this algorithm uses a semi-integral transformation of a time dependent function, 𝑓𝑓(𝑡𝑡), according to: 𝑑𝑑− • • • • 1� 2 𝑑𝑑𝑑𝑑 − 1� 𝑓𝑓(𝑡𝑡) 2 G0 differintegration (Grünwald-0): this algorithm can be used to carry out differintegration to any user-defined order. For the order of 1 the operation is equivalent to a derivative and for -1 to an integration. For 0.5 the G0 algorithm is the same as the time semi-derivative method. For -0.5 the G0 algorithm is the same as the time semi-integral method. Error in results increases with the length of the interval and accumulates, i.e. error in latter points is larger than in earlier ones. Important advantage is that this algorithm does not require the value of the function for t=0, which makes it very well suited for transformation of chronoamperometric data, where 𝑖𝑖𝑡𝑡=0 → 0. The disadvantage of the algorithm is that the total number of operations is proportional to the square of the number of data points, so calculation time grows fast with the length of the data set. The fundamentals of this algorithm are described in Oldham KB, J. Electroanal. Chem. 121(1981) 431. FRLT differintegration (Fast Riemann-Liouville Transform): this is a fast, approximate algorithm based on a recursive digital filter. It is best suited for differintegration in the range of 0.0...-0.5 (up to semi-integration). It is less precise than G0 algorithm, but the number of operations is linearly related to the number of data points. For details refer to Pajkossy T, Nyikos L, J. Electroanal. Chem. 179 (1984) 65. Spherical convolution: this algorithm is used to carry out convolution of the data measured using a spherical electrode and staircase potential waveform. Values of the diffusion coefficient and the electrode radius are necessary. Details of the algorithm can be found in S.O. Engblom, K.B. Oldham, Anal. Chem. 62 (1990) 625. Kinetic convolution: this algorithm carries out kinetic convolution according to F.E. Woodard, R.D. Goodin, P.J. Kinlen, Anal. Chem. 56 (1984) 1920. This convolution requires the value of the rate constant of irreversible homogeneous follow-up reaction (ECi mechanism). The Convolution command can be added to a procedure to process potential sweep or chronoamperometry data. This command requires the Time signal and the WE(1).Current signal. The type of convolution used can be specified using a dropdown list (see Figure 23). 18 | P a g e Figure 23 – The convolution command can be added to the procedure In the analysis view, the Convolution command can be added to a data set which includes the Time and WE(1).Current signals, using the quick access menu or the right-click menu (see Figure 24). Figure 24 – Adding the convolution command to a data set The convolution item will be added to the data set. The type of convolution can be specified, using a dedicated drop-down list, on the right-hand side of the plot, in the analysis frame (see Figure 25). 19 | P a g e Figure 25 – Specifying the type of convolution in the Analysis view The result of the convolution algorithm can be displayed as a plot by clicking the Convoluted plot item in the data explorer frame (see Figure 26). Figure 26 – Example of a time semi-derivative convolution Options added to the Build signal dialog The build signal command has been extended and now also provides the values specified in the Options. This only applies to a linkable cutoff option. When an linkable cutoff condition is used, the value specified in this option will be available in the Build signal dialog (see Figure 27). 20 | P a g e Figure 27 – Linkable cutoff options are now listed in the Build signal dialog 21 | P a g e NOVA 1.10.3 Release notes (Released 18/10/2013) Introduction The 1.10.3 NOVA release adds the following improvements: • • • • • • • • • Support for Metrohm devices in 64 Bit versions of Windows (Sample processors) Increment parameter and Increment parameter with signal back in Control group Single instance of cutoff Integrate between markers Import FRA equivalent circuit Import/Export equivalent circuit New format for Message box and Input box commands Subfolders in procedure browser Multiple warning/error validation tooltip in the procedure editor Support for Metrohm devices in 64 Bit versions of Windows The 1.10.3 update of NOVA adds the support for the 814, 815 and 858 Metrohm Sample processors. Increment parameter and Increment parameter with signal back in the Control group of commands The Increment parameter and Increment parameter with signal commands have been added again to the Control group of commands. These two commands were missing in the initial release of NOVA 1.10. Single instance of cutoff The possibility to perform a specific action specified in a cutoff option only once has been added. This is particularly useful in combination with the Reverse scan direction action for staircase cyclic voltammetry or linear sweep voltammetry. This option is useful for corrosion experiments requiring the scan direction to be reversed once a threshold current is reached, as shown in Figure 28. 22 | P a g e Figure 28 – Example of a corrosion experiment requiring the scan direction to be reversed once a threshold current is reached To indicate that the specified action needs to be executed only once, the checkbox needs to be checked (see Figure 29). Figure 29 – Specifying if the cutoff action needs to be performed only once 23 | P a g e Integrate between markers The Integrate analysis tool has been modified and now provides the means to integrate a curve between two user-defined markers. The area, determined in units of Y axis * units of X axis, is provided in the data explorer frame (see Figure 30). Figure 30 – The Integrate analysis tool now integrates between two user-defined markers The markers can be repositioned by right-clicking them on the plot. The markers can be deleted by clicking the button on the right-hand side of the plot. Import FRA equivalent circuit Existing FRA equivalent circuits, from the GPES/FRA software library, can now be imported directly into the Fit and Simulation analysis tool in NOVA (see Figure 31). 24 | P a g e Figure 31 – The option for importing FRA equivalent circuits is now available in the Fit and Simulation analysis tool FRA equivalent circuit files (.ecc files), from the FRA software package, can be imported directly into the circuit editor. Note The E equivalent circuit (from the FRA software) element is converted to a Q element in NOVA. New Import/Export equivalent circuits The possibility to import and export equivalent circuits directly from the Fit and Simulation dialog window has been added to this version of NOVA (see Figure 31). The equivalent circuits are available as .ece files. Circuits from older versions of NOVA can be imported into the current version. New format for the Message box and Input box commands The Message box and Input box commands are now provided with a text editor that supports line breaks. The message to shown in the two commands can now be edited directly into the procedure editor and line breaks can be created using the enter key (see Figure 32). 25 | P a g e Figure 32 – The Message box and Input box commands now provide editors supporting line breaks Additionally, the Message box and Input box commands now auto-wrap the complete message and no longer display scrollbars, making long texts more readable (see Figure 33). Figure 33 – The complete text is now displayed in the Message box and the Input box commands Subfolders in the procedure browser The procedure browser of NOVA is now able to display subfolder located in the folders defined in the Database manager. This feature can be used to simplify procedure bookkeeping. The subfolders created in one of the folders used by NOVA will also be displayed in the procedure browser (see Figure 34 and Figure 35). 26 | P a g e Figure 34 – Subfolder can be created in the root folders used in the Database manager of NOVA Figure 35 – The subfolders created in the root folder defined in the Database manager of NOVA are displayed in the procedure browser Note A subfolder will only be displayed if there a procedure files located into the folder. Note A subfolder cannot be created in NOVA. The folders must be created in Windows Explorer. 27 | P a g e Multiple warning/error validation tooltip in procedure editor The procedure editor of NOVA validates the procedure in the background and displays warning symbols ( ) or error symbols ( ) where applicable. When the mouse pointer is now located on top of one of these symbols, the tooltip shows up to three errors or warnings in the same tooltip (see Figure 36). Figure 36 – Up to three errors and/or warnings are displayed in the tooltip in the procedure editor Note Errors are always shown before warnings. 28 | P a g e NOVA 1.10.4 Release notes (Released 01/05/2014) Introduction The 1.10.4 NOVA release adds the following improvements: • • • • • • • • New OCP potential integration Baseline correction by moving average Improved controls for Metrohm Liquid Handling instruments Potential Stripping Analysis (PSA) methods Time derivative signals added to Signal Sampler Fast options for the Record signals (> 1 ms) command Derivative based recording in the Record signals (> 1 ms) command Import GPES data buffer New OCP potential integration This update of NOVA introduces a new way to specify the potential values to be applied during any potentiostatic measurement. If an OCP determination command is used in a procedure, all consecutive commands that specify a potential to be applied on the cell can be adjusted using a right-click menu (see Figure 37). 29 | P a g e Figure 37 – Each applied potential value can now be specified versus the OCP or versus the reference electrode (REF) Each potential to be applied can be specified versus the reference electrode (REF) or versus the measured open circuit potential. When the potential is specified versus the reference electrode (REF), the potential will be applied on the cell using an implicit offset potential of 0 V. When the potential is specified versus the open circuit potential, the potential will be applied using an implicit offset potential equal to the OCP value. Note An OCP determination command must be present in the procedure in order to be able to specify a potential versus OCP. For all the measurement commands that allow the potential parameters to be edited in the procedure editor, the right-click menu can be used. For the Chrono methods command, which uses a dedicated editor, this toggle is provided in the editor itself, as shown in Figure 38. 30 | P a g e Figure 38 – The REF/OCP toggle is provided in the Chrono methods command editor Warning The method described in the Open circuit potential measurements tutorial of NOVA is still supported. Using the method described in the tutorial will overrule the new settings provided by this minor update of NOVA. Note The REF/OCP toggle is not available for the pulse potentials used in Square wave voltammetry, Differential pulse voltammetry, Differential normal pulse and Normal pulse. Baseline correction by moving average The baseline correction using the moving average method is now available as command and analysis tool. This baseline correction method is very effective when peaks show as shoulders on steep flanks. The moving average performs the following steps: 1. The source data is grouped into segments of 𝑛𝑛 points; where 𝑛𝑛 correspond to the Window size parameter of the Moving average baseline correction tool (default value of 𝑛𝑛 is 2). This means that the source data is reduced from 𝑚𝑚 data points to 𝑚𝑚/𝑛𝑛 averages. 2. The average value of each segment is calculated. 31 | P a g e 3. Each 𝑖𝑖 𝑡𝑡ℎ average value is compared to the average value of its immediate neighbouring values, at 𝑖𝑖 − 1 and 𝑖𝑖 + 1. a. For positive going sweeps, if the 𝑖𝑖 𝑡𝑡ℎ average value is higher than the average value of the averages at 𝑖𝑖 − 1 and 𝑖𝑖 + 1, then the 𝑖𝑖 𝑡𝑡ℎ average value is replaced by the average value of the averages at 𝑖𝑖 − 1 and 𝑖𝑖 + 1. b. For negative going sweeps, if the 𝑖𝑖 𝑡𝑡ℎ average value is lower than the average value of the averages at 𝑖𝑖 − 1 and 𝑖𝑖 + 1, then the 𝑖𝑖 𝑡𝑡ℎ average value is replaced by the average value of the averages at 𝑖𝑖 − 1 and 𝑖𝑖 + 1. c. Step 3 is repeated for a maximum of 1000 iterations or until the baseline does not change anymore. 4. The baseline is interpolated from 𝑚𝑚/𝑛𝑛 final averages to the original 𝑚𝑚 data points. 5. The baseline is subtracted from the source data. Note The moving average baseline correction tool can only be used with data which is presented on a non-reversing X axis. This means that it cannot be used on a cyclic voltammetry measurement. The moving Baseline correction – Moving average tool can be added to a data set by using the quick access toolbar or by right-clicking the plot and choosing this option from the context menu (see Figure 39). Figure 39 – Adding the Moving average baseline correction to the data The moving average baseline correction tool is added to the data set and the baseline is automatically drawn on the plot, using the default settings (see Figure 40). 32 | P a g e Figure 40 – The baseline correction tool is added to the data and the baseline is drawn The Residual plot is also added automatically. This plot shows the source values after subtraction of the baseline (see Figure 41). Figure 41 – The residual plot is automatically created It is possible to adjust the Window size parameter by change the value shown in the frame on the right-hand side of the plot (see Figure 42). 33 | P a g e Figure 42 – Modifying Window size parameter The baseline will be recalculated using the new window size and the residual plot will be adjusted. Improved controls for Metrohm Liquid Handling instruments This update of NOVA introduces new controls for the Metrohm Liquid Handling tools. The new implementation of these instruments deviates significantly from the information provided in Section 2 of the External devices tutorial, available from the Help menu in NOVA. The main differences are listed here: • • • • • • • It is no longer required to Initialize and Close Metrohm devices. All connected instruments are initialized when NOVA starts and are closed when NOVA is closed. Additional devices can be added, however this requires all connected devices to be reinitialized. All instrumental settings for the Metrohm devices are now locally stored. This means that the device can be operated directly after starting NOVA. Manual control for all initialized devices is now available, even during a NOVA procedure. Full control of all the instrumental settings is now available. Several devices can be operated at the same time. Control for the Metrohm 858 peristaltic pump and injection valve options has been added. All rackcodes are now included in the dedicated hardware setup. To define the settings of the connected devices, the dedicated Liquid Handling Setup can be used (see Figure 43). 34 | P a g e Figure 43 – The Liquid Handling Setup is available from the Tools menu In the Liquid Handling Setup window, the settings of each connected device can be defined and stored. These settings will be used each time one of the defined devices is connected to the computer. A unique identifying name can be assigned to each connected device. This ID is stored alongside the device settings. Note The default name is set to the device serial number. Figure 44 shows the settings for the Metrohm 800 Dosino. 35 | P a g e Figure 44 – The Liquid Handling setup window (shown for a Metrohm 800 Dosino) Note The Dosino setup provides the possibility to define the role of each port of the device. Make sure that the roles are defined properly since this will have an influence on the Prepare, Fill and Empty commands. The following settings can be specified (see Figure 44): • • • • • Name of the device Parallel execution Role of each port, using the provided dropdown list Rate, Diameter and Length for each port Ports can be deactivated, if needed, using the provided checkbox 36 | P a g e Figure 45 shows the settings for the Metrohm 858 Professional Sample Processor. Figure 45 – The Liquid Handling setup window (shown for a Metrohm 858 Professional Sample Processor) The following settings can be specified (see Figure 45): • • • • • • • Name of the device Parallel execution Rack type, using the provided dropdown list Lift rate, shift rate and swing rate for each tower Lift work position and maximum position for each tower The presence of pumps, valves, stirrer, peristaltic pump (858 only) and injection valve (858 only), using the provided checkboxes Towers can be deactivated, if needed, using the provided checkbox Note When a Metrohm 858 Professional Sample Processor is used, Tower 2 is deactivated by default. 37 | P a g e An important parameter which can be defined for each connected device is the Parallel execution mode. When this setting is active, a Liquid Handling device will not block the procedure while it is executing an action, allowing the next command to run and the procedure to continue. If this setting is not active, the device will hold the procedure until the action being carried out by the device is finished. One additional command, Wait for Metrohm device, has been added to force the procedure to wait for a Metrohm device with the Parallel execution enabled. To illustrate this, four examples are illustrated in Figure 46. In this figure, the duration of the Dose commands is shorter for Dosino 1 than for Dosino 2. Dosino 1 Dose Dosino 2 Dose CV Staircase A Time Dosino 1 Dose Dosino 2 Dose B Time CV Staircase Dosino 1 Dose CV Staircase C Time Dosino 2 Dose Dosino 1, 2 Dose D Time CV Staircase Figure 46 – Experiment flow for four different Liquid handling configurations • • Figure 46, A: Dosino 1 and Dosino 2 have parallel execution disabled. Both Dosino need to finish the Dose command before the CV staircase command can start. Figure 46, B: parallel execution is enabled on Dosino 2 and disabled on Dosino 1. Dosino 2 starts dosing immediately after Dosino 1 is finished. The CV staircase command starts as soon as Dosino 2 starts dosing. 38 | P a g e • • Figure 46, C: parallel execution is enabled on Dosino 1 and disabled on Dosino 2. Dosino 2 starts dosing at the same time as Dosino 1. Only when Dosino 2 is finished can the CV staircase command start. Figure 46, D: parallel execution is enabled for both Dosino 1 and Dosino 2. All three commands start at the same time. Once the connected devices are configured in the Liquid Handling Setup tool, each device can be manually controlled using a dedicated panel provided in the Autolab display window. The Liquid Handling manual control, in the View menu, provides a list of connected devices (see Figure 47). Figure 47 – Manual control of the Liquid Handling devices is available from the View menu The devices are listed using the following format: Name of the device – Metrohm device number type – Serial number. In the example shown in Figure 47, one Metrohm 800 Dosino, with serial number 9128, called Analyte (defined in the Liquid Handling Setup). Figure 48, shows the manual control panel added to the Autolab displaying the controls for a Dosino. 39 | P a g e Figure 48 – Manual control of a Dosino The Dosino manual control panel provides the following controls: • • • • • Prepare the Dosino, using the button. Fill the Dosino through the specified filling port, using the button. Empty the Dosino, using the button. Specify and dose a volume, using the button, through the specified port (using the provided drop-down box). The and buttons can be used to hold or stop the currently running actions on the Dosino. Figure 49, shows the manual control panel added to the Autolab displaying the controls for a Stirrer. Figure 49 – Manual control of a Stirrer The Stirrer manual control panel provides the following controls: • Specify the stirring rate between -15 and 15 using the provided slider or numeric value. 40 | P a g e Figure 50, shows the manual control panel added to the Autolab displaying the controls for a Sample Processor. Figure 50 – Manual control of a Sample Processor Note The Pump checkboxes provided in the manual control of the sample processor, correspond to Pump 1 and 2, respectively. The same applies to the Valve control (not shown in Figure 50). The Sample Processor manual control panel provides the following controls: • • • • • • Move the rack to the specified position with respect to the Sample processor tower using the button. Move the tower to the specified position using the button. Three shortcut buttons are available: o moves the lift to the Work position defined in the Liquid Handling Setup for the device using the current rack position. o moves the lift to the Shift position (default: 0 mm) using the current rack position. o moves the lift to the Shift position (default: 0 mm) and moves the rack to position 1. This is defined as the Home position. Switch on or off Pump 1 and/or Pump 2, if present, using the dedicated checkboxes (shown in Figure 50). Switch on or off Valve 1 and/or Valve 2, if present, using the dedicated checkboxes (not shown in Figure 50). Set the Stirrer speed between -15 and 15, if present, (not shown in Figure 50). Set the Peristaltic pump speed between -15 and 15 if present (only for the Metrohm 858 Professional Sample Processor). 41 | P a g e • Set the Injection valve to Fill or Inject position if present (only for the Metrohm 858 Professional Sample Processor, not shown in Figure 50). The commands described in the External devices tutorial are still available and can be used to perform the actions as indicated in this document. However, the Metrohm devices commands have all been modified and now provide a list of available devices in the procedure editor. When using a command to control a Metrohm device, it is possible to type the name of the device directly in the procedure editor (Device name parameter) or click the button to display a list of available devices (see Figure 51). Figure 51 – A list of available devices is displayed in the procedure editor Select the name of the device to control and click the editor. The procedure editor will be updated. button to close the Note The name displayed in the Device name dialog correspond to the names for each device specified in the Liquid Handling Setup. 42 | P a g e Additionally, the following commands have been modified with respect to the previous versions: • • • Dosino prepare: the Number of cycles parameter has been added to the command. This parameter defines how many prepare cycles should be performed on the Dosino (default 1). Dosino dose: the Port parameter has been added to the command. This parameter defines which of the 4 ports should be used in the dosing command. Dosino to end: the Port parameter has been added to the command. This parameter defines which of the 4 ports should be used in the to end command. Two new commands have been added to the Metrohm devices group of commands: • • Sample processor 858 inject valve: this command controls the optional injection valve, if present (Metrohm 858 Professional Sample Processor only). The valve can be set to Fill (Valve parameter 0) or Inject (Valve parameter 1). Sample processor 858 peristaltic pump: this command controls the optional peristaltic pump, if present (Metrohm 858 Professional Sample Processor). The speed can be set between -15 and 15. At any moment, when one of the connected Metrohm devices is performing an action, the status will be displayed in the manual control panel (see Figure 52). Figure 52 – The status of each device is displayed in the manual control panel Potential Stripping Analysis (PSA) methods The Potential Stripping Analysis (PSA) and Constant Current Potential Stripping Analysis (CC-PSA) methods have been added to NOVA. These methods provide the means to perform a potentiometric stripping analysis with chemical oxidation or with a constant current in order to determine substances in an organic matrix with the aid of mercury film electrodes without prior digestion. 43 | P a g e In PSA measurement mode, the analytes are deposited at the working electrode with the constant deposition potential during a predetermined deposition time. Then the applied deposition potential is switched off and the cell voltage is measured as a function of the time with the highest possible sampling rate. In CC-PSA, the same strategy is applied, but after the deposition time, a constant current is applied. The cell voltage is measured as a function of the time with the highest possible sampling rate. The measurement time is limited either by the Potential limit or the Maximum time criterion defined in the procedure (see Figure 53). Figure 53 – Overview of the PSA procedure The PSA command also provides a filter option (default on). When the filter is on, the filter time can be specified. The default filter time is set to 20 ms (for 50 Hz line frequency) or 16.67 ms (for 60 Hz line frequency). The voltage measurement E vs t is used to calculate the retention times dt/dE vs E. Figure 54 show an example of the E vs t measurement and the resulting peakshaped plot. 44 | P a g e E Deposition time Potential stop t Time stop dt/dE E Peak voltage Figure 54 – Schematic overview of a PSA measurement (E vs t measurement, top and dt/dE vs E plot, bottom) The Peak voltage position is characteristic of the substance, the Peak area is proportional to its concentration. Time derivative signals added to Signal Sampler For each signal provided by the Signal sampler, with the exception of the time signal itself, the time derivative can now be sampled and displayed in real time (see Figure 55). 45 | P a g e Figure 55 – The time derivative signals can be selected in the Signal sampler The derivative signals are calculated in real time. Just like any other signal, the derivative signals can be plotted in real time and can be used as a cutoff value, as shown in Figure 56. Figure 56 – The derivative signals can be used for cutoffs 46 | P a g e Note The derivate signals obtained in real time will be noisier than the calculated derivatives obtained using the derivate analysis tool because the latter uses a windowing function to that includes also the data points ahead of the data point at which the derivative is calculated. This function is not available in the real time calculation which can only take into account the values preceding the data point at which the derivate is calculated. An example of a plot of a time derived signals shown in Figure 57. Figure 57 – Example of a real time determination of a derivative (left: i vs E plot; right: Q vs E plot and dQ/dt vs E plot) As observed in Figure 57, the time derivative of the charge provides the same result as the original current measurement. Fast options for the Record signals (> 1 ms) command The Record signals (> 1 ms) command now offers the possibility to define two different interval times: • • The interval time, which corresponds to the time between two consecutive data points. This interval time corresponds to the interval time of the previous versions of NOVA. This value must be ≥ 1.33 ms. The fast interval time, which correspond to a new interval time that can be used to run the Options specified in the procedure. This new fast interval time must be ≥ 1.33 ms and must be an integral fraction of the interval time. 47 | P a g e Each Record signals (> 1 ms) command offers the possibility to use the fast options, through the Use fast options toggle (see Figure 58). When the fast options are not used, the fast interval time parameter is not shown in the procedure editor. Figure 58 – The Use fast options toggles the fast interval time off (top) or on (bottom) Using the fast interval time does not increase the number of data points recorded. This option only changes the behavior of the Options (Automatic current ranging, Cutoffs, etc…). • • If the fast options are not used, the Options specified in the command will be executed at the end of each interval time. If the fast options are used, the Options specified in the command will be executed at the end of each fast interval time. The fast options therefore allows a complete decoupling of the sampling of the data and the execution of the options. This is particularly useful for experiments during which data points need to be recorded for a long time, with a large interval time while the properties of the cell need to be controlled with a short interval time. 48 | P a g e Note When the fast options are used in combination with one or more cutoff options, the number of consecutive detections specified for each cutoff no longer relates to the interval time. The fast interval time is used instead. This means that the number of consecutive detections will no longer match the number of data points recorded after the cutoff condition is met. Derivative based recording in the Record signals (> 1 ms) command The Record signals (> 1 ms) command now provides extra functionality by combining the modifications described in Sections Error! Reference source not found. and Error! Reference source not found. of this document. When a Record signals (> 1 ms) command is executed with the Fast options active and if the time derivative of one or more of the sampled signals is added to the signal sampler, the possibility to specify a sample threshold for each of the derivative signals is provided (see Figure 59). Figure 59 – The sample threshold parameter is available by combining the time derivative sampler with the fast options 49 | P a g e The default value of this new parameter is set to 0. The units of the parameter are indicated in the procedure editor. Note When the fast options are used, the fast interval time must be an integral fraction of the interval time parameter. When the command is executed, the measurement proceeds according to the information provided in Sections Error! Reference source not found. and Error! Reference source not found.. The derivative(s) signals are calculated using the fast interval time and compared (in absolute value) to the specified threshold value for derivative signal, after each fast interval time. • • If the absolute value of the derivative is higher than the specified threshold value, a data point is stored. In all other cases (the absolute value of the derivative is lower or equal than the specified threshold value, or the specified threshold value is 0), the data point is not stored. This new sampling option can therefore be used to sample baseline data using a large interval time and sample transients on this baseline with a much higher sampling rate. An example is shown in Figure 60. Figure 60 – Comparison of a normal Chrono potentiometric measurement (blue) and a Chrono potentiometric measurement using the derivative based recording (red) 50 | P a g e Both curves shown in Figure 60 are recorded using a Chrono potentiometry measurement. The current applied goes from 0 A to 4 mA, using a dummy cell consisting of a 1000 Ohm resistor in series with a 10 µF capacitor in parallel with a 1000 Ohm resistor (see Figure 61). Figure 61 – The dummy cell used in the example shown in Figure 60 The blue curve is recorded using a fixed 20 ms interval time, the red curve is recorded using the same settings when the derivative of the WE(1).Potential signal is ≤ than 2 V/s. When the derivative is larger than this value, the values are recorded using the fast interval time of 2 ms. This leads to more data points in the potential transient region. Import GPES data buffer The Import GPES data command is now also able to import data buffer files. The data is converted to a single data set in the NOVA file. Data buffer files have the .bcw extension (see Figure 62). Figure 62 – The GPES data buffers (.bcw) can now be imported into NOVA Note When importing data buffer files, the additional files with .cv1, .cv2, etc…, must be located in the same folder as the .bcw file. 51 | P a g e Warning It is not possible to import data buffers containing data obtained using the cyclic voltammetry current integration method. Note When importing data buffers containing a second signal, accurate conversion of the second signal cannot be fully guaranteed. It is recommended to review the imported data. 52 | P a g e NOVA 1.10.5 Release notes (Released 15/10/2014) Introduction The 1.10.5 NOVA release adds the following improvements: • • • • • Warning provided on Windows XP computers Support for signal averaging for Avantes spectrometers Control of the Metrohm 6.2148.010 Remote box Improvements to the Metrohm Liquid Handling support Automatic repair of pX1000 checksum error Installation prerequisites In order to run properly, Nova 1.10.5, the following components need to be installed on the computer: • • .NET Framework 4 Visual C++ 2008 x64 When these components are not installed, the Nova installer will start with the Prerequisites installation Wizard (see Figure 63). Figure 63 – Prerequisites installation Wizard Click the Next button to start the Wizard. Figure 64 will appear. Select the Required Prerequisites and click the Next button. The Wizard will detect automatically which prerequisites are already installed on the PC. 53 | P a g e Figure 64 – Prerequisites selection Installation of .NET Framework 4 The installation of the .NET Framework 4 is described in Chapter 1.3.1 of the Getting Started manual. This component is required for Windows 7, Vista and XP. Installation of the Visual C++ 2008 x64 Redistributable The Visual C++ 2008 x64 Redistributable is necessary on for 64 bit versions of Windows only. The installation Wizard will guide you through the installation process (see Figure 65, Figure 66 and Figure 67). Note When one of the Prerequisites is not installed or not installed properly, Nova cannot start and will give an error message. 54 | P a g e Figure 65 – Visual C++ 2008 Redistributable Setup Wizard ` Figure 66 – Visual C++ 2008 License Terms 55 | P a g e Figure 67 – Visual C++ 2008 Redistributable installation Click the Finish button to finalize the prerequisites setup. The setup program will proceed to the Nova Setup automatically (see Figure 68). Figure 68 – Start of Nova installation Windows XP warning Microsoft has ended support for Windows XP on April 8th, 2014. It is therefore no longer recommended to keep using this operating system. A warning is now provided in the User log, indicating that NOVA should no longer be used in combination with Windows XP (see Figure 69). 56 | P a g e Figure 69 - A warning about Windows XP is npw shown in the User lo Note Future versions of NOVA may be incompatible with Windows XP. Support for signal averaging for Avantes spectrometers Signal averaging is now available for Avantes spectrometers. A new command parameter has been added to the Avantes initialize command (see Figure 70). Figure 70 – The number of averages parameter has been added to the Avantes initialize command This parameter can be used to specify the number of averages to use when acquiring a spectrum according to the method specified in the External devices tutorial, available from the Help menu in NOVA. The use of the averaging option can improve the signal to noise ratio of the measured spectra, as shown in Figure 71. 57 | P a g e Figure 71 – Example of data acquired using the Avantes spectrometer (blue curve: no averaging, red curve: 100 averages) Note Each acquired spectrum stored in the Avantes spectrometer will be the average of the number of specified number of averages. Note When the averaging option is used, the total integration time used for each averaged spectrum is given by the specified integration time multiplied by the number of averages. Warning It is necessary to update the firmware of the Avantes spectrometers to version 000.031.000.001. Contact Metrohm Autolab ([email protected]) for more information on firmware modifications of the Avantes spectrometers. Control of the Metrohm 6.2148.010 remote box This update of NOVA provides support for the Metrohm 6.2148.010 Remote box with MSB connection. This device can be connected to any available MSB port and provides one additional spare MSB connection for additional hardware (see Figure 72). 58 | P a g e Figure 72 – Support for the Metrohm 6.2148.010 Remote box with MSB is now available This device can be used to send and receive digital signals from other Metrohm devices. The Remote box is controlled during a measurement using the dedicated Remote inputs and Remote outputs commands, provided in the Metrohm devices group of commands (see Figure 73). Figure 73 – The Remote inputs and Remote outputs commands are used to control the Remote box The Metrohm 6.2148.010 has a total of 8 read lines, the status of which can be acquired using the Remote inputs command. It also has a total of 14 write lines, which can be set using the Remote outputs command. For both command, the high state is represented by a 1 and a low state is represented by a 0. Note The Metrohm 6.2148.010 Remote box is identified in the Liquid Handling setup as a 770 device type (see Section 5.4). 59 | P a g e Improvements to thea Metrohm Liquid Handling support To facilitate bookkeeping of Metrohm Liquid handling devices, the connected devices are now identified by Name – Device type – Serial number in the Liquid Handling setup (see Figure 74). Figure 74 – Metrohm devices are now identified by Name – Device type – Serial number Automatic repair of the pX1000 checksum error problem An error in the programming could potentially lead to a write error when saving the calibration data in the on-board memory of the pX1000 module. This error is now fixed and checksum errors in existing pX1000 modules are automatically repaired. 60 | P a g e NOVA 1.9 Release notes (Released 26/11/2012) Introduction Thank you for installing this update of NOVA. These notes provide an overview of the new features introduced in NOVA 1.9. The following improvements have been added to NOVA: • • • • • • • • • • • • • • • • • • • Support for 64 Bit versions of Windows Active profile indication in the status bar Hidden commands warning Check for updates on startup Linkable cutoff value in procedure editor Power and resistance signals added to the signal sampler WE(X).Charge signal added to the signal sampler Automatic offset DAC control Internal dummy cell control for the PGSTAT101 and the M101 Optional serial number in legend Linkable purge time Procedure editor in Multi Autolab view iR drop correction analysis tool/command File extension identification in Import GPES data command Dedicated Avantes spectrometers support Frequencies per decade distribution in the FRA frequency scan editor Consolidation of the Wait time (s) and Wait time (μs) commands Distributed circuit element added to Fit and Simulation tool Clear measurement plot command Support for 64 Bit versions of Windows NOVA now includes support for 64 Bit versions of Windows for selected instruments. Please refer to for a list of compatible instruments (see Table 1). Instrument type PGSTAT10, 20 PGSTAT12, 30, 302, 100 PGSTAT302N PGSTAT128N PGSTAT100N PGSTAT302F PGSTAT101 Multi Autolab/M101 µAutolab II and III 64 Bit compatible No No Yes (Serial number ≥ AUT84440) Yes (Serial number ≥ AUT84460) Yes (Serial number ≥ AUT84500) Yes Yes Yes No Table 1 – Windows 64 Bit compatibility table 61 | P a g e Active profile indication To indicate which NOVA profiles are currently selected, indicators are now displayed on the right-hand side of the status bar. These indicators facilitate the identification of the active profile in NOVA (see Figure 75). Figure 75 – Active profile indicators are now shown in the status bar Hidden commands warning Depending on the active profile, some commands can be hidden from view in the procedure editor: To warn the user about this, a message is now displayed in the status bar of NOVA (see Figure 76). Figure 76 – A warning is shown when commands are hidden by the active profile To reveal the hidden commands, select the Show all option from the Profile menu or adjust the active profile using the same menu. Check for update on startup If the computer is connected to the internet, NOVA will check if a new version is available for download from the Metrohm Autolab website on startup. If a new version is available, an indication will be displayed in the connection manager in the lower right corner of the screen (see Figure 77). Figure 77 – A message is show when a new version if available for download 62 | P a g e Linkable cutoff value in procedure editor The value parameter used in the Cutoff option, can now be linked in the procedure editor if a unique identifying name is given to it. The Edit Options window now provides an additional field on the Cutoff tab, allowing the user to specify the name of the parameter to use in the procedure editor to identify the cutoff limit (see Figure 111). Figure 78 – The value of the cutoff is now linkable if a name is provided on the Cutoff tab If a name is provided in the Linkable as field in the basic properties, this parameter will be shown in the procedure editor (see Figure 79). Other command parameters can then be linked to this parameter, which allows the cutoff value to be modified or specified by other commands, while the measurement is running (using an input box or a calculate signal, for example). 63 | P a g e Figure 79 – The cutoff limit is displayed in the procedure editor if a name is provided Power and Resistance signals The WE(1).Power signal (in Watt) and the WE(1).Resistance signal (in Ohm) have been added to the signal sampler. These signal are derived from the WE(1).Potential and the WE(1).Current signals and can only be recorded if both signals are sampled (see Figure 112). 64 | P a g e Figure 80 – WE(1).Power and WE(1).Resistance signals are now available in the sampler These new signals are calculated signals and therefore cannot be sampled in optimized mode. The calculation is performed in real time, which allows these new signals to be involved in the cutoff option as well (see Figure 81). Figure 81 – The new signals are also available in the cutoff option 65 | P a g e WE(X).Charge signal The WE(X).Charge signal (in Coulomb) has been added to the signal sampler. This signal is available for each working electrode for which the current signal is measured (see Figure 82). Figure 82 – WE(X).Charge signals are now available in the sampler The WE(X).Charge signal is a calculated signal and therefore cannot be sampled in optimized mode. The calculation is performed in real time, which allows these new signals to be involved in the cutoff option as well (see Figure 83). Warning The charge is calculated mathematically using the so-called trapezoidal method. The accuracy of this method depends on the interval time and on the current derivative. In most cases, the calculated charge will only be a first approximation of the real charge, which can be measured properly using the optional FI20 module or the on-board integration. 66 | P a g e Figure 83 – The calculated charge is available in the cutoff option Automatic offset DAC control The offset DAC, described in Chapter 4 of the NOVA Getting started manual, is now automatically set by the software, whenever required. This allows the potential or the current to be set automatically to any value within the applicable range. Note The offset DAC should not be modified when the cell is on during a measurement. A warning is provided during validation if the procedure requires the offset DAC to be reset during the experiment (see Figure 7). 67 | P a g e Figure 84 – A warning is provided when the offset DAC is reset while the cell is switched on Internal dummy cell control for PGSTAT101 and M101 The PGSTAT101 and M101 are both fitted with an internal dummy cell. This internal dummy cell can now be controlled through the Autolab control command, as shown in Figure 138. Figure 85 – The internal dummy cell for the PGSTAT101 and the M101 can now be controlled using the Autolab control command Using the internal dummy cell toggle, it is possible to set the internal dummy cell on or off. 68 | P a g e Note The internal dummy cell must be switched off when measurements are performed on a real cell. The procedure validation will always provide a warning when a measurement is started with the internal dummy cell on (see Figure 12). Figure 86 – A warning is provided during validation when the internal dummy cell is on Optional serial number in legend By default, the Autolab serial number is displayed in the legend of any plot to facilitate the identification of the instrument in an overlay plot. It is now possible to deactivate this option through the NOVA options (see Figure 87). 69 | P a g e Figure 87 – The NOVA options allow the serial number to be activated or deactivated in the legend Linkable purge time The Duration parameter of the Purge time command is now linkable to other command parameters (see Figure 121). Figure 88 – The duration parameter of the Purge time command is now linkable 70 | P a g e Procedure editor in the Multi Autolab view To facilitate editing of multiple procedures in the Multi Autolab view, a simplified procedure editor is available in this view to edit existing procedures. To open this editor, click the button located next to the specified path (see Figure 140). Figure 89 – Clicking the button in the Multi Autolab view opens a simplified procedure editor Clicking the button opens a popup window displaying a reduced form of the setup view. Through this window, the procedure can be modified. Commands and links in the procedure can be edited and the changes can be saved to file (see Figure 90). Figure 90 – A simplified view of the setup view is shown when the button is clicked iR drop correction tool The iR drop correction command and analysis tool have been added. This tool can be used to automatically correct the data, after the measurement is finished, for iR drop. This tool requires the user to manually set the value of the uncompensated resistance to use in the calculation. The tool calculates an adjusted value of the applied potential, given by: 71 | P a g e 𝐸𝐸𝐶𝐶𝐶𝐶𝐶𝐶𝐶𝐶𝐶𝐶𝐶𝐶𝐶𝐶𝐶𝐶𝐶𝐶 = 𝐸𝐸𝐴𝐴𝐴𝐴𝐴𝐴𝐴𝐴𝐴𝐴𝐴𝐴𝐴𝐴 − 𝑖𝑖𝑅𝑅𝑢𝑢 Where 𝑅𝑅𝑢𝑢 is the resistance value specified by the user. The command can be found in the analysis – general group of commands. The analysis tool can be added to a measured data set directly (see Figure 91). Figure 91 – The iR drop correction analysis tool allows to correct the data for iR drop after the measurement The Corrected potential signal is added to the original data after the calculation. After the calculation, the corrected data can be plotted (see Figure 92). Figure 92 – The iR drop correction command can be used to correct the measured data for ohmic drop 72 | P a g e File extension identification in Import GPES data command The Import GPES data command has been modified in order to recognize the extension of the file and assign the suitable signal names to the imported data 1. Depending on the file extension of the specified file, NOVA will import the data as detailed in Table 2. Extension Type of data Signals Plots .ocw Cyclic voltammetry, Linear sweep voltammetry i, E i vs E .oxw Chrono methods i, t i vs t .oew Voltammetric analysis i, E i vs E .opw Potential stripping analysis E, dt/dE dt/dE vs E .onw Electrochemical noise E, i, t E vs t .odw Multimode electrochemical detection i, t i vs t Table 2 – Overview of the identifiable GPES file extensions Avantes spectrometers support USB 2.0 controlled Avantes AvaSpec spectrophotometers are now directly supported in NOVA. The Avantes instruments can be controlled by NOVA in combination with the Autolab. The commands related to the control of the Avantes instruments have been added to the External devices group of commands (see Figure 93). Figure 93 – Dedicated commands to control Avantes spectrometers are available in the External devices group of commands 1 Please refer to the GPES User Manual for more information on the file format of the GPES files. 73 | P a g e Two commands are available: • • Avantes initialize: initializes the control of a specified Avantes spectrophotometer connected to the computer. This command can be used to specify the measurement range, the integration time and other data acquisition parameters for the spectrophotometer. Avantes close: terminates the control of the initialized Avantes spectrophotometer and recovers the measured data from the spectrometer. This data is then associated with electrochemical data from the Autolab, if applicable. Frequencies per decade in the FRA frequency scan editor It is now possible to specify the frequencies per decade to use in a FRA frequency scan rather than the absolute number of frequencies in the scan. When the number of frequencies per decade is specified, a logarithmic distribution is used between the first and last specified frequencies (see Figure 94). Figure 94 – It is now possible to define the frequency scan using a Frequency per decade distribution Using this distribution, the actual number of frequencies is defined by the First and Last applied frequencies in the scan. 74 | P a g e Merge files option It is now possible to merge files in order to generate a new file which contains the data from the source files. This option can be used when data included in one file needs to be used in a calculation involving data from another file. The source files are not deleted and a new file is created instead. A name for the new file must be specified upon merging (see Figure 95). Figure 95 – Merging data files in the NOVA database A new file is created and added to the database. This file contains the data from the merged source files (see Figure 96). Figure 96 – A new merged file is added to the database Wait time and Wait time (µs) command consolidation The Wait time (s) and Wait time (µs) commands have been consolidated to avoid confusion. Both commands are now replaced by a single Wait time (s) command which accepts decimal values. The accuracy of the wait time is ~ 1 ms. New circuit element for Fit and Simulation The library of circuit elements has been expanded by adding the B2 circuit element. The B2 circuit element available in the Fit and Simulation analysis tool is a transmission line element derived from the classical model for a porous or mixedphase electrode of thickness L (see Figure 97). 75 | P a g e Figure 97 - Overview of the B2 circuit element This transmission line has been integrated in NOVA. In the literature, this denomination is also extended in the world of DSC and in general systems that analyze the combination of charge transport, accumulation and recombination. More information on the B2 circuit element can be found in the Appendix of the Impedance measurements tutorial, available in the Help menu in NOVA. Clear measurement plot command A Clear measurement plot command has been added to the Control group of commands (see Figure 98). Figure 98 – The Clear measurement plot command has been added to the Control group of commands This command can be added anywhere in the procedure to clear the contents of one of the four available plots, or all plots at once. 76 | P a g e NOVA 1.8 Release notes (Released 01/12/2011) Introduction These notes provide an overview of the new features introduced in NOVA 1.8 compared to the previous release. The following items have been added to this release of NOVA: - Support for the instruments and modules: • FRA32M – New impedance analyzer module - Improvements and additions: • • • • • • • • • • • • • • • • • • • Automatic update tool for USB interfaces Automatic Hardware setup Simplified interface with Profile menu Hide/Show option Sorting function for the Commands browser Import/Export Profiles Context sensitive popup menu Add comments to My Commands Favorite commands group Basic Undo/Redo functionality Modification to the Calculate signal command Noise meters added to Autolab display Real time modification of the command parameters Add plots in real time Modification of the plot options in real time Create Windower from X axis New plot options Linkable interval time in Record signals (> 1 ms) command Pseudo capacitance calculation for (RQ) circuit Automatic update tool for USB interfaces Autolab PGSTAT302N and PGSTAT100N with serial numbers > AUT84440 and PGSTAT128N with serial numbers > AUT84460 need a firmware update to avoid a potential USB communication problem. This update is only required for the above mentioned instruments when used in combination with the NOVA only drivers. An automatic update tool is included in the Diagnostics application. Note: when NOVA is used with the instruments mentioned above in combination with the NOVA only driver, the initialization of the instrument will be stopped until the firmware is updated (see Figure 99). 77 | P a g e Figure 99 – The initialization of the instrument is blocked when the outdated firmware is detected on an instrument controlled through the NOVA only driver During Diagnostics, an update message will be displayed if the outdated firmware is detected. Clicking the Yes button when prompted will silently update the firmware (see Figure 100). Figure 100 – An upgrade message is displayed when the outdated firmware is detected The firmware update is permanent and needs to be carried out only once. The update will take about five seconds. FRA32M The FRA32M is the new impedance analyzer module for the modular Autolab PGSTAT instruments and the Multi Autolab instruments. It replaces the FRA2 module and it is compatible with all the commands and procedures used in combination with the FRA2 module. The FRA32M is fitted with a frequency generator that reaches 32 MHz. However, when the FRA32M is used in combination with the Autolab PGSTAT, the maximum frequency that can be applied in a measurement is 1 MHz 2. For measurements involving external devices, the frequency can be increased. The maximum frequency that can be used in combination with the FRA32M depends on the highest achievable bandwidth of the Autolab PGSTAT. Please refer to the Getting started manual for more information. 2 78 | P a g e Please refer to the Impedance spectroscopy tutorial, available from the Help menu, for more information. Automatic Hardware setup Whenever an Autolab is connected to the computer for the first time, Nova will try to configure the instrument automatically by reading out the on-board EEPROM information. This allows the software to pre-configure the hardware setup without user-intervention. For old instruments and old modules 3, this automatic configuration can sometimes not be done accurately. For this reason it is always recommended to verify that the configuration is accurate after initialization of the instruments. Simplified interface with Profile menu A profiling scheme has been added to Nova. Using this tool, it is possible to hide some commands in order to simplify the user interface. The profiles can be adjusted using the dedicated Profile menu (see Figure 101). Figure 101 – The profile menu can be used to set the user profile The profiles are grouped in three sections: • • • 3 Level based (mandatory, set to Intermediate by default) Hardware based (optional) Application based (optional) Please refer to the Getting started manual for more information. 79 | P a g e Level based All the commands and the procedures in Nova have been tagged with three levels: basic, intermediate and advanced. When the basic profile is active, only a few simple commands are shown, when the advance profile is active, all the commands are shown (see Figure 102). Figure 102 – Difference between the basic (left) and the advanced (right) profile Note: the intermediate profile is the default level based profile selected upon installation of Nova. Important: the selected level based profile is always on. Hardware based All the commands and the procedures in Nova have been tagged with a hardware requirement marker. When the hardware-based profile is active, only the procedures and commands that can be executed with the connected instrument are shown. In Figure 103, the Autolab procedures are shown without and with the hardware-based profile active, for a µAutolabIII. Since the µAutolabIII is not fitted with the required hardware, several procedures are hidden. 80 | P a g e Figure 103 – Overview of the Autolab procedures with a µAutolabIII (left, hardware-based profile not active and right, hardware-based profile active) Application based All the commands and the procedures in Nova have been tagged with an application marker: corrosion, energy, electroanalysis, etc... When a given application profile is active, only the commands and procedures relevant for this application are shown (see Figure 104). Figure 104 – Difference between the corrosion (left) and the electroanalytical (right) profile Note: it is possible to combine all the profile schemes at the same time. For example, it is possible to set the profile to show hardware-based and intermediate commands and procedures for the energy application (see Figure 105). 81 | P a g e Figure 105 – It is possible to combine several profiles at the same time (intermediate, hardware-based and energy related) Hide/Show option To further customize the appearance of the user interface, the option to hide and show procedures, commands, and command parameters has been added. To hide an item in Nova, simply right-click the item and select the hide option from the menu. In Figure 106, this option is used to hide the Chrono coulometry fast procedure from the procedures browser. 82 | P a g e Figure 106 – Hiding a procedure from the procedure browser Once an item has been hidden from view, it will not be shown until it is unhidden. To unhide hidden commands, procedures or command parameters, select the Show all option from the Profiles menu (see Figure 107). Figure 107 – Select the Show all option from the Profile menu to display all hidden items 83 | P a g e Hidden items are shown in green (see Figure 108). Figure 108 – Right click hidden items to unhide them To unhide a hidden item, right-click the item and select the unhide option from the context menu, as shown in Figure 108. Note: it is also possible to hide items using the CTRL-H keyboard shortcut and to unhide items using the CTRL-SHIFT-H keyboard shortcut. In the commands browser, it is possible to hide single commands from a given group, using the same method. It is however also possible to completely hide a command group from the browser (see Figure 109). 84 | P a g e Figure 109 – Hiding a command (left) and a command group (right) When a command group is hidden, the whole group will become invisible. Finally, in the procedure editor, it is possible to hide or unhide command parameters, using the same method (see Figure 110). For example, if the interval time is not important, it can be hidden from view. This can be used to further simplify the user interface. 85 | P a g e Figure 110 – Hiding and unhiding command parameters in the procedure editor Sorting function for the commands browser The possibility to sort the commands in a group is now provided. Right-clicking a command group displays the different sorting options: ascending or descending (see Figure 111). It is always possible to return to the original order using the same strategy and using the Original order option provided in the context menu. 86 | P a g e Figure 111 – Sorting the commands in a group in the commands browser Import/Export profiles It is possible to hide any number of items in Nova and to create a new profile for this customized view. Using the Profile menu, it is possible to import and export user profiles (see Figure 112). Figure 112 – Importing and exporting user profiles 87 | P a g e This means that any number of profiles can be created and used at any time using this method. It is possible to reset the user-defined profiles to default by using the Reset user profile option from the Profile menu (Figure 112). Context sensitive popup menu A new context sensitive popup menu window has been added to Nova. This popup appears as soon as any item supporting this feature is clicked (see Figure 113). Figure 113 – Clicking an item in Nova now displays a popup menu window (for supported items only) This popup menu displays a number of icons related to context sensitive actions. In the example shown in Figure 113, a total of eight action buttons are shown in the popup menu. These actions are the most commonly encountered for the CV staircase command (see Figure 114). Figure 114 – Each icon in the popup menu is assigned to a specific action This popup menu system can be used to facilitate procedure construction and data analysis. 88 | P a g e Add comments to My commands To simplify the organisation of commands saved in the My commands group, remarks can now be added to each command, as shown in Figure 138. Figure 115 – Remarks can now be added to commands saved in the My commands group The remarks provided upon saving the command are displayed in a tooltip in the commands browser (see Figure 116). Figure 116 – The remarks are displayed in a tooltip for each command saved in the My commands group Furthermore, it is possible to edit the remarks assigned to saved commands by rightclicking the commands in the My commands group (see Figure 117). 89 | P a g e Figure 117 – Right click the commands saved in My commands group to edit the remarks Favorite commands group A new group, called Favorite commands, has been added to the Commands browser (see Figure 139). Figure 118 – A Favorite commands group has been added to the Commands browser The Favorite commands group automatically displays the ten commands with the highest ranking (see Figure 119). 90 | P a g e Figure 119 – The Favorite commands group displays the ten most used commands User-defined commands, stored in the My commands group of commands, are also listed in the Favorite commands, if applicable. It is possible to manually remove a command from the Favorite commands group by right-clicking the command (see Figure 120). 91 | P a g e Figure 120 – Right click a command to remove it from the Favorite commands group Manually removing a command from the list automatically forces the software to upgrade the 11th most used command to the favorite commands group. Basic Undo/Redo functionality The undo and redo functions have been added to Nova. The following actions can be undone or redone: • • • Delete command Link or unlink command parameter Insert or move command Note: command parameters have to be edited again in order to reset them to an earlier value. Two buttons have been added to the toolbar (see Figure 121). Figure 121 – The undo and redo buttons have been added to the toolbar It is possible to undo an action by clicking the button in the toolbar if available or by right-clicking anywhere in the procedure editor (setup view) or the data explorer frame (analysis view) and select the Undo … option from the context 92 | P a g e menu. In Figure 122 this tool is used to undo the delete action performed on the CV staircase command of the Cyclic Voltammetry potentiostatic procedure. Note: the well known CTRL-Z keyboard shortcut can also be used. Figure 122 – Using the Undo function Similarly, it is possible to redo an undone action by clicking the button in the toolbar or by right-clicking anywhere in the procedure editor (setup view) or the data explorer frame (analysis view) and select the Redo … option from the context menu. In Figure 123 this tool is used to redo the delete action performed on the CV staircase command of the Cyclic Voltammetry potentiostatic procedure. Note: the well known CTRL-Y keyboard shortcut can also be used. Figure 123 – Using the Redo function 93 | P a g e Modification of the Calculate signal command The Calculate signal command has been adjusted and now displays the expression used in the calculation in the procedure editor (see Figure 140). Figure 124 – The expression used in the Calculate signal command is now displayed in the procedure editor Noise meters added to the Autolab display A bar graph noise meter has been added to the Autolab display to indicate the level of noise recorded for both the potential and the current (see Figure 125). Figure 125 – Noise meters are now used to display the noise in the measurements 94 | P a g e The noisier the signal, the more bars will be displayed. In Figure 125, the noise on the potential is very small (one bar), while the noise on the current is larger (four bars, out of maximum of eight). Real time modification of the command parameters It is now possible to modify certain command parameters while the measurement is running. In the measurement view, an additional frame is displayed during the experiment. If the running command offers the possibility to modify a parameter in real time, the current value will be displayed in the additional frame (see Figure 126). Figure 126 – The additional frame located in the measurement progress frame displays the list of modifiable command parameters (left: original parameters; right: modification of the scan rate) In the example shown in Figure 126, the modifiable command parameters of the CV staircase command are displayed. To change a parameter, change the value and press the button (see Figure 126). Note: only the parameters of the active command can be modified. If the modified parameter is linked to other parameters in the procedure, the modification is applied to the linked parameters as well. The modification of the parameters only affects these parameters during the ongoing measurement. The original parameters defined in the procedure in the Setup view or not affected. Add plots in real time 95 | P a g e It is now possible to add new plots to a given command in the measurement view, while the command is running if the command provides data that can be plotted. Right-clicking the command in the measurement progress frame displays a context sensitive menu through which the type of plot and location can be chosen (see Figure 127). Figure 127 – Adding a plot to the CV staircase command Note: the list of plots available in the right-click menu depends on the signals measured by the command. These signals are specified in the signal sampler. Modification of the plot options in real time It is now possible to change the plot options while the procedure is running. All the plots generated by a given command are now listed in the procedure progress frame. Right-clicking a plot displays a menu through which the plot options can be edited (see Figure 128). 96 | P a g e Figure 128 – It is possible to change the plot options while the measurement is running by right-clicking a plot in the measurement progress frame Note: the same menu can be used to delete the plot (see Figure 128). Create Windower from X axis A new way of using the Windower tool has been added to the analysis view. It is possible to zoom in on the data shown in a plot to focus on a specific part of the plot (see Figure 129). Figure 129 – Zoom in on the data Next right click the plot in the data explorer frame and select the Create Windower from X axis option from the context menu (see Figure 130). 97 | P a g e Figure 130 – Select the Create Windower from X axis option to window the visible data The software will then add a Windower item to the data which will contain all the data that fit in the visible range of values for the signal plotted on the X axis. In the case shown in Figure 131, the Z’ values between 9.8 kOhm and 13.2 kOhm have been windowed. Figure 131 – The windowed data 98 | P a g e New plot options It is now possible to change the line plot and the combi plot in order to use a discontinued line instead of regular line (see Figure 132). Through a drop-down list, it is now possible to choose between different line styles. Figure 132 – A line style drop-down list has been added to the plot options 99 | P a g e Linkable interval time in Record signal (> 1 ms) command The interval time parameter of the Record signals (> 1 ms) command can now be linked to another parameter. The interval of the command can therefore be specified using an input box, for example (see Figure 148). Figure 133 – The interval time parameter of the Record signals (> 1 ms) command is now linkable Pseudo capacitance calculation for (RQ) circuit The fitting and simulation tool for impedance spectroscopy now offers the possibility to convert a Q element in parallel with a resistance to a pseudo capacitance according to the following calculation: 1 n 0 Cpseudo = Y ⋅R 1 −1 n This option is shown in Figure 134. For example, a Q element with a Y0 value of 1 µMho and a n factor of 0.75, in parallel with a resistance of 1000 Ohm will be converted to a pseudo capacitance of 51.8 nF. Figure 134 – Converting a Q element to a pseudo capacitance 100 | P a g e NOVA 1.7 Release notes (Released 01/04/2011) Introduction These notes provide an overview of the new features introduced in NOVA 1.7 compared to the previous release. The following items have been added to this release of NOVA: - Support for the instruments and modules • • • PGSTAT302F – Switchable floating version of the PGSTAT302N PGSTAT100N Multi Autolab – Multi channel frame with M101 potentiostat/galvanostat - Improvements and additions • • • • • • • • • • • • • On the fly conversion of procedures and data from previous versions of NOVA Redesign of the pX calibration interface Redesign of Edit Cutoff user interface Reverse on Cutoff Adjustments to the Graphical user interface for Fitting and Simulation of impedance data Improvement of the Peak search analysis tool Driver manager Export to ZView command Integration of My Commands in Analysis view Record signals linkable Faster startup Adjustments to the Windower tool Preview of database names Installation requirements NOVA 1.7 requires the .NET Framework 4.0 to be installed. This windows update is automatically installed, if necessary, during the setup of NOVA 1.7 (see Figure 135). 101 | P a g e Figure 135 – NOVA 1.7 requires the .NET Framework 4.0 PGSTAT302F The PGSTAT302F is a special version of the PGSTAT302N. This instrument can be toggled from normal operation mode to floating mode. The regular use is intended for typical electrochemical cells in which neither the working electrode nor the electrochemical cell itself are connected to ground. The floating mode is intended for grounded electrochemical cells or cells in which the working electrode is directly connected to ground. Please note that the signal-to-noise ratio will deteriorate when working with the PGSTAT302F in floating mode. When the PGSTAT302F is operated in normal mode, the specifications will be identical to those of the PGSTAT302N. More information on the PGSTAT302F can be found in the documentation provided with the instrument. PGSTAT100N The PGSTAT100N is the evolution to N-form factor of the Autolab PGSTAT100. It can now be selected in the Hardware setup. Multi Autolab The Multi Autolab is a generic frame in the same form factor as the PGSTAT302N. This frame can be fitted with additional modules (see Figure 136). 102 | P a g e Figure 136 – Example of a Multi Autolab instrument fitted with M101 modules and daughter modules (BA, EQCM and pX1000) The following modules can be installed in the frame: • • M101: this is a PGSTAT101 module, providing control for a single electrochemical cell. The specifications of the M101 module are identical to the specifications of the PGSTAT101. Up to 12 M101 modules can be installed in a Multi Autolab frame, providing connections for up to 12 independent electrochemical cells. Daughter module: it is possible to install an optional module in the module bay directly on the right hand side of a M101 module. The daughter module can only be installed in an even position (identified by a letter on the front panel). This means that every M101 module installed in an odd module bay in the Multi Autolab frame (identified by a number on the front panel) can control a single daughter module installed in the even position directly on the right. Any of the following modules can be installed in this position: BA, EQCM, pX1000 and MUX. The M101 modules and optional daughter modules are used through the Multi Autolab view. Please refer to the Multi Autolab tutorial for more information. Previous NOVA versions and NOVA 1.7 It is possible to install more than one version of the NOVA software on the same computer. Installing version 1.7 does not upgrade previously installed versions. However, it is only possible to use one version of the software at a time and data sets obtained with NOVA 1.7 cannot be used with previous versions of NOVA. The opposite situation is possible, using the conversion tool that is installed together with version 1.7, or by using the Import data and Import procedure tools available in the software (see Figure 137). 103 | P a g e Figure 137 – It is now possible to import procedures and data from previous versions of Nova directly Please refer to the Upgrading files from previous versions tutorial, available from the Help menu. Note: files from NOVA 1.2 or earlier versions are no longer supported. Redesign of the pH Calibration interface The pH Calibration user interface has been redesigned for clarity. Redundant information has been removed and the calibration information is now displayed more clearly (see Figure 138). 104 | P a g e Figure 138 – The redesigned pH Calibration interface The pH calibration tool requires the pX or the pX1000 module to be installed in the instrument. Please refer to the pX tutorial, available from the Help menu in NOVA, for more information. Redesign of the Edit Cutoff user interface The Edit Cutoff user interface, integrated in the Edit Options menu, has been redesigned in order to present the cutoff definition in a clearer way with respect to the previous versions (see Figure 139). 105 | P a g e Figure 139 – The Cutoff user interface has been redesigned for clarity Please refer to the Cutoff tutorial, available from the Help menu in NOVA, for more information. Reverse on Cutoff The redesign of the Edit Cutoff user interface now also includes a command specific action field which can be used to trigger a specific action when a user-defined cutoff condition is met during the execution of a specific command. Presently, only the CV staircase and the LSV staircase commands make use of this option. For both commands, the possibility to trigger a reversal of the scan direction is provided. This Reverse on cutoff action is only available in the Edit Cutoff dialog specified for CV staircase and LSV staircase (see Figure 140). 106 | P a g e Figure 140 – The Reverse scan direction action can be specified in the cutoff for CV staircase and LSV staircase commands Please refer to the Cutoff tutorial, available from the Help menu in NOVA, for more information. Adjustments to the Graphical user interface for Fitting and Simulation of impedance data The Graphical user interface for the fitting and simulation of impedance spectroscopy, introduced in NOVA 1.6, has been adjusted. The following modifications are included in this release: • Unlinked connections are now identified in a unique way: when connections in the graphical user interface are not combined properly in an equivalent circuit, they are indicated by an open circle ( ) rather than a closed circle ( ). This allows the user to identify the invalid connections more quickly (see Figure 141). Figure 141 – Invalid connections are now indicated by an open circle (left, C element not connected properly; right, C element connected properly) 107 | P a g e • The χ² value is now included in the Report: the calculated χ² value is now included in the report created by the Fit and Simulation tool (see Figure 142). Figure 142 – The calculated χ² value is now automatically included in the report generated by the Fit and Simulation tool Driver manager The Autolab requires specific USB drivers in order to operate properly. Presently two different drivers are provided for the Autolab: • • NOVA only driver (recommended): this driver is only supported in NOVA. It provides faster USB data transfer with respect to the GPES drivers and provides support for up to 16 Autolab instruments connected to the same computer. GPES compatible driver: this driver is recommended for users that want to switch between NOVA and GPES. This driver provides slower data transfer and the maximum number of devices supported in Multi Autolab mode is 8. It is possible to quickly switch between drivers by using the dedicated driver manager application. A shortcut is provided in Start menu – All programs – Autolab – Tools (see Figure 143). 108 | P a g e Figure 143 – The Autolab Driver Manager application can be used to quickly switch from one driver to the other The Autolab NOVA only driver is recommended. Note: switch to the GPES compatible driver when using earlier versions of NOVA or when using the GPES or FRA software. Improvements to the Peak search tool The Peak search command and the corresponding analysis tool have been redesigned and improved. The parameter Number of points in search window is now defined in the Analysis view as a quick dial control (see Figure 144). 109 | P a g e Figure 144 – The Number of points in search window parameter can now be adjusted with a quick dial This allows the user to easily modify this parameter and visualize the changes in the peak search results. Moreover, the search algorithm is now also able to cross over data gaps. When encountering data sets with a gap, the peak baseline can be extended over the gap, if the gap distance is smaller than 3% of the X and Y value range (see Figure 145). Figure 145 – The redesigned peak search tool is able to extend the baseline across data gaps (left, source data with gap around 0.25 V – right, result of peak search) Export to ZView A dedicated data exporting tool has been added to NOVA. Using this tool, it is possible to quickly export impedance spectroscopy data to a ZView compatible format (see Figure 146). 110 | P a g e Figure 146 – A direct Export to ZView tool has been added Using this tool, it is possible to create an ASCII file directly readable by the ZView software. A matching Export to ZView command has been added to the Data handling group of command in the Setup view. My Commands integration in Analysis view User defined commands created in the Setup view or in the Analysis view using the My commands framework can now be accessed from the Analysis view, using the right-click menu (see Figure 147). Figure 147 – Commands created using the My commands framework in the Setup view are now available in the Analysis view 111 | P a g e Linkable duration in Record signal (> 1 ms) command The Duration parameter of the Record signals (> 1 ms) command can now be linked to another parameter. The duration of the command can therefore be specified using an input box, for example (see Figure 148). Figure 148 – The duration parameter of the Record signals (> 1 ms) command is now linkable Faster startup of Nova The boot sequence of the software has been improved with respect to the previous versions. Nova will now start considerably faster and the startup time is independent of the number of files in the database. Adjustments to the Windower tool The Windower command, available from the Data handling group, has been modified. The boundaries defined in the command can now be linked in the procedure editor to other parameters. The linkable boundaries are shown in the procedure editor after definition of initial values in the command (see Figure 149). Figure 149 – The boundaries defined in the Windower tool are now available in the procedure editor Preview of database names When the Automatic save option is set to off (through the Tools – Options menu), the Save measured data dialog window will be displayed at the end of each measurement. To facilitate file naming, a drop-down list, displaying the list of files 112 | P a g e already present in the database starting with the same name typed in the Procedure name field, is automatically generated (see Figure 150). Figure 150 – The Save measured data now automatically displays a list of file names already present in the database 113 | P a g e NOVA 1.6 Release notes (Released 01/06/2010) Introduction These notes provide an overview of the new features introduced in NOVA 1.6 compared to the previous release. The following items have been added to NOVA 1.6: - A new set of tutorials, available from the Help menu - Support for the modules • FI20 – Integrator and on-board integrator - Improvements and additions • • • • • • • • • • • • • • • • • • • • • 114 | P a g e Serial number recognition Redesign of the FRA measurement commands Single frequency FRA measurements Manual control of the FRA through Autolab display Graphical user interface for Fitting and Simulation of impedance data Simplified commands and parameters MultiBA module support Multi Autolab support Software synchronization command for Multi Autolab measurements Serial number and instrument description in the database Multi Autolab support for Diagnostics application New user interface for the procedure validator FFT Analysis and FFT Smoothing ECN Spectral noise analysis Clear plot button modification Dynamic command parameters Repeat for multiple values Autolab display with collapsible panels Current interrupt and positive feedback External .NET applications support Avantes spectrometer support Previous NOVA versions and NOVA 1.6 It is possible to install more than one version of the NOVA software on the same computer. Installing version 1.6 does not upgrade previously installed versions. However, it is not possible to use both software packages at the same time and data sets obtained with NOVA 1.6 cannot be used with previous versions of NOVA. The opposite situation is possible, using the conversion tool that is installed together with version 1.6. Please refer to the Upgrading files from previous versions tutorial, available from the Help menu. Tutorials New tutorials have been added to this version of NOVA. The tutorials are available from the Help menu (see Figure 191). Figure 151 – New tutorials are available from the Help menu 115 | P a g e Modules support NOVA 1.6 adds support for the analog integrator part of the optional FI20 module. It also includes support for the on-board integrator of the µAutolab type II and III as well as the PGSTAT101 (see Figure 152). Figure 152 – The integrator module is now supported in NOVA The integrator module can be used to measure the charge and perform chrono coulometry experiments. It can also be used to perform so-called Cyclic voltammetry staircase current integration experiments. Two default Autolab procedures have been added to illustrate the use of this module. Warning: the integrator must be calibrated before it is used. The calibration of the integrator is performed in the Diagnostics 4 application. Make sure that the Integrator test is selected in the diagnostics application (see Figure 153). 4 Refer to the Getting started manual for more information on the Diagnostics application. 116 | P a g e Figure 153 – The integrator test is used to determine the calibration factor of the integrator When the integrator test is finished, a window will be shown, indicating the currently used calibration factor and the measured calibration factor (see Figure 154). Figure 154 – The stored and measured calibration factors are shown at the end of the test The new value can be stored by clicking the OK button. This value will be shown in the frame on the right-hand side of the Hardware setup window (see Figure 152). More information on the use of the integrator module can be found in the Filter and Integrator tutorial, available from the Help menu. 117 | P a g e Serial number recognition Version 1.6 stores hardware setup profiles for each connected instrument. If the hardware setup is defined and saved on the computer for a specific instrument, this configuration file will be automatically loaded whenever the instrument is connected to the computer. The FRA2 calibration file is also associated with the identifying serial number of the device. Note: it is not necessary to reboot the software whenever the hardware setup is adjusted. Redesign of the FRA measurement commands This version of NOVA includes a set of completely redesigned FRA measurement commands. The data acquisition speed has been significantly improved with respect to the previous versions of NOVA, without compromising data quality. Software overhead times have been reduced, resulting in a dramatic increase in data acquisition speed. The default Test FRA2 procedure provided in the Module test database will now take approximately four minutes instead of roughly ten minutes in the previous versions. Through the added FRA sampler, time and frequency domain raw signals can be easily added to the measurement (see Figure 155). This additional information can be used to evaluate important experimental settings during measurement, like the linearity or the stability of the system being investigated. Figure 155 – The new FRA sampler can be used to sample time and frequency domain information during FRA measurements, as well as the dc components The FRA related commands have been redesigned and the fundamental parameters of the FRA measurements can now be used in combination with other commands, using links. For example, it is possible to define the amplitude to be used in the frequency scan, through an Input box or a calculation (see Figure 156). 118 | P a g e Figure 156 – Linking an Input box to the amplitude used in the FRA measurement Single frequency measurements are now also possible as well as time scan FRA measurements. The Time signal is sampled for each impedance data point. This signal consists of the total elapsed time since the beginning of the experiment. This allows the user to track the progress of the measurement in long experiments or in time scan experiments. Impedance measurements requiring connections to and from external devices are now easier to configure. The FRA sampler has been designed to allow the user to specify all the parameters of the external transfer function from one single location (see Figure 157). 119 | P a g e Figure 157 – The FRA sampler used for measurements in combination with a Kikusui PLZ164WA electronic load The commands required for these measurements can be found in the Measurement – impedance group of commands and more information about impedance spectroscopy measurements can be found in the Impedance spectroscopy tutorial. Single frequency FRA measurements Using the FRA single frequency command, available from the Measurement – impedance group of commands, it is now possible to perform a single frequency measurement. It is not necessary to setup the complete FRA frequency scan command for this type of measurement (see Figure 158). Figure 158 – Single frequency measurements are now possible using the FRA single frequency command 120 | P a g e Manual control of the FRA through Autolab display A panel system has been added to the Autolab display window. It is now possible to add or remove additional panels to this window, by picking the corresponding item in the view menu (see Figure 159). Figure 159 – Adding the FRA manual control panel to the Autolab display When the FRA manual control option is selected, an additional panel will be available in the Autolab display window (see Figure 160). Using this panel, it is possible to perform manual measurements using the FRA2 module. The frequency and amplitude can be directly defined in the panel, as well as other relevant parameters. 121 | P a g e Figure 160 – The Autolab display with the FRA manual control Pressing the FRA ON button switches on the FRA2 module and starts the manual measurement. The measured values are displayed at the bottom of the panel. It is possible to modify the amplitude or the frequency during the measurement. Note: the measurements are repeated until the FRA ON button is clicked again to switch off the impedance analyzer. More information on the use of the FRA manual control panel can be found in the Impedance tutorial, available from the Help menu. 122 | P a g e Graphical user interface for Fit and Simulation A graphical circuit editor has been added to the Fit and Simulation data analysis tool for impedance spectroscopy data. Using this tool, it is possible to create an equivalent circuit graphically, using the individual circuit elements and connections between these elements (see Figure 195). Figure 161 – A graphical circuit editor has been added to the Fit and Simulation analysis tool Note: equivalent circuits can also be created using the traditional CDC syntax. Fit results can be exported easily using the included reporting tool (see Figure 162). 123 | P a g e Figure 162 – The Circuit Report tool can be used to view the results Moreover, an additional user-defined database, in which equivalent circuits can be stored for future use, has been created. This database can be defined through the database manager (see Figure 196). Figure 163 – The Circuits database has been added to the database manager Note: more information about the new Fit and Simulation tool can be found in the Impedance spectroscopy tutorial. 124 | P a g e Simplified commands and parameters For more clarity, some advanced parameters have been hidden from view in the default procedure setup. These advanced parameters are still available and can be modified if required, but the modification of these parameters is only required for advanced measurements. It is possible to switch from the default view to the advanced command view by using the toggle available in the View menu (see Figure 164). Figure 164 – The Repeat for each row command provides a table of one of more parameters Switching to the Advanced command view displays the advanced commands in the commands browser and the advanced parameters in the procedure setup frame. Figure 165 shows a side by side comparison of the FRA single frequency command in normal mode and in advance command view. 125 | P a g e Figure 165 – Comparison of the FRA single frequency command, shown in default simplified mode (left) and in the advanced command view (right) 126 | P a g e Support for MultiBA instruments Version 1.6 of NOVA includes support for MultiBA devices. The MultiBA instrument is a special version of the modular Autolab PGSTAT (except the PGSTAT100) in which more than one BA module is installed. This provides the means to perform measurements on up to six working electrodes, sharing a common reference and counter electrode, at the same time. Multiple BA modules, numbered #1 to #5, can now be selected in the Hardware setup (see Figure 166). Figure 166 – Selecting multiple BA modules for a MultiBA instrument The WE(x).Current and WE(x).Potential signals will be added to the Signal sampler. These signals can be sampled during electrochemical measurements (see Figure 167). 127 | P a g e Figure 167 – The WE(x).Current and WE(x).Potential signals are available in the signal sampler Note: only the signals of the selected modules are shown. In Figure 167, BA modules #2 and #3, corresponding to WE(3) and WE(4), respectively, are present in the instrument but not selected in the Hardware setup. More information on the use of the MultiBA instruments in NOVA can be found in the MultiBA tutorial, available from the Help menu. Multi Autolab support Version 1.6 of NOVA includes support for multiple instruments. It is now possible to connect multiple Autolab instruments to the same computer and perform measurements using any of the connected devices. The maximum number of devices is limited to 8. Selection of the active device is performed using a dedicated toolbar (see Figure 168). Available devices are identified by their serial numbers or by the serial number of the external USB interface, if applicable. Figure 168 – A dedicated toolbar is can be used to select an instrument Measurements can be performed on multiple instruments in the same way they are performed when a single instrument is connected to the computer. A single 128 | P a g e procedure can run on any of the available devices. However, only one instrument can be used during the measurements in this mode. It is also possible to control more than one device at the same time, in order to run the same or different procedures. This can be done by using the Multi Autolab view. The Multi Autolab can be selected using the View menu or by clicking the in the toolbar (see Figure 169). button Figure 169 – The Multi Autolab view can be accessed using the View menu or the dedicated button in the toolbar This view provides a dedicated interface through which two or more devices can be controlled (see Figure 170). Figure 170 – The Multi Autolab view provides an interface through which two or more devices can be controlled at the same time Note: more information on the control of multiple instruments can be found in the Multi Autolab tutorial, available from the Help menu. 129 | P a g e Software synchronization command for Multi Autolab measurements The Multi Autolab software synchronization command has been added to the Measurement – General group of commands. This command can be used create a synchronization point for two or more instruments in a procedure. When two or more instruments perform this procedure in Multi Autolab mode, the synchronization commands will force the instruments to hold until the number of instruments holding at the synchronization point matches the value defined by the user in the procedure, or until the command reaches the time limit, if applied (see Figure 171). Figure 171 – The Multi Autolab software synchronization command can be used to synchronize two or more Autolabs during a Multi Autolab measurement Note: the timing accuracy of the software synchronization command is 100 ms. More information can be found in the Multi Autolab tutorial, available from the Help menu. Instrument serial number and description in the database To simplify data management in the database, each experiment is now logged with the identifying serial number and the configuration name, if specified, in the database frame (see Figure 172). This additional information can be used to find data sets more easily. It is possible to use the database for sorting the experiments using any of the available columns and to filter the database contents using the provided tools in order to display only specific measurements. Figure 172 – The database frame includes an Instrument serial number column and an Instrument description column Please refer to the User Manual and the Multi Autolab tutorial for more information. 130 | P a g e Multi Autolab support in Diagnostics application The diagnostics tool has been modified in NOVA 1.6. This application now supports multiple Autolab instruments. When the application starts it detects all available instruments connected to the computer (see Figure 173). Figure 173 – The Diagnostics application automatically scans for all the connected instruments Note: the test can only be performed on a single instrument at a time. If more than one instrument is detected, a selection menu is displayed before the Diagnostics starts (see Figure 174). Figure 174 – A selection menu is displayed if more than one instrument is detected Note: instruments with serial number beginning with AUT9 or with µ2AUT7, connected through an external USB interface, are identified by the serial number of the interface, USB7XXXX. Instruments with an internal USB interface, or instruments with serial number beginning with AUT7 connected through an external USB interface, are identified by their own serial number. If the hardware setup of the connected instrument can be located on the computer, the diagnostics test can be performed immediately. Otherwise, the hardware setup for the connected instrument can be defined. Select the Hardware setup option from the Select menu (see Figure 175). 131 | P a g e Figure 175 – Adjusting the hardware setup for the connected instrument Procedure validation screen The procedure validation screen has been redesigned in order to present errors and/or warning in a clear way. If errors or warnings situations are detected during the validation step, a window showing these errors and/or warnings will be displayed (see Figure 176). Figure 176 – The redesigned procedure validation screen now groups errors and warnings messages 132 | P a g e If only warnings are detected, the procedure can be started by pressing the OK button, although it is recommended to verify the warning messages before starting the measurement. FFT Analysis and FFT Smoothing Two FFT related analysis tools (with matching commands in the Analysis – general group of commands have been added): • • FFT Smooth: Applies a smoothing on the measured data to filter out noise and spikes. The frequency domain data is first calculated through an FFT. One of four type of filtering strategies can be applied (low pass, high pass, band pass and band stop). The filtered data is reconverted to time domain after the filtering is applied. FFT Analysis: Calculates the frequency domain data from source time domain data through a FFT. Both tools can be selected from the right-click menu (see Figure 177) or can be added as commands in a Nova procedure. Figure 177 – Both the FFT Smooth and FFT Analysis tools have been added More information on the use of these tools can be found in the User Manual, Chapter 4. ECN Spectral noise analysis A dedicated spectral noise analysis command has been added to Nova. This analysis tool can be used to analyze electrochemical noise data obtained using the ECN module or measured through the Autolab PGSTAT. This analysis tool is also available as a command in the Analysis – general group of command. This analysis tool can only be used in combination with data sets that include the Time, WE(1).Current and, WE(1).Potential or ECN(1).Potential (see Figure 178). 133 | P a g e Figure 178 – The ECN Spectral noise analysis command has been added Typical electrochemical noise analysis options are available in this analysis tool. It can be used to construct power spectrum density plots of potential, current and impedance for graphical analysis of noise data. Additional statistical indicators like noise resistance, pitting index, kurtosis and skewness are automatically calculated (see Figure 179). Figure 179 – An example of ECN spectral noise analysis data Please refer to the ECN tutorial, available from the Help menu, for more information. Clear plot button modification The clear plot button, available in the Measurement view, has been modified in order to allow the user to clear all the plots at once (by clicking the clear plot button, ) or to clear one of the specific plot by extending the context menu (by clicking the arrow button, ,located next to the clear button). Any one of the four plots can be cleared through this context menu (see Figure 235). 134 | P a g e Figure 180 – It is possible to clear a specific plot in the measurement view by extending the Clear plot button Dynamic command parameters This version of NOVA clarifies the concept of Dynamic command parameters. Contrary to normal command parameters, belonging to individual commands, like the Scan rate parameter for a Cyclic voltammetry command or the interval time in a Chrono methods command, dynamic command parameters are parameters that are generated by data handling or data analysis commands, during a measurement. Dynamic command parameters therefore have no initial values and they are generated during experiments. For example, the slope calculated by a linear regression on measured data, can only be provided once the data is collected and the calculation performed. The same applies to the value of a Constant phase element impedance obtained by fitting experimental data. NOVA now allows the user to use these dynamic command parameters in the same way as any other parameter. The results of calculations or data handling steps can be linked to other parameters or can be plotted during a measurement. For example, the result of a linear regression can be used in a procedure, plotting the intercept versus the square root of the scan rate. To identify dynamic command parameters in the procedure editor, these parameters are now shown in blue. Other parameters are shown according the following color convention: • • • Red parameters: measurable electrochemical signals (through the signal sampler or a dedicated sampler) Black parameters: command parameters that can be edited Grey parameters: command parameters that cannot be edited and are calculated based on the user-defined command parameter values. Figure 181 shows an example of the four types of parameters in the procedure editor. 135 | P a g e Figure 181 – An example showing the four types of parameters in the procedure setup In this example, WE(1).Current is shown in red because it is a measured value, scan rate is shown in black since it is a command parameter, the interval time is shown in grey because it cannot be edited and it is calculated from the values of the scan rate and the step potential. The average current is a calculated value, generated by the Calculate signal command and it is therefore shown in blue. This parameter is a dynamic parameter since it is calculated during the experiment. Dynamic command parameters are very useful for advanced procedure building. Figure 182 shows an example of the dynamic command parameters used in a procedure. Impedance measurements are repeated a number of times and fitted using a R(RQ) equivalent circuit. The fitted values of the circuit elements are dynamic command parameters and can be used to create plot #3 and plot #4, showing the fitted values versus the repeat number. 136 | P a g e Figure 182 – Using Dynamic command parameters during a measurement: plot #1 and plot# 2 show raw impedance data, plot #3 and plot #4 show calculated values dynamically added by the Fit and simulation command Repeat for multiple values A new type of repeat loop, Repeat for multiple values, has been added to the Control group of commands. This command is similar to the Repeat for each value command. The difference with respect to the latter is that the Repeat for multiple values command can be used to define a Table of values, containing one or more columns (see Figure 183). Figure 183 – The Repeat for multiple values command provides a table of one of more parameters 137 | P a g e Note: the number of values in each column must be the same. During the measurement, the commands in this new type of repetition loop will be repeated for each row of the table. A possible example is shown in Figure 184. In this example, the three parameters defined in the table shown in Figure 183 are linked to the Scan rate, Upper vertex potential and the Potential value defined in the Set potential command, respectively. Figure 184 – A possible use of the Repeat for each row command The measurement will therefore be repeated, using the values defined in each row for the three parameters. Autolab display with collapsible panels The Autolab display has been redesigned in this version of NOVA. It is now possible to add or remove panels to the Autolab display, by choosing the required options in the View menu (see Figure 185). 138 | P a g e Figure 185 – Adding the MUX manual control panel to the Autolab display Another example is shown in Figure 159 and Figure 160 (see section 0). Each panel provides additional manual control over the instruments or the accessories connected to the instrument (see Figure 186). Figure 186 – The MUX manual control panel provides a direct interface to the MUX module 139 | P a g e At any time, the panels can be collapsed and expanded by clicking the the top left corner of each panel (see Figure 187). button in Figure 187 – Collapsing the MUX manual control panel Pressing the button expands the panel again. Current interrupt and positive feedback procedures Two current interrupt procedures (i-Interrupt and i-Interrupt high speed) are now provided in the Autolab group of procedures. These procedures can be used to determine the uncompensated resistance of the cell, using the current interruption method. The i-Interrupt high speed procedure uses the fast sampling ADC module (ADC10M or ADC750). These procedures can be used with all the instruments fitted with the iR compensation circuit 5. Figure 188 shows an example of current interrupt measurement recorded using the provided procedure on the Autolab dummy cell. 5 This option is not available with the PGSTAT10 and the µAutolab II/III. 140 | P a g e Figure 188 – Example of data obtained with the i-Interrupt high speed procedure The recorded potential transient is automatically fitted and the calculated value of the uncompensated resistance is displayed in the Autolab display window (Figure 189). The transient is fitted using an exponential regression and a linear regression, yielding values of Ru exponential and Ru linear, respectively. Note: the commands used in the i-Interrupt and the i-Interrupt high speed procedures are available in the Measurement – general group. 141 | P a g e Figure 189 – The results of the fitting of the transient are shown in the Autolab display Additionally, a Positive feedback procedure is supplied in the Autolab group of procedures. With this procedure, it is possible to fine tune the value of the uncompensated resistance estimated from the current interrupt procedures. Figure 190 shows an example of four positive feedback measurements performed on the Autolab dummy cell, using compensated resistance values of 0, 95, 98 and 102 Ohm, respectively. The correct value of the uncompensated resistance can be determined by trial and error by detecting the point at which the response of the cell becomes a ringing oscillation. 142 | P a g e Figure 190 – Four different positive feedback experiment (plot 1 – green line: 0 Ohm, plot 2 – blue line: 95 Ohm, plot 3 – orange line: 98 Ohm, plot 4 – red line: 102 Ohm) More information on the use of the i-Interrupt and Positive feedback procedures can be found in the iR Compensation tutorial, available from the Help menu. External .NET applications support External applications can be used from NOVA using dedicated commands. This option is for advanced applications only and requires the user to be familiar with software programming. A tutorial and some examples are provided in the installation folder 6. Avantes spectrometer support Basic support for Avantes spectrometers is available. Presently, support of these devices is possible through the External .NET commands. For more information, contact Metrohm Autolab B.V. ([email protected]). This information can be found in the Shared DataBases\Tutorials\External DOTNET DLL folder located in the installation folder. 6 143 | P a g e NOVA 1.5 Release notes (Released 01/06/2009) Introduction These notes provide an overview of the new features introduced in NOVA 1.5 compared to the previous release. The following items have been added to NOVA 1.5: - A new set of tutorials, available from the Help menu - Support for the modules • • • • • • • • pX ECN FI20 – Filter MUX IME663 & IME303 Booster10A for the PGSTAT128N ADC750 revision 4.0 PGSTAT101 - Improvements and additions • • • • • • • • • • • • • • • • • • • • • 144 | P a g e Voltammetric analysis techniques Manual control of the Hg drop electrode (IME663 or IME303) Manual control of the MUX New user interface for Autolab control command Manual control of the instrument through Autolab display Skip button Reverse button Multiple plots in measurement view and overlays Send email command Check online for updates New data handling commands Timed procedure inside a FRA frequency scan New FRA commands Post measurement check Save data option Hardware summary in the About menu Improved support for Metrohm devices Autolab control in options Wait on DIO trigger New Autolab procedures Test of Autolab modules Previous NOVA versions and NOVA 1.5 It is possible to install more than one version of the NOVA software on the same computer. Installing version 1.5 does not upgrade previously installed versions. However, it is not possible to use both software packages at the same time and data sets obtained with NOVA 1.5 cannot be used with previous versions of NOVA. The opposite situation is possible, using the conversion tools that are installed together with version 1.5. Tutorials New tutorials have been added to this version of NOVA. The tutorials are available from the Help menu (see Figure 191). Figure 191 – New tutorials are available from the Help menu Modules support NOVA 1.5 introduces the support for the pX, ECN, MUX, FI20 – Filter modules and the for the IME663 and IME303 interfaces to the Hg drop electrode stands. Support for the Booster10A in combination with the PGSTAT128N is also provided. 145 | P a g e Hardware support The hardware setup of NOVA 1.5 now includes support for the ADC750 rev. 4, ECN, pX, FI20 – filter and MUX modules. The PGSTAT101 is also supported. The external signals can now be conveniently edited using a dedicated menu (see Figure 234). A special conversion function is provided for eSPR signals. Figure 192 – The hardware setup window Voltammetric analysis techniques This new version of NOVA introduces the most commonly used voltammetric analysis (VA) techniques. These techniques can be used on solid electrodes or on a mercury drop electrode. The following techniques are now supported: • • • • • Sampled DC Normal pulse Differential pulse Differential normal pulse Square wave The commands required for these measurements can be found in the Measurement – voltammetric analysis group of commands (see Figure 193). The Timed procedure for voltammetric analysis provides a generic template for VA measurements. 146 | P a g e Figure 193 – The Voltammetric analysis commands Note: it is possible to use these commands in polarographic mode (refer to the user manual for more information). Alongside the VA measurement commands, additional commands to control the mercury drop electrode have been added to the Measurement – general group (see Figure 194): • • • Purge: this command defines the duration of the purge step (the stirrer is always switched on when the N2 purging is on). Set stirrer: this command controls the stirrer of the VA stand. Create new drop: this command creates n new drop by activating the drop knocker on the VA stand. Figure 194 – Three additional command related to the control of the mercury drop electrode have been added to the Measurement – general group 147 | P a g e Manual control for Mercury Drop Electrode (MDE) Manual control over the Mercury Drop Electrode (MDE) is provided in the View menu (see Figure 195). This can be used to manually control the Metrohm VA 663 Stand or the PAR 303/303A Stand through the IME663 and the IME303, respectively. Figure 195 – Manual control of the MDE is provided in the View menu Through the MDE control it is possible to manually switch purging and stirring on and off and create new drops (see Figure 196). Figure 196 – The Electrode Control can be used switch purge and stirrer on or off and to create a new drop Note: control of the MDE is also possible during a measurement using the Autolab control command. A specific MDE tab is available in the Autolab control window (see Figure 197). The Number of new drops controls the number of consecutive drops to knock off the mercury electrode. 148 | P a g e Figure 197 – Control of the MDE is possible through the Autolab control command Manual control for MUX Manual control over the MUX module is available from the View menu (see Figure 235). Figure 198 – Manual control of the MUX module is provided in the View menu Through the MUX control it is possible to manually set one of the available MUX channel to active (see Figure 235). Figure 199 – The MUX Manual Control can be used to select one of the available MUX channels Note: control of the MUX is also possible during a measurement using the Autolab control command (see Figure 200). 149 | P a g e Figure 200 – Control of the MUX is also available in the Autolab control window New Autolab control command The Autolab control command has been redesigned and now displays the available properties under tabs. The number of available tabs depends on the hardware setup (see Figure 201). Figure 201 – The new Autolab control command Note: more information about the Autolab control command can be found in the Autolab control tutorial. 150 | P a g e Autolab display The Autolab display, available from the View menu or through the modified. Two features have been added to the Autolab display: key has been Real-time display of Voltage and Current The Autolab display can now be used to view the voltage and current values measured by the Autolab when no measurement is running (see Figure 202). Figure 202 – The Autolab display can be used to view the voltage and current even if no measurement is running Manual control of the instrument The Autolab display can also be used to manually control the potential or the current of the Autolab. Depending on the instrument settings (PSTAT or GSTAT), it is possible to click the voltage or current label in the Autolab display to edit the value of the applied voltage or current applied on the electrochemical cell, respectively (see Figure 203). 151 | P a g e Figure 203 – Clicking the voltage label (left) or current label (right) in the Autolab display allows editing of the applied voltage or current Skip button The Skip button has been added to the toolbar. This button is active during a measurement and can be used to interrupt the currently executed command in the procedure and immediately move on to the next command. Note: the Skip button does not change the settings of the Autolab. The instrument will remain in the settings encountered immediately before the skip button is pressed. Reverse button Nova now provides an additional button in the Autolab display that can be used to reverse the scan direction of linear sweep and cyclic staircase voltammetry commands (see Figure 204). This button is available both in potentiostatic and in galvanostatic mode. Note: the Reverse button is not available for cyclic voltammetry measurements performed using the linear scan generator module (SCANGEN or SCAN250) and for the Voltammetric analysis commands. 152 | P a g e Figure 204 – The reverse button is now available in the Autolab display Multiple plots in measurement view This version of NOVA introduces the possibility of displaying up to 4 plots at the same time in the measurement view. Each plot can be configured independently and can be used to display measured data points or results from data handling commands or calculations. During the experiments, it is possible to change the arrangement of the plots using dedicated toolbar buttons (see Figure 205). Figure 205 – The dedicated toolbar buttons for multiple plots An example of the use of the multiple plot option is displayed in Figure 206. 153 | P a g e Figure 206 – Using the multiple plot feature in an impedance measurement: plot 1 (top left) - Nyquist plot, plot 2 (top right) - Bode plot, plot 3 (bottom left) - Lissajous plot, plot 4 (bottom right) - Resolution vs time Note: results of calculations and data handling commands are displayed after the data has been collected. Additionally, it is possible to copy plots from the analysis view into any of the 4 available plots in the measurement view. This provides the possibility to create overlays between data points being recorded real-time and data points from previous experiments (see Figure 207). Figure 207 – Copying visible plots from the analysis view to the measurement view can be done by right-clicking a plot in the analysis view and choosing the location of the plot in the measurement view Note: this option creates an exact copy of the selected plot(s), including any additions to the plot(s). 154 | P a g e Send email It is now possible to send an email, using a dedicated command, during an experiment (see Figure 208). This feature can be used to inform the user about the progress of a measurement when the experiments is very long. Figure 208 – It is now possible to send emails during an experiment Check for update An online check option is available from the Help menu (see Figure 209 and Figure 210). This option can be used to verify if a new version of NOVA is available. This option requires an internet connection. Figure 209 – Online check for updates Figure 210 – The current version is up to date If a new version is available, visit the www.metrohm-autolab.com website to download the update. 155 | P a g e New data handling commands Three new data handling commands have been added to the Data handling group of commands: • • • • Get array size Get array item Get first array item Get last array item The get array size command can be used to determine the length of an array. When linked to an array of value, this command will return an integer which corresponds to the number of items in the array. Figure 211 shows a possible use for the Get array size command. Figure 211 – The Get array size command used in combination with the CV staircase command The total number of points parameter displayed in the CV staircase command is an estimation of the real number of data points. Depending on the scan rate and potential step, the real number of data points measured during by the CV staircase command could deviate slightly. The Get array size command can be used to determine the real number of data points. 156 | P a g e The Get array item command can be used to extract the nth value from an array while the Get last array item automatically looks for the last value in an array. Both commands can be used to extract specific values from a list of measured or calculated signals and use these values as parameters in the procedure. Timed procedure in FRA frequency scan It is now possible to add a Timed procedure to a FRA frequency scan. Commands located inside the timed procedure are executed for each frequency in the scan (see Figure 212). Figure 212 – Timed procedures can be added to the FRA frequency scan This feature can be used to record external signals during a frequency scan or to test measured signals against a cutoff condition, as shown in Figure 212. Note: the DSG of the FRA2 module is not switched off when the timed procedure is encountered. If required, it is possible to switch off the DSG input on the PGSTAT by using the Autolab control command in the timed procedure 7. 7 Refer to the Impedance tutorial for more information and a practical example 157 | P a g e New FRA commands Two FRA commands have been added to the Measurement – impedance group of commands. • • FRA single frequency FRA single frequency (external) These two commands are used in combination with the FRA frequency scan commands (potentiostatic, galvanostatic or external). When more than one FRA single frequency is added to a FRA frequency scan command, each frequency in the scan will be measured n times, where n is the number of FRA single frequency commands in the scan (see Figure 213). Figure 213 – Example of two FRA single frequency commands in a FRA measurement potentiostatic 158 | P a g e Post measurement checks The User log will now display messages after the measurement finishes advising to change the experimental condition, if applicable. The example shown in Figure 214 suggests changing the current range used in the measurement, as an overload was detected during the previous experiment. Figure 214 – Post measurement check Note: it is possible to copy/paste the contents of the User log using the right-click menu. Save data at the end of the measurement By default, NOVA saves all the measured data points at the end of the experiment. It is now however possible to switch this feature off. This can be trough the options menu (see Figure 215). Figure 215 – The Automatic save feature can be switched on or off in the options menu When this option is switched off, the user will be prompted at the end of each experiment to provide a name and a comment for the measurement. If the data is invalid or if saving the data is not required, an additional option to discard the measurement is provided (Figure 216). 159 | P a g e Figure 216 – When Automatic save is disabled, the user is prompted to specify name and remarks for the experiment. The user can also discard the data if it is invalid. Note: pressing the Discard button will delete the measured data points immediately. These data points cannot be recovered. Version and hardware overview in the About menu The Help – about menu now displays extensive version and hardware configuration information (see Figure 217). Figure 217 – The hardware configuration is now shown in the About menu, alongside software version information 160 | P a g e Improved support for Metrohm devices Support for Metrohm devices has been improved in this version of NOVA. The Initialization commands now have a dedicated interface in which the parameters of the device can be easily entered. Figure 218 shows the case of the Dosino settings interface. Figure 218 – Dosino settings interface Autolab control in the options The Options menu has been extended with an additional tab, which can be used to set specific Autolab settings at the end of each sampling step (see Figure 219). This can be used, for example, to create a new drop after each sampling step in sampled DC polarography. 161 | P a g e Figure 219 – The Autolab control command is now available in the options Wait for DIO trigger A wait for DIO trigger command has been added to the Measurement – General group of commands. With this command, it is possible to force the procedure to hold until a predefined DIO trigger is detected on one of the DIO connectors of the Autolab (see Figure 220). Figure 220 – The Wait for DIO trigger command is now available for receiving triggers For the trigger byte, it is possible to define the sequence using 1 (pin up), 0 (pin down) or x (wildcard). Additionally, it is possible to define a maximum time limit for the command. If the predefined sequence is not detected within the time limit, the measurement will continue 8. While the software is waiting for the DIO trigger, the current connector status is displayed in the lower right corner of the Autolab display (see Figure 221). 8 More information on DIO triggers can be find in the External devices tutorial 162 | P a g e Figure 221 – The DIO status is displayed in the lower right corner when waiting for a trigger Note: the DIO connector status is verified with an interval time of 100 ms. Changes to the Autolab procedures The following default procedures have been added to the Autolab group in the setup view: • • • • • • • Linear sweep voltammetry potentiostatic Linear sweep voltammetry galvanostatic Differential pulse voltammetry Square wave voltammetry Sampled DC polarography Chrono amperometry high speed Chrono potentiometry high speed The following Autolab procedures have been renamed for clarity purpose: • • Cyclic voltammetry linear scan, previously called Linear scan Cyclic voltammetry linear scan high speed, previously called High speed linear scan • • Chrono amperometry (∆t > 1 ms), previously called Chrono amperometry Chrono potentiometry (∆t > 1 ms), previously called Chrono potentiometry 163 | P a g e The following Autolab procedures have been removed from the list: • • • Cyclic voltammetry with EQCM Cyclic voltammetry with BA Cyclic voltammetry with ECD Specific instructions on how to use these three modules are provided in the tutorials. Autolab test procedures Special procedures are now included in a special Module test database installed with NOVA. These procedures can be used to test specific hardware module and the Autolab potentiostat, using the Autolab dummy cell (see Figure 222). Figure 222 – Module test procedures are now included in the software More information can be found in the Module test with Nova document, available from the Help menu. 164 | P a g e PGSTAT101 support Figure 223 – The new Autolab PGSTAT101 Instrument specifications The PGSTAT101, shown in Figure 223, is a potentiostat/galvanostat with USB interface. The specifications of the device are listed below: • • • • • • • • 9 Compliance voltage: 10 V Maximum applied potential: 10 V Maximum current: 100 mA Electrode connections: CE, RE, S, WE and additional analog ground Analog I/O 9: Eout, iout, Vin, Vout Digital I/O: 8 outputs and 4 inputs Internal dummy cell: 100 Ohm + 1 MOhm // 1 µF iR compensation Requires optional I/O cable. 165 | P a g e Hardware setup PGSTAT101 The new Autolab PGSTAT101 is now supported in the latest version of NOVA. The instrument can be selected in the hardware setup window (see Figure 224). Figure 224 – The PGSTAT101 is available in the hardware setup Note: the PGSTAT101 is not modular and no additional modules, except the IME663 and the IME303, can be selected when this instrument is used. The PGSTAT101 can be fitted with the optional I/O cable. This cable provides four additional connections to the PGSTAT101 analog circuits (see Figure 225). All the signals are with respect to Autolab ground and indirectly to protective earth. 166 | P a g e Figure 225 – The optional I/O cable for the PGSTAT101 With the optional I/O cable, the following signals are available: EOUT – This output corresponds to the differential potential of RE versus S 10. The output voltage will vary between ±10 V. iOUT – This signal corresponds to the inverted output of the current-to-voltage converter circuit of the PGSTAT101 11. A 1 V signal corresponds to {-1 x the selected current range}. VOUT – This output corresponds to the DAC output. It is controlled by software and is meant to be used to control external devices, like the rotating speed of a Rotating Disc Electrode (RDE). The output level varies between ±10 V. VIN – This input corresponds to the ADC input. This input can be used for measuring a second signal. The input range is ±10 V. More information about the PGSTAT101 hardware can be found in the PDF version of the Getting started, available from the Help – Tutorials menu. 10 11 The Eout value corresponds to -WE(1).Potential. The iout value corresponds to -WE(1).Current/Current range. 167 | P a g e Diagnostics The diagnostics application has been adjusted and the PGSTAT101 has been added to the list of devices available in the test (see Figure 226). Figure 226 – The PGSTAT101 has been added to the list of devices in the diagnostics application Note: the PGSTAT101 is equipped with an internal dummy cell. When the diagnostics tests are performed on this instrument, the reference (RE) and counter (CE) electrode leads must be connected together on one hand and the working (WE) and sense (S) electrode leads must be connected together on the other hand. Make sure that RE/CE and S/WE are not in contact. A reminder is shown at the beginning of the diagnostics (see Figure 227). Figure 227 – When the diagnostics are performed with the PGSTAT101, connect RE to CE and S to WE as shown in the visual reminder 168 | P a g e PGSTAT101 test A specific procedure to test the PGSTAT101 has been added to the Module test database (default location: C:\Program Files\Eco Chemie\Nova 1.5\Shared Databases\Module test). This test procedure can be used to verify the basic functionality of the instrument. The test is performed on the internal dummy cell. Refer to the Module test documentation for more information (available from the Help – Tutorials menu). Maximum current The highest current range available in the PGSTAT101 is 10 mA. This current range has a linearity of 10 times, which means that a maximum of 100 mA can be applied to the cell in galvanostatic mode and that a maximum of 100 mA can be measured in this current range, in potentiostatic mode. To apply 100 mA in GSTAT mode, the offset value must first be set to 50 mA, using the Autolab control command (see Figure 228). Figure 228 – The offset value must be set to 50 mA in order to apply 100 mA in the 10 mA current range 169 | P a g e Autolab control The Autolab control command has been adjusted for the PGSTAT101 (see Figure 229). Figure 229 – The Autolab control window has been adjusted for the PGSTAT101 TTL triggering The PGSTAT101 is fitted with a single, non configurable DIO connector. The DIO connector has a total of eight write lines and four read lines (see Figure 230). 170 | P a g e Figure 230 – Mapping of the PGSTAT101 DIO connector Note: Port A includes 8 write lines and two digital ground pins (pin 4 and pin 11). Port B includes 4 read lines and an isolated ground pin (pin 3). All pins on Port B are galvanically isolated. Do not use pin 4 or pin 11 as ground pin for the read lines. Important: the write lines of the PGSTAT101 DIO connector are capable of supplying a maximum current of 200 mA. Suitable pull-down resistors should be placed in the write lines of the DIO cable connected to the PGSTAT101. A typical value for the pull-down resistance is about 1 kΩ. Please refer to the user manual of the external device connected to the PGSTAT101 for more information. The Autolab control command only shows a single option in the DIO tab, where the 8 write pins of the single DIO connector can be defined (see Figure 231). 171 | P a g e Figure 231 – The 8 pins of the write section of the single DIO port of the PSGTAT101 can be set directly from the Autolab control command The Wait for DIO trigger command, available in the Measurement – General group of command has also been adjusted. Pressing the button in the procedure editor opens a dialog window which can be used to identify the available connectors and ports for the instrument in use. For the PGSTAT101, a single input port is available on the DIO connector (see Figure 232). Figure 232 – The new Wait for DIO trigger interface Note: the trigger byte consists of 4 bits for the PGSTAT101. 172 | P a g e NOVA 1.4 Release notes (Released 14/09/2008) Introduction These notes provide an overview of the new features introduced in NOVA 1.4 compared to the previous release. The following items have been added to NOVA 1.4: - A new set of tutorials, available from the Help menu - Support for the modules • • • pX1000 EQCM ECD - Support for the instruments • • PGSTAT20 PGSTAT128N - Improvements and additions • • • • • • • • • • • • • • • • • • • • • • • Tutorials Simplified user interface New Autolab procedures Grouped commands Procedure templates New plotting framework Installed on same computer as previous releases DAC control in Autolab control Cutoffs Simplified FRA frequency range editor FRA Galvanostatic support pH calibration Data repository Reverse compatibility with previous NOVA versions New data analysis framework and data analysis tools New data handling and new data analysis commands My commands Improved Import GPES command Import and Export ASCII G circuit element in Fit and Simulation Kronig-Kramers calculation Metrohm liquid handling support External devices control 173 | P a g e Tutorials A series of short tutorials is available from the Help menu in Nova (see Figure 233). Each tutorial is dedicated to a specific measurement technique or aspect of the software. Some tutorials include procedures that can be used to perform simple measurements on the Autolab dummy cell. Figure 233 – A series of short tutorials is available from the Help menu Modules support NOVA 1.4 introduces the support for the ECD, pX1000 and EQCM modules. Hardware support The hardware setup of NOVA 1.4 now includes the PGSTAT128N and PGSTAT20 12 (see Figure 234). 12 With serial number > 960350. 174 | P a g e Figure 234 – The hardware setup window Simplified user interface NOVA 1.4 introduces a lighter user interface. A number of commands have been condensed into one-line commands. Figure 235 shows the factory default Cyclic voltammetry procedure. The Autolab control, Set Cell, Wait time and Optimize current range command have been reduced to a single line in the procedure editor (see Figure 235). 175 | P a g e Figure 235 – The factory default Cyclic voltammetry potentiostatic procedure New Autolab procedures The following new factory default procedures have been added to the Autolab group (see Figure 236): • • • • • Cyclic voltammetry with EQCM Cyclic voltammetry with BA Cyclic voltammetry with ECD Chrono potentiometry FRA impedance galvanostatic Note: some of the Autolab factory default procedures have been renamed. 176 | P a g e Figure 236 – The Autolab factory default procedures Grouped commands All the commands are now grouped in dedicated sections in the commands browser. Additional sections have been added, like the analysis sections, in which specific analysis commands can be found and the plot sections, in which ready made plot commands are located (see Figure 237). 177 | P a g e Figure 237 – The new commands browser, showing the details of the Cyclic and linear sweep voltammetry measurement section, the Corrosion analysis section and the Impedance plots section Procedure templates A series of special commands, called template commands, have been added to the command browser, in the Measurement – cyclic and linear sweep voltammetry and in the Measurement – chrono methods group (see Figure 238): • • Timed procedure potentiostatic Timed procedure galvanostatic These commands are complete templates that can be used to construct procedures quickly. 178 | P a g e Figure 238 – Special commands are located in the Measurement – cyclic and linear sweep voltammetry and Measurement – chrono methods groups When one of these commands is added to the procedure editor, a complete set of commands will be created. These commands constitute a complete template for a potentiostatic or galvanostatic measurement (see Figure 239). Figure 239 – The template commands can be used to create an almost complete procedure Once a template command has been added to the procedure editor, the missing measurement command can be inserted in the template (see Figure 240). Additionally, the options and the sampler can be defined before the measurement is started. Start and stop potentials can be linked to the Set potential command, if required. 179 | P a g e Figure 240 – Adding a measurement command to a template New plotting framework A new plotting framework has been implemented in this version of NOVA. It is now possible to add pre-defined plots to a procedure, by dragging and dropping the plot command onto a measurement command. If this measurement command provides the required pre-defined signals, these signals are automatically linked to the added plot. The predefined plots are available in two different sections in the command browser. The Plots – general section contains pre-defined plots used in typical DC measurements. The Plots – impedance section contains pre-defined plots related to electrochemical impedance spectroscopy measurements (see Figure 241). 180 | P a g e Figure 241 – The pre-defined default plots The pre-defined plots are also available in the analysis view. Depending on the type of measurement, a number of predefined plots are available using the right-click menu in the analysis view. Figure 242 illustrates this feature on an impedance data set. Since the data has been recorded using the FRA frequency scan command, NOVA offers a number of impedance related plots. Figure 242 – Adding a pre-defined plot to a data set The Custom plot is an empty plot, with undefined X, Y and Z signals. It is possible to add it using the list provided by the Add Plot menu or by clicking the Add Plot option in the right-click menu. The name of the plot can be changed using the right click-menu – properties option. 181 | P a g e Note: Signal set, which was used in the previous versions of NOVA as name for a plot, has been renamed to Plot. Previous NOVA versions and NOVA 1.4 It is possible to install both packages of the NOVA software on the same computer. Installing version 1.4 does not upgrade previously installed versions. However, it is not possible to use both software packages at the same time and data sets obtained with NOVA 1.4 cannot be used with previous versions of NOVA. The opposite situation is possible, using the conversion tools that are installed together with version 1.4. DAC control in Autolab control For external devices controlled through a DAC voltage (set using the Control external device command), a set DAC control field has been added to the Autolab control interface (see Figure 243). This allows for direct control of the DAC in a chrono methods (required for fast transient acquisition involving an external device) and for DAC control in the End Status Autolab (which is useful for safety reasons). Note: only DAC channel #3 can be used using this control. 182 | P a g e Figure 243 – DAC control in the Autolab control window Cutoffs The options available in NOVA have been augmented with a Cutoff interface. It is now possible to define any cutoff condition in a procedure. The cutoff conditions can be defined for the whole procedure or a specific measurement command. It is possible to group cutoff conditions using OR and AND operators. Moreover, users can define the number of cutoff conditions detections required to trigger the cutoff actions. Finally, when a cutoff condition is met, the user has the choice to stop the command, stop the timed procedure or stop the whole procedure (see Figure 244). 183 | P a g e Figure 244 – The Cutoff interface More information about the cutoffs can be found in the Cutoff tutorial. Simplified FRA frequency range editor The determine FRA range window has been simplified. The amplitude range builder has been removed. The possibility of defining more than one amplitude is still available, using the Add button. Moreover, it is now possible to define the amplitude of the FRA frequency scan in absolute value (top) or root mean square value (rms). The tooltip displays both values (see Figure 245). 184 | P a g e Figure 245 – The simplified determine FRA range window FRA Galvanostatic support A dedicated FRA measurement galvanostatic command has been added to the command list. This command can be used to define a frequency scan in galvanostatic conditions. The amplitude can be defined in A directly (see Figure 246). 185 | P a g e Figure 246 – The GSTAT FRA range builder window NOTE: Automatic current ranging is not possible in GSTAT mode. Reverse compatibility with previous NOVA versions This version of NOVA introduces a large number of changes that affect the way the software reads and writes data files. In order to ensure backwards compatibility with the previous versions, conversion tools are provided. The conversion tool can be used to convert data recorded with previous versions. The conversion process is summarized Figure 247. Data from NOVA 1.2 is stored in a single .yap file, which is first converted to files in the NOVA 1.3 format 13. Data from NOVA 1.3 is available as single .nox files can be converted into NOVA 1.4 .nox files. 13 More information can be found in the NOVA 1.3 release notes. 186 | P a g e Figure 247 – Schematic view of the conversion process to NOVA 1.4 from previous versions After installing NOVA 1.4, start the Upgrade files to NOVA 1.4 application (Start menu – All Programs – Autolab – Tools). The Upgrade to NOVA application will be started (see Figure 248). To use the upgrade function, files from older NOVA version must be added to the application, as individual .nox files. Figure 248 – The Upgrade to NOVA 1.4 application To add files to the list, press the ‘Add files to list’ button. Navigate to the folder containing the files to upgrade from previous NOVA versions to 1.4 (see Figure 249). 187 | P a g e Figure 249 – Adding the files to the list Note: the original files will not be removed, which means that you can still access the data from previous NOVA versions. Click the Start button to initiate the conversion to the NOVA 1.4 file format. It is possible to create a backup of the source files and to overwrite the backup files if they are already found in the source folder. It is also possible to create a log file, which can be useful if the conversion fails. During the upgrade step, the progress is displayed in real time (see Figure 250). Figure 250 – The upgrade application converts every .nox file in the list from to the NOVA 1.4 format When all the .nox files have been processed, they will be compatible with the NOVA 1.4 format (see Figure 251). 188 | P a g e Figure 251 – When the upgrade application has finished, the converted .nox files will be ready for NOVA 1.4 Note: if the location of the NOVA source database is the My Documents\My Procedures 1.x folder, the converted files will be automatically copied to the My Documents\My Procedures 1.4 folder. If the source database is located in another folder, the same folder will be used as location for the NOVA 1.4 .nox files. New data analysis framework and data analysis tools The data analysis framework has been redesigned. It is now possible to add data analysis tools directly to the data in the Analysis view, by using a context menu. By right-clicking on a plot in NOVA in the data explorer frame it is possible to add analysis tools directly to the plot (see Figure 252). Figure 252 – Adding a peak search to a CV staircase plot ½ Analysis tools added to a plot are displayed directly in the data explorer frame and the control parameters of the selected tool are accessed using a dedicated interface in the Analysis frame (see Figure 253). 189 | P a g e Figure 253 – Adding a peak search analysis tool to a CV staircase 2/2 The results of the data analysis tools are available in the data grid. This allows for easy export of the results to an ASCII or .xls file (see Figure 254). Figure 254 – Data analysis results are available in the data grid Furthermore, the results of the data analysis tools can be used to generate new plots (see Figure 255). It is also possible to use the Calculate signals and Filter and select tools directly, without switching to the Data grid. 190 | P a g e Figure 255 – Stacked plots and data analysis tools: the red line is the original plot, the black line the applied baseline correction and the blue line is the corrected plot New data handling and analysis commands NOVA 1.4 introduces a number of new data analysis commands, which can be used to perform automatic data handling and data analysis. The following commands have been added: • • • • • In the o o o In the o o o o o In the o o o o In the o o In the Data handling group Import ASCII Export ASCII Scan extractor Analysis – general group Regression Integrate Calculate charge Energy vs Power Hydrodynamic i vs √ω Analysis – baseline correction group Polynomial fixed order Polynomial maximum order Exponential Circle Analysis – corrosion group Corrosion rate, fit Corrosion rate, Tafel slope Analysis – impedance group 191 | P a g e o Kronig-Kramers test o Include all FRA data Furthermore, the following commands have been renamed: • • • Automatic peak search Peak search Mathematical parser Calculate signal Signal windower Windower My commands It is now possible to define your own commands using the My commands framework. In Nova 1.4, a new database that be used to store your own commands has been added. This database can be defined using the database manager (see Figure 256). Figure 256 – The database manager can be used to define a Commands database Commands defined using the My commands framework will be stored in the defined database and will be available for procedure building in the commands browser (see Figure 257). 192 | P a g e Figure 257 – The My commands group is located in the commands browser To add a command to the My commands database, right-click the command in the procedure editor and select the ‘Save in My commands’ option (see Figure 258). Figure 258 – Click the Save in My Commands option to add it to the My commands database You will be prompted to specify a name for the command (see Figure 259). Figure 259 – Specify a name for the command In the example shown here, the whole Timed procedure will be saved in the My commands database, as My potentiostatic Preconditioning (see Figure 260). Note: a tooltip displays the details of the command. 193 | P a g e Figure 260 – The command is added to the My commands database Once a command has been added to the My command database, it can dragged into the procedure editor as any other command. In the example shown in Figure 261, the My Potentiostatic Preconditioning command has been added to a new procedure. 194 | P a g e Figure 261 – Adding a My command into the procedure editor creates a copy of the original command Note: saving a complete Timed procedure instead of a single command allows you to very quickly group commands. This simplifies the procedure building process, especially for routine measurements. Improved Import GPES command The import GPES command has been improved. It is now possible to define the number of columns in the GPES data file (see Figure 262). This allows you to import GPES data files with a recorded second signal (bipotentiostat, SPR, etc…). Figure 262 – The Import GPES data command Moreover, it is possible to assign names and units to the columns located in the GPES file, using a dedicated interface (accessible by clicking the located on the Number of columns parameter line). Using the Signal editor window, it is possible to change the name of the columns manually or using a drop-down list (see Figure 263). 195 | P a g e Figure 263 – Changing the name of the columns can be done using the Signal Editor window Note: using the names from the drop-down list allows identifying the signals and ensures compatibility with all the data analysis tools. Import and Export ASCII Import and Export ASCII data commands have been added to the data handling command group. These two commands can be used to import data from an ASCII file or export measured electrochemical signals to an ASCII file. The Import ASCII data has a number of parameters like the number of lines to ignore at the beginning of the file, the number of columns in the file, the column delimiter (see Figure 264). Figure 264 – The import ASCII data command Moreover, it is possible to specify the name of the signals using the same interface as the new Import GPES command. 196 | P a g e Figure 265 – Changing the name of the columns can be done using the Signal Editor window The Export ASCII data command can be used to export measured or calculated electrochemical signals during a measurement. The number of columns and the delimiter can be specified, as well as the filename (see Figure 266). Figure 266 – The export ASCII data command The Columns can be linked to the electrochemical signals to export (see Figure 267). 197 | P a g e Figure 267 – Using the Export ASCII data in combination with a CV staircase command Note: exporting data to an ASCII file during a measurement introduces a delay in the timing. The duration of the pause depends on the amount of data points. G circuit element The Gerischer diffusion circuit element, which is used to model the effect of a preceding chemical reaction happening in the bulk solution (so-called CE mechanism) or the behavior of a porous electrode, has been added to the list of available circuit elements in the Fit and Simulation tool (see Figure 268). • G, Gerischer impedance 198 | P a g e ZG = 1 Y0 ( k a + jω ) Figure 268 – The G element is now available in the Fit and Simulation Kronig-Kramers calculation The Kronig-Kramers (KK) test tool has been added to the current version of NOVA. The KK test is often used to relate the real and imaginary parts of a complex transfer function (like electrochemical impedance, Z). This test can be used to check whether the measured data comply with the assumptions of KK transformation. These assumptions are: 1. The response is only related to the excitation signal. 2. The response is linear (or the perturbation is small, e.g. <10 mV, for nonlinear systems). 3. The system does not change with time. 4. The system is finite for all values of ω, including zero and infinity. If the investigated system changes with time due to e.g. ageing, temperature change, non-equilibrium initial state etc., the test fails. Failure of KK test usually means that no good fit can be obtained using the equivalent circuit method. This analysis tool is based on the work of Dr. B.A. Boukamp as published in J. Electrochem. Soc., Vol 142, 6 (1995). The KK test can be used by using the right-click menu and by choosing KronigKramers test from the Add Analysis menu (see Figure 269). 199 | P a g e Figure 269 – Adding the Kronig-Kramers test to impedance data Note: in the current version of NOVA, only the impedance Kronig-Kramers test, which uses a serial (RC) element sequence, is supported. More information about the Kronig-Kramers test can be found in the Impedance measurements tutorial. Metrohm devices support This version of NOVA introduces the support for the Metrohm 800 Dosino, Metrohm 801 Stirrer and Metrohm 814/815/858 Sample changer through the Metrohm Serial Bus (MSB) interface. A Control Metrohm devices command group is available in the commands browser (see Figure 270). Figure 270 – The Dosino related commands are located in the Control Metrohm devices group More information about the Dosino control can be found in the External devices tutorial. 200 | P a g e External devices support This version of NOVA also supports the RS232 communication protocol, which can be used to control external devices, like water baths, stirrers, valves, etc… The External devices commands are located in the External devices group (see Figure 271). Figure 271 – The External devices commands can be used to setup a RS232 communication protocol More information about the External devices control can be found in the External devices tutorial. 201 | P a g e NOVA 1.3 Release notes (Released 01/04/2008) Introduction These notes provide an overview of the new features introduced in NOVA 1.3 compared to the previous release. The following items have been added to NOVA 1.3: - A number of tutorials, available from the Help menu - Support for the modules • • Booster 10 A Booster 20 A - Support for the instruments • • • PGSTAT 100 PGSTAT 30/302(N) PGSTAT 12 - Improvements and additions • • • • • • • • • • • • • • • • • • 202 | P a g e NOVA 1.2 and NOVA 1.3 on the same computer Improved Chrono methods SCANGEN/SCAN250 together with the ADC164 New linking behavior Printing links (procedure setup) Reverse compatibility with version 1.2 Diagnostics Signal set(s) for each measurement command More than one signal set in the measurement view Clear plot measurement Manual scaling during measurement Mathematical parser as a command Improved Autolab Control interface OCP integration Reference voltage command Import FRA data command Find circle for impedance data Fit and simulation for impedance data Tutorials A series of short tutorials is available from the Help menu in Nova. Each tutorial is dedicated to a specific measurement technique or aspect of the software. Some tutorials include procedures that can be used to perform simple measurements on the Autolab dummy cell. Figure 272 – A series of short tutorials is available from the Help menu Modules support NOVA 1.3 introduces the support for the current boosters (Booster 10A and Booster 20A). The boosters can be used by setting the instrument in the highest current range (10 A or 20 A). Note: the boosters can only be used on DIO connector P1. Hardware support The hardware setup of NOVA 1.3 now includes the PGSTATs 12, 30, 302N and 100. The hardware setup now separates the choice of the main Autolab module and the additional modules (see Figure 234). 203 | P a g e Figure 273 – The hardware setup window NOVA 1.2 and NOVA 1.3 It is possible to install both packages of the NOVA software on the same computer. Installing version 1.3 does not upgrade version 1.2. However, it is not possible to use both software packages at the same time and data sets obtained with NOVA 1.3 cannot be used with version 1.2. The opposite situation is possible, using the conversion tools that are installed together with version 1.3 (see page 9). Improved Chrono Methods The Chrono methods command introduced in NOVA 1.2 had a USB timeout limitation which meant that measurements longer than 25 seconds could not be performed. This limitation was not practical for long measurements and it has been resolved in NOVA 1.3. Using the Chrono methods command, it is now possible to measure the response of the electrochemical cell as long as required. Figure 274 shows the potential profile for a Chrono methods measurement, with a total duration of 60 seconds (40 repetitions of a sequence of three potential steps – total number of points: 60.000). 204 | P a g e Figure 274 – The potential profile obtained with a 60 s chrono methods command Note: to ensure that the timing of all the events during the chrono methods command is as accurate as possible, the Autolab cannot display the measured data points in real time. While the chrono methods command is running, the Autolab display will indicate a busy timer in the lower left angle (see Figure 275). When the chrono methods measurement finishes, the rest of the procedure will be executed. Figure 275 – The Autolab display window with the Busy timer in the lower left corner SCAN250 & SCANGEN in combination with the ADC164 NOVA 1.3 now supports the combination of the SCAN250/SCANGEN with the ADC164. The SCAN250 was previously only available in combination with the ADC750 or the ADC10M. A dedicated command, CV linear scan, is available from the measurement group. This command performs a linear scan cyclic voltammogram with the SCAN250 or the SCANGEN module while the electrochemical signals are sampled using the ADC164. 205 | P a g e The CV linear scan high speed command can be used to perform a cyclic voltammogram with the SCAN250 or the SCANGEN module while the current and the potential are sampled using a high speed ADC, either the ADC750 or the ADC10M. New linking behavior Links are an important component of the procedure building process. Links are used in Nova to establish a dynamic relationship between two or more parameters or signals. To provide a clear overview of the linked parameters or signals, Nova 1.3 now highlights a link whenever one of the linked items is selected (see Figure 276). Unselected links are displayed in light grey color. Figure 276 – Links are highlighted whenever a linked parameter or signal is selected Note: linking and unlinking is now available through the right mouse button. 206 | P a g e Printable links The print procedure option, available from the File menu can now be used to print the visible links along with the rest of the procedure (see Figure 277). All the links will be printed on the right hand side. A print preview is available from the File menu. Figure 277 – Print preview of the cyclic voltammetry procedure with the links on the right hand side Note: only the visible links will be printed. Maintaining reverse compatibility This version of NOVA introduces a large number of changes that affect the way the software reads and writes data files. In order to ensure backwards compatibility with the previous release version, conversion tools are provided. Previously recorded data sets, obtained with NOVA 1.2, need to be converted using these tools before the data and the procedures can be used by NOVA 1.3. This section describes how to use the conversion tools. 207 | P a g e The main difference between version 1.2 and 1.3 is that the former uses a single file database storage system whereas the latter uses a multiple file database storage. This means that data sets obtained with NOVA 1.2 have first to be extracted from the database as individual NOVA 1.2 .nox files (export phase). The Nova 1.2 .nox files can then be converted into .nox files which can be used by NOVA 1.3 (conversion phase). The two steps are schematically summarized in Figure 247. Figure 278 – Schematic view of the NOVA 1.2 to NOVA 1.3 conversion process After installing NOVA 1.3, start the Export databases 1.2 to files application (Start menu – Programs – Autolab – Tools). This will start the export application, which will display the contents of the default folder containing the NOVA 1.2 databases (My Documents – My Procedures 1.2). All the NOVA 1.2 databases in this folder will be displayed (see Figure 248). Figure 279 – The contents of the My Procedures 1.2 folder are displayed in the Export application Using the Add database to list and the Remove database from the list buttons, databases can be added or removed from the list. The conversion involves two steps. The first conversion step converts the selected database(s) to individual .nox files and the second conversion step converts the NOVA 1.2 files to NOVA 1.3 files. 208 | P a g e Having selected the databases that have to be converted from the 1.2 format to the 1.3 format, click the Convert to files button to start the first conversion step (see Figure 280). Depending on the number of databases and the size of the selected databases, this step could take several minutes. Figure 280 – During the first conversion step, the contents of the selected database(s) are exported to individual .nox files During the conversion step, the progress is displayed in real time. When the first step is finished, the extracted files can be upgraded to the NOVA 1.3 file format (see Figure 281). Figure 281 – When the extraction process is finished, the files can be upgraded to the NOVA 1.3 file format Note: the original databases will not be destroyed, which means that you can still access the data from NOVA 1.2. Click the Upgrade files to NOVA 1.3 button to continue. The Export application will close and the Upgrade application will be loaded. The exported .nox files will be displayed in the list (see Figure 282). 209 | P a g e Figure 282 – The upgrade application displays the available .nox files in NOVA 1.2 format Using the Add files to list and the Remove files from the list buttons, individual .nox files can be added or removed from the list. Click the Start button to initiate the conversion to the NOVA 1.3 file format. It is possible to create a backup of the source files and to overwrite the backup files if they are already found in the source folder. It is also possible to create a log file, which can be useful if the conversion fails. During the upgrade step, the progress is displayed in real time (see Figure 250). Figure 283 – The upgrade application converts every .nox file in the list from the NOVA 1.2 format to the NOVA 1.3 format When all the .nox files have been processed, they will be compatible with the NOVA 1.3 format (see Figure 251). 210 | P a g e Figure 284 – When the upgrade application has finished, the converted .nox files will be ready for NOVA 1.3 Note: if the location of the NOVA 1.2 source database is the My Documents\My Procedures 1.2, the converted files will be automatically copied to the My Documents\My Procedures 1.3 folder. If the source database is located in another folder, the same folder will be used as location for the NOVA 1.3 .nox files. Diagnostics NOVA 1.3 introduces a new version of the diagnostics tool. This tool is provided as a stand alone application and can be accessed from the start menu, in the Autolab group (Start menu – All programs – Autolab – Tools). The diagnostics tool can be used to troubleshoot an instrument or perform individual tests to verify the correct operation of the instrument. It requires the standard dummy cell, with the WE lead (and the S lead, if present) connected to the (a) circuit of the cell. It also requires a BNC cable connected between the ADC164 channel 2 to the DAC164 channel 2 on the front panel of the instrument. In order to perform the tests, the diagnostics tool must be configured according to the instrument type. The configuration of the diagnostics tool is done using the select menu (see Figure 285). 211 | P a g e Figure 285 – Setting the hardware selection in the diagnostics tool from the Select menu For all the PGSTATs, the Autolab setting should be selected. For the µAutolab and the µAutolab with FRA module, a specific setting should be used instead. Pressing the start button will initiate all the selected tests. The connection with the instrument will be established by the diagnostics tool during the Embedded Processor Test. During the test, the progress will be displayed and a successful test will be indicated by a green symbol (see Figure 286). 212 | P a g e Figure 286 – The diagnostics report after all the tests have been performed successfully If all the tests succeed, the instrument is working correctly. It is possible to verify the results of a specific test by clicking open the details in the diagnostics tool (see Figure 287). Figure 287 – The diagnostics tool displays the details of all the tests If one or more of the tests fails, a red symbol will be used to indicate which test failed and what the problem is. Figure 288 shows the output of the diagnostics tool when the test is performed with a faulty USB connection. 213 | P a g e Figure 288 – A failed test will be indicated in the diagnostics tool It is possible to print the test report or to save it as a text file by using the File menu and selecting the appropriate action (see Figure 289). Figure 289 – It is possible to save or print the diagnostics report Signal set(s) for each measurement command It is now possible to define one or more signal set for each measurement command which will be created during the measurement. Each measurement command has a default signal set, which can be edited. The signal set(s) added to a measurement command can use any electrochemical signal defined in the sampler of the command. Figure 290 shows the default signal 214 | P a g e set used for the CV Staircase command. The signal set, i vs. E, uses the following electrochemical signals: • • • X – Potential applied (V) Y – WE(1).Current (A) Z – Time (s) The definition of the electrochemical signals used in the signal set is achieved using links. Figure 290 – The Cyclic voltammetry procedure with the default Signal set of the CV Staircase command The signal set(s) added to a measurement command of a procedure define how the measured data is displayed in real time, during the measurement. For the CV Staircase command, the WE(1).Current signal will be plotted against the Potential applied in real time. If the links are changed, for example by replacing the Potential applied by the Time, the data will be plotted differently during the measurement (see Figure 291). 215 | P a g e Figure 291 – Modifying the links used for the Signal set will change the way the data is displayed during the measurement More than one signal set in the measurement view It is possible to add more than one signal set to a measurement command. Each signal set will be displayed in the measurement view, which means that it is now possible to plot more than one signal in real time. For the Cyclic voltammetry procedure, this can be achieved by dragging a Signal set command from the command browser and drop on the CV Staircase command (see Figure 292). 216 | P a g e Figure 292 – Adding a Signal set command to a measurement command can be done by dragging A new signal set command will be available for the CV Staircase command (see Figure 293). It is possible to select which electrochemical signals to use for this new signal set, by linking the available signals of the CV Staircase to the X, Y and Z inputs of the signal set command. 217 | P a g e Figure 293 – The new signal set is added to the CV Staircase command Setting up the signal set(s), more than one plot can be displayed in real time. Figure 294 shows an example in which two signals are plotted in the measurement view during the measurement. Figure 294 – Real time plot for the Cyclic voltammetry procedure showing two signals plotted at the same time. The blue curve corresponds to the WE(1).Potential (left axis) and the red curve corresponds to the WE(1).Current (right axis) 218 | P a g e Clear plot during measurement The clear measurement plot button in the toolbar is now available during the measurement. If this button is pressed during a measurement, the plot will be cleared, even if a measurement is ongoing. The plotting of the data will resume after the plot is cleared. Manual rescale during measurement In NOVA 1.3, it is possible to disable the automatic rescaling during a measurement. Any action changing the scaling of the plot during a measurement (for example, zooming in or out or changing the scaling of one of the axes), will interrupt the automatic rescaling feature of NOVA. Pressing the F4 key will resume automatic rescaling. Mathematical parser as a command The Mathematical parser command is available from the Analysis group in the command browser. This command can be used to perform a calculation, during the measurement or at the end of it. The mathematical parser command requires a user defined mathematical formula and a source electrochemical signal for each variable in the mathematical expression. Figure 295 shows a typical example of the Mathematical parser command. In this case, the Mathematical parser command has been added at the end of the procedure. 219 | P a g e Figure 295 – The mathematical parser command added to the Cyclic voltammetry procedure To use this command, click the button located on the right-hand side. This will open the Expression builder window, in which the mathematical function can be created (see Figure 296). 220 | P a g e Figure 296 – The expression builder window The following items are required: • • • Name – this is the name of the electrochemical signal generated by the calculation. Unit – this is the unit of the calculated signal. Expression – this is the mathematical expression used for the calculation. The functions provided in the two lists on the right hand side of the expression builder window can be used to build the expression. The unit group can be used to assign a unit to the calculated electrochemical signal. The unit can be selected from the drop-down list or it can be entered manually. The parameters field, which is updated once a formula has been entered, provides a list of all the variables that are used in the calculation. In Figure 297, the expression builder is used to calculate the logarithmic value of the absolute value of the current. The formula has only one parameter, the Current (see Figure 297). 221 | P a g e Figure 297 – The expression builder and the formula used in the Mathematical parser When the mathematical expression has been entered, the expression builder can be closed by clicking the OK button. The Mathematical parser command will be updated (see Figure 298). A list of parameters will be displayed under the Mathematical parser command. Each of these parameters has to be linked to the source electrochemical signal that has to be used in the calculation. 222 | P a g e Figure 298 – The parameters of the mathematical parser command have to be linked to the source electrochemical signals In the example shown in Figure 298, the Current parameter has been linked with the WE(1).Current electrochemical signal. At the end of the measurement, the values of the WE(1).Current will be used in the predefined calculation and a new electrochemical signal, Log of the current, will be added to the data set. This calculated signal will then be available for data analysis. Improved Autolab control interface The Autolab control command is available from the measurement group in the commands browser. This command defines hardware settings of the instrument, like the selected current range, the cell status, the bandwidth of the potentiostat/galvanostat, etc… The Autolab control command is already available in NOVA 1.2. This version of NOVA introduces some user interface changes. To use this command, click on the button located on the right hand side (see Figure 299). 223 | P a g e Figure 299 – Opening the Autolab control user interface Figure 300 shows a typical view of the Autolab control interface. For each hardware module with manual settings, a list of items are available (in Figure 300, the settings for WE(1), WE(2) and DIO are available). Figure 300 – A typical Autolab control interface window The available settings for each item can be selected from a drop-down list (see Figure 301). The default status of each item is Unchanged, which means that the settings of the instrument will not be changed, unless it is required by the user. 224 | P a g e Figure 301 – Changing the settings can be done using the drop-down lists To change a setting, select the new value from a drop-down list. Figure 302 illustrates the change of one of the hardware settings. Using the drop-down lists, the active current range for the WE(1) can be set to 10 µA. 225 | P a g e Figure 302 – The changes in the Autolab control command are highlighted Note: the Autolab control command only displays the settings of the hardware modules defined in the hardware setup. OCP integration Open circuit potential measurements are now easier compared to the previous versions of NOVA. A new command, OCP determination, is now available from the measurement group in the commands browser. This command samples the WE(1).Potential during a pre-defined time (see Figure 303). Figure 303 – The OCP determination command 226 | P a g e The OCP determination command has the following parameters: • • • • Signal sampler: defines the signals that are sampled during the OCP determination (WE(1).Potential and Time are the default settings) Maximum time (s): defines the maximum duration of the OCP determination dE/dt limit: defines an optional cutoff value for the derivative of the OCP (if this value is set to 0, the dE/dt limit is not used) Use average OCP: yes/no – this settings defines whether the moving average the OCP values, measured during 5 seconds, should be used in the determination of the OCP or if the last measured OCP value should be used instead The OCP determination command comes with a signal set, which displays the WE(1).Potential versus time during the measurement. A second window is also displayed during the measurement, displaying real time information about WE(1).Potential and dE/dt (see Figure 304). Figure 304 – The OCP determination window displayed during the measurement During the OCP determination, it is possible to check or uncheck the ‘Accept on timeout’ and ‘Accept on dE/dt limit’ options. It is also possible to switch from the average OCP to the last measured OCP. The minimum and maximum values represent the lowest and highest value of the WE(1).Potential measured during the OCP determination. The green line plotted in the OCP determination window represents the dE/dt limit. 227 | P a g e Note: it is possible to press the Accept button to stop the OCP determination and use the last value of the WE(1).Potential as the OCP. Set reference potential command A new Set reference potential command is available from the measurement group in the command browser. This command can be used to apply any offset to the potential applied on the working electrode (WE(1)), in potentiostatic mode. This command can be used in combination with the OCP determination command, to apply all the potentials with respect to the OCP (see Figure 305). Figure 305 – Linking the OCP value with the Set reference potential will force NOVA to apply all the potential values with respect to OCP The same command can be used to correct the potential of the working electrode with a user-defined offset. This offset will be added to all the potential values in the procedure. This can be useful if the experimental settings are defined relative to a different reference electrode than the one in use. Note: in this case, it is not required to link the Reference potential parameter. Import FRA data command An Import FRA data command has been added to the analysis group of the command browser. This command is similar to the Import GPES data. It allows importing data files obtained with the FRA software into the NOVA 1.3 database. Figure 306 illustrates the use of the Import FRA data command. The parameter of the command is the location of the .dfr file. The command generates a Nyquist plot and a Bode plot automatically. Note: the Import FRA data command can be used even if there is no instrument connected to the computer. 228 | P a g e Figure 306 – The Import FRA data command Find circle for impedance data Analysis of the data obtained during an electrochemical impedance measurement is usually performed by fitting the experimental data with an equivalent circuit, based on the Boukamp model. In order to help in the estimation of the parameters of the equivalent circuit, an electrochemical circle fit tool is available from the Baseline tools. This simple tool calculates the values of the elements of the equivalent circuit shown in Figure 307, using the measured data points of a circular portion of the Nyquist plot (corresponding to a single time constant). Figure 307 – The equivalent circuit used in the Electrochemical circle fit tool 229 | P a g e This circuit includes the following items: • • • • Rs (Ohm) – used to simulate the value of the uncompensated resistance Rp (Ohm) – used to simulate the polarization resistance (also referred to as the charge transfer resistance) CPE – the value of the argument of the constant phase element (also referred to as a Q element) n – the value of the exponent of the constant phase element To use the electrochemical circle fit, load an impedance measurement and select the Nyquist plot for display in the 2D plot area. Click on the analysis toolbar and activate the Electrochemical circle method from the Baseline fit group (see Figure 308). Figure 308 – Selecting the Electrochemical circle method from the Baseline fit group Once the Electrochemical circle method has been selected, a new area will be displayed at the bottom of the 2D plot area (see Figure 309). The mouse cursor changes to a large cross. 230 | P a g e To use the Electrochemical circle baseline fit tool, three measured data points must be clicked, fixing the data points through which the fitted circle must pass. Figure 309 – Selecting the Electrochemical circle method displays a control area at the bottom of the 2D plot area Using the left mouse button, select at least three data points in the Nyquist plot. Each selected data point will be marked by a black arrow. After the third point is clicked, the fitted circle will be plotted in the 2D plot area and the calculated values for the fitted circle will be displayed in the bottom area of the 2D plot (see Figure 310). 231 | P a g e Figure 310 – The results of the Electrochemical circle fit are displayed in the area at the bottom of the 2D plot Note: it is possible to save the results of the electrochemical circle fit by clicking the save button located in the analysis toolbar. Fit and simulation Detailed analysis of the data obtained during an electrochemical impedance measurement is usually performed by fitting the experimental data with an equivalent circuit, based on the Boukamp model. Many circuit elements can be used to fit the experimental data with a model. However, the equivalent circuit must be constructed carefully, since a given experimental data set can be fitted with more than one unique equivalent circuit. The fit and simulation tool allows the definition of an equivalent circuit using the following elements: • • • • • • • R, resistance C, capacitance L, inductance Q, constant phase element W, Warburg impedance O, Cotangent hyperbolic T, Tangent hyperbolic 232 | P a g e The circuit elements can be arranged in series or in parallel. The impedance of series element is given by the sum of the impedance values of each individual element, while the impedance of the element placed in parallel is given by the reciprocal of the sum of the reciprocal impedance values of each element. In order to use the fit and simulation tool in NOVA, load an impedance measurement and select any plot for display in the 2D plot area. Click on the analysis toolbar and activate the Fit and simulation method (see Figure 311). Figure 311 – Selecting the Fit and simulation tool from the Analysis toolbar Once the Fit and simulation tool has been selected, a new area will be displayed at the bottom of the 2D plot area (see Figure 312). This area is the control interface for the fit and simulation tool. 233 | P a g e Figure 312 – Selecting the fit and simulation tool displays the large control window below the 2D plot area The Fit and simulation control interface has a number of values and settings (see Figure 313). Figure 313 – The detailed view of the Fit and simulation control interface 234 | P a g e The following parameters define the calculation method used in the fit and simulation tool: • • • • • • • Fit or Simulation: defines the calculation method. Using the Fit methods, the software will try to find the most suitable values for the parameters of each element defined in the equivalent circuit, starting with initial, user-defined values. The simulation method simply calculates the impedance values for the equivalent circuit, as it is defined by the user. Fitting style: (impedance/admittance) – defines whether the calculation should use the impedance or the admittance values during the fit. Maximum number of iterations: defines the number of consecutive calculations used during the fitting calculation. The default value is 100. Maximum change in Chi square: defines one of the convergence criteria. The fitting will not be finished until the absolute change in the Chi square parameter (including weight factors) will be lower than this value. The default value is 0.001. Maximum number of iterations giving no improvement: defines a second stop condition for the fitting calculation. This number defines the number of iterations that are allowed during which the Chi square value does not improve. When this value is reached the fitting calculation is stopped. Measurement data: (impedance/admittance) – defines the type of data of the data set. Use weight factors: (yes / no) – defines whether a weight factor should be used during the calculation. If weight factors are used, each point is multiplied by a weight factor equal to the inverse of the square of the impedance modulus. If this option is not used, the weight factor is the same for each point, i.e. the inverse of the square root of the average of the impedance modulus. The fit and simulation tool requires the definition of an equivalent circuit as well as initial conditions. This can be done by clicking the button located next to the Circuit field in the fit and simulation control interface (see Figure 314). Figure 314 – Opening the circuit definition window 235 | P a g e The circuit definition window will be displayed (see Figure 315). This window can be used to define the equivalent circuit used to fit or to simulate the data, as well as the initial conditions for the calculation. Figure 315 – The circuit definition window To define the equivalent circuit, click the Circuit description field in the top section of the window and type the expression used to define the circuit. The following convention is used: • • Items between () are in parallel Items between [] are in series For example, the equivalent circuit displayed in Figure 316, is defined by: • R(RQ), where the first R corresponds to Rs, the second R corresponds to Rp, which is in parallel with a constant phase element, Q. Figure 316 – A simple equivalent circuit (Randles cell) 236 | P a g e Once the equivalent circuit is defined, click the Validate circuit button to create the circuit. It is possible to choose an equivalent circuit from a pre-defined list of typical circuits. To do this, click the drop-down list button in the Circuit description field and select the required circuit from the list (Figure 317). Press the Validate circuit button to create the circuit. Figure 317 – Selecting an equivalent circuit from the pre-defined list Once the equivalent circuit is defined, it is possible to define the initial values of the variable(s) of each element of the circuit. To do this, click an element in the frame on the left. The properties of the selected element will be displayed in the frame on the right (see Figure 318). Figure 318 – Displaying the parameters and properties of the selected element (note the two variables used in the definition of the Q element) 237 | P a g e The following settings can be edited for each individual element: • • • • • • Lower limit: defines the lowest possible value for the variable of the element, to be used during the fitting of the data. Unit: defines the unit used for the element. Fixed: (true/false) – defines whether the value of the variable can be changed during the fitting of the data. The default setting is false. Upper limit: defines the highest possible value for the variable of the element, to be used during the fitting of the data. User limits: (yes/no) – defines whether the Lower and Upper limit should be used during the fitting of the data. Default setting is yes. Value: defines the initial value of the variable of the circuit element. Note: some circuit elements have more than one variable. The fitting parameters can be defined for each variable, independently (see Figure 318). Once the fitting conditions have been defined, the calculation can be performed. Fitting the data using an equivalent circuit To start the fitting algorithm, click the button located in the toolbar. This will start the calculation, using the defined equivalent circuit and the initial conditions for each element. If the fitting calculation succeeds, the calculated data points will be plotted in the 2D plot area, overlaying the original data set (see Figure 319). The area below the 2D plot area is updated after the calculation. A table is displayed on the left hand side, showing the calculated values of the total impedance, the real and imaginary components and the phase angle (see Figure 319). The Fit and simulation control interface is also updated and displays the number of iterations required to reach the final result and the final value of the Chi square parameter (χ2). 238 | P a g e Figure 319 – The 2D plot area is updated after the fit (the black line plot corresponds to the calculated data) To view the fitted circuit elements, click the button located next to the Result field in the fit and simulation control interface (see Figure 320). Figure 320 – Opening the results window This opens a new window, similar to the one used to create the equivalent circuit (see Figure 321). The calculated values and the estimated error are displayed for each element. 239 | P a g e Figure 321 – The detailed results of the fit calculation The frame on the right displays the detailed calculated values of each variable for the selected element. Note: if the fit calculation is not complete after the maximum number of iterations, it is possible to resume the fitting using the last calculated values of each element of the equivalent circuit. To do this, check the ‘Use result as circuit’ check box in the Results window and press the analyze button to restart the fit calculation, using the last values as initial conditions (see Figure 321). To save the results of the fitting, click the button located in the toolbar. This will add the calculation to the data set, which will be available as a new signal set in the data explorer (see Figure 322). Figure 322 – The saved results of the fit are added to the data set The added signal set contains the calculated Bode and Nyquist plots, as well as the residual plots for Z’ and Z”. 240 | P a g e Simulating the data using an equivalent circuit The simulation tool can be used to calculate the expected behavior of a user-defined equivalent circuit. To use the simulation tool, the equivalent circuit must first be defined, in the same way as for the fitting procedure. However, the Fit or Simulation parameter in the control interface must be set to Simulation (see Figure 323). Figure 323 – To use the simulation tool, the Fit or Simulation parameter must be set accordingly To start the simulation algorithm, click the button located in the toolbar. This will calculate the expected behavior of the equivalent circuit, using the initial parameters for each of the circuit elements. Figure 324 shows an example of simulated data. 241 | P a g e Figure 324 – The results of the simulation are displayed in the same way as those of the fitting The results of the simulation are displayed in the same way as those of the fitting calculation. Clicking the button, located in the toolbar, will save the results of the simulation. 242 | P a g e