1
SIPLUS CMS X-Tools - User Manual - 05 - Monitoring System
SIPLUS CMS
Preface
1
Monitoring System
2
Contact Information
3
SIPLUS CMS
SIPLUS CMS X-Tools
User Manual - 05 - Monitoring System
English
Release 2012-09
English
Release 2012-09
1 / 214
SIPLUS CMS X-Tools - User Manual - 05 - Monitoring System
SIPLUS CMS
Safety Guidelines
This document contains notices which you should observe to ensure your own personal safety as well as to avoid property damage. The
notices referring to your personal safety are highlighted in the manual by a safety alert symbol, notices referring to property damage only
have no safety alert symbol
Danger
Indicates an imminently hazardous situation which, if not avoided, will result in death or serious injury.
Warning
Indicates a potentially hazardous situation which, if not avoided, could result in death or serious injury.
Caution
Used with the safety alert symbol indicates a potentially hazardous situation which, if not avoided, may result in minor or moderate injury.
Notice
Used without the safety alert symbol indicates a potential situation which, if not avoided, may result in an undesirable result or
state.
When several danger levels apply, the notices of the highest level (lower number) are always displayed. If a notice refers to personal
damages with the safety alert symbol, then another notice may be added warning of property damage.
Qualified Personnel
The device/system may only be set up and operated in conjunction with this documentation. Only qualified personnel should be allowed to
install and work on the equipment. Qualified persons are defined as persons who are authorized to commission, to earth, and to tag circuits, equipment and systems in accordance with established safety practices and standards.
Intended Use
Please note the following:
Warning
This device and its components may only be used for the applications described in the catalog or technical description, and
only in connection with devices or components from other manufacturers approved or recommended by Siemens. This product can only function correctly and safely if it is transported, stored, set up and installed correctly, and operated and maintained as recommended.
Trademarks
All designations marked with ® are registered trademarks of Siemens AG. Other designations in this documentation might be trademarks
which, if used by third parties for their purposes, might infringe upon the rights of the proprietors.
Copyright Siemens AG 2012. All rights reserved.
Reproduction, transmission or use of this document or its contents is not permitted without express written authority. Offenders will be
liable for damages. All rights, including rights created by patent grant or registration of a utility model or design, are reserved.
Disclaimer of Liability
We have checked the contents of this document for agreement with the hardware and software described. Since deviations cannot be
precluded entirely, we cannot guarantee full agreement. However, the data in the manual are reviewed regularly, and any necessary corrections will be included in subsequent editions. Suggestions for improvement are welcomed.
Siemens AG
Industry Sector
P.O. Box 4848
90327 Nuremberg
Germany
English
Release 2012-09
Siemens AG 2012
Technical data subject to change
2 / 214
SIPLUS CMS X-Tools - User Manual - 05 - Monitoring System
SIPLUS CMS
Table of Contents
1
Preface ..............................................................................................................................................13
1.1
Purpose of this Document ............................................................................................................13
1.2
Validity of this Document..............................................................................................................13
1.3
Audience ......................................................................................................................................13
1.4
Notations ......................................................................................................................................14
2
Monitoring System.............................................................................................................................15
2.1
Monitoring System Explorer .........................................................................................................15
2.1.1
Overview .................................................................................................................................15
2.1.2
Main Branch ............................................................................................................................16
2.1.3
Editors Branch.........................................................................................................................16
2.1.4
Monitoring Charts Branch .......................................................................................................16
2.1.5
Monitoring Chart Branch .........................................................................................................16
2.1.6
Monitoring View Editors Branch ..............................................................................................16
2.1.7
Monitoring View Editor Branch................................................................................................17
2.1.8
Servers Branch .......................................................................................................................17
2.1.9
Server Branch .........................................................................................................................17
2.1.10
Files Branch ............................................................................................................................17
2.1.11
File Location Branch ...............................................................................................................17
2.1.12
Monitoring View Files Branch .................................................................................................17
2.1.13
Libraries Branch ......................................................................................................................18
2.1.14
Monitoring Process Modules Branch ......................................................................................18
2.1.15
Monitoring Process Module Branch ........................................................................................18
2.2
2.2.1
Monitoring Charts .........................................................................................................................19
MTC Orbit T001 ......................................................................................................................19
2.2.1.1
Overview ............................................................................................................................19
2.2.1.2
Curve Area .........................................................................................................................20
2.2.1.3
x-Axis Area.........................................................................................................................23
2.2.1.4
y-Axis Area.........................................................................................................................25
2.2.1.5
Slider Area .........................................................................................................................27
2.2.1.6
Legend Area ......................................................................................................................29
2.2.1.7
Toolbar Area ......................................................................................................................31
2.2.1.8
Measurement Cursor .........................................................................................................33
2.2.1.9
Measurement Cursors Table .............................................................................................34
2.2.1.10
Chart Options Dialog..........................................................................................................35
2.2.1.10.1
Overview .......................................................................................................................35
2.2.1.10.2
Chart Options Table......................................................................................................36
2.2.1.10.3
Menu Bar ......................................................................................................................38
2.2.1.11
Chart Styles Dialog ............................................................................................................39
2.2.1.11.1
Overview .......................................................................................................................39
2.2.1.11.2
Default Styles of Data Table .........................................................................................39
English
Release 2012-09
3 / 214
SIPLUS CMS X-Tools - User Manual - 05 - Monitoring System
SIPLUS CMS
2.2.1.11.3
Styles of Controls Table................................................................................................40
2.2.1.11.4
Menu Bar ......................................................................................................................40
2.2.1.12
Data Style Dialog ...............................................................................................................40
2.2.1.12.1
Overview .......................................................................................................................40
2.2.1.12.2
Style Parameters Table ................................................................................................41
2.2.1.12.3
Menu Bar ......................................................................................................................41
2.2.1.13
2.2.1.13.1
2.2.1.14
Select Style Dialog .............................................................................................................42
Overview .......................................................................................................................42
Manual scale x-Axis Dialog ................................................................................................42
2.2.1.14.1
Overview .......................................................................................................................42
2.2.1.14.2
x-Axis Parameters Table ..............................................................................................43
2.2.1.14.3
Menu Bar ......................................................................................................................43
2.2.1.15
Manual scale y-Axis Dialog ................................................................................................44
2.2.1.15.1
Overview .......................................................................................................................44
2.2.1.15.2
y-Axis Parameters Table ..............................................................................................44
2.2.1.15.3
Menu Bar ......................................................................................................................45
2.2.1.16
Manual scale Renderer Dialog ..........................................................................................45
2.2.1.16.1
Overview .......................................................................................................................45
2.2.1.16.2
Renderer Parameters Table .........................................................................................45
2.2.1.16.3
Menu Bar ......................................................................................................................45
2.2.1.17
2.2.2
Drag&Drop sensitive Areas ...............................................................................................46
MTC Vector2D T001 ...............................................................................................................47
2.2.2.1
Overview ............................................................................................................................47
2.2.2.2
Curve Area .........................................................................................................................48
2.2.2.3
x-Axis Area.........................................................................................................................52
2.2.2.4
y-Axis Area.........................................................................................................................54
2.2.2.5
Slider Area .........................................................................................................................56
2.2.2.6
Legend Area ......................................................................................................................58
2.2.2.7
Toolbar Area ......................................................................................................................60
2.2.2.8
Measurement Cursor .........................................................................................................62
2.2.2.9
Measurement Cursors Table .............................................................................................64
2.2.2.10
Chart Options Dialog..........................................................................................................65
2.2.2.10.1
Overview .......................................................................................................................65
2.2.2.10.2
Chart Options Table......................................................................................................66
2.2.2.10.3
Menu Bar ......................................................................................................................68
2.2.2.11
Chart Styles Dialog ............................................................................................................69
2.2.2.11.1
Overview .......................................................................................................................69
2.2.2.11.2
Default Styles of Data Table .........................................................................................69
2.2.2.11.3
Styles of Controls Table................................................................................................70
2.2.2.11.4
Menu Bar ......................................................................................................................70
2.2.2.12
2.2.2.12.1
English
Release 2012-09
Data Style Dialog ...............................................................................................................70
Overview .......................................................................................................................70
4 / 214
SIPLUS CMS X-Tools - User Manual - 05 - Monitoring System
SIPLUS CMS
2.2.2.12.2
Style Parameters Table ................................................................................................71
2.2.2.12.3
Menu Bar ......................................................................................................................71
2.2.2.13
2.2.2.13.1
2.2.2.14
Select Style Dialog .............................................................................................................71
Overview .......................................................................................................................71
Manual scale x-Axis Dialog ................................................................................................72
2.2.2.14.1
Overview .......................................................................................................................72
2.2.2.14.2
x-Axis Parameters Table ..............................................................................................72
2.2.2.14.3
Menu Bar ......................................................................................................................73
2.2.2.15
Manual scale y-Axis Dialog ................................................................................................73
2.2.2.15.1
Overview .......................................................................................................................73
2.2.2.15.2
y-Axis Parameters Table ..............................................................................................73
2.2.2.16
Manual scale Renderer Dialog ..........................................................................................74
2.2.2.16.1
Overview .......................................................................................................................74
2.2.2.16.2
Renderer Parameters Table .........................................................................................74
2.2.2.17
2.2.3
Drag&Drop sensitive Areas ...............................................................................................75
MTC yn T001 ..........................................................................................................................76
2.2.3.1
Overview ............................................................................................................................76
2.2.3.2
Curve Area .........................................................................................................................77
2.2.3.3
x-Axes Area .......................................................................................................................81
2.2.3.4
y-Axes Area .......................................................................................................................83
2.2.3.5
Slider Area .........................................................................................................................85
2.2.3.6
Legend Area ......................................................................................................................87
2.2.3.7
Toolbar Area ......................................................................................................................90
2.2.3.8
Measurement Cursors .......................................................................................................93
2.2.3.9
Advanced Cursors .............................................................................................................94
2.2.3.10
Frequency Markers ............................................................................................................97
2.2.3.11
Using of Cursors and Markers ...........................................................................................98
2.2.3.11.1
The currently selected Cursor ......................................................................................98
2.2.3.11.2
The current Cursor Data ...............................................................................................98
2.2.3.11.3
Labeling of Cursor and Marker Lines ...........................................................................98
2.2.3.11.4
Linking of Cursors/Markers ...........................................................................................99
2.2.3.11.5
Linking of Data to the Main Frequency Marker ............................................................99
2.2.3.12
Measurement Cursors Table .............................................................................................99
2.2.3.13
Advanced Cursors Table .................................................................................................100
2.2.3.14
Frequency Markers Table ................................................................................................101
2.2.3.15
Chart Options Dialog........................................................................................................102
2.2.3.15.1
Overview .....................................................................................................................102
2.2.3.15.2
Chart Options Table....................................................................................................103
2.2.3.15.3
Menu Bar ....................................................................................................................105
2.2.3.16
Chart Styles Dialog ..........................................................................................................106
2.2.3.16.1
Overview .....................................................................................................................106
2.2.3.16.2
Default Styles of Data Table .......................................................................................106
English
Release 2012-09
5 / 214
SIPLUS CMS X-Tools - User Manual - 05 - Monitoring System
SIPLUS CMS
2.2.3.16.3
Styles of Controls Table..............................................................................................107
2.2.3.16.4
Menu Bar ....................................................................................................................107
2.2.3.17
Data Style Dialog .............................................................................................................107
2.2.3.17.1
Overview .....................................................................................................................107
2.2.3.17.2
Style Parameters Table ..............................................................................................108
2.2.3.17.3
Menu Bar ....................................................................................................................108
2.2.3.18
2.2.3.18.1
2.2.3.19
Select Style Dialog ...........................................................................................................109
Overview .....................................................................................................................109
Manual scale x-Axis Dialog ..............................................................................................109
2.2.3.19.1
Overview .....................................................................................................................109
2.2.3.19.2
x-Axis Parameters Table ............................................................................................110
2.2.3.19.3
Menu Bar ....................................................................................................................110
2.2.3.20
2.2.3.20.1
2.2.3.21
Manual scale y-Axis Dialog ..............................................................................................111
Overview .....................................................................................................................111
Configure Frequency Markers Dialog ..............................................................................111
2.2.3.21.1
Overview .....................................................................................................................111
2.2.3.21.2
Frequency Markers Table ...........................................................................................112
2.2.3.21.3
Menu Bar ....................................................................................................................112
2.2.3.22
2.2.4
Drag&Drop sensitive Areas .............................................................................................113
MTC ynm T001 .....................................................................................................................114
2.2.4.1
Overview ..........................................................................................................................114
2.2.4.2
Curve Area .......................................................................................................................115
2.2.4.3
x-Axis Area.......................................................................................................................120
2.2.4.4
y-Axis Area.......................................................................................................................121
2.2.4.5
z-Axis Area.......................................................................................................................122
2.2.4.6
Slider Area .......................................................................................................................122
2.2.4.7
Legend Area ....................................................................................................................126
2.2.4.8
Toolbar Area ....................................................................................................................128
2.2.4.9
Measurement Cursors .....................................................................................................133
2.2.4.10
Measurement Cursors Table ...........................................................................................133
2.2.4.11
Chart Options Dialog........................................................................................................134
2.2.4.11.1
Overview .....................................................................................................................134
2.2.4.11.2
Chart Options Table....................................................................................................135
2.2.4.11.3
Menu Bar ....................................................................................................................138
2.2.4.12
Chart Styles Dialog ..........................................................................................................138
2.2.4.12.1
Overview .....................................................................................................................138
2.2.4.12.2
Default Styles of Data Table .......................................................................................139
2.2.4.12.3
Styles of Controls Table..............................................................................................139
2.2.4.12.4
Menu Bar ....................................................................................................................139
2.2.4.13
Data Style Dialog .............................................................................................................140
2.2.4.13.1
Overview .....................................................................................................................140
2.2.4.13.2
Style Parameters Table ..............................................................................................140
English
Release 2012-09
6 / 214
SIPLUS CMS X-Tools - User Manual - 05 - Monitoring System
2.2.4.13.3
2.2.4.14
2.2.4.14.1
2.2.4.15
SIPLUS CMS
Menu Bar ....................................................................................................................141
Select Style Dialog ...........................................................................................................141
Overview .....................................................................................................................141
Manual scale x-Axis Dialog ..............................................................................................142
2.2.4.15.1
Overview .....................................................................................................................142
2.2.4.15.2
x-Axis Parameters Table ............................................................................................142
2.2.4.15.3
Menu Bar ....................................................................................................................143
2.2.4.16
2.2.4.16.1
2.2.4.17
2.2.4.17.1
2.2.4.18
Manual scale y-Axis Dialog ..............................................................................................143
Overview .....................................................................................................................143
Manual scale z-Axis Dialog ..............................................................................................143
Overview .....................................................................................................................143
Manual scale Color Gradient Dialog ................................................................................144
2.2.4.18.1
Overview .....................................................................................................................144
2.2.4.18.2
Color Gradient Parameters Table ...............................................................................144
2.2.4.18.3
Menu Bar ....................................................................................................................144
2.2.4.19
2.2.5
Drag&Drop sensitive Areas .............................................................................................145
MTC yt T001 .........................................................................................................................146
2.2.5.1
Overview ..........................................................................................................................146
2.2.5.2
Curve Area .......................................................................................................................147
2.2.5.3
t-Axes Area ......................................................................................................................151
2.2.5.4
y-Axes Area .....................................................................................................................153
2.2.5.5
Legend Area ....................................................................................................................156
2.2.5.6
Toolbar Area ....................................................................................................................159
2.2.5.7
Measurement Cursors .....................................................................................................161
2.2.5.8
Measurement Cursors Table ...........................................................................................162
2.2.5.9
Chart Options Dialog........................................................................................................163
2.2.5.9.1
Overview .....................................................................................................................163
2.2.5.9.2
Chart Options Table....................................................................................................164
2.2.5.9.3
Menu Bar ....................................................................................................................166
2.2.5.10
Chart Styles Dialog ..........................................................................................................167
2.2.5.10.1
Overview .....................................................................................................................167
2.2.5.10.2
Default Styles of Data Table .......................................................................................167
2.2.5.10.3
Styles of Controls Table..............................................................................................168
2.2.5.10.4
Menu Bar ....................................................................................................................168
2.2.5.11
Data Style Dialog .............................................................................................................168
2.2.5.11.1
Overview .....................................................................................................................168
2.2.5.11.2
Style Parameters Table ..............................................................................................169
2.2.5.11.3
Menu Bar ....................................................................................................................170
2.2.5.12
2.2.5.12.1
2.2.5.13
2.2.5.13.1
English
Release 2012-09
Select Style Dialog ...........................................................................................................170
Overview .....................................................................................................................170
Manual scale t-Axis Dialog ..............................................................................................171
Overview .....................................................................................................................171
7 / 214
SIPLUS CMS X-Tools - User Manual - 05 - Monitoring System
SIPLUS CMS
2.2.5.13.2
t-Axis Parameters Table .............................................................................................171
2.2.5.13.3
Menu Bar ....................................................................................................................172
2.2.5.14
Manual scale y-Axis Dialog for numerical y-Axes ............................................................172
2.2.5.14.1
Overview .....................................................................................................................172
2.2.5.14.2
y-Axis Parameters Table ............................................................................................172
2.2.5.14.3
Menu Bar ....................................................................................................................173
2.2.5.15
Manual scale y-Axis Dialog for binary y-Axes .................................................................173
2.2.5.15.1
Overview .....................................................................................................................173
2.2.5.15.2
y-Axis Parameters Table ............................................................................................173
2.2.5.15.3
Menu Bar ....................................................................................................................173
2.2.5.16
2.2.6
Drag&Drop sensitive Areas .............................................................................................174
MTC yx T001.........................................................................................................................175
2.2.6.1
Overview ..........................................................................................................................175
2.2.6.2
Curve Area .......................................................................................................................176
2.2.6.3
x-Axis Area.......................................................................................................................180
2.2.6.4
y-Axis Area.......................................................................................................................182
2.2.6.5
Slider Area .......................................................................................................................184
2.2.6.6
Legend Area ....................................................................................................................186
2.2.6.7
Toolbar Area ....................................................................................................................189
2.2.6.8
Measurement Cursors .....................................................................................................192
2.2.6.9
Measurement Cursors Table ...........................................................................................193
2.2.6.10
Chart Options Dialog........................................................................................................194
2.2.6.10.1
Overview .....................................................................................................................194
2.2.6.10.2
Chart Options Table....................................................................................................195
2.2.6.10.3
Menu Bar ....................................................................................................................197
2.2.6.11
Chart Styles Dialog ..........................................................................................................198
2.2.6.11.1
Overview .....................................................................................................................198
2.2.6.11.2
Default Styles of Data Table .......................................................................................198
2.2.6.11.3
Styles of Controls Table..............................................................................................199
2.2.6.11.4
Menu Bar ....................................................................................................................199
2.2.6.12
Data Style Dialog .............................................................................................................199
2.2.6.12.1
Overview .....................................................................................................................199
2.2.6.12.2
Style Parameters Table ..............................................................................................200
2.2.6.12.3
Menu Bar ....................................................................................................................200
2.2.6.13
2.2.6.13.1
2.2.6.14
Select Style Dialog ...........................................................................................................201
Overview .....................................................................................................................201
Manual scale x-Axis Dialog ..............................................................................................201
2.2.6.14.1
Overview .....................................................................................................................201
2.2.6.14.2
x-Axis Parameters Table ............................................................................................202
2.2.6.14.3
Menu Bar ....................................................................................................................202
2.2.6.15
2.2.6.15.1
English
Release 2012-09
Manual scale y-Axis Dialog ..............................................................................................203
Overview .....................................................................................................................203
8 / 214
SIPLUS CMS X-Tools - User Manual - 05 - Monitoring System
SIPLUS CMS
2.2.6.15.2
y-Axis Parameters Table ............................................................................................203
2.2.6.15.3
Menu Bar ....................................................................................................................204
Manual scale Renderer Dialog ........................................................................................204
2.2.6.16
2.2.6.16.1
Overview .....................................................................................................................204
2.2.6.16.2
Renderer Parameters Table .......................................................................................204
2.2.6.16.3
Menu Bar ....................................................................................................................204
2.2.6.17
Drag&Drop sensitive Areas .............................................................................................205
2.3
Monitoring View Editors .............................................................................................................206
2.3.1
Overview ...............................................................................................................................206
2.3.2
Common Controls .................................................................................................................206
2.3.2.1
Overview ..........................................................................................................................206
2.3.2.2
Monitoring View Settings Table .......................................................................................206
2.3.2.3
Menu Bar .........................................................................................................................207
MVE Standard T001 .............................................................................................................208
2.3.3
2.3.3.1
Overview ..........................................................................................................................208
2.3.3.2
Monitoring View Settings Table .......................................................................................209
2.3.3.3
Monitoring View Parameters Table..................................................................................209
2.3.3.4
Automatic Reports Parameters Table..............................................................................211
2.3.3.5
Automatic Reports Trigger Table .....................................................................................212
2.3.3.6
Action Area ......................................................................................................................213
2.3.3.7
Cursor Area......................................................................................................................213
2.3.3.8
Menu Bar .........................................................................................................................213
2.3.3.9
Dropping of Items.............................................................................................................213
3
Contact Information .........................................................................................................................214
English
Release 2012-09
9 / 214
SIPLUS CMS X-Tools - User Manual - 05 - Monitoring System
SIPLUS CMS
Table of Figures
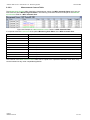
Figure 1: Example of a MTS Explorer ................................................................................................................. 15
Figure 2: Example of a MTC Orbit T001.............................................................................................................. 19
Figure 3: Example of the Curve Area of a MTC Orbit T001 ................................................................................ 20
Figure 4: Example of the x-Axis Area of a MTC Orbit T001 ................................................................................ 23
Figure 5: Example of the y-Axis Area of a MTC Orbit T001 ................................................................................ 25
Figure 6: Example of the Slider Area of a MTC Orbit T001................................................................................. 27
Figure 7: Example of the Legend Area of a MTC Orbit T001 .............................................................................. 29
Figure 8: Example of the Toolbar Area of a MTC Orbit T001.............................................................................. 31
Figure 9: Example of the Measurement Cursor of a MTC Orbit T001................................................................. 33
Figure 10: Example of a Measurement Cursors Table of a MTC Orbit T001 ...................................................... 34
Figure 11: Example of a Chart Options Dialog of a MTC Orbit T001 ................................................................ 35
Figure 12: Example of a Chart Styles Dialog of a MTC Orbit T001 ................................................................... 39
Figure 13: Example of a Data Style Dialog of a MTC Orbit T001 ....................................................................... 40
Figure 14: Example of a Select Style Dialog of a MTC Orbit T001 .................................................................... 42
Figure 15: Example of a Manual scale x-Axis Dialog of a MTC Orbit T001 ...................................................... 42
Figure 16: Example of a Manual scale y-Axis Dialog of a MTC Orbit T001 ...................................................... 44
Figure 17: Example of a Manual scale Renderer Dialog of a MTC Orbit T001 ................................................. 45
Figure 18: Dropping of Data in order to open a new Monitoring Chart .............................................................. 46
Figure 19: Dropping of Data in order to add it to the existing MTC Orbit T001 ................................................... 46
Figure 20: Example of a MTC Vector2D T001..................................................................................................... 47
Figure 21: Example of the Curve Area of a MTC Vector2D T001 ....................................................................... 48
Figure 22: Example of the x-Axis Area of a MTC Vector2D T001 ....................................................................... 52
Figure 23: Example of the y-Axis Area of a MTC Vector2D T001 ....................................................................... 54
Figure 24: Example of the Slider Area of a MTC Vector2D T001........................................................................ 56
Figure 25: Example of the Legend Area of a MTC Vector2D T001..................................................................... 58
Figure 26: Example of the Toolbar Area of a MTC Vector2D T001..................................................................... 60
Figure 27: Example of the Measurement Cursor of a MTC Vector2D T001 ....................................................... 62
Figure 28: Example of a Measurement Cursors Table of a MTC Vector2D T001............................................... 64
Figure 29: Example of a Chart Options Dialog of a MTC Vector2D T001 ......................................................... 65
Figure 30: Example of a Chart Styles Dialog of a MTC Vector2D T001 ............................................................ 69
Figure 31: Example of a Data Style Dialog of a MTC Vector2D T001................................................................ 70
Figure 32: Example of a Select Style Dialog of a MTC Vector2D T001 ............................................................. 71
Figure 33: Example of a Manual scale x-Axis Dialog of a MTC Vector2D T001............................................... 72
Figure 34: Example of a Manual scale y-Axis Dialog of a MTC Vector2D T001............................................... 73
Figure 35: Example of a Manual scale Renderer Dialog of a MTC Vector2D T001.......................................... 74
Figure 36: Dropping of Data in order to open a new Monitoring Chart .............................................................. 75
Figure 37: Dropping of Data in order to add it to the existing MTC Vector2D T001............................................ 75
Figure 38: Example of a MTC yn T001 ................................................................................................................ 76
Figure 39: Example of the Curve Area of a MTC yn T001................................................................................... 77
Figure 40: Example of the x-Axes Area of a MTC yn T001 ................................................................................. 81
English
Release 2012-09
10 / 214
SIPLUS CMS X-Tools - User Manual - 05 - Monitoring System
SIPLUS CMS
Figure 41: Example of the y-Axes Area of a MTC yn T001 ................................................................................. 83
Figure 42: Example of the Slider Area of a MTC yn T001 ................................................................................... 85
Figure 43: Example of the Legend Area of a MTC yn T001 ................................................................................ 87
Figure 44: Example of the Toolbar Area of a MTC yn T001 ................................................................................ 90
Figure 45: Example of the Measurement Cursors of a MTC yn T001 ................................................................. 93
Figure 46: Example of the Harmonics of a MTC yn T001.................................................................................... 94
Figure 47: Example of the Subharmonics of a MTC yn T001 .............................................................................. 95
Figure 48: Example of the Sidebands of a MTC yn T001 .................................................................................... 95
Figure 49: Example of the Frequency Markers of a MTC yn T001 ...................................................................... 97
Figure 50: Example of a Measurement Cursors table of a MTC yn T001............................................................ 99
Figure 51: Example of an Advanced Cursors table of a MTC yn T001.............................................................. 100
Figure 52: Example of a Frequency Markers table of a MTC yn T001 .............................................................. 101
Figure 53: Example of a Chart Options Dialog of a MTC yn T001................................................................... 102
Figure 54: Example of a Chart Styles Dialog of a MTC yn T001...................................................................... 106
Figure 55: Example of a Data Style Dialog of a MTC yn T001 ......................................................................... 107
Figure 56: Example of a Select Style Dialog of a MTC yn T001....................................................................... 109
Figure 57: Example of a Manual scale x-Axis Dialog of a MTC yn T001......................................................... 109
Figure 58: Example of a Manual scale y-Axis Dialog of a MTC yn T001......................................................... 111
Figure 59: Example of a Configure Frequency Markers Dialog of a MTC yn T001........................................ 111
Figure 60: Dropping of Data in order to open a new Monitoring Chart ............................................................ 113
Figure 61: Dropping of Data in order to add it to the existing MTC yn T001 ..................................................... 113
Figure 62: Example of a MTC ynm T001 ........................................................................................................... 114
Figure 63: Example of the Curve Area of a MTC ynm T001.............................................................................. 115
Figure 64: Example of the x-Axis Area of a MTC ynm T001 ............................................................................. 120
Figure 65: Example of the y-Axis Area of a MTC ynm T001 ............................................................................. 121
Figure 66: Example of the z-Axis Area of a MTC ynm T001 ............................................................................. 122
Figure 67: Example of the Slider Area of a MTC ynm T001 .............................................................................. 122
Figure 68: Example of the Legend Area of a MTC ynm T001 ........................................................................... 126
Figure 69: Example of the Toolbar Area of a MTC ynm T001 ........................................................................... 128
Figure 70: Example of the Measurement Cursors of a MTC ynm T001 ............................................................ 133
Figure 71: Example of a Measurement Cursors table of a MTC ynm T001 ...................................................... 133
Figure 72: Example of a Chart Options Dialog of a MTC ynm T001................................................................ 134
Figure 73: Example of a Chart Styles Dialog of a MTC ynm T001................................................................... 138
Figure 74: Example of a Data Style Dialog of a MTC ynm T001 ...................................................................... 140
Figure 75: Example of a Select Style Dialog of a MTC ynm T001 ................................................................... 141
Figure 76: Example of a Manual scale x-Axis Dialog of a MTC ynm T001 ..................................................... 142
Figure 77: Example of a Manual scale y-Axis Dialog of a MTC ynm T001 ..................................................... 143
Figure 78: Example of a Manual scale z-Axis Dialog of a MTC ynm T001...................................................... 143
Figure 79: Example of a Manual scale Color Gradient Dialog of a MTC ynm T001....................................... 144
Figure 80: Dropping of Data in order to open a new Monitoring Chart ............................................................ 145
Figure 81: Dropping of Data in order to add it to the existing MTC ynm T001 .................................................. 145
Figure 82: Example of a MTC yt T001 ............................................................................................................... 146
English
Release 2012-09
11 / 214
SIPLUS CMS X-Tools - User Manual - 05 - Monitoring System
SIPLUS CMS
Figure 83: Example of the Curve Area of a MTC yt T001 .................................................................................. 147
Figure 84: Example of the t-Axes Area of a MTC yt T001 ................................................................................. 151
Figure 85: Example of the y-Axes Area of a MTC yt T001 ................................................................................ 153
Figure 86: Example of the Legend Area of a MTC yt T001 ............................................................................... 156
Figure 87: Example of the Toolbar Area of a MTC yt T001 ............................................................................... 159
Figure 88: Example of the Measurement Cursors of a MTC yt T001 ................................................................ 161
Figure 89: Example of a Measurement Cursors table of a MTC yt T001........................................................... 162
Figure 90: Example of a Chart Options Dialog of a MTC yt T001.................................................................... 163
Figure 91: Example of a Chart Styles Dialog of a MTC yt T001....................................................................... 167
Figure 92: Example of a Data Style Dialog of a MTC yt T001 .......................................................................... 168
Figure 93: Example of a Select Style Dialog of a MTC yt T001........................................................................ 170
Figure 94: Example of a Manual scale t-Axis Dialog of a MTC yt T001 .......................................................... 171
Figure 95: Example of a Manual scale y-Axis Dialog for numerical y-Axes of a MTC yn T001 ...................... 172
Figure 96: Example of a Manual scale y-Axis Dialog for binary y-Axes of a MTC yt T001 ............................. 173
Figure 97: Dropping of Data in order to open a new Monitoring Chart ............................................................ 174
Figure 98: Dropping of Data in order to add it to the existing MTC yt T001 ...................................................... 174
Figure 99: Example of a MTC yx T001 .............................................................................................................. 175
Figure 100: Example of the Curve Area of a MTC yx T001 ............................................................................... 176
Figure 101: Example of the x-Axis Area of a MTC yx T001............................................................................... 180
Figure 102: Example of the y-Axis Area of a MTC yx T001............................................................................... 182
Figure 103: Example of the Slider Area of a MTC yx T001 ............................................................................... 184
Figure 104: Example of the Legend Area of a MTC yx T001............................................................................. 186
Figure 105: Example of the Toolbar Area of a MTC yx T001 ............................................................................ 189
Figure 106: Example of the Measurement Cursors of a MTC yx T001.............................................................. 192
Figure 107: Example of a Measurement Cursors table of a MTC yx T001........................................................ 193
Figure 108: Example of a Chart Options Dialog of a MTC yx T001 ................................................................. 194
Figure 109: Example of a Chart Styles Dialog of a MTC yx T001 .................................................................... 198
Figure 110: Example of a Data Style Dialog of a MTC yx T001........................................................................ 199
Figure 111: Example of a Select Style Dialog of a MTC yx T001..................................................................... 201
Figure 112: Example of a Manual scale x-Axis Dialog of a MTC yx T001....................................................... 201
Figure 113: Example of a Manual scale y-Axis Dialog of a MTC yx T001....................................................... 203
Figure 114: Example of a Manual scale Renderer Dialog of a MTC yx T001.................................................. 204
Figure 115: Dropping of Data in order to open a new Monitoring Chart .......................................................... 205
Figure 116: Dropping of Data in order to add it to the existing MTC yx T001.................................................... 205
Figure 117: Example of a MVE Standard T001................................................................................................. 208
English
Release 2012-09
12 / 214
SIPLUS CMS X-Tools - User Manual - 05 - Monitoring System
1
SIPLUS CMS
Preface
1.1
Purpose of this Document
This document provides detailed information about the functionalities and usage of the software
• SIPLUS CMS X-Tools
of the SIPLUS CMS product line.
In addition to the detailed information about each dialog and functionality of the Monitoring System which is
found within this document, also the following documentation is available:
• SIPLUS CMS X-Tools - User Manual - 01 - Introduction
o provides an introduction into the basic functionalities of SIPLUS CMS X-Tools
• SIPLUS CMS X-Tools - User Manual - 02 - Master Data System
o provides detailed information about the functionality which is provided by the Master Data System
• SIPLUS CMS X-Tools - User Manual - 03 - Main Management System
o provides detailed information about the functionality which is provided by the Main Management System
• SIPLUS CMS X-Tools - User Manual - 04 - Device Management System
o provides detailed information about the functionality which is provided by the Device Management
System
• SIPLUS CMS X-Tools - User Manual - 06 - Analyzing System
o provides detailed information about the functionality which is provided by the Analyzing System
• SIPLUS CMS X-Tools - User Manual - 07 - Storage System
o provides detailed information about the functionality which is provided by the Storage System
• SIPLUS CMS X-Tools - Release Notes
o provides additional information about the released version of SIPLUS CMS X-Tools
• SIPLUS CMS X-Tools - Change Log
o provides an overview about the changes which have been introduced with the current version of
SIPLUS CMS X-Tools
1.2
Validity of this Document
This document is valid for the following software:
• SIPLUS CMS X-Tools Demo V 03.05
• SIPLUS CMS X-Tools Standard V 03.05
• SIPLUS CMS X-Tools Professional V 03.05
During the following pages, these software packages will be referred to by the term X-Tools.
1.3
Audience
This document is intended for personnel involved in the commissioning and using of the software:
• X-Tools
English
Release 2012-09
13 / 214
SIPLUS CMS X-Tools - User Manual - 05 - Monitoring System
1.4
SIPLUS CMS
Notations
The following notations are used within this document:
• bold, italic text is being used for the main executables of X-Tools
o examples: X-Tools Client, X-Tools Server
• bold text is being used for the software modules of X-Tools
o examples: Main Management System, Device Profile Editor, IPE Socket T001
• green text is being used for controls like tables and trees
o examples: Main Profile Settings table, Device Profile Data table
• orange text is being used for simple controls like a menu button, a single row/column/cell of a table or a
branch of a tree
o examples: Open… menu button, IP Address column, Target Device Name cell, Interfaces Branch
• dark yellow text is being used for the entries of context menus
o examples: Advanced Append…, Edit
• Camel Notation is being used for major terms of X-Tools
o examples: Main Profile, Interface Profile, User Accounts File, Analyzing Function
• < and > brackets are being used for keyboard keys
o examples: <Ctrl>, <Alt>, <Shift>, <Del>
• [ and ] brackets are being used for mouse operations
o examples: [left mouse button down], [mouse move]
English
Release 2012-09
14 / 214
SIPLUS CMS X-Tools - User Manual - 05 - Monitoring System
2
SIPLUS CMS
Monitoring System
2.1
2.1.1
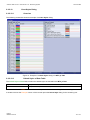
Monitoring System Explorer
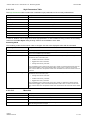
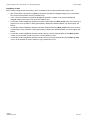
Overview
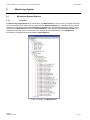
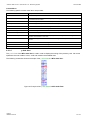
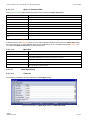
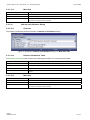
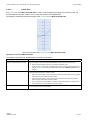
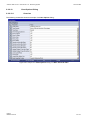
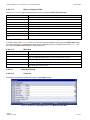
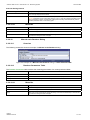
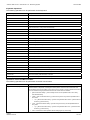
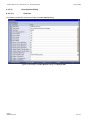
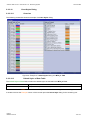
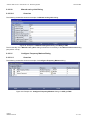
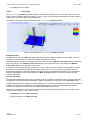
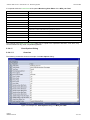
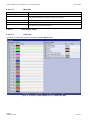
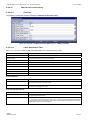
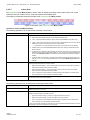
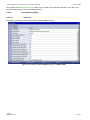
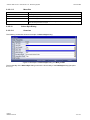
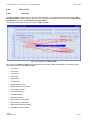
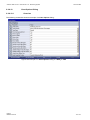
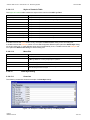
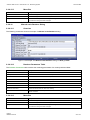
The Monitoring System Explorer (in the following, the MTS Explorer) is used in order to visualize and maintain all of the files and modules which are relevant for the Monitoring System. It is displayed as a tree which
contains all of the relevant and available Monitoring System items. Via Drag&Drop the user is able to move
items within the MTS Explorer and from the MTS Explorer to other dialogs of the Monitoring System. The
following lines provide a short overview about the information that is available from the MTS Explorer.
The following screenshot shows an example of a MTS Explorer:
Figure 1: Example of a MTS Explorer
English
Release 2012-09
15 / 214
SIPLUS CMS X-Tools - User Manual - 05 - Monitoring System
SIPLUS CMS
Each branch of the MTS Explorer has a defined task and provides certain functionalities. The following major
branches are provided by the MTS Explorer:
• Main Branch
• Editors Branch
• Monitoring Charts Branch
• Monitoring Chart Branch
• Monitoring View Editors Branch
• Monitoring View Editor Branch
• Servers Branch
• Server Branch
• Files Branch
• File Location Branch
• Monitoring View Files Branch
• Libraries Branch
• Monitoring Process Modules Branch
• Monitoring Process Module Branch
2.1.2
Main Branch
The one and only Main Branch provides all of the other items of the MTS Explorer. It can be expanded and
collapsed in order to show or hide its sub-items.
2.1.3
Editors Branch
The one and only Editors Branch provides all of the editors which are available within the Monitoring System.
2.1.4
Monitoring Charts Branch
The one and only Monitoring Charts Branch provides all of the Monitoring Charts which are available within
the Monitoring System. The tree of shown Monitoring Charts is updated automatically whenever a chart file
at the local disk is added/removed/modified.
2.1.5
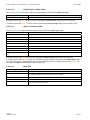
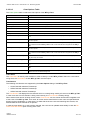
Monitoring Chart Branch
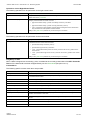
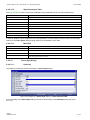
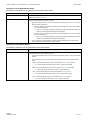
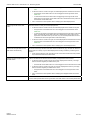
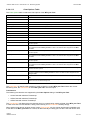
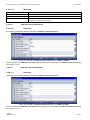
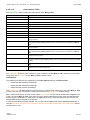
Each Monitoring Chart Branch represents one available Monitoring Chart. Dragging of a Monitoring Chart
Branch into the Monitoring System workspace opens an empty chart of the dragged type. After the chart has
been opened, any of the present data of correct type can be dragged into it for visualization.
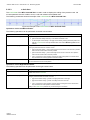
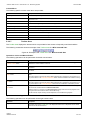
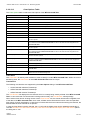
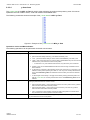
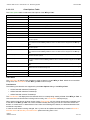
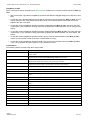
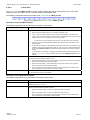
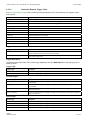
The following specific context menu items are provided:
Context Menu Item
Description
Open
opens a Monitoring View Editor within the Monitoring System workspace, creates a new Monitoring View, initializes it with default values and opens an empty Monitoring Chart of the chosen
type within the new Monitoring View
New Monitoring View > …
opens a Monitoring View Editor within the Monitoring System workspace, creates a new Monitoring View, initializes it with default values and opens an empty Monitoring Chart of the chosen
type within the new Monitoring View
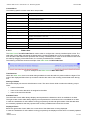
2.1.6
Monitoring View Editors Branch
The one and only Monitoring View Editors Branch provides all of the Monitoring View Editors which are available within the Monitoring System. The tree of shown Monitoring View Editors is updated automatically
whenever an editor file at the local disk is added/removed/modified.
English
Release 2012-09
16 / 214
SIPLUS CMS X-Tools - User Manual - 05 - Monitoring System
2.1.7
SIPLUS CMS
Monitoring View Editor Branch
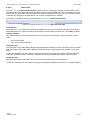
Each Monitoring View Editor Branch represents one available Monitoring View Editor. Dragging of a Monitoring View Editor Branch into the Monitoring System workspace opens an empty editor of the dragged type.
After the editor has been opened, any of the present files of correct type can be dragged into it for visualization
and/or editing.
The following specific context menu items are provided:
Context Menu Item
Description
Open
opens an empty Monitoring Editor of the chosen type within the Monitoring System workspace
New Monitoring View > …
opens a Monitoring View Editor of the chosen type within the Monitoring System workspace,
creates a new Monitoring View and initializes it with default values
2.1.8
Servers Branch
The one and only Servers Branch provides all of the X-Tools Servers which are connected at the moment. The
tree of shown X-Tools Servers is updated automatically whenever an X-Tools Server is attached or detached.
2.1.9
Server Branch
Each Server Branch represents one of the currently connected X-Tools Servers.
2.1.10
Files Branch
The Files Branch of each connected X-Tools Server provides all of the files which are available within the
Monitoring System.
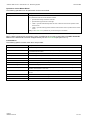
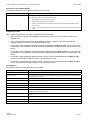
The following specific context menu item is provided:
Context Menu Item
Description
Add Location…
opens the Add Location dialog and adds a new Configuration File location afterwards
2.1.11
File Location Branch
Each File Location Branch provides all of the Monitoring System specific files which are available from the
directory to which the Configuration File location points.
The following specific context menu items are provided:
Context Menu Item
Description
Delete Location
deletes the chosen file location from the hard disk
Remove Location
removes the chosen file location from X-Tools but keeps it at the hard disk
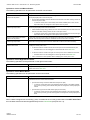
2.1.12
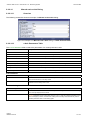
Monitoring View Files Branch
Each Monitoring View Files Branch provides all of the Monitoring Views which are available from the directory to
which its Configuration File location points. The tree of shown Monitoring Views is updated automatically whenever a Monitoring View at the disk is added/deleted/modified.
Drag&Drop can be used in order to copy/move Monitoring View directories and Monitoring View files. The default Drag&Drop operation within an X-Tools Server is “move”, but when the <Ctrl> key is pressed a “copy”
operation is performed. The default Drag&Drop operation from one X-Tools Server to another is “copy”, but
when the <Shift> key is pressed a “move” operation is performed.
Monitoring View directories and Monitoring View files can be copied/moved within Monitoring View Files
Branches (either within one X-Tools Server or over different X-Tools Servers) but they can not be copied/moved to another files branch. As the unique name of each Monitoring View also includes its storage directory, multiple Monitoring Views with matching file names can be stored in different Monitoring View directories.
Dragging of a Monitoring View into the Monitoring System workspace opens the Monitoring View Editor for
the dragged Monitoring View.
In case a Monitoring View Directory Branch (or any of its sub-branches) contains a suspended Monitoring View,
the icon of the Monitoring View Directory Branch shows an according overlay. When there is no suspended
English
Release 2012-09
17 / 214
SIPLUS CMS X-Tools - User Manual - 05 - Monitoring System
SIPLUS CMS
Monitoring View but there is at least one started Monitoring View, the icon of the Monitoring View Directory
Branch shows an according overlay also.
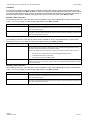
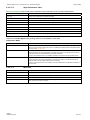
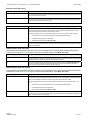
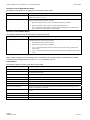
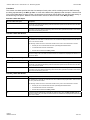
The following specific context menu items are provided:
Context Menu Item
Description
New Monitoring View > …
opens a Monitoring View Editor of the chosen type within the Monitoring System workspace,
creates a new Monitoring View and initializes it with default values
Edit
opens a new Monitoring View Editor for the chosen file within the Monitoring System workspace
Cut
cuts the currently selected items
Copy
copies the currently selected items
Paste
pastes currently copied/cut items
Delete
deletes the selected items from the disk
Rename
allows to rename the selected item directly within the MTS Explorer
New Directory…
opens the Add Directory dialog and creates a new directory afterwards
Start
starts the currently selected items
Restart
restarts (= stops and starts) the currently selected items
Pause
pauses the currently selected items
Continue
continues the currently selected items
Stop
stops the currently selected items
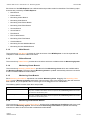
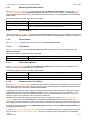
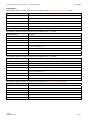
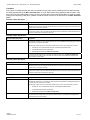
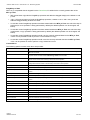
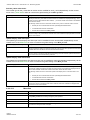
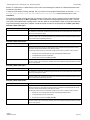
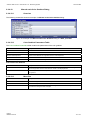
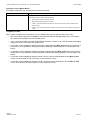
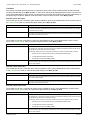
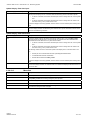
The following icons are provided and indicate the current status of each Monitoring View:
Icon
Description
(stopped)
The Monitoring View is stopped and does not perform any operations.
(started)
The Monitoring View is started and creates a report.
(paused)
When the Monitoring View is paused it finishes an eventually already started report and does not
create any further reports until it is being continued.
(suspended)
The Monitoring View is suspended because it has detected an error condition (e.g. because the
trigger data became unavailable, …). The Monitoring View will resume after the error condition
has been solved.
In case the Monitoring View is suspended and its according Monitoring View File at the disk is
being updated, the updated Monitoring View File is being loaded and the Monitoring View uses
the updated configuration for its further processing.
(triggering)
2.1.13
The Monitoring View is triggering and does not create a report yet. As soon as the specified start
event occurs the creation of the report is being started.
Libraries Branch
The Libraries Branch of each connected X-Tools Server provides all of the libraries which are available for the
Monitoring System.
2.1.14
Monitoring Process Modules Branch
The Monitoring Process Modules Branch of each connected X-Tools Server provides all of the Monitoring
Process Modules which are available for the Monitoring System. The tree of shown Monitoring Process
Modules is updated automatically whenever a Monitoring Process Module at the disk is
added/removed/modified.
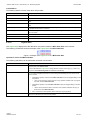
2.1.15
Monitoring Process Module Branch
Each Monitoring Process Module Branch represents one available Monitoring Process Module.
The following specific context menu item is provided:
Context Menu Item
Description
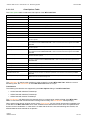
New Monitoring View
opens a Monitoring View Editor within the Monitoring System workspace, creates a new Monitoring View, initializes it with default values and opens an empty Monitoring Chart of the chosen
type within the new Monitoring View
English
Release 2012-09
18 / 214
SIPLUS CMS X-Tools - User Manual - 05 - Monitoring System
2.2
SIPLUS CMS
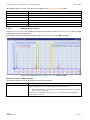
Monitoring Charts
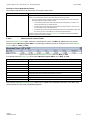
2.2.1
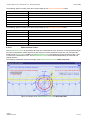
MTC Orbit T001
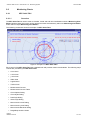
2.2.1.1
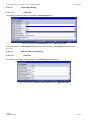
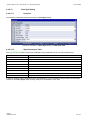
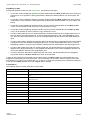
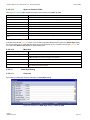
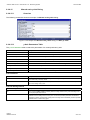
Overview
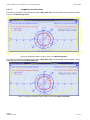
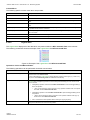
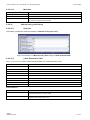
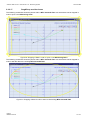
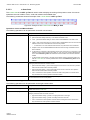
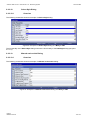
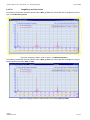
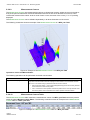
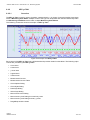
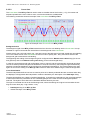
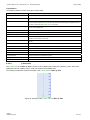
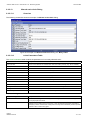
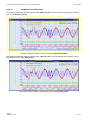
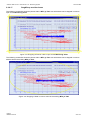
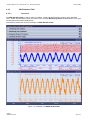
The MTC Orbit T001 is used in order to visualize, create and edit orbit visualizations within a Monitoring View
Editor. Multiple charts of this type can be opened and used simultaneously within one Monitoring View Editor
and/or within multiple Monitoring View Editors.
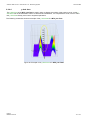
The following screenshot shows an example of a MTC Orbit T001:
Figure 2: Example of a MTC Orbit T001
Each control of the MTC Orbit T001 has a defined task and provides certain functionalities. The following major
controls are provided by the MTC Orbit T001:
• Curve Area
• x-Axis Area
• y-Axis Area
• Slider Area
• Legend Area
• Toolbar Area
• Measurement Cursors
• Measurement Cursors Table
• Chart Options Dialog
• Chart Styles Dialog
• Data Style Dialog
• Select Style Dialog
• Manual scale x-Axis Dialog
• Manual scale y-Axis Dialog
• Manual scale Renderer Dialog
• Drag&Drop sensitive Areas
English
Release 2012-09
19 / 214
SIPLUS CMS X-Tools - User Manual - 05 - Monitoring System
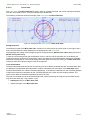
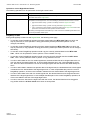
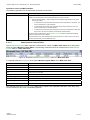
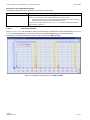
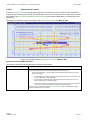
2.2.1.2
SIPLUS CMS
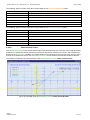
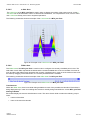
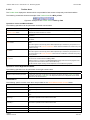
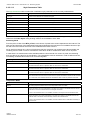
Curve Area
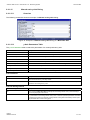
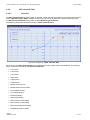
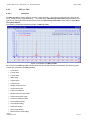
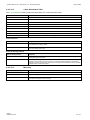
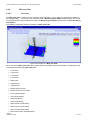
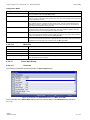
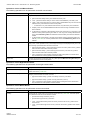
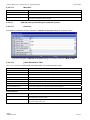
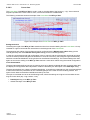
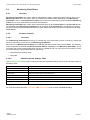
The Curve Area of the MTC Orbit T001 is used in order to visualize orbit data. Via mouse and keyboard operations the user is able to zoom, scroll and maintain the available data.
The following screenshot shows an example of the Curve Area of a MTC Orbit T001:
Figure 3: Example of the Curve Area of a MTC Orbit T001
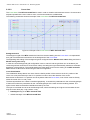
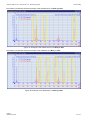
Background Grid
The background grid of the MTC Orbit T001 consists out of circles which have their center in the origin of the xand y-axes and which are being displayed in the background of the Curve Area.
The appearing and scaling of the background grid is configured via the Manual scale x-Axis dialog and via the
Manual scale y-Axis dialog.
In case the current background grid configuration is set to “manual” and the grid lines can not be drawn (because the grid lines would be too close to each other), the background grid automatically switches to automatic
distribution of the grid lines. The manual settings are used again as soon as the scaling of the MTC Orbit T001
reaches a value which allows using the manual configuration.
Curve Visualization
The data interpolation defines how two successive points of an already rendered data are connected when they
are displayed. All supported data interpolation modes are defined by the description of the Data Style dialog.
The data style defines how a data is visualized graphically. It contains the parameters for the color/strength/style
of the line as well as the parameters for the color/strength/style of the mark and the rendering method. The
styles of each data can be defined at different levels by the user.
The style of each data can be set at the following levels, where the settings of a higher level overwrite the settings of a lower level (top = high, bottom = low):
• Data Style dialog of the MTC Orbit T001
• default data style of the MTC Orbit T001
English
Release 2012-09
20 / 214
SIPLUS CMS X-Tools - User Manual - 05 - Monitoring System
SIPLUS CMS
Keyboard Operations
The following operations can be performed via the keyboard:
Keyboard Operation
Description
<+>
zooms into the x- and y-axis simultaneously
<Shift> + <+>
zooms only into the x-axis
<x> + <+>
behaves like <Shift> + <+>
<Ctrl> + <+>
zooms only into the y-axis
<y> + <+>
behaves like <Ctrl> + <+>
<->
zooms out from the x- and y-axis simultaneously
<Shift> + <->
zooms only out from the x-axis
<x> + <->
behaves like <Shift> + <->
<Ctrl> + <->
zooms only out from the y-axis
<y> + <->
behaves like <Ctrl> + <->
<F>
fits the scaling of the x- and y-axis simultaneously
<L>
toggles the aspect ratio between locked and unlocked
<Shift> + <F>
fits the scaling only of the x-axis
<x> + <F>
behaves like <Shift> + <F>
<Ctrl> + <F>
fits the scaling only of the y-axis
<y> + <F>
behaves like <Ctrl> + <F>
<Ctrl> + <Z>
undoes the latest operation from the undo buffer
<Shift> + <Ctrl> + <Z>
undoes all operations from the undo buffer
<Ctrl> + <Y>
redoes the latest operation from the redo buffer
<Shift> + <Ctrl> + <Y>
redoes all operations from the redo buffer
<Cursor left>
in case the measurement cursor is turned on, this key moves the measurement cursor to the next
lower x-value at the curve
<Cursor right>
in case the measurement cursor is turned on, this key moves the measurement cursor to the next
higher x-value at the curve
<Cursor down>
in case the measurement cursor is turned on, this key moves the measurement cursor to the next
lower y-value at the curve
<Cursor up>
in case the measurement cursor is turned on, this key moves the measurement cursor to the next
higher y-value at the curve
Operations via the Left Mouse Button
The following operations can be performed via the left mouse button:
Operation
Description
single click with keeping the button
A single click of the left mouse button with keeping the button starts a zoom operation. While the
left mouse button is kept down, a rectangle is shown in order to indicate the zooming area. The
actual zooming is performed when the left mouse button is released:
•
[left mouse button down] + [mouse move] zooms into the specified area of the x- and yaxis simultaneously
•
<Shift> + [left mouse button down] + [mouse move] zooms only into the specified area of
the x-axis
o
•
<Ctrl> + [left mouse button down] + [mouse move] zooms only into the specified area of
the y-axis
o
•
English
Release 2012-09
<x> + [left mouse button down] + [mouse move] behaves like <Shift> + [left mouse button down] + [mouse move]
<y> + [left mouse button down] + [mouse move] behaves like <Ctrl> + [left mouse button down] + [mouse move]
<Esc> cancels the current operation without changing of any axis scaling
21 / 214
SIPLUS CMS X-Tools - User Manual - 05 - Monitoring System
SIPLUS CMS
Operations via the Right Mouse Button
The following operations can be performed via the right mouse button:
Operation
Description
single click with releasing the button
A single click of the right mouse button with releasing the button above the Curve Area opens the
context menu for the Curve Area.
single click with keeping the button
A single click of the right mouse button with keeping the button starts a shift operation. The actual
shifting is performed when the mouse is moved:
•
[right mouse button down] + [mouse move] moves all curves within the Curve Area into the
direction of the mouse move
o
when the <Shift> key is being pressed during the shift operation, the curves are shifted
only in horizontal direction
o
when the <Ctrl> key is being pressed during the shift operation, the curves are shifted
only in vertical direction
•
when <x> key is being pressed during the shift operation, the behavior is like if the
<Shift> key is being pressed during the shift operation
when <y> key is being pressed during the shift operation, the behavior is like if the
<Shift> key is being pressed during the shift operation
<Esc> cancels the current operation and sets all axes scaling back to the values which
they had before the shift operation had been started
Shifting of the Curve Area is possible only in case the origin is not locked.
Operations via the Mouse Wheel
The following operations can be performed via the mouse wheel:
Operation
Description
scrolling
Scrolling with the mouse wheel can be used to shift or zoom the Curve Area. The actual operation
is performed when the mouse wheel is scrolled:
•
[mouse wheel down] zooms out of the current mouse position of the x- and y-axis simultaneously
•
[mouse wheel up] zooms into the current mouse position of the x- and y-axis simultaneously
•
<Shift> + [mouse wheel down] moves all curves within the Curve Area to the left
o
•
<Shift> + [mouse wheel up] moves all curves within the Curve Area to the right
o
•
<x> + [mouse wheel up] behaves like <Shift> + [mouse wheel up]
<Ctrl> + [mouse wheel down] moves all curves within the Curve Area up
o
•
<x> + [mouse wheel down] behaves like <Shift> + [mouse wheel down]
<y> + [mouse wheel down] behaves like <Ctrl> + [mouse wheel down]
<Ctrl> + [mouse wheel up] moves all curves within the Curve Area down
o
<y> + [mouse wheel up] behaves like <Ctrl> + [mouse wheel up]
Drag&Drop of Data
When a time series data is dropped into the Curve Area, it is added to the currently present data of the MTC
Orbit T001:
• [left mouse button up] ends the Drag&Drop operation and adds the dragged data(s) to the legend.
• In case the current Drag&Drop operation has been started within the MTC Orbit T001 onto which the
drop is performed, a move operation is being performed by default (the default operation can be
changed, see below).
• In case the current Drag&Drop operation has been started outside the MTC Orbit T001 onto which the
drop is performed, a copy operation is being performed by default (the default operation can be changed,
see below).
• In case the current Drag&Drop operation would copy the currently selected data into the MTC Orbit
T001, <Shift> can be pressed in order to perform a move instead of a copy.
• In case the current Drag&Drop operation would move the currently selected data into the MTC Orbit
T001, <Ctrl> can be pressed in order to perform a copy instead of a move.
English
Release 2012-09
22 / 214
SIPLUS CMS X-Tools - User Manual - 05 - Monitoring System
SIPLUS CMS
Context Menu
The following specific context menu items are provided:
Context Menu Item
Description
Fit to Chart
sets the scaling of all t- and y-axes so that the complete values of all data within the MTC Orbit
T001 become visible
Fit to Charts
sets the scaling of all Monitoring Charts within the parent Monitoring View Editor so that the
complete values of all data within all Monitoring Charts become visible
Zoom in
zooms in at all t- and y-axes simultaneously; the new scaling interval is half of the old scaling
interval and the center of the zooming is the current mouse position
Zoom out
zooms out at all t- and y-axes simultaneously; the new scaling interval is the double of the old
scaling interval and the center of the zooming is the current mouse position
Lock Aspect Ratio > …
sets the locking of the aspect ratio to the value which is specified via the submenu of this item
Lock Origin > …
sets the locking of the origin to the value which is specified via the submenu of this item
Manual scale Renderer…
opens the Manual scale Renderer dialog
Chart Options…
opens the Chart Options dialog
Copy Chart Options
copies the options of the MTC Orbit T001 below the current mouse position
Paste Chart Options
pastes the currently copied MTC Orbit T001 options onto the MTC Orbit T001 below the current
mouse position
Chart Styles…
opens the Chart Styles dialog
Copy Chart Styles
copies the styles of the MTC Orbit T001 below the current mouse position
Paste Chart Styles
pastes the currently copied MTC Orbit T001 styles onto the MTC Orbit T001 below the current
mouse position
Show Background Grid > …
sets the visibility of the background grid to the state which is specified via the submenu of this item
Show Legend > …
sets the visibility of the Legend Area to the state which is specified via the submenu of this item
Show Toolbar > …
sets the visibility of the Toolbar Area to the state which is specified via the submenu of this item
Show x-Axis > …
sets the visibility of the t-Axis Area to the state which is specified via the submenu of this item
Show y-Axis > …
sets the visibility of the y-Axis Area to the state which is specified via the submenu of this item
Show Sliders > …
sets the visibility of the Slider Area to the state which is specified via the submenu of this item
Print Screenshot
prints the screenshot of the Monitoring View
Save Screenshot
saves the screenshot of the Monitoring View
Close Chart
closes the MTC Orbit T001
Lock Aspect Ratio
In case the aspect ratio is locked, the scaling of the x- and y-axes always is kept synchronized so that the same
amount of pixels are being used at the x- and y-axes for the same interval of values. Changing of the scaling of
one axis automatically also changes the scaling of the other axis in case the aspect ratio is locked.
Lock Origin
In case the origin is locked, the origin of the x- and y-axes always is being kept in the middle of the MTC Orbit
T001. In this mode, zooming is not possible via the left mouse button except when the left mouse button is being moved directly above an axis. In addition, shifting via the right mouse button is not possible in this mode.
2.2.1.3
x-Axis Area
The x-Axis Area of the MTC Orbit T001 is used in order to display the scaling of the present x-axis. Via mouse
operations the user is able to zoom, scroll and maintain the available data.
The following screenshot shows an example of the x-Axis Area of a MTC Orbit T001:
Figure 4: Example of the x-Axis Area of a MTC Orbit T001
English
Release 2012-09
23 / 214
SIPLUS CMS X-Tools - User Manual - 05 - Monitoring System
SIPLUS CMS
Operations via the Left Mouse Button
The following operations can be performed via the left mouse button:
Operation
Description
single click with releasing the button
Single and multiple x-axis can be selected/deselected through a left mouse button click:
single click with keeping the button
double click
●
[left mouse button down] above any x-axis selects the below x-axis
•
in case the [left mouse button] or the [right mouse button] is being pressed anywhere outside the x-Axis Area, the currently selected items of the clicked Monitoring Chart are deselected
A single click of the left mouse button with keeping the button starts a zoom operation. The actual
zooming is performed when the mouse is moved:
•
[left mouse button down] + [mouse move right] zooms out of the x-axis from the x position
where the left mouse button has been pressed
•
[left mouse button down] + [mouse move left] zooms into the x-axis from the x position
where the left mouse button has been pressed
•
<Esc> cancels the current operation and sets the axes scaling back to the values which
they had before the zooming operation had been started
A double click of the left mouse button onto any x-axis opens the Manual scale x-Axis dialog for
the x-axis below the current mouse position.
Operations via the Right Mouse Button
The following operations can be performed via the right mouse button:
Operation
Description
single click with releasing the button
A single click of the right mouse button with releasing the button above the x-Axis Area opens the
context menu for the x-Axis Area.
single click with keeping the button
A single click of the right mouse button with keeping the button starts a shift operation. The actual
shifting is performed when the mouse is moved:
•
[right mouse button down] + [mouse move right] moves the x-axis right
•
[right mouse button down] + [mouse move left] moves the x-axis left
•
<Esc> cancels the current operation and sets all axes scaling back to the values which
they had before the shift operation had been started
Shifting of the x-Axis Area is possible only in case the origin is not locked.
Operations via the Mouse Wheel
The following operations can be performed via the mouse wheel:
Operation
Description
scrolling
Scrolling with the mouse wheel can be used to shift or zoom the x-Axes Area. The actual operation is performed when the mouse wheel is scrolled:
•
[mouse wheel down] moves the x-axis left
•
[mouse wheel up] moves the x-axis right
•
<Shift> + [mouse wheel down] zooms out of the x-axis from the current x position of the
mouse cursor
•
<Shift> + [mouse wheel up] zooms into the x-axis from the current x position of the mouse
cursor
Shifting of the x-Axis Area is possible only in case the origin is not locked.
Drag&Drop of Data
When a data is dropped onto an existing x-axis, it is added to the currently present data of the MTC Orbit T001
as if the data would have been dropped directly into the Curve Area (see point 2.2.1.2).
English
Release 2012-09
24 / 214
SIPLUS CMS X-Tools - User Manual - 05 - Monitoring System
SIPLUS CMS
Context Menu
The following specific context menu items are provided:
Context Menu Item
Description
Show x-Axis > …
sets the visibility of the x-Axis Area to the state which is specified via the submenu of this item
Auto scale Axis > …
sets whether the x-axis shall automatically adopt its scaling so that always the complete values of
its contained data are visible
Fit to Axis
sets the scaling of the x-axis so that the complete values of its contained data are visible
Lock Aspect Ratio > …
sets the locking of the aspect ratio to the value which is specified via the submenu of this item
Manual scale Renderer…
opens the Manual scale Renderer dialog
Manual scale x-Axis…
opens the Manual scale x-Axis dialog
Copy x-Axis Scaling
copies the scaling of the x-axis below the current mouse position
Paste x-Axis Scaling
pastes the currently copied x-axis scaling onto the x-axis below the current mouse position
Rescale x-Axis after Open > …
sets the rescale type of the x-axis after opening of the Monitoring View File to the type which is
specified via the submenu of this item
Rescale x-Axis after Action > …
sets the rescale type of the x-axis after an action to the type which is specified via the submenu of
this item
Print Screenshot
prints the screenshot of the Monitoring View
Save Screenshot
saves the screenshot of the Monitoring View
Close Chart
closes the MTC Orbit T001
2.2.1.4
y-Axis Area
The y-Axis Area of the MTC Orbit T001 is used in order to display the scaling of the present y-axis. Via mouse
operations the user is able to zoom, scroll and maintain the available data.
The following screenshot shows an example of the y-Axis Area of a MTC Orbit T001:
Figure 5: Example of the y-Axis Area of a MTC Orbit T001
English
Release 2012-09
25 / 214
SIPLUS CMS X-Tools - User Manual - 05 - Monitoring System
SIPLUS CMS
Operations via the Left Mouse Button
The following operations can be performed via the left mouse button:
Operation
Description
single click with releasing the button
Single and multiple y-axis can be selected/deselected through a left mouse button click:
single click with keeping the button
double click
●
[left mouse button down] above any y-axis selects the below y-axis
•
in case the [left mouse button] or the [right mouse button] is being pressed anywhere outside the y-Axis Area, the currently selected items of the clicked Monitoring Chart are deselected
A single click of the left mouse button with keeping the button starts a zoom operation. The actual
zooming is performed when the mouse is moved:
•
[left mouse button down] + [mouse move down] zooms out of the y-axis from the y position
where the left mouse button has been pressed
•
[left mouse button down] + [mouse move up] zooms into the y-axis from the y position
where the left mouse button has been pressed
•
<Esc> cancels the current operation and sets the axes scaling back to the values which
they had before the zooming operation had been started
A double click of the left mouse button onto any y-axis opens the Manual scale y-Axis dialog for
the y-axis below the current mouse position.
Operations via the Right Mouse Button
The following operations can be performed via the right mouse button:
Operation
Description
single click with releasing the button
A single click of the right mouse button with releasing the button above the y-Axis Area opens the
context menu for the y-Axis Area.
single click with keeping the button
A single click of the right mouse button with keeping the button starts a shift operation. The actual
shifting is performed when the mouse is moved:
•
[right mouse button down] + [mouse move down] moves the y-axis down
•
[right mouse button down] + [mouse move up] moves the y-axis up
•
<Esc> cancels the current operation and sets all axes scaling back to the values which
they had before the shift operation had been started
Shifting of the y-Axis Area is possible only in case the origin is not locked.
Operations via the Mouse Wheel
The following operations can be performed via the mouse wheel:
Operation
Description
scrolling
Scrolling with the mouse wheel can be used to shift or zoom the y-Axis Area. The actual operation
is performed when the mouse wheel is scrolled:
•
[mouse wheel down] moves the y-axis up
•
[mouse wheel up] moves the y-axis down
•
<Ctrl> + [mouse wheel down] zooms out of the y-axis from the current y position of the
mouse cursor
•
<Ctrl> + [mouse wheel up] zooms into the y-axis from the current y position of the mouse
cursor
Shifting of the y-Axis Area is possible only in case the origin is not locked.
Drag&Drop of Data
When a data is dropped onto an existing y-axis, it is added to the currently present data of the MTC Orbit T001
as if the data would have been dropped directly into the Curve Area (see point 2.2.1.2).
English
Release 2012-09
26 / 214
SIPLUS CMS X-Tools - User Manual - 05 - Monitoring System
SIPLUS CMS
Context Menu
The following specific context menu items are provided:
Context Menu Item
Description
Show y-Axis > …
sets the visibility of the y-Axis Area to the state which is specified via the submenu of this item
Auto scale Axis > …
sets whether the y-axis shall automatically adopt its scaling so that always the complete values of
its contained data are visible
Fit to Axis
sets the scaling of the y-axis so that the complete values of its contained data are visible
Lock Aspect Ratio > …
sets the locking of the aspect ratio to the value which is specified via the submenu of this item
Manual scale Renderer
opens the Manual scale Renderer dialog
Manual scale y-Axis…
opens the Manual scale y-Axis dialog
Copy y-Axis Scaling
copies the scaling of the y-axis below the current mouse position
Paste y-Axis Scaling
pastes the currently copied y-axis scaling onto the y-axis below the current mouse position
Rescale y-Axis after Open > …
sets the rescale type of the y-axis after opening of the Monitoring View File to the type which is
specified via the submenu of this item
Rescale y-Axis after Action > …
sets the rescale type of the y-axis after an action to the type which is specified via the submenu of
this item
Print Screenshot
prints the screenshot of the Monitoring View
Save Screenshot
saves the screenshot of the Monitoring View
Close Chart
closes the MTC Orbit T001
2.2.1.5
Slider Area
The Slider Area of the MTC Orbit T001 is used in order to configure the currently visualized point in time. The
total width of each slider represents the oldest and the newest available time of the current data of its time domain and the inside slider button represents the currently visualized point in time out of the total time interval of
the data. By dragging of the slider button, the currently visualized time is modified.
The following screenshot shows an example of the Slider Area of a MTC Orbit T001:
Figure 6: Example of the Slider Area of a MTC Orbit T001
Time Domains
Within the Slider Area, there is one slider being available for each data which is present within the legend. The
order of the displayed sliders from top to bottom matches the order of the currently present data within the legend.
Naming of Sliders
Each slider displays its name at its left bottom corner. The name of each slider contains the following components:
• number of the slider
• name of the x-axis data which is assigned to the slider
• name of the used time domain
Available Times
The left border of each slider always displays and represents the oldest time which is available for its data.
The right border of each slider always displays and represents the newest time which is available for its data.
In case the visualization of online data is running (not paused), the left and right borders of the affected slider
are constantly updated so that they represent the currently available time interval of their data.
Displayed Times
Below the right border of each slider, the current time of the slider button is being displayed.
In case the visualization of online data is running (not paused), the displayed current time is constantly updated.
English
Release 2012-09
27 / 214
SIPLUS CMS X-Tools - User Manual - 05 - Monitoring System
SIPLUS CMS
Operations via the Left Mouse Button
The following operations can be performed via the left mouse button:
Operation
Description
single click with releasing the button
onto the left step button
A single click of the left mouse button with releasing the button above the left step button shifts the
currently displayed point in time into the past:
•
the next older timestamp from the data at the time domain of the slider is being chosen as
new current point in time
○
single click with releasing the button
onto the right step button
in case the current point in time already is the oldest available point in time, the left
step button does not change the current point in time any more
A single click of the left mouse button with releasing the button above the right step button shifts
the currently displayed point in time into the future:
•
without additional keys being pressed, the next newer timestamp from the data at the time
domain of the slider is being chosen as new current point in time
○
in case the current point in time already is the newest available point in time, the right
step button does not change the current point in time any more
single click with keeping the button
onto the left step button
A single click of the left mouse button with keeping the button down onto the left step button behaves like if the left step button would be clicked with the left mouse button constantly.
single click with keeping the button
onto the right step button
A single click of the left mouse button with keeping the button down onto the right step button
behaves like if the right step button would be clicked with the left mouse button constantly.
single click with keeping the button
onto the slider button
A single click of the left mouse button with keeping the button down onto the slider button allows
to modify the current point in time:
•
in case the mouse is moved to the left, the current point in time is shifted into the past
○
•
in case the mouse is moved to the right, the current point in time is shifted into the future
○
•
the slider button can not be dragged out of the left border of the Slider Area
the slider button can not be dragged out of the right border of the Slider Area
<Esc> cancels the current operation without modifying the current point in time
Operations via the Right Mouse Button
The following operation can be performed via the right mouse button:
Operation
Description
single click with releasing the button
A single click of the right mouse button with releasing the button above the Slider Area opens the
context menu for the Slider Area.
Operations via the Mouse Wheel
The following operations can be performed via the mouse wheel:
Operation
Description
scrolling
Scrolling with the mouse wheel can be used to shift or zoom the Slider Area. The actual operation
is performed when the mouse wheel is scrolled:
•
[mouse wheel down] moves the slider button left (into the past)
○
•
in case the current begin time of the displayed interval already is the oldest available
point in time (or older), [mouse wheel down] does not change the currently displayed
interval
[mouse wheel up] moves the slider button right (into the future)
○
in case the current end time of the displayed interval already is the newest available
point in time (or newer), [mouse wheel up] does not change the currently displayed interval
Drag&Drop of Data
When a data is dropped onto an existing y-axis, it is added to the currently present data of the MTC Orbit T001
as if the data would have been dropped directly into the Curve Area (see point 2.2.1.2).
English
Release 2012-09
28 / 214
SIPLUS CMS X-Tools - User Manual - 05 - Monitoring System
SIPLUS CMS
Context Menu
The following specific context menu items are provided:
Context Menu Item
Description
Show Sliders > …
sets the visibility of the Slider Area to the state which is specified via the submenu of this item
Manual scale Renderer…
opens the Manual scale Renderer dialog
Pause Visualization
pauses the visualization, which pauses the automatic update of all data which belongs to this
slider
Continue Visualization
continues the visualization, which continues the automatic update of all data which belongs to this
slider
Update Display Time after Open > …
sets the update type of the display time after opening of the Monitoring View File to the type which
is specified via the submenu of this item
Update Display Time after Action > … sets the update type of the display time after an action to the type which is specified via the submenu of this item
Print Screenshot
prints the screenshot of the Monitoring View
Save Screenshot
saves the screenshot of the Monitoring View
Close Chart
closes the MTC Orbit T001
2.2.1.6
Legend Area
The Legend Area displays all of the data which are present within the MTC Orbit T001 at the moment.
The following screenshot shows an example of the Legend Area of a MTC Orbit T001:
Figure 7: Example of the Legend Area of a MTC Orbit T001
Operations via the Left Mouse Button
The following operations can be performed via the left mouse button:
Operation
Description
single click with releasing the button
Selecting of data within the Legend Area is performed identically to the selecting of items within
the other trees of the X-Tools Client.
In case a data within the Legend Area is being selected, all items of other type (e.g. x-axis and yaxis) of the clicked Monitoring Chart are deselected automatically.
single click with keeping the button
A single click of the left mouse button with keeping the button down onto any text within the Legend Area starts a Drag&Drop operation for the currently selected data(s) as soon as the mouse
cursor is moved:
•
a Drag&Drop operation within the same MTC Orbit T001 moves the dragged data(s) to the
new position
o
•
a Drag&Drop operation to another MTC Orbit T001 copies the dragged data(s) to the new
position
o
•
double click
English
Release 2012-09
<Ctrl> can be pressed in order to execute a copy operation instead of the move operation within the same MTC Orbit T001
<Shift> can be pressed in order to execute a move operation instead of the copy operation to the other MTC Orbit T001
<Esc> cancels the current operation without moving or copying anything
A double click of the left mouse button onto any text within the Legend Area opens the Data Style
dialog for the data below the current mouse position.
29 / 214
SIPLUS CMS X-Tools - User Manual - 05 - Monitoring System
SIPLUS CMS
Operations via the Right Mouse Button
The following operations can be performed via the right mouse button:
Operation
Description
single click with releasing the button
A single click of the right mouse button with releasing the button above the Legend Area opens
the context menu for the Legend Area.
single click with keeping the button
A single click of the right mouse button with keeping the button above the Legend Area starts a
shift operation for the legend texts. The actual shifting is performed when the mouse is moved:
•
[right mouse button down] + [mouse move down] moves the Legend Area down
•
[right mouse button down] + [mouse move up] moves the Legend Area up
•
<Esc> cancels the current operation and sets the position of the Legend Area back to the
place which it had before the shift operation had been started
The shifting of the legend texts is enabled only in case not all of the available legend texts fit into
the currently available vertical space.
Drag&Drop of Data
During all Drag&Drop of data into the Legend Area, the following rules apply:
• In case the current Drag&Drop operation has been started within the MTC Orbit T001 onto which the
drop is performed, a move operation is being performed by default (the default operation can be
changed, see below).
• In case the current Drag&Drop operation has been started outside the MTC Orbit T001 onto which the
drop is performed, a copy operation is being performed by default (the default operation can be changed,
see below).
• In case the current Drag&Drop operation would copy the currently selected data into the MTC Orbit
T001, <Shift> can be pressed in order to perform a move instead of a copy.
• In case the current Drag&Drop operation would move the currently selected data into the MTC Orbit
T001, <Ctrl> can be pressed in order to perform a copy instead of a move.
• In order to add a data as root of a certain legend tree, the desired data has to be dropped above the current root data of the target legend tree. In case multiple data take part in the current Drag&Drop operation, the first of them becomes the new root of the target legend tree and all others are listed directly below it.
• In order to add a data in between two present data of the legend tree, the desired data has to be dropped
in between the two desired data of the target legend tree. In case multiple data take part in the current
Drag&Drop operation, all of them are inserted in between the two desired data of the target legend tree.
• In order to add a data at the end of a certain legend tree, the desired data has to be dropped below the
last data of the target legend tree. In case multiple data take part in the current Drag&Drop operation, all
of them are added to the end of the target legend tree.
• In order to remove a data from the legend tree with the mouse, the desired data has to be dragged to
any position within the X-Tools Client which does not accept data.
English
Release 2012-09
30 / 214
SIPLUS CMS X-Tools - User Manual - 05 - Monitoring System
SIPLUS CMS
Context Menu
The following specific context menu items are provided:
Context Menu Item
Description
Show Legend > …
sets the visibility of the legend to the state which is specified via the submenu of this item
Show Data Sources > …
specifies whether the legend trees shall display the name of the source server together with the
data name or not
Show Smax > …
specifies whether the vector of Smax shall be shown within the Curve Area or not
Show Spp > …
specifies whether the vector of Spp shall be shown within the Curve Area or not
Set Cursor Data
assigns the measurement cursor to this orbit data
Data Style…
opens the Data Style dialog for the selected data(s)
Copy Data Style
copies the style of the data below the current mouse position
Paste Data Style
pastes the currently copied data style onto the data below the current mouse position
Remove Data
removes the selected data(s) from the MTC Orbit T001
Print Screenshot
prints the screenshot of the Monitoring View
Save Screenshot
saves the screenshot of the Monitoring View
Close Chart
closes the MTC Orbit T001
2.2.1.7
Toolbar Area
The Toolbar Area displays the buttons which are provided for fast access to frequently used functionalities.
The following screenshot shows an example of the Toolbar Area of a MTC Orbit T001:
Figure 8: Example of the Toolbar Area of a MTC Orbit T001
Operations via the Left Mouse Button
The following operations can be performed via the left mouse button:
Operation
Description
single click onto the On/Off Measurement Cursors button
A single click of the left mouse button onto the On/Off Measurement Cursors button toggles the
measurement cursor between on and off.
single click onto the Undo button
A single click of the left mouse button onto the Undo button undoes the last operation from the
undo buffer.
single click onto the Redo button
A single click of the left mouse button onto the Redo button redoes the last operation from the
redo buffer.
single click onto the Continue Visualization button
A single click of the left mouse button onto the Continue Visualization button continues the visualization.
This button applies to all currently present data independently to whether they are paused or running at the moment. The Continue Visualization button sets the visualization of all data to running.
single click onto the Pause Visualization button
A single click of the left mouse button onto the Pause Visualization button pause the visualization.
This button applies to all currently present data independently to whether they are paused or running at the moment. The Pause Visualization button sets the visualization of all data to paused.
single click onto the Store Data Snap- A single click of the left mouse button onto the Store Data Snapshot button starts the storing of the
shot button
data which are contained within the MTC Orbit T001.
While the storing is in progress, the Storage Progress dialog shows the current progress of the
storing and also can be used in order to cancel the storing.
See also tutorial, chapter “Storing of Data Snapshots out of the Monitoring System”.
Operations via the Right Mouse Button
The following operations can be performed via the right mouse button:
Operation
Description
single click with releasing the button
A single click of the right mouse button with releasing the button above the Toolbar Area opens
the context menu for the Toolbar Area. The displayed context menu is dependent to the clicked
toolbar button as described below.
English
Release 2012-09
31 / 214
SIPLUS CMS X-Tools - User Manual - 05 - Monitoring System
SIPLUS CMS
Context Menu
The following specific context menu items are provided for the On/Off Measurement Cursors button:
Context Menu Item
Description
Show Toolbar > …
sets the visibility of the toolbar to the state which is specified via the submenu of this item
Show Measurement Cursors > …
sets the visibility of measurement cursor to the state which is specified via the submenu of this
item
Restore Measurement Cursors
restores the positions of the measurement cursor
Print Screenshot
prints the screenshot of the Monitoring View
Save Screenshot
saves the screenshot of the Monitoring View
Close Chart
closes the MTC Orbit T001
The following specific context menu items are provided for the Undo button:
Context Menu Item
Description
Show Toolbar > …
sets the visibility of the toolbar to the state which is specified via the submenu of this item
Undo
undoes the last operation from the undo buffer
Undo all
undoes all operations from the undo buffer
Clear Undo/Redo Buffer
removes all entries from the undo/redo buffer of the MTC Orbit T001
Change Undo/Redo Buffer Size
opens the Chart Options dialog, sets the input focus to the Undo/Redo Buffer Size edit control
and puts it into editing mode
Print Screenshot
prints the screenshot of the Monitoring View
Save Screenshot
saves the screenshot of the Monitoring View
Close Chart
closes the MTC Orbit T001
The following specific context menu items are provided for the Redo button:
Context Menu Item
Description
Show Toolbar > …
sets the visibility of the toolbar to the state which is specified via the submenu of this item
Redo
redoes the last operation from the redo buffer
Redo all
redoes all operations from the redo buffer
Clear Undo/Redo Buffer
removes all entries from the undo/redo buffer of the MTC Orbit T001
Change Undo/Redo Buffer Size
opens the Chart Options dialog, sets the input focus to the Undo/Redo Buffer Size edit control
and puts it into editing mode
Print Screenshot
prints the screenshot of the Monitoring View
Save Screenshot
saves the screenshot of the Monitoring View
Close Chart
closes the MTC Orbit T001
The following specific context menu items are provided for the Pause Visualization button:
Context Menu Item
Description
Show Toolbar > …
sets the visibility of the toolbar to the state which is specified via the submenu of this item
Pause Visualization
pauses the visualization, which stops the automatic update of all data
Continue Visualization
continues the visualization, which continues the automatic update of all data
Print Screenshot
prints the screenshot of the Monitoring View
Save Screenshot
saves the screenshot of the Monitoring View
Close Chart
closes the MTC Orbit T001
English
Release 2012-09
32 / 214
SIPLUS CMS X-Tools - User Manual - 05 - Monitoring System
SIPLUS CMS
The following specific context menu items are provided for the Continue Visualization button:
Context Menu Item
Description
Show Toolbar > …
sets the visibility of the toolbar to the state which is specified via the submenu of this item
Pause Visualization
pauses the visualization, which stops the automatic update of all data
Continue Visualization
continues the visualization, which continues the automatic update of all data
Print Screenshot
prints the screenshot of the Monitoring View
Save Screenshot
saves the screenshot of the Monitoring View
Close Chart
closes the MTC Orbit T001
The following specific context menu items are provided for the Store Data Snapshot button:
Context Menu Item
Description
Show Toolbar > …
sets the visibility of the toolbar to the state which is specified via the submenu of this item
Store Data Snapshot
starts the storing of the data which are contained within the MTC Orbit T001
Data Snapshot Scope > …
sets the scope for data snapshots to the setting which is specified via the submenu of this item
Print Screenshot
prints the screenshot of the Monitoring View
Save Screenshot
saves the screenshot of the Monitoring View
Close Chart
closes the MTC Orbit T001
2.2.1.8
Measurement Cursor
The Measurement Cursor is represented through one 2-dimensional cross, where the cross is placed exactly at
the point of intersection of both dimensions and moves into all four directions from there, until it reaches the
borders of the Curve Area. In addition, the Measurement Cursor also draws a line from the origin of the x- and
y-axes to the 2-dimensional cross. The Measurement Cursor can be shifted independently in horizontal and
vertical direction.
The following screenshot shows an example of the Measurement Cursor of a MTC Orbit T001:
Figure 9: Example of the Measurement Cursor of a MTC Orbit T001
English
Release 2012-09
33 / 214
SIPLUS CMS X-Tools - User Manual - 05 - Monitoring System
SIPLUS CMS
Operations via the Left Mouse Button
The following operations can be performed via the left mouse button:
Operation
Description
single click with keeping the button
A single click of the left mouse button with keeping the button starts a shift operation. The actual
shifting of the measurement cursor is performed when the mouse is moved:
•
[left mouse button down] + [mouse move] shifts the targeted measurement cursor to the
new mouse position
o
in case the left mouse button was pressed above the horizontal line of the cursor, the
cursor is shifted only in vertical direction
o
in case the left mouse button was pressed above the vertical line of the cursor, the
cursor is shifted only in horizontal direction
o
in case the left mouse button was pressed above the point of intersection of both lines
of the cursor, the cursor is shifted in horizontal and vertical direction
The values which are displayed by the Measurement Cursors table are updated automatically
while the measurement cursor is shifted.
The measurement cursor automatically snaps to the exact point of a known value, it can not be
moved to anywhere away from the displayed curve.
2.2.1.9
Measurement Cursors Table
The Measurement Cursors table contains the measurement values of all MTC Orbit T001s which are present
within the parent Monitoring View Editor. The following screenshot shows an example for the Measurement
Cursors table for a MTC Orbit T001:
Figure 10: Example of a Measurement Cursors Table of a MTC Orbit T001
It is opened within the Cursor Area of the parent Monitoring View Editor of the MTC Orbit T001:
Column
Description
No.
contains the row number
Chart
contains the name of the chart from which the data comes
Data
contains the name of the data
Unit
contains the unit of the data
|Cursor|
contains the norm between the origin of the Curve Area and the point of intersection of the cursor
Angle Cursor [°]
contains the angle between the origin of the Curve Area and the point of intersection of the cursor
|Smax|
contains the norm between the origin of the Curve Area and Smax
Agnle Smax [°]
contains the angle between the origin of the Curve Area and Smax
|Spp|
contains the norm of Spp
The contents of the Measurement Cursors table can be copied to the clipboard of Windows. From there, they
can be inserted into any other compatible application.
English
Release 2012-09
34 / 214
SIPLUS CMS X-Tools - User Manual - 05 - Monitoring System
2.2.1.10
2.2.1.10.1
SIPLUS CMS
Chart Options Dialog
Overview
The following screenshot shows an example of a Chart Options dialog:
Figure 11: Example of a Chart Options Dialog of a MTC Orbit T001
English
Release 2012-09
35 / 214
SIPLUS CMS X-Tools - User Manual - 05 - Monitoring System
2.2.1.10.2
SIPLUS CMS
Chart Options Table
The Chart Options table contains the chart options of the MTC Orbit T001:
Parameter
Description
Chart Name
allows to enter a name for the chart
Time Domain
allows to choose the time domain
Time Base
allows to choose the time base
Show Background Grid
allows to choose whether the background grid shall be shown within the Curve Area
Show Legend
allows to choose whether the Legend Area shall be shown
Show Toolbar
allows to choose whether the Toolbar Area shall be shown
Show x-Axis
allows to choose whether the x-Axis Area shall be shown
Show y-Axis
allows to choose whether the y-Axis Area shall be shown
Show Sliders
allows to choose whether the Slider Area shall be shown
Rescale x-Axis after Open
allows to choose whether the x-axis shall be scaled automatically after the Monitoring View File
has been opened
Rescale x-Axis after Action
allows to choose whether the x-axis shall be scaled automatically after the displayed data have
been modified outside the MTC Orbit T001 or after a new data has been dropped into the MTC
Orbit T001
Rescale y-Axis after Open
allows to choose whether the y-axis shall be scaled automatically after the Monitoring View File
has been opened
Rescale y-Axis after Action
allows to choose whether the y-axis shall be scaled automatically after the displayed data have
been modified outside the MTC Orbit T001 or after a new data has been dropped into the MTC
Orbit T001
Update Display Time after Open
allows to choose whether the display time shall be updated automatically after the Monitoring
View File has been opened
Update Display Time after Action
allows to choose whether the display time shall be updated automatically after the displayed data
have been modified outside the MTC Orbit T001 or after a new data has been dropped into the
MTC Orbit T001
Lock Aspect Ratio
sets the locking of the aspect ratio to the value which is specified via the submenu of this item
Lock Origin
sets the locking of the origin to the value which is specified via the submenu of this item
Show Smax
allows to choose whether the vector of Smax shall be shown within the Curve Area
Show Spp
allows to choose whether the vector of Spp shall be shown within the Curve Area
Undo/Redo Buffer Size
allows to enter the total size of undo/redo operations which shall be remembered by the MTC
Orbit T001
Data Snapshot Scope
allows to choose whether data snapshots shall store only the data from the currnet Monitoring
Chart or from the whole Monitoring View
Chart Name
The Chart Name is used by other modules in order to identify a certain MTC Orbit T001. Within the current
Monitoring View, the Chart Name of each MTC Orbit T001 must be unique.
Time Domain
The following time domains are supported by the Chart Options dialog of the MTC Orbit T001:
• Online Data with absolute Timestamps
• Offline Data with absolute Timestamps
• Offline Data with relative Timestamps
The Time Domain cell displays the time domain which is currently being used by all data of the MTC Orbit
T001. In case more than one time domain is being used currently, the Time Domain cell stays empty.
When another time domain is being chosen via the Time Domain cell, the chosen time domain is applied to all
of the data of the MTC Orbit T001. As a result, all data use the data with the known name and specified time
domain for their visualization. In case there is no data with the known name and matching time domain, the
affected data becomes marked as not present.
English
Release 2012-09
36 / 214
SIPLUS CMS X-Tools - User Manual - 05 - Monitoring System
SIPLUS CMS
In case the time domain is being changed, the x-/y-axis and the display time can be updated automatically in
case the Rescale x-Axis after Action, Rescale y-Axis after Action or Rescale Display Time after Action options
are being set to “Yes”.
Time Base
The chosen time base specifies how the time stamps of each probe, which are being stored in GMT internally,
are being represented by the MTC Orbit T001. In case online data is being displayed and the option “Use the
local Time of the Offline Data” is being chosen, the time base for all online data is taken from the time base setting of the Monitoring View (like if “Default” would have been chosen for the time base of the MTC Orbit T001).
Rescale x-Axis after Open
Rescale x-Axis after Open
Description
Yes
In case the rescale mode for the x-axis after open is set to “Yes”, the MTC Orbit T001 automatically rescales its x-axis after the Monitoring View File has been opened so that all values from all
data of the x-axis become visible.
No
In case the rescale mode for the x-axis after open is set to “No”, the MTC Orbit T001 does not
touch the scaling of its x-axis after the Monitoring View File has been opened and leaves it at the
stored values from the Monitoring View File.
Rescale x-Axis after Action
Rescale x-Axis after Action
Description
Yes
In case the rescale mode for the x-axis after an action is set to “Yes”, the MTC Orbit T001 automatically rescales its x-axis after an external action has modified the displayed data so that all
values from the x-axis become visible.
The following actions result in an automatic rescale of the x-axis in case this mode is chosen:
No
•
another part of a contained data has been opened/appended/overwritten
•
a contained data has been recalculated
•
another data is added to the MTC Orbit T001
In case the rescale mode for the x-axis after an action is set to “No”, the MTC Orbit T001 does not
touch the scaling of its x-axis after an external action has modified the displayed and leaves it at
the current values.
Rescale y-Axis after Open
Rescale y-Axis after Open
Description
Yes
In case the rescale mode for the y-axis after open is set to “Yes”, the MTC Orbit T001 automatically rescales its y-axis after the Monitoring View File has been opened so that all values from all
data of the y-axis become visible.
No
In case the rescale mode for the y-axis after open is set to “No”, the MTC Orbit T001 does not
touch the scaling of its y-axis after the Monitoring View File has been opened and leaves it at the
stored values from the Monitoring View File.
Rescale y-Axis after Action
Rescale y-Axis after Action
Description
Yes
In case the rescale mode for the y-axis after an action is set to “Yes”, the MTC Orbit T001 automatically rescales the y-axis after an external action has modified the displayed data so that all
values from the y-axis become visible.
The following actions result in an automatic rescale of the y-axis in case this mode is chosen:
No
English
Release 2012-09
•
another part of a contained data has been opened/appended/overwritten
•
a contained data has been recalculated
•
another data is added to the MTC Orbit T001
In case the rescale mode for the y-axis after an action is set to “No”, the MTC Orbit T001 does not
touch the scaling of its y-axis after an external action has modified the displayed data and leaves it
at the current values.
37 / 214
SIPLUS CMS X-Tools - User Manual - 05 - Monitoring System
SIPLUS CMS
Update Display Time after Open
Update Display Time after Open
Description
Yes
In case the update mode for the display time after open is set to “Yes”, the MTC Orbit T001 automatically sets its display time to the newest available point in time after the Monitoring View File
has been opened.
No
In case the update mode for the display time after open is set to “No”, the MTC Orbit T001 does
not touch the display time after the Monitoring View File has been opened and leaves it at the
stored value from the Monitoring View File.
Update Display Time after Action
Update Display Time after Action
Description
Yes
In case the update mode for the display time after an action is set to “Yes”, the MTC Orbit T001
automatically sets its display time to the newest available point in time after an external action has
modified the displayed data so that all values from the y-axis become visible.
The following actions result in an automatic update of the display time in case this mode is chosen:
No
2.2.1.10.3
•
another part of a contained data has been opened/appended/overwritten
•
a contained data has been recalculated
•
another data is added to the MTC Orbit T001
In case the update mode for the display time after an action is set to “No”, the MTC Orbit T001
does not touch the display time after an external action has modified the displayed data and
leaves it at the current value.
Menu Bar
Menu Button
Description
Restore Defaults
Sets all options back to their default settings.
Set as Standard
Sets the current options as standard options for each new MTC Orbit T001. The options of already existing MTC Orbit T001s are not being changed by this operation.
OK
Closes the dialog and takes over all user inputs.
Cancel
Closes the dialog and discards all user inputs.
Apply
Takes over all user inputs without closing the dialog. This control is enabled only in case the settings within the dialog have been changed.
English
Release 2012-09
38 / 214
SIPLUS CMS X-Tools - User Manual - 05 - Monitoring System
2.2.1.11
2.2.1.11.1
SIPLUS CMS
Chart Styles Dialog
Overview
The following screenshot shows an example of a Chart Styles dialog:
Figure 12: Example of a Chart Styles Dialog of a MTC Orbit T001
2.2.1.11.2
Default Styles of Data Table
The Default Styles of Data table contains the default styles of data within the MTC Orbit T001:
Parameter
Description
Data #01 … Data #32
displays the currently chosen color and style for the according data
A double-click into the Color column of this control opens the Select Color dialog for the according row.
A double-click into the Example column of this control opens the Select Style dialog for the according row.
English
Release 2012-09
39 / 214
SIPLUS CMS X-Tools - User Manual - 05 - Monitoring System
2.2.1.11.3
SIPLUS CMS
Styles of Controls Table
The Styles of Controls table contains the styles of the controls of the MTC Orbit T001:
Parameter
Description
Chart Background
displays the currently chosen color for the chart background
Background Grid
displays the currently chosen style for the background grid
Cursor
displays the currently chosen color for the cursor
Axes Color
displays the currently chosen color for the axes
Zooming Frame
displays the currently chosen style for the zooming frame
Text of selected Items (Active)
displays the currently chosen color of the text of active selected items
Text of selected Items (Inactive)
displays the currently chosen color of the text of inactive selected items
Background of selected Items (Active) displays the currently chosen color of the background of active selected items
Background of selected Items (Inactive)
displays the currently chosen color of the background of inactive selected items
A double-click into the Color column of any row opens the Select Color dialog for the according row.
A double-click into the Example column of a row which supports different styles opens the Select Style dialog
for the according row. In case different styles are not supported by a row, a double-click into the Example column opens the Select Color dialog for the according row.
2.2.1.11.4
Menu Bar
Menu Button
Description
Restore Defaults
Sets all styles back to their default settings.
Set as Standard
Sets the current styles as standard styles for each new MTC Orbit T001. The styles of already
existing MTC Orbit T001s are not being changed by this operation.
OK
Closes the dialog and takes over all user inputs.
Cancel
Closes the dialog and discards all user inputs.
Apply
Takes over all user inputs without closing the dialog. This control is enabled only in case the styles
within the dialog have been changed.
2.2.1.12
2.2.1.12.1
Data Style Dialog
Overview
The following screenshot shows an example of a Data Style dialog:
Figure 13: Example of a Data Style Dialog of a MTC Orbit T001
English
Release 2012-09
40 / 214
SIPLUS CMS X-Tools - User Manual - 05 - Monitoring System
2.2.1.12.2
SIPLUS CMS
Style Parameters Table
The Style Parameters table contains the visualization style parameters of the currently selected data:
Parameter
Description
Line Type
allows to switch between the available line types
Line Color
allows to enter the desired line color
Line Strength
allows to switch between the available line strengths
Mark Type
allows to switch between the available mark types
Mark Color
allows to enter the desired mark color
Mark Strength
allows to switch between the available mark strengths
Rendering Mode
allows to switch between the available rendering modes
Interpolation Mode
not applicable
Example
displays an example curve according to the specified data style
A value of “Default” can be assigned to each style parameter. In case “Default” is being chosen, the according
value from the Chart Styles dialog is being used for the visualization of the data.
Rendering Mode
The rendering mode can be used in order to configure how the to-be-displayed value shall be calculated.
Rendering Mode
Description
Default
This setting keeps the default value for the rendering mode of the data.
Average Value
When the rendering mode is set to “Average Value”, the arithmetic average value is taken as
value for the visualization (for both axes).
Minimal and Maximal Value (x-Axis)
When the rendering mode is set to “Minimal and Maximal Value (x-Axis)”, the following values are
calculated for each to-be-drawn point:
•
smallest value of the x-axis data
•
biggest value of the x-axis data
•
average value of the y-axis data
In the visualization (and in case the line type is set to “Solid”), a horizontal line is drawn from the
smallest to the biggest x-value at the vertical position of the y-value. In order to connect two
points, a line is drawn from the previous center of the horizontal line to the next center of the horizontal line.
Minimal and Maximal Value (y-Axis)
When the rendering mode is set to “Minimal and Maximal Value (y-Axis)”, the following values are
calculated for each to-be-drawn point:
•
average value of the x-axis data
•
smallest value of the y-axis data
•
biggest value of the y-axis data
In the visualization (and in case the line type is set to “Solid”), a vertical line is drawn from the
smallest to the biggest y-value at the horizontal position of the x-value. In order to connect two
points, a line is drawn from the previous center of the vertical line to the next center of the vertical
line.
2.2.1.12.3
Menu Button
Menu Bar
Description
Restore Defaults
Sets all styles back to their default settings.
OK
Closes the dialog and takes over all user inputs.
Cancel
Closes the dialog and discards all user inputs.
Apply
Takes over all user inputs without closing the dialog. This control is enabled only in case the styles
within the dialog have been changed.
English
Release 2012-09
41 / 214
SIPLUS CMS X-Tools - User Manual - 05 - Monitoring System
2.2.1.13
2.2.1.13.1
SIPLUS CMS
Select Style Dialog
Overview
The following screenshot shows an example of a Select Style dialog:
Figure 14: Example of a Select Style Dialog of a MTC Orbit T001
The functionality of the Select Style dialog matches the functionality of the Data Style dialog (see point
2.2.6.12).
2.2.1.14
2.2.1.14.1
Manual scale x-Axis Dialog
Overview
The following screenshot shows an example of a Manual scale x-Axis dialog:
Figure 15: Example of a Manual scale x-Axis Dialog of a MTC Orbit T001
English
Release 2012-09
42 / 214
SIPLUS CMS X-Tools - User Manual - 05 - Monitoring System
2.2.1.14.2
SIPLUS CMS
x-Axis Parameters Table
The x-Axis Parameters table contains the parameters of a currently selected x-axis:
Parameter
Description
Auto scale Axis
allows to switch between the available auto scale axis modes
Minimum Value
allows to enter the minimum value of the scaling
Minimum Value Exponent
allows to switch between the supported minimum value exponents
Maximum Value
allows to enter the maximum value of the scaling
Maximum Value Exponent
allows to switch between the supported maximum value exponents
Auto set Scaling Interval
allows to switch between the available modes for the automatic scaling interval
Scaling Interval
allows to enter the scaling interval
Scaling Interval Exponent
allows to switch between the supported scaling interval exponents
Minor Scaling Divider
allows to switch between the available minor scaling dividers
Auto scale Axis
Auto scale Axis
Description
On
In this mode, the MTC Orbit T001 constantly sets the scaling of the x-axis so that all available
values of the data at the x-axis stay visible.
Off
In this mode, the MTC Orbit T001 uses the specified Minimum Value and Maximum Value parameters for the scaling of the x-axis.
Auto set Scaling Interval
Auto set Scaling Interval
Description
On
In this mode, the MTC Orbit T001 constantly sets the scaling interval of the x-axis according to
the currently displayed value interval.
Off
In this mode, the MTC Orbit T001 uses the specified Scaling Interval and Scaling Interval Exponent parameters for the scaling interval of the x-axis. In case the specified parameters would lead
to overlapping numbers, the automatic scaling interval is being used automatically until the specified parameters allow a valid scaling again.
2.2.1.14.3
Menu Bar
Menu Button
Description
OK
Closes the dialog and takes over all user inputs.
Cancel
Closes the dialog and discards all user inputs.
Apply
Takes over all user inputs without closing the dialog. This control is enabled only in case the settings within the dialog have been changed.
English
Release 2012-09
43 / 214
SIPLUS CMS X-Tools - User Manual - 05 - Monitoring System
2.2.1.15
SIPLUS CMS
Manual scale y-Axis Dialog
2.2.1.15.1
Overview
The following screenshot shows an example of a Manual scale y-Axis dialog:
Figure 16: Example of a Manual scale y-Axis Dialog of a MTC Orbit T001
2.2.1.15.2
y-Axis Parameters Table
The y-Axis Parameters table contains the parameters of a currently selected y-axis:
Parameter
Description
Auto scale Axis
allows to switch between the available auto scale axis modes
Minimum Value
allows to enter the minimum value of the scaling
Minimum Value Exponent
allows to switch between the supported minimum value exponents
Maximum Value
allows to enter the maximum value of the scaling
Maximum Value Exponent
allows to switch between the supported maximum value exponents
Auto set Scaling Interval
allows to switch between the available modes for the automatic scaling interval
Scaling Interval
allows to enter the scaling interval
Scaling Interval Exponent
allows to switch between the supported scaling interval exponents
Minor Scaling Divider
allows to switch between the available minor scaling dividers
Auto scale Axis
Auto scale Axis
Description
On
In this mode, the MTC Orbit T001 constantly sets the scaling of the y-axis so that all available
values of the data at the y-axis stay visible.
Off
In this mode, the MTC Orbit T001 uses the specified Minimum Value and Maximum Value parameters for the scaling of the y-axis.
Auto set Scaling Interval
Auto set Scaling Interval
Description
On
In this mode, the MTC Orbit T001 constantly sets the scaling interval of the y-axis according to
the currently displayed value interval.
Off
In this mode, the MTC Orbit T001 uses the specified Scaling Interval and Scaling Interval Exponent parameters for the scaling interval of the y-axis. In case the specified parameters would lead
to overlapping numbers, the automatic scaling interval is being used automatically until the specified parameters allow a valid scaling again.
English
Release 2012-09
44 / 214
SIPLUS CMS X-Tools - User Manual - 05 - Monitoring System
2.2.1.15.3
SIPLUS CMS
Menu Bar
Menu Button
Description
OK
Closes the dialog and takes over all user inputs.
Cancel
Closes the dialog and discards all user inputs.
Apply
Takes over all user inputs without closing the dialog. This control is enabled only in case the settings within the dialog have been changed.
2.2.1.16
Manual scale Renderer Dialog
2.2.1.16.1
Overview
The following screenshot shows an example of a Manual scale Renderer dialog:
Figure 17: Example of a Manual scale Renderer Dialog of a MTC Orbit T001
2.2.1.16.2
Renderer Parameters Table
The Renderer Parameters table contains the rendering parameters of a currently selected slider:
Parameter
Description
Target Slider
allows to switch between the available sliders
Display Time Format
allows to switch between the available input formats for the display time
Display Time Value
allows to enter the display time of the scaling
Rendered Points
allows to enter the number of points which shall be calculated by the renderer for each orbit visualization
2.2.1.16.3
Menu Bar
Menu Button
Description
OK
Closes the dialog and takes over all user inputs.
Cancel
Closes the dialog and discards all user inputs.
Apply
Takes over all user inputs without closing the dialog. This control is enabled only in case the settings within the dialog have been changed.
English
Release 2012-09
45 / 214
SIPLUS CMS X-Tools - User Manual - 05 - Monitoring System
2.2.1.17
SIPLUS CMS
Drag&Drop sensitive Areas
The following screenshot shows the places within a MTC Orbit T001 onto which data can be dropped in order
to open a new Monitoring Chart:
Figure 18: Dropping of Data in order to open a new Monitoring Chart
The following screenshot shows the places within a MTC Orbit T001 onto which data can be dropped in order
to add the data to the existing MTC Orbit T001:
Figure 19: Dropping of Data in order to add it to the existing MTC Orbit T001
English
Release 2012-09
46 / 214
SIPLUS CMS X-Tools - User Manual - 05 - Monitoring System
2.2.2
SIPLUS CMS
MTC Vector2D T001
2.2.2.1
Overview
The MTC Vector2D T001 is used in order to visualize, create and edit visualizations of two-dimensional vectors
within a Monitoring View Editor. Multiple charts of this type can be opened and used simultaneously within
one Monitoring View Editor and/or within multiple Monitoring View Editors.
The following screenshot shows an example of a MTC Vector2D T001:
Figure 20: Example of a MTC Vector2D T001
Each control of the MTC Vector2D T001 has a defined task and provides certain functionalities. The following
major controls are provided by the MTC Vector2D T001:
• Curve Area
• x-Axis Area
• y-Axis Area
• Slider Area
• Legend Area
• Toolbar Area
• Measurement Cursors
• Measurement Cursors Table
• Chart Options Dialog
• Chart Styles Dialog
• Data Style Dialog
• Select Style Dialog
• Manual scale x-Axis Dialog
• Manual scale y-Axis Dialog
• Manual scale Renderer Dialog
• Drag&Drop sensitive Areas
English
Release 2012-09
47 / 214
SIPLUS CMS X-Tools - User Manual - 05 - Monitoring System
2.2.2.2
SIPLUS CMS
Curve Area
The Curve Area of the MTC Vector2D T001 is used in order to visualize 2-dimensional vectors. Via mouse and
keyboard operations the user is able to zoom, scroll and maintain the available data.
The following screenshot shows an example of the Curve Area of a MTC Vector2D T001:
Figure 21: Example of the Curve Area of a MTC Vector2D T001
Background Grid
The background grid of the MTC extends the lines from the axis labeling into the Curve Area. It is represented
as a grid of horizontal and vertical lines in the background of the Curve Area.
The appearing and scaling of the background grid is configured via the Manual scale x-Axis dialog and via the
Manual scale y-Axis dialog.
In case the current background grid configuration is set to “manual” and the grid lines can not be drawn (because the grid lines would be too close to each other), the background grid automatically switches to automatic
distribution of the grid lines. The manual settings are used again as soon as the scaling of the MTC Vector2D
T001 reaches a value which allows using the manual configuration.
Curve Visualization
The visualization always draws one vector from the X0/Y0 position of the vector to the X1/Y1 position of the
vector. An arrow points directly to the X1/Y1 position in order to show the direction of the vector.
Both the X0/Y0 and the X1/Y1 position can be anywhere within the Curve Area, none of them must be directly
within the center of the x- and y-axes.
The data style defines how a data is visualized graphically. It contains the parameters for the color/strength/style
of the line as well as the parameters for the color/strength/style of the mark and the rendering method. The
styles of each data can be defined at different levels by the user.
The style of each data can be set at the following levels, where the settings of a higher level overwrite the settings of a lower level (top = high, bottom = low):
• Data Style dialog of the MTC Vector2D T001
• default data style of the MTC Vector2D T001
English
Release 2012-09
48 / 214
SIPLUS CMS X-Tools - User Manual - 05 - Monitoring System
SIPLUS CMS
Keyboard Operations
The following operations can be performed via the keyboard:
Keyboard Operation
Description
<+>
zooms into the x- and y-axis simultaneously
<Shift> + <+>
zooms only into the x-axis
<x> + <+>
behaves like <Shift> + <+>
<Ctrl> + <+>
zooms only into the y-axis
<y> + <+>
behaves like <Ctrl> + <+>
<->
zooms out from the x- and y-axis simultaneously
<Shift> + <->
zooms only out from the x-axis
<x> + <->
behaves like <Shift> + <->
<Ctrl> + <->
zooms only out from the y-axis
<y> + <->
behaves like <Ctrl> + <->
<F>
fits the scaling of the x- and y-axis simultaneously
<L>
toggles the aspect ratio between locked and unlocked
<Shift> + <F>
fits the scaling only of the x-axis
<x> + <F>
behaves like <Shift> + <F>
<Ctrl> + <F>
fits the scaling only of the y-axis
<y> + <F>
behaves like <Ctrl> + <F>
<Ctrl> + <Z>
undoes the latest operation from the undo buffer
<Shift> + <Ctrl> + <Z>
undoes all operations from the undo buffer
<Ctrl> + <Y>
redoes the latest operation from the redo buffer
<Shift> + <Ctrl> + <Y>
redoes all operations from the redo buffer
Operations via the Left Mouse Button
The following operations can be performed via the left mouse button:
Operation
Description
single click with keeping the button
A single click of the left mouse button with keeping the button starts a zoom operation. While the
left mouse button is kept down, a rectangle is shown in order to indicate the zooming area. The
actual zooming is performed when the left mouse button is released:
•
[left mouse button down] + [mouse move] zooms into the specified area of the x- and yaxis simultaneously
•
<Shift> + [left mouse button down] + [mouse move] zooms only into the specified area of
the x-axis
o
•
<Ctrl> + [left mouse button down] + [mouse move] zooms only into the specified area of
the y-axis
o
•
English
Release 2012-09
<x> + [left mouse button down] + [mouse move] behaves like <Shift> + [left mouse button down] + [mouse move]
<y> + [left mouse button down] + [mouse move] behaves like <Ctrl> + [left mouse button down] + [mouse move]
<Esc> cancels the current operation without changing of any axis scaling
49 / 214
SIPLUS CMS X-Tools - User Manual - 05 - Monitoring System
SIPLUS CMS
Operations via the Right Mouse Button
The following operations can be performed via the right mouse button:
Operation
Description
single click with releasing the button
A single click of the right mouse button with releasing the button above the Curve Area opens the
context menu for the Curve Area.
single click with keeping the button
A single click of the right mouse button with keeping the button starts a shift operation. The actual
shifting is performed when the mouse is moved:
•
[right mouse button down] + [mouse move] moves all curves within the Curve Area into the
direction of the mouse move
o
when the <Shift> key is being pressed during the shift operation, the curves are shifted
only in horizontal direction
o
when the <Ctrl> key is being pressed during the shift operation, the curves are shifted
only in vertical direction
•
when <x> key is being pressed during the shift operation, the behavior is like if the
<Shift> key is being pressed during the shift operation
when <y> key is being pressed during the shift operation, the behavior is like if the
<Shift> key is being pressed during the shift operation
<Esc> cancels the current operation and sets all axes scaling back to the values which
they had before the shift operation had been started
Shifting of the Curve Area is possible only in case the origin is not locked.
Operations via the Mouse Wheel
The following operations can be performed via the mouse wheel:
Operation
Description
scrolling
Scrolling with the mouse wheel can be used to shift or zoom the Curve Area. The actual operation
is performed when the mouse wheel is scrolled:
•
[mouse wheel down] zooms out of the current mouse position of the x- and y-axis simultaneously
•
[mouse wheel up] zooms into the current mouse position of the x- and y-axis simultaneously
•
<Shift> + [mouse wheel down] moves all curves within the Curve Area to the left
o
•
<Shift> + [mouse wheel up] moves all curves within the Curve Area to the right
o
•
<x> + [mouse wheel up] behaves like <Shift> + [mouse wheel up]
<Ctrl> + [mouse wheel down] moves all curves within the Curve Area up
o
•
<x> + [mouse wheel down] behaves like <Shift> + [mouse wheel down]
<y> + [mouse wheel down] behaves like <Ctrl> + [mouse wheel down]
<Ctrl> + [mouse wheel up] moves all curves within the Curve Area down
o
<y> + [mouse wheel up] behaves like <Ctrl> + [mouse wheel up]
Drag&Drop of Data
When a time series data is dropped into the Curve Area, it is added to the currently present data of the MTC
Vector2D T001:
• [left mouse button up] ends the Drag&Drop operation and adds the dragged data(s) to the legend.
• In case the current Drag&Drop operation has been started within the MTC Vector2D T001 onto which
the drop is performed, a move operation is being performed by default (the default operation can be
changed, see below).
• In case the current Drag&Drop operation has been started outside the MTC Vector2D T001 onto which
the drop is performed, a copy operation is being performed by default (the default operation can be
changed, see below).
• In case the current Drag&Drop operation would copy the currently selected data into the MTC Vector2D
T001, <Shift> can be pressed in order to perform a move instead of a copy.
• In case the current Drag&Drop operation would move the currently selected data into the MTC Vector2D
T001, <Ctrl> can be pressed in order to perform a copy instead of a move.
English
Release 2012-09
50 / 214
SIPLUS CMS X-Tools - User Manual - 05 - Monitoring System
SIPLUS CMS
Context Menu
The following specific context menu items are provided:
Context Menu Item
Description
Fit to Chart
sets the scaling of all t- and y-axes so that the complete values of all data within the MTC Vector2D T001 become visible
Fit to Charts
sets the scaling of all Monitoring Charts within the parent Monitoring View Editor so that the
complete values of all data within all Monitoring Charts become visible
Zoom in
zooms in at all t- and y-axes simultaneously; the new scaling interval is half of the old scaling
interval and the center of the zooming is the current mouse position
Zoom out
zooms out at all t- and y-axes simultaneously; the new scaling interval is the double of the old
scaling interval and the center of the zooming is the current mouse position
Lock Aspect Ratio > …
sets the locking of the aspect ratio to the value which is specified via the submenu of this item
Lock Origin > …
sets the locking of the origin to the value which is specified via the submenu of this item
Manual scale x-Axis…
opens the Manual scale x-Axis dialog
Manual scale y-Axis…
opens the Manual scale y-Axis dialog
Manual scale Renderer…
opens the Manual scale Renderer dialog
Chart Options…
opens the Chart Options dialog
Copy Chart Options
copies the options of the MTC Vector2D T001 below the current mouse position
Paste Chart Options
pastes the currently copied MTC Vector2D T001 options onto the MTC Vector2D T001 below the
current mouse position
Chart Styles…
opens the Chart Styles dialog
Copy Chart Styles
copies the styles of the MTC Vector2D T001 below the current mouse position
Paste Chart Styles
pastes the currently copied MTC Vector2D T001 styles onto the MTC Vector2D T001 below the
current mouse position
Show Background Grid > …
sets the visibility of the background grid to the state which is specified via the submenu of this item
Show Legend > …
sets the visibility of the Legend Area to the state which is specified via the submenu of this item
Show Toolbar > …
sets the visibility of the Toolbar Area to the state which is specified via the submenu of this item
Show x-Axis > …
sets the visibility of the t-Axis Area to the state which is specified via the submenu of this item
Show y-Axis > …
sets the visibility of the y-Axis Area to the state which is specified via the submenu of this item
Show Sliders > …
sets the visibility of the Slider Area to the state which is specified via the submenu of this item
Print Screenshot
prints the screenshot of the Monitoring View
Save Screenshot
saves the screenshot of the Monitoring View
Close Chart
closes the MTC Vector2D T001
Lock Aspect Ratio
In case the aspect ratio is locked, the scaling of the x- and y-axes always is kept synchronized so that the same
amount of pixels are being used at the x- and y-axes for the same interval of values. Changing of the scaling of
one axis automatically also changes the scaling of the other axis in case the aspect ratio is locked.
Lock Origin
In case the origin is locked, the origin of the x- and y-axes always is being kept in the middle of the MTC Vector2D T001. In this mode, zooming is not possible via the left mouse button except when the left mouse button
is being moved directly above an axis. In addition, shifting via the right mouse button is not possible in this
mode.
English
Release 2012-09
51 / 214
SIPLUS CMS X-Tools - User Manual - 05 - Monitoring System
2.2.2.3
SIPLUS CMS
x-Axis Area
The x-Axis Area of the MTC Vector2D T001 is used in order to display the scaling of the present x-axis. Via
mouse operations the user is able to zoom, scroll and maintain the available data.
The following screenshot shows an example of the x-Axis Area of a MTC Vector2D T001:
Figure 22: Example of the x-Axis Area of a MTC Vector2D T001
Operations via the Left Mouse Button
The following operations can be performed via the left mouse button:
Operation
Description
single click with releasing the button
Single and multiple x-axis can be selected/deselected through a left mouse button click:
single click with keeping the button
double click
●
[left mouse button down] above any x-axis selects the below x-axis
•
in case the [left mouse button] or the [right mouse button] is being pressed anywhere outside the x-Axis Area, the currently selected items of the clicked Monitoring Chart are deselected
A single click of the left mouse button with keeping the button starts a zoom operation. The actual
zooming is performed when the mouse is moved:
•
[left mouse button down] + [mouse move right] zooms out of the x-axis from the x position
where the left mouse button has been pressed
•
[left mouse button down] + [mouse move left] zooms into the x-axis from the x position
where the left mouse button has been pressed
•
<Esc> cancels the current operation and sets the axes scaling back to the values which
they had before the zooming operation had been started
A double click of the left mouse button onto any x-axis opens the Manual scale x-Axis dialog for
the x-axis below the current mouse position.
Operations via the Right Mouse Button
The following operations can be performed via the right mouse button:
Operation
Description
single click with releasing the button
A single click of the right mouse button with releasing the button above the x-Axis Area opens the
context menu for the x-Axis Area.
single click with keeping the button
A single click of the right mouse button with keeping the button starts a shift operation. The actual
shifting is performed when the mouse is moved:
•
[right mouse button down] + [mouse move right] moves the x-axis right
•
[right mouse button down] + [mouse move left] moves the x-axis left
•
<Esc> cancels the current operation and sets all axes scaling back to the values which
they had before the shift operation had been started
Shifting of the x-Axis Area is possible only in case the origin is not locked.
English
Release 2012-09
52 / 214
SIPLUS CMS X-Tools - User Manual - 05 - Monitoring System
SIPLUS CMS
Operations via the Mouse Wheel
The following operations can be performed via the mouse wheel:
Operation
Description
scrolling
Scrolling with the mouse wheel can be used to shift or zoom the x-Axes Area. The actual operation is performed when the mouse wheel is scrolled:
•
[mouse wheel down] moves the x-axis left
•
[mouse wheel up] moves the x-axis right
•
<Shift> + [mouse wheel down] zooms out of the x-axis from the current x position of the
mouse cursor
•
<Shift> + [mouse wheel up] zooms into the x-axis from the current x position of the mouse
cursor
Shifting of the x-Axis Area is possible only in case the origin is not locked.
Drag&Drop of Data
When a data is dropped onto an existing x-axis, it is added to the currently present data of the MTC Vector2D
T001 as if the data would have been dropped directly into the Curve Area (see point 2.2.1.2).
Context Menu
The following specific context menu items are provided:
Context Menu Item
Description
Show x-Axis > …
sets the visibility of the x-Axis Area to the state which is specified via the submenu of this item
Auto scale Axis > …
sets whether the x-axis shall automatically adopt its scaling so that always the complete values of
its contained data are visible
Fit to Axis
sets the scaling of the x-axis so that the complete values of its contained data are visible
Lock Aspect Ratio > …
sets the locking of the aspect ratio to the value which is specified via the submenu of this item
Manual scale Renderer…
opens the Manual scale Renderer dialog
Manual scale x-Axis…
opens the Manual scale x-Axis dialog
Copy x-Axis Scaling
copies the scaling of the x-axis below the current mouse position
Paste x-Axis Scaling
pastes the currently copied x-axis scaling onto the x-axis below the current mouse position
Rescale x-Axis after Open > …
sets the rescale type of the x-axis after opening of the Monitoring View File to the type which is
specified via the submenu of this item
Rescale x-Axis after Action > …
sets the rescale type of the x-axis after an action to the type which is specified via the submenu of
this item
Print Screenshot
prints the screenshot of the Monitoring View
Save Screenshot
saves the screenshot of the Monitoring View
Close Chart
closes the MTC Vector2D T001
English
Release 2012-09
53 / 214
SIPLUS CMS X-Tools - User Manual - 05 - Monitoring System
2.2.2.4
SIPLUS CMS
y-Axis Area
The y-Axis Area of the MTC Vector2D T001 is used in order to display the scaling of the present y-axis. Via
mouse operations the user is able to zoom, scroll and maintain the available data.
The following screenshot shows an example of the y-Axis Area of a MTC Vector2D T001:
Figure 23: Example of the y-Axis Area of a MTC Vector2D T001
Operations via the Left Mouse Button
The following operations can be performed via the left mouse button:
Operation
Description
single click with releasing the button
Single and multiple y-axis can be selected/deselected through a left mouse button click:
single click with keeping the button
double click
English
Release 2012-09
●
[left mouse button down] above any y-axis selects the below y-axis
•
in case the [left mouse button] or the [right mouse button] is being pressed anywhere outside the y-Axis Area, the currently selected items of the clicked Monitoring Chart are deselected
A single click of the left mouse button with keeping the button starts a zoom operation. The actual
zooming is performed when the mouse is moved:
•
[left mouse button down] + [mouse move down] zooms out of the y-axis from the y position
where the left mouse button has been pressed
•
[left mouse button down] + [mouse move up] zooms into the y-axis from the y position
where the left mouse button has been pressed
•
<Esc> cancels the current operation and sets the axes scaling back to the values which
they had before the zooming operation had been started
A double click of the left mouse button onto any y-axis opens the Manual scale y-Axis dialog for
the y-axis below the current mouse position.
54 / 214
SIPLUS CMS X-Tools - User Manual - 05 - Monitoring System
SIPLUS CMS
Operations via the Right Mouse Button
The following operations can be performed via the right mouse button:
Operation
Description
single click with releasing the button
A single click of the right mouse button with releasing the button above the y-Axis Area opens the
context menu for the y-Axis Area.
single click with keeping the button
A single click of the right mouse button with keeping the button starts a shift operation. The actual
shifting is performed when the mouse is moved:
•
[right mouse button down] + [mouse move down] moves the y-axis down
•
[right mouse button down] + [mouse move up] moves the y-axis up
•
<Esc> cancels the current operation and sets all axes scaling back to the values which
they had before the shift operation had been started
Shifting of the y-Axis Area is possible only in case the origin is not locked.
Operations via the Mouse Wheel
The following operations can be performed via the mouse wheel:
Operation
Description
scrolling
Scrolling with the mouse wheel can be used to shift or zoom the y-Axis Area. The actual operation
is performed when the mouse wheel is scrolled:
•
[mouse wheel down] moves the y-axis up
•
[mouse wheel up] moves the y-axis down
•
<Ctrl> + [mouse wheel down] zooms out of the y-axis from the current y position of the
mouse cursor
•
<Ctrl> + [mouse wheel up] zooms into the y-axis from the current y position of the mouse
cursor
Shifting of the y-Axis Area is possible only in case the origin is not locked.
Drag&Drop of Data
When a data is dropped onto an existing y-axis, it is added to the currently present data of the MTC Vector2D
T001 as if the data would have been dropped directly into the Curve Area (see point 2.2.1.2).
Context Menu
The following specific context menu items are provided:
Context Menu Item
Description
Show y-Axis > …
sets the visibility of the y-Axis Area to the state which is specified via the submenu of this item
Auto scale Axis > …
sets whether the y-axis shall automatically adopt its scaling so that always the complete values of
its contained data are visible
Fit to Axis
sets the scaling of the y-axis so that the complete values of its contained data are visible
Lock Aspect Ratio > …
sets the locking of the aspect ratio to the value which is specified via the submenu of this item
Manual scale Renderer
opens the Manual scale Renderer dialog
Manual scale y-Axis…
opens the Manual scale y-Axis dialog
Copy y-Axis Scaling
copies the scaling of the y-axis below the current mouse position
Paste y-Axis Scaling
pastes the currently copied y-axis scaling onto the y-axis below the current mouse position
Rescale y-Axis after Open > …
sets the rescale type of the y-axis after opening of the Monitoring View File to the type which is
specified via the submenu of this item
Rescale y-Axis after Action > …
sets the rescale type of the y-axis after an action to the type which is specified via the submenu of
this item
Print Screenshot
prints the screenshot of the Monitoring View
Save Screenshot
saves the screenshot of the Monitoring View
Close Chart
closes the MTC Vector2D T001
English
Release 2012-09
55 / 214
SIPLUS CMS X-Tools - User Manual - 05 - Monitoring System
2.2.2.5
SIPLUS CMS
Slider Area
The Slider Area of the MTC Vector2D T001 is used in order to configure the currently visualized point in time.
The total width of each slider represents the oldest and the newest available time of the current data of its time
domain and the inside slider button represents the currently visualized point in time out of the total time interval
of the data. By dragging of the slider button, the currently visualized time is modified.
The following screenshot shows an example of the Slider Area of a MTC Vector2D T001:
Figure 24: Example of the Slider Area of a MTC Vector2D T001
Time Domains
Within the Slider Area, there is one slider being available for each of the possible time domains. Each slider is
being displayed only in case its according time domain is actually being used within the current MTC yn T001.
Naming of Sliders
Each slider displays its name at its left bottom corner. The name of each slider contains the following components:
• number of the slider
• name of the used time domain
Available Times
The left border of each slider always displays and represents the oldest time of all of the data of its time domain.
The right border of each slider always displays and represents the newest time of all of the data of its time domain.
In case the visualization of online data is running (not paused), the left and right borders of the affected slider
button are constantly updated so that they represent the currently available time interval of their time axis.
Displayed Times
Below the right border of each slider, the current time of the slider button is being displayed.
In case the visualization of online data is running (not paused), the displayed current time is constantly updated.
English
Release 2012-09
56 / 214
SIPLUS CMS X-Tools - User Manual - 05 - Monitoring System
SIPLUS CMS
Operations via the Left Mouse Button
The following operations can be performed via the left mouse button:
Operation
Description
single click with releasing the button
onto the left step button
A single click of the left mouse button with releasing the button above the left step button shifts the
currently displayed point in time into the past:
•
the next older timestamp from the data at the time domain of the slider is being chosen as
new current point in time
○
single click with releasing the button
onto the right step button
in case the current point in time already is the oldest available point in time, the left
step button does not change the current point in time any more
A single click of the left mouse button with releasing the button above the right step button shifts
the currently displayed point in time into the future:
•
without additional keys being pressed, the next newer timestamp from the data at the time
domain of the slider is being chosen as new current point in time
○
in case the current point in time already is the newest available point in time, the right
step button does not change the current point in time any more
single click with keeping the button
onto the left step button
A single click of the left mouse button with keeping the button down onto the left step button behaves like if the left step button would be clicked with the left mouse button constantly.
single click with keeping the button
onto the right step button
A single click of the left mouse button with keeping the button down onto the right step button
behaves like if the right step button would be clicked with the left mouse button constantly.
single click with keeping the button
onto the slider button
A single click of the left mouse button with keeping the button down onto the slider button allows
to modify the current point in time:
•
in case the mouse is moved to the left, the current point in time is shifted into the past
○
•
in case the mouse is moved to the right, the current point in time is shifted into the future
○
•
the slider button can not be dragged out of the left border of the Slider Area
the slider button can not be dragged out of the right border of the Slider Area
<Esc> cancels the current operation without modifying the current point in time
Operations via the Right Mouse Button
The following operation can be performed via the right mouse button:
Operation
Description
single click with releasing the button
A single click of the right mouse button with releasing the button above the Slider Area opens the
context menu for the Slider Area.
Operations via the Mouse Wheel
The following operations can be performed via the mouse wheel:
Operation
Description
scrolling
Scrolling with the mouse wheel can be used to shift or zoom the Slider Area. The actual operation
is performed when the mouse wheel is scrolled:
•
[mouse wheel down] moves the slider button left (into the past)
○
•
in case the current begin time of the displayed interval already is the oldest available
point in time (or older), [mouse wheel down] does not change the currently displayed
interval
[mouse wheel up] moves the slider button right (into the future)
○
in case the current end time of the displayed interval already is the newest available
point in time (or newer), [mouse wheel up] does not change the currently displayed interval
Drag&Drop of Data
When a data is dropped onto an existing y-axis, it is added to the currently present data of the MTC Vector2D
T001 as if the data would have been dropped directly into the Curve Area (see point 2.2.1.2).
English
Release 2012-09
57 / 214
SIPLUS CMS X-Tools - User Manual - 05 - Monitoring System
SIPLUS CMS
Context Menu
The following specific context menu items are provided:
Context Menu Item
Description
Show Sliders > …
sets the visibility of the Slider Area to the state which is specified via the submenu of this item
Manual scale Renderer…
opens the Manual scale Renderer dialog
Pause Visualization
pauses the visualization, which pauses the automatic update of all data which belongs to this
slider
Continue Visualization
continues the visualization, which continues the automatic update of all data which belongs to this
slider
Update Display Time after Open > …
sets the update type of the display time after opening of the Monitoring View File to the type which
is specified via the submenu of this item
Update Display Time after Action > … sets the update type of the display time after an action to the type which is specified via the submenu of this item
Print Screenshot
prints the screenshot of the Monitoring View
Save Screenshot
saves the screenshot of the Monitoring View
Close Chart
closes the MTC Vector2D T001
2.2.2.6
Legend Area
The Legend Area displays all of the data which are present within the MTC Vector2D T001 at the moment.
The following screenshot shows an example of the Legend Area of a MTC Vector2D T001:
Figure 25: Example of the Legend Area of a MTC Vector2D T001
Operations via the Left Mouse Button
The following operations can be performed via the left mouse button:
Operation
Description
single click with releasing the button
Selecting of data within the Legend Area is performed identically to the selecting of items within
the other trees of the X-Tools Client.
In case a data within the Legend Area is being selected, all items of other type (e.g. x-axis and yaxis) of the clicked Monitoring Chart are deselected automatically.
single click with keeping the button
A single click of the left mouse button with keeping the button down onto any text within the Legend Area starts a Drag&Drop operation for the currently selected data(s) as soon as the mouse
cursor is moved:
•
a Drag&Drop operation within the same MTC Vector2D T001 moves the dragged data(s)
to the new position
o
•
a Drag&Drop operation to another MTC Vector2D T001 copies the dragged data(s) to the
new position
o
•
double click
English
Release 2012-09
<Ctrl> can be pressed in order to execute a copy operation instead of the move operation within the same MTC Vector2D T001
<Shift> can be pressed in order to execute a move operation instead of the copy operation to the other MTC Vector2D T001
<Esc> cancels the current operation without moving or copying anything
A double click of the left mouse button onto any text within the Legend Area opens the Data Style
dialog for the data below the current mouse position.
58 / 214
SIPLUS CMS X-Tools - User Manual - 05 - Monitoring System
SIPLUS CMS
Operations via the Right Mouse Button
The following operations can be performed via the right mouse button:
Operation
Description
single click with releasing the button
A single click of the right mouse button with releasing the button above the Legend Area opens
the context menu for the Legend Area.
single click with keeping the button
A single click of the right mouse button with keeping the button above the Legend Area starts a
shift operation for the legend texts. The actual shifting is performed when the mouse is moved:
•
[right mouse button down] + [mouse move down] moves the Legend Area down
•
[right mouse button down] + [mouse move up] moves the Legend Area up
•
<Esc> cancels the current operation and sets the position of the Legend Area back to the
place which it had before the shift operation had been started
The shifting of the legend texts is enabled only in case not all of the available legend texts fit into
the currently available vertical space.
Drag&Drop of Data
During all Drag&Drop of data into the Legend Area, the following rules apply:
• In case the current Drag&Drop operation has been started within the MTC Vector2D T001 onto which
the drop is performed, a move operation is being performed by default (the default operation can be
changed, see below).
• In case the current Drag&Drop operation has been started outside the MTC Vector2D T001 onto which
the drop is performed, a copy operation is being performed by default (the default operation can be
changed, see below).
• In case the current Drag&Drop operation would copy the currently selected data into the MTC Vector2D
T001, <Shift> can be pressed in order to perform a move instead of a copy.
• In case the current Drag&Drop operation would move the currently selected data into the MTC Vector2D
T001, <Ctrl> can be pressed in order to perform a copy instead of a move.
• In order to add a data as root of a certain legend tree, the desired data has to be dropped above the current root data of the target legend tree. In case multiple data take part in the current Drag&Drop operation, the first of them becomes the new root of the target legend tree and all others are listed directly below it.
• In order to add a data in between two present data of the legend tree, the desired data has to be dropped
in between the two desired data of the target legend tree. In case multiple data take part in the current
Drag&Drop operation, all of them are inserted in between the two desired data of the target legend tree.
• In order to add a data at the end of a certain legend tree, the desired data has to be dropped below the
last data of the target legend tree. In case multiple data take part in the current Drag&Drop operation, all
of them are added to the end of the target legend tree.
• In order to remove a data from the legend tree with the mouse, the desired data has to be dragged to
any position within the X-Tools Client which does not accept data.
English
Release 2012-09
59 / 214
SIPLUS CMS X-Tools - User Manual - 05 - Monitoring System
SIPLUS CMS
Context Menu
The following specific context menu items are provided:
Context Menu Item
Description
Show Legend > …
sets the visibility of the legend to the state which is specified via the submenu of this item
Show Data Sources > …
specifies whether the legend trees shall display the name of the source server together with the
data name or not
Set Cursor Data
assigns the measurement cursor to this 2-dimensional vector data
Data Style…
opens the Data Style dialog for the selected data(s)
Copy Data Style
copies the style of the data below the current mouse position
Paste Data Style
pastes the currently copied data style onto the data below the current mouse position
Remove Data
removes the selected data(s) from the MTC Vector T001
Print Screenshot
prints the screenshot of the Monitoring View
Save Screenshot
saves the screenshot of the Monitoring View
Close Chart
closes the MTC Vector T001
2.2.2.7
Toolbar Area
The Toolbar Area displays the buttons which are provided for fast access to frequently used functionalities.
The following screenshot shows an example of the Toolbar Area of a MTC Vector2D T001:
Figure 26: Example of the Toolbar Area of a MTC Vector2D T001
Operations via the Left Mouse Button
The following operations can be performed via the left mouse button:
Operation
Description
single click onto the On/Off Measurement Cursors button
A single click of the left mouse button onto the On/Off Measurement Cursors button toggles the
measurement cursor between on and off.
single click onto the Undo button
A single click of the left mouse button onto the Undo button undoes the last operation from the
undo buffer.
single click onto the Redo button
A single click of the left mouse button onto the Redo button redoes the last operation from the
redo buffer.
single click onto the Continue Visualization button
A single click of the left mouse button onto the Continue Visualization button continues the visualization.
This button applies to all currently present data independently to whether they are paused or running at the moment. The Continue Visualization button sets the visualization of all data to running.
single click onto the Pause Visualization button
A single click of the left mouse button onto the Pause Visualization button pause the visualization.
This button applies to all currently present data independently to whether they are paused or running at the moment. The Pause Visualization button sets the visualization of all data to paused.
single click onto the Store Data Snap- A single click of the left mouse button onto the Store Data Snapshot button starts the storing of the
shot button
data which are contained within the MTC Vector2D T001.
While the storing is in progress, the Storage Progress dialog shows the current progress of the
storing and also can be used in order to cancel the storing.
See also tutorial, chapter “Storing of Data Snapshots out of the Monitoring System”.
Operations via the Right Mouse Button
The following operations can be performed via the right mouse button:
Operation
Description
single click with releasing the button
A single click of the right mouse button with releasing the button above the Toolbar Area opens
the context menu for the Toolbar Area. The displayed context menu is dependent to the clicked
toolbar button as described below.
English
Release 2012-09
60 / 214
SIPLUS CMS X-Tools - User Manual - 05 - Monitoring System
SIPLUS CMS
Context Menu
The following specific context menu items are provided for the On/Off Measurement Cursors button:
Context Menu Item
Description
Show Toolbar > …
sets the visibility of the toolbar to the state which is specified via the submenu of this item
Show Measurement Cursors > …
sets the visibility of measurement cursor to the state which is specified via the submenu of this
item
Restore Measurement Cursors
restores the position of the measurement cursor
Print Screenshot
prints the screenshot of the Monitoring View
Save Screenshot
saves the screenshot of the Monitoring View
Close Chart
closes the MTC Vector2D T001
The following specific context menu items are provided for the Undo button:
Context Menu Item
Description
Show Toolbar > …
sets the visibility of the toolbar to the state which is specified via the submenu of this item
Undo
undoes the last operation from the undo buffer
Undo all
undoes all operations from the undo buffer
Clear Undo/Redo Buffer
removes all entries from the undo/redo buffer of the MTC Vector2D T001
Change Undo/Redo Buffer Size
opens the Chart Options dialog, sets the input focus to the Undo/Redo Buffer Size edit control
and puts it into editing mode
Print Screenshot
prints the screenshot of the Monitoring View
Save Screenshot
saves the screenshot of the Monitoring View
Close Chart
closes the MTC Vector2D T001
The following specific context menu items are provided for the Redo button:
Context Menu Item
Description
Show Toolbar > …
sets the visibility of the toolbar to the state which is specified via the submenu of this item
Redo
redoes the last operation from the redo buffer
Redo all
redoes all operations from the redo buffer
Clear Undo/Redo Buffer
removes all entries from the undo/redo buffer of the MTC Vector2D T001
Change Undo/Redo Buffer Size
opens the Chart Options dialog, sets the input focus to the Undo/Redo Buffer Size edit control
and puts it into editing mode
Print Screenshot
prints the screenshot of the Monitoring View
Save Screenshot
saves the screenshot of the Monitoring View
Close Chart
closes the MTC Vector2D T001
The following specific context menu items are provided for the Pause Visualization button:
Context Menu Item
Description
Show Toolbar > …
sets the visibility of the toolbar to the state which is specified via the submenu of this item
Pause Visualization
pauses the visualization, which stops the automatic update of all data
Continue Visualization
continues the visualization, which continues the automatic update of all data
Print Screenshot
prints the screenshot of the Monitoring View
Save Screenshot
saves the screenshot of the Monitoring View
Close Chart
closes the MTC Vector2D T001
English
Release 2012-09
61 / 214
SIPLUS CMS X-Tools - User Manual - 05 - Monitoring System
SIPLUS CMS
The following specific context menu items are provided for the Continue Visualization button:
Context Menu Item
Description
Show Toolbar > …
sets the visibility of the toolbar to the state which is specified via the submenu of this item
Pause Visualization
pauses the visualization, which stops the automatic update of all data
Continue Visualization
continues the visualization, which continues the automatic update of all data
Print Screenshot
prints the screenshot of the Monitoring View
Save Screenshot
saves the screenshot of the Monitoring View
Close Chart
closes the MTC Vector2D T001
The following specific context menu items are provided for the Store Data Snapshot button:
Context Menu Item
Description
Show Toolbar > …
sets the visibility of the toolbar to the state which is specified via the submenu of this item
Store Data Snapshot
starts the storing of the data which are contained within the MTC Vector2D T001
Data Snapshot Scope > …
sets the scope for data snapshots to the setting which is specified via the submenu of this item
Print Screenshot
prints the screenshot of the Monitoring View
Save Screenshot
saves the screenshot of the Monitoring View
Close Chart
closes the MTC Vector2D T001
2.2.2.8
Measurement Cursor
The Measurement Cursors are represented through one 2-dimensional cross, where the cross is placed exactly
at the point of intersection of both dimensions and moves into all four directions from there, until it reaches the
borders of the Curve Area. In addition, the measurement cursor also draws a line from the origin of the x- and yaxes to the 2-dimensional cross. The Measurement Cursors can be shifted in horizontal and vertical direction.
The following screenshot shows an example of the Measurement Cursor of a MTC Vector2D T001:
Figure 27: Example of the Measurement Cursor of a MTC Vector2D T001
English
Release 2012-09
62 / 214
SIPLUS CMS X-Tools - User Manual - 05 - Monitoring System
SIPLUS CMS
Operations via the Left Mouse Button
The following operations can be performed via the left mouse button:
Operation
Description
single click with keeping the button
A single click of the left mouse button with keeping the button starts a shift operation. The actual
shifting of the measurement cursor is performed when the mouse is moved:
•
•
•
[left mouse button down] + [mouse move] shifts the targeted measurement cursor to the
new mouse position
o
in case the left mouse button was pressed above the horizontal line of the cursor, the
cursor is shifted only in vertical direction
o
in case the left mouse button was pressed above the vertical line of the cursor, the
cursor is shifted only in horizontal direction
o
in case the left mouse button was pressed above the point of intersection of both lines
of the cursor, the cursor is shifted in horizontal and vertical direction
the measurement cursor automatically snaps to the exact position of a known X0/Y0 or
X1/Y1 position in case there is any close to the current mouse position
o
snapping is turned on in case the current mouse position is less than 5 pixels away
from a known X0/Y0 or X1/Y1 position
o
when there are multiple positions of known X0/Y0 and/or X1/Y1 positions close to the
measurement cursor, the measurement cursor snaps to the one position which is closest to the position of the mouse cursor
multiple data can share the same X0/Y0 and/or X1/Y1 positions - in this case, the
measurement cursor snaps to the data which is topmost within the legend
this snapping also can assign the measurement data from one 2-dimensional vector data to another 2-dimensional vector data
<Esc> cancels the current operation and sets the position of the measurement cursor back
to the position which it had before the shift operation had been started
The values which are displayed by the Measurement Cursors table are updated automatically
while the measurement cursor is shifted.
Assignment of the Measurement Cursor
The Measurement Cursor can be assigned to the X0/Y0 or to the X1/Y1 position of one 2-dimensional vector
data.
After the Measurement Cursor has been assigned to one 2-dimensional vector data (either because the Measurement Cursor has been turned on right now or because the Set Cursor Data entry from the context menu of
the Legend Area has been called), the Measurement Cursor is placed at the (X0/Y0 or X1/Y1) position of its
assigned 2-dimensional vector data.
In case the Measurement Cursor is being moved by the user, it can be placed anywhere within the Curve Area.
In order to assign it to a Vector2D data again, the Set Cursor Data entry from the context menu of the Legend
Area can be used.
The Measurement Cursor also can be assigned to a 2-dimensional vector data by moving of the Measurement
Cursor. Through the used snapping the Measurement Cursor can be placed either to the X0/Y0 or to the X1/Y1
position of any 2-dimensional vector data.
Automatic Update of the Cursor Position
The automatic update of the cursor position is performed only in case the Measurement Cursor is assigned to a
2-dimensional vector data currently.
In case the Measurement Cursor is assigned to a data, it is assigned either to the X0/Y0 position of the data or
to the X1/Y1 position of the data. After an update of the visualization, the assigned point of the Measurement
Cursor may have been moved. In this case, the Measurement Cursor is being placed automatically to the new
(X0/Y0 or X1/Y1) position.
In case the 2-dimensional vector data to which the Measurement Cursor is assigned currently is removed from
the MTC Vector2D T001 or does not provide a value any more, the Measurement Cursor remains at the last
known position and does not update its position any more.
English
Release 2012-09
63 / 214
SIPLUS CMS X-Tools - User Manual - 05 - Monitoring System
2.2.2.9
SIPLUS CMS
Measurement Cursors Table
The Measurement Cursors table contains the measurement values of all MTC Vector2D T001s which are present within the parent Monitoring View Editor. The following screenshot shows an example for the Measurement Cursors table for a MTC Vector2D T001:
Figure 28: Example of a Measurement Cursors Table of a MTC Vector2D T001
It is opened within the Cursor Area of the parent Monitoring View Editor of the MTC Vector2D T001:
Column
Description
No.
contains the row number
Chart
contains the name of the chart from which the data comes
Data
contains the name of the data
Unit
contains the unit of the data
X0
contains the X0 position of the data
Y0
contains the Y0 position of the data
X1
contains the X1 position of the data
Y1
contains the Y1 position of the data
Length
contains the length of the data
Angle
contains the angle of the data
The contents of the Measurement Cursors table can be copied to the clipboard of Windows. From there, they
can be inserted into any other compatible application.
English
Release 2012-09
64 / 214
SIPLUS CMS X-Tools - User Manual - 05 - Monitoring System
2.2.2.10
2.2.2.10.1
SIPLUS CMS
Chart Options Dialog
Overview
The following screenshot shows an example of a Chart Options dialog:
Figure 29: Example of a Chart Options Dialog of a MTC Vector2D T001
English
Release 2012-09
65 / 214
SIPLUS CMS X-Tools - User Manual - 05 - Monitoring System
2.2.2.10.2
SIPLUS CMS
Chart Options Table
The Chart Options table contains the chart options of the MTC Vector2D T001:
Parameter
Description
Chart Name
allows to enter a name for the chart
Time Domain
allows to choose the time domain
Time Base
allows to choose the time base
Show Background Grid
allows to choose whether the background grid shall be shown within the Curve Area
Show Legend
allows to choose whether the Legend Area shall be shown
Show Toolbar
allows to choose whether the Toolbar Area shall be shown
Show x-Axis
allows to choose whether the x-Axis Area shall be shown
Show y-Axis
allows to choose whether the y-Axis Area shall be shown
Show Sliders
allows to choose whether the Slider Area shall be shown
Rescale x-Axis after Open
allows to choose whether the x-axis shall be scaled automatically after the Monitoring View File
has been opened
Rescale x-Axis after Action
allows to choose whether the x-axis shall be scaled automatically after the displayed data have
been modified outside the MTC Vector2D T001 or after a new data has been dropped into the
MTC Vector2D T001
Rescale y-Axis after Open
allows to choose whether the y-axis shall be scaled automatically after the Monitoring View File
has been opened
Rescale y-Axis after Action
allows to choose whether the y-axis shall be scaled automatically after the displayed data have
been modified outside the MTC Vector2D T001 or after a new data has been dropped into the
MTC Vector2D T001
Update Display Time after Open
allows to choose whether the display time shall be updated automatically after the Monitoring
View File has been opened
Update Display Time after Action
allows to choose whether the display time shall be updated automatically after the displayed data
have been modified outside the MTC Vector2D T001 or after a new data has been dropped into
the MTC Vector2D T001
Lock Aspect Ratio
sets the locking of the aspect ratio to the value which is specified via the submenu of this item
Lock Origin
sets the locking of the origin to the value which is specified via the submenu of this item
Undo/Redo Buffer Size
allows to enter the total size of undo/redo operations which shall be remembered by the MTC
Vector2D T001
Data Snapshot Scope
allows to choose whether data snapshots shall store only the data from the currnet Monitoring
Chart or from the whole Monitoring View
Chart Name
The Chart Name is used by other modules in order to identify a certain MTC Vector2D T001. Within the current
Monitoring View, the Chart Name of each MTC Vector2D T001 must be unique.
Time Domain
The following time domains are supported by the Chart Options dialog of the MTC Vector2D T001:
• Online Data with absolute Timestamps
• Offline Data with absolute Timestamps
• Offline Data with relative Timestamps
The Time Domain cell displays the time domain which is currently being used by all data of the MTC Vector2D
T001. In case more than one time domain is being used currently, the Time Domain cell stays empty.
When another time domain is being chosen via the Time Domain cell, the chosen time domain is applied to all
of the data of the MTC Vector2D T001. As a result, all data use the data with the known name and specified
time domain for their visualization. In case there is no data with the known name and matching time domain, the
affected data becomes marked as not present.
In case the time domain is being changed, the x-/y-axis and the display time can be updated automatically in
case the Rescale x-Axis after Action, Rescale y-Axis after Action or Rescale Display Time after Action options
are being set to “Yes”.
English
Release 2012-09
66 / 214
SIPLUS CMS X-Tools - User Manual - 05 - Monitoring System
SIPLUS CMS
Time Base
The chosen time base specifies how the time stamps of each probe, which are being stored in GMT internally,
are being represented by the MTC Vector2D T001. In case online data is being displayed and the option “Use
the local Time of the Offline Data” is being chosen, the time base for all online data is taken from the time base
setting of the Monitoring View (like if “Default” would have been chosen for the time base of the MTC Vector2D
T001).
Rescale x-Axis after Open
Rescale x-Axis after Open
Description
Yes
In case the rescale mode for the x-axis after open is set to “Yes”, the MTC Vector2D T001 automatically rescales its x-axis after the Monitoring View File has been opened so that all values from
all data of the x-axis become visible.
No
In case the rescale mode for the x-axis after open is set to “No”, the MTC Vector2D T001 does
not touch the scaling of its x-axis after the Monitoring View File has been opened and leaves it at
the stored values from the Monitoring View File.
Rescale x-Axis after Action
Rescale x-Axis after Action
Description
Yes
In case the rescale mode for the x-axis after an action is set to “Yes”, the MTC Vector2D T001
automatically rescales its x-axis after an external action has modified the displayed data so that all
values from the x-axis become visible.
The following actions result in an automatic rescale of the x-axis in case this mode is chosen:
No
•
another part of a contained data has been opened/appended/overwritten
•
a contained data has been recalculated
•
another data is added to the MTC Vector2D T001
In case the rescale mode for the x-axis after an action is set to “No”, the MTC Vector2D T001
does not touch the scaling of its x-axis after an external action has modified the displayed and
leaves it at the current values.
Rescale y-Axis after Open
Rescale y-Axis after Open
Description
Yes
In case the rescale mode for the y-axis after open is set to “Yes”, the MTC Vector2D T001 automatically rescales its y-axis after the Monitoring View File has been opened so that all values from
all data of the y-axis become visible.
No
In case the rescale mode for the y-axis after open is set to “No”, the MTC Vector2D T001 does
not touch the scaling of its y-axis after the Monitoring View File has been opened and leaves it at
the stored values from the Monitoring View File.
Rescale y-Axis after Action
Rescale y-Axis after Action
Description
Yes
In case the rescale mode for the y-axis after an action is set to “Yes”, the MTC Vector2D T001
automatically rescales the y-axis after an external action has modified the displayed data so that
all values from the y-axis become visible.
The following actions result in an automatic rescale of the y-axis in case this mode is chosen:
No
English
Release 2012-09
•
another part of a contained data has been opened/appended/overwritten
•
a contained data has been recalculated
•
another data is added to the MTC Vector2D T001
In case the rescale mode for the y-axis after an action is set to “No”, the MTC Vector2D T001
does not touch the scaling of its y-axis after an external action has modified the displayed data
and leaves it at the current values.
67 / 214
SIPLUS CMS X-Tools - User Manual - 05 - Monitoring System
SIPLUS CMS
Update Display Time after Open
Update Display Time after Open
Description
Yes
In case the update mode for the display time after open is set to “Yes”, the MTC Vector2D T001
automatically sets its display time to the newest available point in time after the Monitoring View
File has been opened.
No
In case the update mode for the display time after open is set to “No”, the MTC Vector2D T001
does not touch the display time after the Monitoring View File has been opened and leaves it at
the stored value from the Monitoring View File.
Update Display Time after Action
Update Display Time after Action
Description
Yes
In case the update mode for the display time after an action is set to “Yes”, the MTC Vector2D
T001 automatically sets its display time to the newest available point in time after an external
action has modified the displayed data so that all values from the y-axis become visible.
The following actions result in an automatic update of the display time in case this mode is chosen:
No
2.2.2.10.3
•
another part of a contained data has been opened/appended/overwritten
•
a contained data has been recalculated
•
another data is added to the MTC Vector2D T001
In case the update mode for the display time after an action is set to “No”, the MTC Vector2D
T001 does not touch the display time after an external action has modified the displayed data and
leaves it at the current value.
Menu Bar
Menu Button
Description
Restore Defaults
Sets all options back to their default settings.
Set as Standard
Sets the current options as standard options for each new MTC Vector2D T001. The options of
already existing MTC Vector2D T001s are not being changed by this operation.
OK
Closes the dialog and takes over all user inputs.
Cancel
Closes the dialog and discards all user inputs.
Apply
Takes over all user inputs without closing the dialog. This control is enabled only in case the settings within the dialog have been changed.
English
Release 2012-09
68 / 214
SIPLUS CMS X-Tools - User Manual - 05 - Monitoring System
2.2.2.11
2.2.2.11.1
SIPLUS CMS
Chart Styles Dialog
Overview
The following screenshot shows an example of a Chart Styles dialog:
Figure 30: Example of a Chart Styles Dialog of a MTC Vector2D T001
2.2.2.11.2
Default Styles of Data Table
The Default Styles of Data table contains the default styles of data within the MTC Vector2D T001:
Parameter
Description
Data #01 … Data #32
displays the currently chosen color and style for the according data
A double-click into the Color column of this control opens the Select Color dialog for the according row.
A double-click into the Example column of this control opens the Select Style dialog for the according row.
English
Release 2012-09
69 / 214
SIPLUS CMS X-Tools - User Manual - 05 - Monitoring System
2.2.2.11.3
SIPLUS CMS
Styles of Controls Table
The Styles of Controls table contains the styles of the controls of the MTC Vector2D T001:
Parameter
Description
Chart Background
displays the currently chosen color for the chart background
Background Grid
displays the currently chosen style for the background grid
Cursor
displays the currently chosen color for the cursor
Axes Color
displays the currently chosen color for the axes
Zooming Frame
displays the currently chosen style for the zooming frame
Text of selected Items (Active)
displays the currently chosen color of the text of active selected items
Text of selected Items (Inactive)
displays the currently chosen color of the text of inactive selected items
Background of selected Items (Active) displays the currently chosen color of the background of active selected items
Background of selected Items (Inactive)
displays the currently chosen color of the background of inactive selected items
A double-click into the Color column of any row opens the Select Color dialog for the according row.
A double-click into the Example column of a row which supports different styles opens the Select Style dialog
for the according row. In case different styles are not supported by a row, a double-click into the Example column opens the Select Color dialog for the according row.
2.2.2.11.4
Menu Bar
Menu Button
Description
Restore Defaults
Sets all styles back to their default settings.
Set as Standard
Sets the current styles as standard styles for each new MTC Vector2D T001. The styles of already existing MTC Vector2D T001s are not being changed by this operation.
OK
Closes the dialog and takes over all user inputs.
Cancel
Closes the dialog and discards all user inputs.
Apply
Takes over all user inputs without closing the dialog. This control is enabled only in case the styles
within the dialog have been changed.
2.2.2.12
2.2.2.12.1
Data Style Dialog
Overview
The following screenshot shows an example of a Data Style dialog:
Figure 31: Example of a Data Style Dialog of a MTC Vector2D T001
English
Release 2012-09
70 / 214
SIPLUS CMS X-Tools - User Manual - 05 - Monitoring System
2.2.2.12.2
SIPLUS CMS
Style Parameters Table
The Style Parameters table contains the visualization style parameters of the currently selected data:
Parameter
Description
Line Type
allows to switch between the available line types
Line Color
allows to enter the desired line color
Line Strength
allows to switch between the available line strengths
Mark Type
allows to switch between the available mark types
Mark Color
allows to enter the desired mark color
Mark Strength
allows to switch between the available mark strengths
Rendering Mode
allows to switch between the available rendering modes
Interpolation Mode
not applicable
Example
displays an example curve according to the specified data style
A value of “Default” can be assigned to each style parameter. In case “Default” is being chosen, the according
value from the Chart Styles dialog is being used for the visualization of the data.
2.2.2.12.3
Menu Bar
Menu Button
Description
Restore Defaults
Sets all styles back to their default settings.
OK
Closes the dialog and takes over all user inputs.
Cancel
Closes the dialog and discards all user inputs.
Apply
Takes over all user inputs without closing the dialog. This control is enabled only in case the styles
within the dialog have been changed.
2.2.2.13
2.2.2.13.1
Select Style Dialog
Overview
The following screenshot shows an example of a Select Style dialog:
Figure 32: Example of a Select Style Dialog of a MTC Vector2D T001
The functionality of the Select Style dialog matches the functionality of the Data Style dialog (see point
2.2.2.12).
English
Release 2012-09
71 / 214
SIPLUS CMS X-Tools - User Manual - 05 - Monitoring System
2.2.2.14
SIPLUS CMS
Manual scale x-Axis Dialog
2.2.2.14.1
Overview
The following screenshot shows an example of a Manual scale x-Axis dialog:
Figure 33: Example of a Manual scale x-Axis Dialog of a MTC Vector2D T001
2.2.2.14.2
x-Axis Parameters Table
The x-Axis Parameters table contains the parameters of a currently selected x-axis:
Parameter
Description
Auto scale Axis
allows to switch between the available auto scale axis modes
Minimum Value
allows to enter the minimum value of the scaling
Minimum Value Exponent
allows to switch between the supported minimum value exponents
Maximum Value
allows to enter the maximum value of the scaling
Maximum Value Exponent
allows to switch between the supported maximum value exponents
Auto set Scaling Interval
allows to switch between the available modes for the automatic scaling interval
Scaling Interval
allows to enter the scaling interval
Scaling Interval Exponent
allows to switch between the supported scaling interval exponents
Minor Scaling Divider
allows to switch between the available minor scaling dividers
Auto scale Axis
Auto scale Axis
Description
On
In this mode, the MTC Vector2D T001 constantly sets the scaling of the x-axis so that all available
values of the data at the x-axis stay visible.
Off
In this mode, the MTC Vector2D T001 uses the specified Minimum Value and Maximum Value
parameters for the scaling of the x-axis.
Auto set Scaling Interval
Auto set Scaling Interval
Description
On
In this mode, the MTC Vector2D T001 constantly sets the scaling interval of the x-axis according
to the currently displayed value interval.
Off
In this mode, the MTC Vector2D T001 uses the specified Scaling Interval and Scaling Interval
Exponent parameters for the scaling interval of the x-axis. In case the specified parameters would
lead to overlapping numbers, the automatic scaling interval is being used automatically until the
specified parameters allow a valid scaling again.
English
Release 2012-09
72 / 214
SIPLUS CMS X-Tools - User Manual - 05 - Monitoring System
2.2.2.14.3
SIPLUS CMS
Menu Bar
Menu Button
Description
OK
Closes the dialog and takes over all user inputs.
Cancel
Closes the dialog and discards all user inputs.
Apply
Takes over all user inputs without closing the dialog. This control is enabled only in case the settings within the dialog have been changed.
2.2.2.15
Manual scale y-Axis Dialog
2.2.2.15.1
Overview
The following screenshot shows an example of a Manual scale y-Axis dialog:
Figure 34: Example of a Manual scale y-Axis Dialog of a MTC Vector2D T001
2.2.2.15.2
y-Axis Parameters Table
The y-Axis Parameters table contains the parameters of a currently selected y-axis:
Parameter
Description
Auto scale Axis
allows to switch between the available auto scale axis modes
Minimum Value
allows to enter the minimum value of the scaling
Minimum Value Exponent
allows to switch between the supported minimum value exponents
Maximum Value
allows to enter the maximum value of the scaling
Maximum Value Exponent
allows to switch between the supported maximum value exponents
Auto set Scaling Interval
allows to switch between the available modes for the automatic scaling interval
Scaling Interval
allows to enter the scaling interval
Scaling Interval Exponent
allows to switch between the supported scaling interval exponents
Minor Scaling Divider
allows to switch between the available minor scaling dividers
Auto scale Axis
Auto scale Axis
Description
On
In this mode, the MTC Vector2D T001 constantly sets the scaling of the y-axis so that all available
values of the data at the y-axis stay visible.
Off
In this mode, the MTC Vector2D T001 uses the specified Minimum Value and Maximum Value
parameters for the scaling of the y-axis.
English
Release 2012-09
73 / 214
SIPLUS CMS X-Tools - User Manual - 05 - Monitoring System
SIPLUS CMS
Auto set Scaling Interval
Auto set Scaling Interval
Description
On
In this mode, the MTC Vector2D T001 constantly sets the scaling interval of the y-axis according
to the currently displayed value interval.
Off
In this mode, the MTC Vector2D T001 uses the specified Scaling Interval and Scaling Interval
Exponent parameters for the scaling interval of the y-axis. In case the specified parameters would
lead to overlapping numbers, the automatic scaling interval is being used automatically until the
specified parameters allow a valid scaling again.
2.2.2.15.2.1
Menu Bar
Menu Button
Description
OK
Closes the dialog and takes over all user inputs.
Cancel
Closes the dialog and discards all user inputs.
Apply
Takes over all user inputs without closing the dialog. This control is enabled only in case the settings within the dialog have been changed.
2.2.2.16
Manual scale Renderer Dialog
2.2.2.16.1
Overview
The following screenshot shows an example of a Manual scale Renderer dialog:
Figure 35: Example of a Manual scale Renderer Dialog of a MTC Vector2D T001
2.2.2.16.2
Renderer Parameters Table
The Renderer Parameters table contains the rendering parameters of a currently selected slider:
Parameter
Description
Target Slider
allows to switch between the available sliders
Display Time Format
allows to switch between the available input formats for the display time
Display Time Value
allows to enter the display time of the scaling
2.2.2.16.2.1
Menu Bar
Menu Button
Description
OK
Closes the dialog and takes over all user inputs.
Cancel
Closes the dialog and discards all user inputs.
Apply
Takes over all user inputs without closing the dialog. This control is enabled only in case the settings within the dialog have been changed.
English
Release 2012-09
74 / 214
SIPLUS CMS X-Tools - User Manual - 05 - Monitoring System
2.2.2.17
SIPLUS CMS
Drag&Drop sensitive Areas
The following screenshot shows the places within a MTC Vector2D T001 onto which data can be dropped in
order to open a new Monitoring Chart:
Figure 36: Dropping of Data in order to open a new Monitoring Chart
The following screenshot shows the places within a MTC Vector2D T001 onto which data can be dropped in
order to add the data to the existing MTC Vector2D T001:
Figure 37: Dropping of Data in order to add it to the existing MTC Vector2D T001
English
Release 2012-09
75 / 214
SIPLUS CMS X-Tools - User Manual - 05 - Monitoring System
2.2.3
SIPLUS CMS
MTC yn T001
2.2.3.1
Overview
The MTC yn T001 is used in order to visualize, create and edit y = f(n) charts (for example the outputs of the
FFT(), Histogram1D(), ApplyBlackman(), … functions) within a Monitoring View Editor. Multiple editors of this
type can be opened and used simultaneously within one Monitoring View Editor and/or within multiple Monitoring View Editors.
The following screenshot shows an example of a MTC yn T001:
Figure 38: Example of a MTC yn T001
Each control of the MTC yn T001 has a defined task and provides certain functionalities. The following major
controls are provided by the MTC yn T001:
• Curve Area
• x-Axes Area
• y-Axes Area
• Slider Area
• Legend Area
• Toolbar Area
• Measurement Cursors
• Advanced Cursors
• Frequency Markers
• Measurement Cursors Table
• Advanced Cursors Table
• Frequency Markers Table
• Chart Options Dialog
• Chart Styles Dialog
• Data Style Dialog
• Select Style Dialog
• Manual scale x-Axis Dialog
English
Release 2012-09
76 / 214
SIPLUS CMS X-Tools - User Manual - 05 - Monitoring System
SIPLUS CMS
• Manual scale y-Axis Dialog
• Configure Frequency Markers Dialog
• Drag&Drop sensitive Areas
2.2.3.2
Curve Area
The Curve Area of the MTC yn T001 is used in order to visualize data of the function y = f(n). Via mouse and
keyboard operations the user is able to zoom, scroll and maintain the available data.
The following screenshot shows an example of the Curve Area of a MTC yn T001:
Figure 39: Example of the Curve Area of a MTC yn T001
Background Grid
The background grid of the MTC yn T001 extends the lines from the axis labeling into the Curve Area. It is represented as a grid of horizontal and vertical lines in the background of the Curve Area.
Always exactly one x-axis and exactly one y-axis are bound to the background grid and extend their axis labeling via it. The context menus of the Axis Areas are used in order to specify the x- and y-axis which shall use the
background grid to extend their axis labeling.
The appearing and scaling of the background grid is configured via the Manual scale x-Axis dialog (for the
vertical grid lines) and via the Manual scale y-Axis dialog (for the horizontal grid lines).
In case the current background grid configuration is set to “manual” and the vertical and/or horizontal grid lines
can not be drawn (because the grid lines would be too close to each other), the background grid automatically
switches to automatic distribution of the grid lines for the affected orientation(s). The manual settings are used
again as soon as the scaling of the MTC yn T001 reaches a value which allows using the manual configuration.
Curve Visualization
The data interpolation defines how two successive points of an already rendered data are connected when they
are displayed. All supported data interpolation modes are defined by the description of the Data Style dialog.
The data style defines how a data is visualized graphically. It contains the parameters for the color/strength/style
of the line as well as the parameters for the color/strength/style of the mark and the rendering/interpolation
methods. The styles of each data can be defined at different levels by the user.
The style of each data can be set at the following levels, where the settings of a higher level overwrite the settings of a lower level (top = high, bottom = low):
• Data Style dialog of the MTC yn T001
• default data style of the MTC yn T001
English
Release 2012-09
77 / 214
SIPLUS CMS X-Tools - User Manual - 05 - Monitoring System
SIPLUS CMS
Keyboard Operations
The following operations can be performed via the keyboard:
Keyboard Operation
Description
<+>
zooms into the x- and y-axes simultaneously
<Shift> + <+>
zooms only into the x-axes
<x> + <+>
behaves like <Shift> + <+>
<Ctrl> + <+>
zooms only into the y-axes
<y> + <+>
behaves like <Ctrl> + <+>
<->
zooms out from the x- and y-axes simultaneously
<Shift> + <->
zooms only out from the x-axes
<x> + <->
behaves like <Shift> + <->
<Ctrl> + <->
zooms only out from the y-axes
<y> + <->
behaves like <Ctrl> + <->
<F>
fits the scaling of the x- and y-axes simultaneously
<Shift> + <F>
fits the scaling only of the x-axes
<x> + <F>
behaves like <Shift> + <F>
<Ctrl> + <F>
fits the scaling only of the y-axes
<y> + <F>
behaves like <Ctrl> + <F>
<Ctrl> + <Z>
undoes the latest operation from the undo buffer
<Shift> + <Ctrl> + <Z>
undoes all operations from the undo buffer
<Ctrl> + <Y>
redoes the latest operation from the redo buffer
<Shift> + <Ctrl> + <Y>
redoes all operations from the redo buffer
<1>
sets measurement cursor 1 as currently selected cursor
<2>
sets measurement cursor 2 as currently selected cursor
<H>
sets the 1. Harmonic as currently selected cursor
<C>
sets the Center Frequency as currently selected cursor
<S>
sets the first upper sideband as currently selected cursor
<M>
sets the Main Frequency Marker as currently selected cursor
<R>
restores the default position of the currently selected cursor
<Cursor left>
moves the currently selected cursor to the left
<Cursor right>
moves the currently selected cursor to the right
Operations via the Left Mouse Button
The following operations can be performed via the left mouse button:
Operation
Description
single click with keeping the button
A single click of the left mouse button with keeping the button starts a zoom operation. While the
left mouse button is kept down, a rectangle from the position where the left mouse button has
been pressed to the current position of the mouse cursor is shown in order to indicate the zooming
area. The actual zooming is performed when the left mouse button is released:
•
[left mouse button down] + [mouse move] zooms into the specified area of the x and yaxes simultaneously
•
<Shift> + [left mouse button down] + [mouse move] zooms only into the specified area of
the x-axes
o
•
<Ctrl> + [left mouse button down] + [mouse move] zooms only into the specified area of
the y-axes
o
•
English
Release 2012-09
<x> + [left mouse button down] + [mouse move] behaves like <Shift> + [left mouse button down] + [mouse move]
<y> + [left mouse button down] + [mouse move] behaves like <Ctrl> + [left mouse button down] + [mouse move]
<Esc> cancels the current operation without changing of any axis scaling
78 / 214
SIPLUS CMS X-Tools - User Manual - 05 - Monitoring System
SIPLUS CMS
Operations via the Right Mouse Button
The following operations can be performed via the right mouse button:
Operation
Description
single click with releasing the button
A single click of the right mouse button with releasing the button above the Curve Area opens the
context menu for the Curve Area.
single click with keeping the button
A single click of the right mouse button with keeping the button starts a shift operation. The actual
shifting is performed when the mouse is moved:
•
[right mouse button down] + [mouse move] moves all curves within the Curve Area into the
direction of the mouse move
o
when the <Shift> key is being pressed during the shift operation, the curves are shifted
only in horizontal direction
o
when the <Ctrl> key is being pressed during the shift operation, the curves are shifted
only in vertical direction
•
when <x> key is being pressed during the shift operation, the behavior is like if the
<Shift> key is being pressed during the shift operation
when <y> key is being pressed during the shift operation, the behavior is like if the
<Shift> key is being pressed during the shift operation
<Esc> cancels the current operation and sets all axes scaling back to the values which
they had before the shift operation had been started
Operations via the Mouse Wheel
The following operations can be performed via the mouse wheel:
Operation
Description
scrolling
Scrolling with the mouse wheel can be used to shift or zoom the Curve Area. The actual operation
is performed when the mouse wheel is scrolled:
•
[mouse wheel down] zooms out of the current mouse position of the x- and y-axes simultaneously
•
[mouse wheel up] zooms into the current mouse position of the x- and y-axes simultaneously
•
<Shift> + [mouse wheel down] moves all curves within the Curve Area to the left
o
•
<Shift> + [mouse wheel up] moves all curves within the Curve Area to the right
o
•
<y> + [mouse wheel down] behaves like <Ctrl> + [mouse wheel down]
<Ctrl> + [mouse wheel up] moves all curves within the Curve Area down
o
English
Release 2012-09
<x> + [mouse wheel up] behaves like <Shift> + [mouse wheel up]
<Ctrl> + [mouse wheel down] moves all curves within the Curve Area up
o
•
<x> + [mouse wheel down] behaves like <Shift> + [mouse wheel down]
<y> + [mouse wheel up] behaves like <Ctrl> + [mouse wheel up]
79 / 214
SIPLUS CMS X-Tools - User Manual - 05 - Monitoring System
SIPLUS CMS
Drag&Drop of Data
When an yn-compatible data is dropped into the Curve Area, it is added to the currently present data of the
MTC yn T001:
• [left mouse button up] ends the Drag&Drop operation and adds the dragged data(s) to the default x- and
y-axes.
• <Alt> + [left mouse button up] ends the Drag&Drop operation, creates a new x- and a new y-axis and
adds the dragged data(s) to these new axes.
• In case the current Drag&Drop operation has been started within the MTC yn T001 onto which the drop is
performed, a move operation is being performed by default (the default operation can be changed, see
below).
• In case the current Drag&Drop operation has been started outside the MTC yn T001 onto which the drop
is performed, a copy operation is being performed by default (the default operation can be changed, see
below).
• In case the current Drag&Drop operation would copy the currently selected data into the MTC yn T001,
<Shift> can be pressed in order to perform a move instead of a copy.
• In case the current Drag&Drop operation would move the currently selected data into the MTC yn T001,
<Ctrl> can be pressed in order to perform a copy instead of a move.
Context Menu
The following specific context menu items are provided:
Context Menu Item
Description
Fit to Chart
sets the scaling of all x- and y-axes so that the complete values of all data within the MTC yn
T001 become visible
Fit to Charts
sets the scaling of all Monitoring Charts within the parent Monitoring View Editor so that the
complete values of all data within all Monitoring Charts become visible
Zoom in
zooms in at all x- and y-axes simultaneously; the new scaling interval is half of the old scaling
interval and the center of the zooming is the current mouse position
Zoom out
zooms out at all x- and y-axes simultaneously; the new scaling interval is the double of the old
scaling interval and the center of the zooming is the current mouse position
Chart Options…
opens the Chart Options dialog
Copy Chart Options
copies the options of the MTC yn T001 below the current mouse position
Paste Chart Options
pastes the currently copied MTC yn T001 options onto the MTC yn T001 below the current mouse
position
Chart Styles…
opens the Chart Styles dialog
Copy Chart Styles
copies the styles of the MTC yn T001 below the current mouse position
Paste Chart Styles
pastes the currently copied MTC yn T001 styles onto the MTC yn T001 below the current mouse
position
Show Background Grid > …
sets the visibility of the background grid to the state which is specified via the submenu of this item
Show Legend > …
sets the visibility of the Legend Area to the state which is specified via the submenu of this item
Show Toolbar > …
sets the visibility of the Toolbar Area to the state which is specified via the submenu of this item
Show x-Axes > …
sets the visibility of the x-Axes Area to the state which is specified via the submenu of this item
Show y-Axes > …
sets the visibility of the y-Axes Area to the state which is specified via the submenu of this item
Show Sliders > …
sets the visibility of the Slider Area to the state which is specified via the submenu of this item
Print Screenshot
prints the screenshot of the Monitoring View
Save Screenshot
saves the screenshot of the Monitoring View
Close Chart
closes the MTC yn T001
English
Release 2012-09
80 / 214
SIPLUS CMS X-Tools - User Manual - 05 - Monitoring System
2.2.3.3
SIPLUS CMS
x-Axes Area
The x-Axes Area of the MTC yn T001 is used in order to display the scaling of the present x-axes. Via mouse
operations the user is able to zoom, scroll and maintain the available data.
The following screenshot shows an example of the x-Axes Area of a MTC yn T001:
Figure 40: Example of the x-Axes Area of a MTC yn T001
Operations via the Left Mouse Button
The following operations can be performed via the left mouse button:
Operation
Description
single click with releasing the button
Single and multiple x-axes can be selected/deselected through a left mouse button click:
●
[left mouse button down] above any x-axis selects the below x-axis
●
<Ctrl> + [left mouse button down] is used in order to select/deselect x-axis after x-axis
●
<Shift> + [left mouse button down] is used in order to select/deselect all x-axis from the last
selected x-axis to the x-axis below the current mouse position
○
single click with keeping the button
double click
in case there is no x-axis selected at the moment, only the below x-axis is selected
●
multiple x-axes can be selected/deselected after each other through combinations of the
above methods
●
in case there is a selection of items already and the user clicks onto any x-axis which is not
selected currently without pressing the <Shift> or <Ctrl> keys, the currently selected items
of the clicked Monitoring Chart are deselected and the clicked x-axis becomes selected
instead
•
in case the [left mouse button] or the [right mouse button] is being pressed anywhere outside the x-Axes Area, the currently selected items of the clicked Monitoring Chart are deselected
A single click of the left mouse button with keeping the button starts a zoom operation. The actual
zooming is performed when the mouse is moved:
•
[left mouse button down] + [mouse move right] zooms out of the x-axis from the x position
where the left mouse button has been pressed
•
[left mouse button down] + [mouse move left] zooms into the x-axis from the x position
where the left mouse button has been pressed
•
<Esc> cancels the current operation and sets the axes scaling back to the values which
they had before the zooming operation had been started
A double click of the left mouse button onto any x-axis opens the Manual scale x-Axis dialog for
the x-axis below the current mouse position.
Operations via the Right Mouse Button
The following operations can be performed via the right mouse button:
Operation
Description
single click with releasing the button
A single click of the right mouse button with releasing the button above the x-Axes Area opens the
context menu for the x-Axes Area.
single click with keeping the button
A single click of the right mouse button with keeping the button starts a shift operation. The actual
shifting is performed when the mouse is moved:
English
Release 2012-09
•
[right mouse button down] + [mouse move right] moves the x-axis right
•
[right mouse button down] + [mouse move left] moves the x-axis left
•
<Esc> cancels the current operation and sets all axes scaling back to the values which
they had before the shift operation had been started
81 / 214
SIPLUS CMS X-Tools - User Manual - 05 - Monitoring System
SIPLUS CMS
Operations via the Mouse Wheel
The following operations can be performed via the mouse wheel:
Operation
Description
scrolling
Scrolling with the mouse wheel can be used to shift or zoom the x-Axes Area. The actual operation is performed when the mouse wheel is scrolled:
•
[mouse wheel down] moves the x-axis left
•
[mouse wheel up] moves the x-axis right
•
<Shift> + [mouse wheel down] zooms out of the x-axis from the current x position of the
mouse cursor
•
<Shift> + [mouse wheel up] zooms into the x-axis from the current x position of the mouse
cursor
Drag&Drop of Data
When a data is dropped onto an existing x-axis, it is added to the currently present data of this x-axis:
• [left mouse button up] ends the Drag&Drop operation and adds the dragged data(s) to the x-axis below
the current mouse position and to the default y-axis.
• <Alt> + [left mouse button up] ends the Drag&Drop operation, creates a new x-axis and adds the dragged
data(s) to this new x-axis and to the default y-axis.
• In case the current Drag&Drop operation has been started within the MTC yn T001 onto which the drop is
performed, a move operation is being performed by default (the default operation can be changed, see
below).
• In case the current Drag&Drop operation has been started outside the MTC yn T001 onto which the drop
is performed, a copy operation is being performed by default (the default operation can be changed, see
below).
• In case the current Drag&Drop operation would copy the currently selected data into the MTC yn T001,
<Shift> can be pressed in order to perform a move instead of a copy.
• In case the current Drag&Drop operation would move the currently selected data into the MTC yn T001,
<Ctrl> can be pressed in order to perform a copy instead of a move.
Context Menu
The following specific context menu items are provided:
Context Menu Item
Description
Show x-Axes > …
sets the visibility of the x-Axes Area to the state which is specified via the submenu of this item
Auto scale Axis > …
sets whether all selected x-axes shall automatically adopt their scaling so that always the complete values of their contained data are visible
Fit to Axis
sets the scaling of all selected x-axes so that the complete values of their contained data are visible
Set Background Grid Axis
sets the x-axis from which the context menu has been called as the x-axis which is providing the
vertical background grid lines; the x-axis which provides the vertical background grid lines also is
the x-axis to which the Measurement Cursors are bound
Set Default Axis
sets the x-axis from which the context menu has been called as the x-axis which is the default xaxis for newly dragged data
Manual scale x-Axis…
opens the Manual scale x-Axis dialog for the selected x-axes
Copy x-Axis Scaling
copies the scaling of the x-axis below the current mouse position
Paste x-Axis Scaling
pastes the currently copied x-axis scaling onto the x-axis below the current mouse position
Rescale x-Axis after Open > …
sets the rescale type of the x-axis after opening of the Monitoring View File to the type which is
specified via the submenu of this item
Rescale x-Axis after Action > …
sets the rescale type of the x-axis after an action to the type which is specified via the submenu of
this item
Remove Axis
removes all selected x-axes with all of their data from the MTC yn T001
Print Screenshot
prints the screenshot of the Monitoring View
Save Screenshot
saves the screenshot of the Monitoring View
Close Chart
closes the MTC yn T001
English
Release 2012-09
82 / 214
SIPLUS CMS X-Tools - User Manual - 05 - Monitoring System
2.2.3.4
SIPLUS CMS
y-Axes Area
The y-Axes Area of the MTC yn T001 is used in order to display the scaling of the present y-axes. Via mouse
operations the user is able to zoom, scroll and maintain the available data.
The following screenshot shows an example of the y-Axes Area of a MTC yn T001:
Figure 41: Example of the y-Axes Area of a MTC yn T001
Operations via the Left Mouse Button
The following operations can be performed via the left mouse button:
Operation
Description
single click with releasing the button
Single and multiple y-axes can be selected/deselected through a left mouse button click:
●
[left mouse button down] above any y-axis selects the below y-axis
●
<Ctrl> + [left mouse button down] is used in order to select/deselect y-axis after y-axis
●
<Shift> + [left mouse button down] is used in order to select/deselect all y-axis from the last
selected to the y-axis below the current mouse position
○
single click with keeping the button
double click
English
Release 2012-09
in case there is no y-axis selected at the moment, only the below y-axis is selected
●
multiple y-axes can be selected/deselected after each other through combinations of the
above methods
●
in case there is a selection of items already and the user clicks onto any y-axis which is not
selected currently without pressing the <Shift> or <Ctrl> keys, the currently selected items
of the clicked Monitoring Chart are deselected and the clicked y-axis becomes selected
instead
•
in case the [left mouse button] or the [right mouse button] is being pressed anywhere outside the y-Axes Area, the currently selected items of the clicked Monitoring Chart are deselected
A single click of the left mouse button with keeping the button starts a zoom operation. The actual
zooming is performed when the mouse is moved:
•
[left mouse button down] + [mouse move down] zooms out of the y-axis from the y position
where the left mouse button has been pressed
•
[left mouse button down] + [mouse move up] zooms into the y-axis from the y position
where the left mouse button has been pressed
•
<Esc> cancels the current operation and sets the axes scaling back to the values which
they had before the zooming operation had been started
A double click of the left mouse button onto any y-axis opens the Manual scale y-Axis dialog for
the y-axis below the current mouse position.
83 / 214
SIPLUS CMS X-Tools - User Manual - 05 - Monitoring System
SIPLUS CMS
Operations via the Right Mouse Button
The following operations can be performed via the right mouse button:
Operation
Description
single click with releasing the button
A single click of the right mouse button with releasing the button above the y-Axes Area opens the
context menu for the y-Axes Area.
single click with keeping the button
A single click of the right mouse button with keeping the button starts a shift operation. The actual
shifting is performed when the mouse is moved:
•
[right mouse button down] + [mouse move down] moves the y-axis down
•
[right mouse button down] + [mouse move up] moves the y-axis up
•
<Esc> cancels the current operation and sets all axes scaling back to the values which
they had before the shift operation had been started
Operations via the Mouse Wheel
The following operations can be performed via the mouse wheel:
Operation
Description
scrolling
Scrolling with the mouse wheel can be used to shift or zoom the y-Axes Area. The actual operation is performed when the mouse wheel is scrolled:
•
[mouse wheel down] moves the y-axis up
•
[mouse wheel up] moves the y-axis down
•
<Ctrl> + [mouse wheel down] zooms out of the y-axis from the current y position of the
mouse cursor
•
<Ctrl> + [mouse wheel up] zooms into the y-axis from the current y position of the mouse
cursor
Drag&Drop of Data
When a data is dropped onto an existing y-axis, it is added to the currently present data of this y-axis:
• [left mouse button up] ends the Drag&Drop operation and adds the dragged data(s) to the y-axis below
the current mouse position and to the default x-axis.
• <Alt> + [left mouse button up] ends the Drag&Drop operation, creates a new y-axis and adds the
dragged data(s) to this new y-axis and to the default x-axis.
• In case the current Drag&Drop operation has been started within the MTC yn T001 onto which the drop
is performed, a move operation is being performed by default (the default operation can be changed, see
below).
• In case the current Drag&Drop operation has been started outside the MTC yn T001 onto which the drop
is performed, a copy operation is being performed by default (the default operation can be changed, see
below).
• In case the current Drag&Drop operation would copy the currently selected data into the MTC yn T001,
<Shift> can be pressed in order to perform a move instead of a copy.
• In case the current Drag&Drop operation would move the currently selected data into the MTC yn T001,
<Ctrl> can be pressed in order to perform a copy instead of a move.
English
Release 2012-09
84 / 214
SIPLUS CMS X-Tools - User Manual - 05 - Monitoring System
SIPLUS CMS
Context Menu
The following specific context menu items are provided:
Context Menu Item
Description
Show y-Axes > …
sets the visibility of the y-Axes Area to the state which is specified via the submenu of this item
Auto scale Axis > …
sets whether all selected y-axes shall automatically adopt their scaling so that always the complete values of their contained data are visible
Fit to Axis
sets the scaling of all selected y-axes so that the complete values of their contained data are visible
Set Background Grid Axis
sets the y-axis from which the context menu has been called as the y-axis which is providing the
horizontal background grid lines
Set Default Axis
sets the y-axis from which the context menu has been called as the y-axis which is the default yaxis for newly dragged data
Manual scale y-Axis…
opens the Manual scale y-Axis dialog for the selected y-axes
Copy y-Axis Scaling
copies the scaling of the y-axis below the current mouse position
Paste y-Axis Scaling
pastes the currently copied y-axis scaling onto the y-axis below the current mouse position
Rescale y-Axis after Open > …
sets the rescale type of the y-axis after opening of the Monitoring View File to the type which is
specified via the submenu of this item
Rescale y-Axis after Action > …
sets the rescale type of the y-axis after an action to the type which is specified via the submenu of
this item
Remove Axis
removes all selected y-axes with all of their data from the MTC yn T001
Print Screenshot
prints the screenshot of the Monitoring View
Save Screenshot
saves the screenshot of the Monitoring View
Close Chart
closes the MTC yn T001
2.2.3.5
Slider Area
The Slider Area of the MTC yn T001 is used in order to configure the currently visualized point in time. The total
width of each slider represents the oldest and the newest available time of the current data of its time domain
and the inside slider button represents the currently visualized point in time out of the total time interval of the
data. By dragging of the slider button, the currently visualized time is modified.
The following screenshot shows an example of the Slider Area of a MTC yn T001:
Figure 42: Example of the Slider Area of a MTC yn T001
Time Domains
Within the Slider Area, there is one slider being available for each of the possible time domains. Each slider is
being displayed only in case its according time domain is actually being used within the current MTC yn T001.
Naming of Sliders
Each slider displays its name at its left bottom corner. The name of each slider contains the following components:
• number of the slider
• name of the used time domain
Available Times
The left border of each slider always displays and represents the oldest time of all of the data of its time domain.
The right border of each slider always displays and represents the newest time of all of the data of its time domain.
In case the visualization of online data is running (not paused), the left and right borders of the affected slider
button are constantly updated so that they represent the currently available time interval of their time axis.
Displayed Times
Below the right border of each slider, the current time of the slider button is being displayed.
In case the visualization of online data is running (not paused), the displayed current time is constantly updated.
English
Release 2012-09
85 / 214
SIPLUS CMS X-Tools - User Manual - 05 - Monitoring System
SIPLUS CMS
Operations via the Left Mouse Button
The following operations can be performed via the left mouse button:
Operation
Description
single click with releasing the button
onto the left step button
A single click of the left mouse button with releasing the button above the left step button shifts the
currently displayed point in time into the past:
•
the next older timestamp from all of the data at the time domain of the slider is being chosen as new current point in time
○
single click with releasing the button
onto the right step button
in case the current point in time already is the oldest available point in time, the left
step button does not change the current point in time any more
A single click of the left mouse button with releasing the button above the right step button shifts
the currently displayed point in time into the future:
•
without additional keys being pressed, the next newer timestamp from all of the data at the
time domain of the slider is being chosen as new current point in time
○
in case the current point in time already is the newest available point in time, the right
step button does not change the current point in time any more
single click with keeping the button
onto the left step button
A single click of the left mouse button with keeping the button down onto the left step button behaves like if the left step button would be clicked with the left mouse button constantly.
single click with keeping the button
onto the right step button
A single click of the left mouse button with keeping the button down onto the right step button
behaves like if the right step button would be clicked with the left mouse button constantly.
single click with keeping the button
onto the slider button
A single click of the left mouse button with keeping the button down onto the slider button allows
to modify the current point in time:
•
in case the mouse is moved to the left, the current point in time is shifted into the past
○
•
in case the mouse is moved to the right, the current point in time is shifted into the future
○
•
the slider button can not be dragged out of the left border of the Slider Area
the slider button can not be dragged out of the right border of the Slider Area
<Esc> cancels the current operation without modifying the current point in time
Operations via the Right Mouse Button
The following operation can be performed via the right mouse button:
Operation
Description
single click with releasing the button
A single click of the right mouse button with releasing the button above the Slider Area opens the
context menu for the Slider Area.
Operations via the Mouse Wheel
The following operations can be performed via the mouse wheel:
Operation
Description
scrolling
Scrolling with the mouse wheel can be used to shift or zoom the Slider Area. The actual operation
is performed when the mouse wheel is scrolled:
•
[mouse wheel down] moves the slider button left (into the past)
○
•
[mouse wheel up] moves the slider button right (into the future)
○
English
Release 2012-09
in case the current begin time of the displayed interval already is the oldest available
point in time (or older), [mouse wheel down] does not change the currently displayed
interval
in case the current end time of the displayed interval already is the newest available
point in time (or newer), [mouse wheel up] does not change the currently displayed interval
86 / 214
SIPLUS CMS X-Tools - User Manual - 05 - Monitoring System
SIPLUS CMS
Drag&Drop of Data
When an yn-compatible data is dropped into the Slider Area, it is added to the currently present data of the MTC
yn T001:
• [left mouse button up] ends the Drag&Drop operation and adds the dragged data(s) to the default x- and
y-axes.
• <Alt> + [left mouse button up] ends the Drag&Drop operation, creates a new x- and a new y-axis and
adds the dragged data(s) to these new axes.
• In case the current Drag&Drop operation has been started within the MTC yn T001 onto which the drop is
performed, a move operation is being performed by default (the default operation can be changed, see
below).
• In case the current Drag&Drop operation has been started outside the MTC yn T001 onto which the drop
is performed, a copy operation is being performed by default (the default operation can be changed, see
below).
• In case the current Drag&Drop operation would copy the currently selected data into the MTC yn T001,
<Shift> can be pressed in order to perform a move instead of a copy.
• In case the current Drag&Drop operation would move the currently selected data into the MTC yn T001,
<Ctrl> can be pressed in order to perform a copy instead of a move.
Data of other types are handled according to the definitions which are found later in this document.
Context Menu
The following specific context menu items are provided:
Context Menu Item
Description
Show Sliders > …
sets the visibility of the Slider Area to the state which is specified via the submenu of this item
Pause Visualization
pauses the visualization, which pauses the automatic time shift of the according time domain
Continue Visualization
continues the visualization, which continues the automatic update of all data of the according time
domain
Update Display Time after Open > …
sets the update type of the display time after opening of the Monitoring View File to the type which
is specified via the submenu of this item
Update Display Time after Action > … sets the update type of the display time after an action to the type which is specified via the submenu of this item
Print Screenshot
prints the screenshot of the Monitoring View
Save Screenshot
saves the screenshot of the Monitoring View
Close Chart
closes the MTC yn T001
2.2.3.6
Legend Area
The Legend Area displays all of the data which are present within the MTC yn T001 at the moment.
All of the present data are arranged via legend trees. All data which is assigned to a common axis (either x or y)
is shown together within a common legend tree. The Legend Area can be switched between the legend trees of
the x-axes and the legend trees of the y-axes so that the user is able to make independent grouping for the xand y-axes.
• The x-axis view of the Legend Area shows the currently defined legend trees of data at the present xaxes. One legend tree is displayed for each defined x-axis and all of the data which are present at this xaxis at the moment.
• The y-axis view of the Legend Area shows the currently defined legend trees of data at the present yaxes. One legend tree is displayed for each defined y-axis and all of the data which are present at this yaxis at the moment.
The following screenshot shows an example of the Legend Area of a MTC yn T001:
Figure 43: Example of the Legend Area of a MTC yn T001
English
Release 2012-09
87 / 214
SIPLUS CMS X-Tools - User Manual - 05 - Monitoring System
SIPLUS CMS
Operations via the Left Mouse Button
The following operations can be performed via the left mouse button:
Operation
Description
single click with releasing the button
Selecting of data within the Legend Area is performed identically to the selecting of items within
the other trees of the X-Tools Client.
In case a data within the Legend Area is being selected, all items of other type (e.g. x-axes and yaxes) of the clicked Monitoring Chart are deselected automatically.
single click with keeping the button
A single click of the left mouse button with keeping the button down onto any text within the Legend Area starts a Drag&Drop operation for the currently selected data(s) as soon as the mouse
cursor is moved:
•
a Drag&Drop operation within the same MTC yn T001 moves the dragged data(s) to the
new position
o
•
a Drag&Drop operation to another MTC yn T001 copies the dragged data(s) to the new
position
o
•
double click
<Ctrl> can be pressed in order to execute a copy operation instead of the move operation within the same MTC yn T001
<Shift> can be pressed in order to execute a move operation instead of the copy operation to the other MTC yn T001
<Esc> cancels the current operation without moving or copying anything
A double click of the left mouse button onto any text within the Legend Area opens the Data Style
dialog for the data below the current mouse position.
Operations via the Right Mouse Button
The following operations can be performed via the right mouse button:
Operation
Description
single click with releasing the button
A single click of the right mouse button with releasing the button above the Legend Area opens
the context menu for the Legend Area.
single click with keeping the button
A single click of the right mouse button with keeping the button above the Legend Area starts a
shift operation for the legend texts. The actual shifting is performed when the mouse is moved:
•
[right mouse button down] + [mouse move down] moves the Legend Area down
•
[right mouse button down] + [mouse move up] moves the Legend Area up
•
<Esc> cancels the current operation and sets the position of the Legend Area back to the
place which it had before the shift operation had been started
The shifting of the legend texts is enabled only in case not all of the available legend texts fit into
the currently available vertical space.
English
Release 2012-09
88 / 214
SIPLUS CMS X-Tools - User Manual - 05 - Monitoring System
SIPLUS CMS
Drag&Drop of Data
During all Drag&Drop of data into the Legend Area, the following rules apply:
• In case the current Drag&Drop operation has been started within the MTC yn T001 onto which the drop
is performed, a move operation is being performed by default (the default operation can be changed, see
below).
• In case the current Drag&Drop operation has been started outside the MTC yn T001 onto which the drop
is performed, a copy operation is being performed by default (the default operation can be changed, see
below).
• In case the current Drag&Drop operation would copy the currently selected data into the MTC yn T001,
<Shift> can be pressed in order to perform a move instead of a copy.
• In case the current Drag&Drop operation would move the currently selected data into the MTC yn T001,
<Ctrl> can be pressed in order to perform a copy instead of a move.
• In order to add a data as root of a certain legend tree, the desired data has to be dropped above the current root data of the target legend tree. In case multiple data take part in the current Drag&Drop operation, the first of them becomes the new root of the target legend tree and all others are listed directly below it.
• In order to add a data in between two present data of the legend tree, the desired data has to be dropped
in between the two desired data of the target legend tree. In case multiple data take part in the current
Drag&Drop operation, all of them are inserted in between the two desired data of the target legend tree.
• In order to add a data at the end of a certain legend tree, the desired data has to be dropped below the
last data of the target legend tree. In case multiple data take part in the current Drag&Drop operation, all
of them are added to the end of the target legend tree.
• In order to remove a data from the legend tree with the mouse, the desired data has to be dragged to
any position within the X-Tools Client which does not accept data.
In order to drag a data from the legend tree to another area of the MTC yn T001, the desired data has to be
dragged from its legend tree to the target area. This functionality can be used in order to copy/move the data
onto another (x or y) axis or to create a new (x or y) axis for it. The actual operation which is performed depends
to the area of the MTC yn T001 where the dragged data is dropped.
Context Menu
The following specific context menu items are provided:
Context Menu Item
Description
Show Legend > …
sets the visibility of the legend to the state which is specified via the submenu of this item
Legend Tree Mode > …
specifies whether the legend trees shall assort the data with common x-axes or with common yaxes
Show Data Sources > …
specifies whether the legend trees shall display the name of the source server together with the
data name or not
Create new x-Axis
creates a new x-axis and moves the selected data(s) onto this new x-axis
Create new y-Axis
creates a new y-axis and moves the selected data(s) onto this new y-axis
Create new x- and y-Axes
creates a new x- and a new y-axis and moves the selected data(s) onto these new x- and y-axes
Data Style…
opens the Data Style dialog for the selected data(s)
Copy Data Style
copies the style of the data below the current mouse position
Paste Data Style
pastes the currently copied data style onto the data below the current mouse position
Remove Data
removes the selected data(s) from the MTC yn T001
Print Screenshot
prints the screenshot of the Monitoring View
Save Screenshot
saves the screenshot of the Monitoring View
Close Chart
closes the MTC yn T001
English
Release 2012-09
89 / 214
SIPLUS CMS X-Tools - User Manual - 05 - Monitoring System
2.2.3.7
SIPLUS CMS
Toolbar Area
The Toolbar Area displays the buttons which are provided for fast access to frequently used functionalities.
The following screenshot shows an example of the Toolbar Area of a MTC yn T001:
Figure 44: Example of the Toolbar Area of a MTC yn T001
Operations via the Left Mouse Button
The following operations can be performed via the left mouse button:
Operation
Description
single click onto the On/Off Measurement Cursors button
A single click of the left mouse button onto the On/Off Measurement Cursors button toggles the
measurement cursors between on and off.
single click onto the On/Off Advanced
Cursors button
A single click of the left mouse button onto the On/Off Advanced Cursors button toggles the advanced cursors between on and off.
single click onto the On/Off Frequency Markers button
A single click of the left mouse button onto the On/Off Frequency Markers button toggles the frequency markers between on and off.
single click onto the Undo button
A single click of the left mouse button onto the Undo button undoes the last operation from the
undo buffer.
single click onto the Redo button
A single click of the left mouse button onto the Redo button redoes the last operation from the
redo buffer.
single click onto the Continue Visualization button
A single click of the left mouse button onto the Continue Visualization button continues the visualization.
This button applies to all currently present data independently to whether they are paused or running at the moment. The Continue Visualization button sets the visualization of all data of all (x
and y) axes to running.
single click onto the Pause Visualization button
A single click of the left mouse button onto the Pause Visualization button pause the visualization.
This button applies to all currently present data independently to whether they are paused or running at the moment. The Pause Visualization button sets the visualization of all data of all (x and
y) axes to paused.
single click onto the Store Data Snap- A single click of the left mouse button onto the Store Data Snapshot button starts the storing of the
shot button
data which are contained within the MTC yn T001.
While the storing is in progress, the Storage Progress dialog shows the current progress of the
storing and also can be used in order to cancel the storing.
See also tutorial, chapter “Storing of Data Snapshots out of the Monitoring System”.
Operations via the Right Mouse Button
The following operation can be performed via the right mouse button:
Operation
Description
single click with releasing the button
A single click of the right mouse button with releasing the button above the Toolbar Area opens
the context menu for the Toolbar Area. The displayed context menu is dependent to the clicked
toolbar button as described below.
Context Menu
The following specific context menu items are provided for the On/Off Measurement Cursors button:
Context Menu Item
Description
Show Toolbar > …
sets the visibility of the toolbar to the state which is specified via the submenu of this item
Show Measurement Cursors > …
sets the visibility of the measurement cursors to the state which is specified via the submenu of
this item
Restore Measurement Cursors
restores the positions of the measurement cursors so that both of them are visible at the screen
again
Select Cursor > …
specifies which measurement cursor shall have the input focus at the moment
Print Screenshot
prints the screenshot of the Monitoring View
Save Screenshot
saves the screenshot of the Monitoring View
Close Chart
closes the MTC yn T001
English
Release 2012-09
90 / 214
SIPLUS CMS X-Tools - User Manual - 05 - Monitoring System
SIPLUS CMS
The following specific context menu items are provided for the On/Off Advanced Cursors button:
Context Menu Item
Description
Show Toolbar > …
sets the visibility of the toolbar to the state which is specified via the submenu of this item
Show Harmonics > …
sets the visibility of the harmonic cursors to the state which is specified via the submenu of this
item
Show Subharmonics > …
sets the visibility of the subharmonic cursors to the state which is specified via the submenu of this
item
Show Sidebands > …
sets the visibility of the sideband cursors to the state which is specified via the submenu of this
item
Restore Advanced Cursor > …
restores the position of the chosen advanced cursors so that it is visible at the screen again
Select Cursor > …
specifies which advanced cursor shall have the input focus at the moment
Print Screenshot
prints the screenshot of the Monitoring View
Save Screenshot
saves the screenshot of the Monitoring View
Close Chart
closes the MTC yn T001
The following specific context menu items are provided for the On/Off Frequency Markers button:
Context Menu Item
Description
Show Toolbar > …
sets the visibility of the toolbar to the state which is specified via the submenu of this item
Show Frequency Markers > …
sets the visibility of the frequency markers to the state which is specified via the submenu of this
item
Restore Main Frequency Marker
restores the position of the chosen advanced cursors so that it is visible at the screen again
Select Main Frequency Marker
switches the input focus to the Main Frequency Marker
Configure Frequency Markers …
opens the Configure Frequency Markers dialog
Copy Frequency Markers
copies the frequency marker definitions of the MTC yn T001
Paste Frequency Markers
overwrites the current frequency marker definitions of the MTC yn T001 with the previously copied
frequency marker definitions
Print Screenshot
prints the screenshot of the Monitoring View
Save Screenshot
saves the screenshot of the Monitoring View
Close Chart
closes the MTC yn T001
English
Release 2012-09
91 / 214
SIPLUS CMS X-Tools - User Manual - 05 - Monitoring System
SIPLUS CMS
The following specific context menu items are provided for the Undo button:
Context Menu Item
Description
Show Toolbar > …
sets the visibility of the toolbar to the state which is specified via the submenu of this item
Undo
undoes the last operation from the undo buffer
Undo all
undoes all operations from the undo buffer
Clear Undo/Redo Buffer
removes all entries from the undo/redo buffer of the MTC yn T001
Change Undo/Redo Buffer Size
opens the Chart Options dialog, sets the input focus to the Undo/Redo Buffer Size edit control
and puts it into editing mode
Print Screenshot
prints the screenshot of the Monitoring View
Save Screenshot
saves the screenshot of the Monitoring View
Close Chart
closes the MTC yn T001
The following specific context menu items are provided for the Redo button:
Context Menu Item
Description
Show Toolbar > …
sets the visibility of the toolbar to the state which is specified via the submenu of this item
Redo
redoes the last operation from the redo buffer
Redo all
redoes all operations from the redo buffer
Clear Undo/Redo Buffer
removes all entries from the undo/redo buffer of the MTC yn T001
Change Undo/Redo Buffer Size
opens the Chart Options dialog, sets the input focus to the Undo/Redo Buffer Size edit control
and puts it into editing mode
Print Screenshot
prints the screenshot of the Monitoring View
Save Screenshot
saves the screenshot of the Monitoring View
Close Chart
closes the MTC yn T001
The following specific context menu items are provided for the Pause Visualization button:
Context Menu Item
Description
Show Toolbar > …
sets the visibility of the toolbar to the state which is specified via the submenu of this item
Pause Visualization
pauses the visualization, which stops the automatic update of all data
Continue Visualization
continues the visualization, which continues the automatic update of all data
Print Screenshot
prints the screenshot of the Monitoring View
Save Screenshot
saves the screenshot of the Monitoring View
Close Chart
closes the MTC yn T001
The following specific context menu items are provided for the Continue Visualization button:
Context Menu Item
Description
Show Toolbar > …
sets the visibility of the toolbar to the state which is specified via the submenu of this item
Pause Visualization
pauses the visualization, which stops the automatic update of all data
Continue Visualization
continues the visualization, which continues the automatic update of all data
Print Screenshot
prints the screenshot of the Monitoring View
Save Screenshot
saves the screenshot of the Monitoring View
Close Chart
closes the MTC yn T001
English
Release 2012-09
92 / 214
SIPLUS CMS X-Tools - User Manual - 05 - Monitoring System
SIPLUS CMS
The following specific context menu items are provided for the Store Data Snapshot button:
Context Menu Item
Description
Show Toolbar > …
sets the visibility of the toolbar to the state which is specified via the submenu of this item
Store Data Snapshot
starts the storing of the data which are contained within the MTC yn T001
Data Snapshot Scope > …
sets the scope for data snapshots to the setting which is specified via the submenu of this item
Print Screenshot
prints the screenshot of the Monitoring View
Save Screenshot
saves the screenshot of the Monitoring View
Close Chart
closes the MTC yn T001
2.2.3.8
Measurement Cursors
The Measurement Cursors are represented through two vertical lines. The Measurement Cursors can be shifted
independently in horizontal direction.
The following screenshot shows an example of the Measurement Cursors of a MTC yn T001:
Figure 45: Example of the Measurement Cursors of a MTC yn T001
Operations via the Left Mouse Button
The following operations can be performed via the left mouse button:
Operation
Description
single click with keeping the button
A single click of the left mouse button with keeping the button starts a shift operation. The actual
shifting of the measurement cursor is performed when the mouse is moved:
•
[left mouse button down] + [mouse move] shifts the targeted measurement cursor horizontally to the new mouse position
The values which are displayed by the Measurement Cursors table are updated automatically
while the shifting is performed.
English
Release 2012-09
93 / 214
SIPLUS CMS X-Tools - User Manual - 05 - Monitoring System
SIPLUS CMS
Operations via the Right Mouse Button
The following operations can be performed via the right mouse button:
Operation
Description
single click with keeping the button
A single click of the right mouse button with keeping the button starts a shift operation. The actual
shifting of the measurement cursors is performed when the mouse is moved:
•
[right mouse button down] + [mouse move] shifts both measurement cursors horizontally
simultaneously with keeping the value distance between them
The values which are displayed by the Measurement Cursors table are updated automatically
while the shifting is performed.
2.2.3.9
Advanced Cursors
The Advanced Cursors can be used in order to show harmonics, subharmonics and sidebands. Each Advanced
Cursor is represented through a vertical line and can be shifted independently in horizontal direction.
The following screenshot shows an example of the harmonics of a MTC yn T001:
Figure 46: Example of the Harmonics of a MTC yn T001
English
Release 2012-09
94 / 214
SIPLUS CMS X-Tools - User Manual - 05 - Monitoring System
SIPLUS CMS
The following screenshot shows an example of the subharmonics of a MTC yn T001:
Figure 47: Example of the Subharmonics of a MTC yn T001
The following screenshot shows an example of the sidebands of a MTC yn T001:
Figure 48: Example of the Sidebands of a MTC yn T001
English
Release 2012-09
95 / 214
SIPLUS CMS X-Tools - User Manual - 05 - Monitoring System
SIPLUS CMS
Operations via the Left Mouse Button
The following operations can be performed via the left mouse button:
Operation
Description
single click with keeping the button
A single click of the left mouse button above the 1. Harmonic, Center Frequency or a sideband
with keeping the button starts a shift operation. The actual shifting is performed when the mouse
is moved:
•
•
[left mouse button down] + [mouse move] shifts the 1. Harmonic, Center Frequency or
sideband horizontally to the new mouse position
o
whenever the position of the 1. Harmonic is changed, the position of all harmonics and
subharmonics is updated automatically
o
whenever the Center Frequency is changed, the position of all sidebands is updated
automatically
o
whenever a sideband is changed, the position of all other sidebands is updated automatically
in case <Alt> is pressed while the shifting is performed, the shifted cursor snaps to the exact x-position of close values
The values which are displayed by the Advanced Cursors table are updated automatically while
the shifting is performed.
Operations via the Right Mouse Button
The following operations can be performed via the right mouse button:
Operation
Description
single click with keeping the button
A single click of the right mouse button above the 1. Harmonic, Center Frequency or a sideband
with keeping the button starts a shift operation. The actual shifting is performed when the mouse
is moved:
•
in case the mouse cursor is above the 1. Harmonic or above the Center Frequency, [right
mouse button down] + [mouse move] shifts both advanced cursors horizontally simultaneously with keeping the value distance between them
o
whenever the position of the 1. Harmonic is changed, the position of all harmonics is
updated automatically
o
whenever the Center Frequency is changed, the position of all sidebands is updated
automatically
The values which are displayed by the Advanced Cursors table are updated automatically while
the shifting is performed.
English
Release 2012-09
96 / 214
SIPLUS CMS X-Tools - User Manual - 05 - Monitoring System
2.2.3.10
SIPLUS CMS
Frequency Markers
Each Frequency Marker is represented through a vertical line. The Main Frequency Marker can be shifted in
horizontal direction (either manually or automatically, see point 0), all other Frequency Markers are either at a
static position or derived from the position of the Main Frequency Marker. The Configure Frequency Markers
dialog is used in order to configure which Frequency Markers shall be available (see point 2.2.3.21).
The following screenshot shows an example of the Frequency Markers of a MTC yn T001:
Figure 49: Example of the Frequency Markers of a MTC yn T001
Operations via the Left Mouse Button
The following operations can be performed via the left mouse button:
Operation
Description
single click with keeping the button
A single click of the left mouse button above the small rectangle at the top of the Main Frequency
Marker starts a shift operation. The actual shifting of the Main Frequency Marker is performed
when the mouse is moved:
•
[left mouse button down] + [mouse move] shifts the Main Frequency Marker horizontally to
the new mouse position
o
•
whenever the position of the Main Frequency Marker is changed, the position of all derived Frequency Markers is updated automatically
in case <Alt> is pressed while the shifting is performed, the Main Frequency Marker snaps
to the exact x-position of close values
The values which are displayed by the Frequency Markers table are updated automatically while
the shifting is performed.
dropping of data
In case a data is dropped onto the vertical line of the Main Frequency Marker, the dropped data is
linked to the Main Frequency Marker (see point 2.2.3.11.5).
Operations via the Right Mouse Button
The following operations can be performed via the right mouse button:
Operation
Description
single click with keeping the button
A single click of the right mouse button with keeping the button starts a shift operation. The actual
shifting of the measurement cursors is performed when the mouse is moved:
•
[right mouse button down] + [mouse move] shifts both measurement cursors horizontally
simultaneously with keeping the value distance between them
The values which are displayed by the Frequency Markers table are updated automatically while
the shifting is performed.
English
Release 2012-09
97 / 214
SIPLUS CMS X-Tools - User Manual - 05 - Monitoring System
SIPLUS CMS
Context Menu
The following context menu items are provided for each Frequency Marker:
Context Menu Item
Description
Hide Frequency Marker
hides the frequency marker from which the context menu has been called
Show Harmonics > …
sets the visibility of the harmonics of the frequency marker to the state which is specified via the
submenu of this item
Change Number of Harmonics …
opens the Configure Frequency Markers dialog and puts the Number of Harmonics cell of the
frequency marker into editing mode
Change Position …
opens the Configure Frequency Markers dialog and puts the Value cell of the frequency marker
into editing mode
2.2.3.11
2.2.3.11.1
Using of Cursors and Markers
The currently selected Cursor
Whenever a cursor or marker is moved via the mouse it becomes the currently selected cursor. The currently
selected cursor also can be chosen via the context menus of the Toolbar (see point 2.2.3.7) and via the keyboard (see point 2.2.3.2).
The position of the currently selected cursor can be changed and restored via <Cursor left>, <Cursor right> and
<R>.
2.2.3.11.2
The current Cursor Data
The cursors and markers of each MTC yn T001 always are assigned to one of the data from the legend. The x
and y information at the bottom of each cursor/marker line always shows the values of the current cursor data.
Within the Advanced Cursors and Frequency Markers tables, only the values of the data which is present at the
x-axis of the current cursor data are displayed.
In addition, all cursors and markers preferential snap to values of the current cursor data – however, in case
there are no values of the current cursor data nearby and there are values nearby of another data, a cursor/marker also can snap to this other data. In this case, this other data becomes the new cursor data.
The current cursor data can be changed also via the context menu of the Legend (see point 2.2.3.6).
2.2.3.11.3
Labeling of Cursor and Marker Lines
At the top of the line of each cursor/marker, its name is displayed. The same name also is being used within the
Measurement Cursors, Advanced Cursors and Frequency Markers tables.
A small icon at the top of the vertical line is shown in case the cursor/marker is currently linked to another cursor/marker (see point 2.2.3.11.4).
At the bottom of the line of each cursor/marker, the current x and y values of the cursor/marker and of the current cursor data (see point 2.2.3.11.2) are displayed.
English
Release 2012-09
98 / 214
SIPLUS CMS X-Tools - User Manual - 05 - Monitoring System
2.2.3.11.4
SIPLUS CMS
Linking of Cursors/Markers
Cursors can be linked to cursors/markers in order to receive advanced measurement capabilities. While a cursor is linked to a cursor/marker, moving of one of them automatically moves the other one also. In addition, turning on/off of a linked cursor/marker automatically also turns on/off its currently linked cursor/marker.
The following items can be linked:
• Measurement Cursor 1 and Measurement Cursor 2 can be linked to
o the 1. Harmonic cursor
o the Center Frequency cursor
o any of the harmonics and subharmonics of the 1. Harmonic cursor
o any of the sidebands of the Center Frequency cursor
o any of the frequency markers
o any of the harmonics of the frequency markers
• the 1. Harmonic cursor and the Center Frequency cursor can be linked to
o any of the frequency markers
o any of the harmonics of the frequency markers
In order to link a cursor to another cursor/marker, the cursor must be snapped to this other cursor/marker (with
<Alt> being hold down while the cursor is shifted). While a cursor is linked to another cursor/marker, an according icon is displayed at the top of the vertical line. In order to break the link between a cursor and its currently
linked cursor/marker, the icon must be clicked.
2.2.3.11.5
Linking of Data to the Main Frequency Marker
In order to link a data to the Main Frequency Marker, the data must be dropped onto the vertical line of the Main
Frequency Marker. In case the Main Frequency Marker is linked to a data currently, the name of the linked data
is displayed at the top of the vertical line of the Main Frequency Marker. In order to break the link between the
Main Frequency Marker and its currently linked data, the Main Frequency Marker can be moved away (either
with the mouse or via the keyboard).
While it is linked to a data, the position of the Main Frequency Marker is updated automatically to the value of its
linked data which matches the currently visualized point in time. Whenever the currently visualized point in time
is changed (either because the online visualization is running or because the slide button is moved), the position
of the Main Frequency Marker is updated automatically.
2.2.3.12
Measurement Cursors Table
The Measurement Cursors table contains the values of all Measurement Cursors of all MTC yn T001s which
are present within the parent Monitoring View Editor. The following screenshot shows an example for the
Measurement Cursors table for a MTC yn T001:
Figure 50: Example of a Measurement Cursors table of a MTC yn T001
English
Release 2012-09
99 / 214
SIPLUS CMS X-Tools - User Manual - 05 - Monitoring System
SIPLUS CMS
It is opened within the Cursor Area of the parent Monitoring View Editor of the MTC yn T001:
Column
Description
No.
contains the row number
Chart
contains the name of the chart from which the data comes
Data
contains the name of the data
Unit
contains the unit of the data
X1
contains the x-value of the data at the x-position of cursor 1
Y1
contains the y-value of the data at the y-position of cursor 1
X2
contains the x-value of the data at the x-position of cursor 2
Y2
contains the y-value of the data at the y-position of cursor 2
X2-X1
contains the difference in between X2 and X1
Y2-Y1
contains the difference in between Y2 and Y1
The contents of the Measurement Cursors table can be copied to the clipboard of Windows. From there, they
can be inserted into any other compatible application.
2.2.3.13
Advanced Cursors Table
The Advanced Cursors table contains the values of all Advanced Cursors of all MTC yn T001s which are present within the parent Monitoring View Editor. The following screenshot shows an example for the Advanced
Cursors table for a MTC yn T001:
Figure 51: Example of an Advanced Cursors table of a MTC yn T001
English
Release 2012-09
100 / 214
SIPLUS CMS X-Tools - User Manual - 05 - Monitoring System
SIPLUS CMS
It is opened within the Cursor Area of the parent Monitoring View Editor of the MTC yn T001:
Column
Description
No.
contains the row number
Chart
contains the name of the chart from which the data comes
Data
contains the name of the data
Unit
contains the unit of the data
Advanced Cursor
contains the name of the Advanced Cursor
X
contains the x-value of the data at the x-position of the cursor
Y
contains the y-value of the data at the y-position of the cursor
X-X(Ref)
contains the difference in between the x-value of the cursor and the x-value of the reference
Y-Y(Ref)
contains the difference in between the y-value of the cursor and the y-value of the reference
The contents of the Advanced Cursors table can be copied to the clipboard of Windows. From there, they can
be inserted into any other compatible application.
2.2.3.14
Frequency Markers Table
The Frequency Markers table contains the values of all Frequency Markers of all MTC yn T001s which are present within the parent Monitoring View Editor. The following screenshot shows an example for the Frequency
Markers table for a MTC yn T001:
Figure 52: Example of a Frequency Markers table of a MTC yn T001
It is opened within the Cursor Area of the parent Monitoring View Editor of the MTC yn T001:
Column
Description
No.
contains the row number
Chart
contains the name of the chart from which the data comes
Data
contains the name of the data
Unit
contains the unit of the data
Frequency Marker
contains the name of the Frequency Marker
Frequency [Hz]
contains the frequency of the Frequency Marker
Amplitude
contains the amplitude of the data at the frequency of the Frequency Marker
The contents of the Frequency Markers table can be copied to the clipboard of Windows. From there, they can
be inserted into any other compatible application.
English
Release 2012-09
101 / 214
SIPLUS CMS X-Tools - User Manual - 05 - Monitoring System
2.2.3.15
2.2.3.15.1
SIPLUS CMS
Chart Options Dialog
Overview
The following screenshot shows an example of a Chart Options dialog:
Figure 53: Example of a Chart Options Dialog of a MTC yn T001
English
Release 2012-09
102 / 214
SIPLUS CMS X-Tools - User Manual - 05 - Monitoring System
2.2.3.15.2
SIPLUS CMS
Chart Options Table
The Chart Options table contains the chart options of the MTC yn T001:
Parameter
Description
Chart Name
allows to enter a name for the chart
Time Domain
allows to choose the time domain
Time Base
allows to choose the time base
Show Background Grid
allows to choose whether the background grid shall be shown within the Curve Area
Show Legend
allows to choose whether the Legend Area shall be shown
Show Toolbar
allows to choose whether the Toolbar Area shall be shown
Show x-Axes
allows to choose whether the x-Axes Area shall be shown
Show y-Axes
allows to choose whether the y-Axes Area shall be shown
Show Sliders
allows to choose whether the Slider Area shall be shown
Rescale x-Axes after Open
allows to choose whether the x-axes shall be scaled automatically after the Monitoring View File
has been opened
Rescale x-Axes after Action
allows to choose whether the x-axes shall be scaled automatically after the displayed data have
been modified outside the MTC yn T001 or after a new data has been dropped into the MTC yn
T001
Rescale y-Axes after Open
allows to choose whether the y-axes shall be scaled automatically after the Monitoring View File
has been opened
Rescale y-Axes after Action
allows to choose whether the y-axes shall be scaled automatically after the displayed data have
been modified outside the MTC yn T001 or after a new data has been dropped into the MTC yn
T001
Update Display Time after Open
allows to choose whether the display time shall be updated automatically after the Monitoring
View File has been opened
Update Display Time after Action
allows to choose whether the display time shall be updated automatically after the displayed data
have been modified outside the MTC yn T001 or after a new data has been dropped into the MTC
yn T001
Undo/Redo Buffer Size
allows to enter the total size of undo/redo operations which shall be remembered by the MTC yn
T001
Data Snapshot Scope
allows to choose whether data snapshots shall store only the data from the currnet Monitoring
Chart or from the whole Monitoring View
Number of Harmonics
allows to enter the total number of harmonics which shall be shown by the Monitoring Chart
Number of Subharmonics
allows to enter the total number of subharmonics which shall be shown by the Monitoring Chart
Number of Sidebands
allows to enter the total number of sidebands which shall be shown by the Monitoring Chart
Chart Name
The Chart Name is used by other modules in order to identify a certain MTC yn T001. Within the current Monitoring View, the Chart Name of each MTC yn T001 must be unique.
Time Domain
The following time domains are supported by the Chart Options dialog of the MTC yn T001:
• Online Data with absolute Timestamps
• Offline Data with absolute Timestamps
• Offline Data with relative Timestamps
The Time Domain cell displays the time domain which is currently being used by all data of the MTC yn T001. In
case more than one time domain is being used currently, the Time Domain cell stays empty.
When another time domain is being chosen via the Time Domain cell, the chosen time domain is applied to all
of the data of the MTC yn T001. As a result, all data internally are being put onto the t-axis with chosen time
domain. In case there is no data with the known name and matching time domain, the affected data becomes
marked as not present.
In case the time domain is being changed, the x-/y-axes can be updated automatically in case the Rescale xAxis after Action or Rescale y-Axis after Action options are being set to “Yes”.
English
Release 2012-09
103 / 214
SIPLUS CMS X-Tools - User Manual - 05 - Monitoring System
SIPLUS CMS
Time Base
The chosen time base specifies how the time stamps of each probe, which are being stored in GMT internally,
are being represented by the MTC yn T001. In case online data is being displayed and the option “Use the local
Time of the Offline Data” is being chosen, the time base for all online data is taken from the time base setting of
the Monitoring View (like if “Default” would have been chosen for the time base of the MTC yn T001).
Rescale x-Axes after Open
The rescale type for the x-axes after open can be modified for each x-axis independently via the context menu
of the x-Axes Area in order to overwrite the global setting of the MTC yn T001.
Rescale x-Axes after Open
Description
Yes
In case the rescale mode for the x-axes after open is set to “Yes”, the MTC yn T001 automatically
rescales its x-axes after the Monitoring View File has been opened so that all values from all data
of all x-axes become visible.
No
In case the rescale mode for the x-axes after open is set to “No”, the MTC yn T001 does not touch
the scaling of its x-axes after the Monitoring View File has been opened and leaves it at the stored
values from the Monitoring View File.
Rescale x-Axes after Action
The rescale type for the x-axes after an action can be modified for each x-axis independently via the context
menu of the x-Axes Area in order to overwrite the global setting of the MTC yn T001.
Rescale x-Axes after Action
Description
Yes
In case the rescale mode for the x-axes after an action is set to “Yes”, the MTC yn T001 automatically rescales its x-axes after an external action has modified the displayed data so that all
values from all data of the affected x-axes become visible.
The following actions result in an automatic rescale of the x-axes in case this mode is chosen:
No
•
another part of a contained data has been opened/appended/overwritten
•
a contained data has been recalculated
•
another data is added to the MTC yn T001
In case the rescale mode for the x-axes after an action is set to “No”, the MTC yn T001 does not
touch the scaling of its x-axes after an external action has modified the displayed data and leaves
it at the current values.
Rescale y-Axes after Open
The rescale type for the y-axes after open can be modified for each y-axis independently via the context menu
of the y-Axes Area in order to overwrite the global setting of the MTC yn T001.
Rescale y-Axes after Open
Description
Yes
In case the rescale mode for the y-axes after open is set to “Yes”, the MTC yn T001 automatically
rescales its y-axes after the Monitoring View File has been opened so that all values from all data
of all y-axes become visible.
No
In case the rescale mode for the y-axes after open is set to “No”, the MTC yn T001 does not touch
the scaling of its y-axes after the Monitoring View File has been opened and leaves it at the stored
values from the Monitoring View File.
English
Release 2012-09
104 / 214
SIPLUS CMS X-Tools - User Manual - 05 - Monitoring System
SIPLUS CMS
Rescale y-Axes after Action
The rescale type for the y-axes after an action can be modified for each y-axis independently via the context
menu of the y-Axes Area in order to overwrite the global setting of the MTC yn T001.
Rescale y-Axes after Action
Description
Yes
In case the rescale mode for the y-axes after an action is set to “Yes”, the MTC yn T001 automatically rescales the y-axes after an external action has modified the displayed data (e.g. when
another part of the offline data has been loaded, …) so that all values from all data of the affected
y-axes become visible.
The following actions result in an automatic rescale of the y-axes in case this mode is chosen:
No
•
another part of a contained data has been opened/appended/overwritten
•
a contained data has been recalculated
•
another data is added to the MTC yn T001
In case the rescale mode for the y-axes after an action is set to “No”, the MTC yn T001 does not
touch the scaling of its y-axes after an external action has modified the displayed data and leaves
it at the current values.
Update Display Time after Open
The update type for the display time after open can be modified for each time domain independently via the
context menu of the Slider Area in order to overwrite the global setting of the MTC yn T001.
Update Display Time after Open
Description
Yes
In case the update mode for the display time after open is set to “Yes”, the MTC yn T001 automatically updates its display time after the Monitoring View File has been opened so that the latest
available values from all data of each time domain become visible.
No
In case the update mode for the display time after open is set to “No”, the MTC yn T001 does not
touch the values of its display times after the Monitoring View File has been opened and leaves it
at the stored values from the Monitoring View File.
Update Display Time after Action
The update type for the display time after an action can be modified for each time domain independently via the
context menu of the Slider Area in order to overwrite the global setting of the MTC yn T001.
Update Display Time after Action
Description
Yes
In case the update mode for the display time after an action is set to “Yes”, the MTC yn T001
automatically updates the display time after an external action has modified the displayed data so
that the latest available values from all data of each time domain become visible.
The following actions result in an automatic update of the display time in case this mode is chosen:
No
2.2.3.15.3
•
another part of a contained data has been opened/appended/overwritten
•
a contained data has been recalculated
•
another data is added to the MTC yn T001
In case the update mode for the display time after an action is set to “No”, the MTC yn T001 does
not touch the values of its display times after an external action has modified the displayed data
and leaves it at the current values.
Menu Bar
Menu Button
Description
Restore Defaults
Sets all options back to their default settings.
Set as Standard
Sets the current options as standard options for each new MTC yn T001. The options of already
existing MTC yn T001s are not being changed by this operation.
OK
Closes the dialog and takes over all user inputs.
Cancel
Closes the dialog and discards all user inputs.
Apply
Takes over all user inputs without closing the dialog. This control is enabled only in case the settings within the dialog have been changed.
English
Release 2012-09
105 / 214
SIPLUS CMS X-Tools - User Manual - 05 - Monitoring System
2.2.3.16
2.2.3.16.1
SIPLUS CMS
Chart Styles Dialog
Overview
The following screenshot shows an example of a Chart Styles dialog:
Figure 54: Example of a Chart Styles Dialog of a MTC yn T001
2.2.3.16.2
Default Styles of Data Table
The Default Styles of Data table contains the default styles of data within the MTC yn T001:
Parameter
Description
Data #01 … Data #32
displays the currently chosen color and style for the according data
A double-click into the Color column of this control opens the Select Color dialog for the according row.
A double-click into the Example column of this control opens the Select Style dialog for the according row.
English
Release 2012-09
106 / 214
SIPLUS CMS X-Tools - User Manual - 05 - Monitoring System
2.2.3.16.3
SIPLUS CMS
Styles of Controls Table
The Styles of Controls table contains the styles of the controls of the MTC yn T001:
Parameter
Description
Chart Background
displays the currently chosen color for the chart background
Background Grid
displays the currently chosen style for the background grid
Cursor 1
displays the currently chosen color for the first cursor
Cursor 2
displays the currently chosen color for the second cursor
Zooming Frame
displays the currently chosen style for the zooming frame
Text of selected Items (Active)
displays the currently chosen color of the text of active selected items
Text of selected Items (Inactive)
displays the currently chosen color of the text of inactive selected items
Background of selected Items (Active) displays the currently chosen color of the background of active selected items
Background of selected Items (Inactive)
displays the currently chosen color of the background of inactive selected items
A double-click into the Color column of any row opens the Select Color dialog for the according row.
A double-click into the Example column of a row which supports different styles opens the Select Style dialog
for the according row. In case different styles are not supported by a row, a double-click into the Example column opens the Select Color dialog for the according row.
2.2.3.16.4
Menu Bar
Menu Button
Description
Restore Defaults
Sets all styles back to their default settings.
Set as Standard
Sets the current styles as standard styles for each new MTC yn T001. The styles of already existing MTC yn T001s are not being changed by this operation.
OK
Closes the dialog and takes over all user inputs.
Cancel
Closes the dialog and discards all user inputs.
Apply
Takes over all user inputs without closing the dialog. This control is enabled only in case the styles
within the dialog have been changed.
2.2.3.17
2.2.3.17.1
Data Style Dialog
Overview
The following screenshot shows an example of a Data Style dialog:
Figure 55: Example of a Data Style Dialog of a MTC yn T001
English
Release 2012-09
107 / 214
SIPLUS CMS X-Tools - User Manual - 05 - Monitoring System
2.2.3.17.2
SIPLUS CMS
Style Parameters Table
The Style Parameters table contains the visualization style parameters of the currently selected data:
Parameter
Description
Line Type
allows to switch between the available line types
Line Color
allows to enter the desired line color
Line Strength
allows to switch between the available line strengths
Mark Type
allows to switch between the available mark types
Mark Color
allows to enter the desired mark color
Mark Strength
allows to switch between the available mark strengths
Rendering Mode
N/A
Interpolation Mode
allows to switch between the available interpolation modes
Example
displays an example curve according to the specified data style
A value of “Default” can be assigned to each style parameter. In case “Default” is being chosen, the according
value from the Chart Styles dialog is being used for the visualization of the data.
Interpolation Mode
Interpolation Mode
Description
Bars
When the interpolation mode “Bars” is chosen for a data, the visualization displays one bar in y
direction for each present value at the x-axis. The width of the displayed bars is dependent to the
currently chosen Line Strength.
Lines
When the interpolation mode “Lines” is chosen for a data, the visualization connects two rendered
pixels at the screen via a line interpolation. The data curve always is visualized from the last rendered value to the next rendered value via a straight connection.
In case a next rendered value is not available, the data curve stops at the last rendered value.
Stairs
When the interpolation mode “Stairs” is chosen for a data, the visualization connects two rendered
pixels at the screen via a stairs interpolation. The data curve always is visualized from the left
rendered value to the next right rendered value horizontally.
In case a next rendered value is not available, the last rendered value is extended horizontally to
the newer time.
2.2.3.17.3
Menu Bar
Menu Button
Description
Restore Defaults
Sets all styles back to their default settings.
OK
Closes the dialog and takes over all user inputs.
Cancel
Closes the dialog and discards all user inputs.
Apply
Takes over all user inputs without closing the dialog. This control is enabled only in case the styles
within the dialog have been changed.
English
Release 2012-09
108 / 214
SIPLUS CMS X-Tools - User Manual - 05 - Monitoring System
2.2.3.18
2.2.3.18.1
SIPLUS CMS
Select Style Dialog
Overview
The following screenshot shows an example of a Select Style dialog:
Figure 56: Example of a Select Style Dialog of a MTC yn T001
The functionality of the Select Style dialog matches the functionality of the Data Style dialog (see point
2.2.3.17).
2.2.3.19
2.2.3.19.1
Manual scale x-Axis Dialog
Overview
The following screenshot shows an example of a Manual scale x-Axis dialog:
Figure 57: Example of a Manual scale x-Axis Dialog of a MTC yn T001
English
Release 2012-09
109 / 214
SIPLUS CMS X-Tools - User Manual - 05 - Monitoring System
2.2.3.19.2
SIPLUS CMS
x-Axis Parameters Table
The x-Axis Parameters table contains the parameters of a currently selected x-axis:
Parameter
Description
Auto scale Axis
allows to switch between the available auto scale axis modes
Minimum Value
allows to enter the minimum value of the scaling
Minimum Value Exponent
allows to switch between the supported minimum value exponents
Maximum Value
allows to enter the maximum value of the scaling
Maximum Value Exponent
allows to switch between the supported maximum value exponents
Auto set Scaling Interval
allows to switch between the available modes for the automatic scaling interval
Scaling Interval
allows to enter the scaling interval
Scaling Interval Exponent
allows to switch between the supported scaling interval exponents
Minor Scaling Divider
allows to switch between the available minor scaling dividers
Auto scale Axis
Auto scale Axis
Description
On
In this mode, the MTC yn T001 constantly sets the scaling of the x-axis so that all available values
of the data at the x-axis stay visible.
Off
In this mode, the MTC yn T001 uses the specified Minimum Value and Maximum Value parameters for the scaling of the x-axis.
Auto set Scaling Interval
Auto set Scaling Interval
Description
On
In this mode, the MTC yn T001 constantly sets the scaling interval of the x-axis according to the
currently displayed time interval.
Off
In this mode, the MTC yn T001 uses the specified Scaling Interval and Scaling Interval Exponent
parameters for the scaling interval of the x-axis. In case the specified parameters would lead to
overlapping numbers, the automatic scaling interval is being used automatically until the specified
parameters allow a valid scaling again.
2.2.3.19.3
Menu Bar
Menu Button
Description
OK
Closes the dialog and takes over all user inputs.
Cancel
Closes the dialog and discards all user inputs.
Apply
Takes over all user inputs without closing the dialog. This control is enabled only in case the settings within the dialog have been changed.
English
Release 2012-09
110 / 214
SIPLUS CMS X-Tools - User Manual - 05 - Monitoring System
2.2.3.20
2.2.3.20.1
SIPLUS CMS
Manual scale y-Axis Dialog
Overview
The following screenshot shows an example of a Manual scale y-Axis dialog:
Figure 58: Example of a Manual scale y-Axis Dialog of a MTC yn T001
The functionality of the Manual scale y-Axis dialog matches the functionality of the Manual scale x-Axis dialog
(see point 2.2.3.19).
2.2.3.21
2.2.3.21.1
Configure Frequency Markers Dialog
Overview
The following screenshot shows an example of a Configure Frequency Markers dialog:
Figure 59: Example of a Configure Frequency Markers Dialog of a MTC yn T001
English
Release 2012-09
111 / 214
SIPLUS CMS X-Tools - User Manual - 05 - Monitoring System
2.2.3.21.2
SIPLUS CMS
Frequency Markers Table
The Frequency Markers table contains the currently defined frequency markers:
Column
Description
No.
contains the row number
Enable
specifies whether the frequency marker from this row shall be visible within the Curve Area
Name
contains the name of the frequency marker
Reference
specifies whether the value within the Value cell is an absolute or a relative value
Value
contains the frequency or the multiplicator of the frequency marker
Number of Harmonics
contains the number of harmonics which shall be displayed for this frequency marker
The user is able to highlight a complete row (or multiple rows) and to delete them via the context menu (Remove context menu item) and/or via the keyboard (<Del> key).
The last row of the Frequency Markers table always is an empty row and therefore it allows the user to add a
new frequency marker by entering of another name into the Name field of this last row. All other cells of the last
row are empty and disabled as long as the Name field is empty. Whenever a new name has been entered to the
Name field, another new, empty row is added to the Frequency Markers table automatically.
The names must be unique among all present frequency markers.
2.2.3.21.3
Menu Bar
Menu Button
Description
Import
Imports the frequency marker definitions from a .csv file. After this button has been pressed, a
browse dialog opens which allows to choose the input file from the local file system of the X-Tools
Client.
Export
Exports the current frequency marker definitions to a file. After this button has been pressed, a
browse dialog opens which allows to choose the output file from the local file system of the XTools Client.
OK
Closes the dialog and takes over all user inputs.
Cancel
Closes the dialog and discards all user inputs.
Apply
Takes over all user inputs without closing the dialog. This control is enabled only in case the settings within the dialog have been changed.
English
Release 2012-09
112 / 214
SIPLUS CMS X-Tools - User Manual - 05 - Monitoring System
2.2.3.22
SIPLUS CMS
Drag&Drop sensitive Areas
The following screenshot shows the places within a MTC yn T001 onto which data can be dropped in order to
open a new Monitoring Chart:
Figure 60: Dropping of Data in order to open a new Monitoring Chart
The following screenshot shows the places within a MTC yn T001 onto which data can be dropped in order to
add the data to the existing MTC yn T001:
Figure 61: Dropping of Data in order to add it to the existing MTC yn T001
English
Release 2012-09
113 / 214
SIPLUS CMS X-Tools - User Manual - 05 - Monitoring System
2.2.4
SIPLUS CMS
MTC ynm T001
2.2.4.1
Overview
The MTC ynm T001 is used in order to visualize, create and edit y = f(n,m) charts (for example the outputs of
the Histogram2D(), … functions) in the 3D space within a Monitoring View Editor. Multiple editors of this type
can be opened and used simultaneously within one Monitoring View Editor and/or within multiple Monitoring
View Editors.
The following screenshot shows an example of a MTC ynm T001:
Figure 62: Example of a MTC ynm T001
Each control of the MTC ynm T001 has a defined task and provides certain functionalities. The following major
controls are provided by the MTC ynm T001:
• Curve Area
• x-Axis Area
• y-Axis Area
• z-Axis Area
• Slider Area
• Legend Area
• Toolbar Area
• Measurement Cursors
• Measurement Cursors Table
• Chart Options Dialog
• Chart Styles Dialog
• Data Style Dialog
• Select Style Dialog
• Manual scale x-Axis Dialog
• Manual scale y-Axis Dialog
• Manual scale z-Axis Dialog
• Manual scale Color Gradient Dialog
English
Release 2012-09
114 / 214
SIPLUS CMS X-Tools - User Manual - 05 - Monitoring System
SIPLUS CMS
• Drag&Drop sensitive Areas
2.2.4.2
Curve Area
The Curve Area of the MTC ynm T001 displays a 3-dimensional cuboid which contains the current data and is
used in order to visualize data of the function y = f(n,m). Via mouse and keyboard operations the user is able to
rotate, zoom, scroll and maintain the available data.
The following screenshot shows an example of the Curve Area of a MTC ynm T001:
Figure 63: Example of the Curve Area of a MTC ynm T001
Background Grid
The background grid of the MTC ynm T001 extends the lines from the axis labeling into the cuboid. It is represented as a grid of horizontal, vertical and in-depth lines within the cuboid.
The appearing and scaling of the background grid is configured via the Manual scale x-Axis dialog (for the grid
lines of the x-axis), via the Manual scale y-Axis dialog (for the grid lines of the y-axis) and via the Manual
scale z-Axis dialog (for the grid lines of the z-axis).
In case the current background grid configuration is set to “manual” and the vertical, horizontal and/or in-depth
grid lines can not be drawn (because the grid lines would be too close to each other), the background grid
automatically switches to automatic distribution of the grid lines for the affected orientation(s). The manual settings are used again as soon as the scaling of the MTC ynm T001 reaches a value which allows using the
manual configuration.
Curve Visualization
The data interpolation defines how two successive points of an already rendered data are connected when they
are displayed. All supported data interpolation modes are defined by the description of the Data Style dialog.
The data style defines how a data is visualized graphically. It contains the parameters for the color/strength/style
of the line as well as the parameters for the color/strength/style of the mark and the rendering/interpolation
methods. The styles of each data can be defined at different levels by the user.
The style of each data can be set at the following levels, where the settings of a higher level overwrite the settings of a lower level (top = high, bottom = low):
• Data Style dialog of the MTC ynm T001
• default data style of the MTC ynm T001
English
Release 2012-09
115 / 214
SIPLUS CMS X-Tools - User Manual - 05 - Monitoring System
SIPLUS CMS
Keyboard Operations
The following operations can be performed via the keyboard:
Keyboard Operation
Description
<+>
zooms into all three directions simultaneously
<Shift> + <+>
zooms only into the x-axis
<x> + <+>
behaves like <Shift> + <+>
<Ctrl> + <+>
zooms only into the y-axis
<y> + <+>
behaves like <Ctrl> + <+>
<Alt> + <+>
zooms only into the z-axis
<z> + <+>
behaves like <Alt> + <+>
<->
zooms out from all three directions simultaneously
<Shift> + <->
zooms only out from the x-axis
<x> + <->
behaves like <Shift> + <->
<Ctrl> + <->
zooms only out from the y-axis
<y> + <->
behaves like <Ctrl> + <->
<Alt> + <->
zooms only out from the z-axis
<z> + <->
zoom only out from the z-axis
<F>
fits the scaling of all three directions simultaneously
<Ctrl> + <Z>
undoes the latest operation from the undo buffer
<Shift> + <Ctrl> + <Z>
undoes all operations from the undo buffer
<Ctrl> + <Y>
redoes the latest operation from the redo buffer
<Shift> + <Ctrl> + <Y>
redoes all operations from the redo buffer
<Esc>
when <Esc> is being pressed while a mouse operation (e.g. rotating or scrolling) is going on, the
ongoing operation is cancelled
<Cursor left>
moves the currently selected cursor to the next lower element in x-direction
<Cursor right>
moves the currently selected cursor to the next higher element in x-direction
<Cursor down>
moves the currently selected cursor to the next lower element in z-direction
<Cursor up>
moves the currently selected cursor to the next higher element in z-direction
<1>
sets the cursor 1 as currently selected cursor
<2>
sets the cursor 2 as currently selected cursor
Operations via the Left Mouse Button
The following operations can be performed via the left mouse button:
Operation
Description
single click with keeping the button
In case the current mouse position is above the point of intersection of a measurement cursor, a
single click of the left mouse button with keeping the button starts to move the below measurement cursor.
In case the current mouse position is not above the point of intersection of a measurement cursor,
a single click of the left mouse button with keeping the button starts a rotate operation. The actual
rotation is performed when the mouse is moved:
English
Release 2012-09
•
[left mouse button down] + [mouse move] rotates the cuboid into the direction of the mouse
move
•
<Esc> cancels the current operation and sets the orientation of the cuboid back to the orientation which it had before the rotation had been started
116 / 214
SIPLUS CMS X-Tools - User Manual - 05 - Monitoring System
SIPLUS CMS
Operations via the Right Mouse Button
The following operations can be performed via the right mouse button:
Operation
Description
single click with releasing the button
A single click of the right mouse button with releasing the button above the Curve Area opens the
context menu for the Curve Area.
single click with keeping the button
A single click of the right mouse button with keeping the button starts a shift operation. The actual
shifting is performed when the mouse is moved:
•
[right mouse button down] + [mouse move] moves all curves within the cuboid into the direction of the mouse move
o
<Shift> + [right mouse button down] + [mouse move left/up] moves all curves within the
cuboid to the left in direction of the horizontal axis
o
<Shift> + [right mouse button down] + [mouse move right/down] moves all curves
within the cuboid to the right in direction of the horizontal axis
o
English
Release 2012-09
<z> + [right mouse button down] + [mouse move left/up] behaves like <Ctrl> +
[right mouse button down] + [mouse move left]
<Alt> + [right mouse button down] + [mouse move right/down] moves all curves within
the cuboid to the back in the direction of the depth axis
•
<y> + [right mouse button down] + [mouse move right/down] behaves like <Ctrl> +
[right mouse button down] + [mouse move right]
<Alt> + [right mouse button down] + [mouse move left/up] moves all curves within the
cuboid to the front in the direction of the depth axis
o
<y> + [right mouse button down] + [mouse move left/up] behaves like <Ctrl> +
[right mouse button down] + [mouse move left]
<Ctrl> + [right mouse button down] + [mouse move right/down] moves all curves within
the cuboid down in the direction of the vertical axis
o
<x> + [right mouse button down] + [mouse move right/down] behaves like <Shift>
+ [right mouse button down] + [mouse move right]
<Ctrl> + [right mouse button down] + [mouse move left/up] moves all curves within the
cuboid up in the direction of the vertical axis
o
<x> + [right mouse button down] + [mouse move left/up] behaves like <Shift> +
[right mouse button down] + [mouse move left]
<z> + [right mouse button down] + [mouse move right/down] behaves like <Ctrl> +
[right mouse button down] + [mouse move right]
<Esc> cancels the current operation and sets the position of the cuboid back to the position which it had before the shift operation had been started
117 / 214
SIPLUS CMS X-Tools - User Manual - 05 - Monitoring System
SIPLUS CMS
Operations via the Mouse Wheel
The following operations can be performed via the mouse wheel:
Operation
Description
scrolling
Scrolling with the mouse wheel can be used to shift or zoom the cuboid. The actual operation is
performed when the mouse wheel is scrolled:
•
[mouse wheel down] zooms out of the current mouse position in all three directions
•
[mouse wheel up] zooms into the current mouse position in all three directions
•
<Shift> + [mouse wheel down] zooms only out from the horizontal axis from the middle of
the horizontal axis
o
•
<Shift> + [mouse wheel up] zooms only into the horizontal axis from the middle of the horizontal axis
o
•
<y> + [mouse wheel up] behaves like <Ctrl> + [mouse wheel up]
<Alt> + [mouse wheel down] zooms only out from the depth axis from the middle of the
depth axis
o
•
<y> + [mouse wheel down] behaves like <Ctrl> + [mouse wheel down]
<Ctrl> + [mouse wheel up] zooms only into the vertical axis from the middle of the vertical
axis
o
•
<x> + [mouse wheel up] behaves like <Shift> + [mouse wheel up]
<Ctrl> + [mouse wheel down] zooms only out from the vertical axis from the middle of the
vertical axis
o
•
<x> + [mouse wheel down] behaves like <Shift> + [mouse wheel down]
<z> + [mouse wheel down] behaves like <Alt> + [mouse wheel down]
<Alt> + [mouse wheel up] zooms only into the depth axis from the middle of the depth axis
o
<z> + [mouse wheel up] behaves like <Alt> + [mouse wheel up]
Drag&Drop of Data
When an ynm-compatible data is dropped into the Curve Area, it is added to the currently present data of the
MTC ynm T001:
• [left mouse button up] ends the Drag&Drop operation and adds the dragged data(s) to the default x-, yand z-axes.
• In case the current Drag&Drop operation has been started within the MTC ynm T001 onto which the drop
is performed, a move operation is being performed by default (the default operation can be changed, see
below).
• In case the current Drag&Drop operation has been started outside the MTC ynm T001 onto which the
drop is performed, a copy operation is being performed by default (the default operation can be changed,
see below).
• In case the current Drag&Drop operation would copy the currently selected data into the MTC ynm T001,
<Shift> can be pressed in order to perform a move instead of a copy.
• In case the current Drag&Drop operation would move the currently selected data into the MTC ynm
T001, <Ctrl> can be pressed in order to perform a copy instead of a move.
English
Release 2012-09
118 / 214
SIPLUS CMS X-Tools - User Manual - 05 - Monitoring System
SIPLUS CMS
Context Menu
The following specific context menu items are provided:
Context Menu Item
Description
Fit to Chart
sets the scaling of the horizontal-, vertical- and depth-axes so that the complete values of all data
within the MTC ynm T001 become visible
Fit to Charts
sets the scaling of all Monitoring Charts within the parent Monitoring View Editor so that the
complete values of all data within all Monitoring Charts become visible
Zoom in
zooms into the cuboid
Zoom out
zooms out from the cuboid
Manual scale x-Axis
opens the Manual scale x-Axis dialog
Manual scale y-Axis
opens the Manual scale y-Axis dialog
Manual scale z-Axis
opens the Manual scale z-Axis dialog
Manual scale Color Gradient
opens the Manual scale Color Gradient dialog
Chart Options…
opens the Chart Options dialog
Copy Chart Options
copies the options of the MTC ynm T001 below the current mouse position
Paste Chart Options
pastes the currently copied MTC ynm T001 options onto the MTC ynm T001 below the current
mouse position
Chart Styles…
opens the Chart Styles dialog
Copy Chart Styles
copies the styles of the MTC ynm T001 below the current mouse position
Paste Chart Styles
pastes the currently copied MTC ynm T001 styles onto the MTC ynm T001 below the current
mouse position
Show Background Grid > …
sets the visibility of the background grid to the state which is specified via the submenu of this item
Show Legend > …
sets the visibility of the Legend Area to the state which is specified via the submenu of this item
Show Color Gradient > …
sets the visibility of the Color Gradient Area to the state which is specified via the submenu of this
item
Show Toolbar > …
sets the visibility of the Toolbar Area to the state which is specified via the submenu of this item
Show x-Axis > …
sets the visibility of the x-Axes Area to the state which is specified via the submenu of this item
Show y-Axis > …
sets the visibility of the y-Axes Area to the state which is specified via the submenu of this item
Show z-Axis > …
sets the visibility of the z-Axis Area to the state which is specified via the submenu of this item
Show Slider > …
sets the visibility of the Slider Area to the state which is specified via the submenu of this item
Print Screenshot
prints the screenshot of the Monitoring View
Save Screenshot
saves the screenshot of the Monitoring View
Close Chart
closes the MTC ynm T001
English
Release 2012-09
119 / 214
SIPLUS CMS X-Tools - User Manual - 05 - Monitoring System
2.2.4.3
SIPLUS CMS
x-Axis Area
The x-Axis Area of the MTC ynm T001 is used in order to display the scaling of the present x-axis. As the xAxis Area can not be selected in case of 3-dimensional visualization, it is not possible to zoom, scroll or maintain x-Axis Area directly via mouse or keyboard operations.
The following screenshot shows an example of the x-Axis Area of a MTC ynm T001:
Figure 64: Example of the x-Axis Area of a MTC ynm T001
English
Release 2012-09
120 / 214
SIPLUS CMS X-Tools - User Manual - 05 - Monitoring System
2.2.4.4
SIPLUS CMS
y-Axis Area
The y-Axis Area of the MTC ynm T001 is used in order to display the scaling of the present y-axis. As the yAxis Area can not be selected in case of 3-dimensional visualization, it is not possible to zoom, scroll or maintain y-Axis Area directly via mouse or keyboard operations.
The following screenshot shows an example of the y-Axis Area of a MTC ynm T001:
Figure 65: Example of the y-Axis Area of a MTC ynm T001
English
Release 2012-09
121 / 214
SIPLUS CMS X-Tools - User Manual - 05 - Monitoring System
2.2.4.5
SIPLUS CMS
z-Axis Area
The z-Axis Area of the MTC ynm T001 is used in order to display the scaling of the present z-axis. As the zAxis Area can not be selected in case of 3-dimensional visualization, it is not possible to zoom, scroll or maintain z-Axis Area directly via mouse or keyboard operations.
The following screenshot shows an example of the z-Axis Area of a MTC ynm T001:
Figure 66: Example of the z-Axis Area of a MTC ynm T001
2.2.4.6
Slider Area
The Slider Area of the MTC ynm T001 is used in order to configure the currently visualized point in time. The
total width of each slider represents the oldest and the newest available time of the current data of its time domain and the inside slider button represents the currently visualized point in time out of the total time interval of
the data. By dragging of the slider button, the currently visualized time is modified.
The following screenshot shows an example of the Slider Area of a MTC ynm T001:
Figure 67: Example of the Slider Area of a MTC ynm T001
Time Domains
Within the Slider Area, there is one slider being available for each of the possible time domains. Each slider is
being displayed only in case its according time domain is actually being used within the current MTC ynm T001.
Naming of Sliders
Each slider displays its name at its left bottom corner. The name of each slider contains the following components:
• number of the slider
• name of the used time domain
English
Release 2012-09
122 / 214
SIPLUS CMS X-Tools - User Manual - 05 - Monitoring System
SIPLUS CMS
Available Times
The left border of each slider always displays and represents the oldest time of all of the data of its time domain.
The right border of each slider always displays and represents the newest time of all of the data of its time domain.
In case the visualization of online data is running (not paused), the left and right borders of the affected slider
are constantly updated so that they represent the currently available time interval of their time axis.
Displayed Times
Below the right border of each slider, the current time of the slider button is being displayed.
In case the visualization of online data is running (not paused), the displayed current time is constantly updated.
Operations via the Left Mouse Button
The following operations can be performed via the left mouse button:
Operation
Description
single click with releasing the button
onto the left step button
A single click of the left mouse button with releasing the button above the left step button shifts the
currently displayed time interval into the past:
•
•
single click with releasing the button
onto the right step button
without additional keys being pressed, the next older timestamp from the x-axis data of the
slider is being chosen as new begin of the displayed time interval
○
in case the current begin time of the displayed interval already is the oldest available
point in time (or older), the left step button does not change the currently displayed interval
○
the new end time of the displayed time interval is being set to (new begin time + old
time interval)
<Alt> + [left mouse button down] shifts the current time interval to the past 10% of the full
available time interval of the slider and determines the next older timestamp from the x-axis
data of the slider as new begin time of the displayed interval
○
in case the current begin time of the displayed interval already is the oldest available
point in time (or older), the left step button does not change the currently displayed interval
○
in case the newly determined begin time would be before the oldest available point in
time, the oldest available point in time is being chosen as new begin time
○
the new end time of the displayed time interval is being set to (new begin time + old
time interval)
A single click of the left mouse button with releasing the button above the right step button shifts
the currently displayed time interval into the future:
•
•
without additional keys being pressed, the next newer timestamp from the x-axis data of
the slider is being chosen as new end time of the displayed time interval
○
in case the current end time of the displayed interval already is the newest available
point in time (or newer), the right step button does not change the currently displayed
interval
○
the new begin time of the displayed time interval is being set to (new end time - old
time interval)
<Alt> + [left mouse button down] shifts the current time interval to the future 10% of the full
available time interval of the slider and determines the next newer timestamp from the xaxis data of the slider as new end time of the displayed interval
○
in case the current end time of the displayed interval already is the newest available
point in time (or newer), the right step button does not change the currently displayed
interval
○
in case the newly determined end time would be after the newest available point in
time, the newest available point in time is being chosen as new end time
○
the new begin time of the displayed time interval is being set to (new end time - old
time interval)
single click with keeping the button
onto the left step button
A single click of the left mouse button with keeping the button down onto the left step button behaves like if the left step button would be clicked with the left mouse button constantly.
single click with keeping the button
onto the right step button
A single click of the left mouse button with keeping the button down onto the right step button
behaves like if the right step button would be clicked with the left mouse button constantly.
single click with keeping the button
A single click of the left mouse button with keeping the button down onto the left border of the
onto the left border of the slider button slider button allows to modify the oldest displayed time:
•
English
Release 2012-09
in case the mouse is moved to the left, the oldest displayed time is shifted into the past
123 / 214
SIPLUS CMS X-Tools - User Manual - 05 - Monitoring System
○
•
•
single click with keeping the button
onto the right border of the slider
button
in case the mouse is moved to the right, the oldest displayed time is shifted into the future
○
the left border of the slider button can not be dragged out of the right border of the
Slider Area
○
in case the left border of the slider button is dragged right to the right border of the
slider button, the right border of the slider button also is shifted to the same position as
the left border of the slider button
<Esc> cancels the current operation without modifying the oldest displayed time
•
in case the mouse is moved to the left, the newest displayed time is shifted into the past
○
the right border of the slider button can not be dragged out of the left border of the
Slider Area
○
in case the right border of the slider button is dragged left to the left border of the slider
button, the left border of the slider button also is shifted to the same position as the
right border of the slider button (in this case, only the minimal possible time interval is
in between the left and the right border of the slider button)
in case the mouse is moved to the right, the newest displayed time is shifted into the future
○
•
<Esc> cancels the current operation without modifying the newest displayed time
in this case the behavior is the same as if the left mouse button would have been pressed
only onto the left border of the slider button
A single click of the left mouse button with keeping the button down in between the left and right
borders of the slider button starts to shift the currently configured time interval in time:
•
in case the mouse is moved to the left, the currently displayed time interval (= the begin
and the end times together) is shifted into the past
○
•
•
English
Release 2012-09
the left border of the slider button can not be dragged out of the left border of the slider
in case the mouse is moved to the right, the currently displayed time interval (= the begin
and the end times together) is shifted into the future
○
double click onto the slider button
the right border of the slider button can not be dragged out of the right border of the
Slider Area
In case the left mouse button is being pressed with keeping the button at a position which covers
both the left and the right borders of the slider button simultaneously (e.g. because the distance in
between them is so small), only the oldest displayed time is being modified by a following move
operation:
•
single click with keeping the button in
between the left and right borders of
the slider button
the left border of the slider button can not be dragged out of the left border of the Slider
Area
A single click of the left mouse button with keeping the button down onto the right border of the
slider button allows to modify the newest displayed time:
•
single click with keeping the button
onto the left and right borders of the
slider button simultaneously
SIPLUS CMS
the right border of the slider button can not be dragged out of the right border of the
slider
<Esc> cancels the current operation without modifying the displayed oldest and newest
times
A double click of the left mouse button onto the slider button sets the left border of the slider button to the oldest possible time and the right border of the slider button to the newest possible time.
124 / 214
SIPLUS CMS X-Tools - User Manual - 05 - Monitoring System
SIPLUS CMS
Operations via the Right Mouse Button
The following operation can be performed via the right mouse button:
Operation
Description
single click with releasing the button
A single click of the right mouse button with releasing the button above the Slider Area opens the
context menu for the Slider Area.
single click with keeping the button
A single click of the right mouse button with keeping the button down onto the left border of the
onto the left border of the slider button slider button allows to modify the oldest displayed time:
•
in this case the behavior is the same as if the left mouse button would have been pressed
onto the left border of the slider button
single click with keeping the button
onto the right border of the slider
button
A single click of the right mouse button with keeping the button down onto the right border of the
slider button allows to modify the newest displayed time:
single click with keeping the button
onto the left and right borders of the
slider button simultaneously
A single click of the right mouse button with keeping the button down onto the left and right border
of the slider button simultaneously (e.g. because the distance in between them is so small), only
the oldest displayed time is being modified by a following move operation:
•
•
single click with keeping the button in
between the left and right borders of
the slider button
in this case the behavior is the same as if the left mouse button would have been pressed
onto the right border of the slider button
in this case the behavior is the same as if the left mouse button would have been pressed
onto the left and right borders of the slider button simultaneously
A single click of the left mouse button with keeping the button down in between the left and right
borders of the slider button starts to shift the currently configured time interval in time:
•
in this case the behavior is the same as if the left mouse button would have been pressed
between the left and right borders of the slider button
Operations via the Mouse Wheel
The following operations can be performed via the mouse wheel:
Operation
Description
shifting and scrolling
Scrolling with the mouse wheel can be used to shift or zoom the slider button of the Slider Area.
The actual operation is performed when the mouse wheel is scrolled:
•
[mouse wheel down] moves the slider button left (into the past)
○
•
in case the current begin time of the displayed interval already is the oldest available
point in time (or older), [mouse wheel down] does not change the currently displayed
interval
[mouse wheel up] moves the slider button right (into the future)
○
in case the current end time of the displayed interval already is the newest available
point in time (or newer), [mouse wheel up] does not change the currently displayed interval
•
<Shift> + [mouse wheel down] zooms out of the slider button from the current x position of
the mouse cursor
•
<Shift> + [mouse wheel up] zooms into the slider button from the current x position of the
mouse cursor
Drag&Drop of Data
When an ynm-compatible data is dropped into the Slider Area, it is added to the currently present data of the
MTC ynm T001:
• [left mouse button up] ends the Drag&Drop operation and adds the dragged data(s) to the default x-, yand z-axes.
• In case the current Drag&Drop operation has been started within the MTC ynm T001 onto which the drop
is performed, a move operation is being performed by default (the default operation can be changed, see
below).
• In case the current Drag&Drop operation has been started outside the MTC ynm T001 onto which the
drop is performed, a copy operation is being performed by default (the default operation can be changed,
see below).
• In case the current Drag&Drop operation would copy the currently selected data into the MTC ynm T001,
<Shift> can be pressed in order to perform a move instead of a copy.
• In case the current Drag&Drop operation would move the currently selected data into the MTC ynm
T001, <Ctrl> can be pressed in order to perform a copy instead of a move.
English
Release 2012-09
125 / 214
SIPLUS CMS X-Tools - User Manual - 05 - Monitoring System
SIPLUS CMS
Context Menu
The following specific context menu items are provided:
Context Menu Item
Description
Show Slider > …
sets the visibility of the Slider Area to the state which is specified via the submenu of this item
Pause Visualization
pauses the visualization, which pauses the automatic time shift of the according time domain
Continue Visualization
continues the visualization, which continues the automatic update of all data of the according time
domain
Update Display Time after Open > …
sets the update type of the display time after opening of the Monitoring View File to the type which
is specified via the submenu of this item
Update Display Time after Action > … sets the update type of the display time after an action to the type which is specified via the submenu of this item
Print Screenshot
prints the screenshot of the Monitoring View
Save Screenshot
saves the screenshot of the Monitoring View
Close Chart
closes the MTC ynm T001
2.2.4.7
Legend Area
The Legend Area displays all of the data which are present within the MTC ynm T001 at the moment.
The following screenshot shows an example of the Legend Area of a MTC ynm T001:
Figure 68: Example of the Legend Area of a MTC ynm T001
Operations via the Left Mouse Button
The following operations can be performed via the left mouse button:
Operation
Description
single click with releasing the button
Selecting of data within the Legend Area is performed identically to the selecting of items within
the other trees of the X-Tools Client.
In case a data within the Legend Area is being selected, all items of other type (e.g. x-axes, yaxes and z-axes) of the clicked Monitoring Chart are deselected automatically.
single click with keeping the button
A single click of the left mouse button with keeping the button down onto any text within the Legend Area starts a Drag&Drop operation for the currently selected data(s) as soon as the mouse
cursor is moved:
•
a Drag&Drop operation within the same MTC ynm T001 moves the dragged data(s) to the
new position
o
•
a Drag&Drop operation to another MTC ynm T001 copies the dragged data(s) to the new
position
o
•
double click
English
Release 2012-09
<Ctrl> can be pressed in order to execute a copy operation instead of the move operation within the same MTC ynm T001
<Shift> can be pressed in order to execute a move operation instead of the copy operation to the other MTC ynm T001
<Esc> cancels the current operation without moving or copying anything
A double click of the left mouse button onto any text within the Legend Area opens the Data Style
dialog for the data below the current mouse position.
126 / 214
SIPLUS CMS X-Tools - User Manual - 05 - Monitoring System
SIPLUS CMS
Operations via the Right Mouse Button
The following operations can be performed via the right mouse button:
Operation
Description
single click with releasing the button
A single click of the right mouse button with releasing the button above the Legend Area opens
the context menu for the Legend Area.
single click with keeping the button
A single click of the right mouse button with keeping the button above the Legend Area starts a
shift operation for the legend texts. The actual shifting is performed when the mouse is moved:
•
[right mouse button down] + [mouse move down] moves the Legend Area down
•
[right mouse button down] + [mouse move up] moves the Legend Area up
•
<Esc> cancels the current operation and sets the position of the Legend Area back to the
place which it had before the shift operation had been started
The shifting of the legend texts is enabled only in case not all of the available legend texts fit into
the currently available vertical space.
Drag&Drop of Data
During all Drag&Drop of data into the Legend Area, the following rules apply:
• In case the current Drag&Drop operation has been started within the MTC ynm T001 onto which the
drop is performed, a move operation is being performed by default (the default operation can be
changed, see below).
• In case the current Drag&Drop operation has been started outside the MTC ynm T001 onto which the
drop is performed, a copy operation is being performed by default (the default operation can be changed,
see below).
• In case the current Drag&Drop operation would copy the currently selected data into the MTC ynm T001,
<Shift> can be pressed in order to perform a move instead of a copy.
• In case the current Drag&Drop operation would move the currently selected data into the MTC ynm
T001, <Ctrl> can be pressed in order to perform a copy instead of a move.
• In order to add a data as root of a certain legend tree, the desired data has to be dropped above the current root data of the target legend tree. In case multiple data take part in the current Drag&Drop operation, the first of them becomes the new root of the target legend tree and all others are listed directly below it.
• In order to add a data in between two present data of the legend tree, the desired data has to be dropped
in between the two desired data of the target legend tree. In case multiple data take part in the current
Drag&Drop operation, all of them are inserted in between the two desired data of the target legend tree.
• In order to add a data at the end of a certain legend tree, the desired data has to be dropped below the
last data of the target legend tree. In case multiple data take part in the current Drag&Drop operation, all
of them are added to the end of the target legend tree.
• In order to remove a data from the legend tree with the mouse, the desired data has to be dragged to
any position within the X-Tools Client which does not accept data.
Context Menu
The following specific context menu items are provided:
Context Menu Item
Description
Show Legend > …
sets the visibility of the legend to the state which is specified via the submenu of this item
Show Data Sources > …
specifies whether the legend trees shall display the name of the source server together with the
data name or not
Data Style…
opens the Data Style dialog for the selected data(s)
Copy Data Style
copies the style of the data below the current mouse position
Paste Data Style
pastes the currently copied data style onto the data below the current mouse position
Remove Data
removes the selected data(s) from the MTC ynm T001
Print Screenshot
prints the screenshot of the Monitoring View
Save Screenshot
saves the screenshot of the Monitoring View
Close Chart
closes the MTC ynm T001
English
Release 2012-09
127 / 214
SIPLUS CMS X-Tools - User Manual - 05 - Monitoring System
2.2.4.8
SIPLUS CMS
Toolbar Area
The Toolbar Area displays the buttons which are provided for fast access to frequently used functionalities.
The following screenshot shows an example of the Toolbar Area of a MTC ynm T001:
Figure 69: Example of the Toolbar Area of a MTC ynm T001
Operations via the Left Mouse Button
The following operations can be performed via the left mouse button:
Operation
Description
single click onto the Zoom into x-Axis
button with releasing the button
A single click of the left mouse button with releasing the button onto the Zoom into x-Axis button
zooms into the x-axis once.
single click onto the Zoom into x-Axis
button with keeping the button
A single click of the left mouse button with keeping the button onto the Zoom into x-Axis button
zooms into the x-axis continuously.
single click onto the Zoom out from xAxis button with releasing the button
A single click of the left mouse button with releasing the button onto the Zoom out from x-Axis
button zooms out from the x-axis once.
single click onto the Zoom out from xAxis button with keeping the button
A single click of the left mouse button with keeping the button onto the Zoom out from x-Axis button zooms out from the x-axis continuously.
single click onto the Zoom into y-Axis
button with releasing the button
A single click of the left mouse button with releasing the button onto the Zoom into y-Axis button
zooms into the y-axis once.
single click onto the Zoom into y-Axis
button with keeping the button
A single click of the left mouse button with keeping the button onto the Zoom into y-Axis button
zooms into the y-axis continuously.
single click onto the Zoom out from yAxis button with releasing the button
A single click of the left mouse button with releasing the button onto the Zoom out from y-Axis
button zooms out from the y-axis once.
single click onto the Zoom out from yAxis button with keeping the button
A single click of the left mouse button with keeping the button onto the Zoom out from y-Axis button zooms out from the y-axis continuously.
single click onto the Zoom into z-Axis
button with releasing the button
A single click of the left mouse button with releasing the button onto the Zoom into z-Axis button
zooms into the z-axis once.
single click onto the Zoom into z-Axis
button with keeping the button
A single click of the left mouse button with keeping the button onto the Zoom into z-Axis button
zooms into the z-axis continuously.
single click onto the Zoom out from zAxis button with releasing the button
A single click of the left mouse button with releasing the button onto the Zoom out from z-Axis
button zooms out from the z-axis once.
single click onto the Zoom out from zAxis button with keeping the button
A single click of the left mouse button with keeping the button onto the Zoom out from z-Axis button zooms out from the z-axis continuously.
single click onto the Zoom into all
button with releasing the button
A single click of the left mouse button with releasing the button onto the Zoom into all button
zooms into all axes simultaneously once.
single click onto the Zoom into all
button with keeping the button
A single click of the left mouse button with keeping the button onto the Zoom into all button zooms
into all axes simultaneously continuously.
single click onto the Zoom out from all A single click of the left mouse button with releasing the button onto the Zoom out from all button
button with releasing the button
zooms out from all axes simultaneously once.
single click onto the Zoom out from all A single click of the left mouse button with keeping the button onto the Zoom out from all button
button with keeping the button
zooms out from all axes simultaneously continuously.
single click onto the On/Off Measurement Cursors button
A single click of the left mouse button onto the On/Off Measurement Cursors button toggles the
measurement cursors between on and off.
single click onto the Undo button
A single click of the left mouse button onto the Undo button undoes the last operation from the
undo buffer.
single click onto the Redo button
A single click of the left mouse button onto the Redo button redoes the last operation from the
redo buffer.
single click onto the Continue Visualization button
A single click of the left mouse button onto the Continue Visualization button continues the visualization.
This button applies to all currently present data independently to whether they are paused or running at the moment. The Continue Visualization button sets the visualization of all data to running.
single click onto the Pause Visualization button
A single click of the left mouse button onto the Pause Visualization button pause the visualization.
This button applies to all currently present data independently to whether they are paused or running at the moment. The Pause Visualization button sets the visualization of all data to paused.
single click onto the Store Data Snap- A single click of the left mouse button onto the Store Data Snapshot button starts the storing of the
shot button
data which are contained within the MTC ynm T001.
English
Release 2012-09
128 / 214
SIPLUS CMS X-Tools - User Manual - 05 - Monitoring System
SIPLUS CMS
While the storing is in progress, the Storage Progress dialog shows the current progress of the
storing and also can be used in order to cancel the storing.
See also tutorial, chapter “Storing of Data Snapshots out of the Monitoring System”.
Operations via the Right Mouse Button
The following operation can be performed via the right mouse button:
Operation
Description
single click with releasing the button
A single click of the right mouse button with releasing the button above the Toolbar Area opens
the context menu for the Toolbar Area. The displayed context menu is dependent to the clicked
toolbar button as described below.
Context Menu
The following specific context menu items are provided for the Zoom into x-Axis button:
Context Menu Item
Description
Show Toolbar > …
sets the visibility of the toolbar to the state which is specified via the submenu of this item
Auto scale Axis > …
sets whether the x-axis shall automatically adopt its scaling so that always the complete values of
the contained data are visible
Fit to Axis
sets the scaling of the x-axis so that the complete values of the contained data are visible
Manual scale x-Axis …
opens the Manual scale x-Axis dialog
Copy x-Axis Scaling
copies the scaling of the x-axis
Paste x-Axis Scaling
pastes the currently copied x-axis scaling onto the x-axis
Print Screenshot
prints the screenshot of the Monitoring View
Save Screenshot
saves the screenshot of the Monitoring View
Close Chart
closes the MTC ynm T001
The following specific context menu items are provided for the Zoom out from x-Axis button:
Context Menu Item
Description
Show Toolbar > …
sets the visibility of the toolbar to the state which is specified via the submenu of this item
Auto scale Axis > …
sets whether the x-axis shall automatically adopt its scaling so that always the complete values of
the contained data are visible
Fit to Axis
sets the scaling of the x-axis so that the complete values of the contained data are visible
Manual scale x-Axis …
opens the Manual scale x-Axis dialog
Copy x-Axis Scaling
copies the scaling of the x-axis
Paste x-Axis Scaling
pastes the currently copied x-axis scaling onto the x-axis
Print Screenshot
prints the screenshot of the Monitoring View
Save Screenshot
saves the screenshot of the Monitoring View
Close Chart
closes the MTC ynm T001
The following specific context menu items are provided for the Zoom into y-Axis button:
Context Menu Item
Description
Show Toolbar > …
sets the visibility of the toolbar to the state which is specified via the submenu of this item
Auto scale Axis > …
sets whether the y-axis shall automatically adopt its scaling so that always the complete values of
the contained data are visible
Fit to Axis
sets the scaling of the y-axis so that the complete values of the contained data are visible
Manual scale y-Axis …
opens the Manual scale y-Axis dialog
Copy y-Axis Scaling
copies the scaling of the y-axis
Paste y-Axis Scaling
pastes the currently copied y-axis scaling onto the y-axis
Print Screenshot
prints the screenshot of the Monitoring View
Save Screenshot
saves the screenshot of the Monitoring View
Close Chart
closes the MTC ynm T001
English
Release 2012-09
129 / 214
SIPLUS CMS X-Tools - User Manual - 05 - Monitoring System
SIPLUS CMS
The following specific context menu items are provided for the Zoom out from y-Axis button:
Context Menu Item
Description
Show Toolbar > …
sets the visibility of the toolbar to the state which is specified via the submenu of this item
Auto scale Axis > …
sets whether the y-axis shall automatically adopt its scaling so that always the complete values of
the contained data are visible
Fit to Axis
sets the scaling of the y-axis so that the complete values of the contained data are visible
Manual scale y-Axis …
opens the Manual scale y-Axis dialog
Copy y-Axis Scaling
copies the scaling of the y-axis
Paste y-Axis Scaling
pastes the currently copied y-axis scaling onto the y-axis
Print Screenshot
prints the screenshot of the Monitoring View
Save Screenshot
saves the screenshot of the Monitoring View
Close Chart
closes the MTC ynm T001
The following specific context menu items are provided for the Zoom into z-Axis button:
Context Menu Item
Description
Show Toolbar > …
sets the visibility of the toolbar to the state which is specified via the submenu of this item
Auto scale Axis > …
sets whether the z-axis shall automatically adopt its scaling so that always the complete values of
the contained data are visible
Fit to Axis
sets the scaling of the z-axis so that the complete values of the contained data are visible
Manual scale z-Axis …
opens the Manual scale z-Axis dialog
Copy z-Axis Scaling
copies the scaling of the z-axis
Paste z-Axis Scaling
pastes the currently copied z-axis scaling onto the z-axis
Print Screenshot
prints the screenshot of the Monitoring View
Save Screenshot
saves the screenshot of the Monitoring View
Close Chart
closes the MTC ynm T001
The following specific context menu items are provided for the Zoom out from z-Axis button:
Context Menu Item
Description
Show Toolbar > …
sets the visibility of the toolbar to the state which is specified via the submenu of this item
Auto scale Axis > …
sets whether the z-axis shall automatically adopt its scaling so that always the complete values of
the contained data are visible
Fit to Axis
sets the scaling of the z-axis so that the complete values of the contained data are visible
Manual scale z-Axis …
opens the Manual scale z-Axis dialog
Copy z-Axis Scaling
copies the scaling of the z-axis
Paste z-Axis Scaling
pastes the currently copied z-axis scaling onto the z-axis
Print Screenshot
prints the screenshot of the Monitoring View
Save Screenshot
saves the screenshot of the Monitoring View
Close Chart
closes the MTC ynm T001
English
Release 2012-09
130 / 214
SIPLUS CMS X-Tools - User Manual - 05 - Monitoring System
SIPLUS CMS
The following specific context menu items are provided for the Zoom into all button:
Context Menu Item
Description
Show Toolbar > …
sets the visibility of the toolbar to the state which is specified via the submenu of this item
Fit to x-Axis
sets the scaling of the x-axis so that the complete values of the contained data are visible
Fit to y-Axis
sets the scaling of the y-axis so that the complete values of the contained data are visible
Fit to z-Axis
sets the scaling of the z-axis so that the complete values of the contained data are visible
Manual scale x-Axis …
opens the Manual scale x-Axis dialog
Manual scale y-Axis …
opens the Manual scale y-Axis dialog
Manual scale z-Axis …
opens the Manual scale z-Axis dialog
Print Screenshot
prints the screenshot of the Monitoring View
Save Screenshot
saves the screenshot of the Monitoring View
Close Chart
closes the MTC ynm T001
The following specific context menu items are provided for the Zoom out from all button:
Context Menu Item
Description
Show Toolbar > …
sets the visibility of the toolbar to the state which is specified via the submenu of this item
Fit to x-Axis
sets the scaling of the x-axis so that the complete values of the contained data are visible
Fit to y-Axis
sets the scaling of the y-axis so that the complete values of the contained data are visible
Fit to z-Axis
sets the scaling of the z-axis so that the complete values of the contained data are visible
Manual scale x-Axis …
opens the Manual scale x-Axis dialog
Manual scale y-Axis …
opens the Manual scale y-Axis dialog
Manual scale z-Axis …
opens the Manual scale z-Axis dialog
Print Screenshot
prints the screenshot of the Monitoring View
Save Screenshot
saves the screenshot of the Monitoring View
Close Chart
closes the MTC ynm T001
The following specific context menu items are provided for the On/Off Measurement Cursors button:
Context Menu Item
Description
Show Toolbar > …
sets the visibility of the toolbar to the state which is specified via the submenu of this item
Show Measurement Cursors > …
sets the visibility of measurement cursors to the state which is specified via the submenu of this
item
Select Measurement Cursor > …
specifies which measurement cursor shall have the input focus at the moment
Restore Measurement Cursors
restores the positions of the measurement cursors so that both of them are visible at the screen
again
Print Screenshot
prints the screenshot of the Monitoring View
Save Screenshot
saves the screenshot of the Monitoring View
Close Chart
closes the MTC ynm T001
The following specific context menu items are provided for the Undo button:
Context Menu Item
Description
Show Toolbar > …
sets the visibility of the toolbar to the state which is specified via the submenu of this item
Undo
undoes the last operation from the undo buffer
Undo all
undoes all operations from the undo buffer
Clear Undo/Redo Buffer
removes all entries from the undo/redo buffer of the MTC ynm T001
Change Undo/Redo Buffer Size
opens the Chart Options dialog, sets the input focus to the Undo/Redo Buffer Size edit control
and puts it into editing mode
Close Chart
closes the MTC ynm T001
English
Release 2012-09
131 / 214
SIPLUS CMS X-Tools - User Manual - 05 - Monitoring System
SIPLUS CMS
The following specific context menu items are provided for the Redo button:
Context Menu Item
Description
Show Toolbar > …
sets the visibility of the toolbar to the state which is specified via the submenu of this item
Redo
redoes the last operation from the redo buffer
Redo all
redoes all operations from the redo buffer
Clear Undo/Redo Buffer
removes all entries from the undo/redo buffer of the MTC ynm T001
Change Undo/Redo Buffer Size
opens the Chart Options dialog, sets the input focus to the Undo/Redo Buffer Size edit control
and puts it into editing mode
Close Chart
closes the MTC ynm T001
The following specific context menu items are provided for the Pause Visualization button:
Context Menu Item
Description
Show Toolbar > …
sets the visibility of the toolbar to the state which is specified via the submenu of this item
Pause Visualization
pauses the visualization, which stops the automatic update of all data
Continue Visualization
continues the visualization, which continues the automatic update of all data
Print Screenshot
prints the screenshot of the Monitoring View
Save Screenshot
saves the screenshot of the Monitoring View
Close Chart
closes the MTC ynm T001
The following specific context menu items are provided for the Continue Visualization button:
Context Menu Item
Description
Show Toolbar > …
sets the visibility of the toolbar to the state which is specified via the submenu of this item
Pause Visualization
pauses the visualization, which stops the automatic update of all data
Continue Visualization
continues the visualization, which continues the automatic update of all data
Print Screenshot
prints the screenshot of the Monitoring View
Save Screenshot
saves the screenshot of the Monitoring View
Close Chart
closes the MTC ynm T001
The following specific context menu items are provided for the Store Data Snapshot button:
Context Menu Item
Description
Show Toolbar > …
sets the visibility of the toolbar to the state which is specified via the submenu of this item
Store Data Snapshot
starts the storing of the data which are contained within the MTC ynm T001
Data Snapshot Scope > …
sets the scope for data snapshots to the setting which is specified via the submenu of this item
Print Screenshot
prints the screenshot of the Monitoring View
Save Screenshot
saves the screenshot of the Monitoring View
Close Chart
closes the MTC ynm T001
English
Release 2012-09
132 / 214
SIPLUS CMS X-Tools - User Manual - 05 - Monitoring System
2.2.4.9
SIPLUS CMS
Measurement Cursors
The Measurement Cursors are represented through two 3-dimensional crosses, where the cross is placed exactly at the point of intersection of all three dimensions and moves into all six directions from there, until it
reaches the borders of the cuboid. At all six ends of each cursor, the name of the cursor ("1" or "2") is being
displayed.
The Measurement Cursors can be shifted independently in all three dimensions of the cuboid.
The following screenshot shows an example of the Measurement Cursors of a MTC ynm T001:
Figure 70: Example of the Measurement Cursors of a MTC ynm T001
Operations via the Left Mouse Button
The following operations can be performed via the left mouse button:
Operation
Description
single click with keeping the button
In case the current mouse position is above the point of intersection of a measurement cursor, a
single click of the left mouse button with keeping the button starts to move the below measurement cursor. The actual moving is performed when the mouse is moved:
2.2.4.10
•
[left mouse button down] + [mouse move left/right/down/up] moves the currently selected
cursor below the current mouse position
•
<Esc> cancels the current operation and sets the position of the currently selected cursor
back to the position which it had before the rotation operation had been started
Measurement Cursors Table
The Measurement Cursors table contains the measurement values of all MTC ynm T001s which are present
within the parent Monitoring View Editor. The following screenshot shows an example for the Measurement
Cursors table for a MTC ynm T001:
Figure 71: Example of a Measurement Cursors table of a MTC ynm T001
English
Release 2012-09
133 / 214
SIPLUS CMS X-Tools - User Manual - 05 - Monitoring System
SIPLUS CMS
It is opened within the Cursor Area of the parent Monitoring View Editor of the MTC ynm T001:
Column
Description
No.
contains the row number
Chart
contains the name of the chart from which the data comes
Data
contains the name of the data
Unit
contains the unit of the data
X1
contains the x-value of the data at the x-position of cursor 1
Z1
contains the z-value of the data at the z-position of cursor 1
Y1
contains the y-value of the data at the y-position of cursor 1
X2
contains the x-value of the data at the x-position of cursor 2
Z2
contains the z-value of the data at the z-position of cursor 2
Y2
contains the y-value of the data at the y-position of cursor 2
X2-X1
contains the difference in between X2 and X1
Z2-Z1
contains the difference in between Z2 and Z1
Y2-Y1
contains the difference in between Y2 and Y1
The contents of the Measurement Cursors table can be copied to the clipboard of Windows. From there, they
can be inserted into any other compatible application.
2.2.4.11
2.2.4.11.1
Chart Options Dialog
Overview
The following screenshot shows an example of a Chart Options dialog:
Figure 72: Example of a Chart Options Dialog of a MTC ynm T001
English
Release 2012-09
134 / 214
SIPLUS CMS X-Tools - User Manual - 05 - Monitoring System
2.2.4.11.2
SIPLUS CMS
Chart Options Table
The Chart Options table contains the chart options of the MTC ynm T001:
Parameter
Description
Chart Name
allows to enter a name for the chart
Time Domain
allows to choose the time domain
Time Base
allows to choose the time base
Show Background Grid
allows to choose whether the background grid shall be shown within the Curve Area
Show Legend
allows to choose whether the Legend Area shall be shown
Show Color Gradient
allows to choose whether the Color Gradient Area shall be shown
Show Toolbar
allows to choose whether the Toolbar Area shall be shown
Show x-Axes
allows to choose whether the x-Axes Area shall be shown
Show y-Axes
allows to choose whether the y-Axes Area shall be shown
Show z-Axes
allows to choose whether the z-Axes Area shall be shown
Show Slider
allows to choose whether the Slider Area shall be shown
Rescale x-Axes after Open
allows to choose whether the x-axes shall be scaled automatically after the Monitoring View File
has been opened
Rescale x-Axes after Action
allows to choose whether the x-axes shall be scaled automatically after the displayed data have
been modified outside the MTC ynm T001 or after a new data has been dropped into the MTC
ynm T001
Rescale y-Axes after Open
allows to choose whether the y-axes shall be scaled automatically after the Monitoring View File
has been opened
Rescale y-Axes after Action
allows to choose whether the y-axes shall be scaled automatically after the displayed data have
been modified outside the MTC ynm T001 or after a new data has been dropped into the MTC
ynm T001
Rescale z-Axes after Open
allows to choose whether the z-axes shall be scaled automatically after the Monitoring View File
has been opened
Rescale z-Axes after Action
allows to choose whether the z-axes shall be scaled automatically after the displayed data have
been modified outside the MTC ynm T001 or after a new data has been dropped into the MTC
ynm T001
Update Display Time after Open
allows to choose whether the display time shall be updated automatically after the Monitoring
View File has been opened
Update Display Time after Action
allows to choose whether the display time shall be updated automatically after the displayed data
have been modified outside the MTC ynm T001 or after a new data has been dropped into the
MTC ynm T001
Undo/Redo Buffer Size
allows to enter the total size of undo/redo operations which shall be remembered by the MTC ynm
T001
Data Snapshot Scope
allows to choose whether data snapshots shall store only the data from the currnet Monitoring
Chart or from the whole Monitoring View
Chart Name
The Chart Name is used by other modules in order to identify a certain MTC ynm T001. Within the current
Monitoring View, the Chart Name of each MTC ynm T001 must be unique.
Time Domain
The following time domains are supported by the Chart Options dialog of the MTC ynm T001:
• Online Data with absolute Timestamps
• Offline Data with absolute Timestamps
• Offline Data with relative Timestamps
The Time Domain cell displays the time domain which is currently being used by all data of the MTC ynm T001.
In case more than one time domain is being used currently, the Time Domain cell stays empty.
When another time domain is being chosen via the Time Domain cell, the chosen time domain is applied to all
of the data of the MTC ynm T001. As a result, all data internally are being put onto the t-axis with chosen time
English
Release 2012-09
135 / 214
SIPLUS CMS X-Tools - User Manual - 05 - Monitoring System
SIPLUS CMS
domain. In case there is no data with the known name and matching time domain, the affected data becomes
marked as not present.
In case the time domain is being changed, the x-/y-/z-axes can be updated automatically in case the Rescale xAxis after Action, Rescale y-Axis after Action or Rescale z-Axis after Action options are being set to “Yes”.
Time Base
The chosen time base specifies how the time stamps of each probe, which are being stored in GMT internally,
are being represented by the MTC ynm T001. In case online data is being displayed and the option “Use the
local Time of the Offline Data” is being chosen, the time base for all online data is taken from the time base setting of the Monitoring View (like if “Default” would have been chosen for the time base of the MTC ynm T001).
Rescale x-Axes after Open
Rescale x-Axes after Open
Description
Yes
In case the rescale mode for the x-axes after open is set to “Yes”, the MTC ynm T001 automatically rescales its x-axes after the Monitoring View File has been opened so that all values from all
data of all x-axes become visible.
No
In case the rescale mode for the x-axes after open is set to “No”, the MTC ynm T001 does not
touch the scaling of its x-axes after the Monitoring View File has been opened and leaves it at the
stored values from the Monitoring View File.
Rescale x-Axes after Action
Rescale x-Axes after Action
Description
Yes
In case the rescale mode for the x-axes after an action is set to “Yes”, the MTC ynm T001 automatically rescales its x-axes after an external action has modified the displayed data so that all
values from all data of the affected x-axes become visible.
The following actions result in an automatic rescale of the x-axes in case this mode is chosen:
No
•
another part of a contained data has been opened/appended/overwritten
•
a contained data has been recalculated
•
another data is added to the MTC ynm T001
In case the rescale mode for the x-axes after an action is set to “No”, the MTC ynm T001 does not
touch the scaling of its x-axes after an external action has modified the displayed data and leaves
it at the current values.
Rescale y-Axes after Open
Rescale y-Axes after Open
Description
Yes
In case the rescale mode for the y-axes after open is set to “Yes”, the MTC ynm T001 automatically rescales its y-axes after the Monitoring View File has been opened so that all values from all
data of all y-axes become visible.
No
In case the rescale mode for the y-axes after open is set to “No”, the MTC ynm T001 does not
touch the scaling of its y-axes after the Monitoring View File has been opened and leaves it at the
stored values from the Monitoring View File.
Rescale y-Axes after Action
Rescale y-Axes after Action
Description
Yes
In case the rescale mode for the y-axes after an action is set to “Yes”, the MTC ynm T001 automatically rescales the y-axes after an external action has modified the displayed data so that all
values from all data of the affected y-axes become visible.
The following actions result in an automatic rescale of the y-axes in case this mode is chosen:
No
English
Release 2012-09
•
another part of a contained data has been opened/appended/overwritten
•
a contained data has been recalculated
•
another data is added to the MTC ynm T001
In case the rescale mode for the y-axes after an action is set to “No”, the MTC ynm T001 does not
touch the scaling of its y-axes after an external action has modified the displayed data and leaves
it at the current values.
136 / 214
SIPLUS CMS X-Tools - User Manual - 05 - Monitoring System
SIPLUS CMS
Rescale z-Axes after Open
Rescale z-Axes after Open
Description
Yes
In case the rescale mode for the z-axes after open is set to “Yes”, the MTC ynm T001 automatically rescales its z-axes after the Monitoring View File has been opened so that all values from all
data of all z-axes become visible.
No
In case the rescale mode for the z-axes after open is set to “No”, the MTC ynm T001 does not
touch the scaling of its z-axes after the Monitoring View File has been opened and leaves it at the
stored values from the Monitoring View File.
Rescale z-Axes after Action
Rescale z-Axes after Action
Description
Yes
In case the rescale mode for the z-axes after an action is set to “Yes”, the MTC ynm T001 automatically rescales its z-axes after an external action has modified the displayed data so that all
values from all data of the affected z-axes become visible.
The following actions result in an automatic rescale of the z-axes in case this mode is chosen:
No
•
another part of a contained data has been opened/appended/overwritten
•
a contained data has been recalculated
•
another data is added to the MTC ynm T001
In case the rescale mode for the z-axes after an action is set to “No”, the MTC ynm T001 does not
touch the scaling of its z-axes after an external action has modified the displayed data and leaves
it at the current values.
Update Display Time after Open
The update type for the display time after open can be modified for each time domain independently via the
context menu of the Slider Area in order to overwrite the global setting of the MTC ynm T001.
Update Display Time after Open
Description
Yes
In case the update mode for the display time after open is set to “Yes”, the MTC ynm T001 automatically updates its display time after the Monitoring View File has been opened so that the latest
available values from all data of each time domain become visible.
No
In case the update mode for the display time after open is set to “No”, the MTC ynm T001 does
not touch the values of its display times after the Monitoring View File has been opened and
leaves it at the stored values from the Monitoring View File.
Update Display Time after Action
The update type for the display time after an action can be modified for each time domain independently via the
context menu of the Slider Area in order to overwrite the global setting of the MTC ynm T001.
Update Display Time after Action
Description
Yes
In case the update mode for the display time after an action is set to “Yes”, the MTC ynm T001
automatically updates the display time after an external action has modified the displayed data so
that the latest available values from all data of each time domain become visible.
The following actions result in an automatic update of the display time in case this mode is chosen:
No
English
Release 2012-09
•
another part of a contained data has been opened/appended/overwritten
•
a contained data has been recalculated
•
another data is added to the MTC ynm T001
In case the update mode for the display time after an action is set to “No”, the MTC ynm T001
does not touch the values of its display times after an external action has modified the displayed
data and leaves it at the current values.
137 / 214
SIPLUS CMS X-Tools - User Manual - 05 - Monitoring System
2.2.4.11.3
SIPLUS CMS
Menu Bar
Menu Button
Description
Restore Defaults
Sets all options back to their default settings.
Set as Standard
Sets the current options as standard options for each new MTC ynm T001. The options of already
existing MTC ynm T001s are not being changed by this operation.
OK
Closes the dialog and takes over all user inputs.
Cancel
Closes the dialog and discards all user inputs.
Apply
Takes over all user inputs without closing the dialog. This control is enabled only in case the settings within the dialog have been changed.
2.2.4.12
2.2.4.12.1
Chart Styles Dialog
Overview
The following screenshot shows an example of a Chart Styles dialog:
Figure 73: Example of a Chart Styles Dialog of a MTC ynm T001
English
Release 2012-09
138 / 214
SIPLUS CMS X-Tools - User Manual - 05 - Monitoring System
2.2.4.12.2
SIPLUS CMS
Default Styles of Data Table
The Default Styles of Data table contains the default styles of data within the MTC ynm T001:
Parameter
Description
Data #01 … Data #32
displays the currently chosen color and style for the according data
A double-click into the Color column of this control opens the Select Color dialog for the according row.
A double-click into the Example column of this control opens the Select Style dialog for the according row.
2.2.4.12.3
Styles of Controls Table
The Styles of Controls table contains the styles of the controls of the MTC ynm T001:
Parameter
Description
Chart Background
displays the currently chosen color for the chart background
Background Grid
displays the currently chosen style for the background grid
Cursor 1
displays the currently chosen color for the first cursor
Cursor 2
displays the currently chosen color for the second cursor
Axes Color
displays the currently chosen color for the axes
Text of selected Items (Active)
displays the currently chosen color of the text of active selected items
Text of selected Items (Inactive)
displays the currently chosen color of the text of inactive selected items
Background of selected Items (Active) displays the currently chosen color of the background of active selected items
Background of selected Items (Inactive)
displays the currently chosen color of the background of inactive selected items
A double-click into the Color column of any row opens the Select Color dialog for the according row.
A double-click into the Example column of a row which supports different styles opens the Select Style dialog
for the according row. In case different styles are not supported by a row, a double-click into the Example column opens the Select Color dialog for the according row.
2.2.4.12.4
Menu Bar
Menu Button
Description
Restore Defaults
Sets all styles back to their default settings.
Set as Standard
Sets the current styles as standard styles for each new MTC ynm T001. The styles of already
existing MTC ynm T001s are not being changed by this operation.
OK
Closes the dialog and takes over all user inputs.
Cancel
Closes the dialog and discards all user inputs.
Apply
Takes over all user inputs without closing the dialog. This control is enabled only in case the styles
within the dialog have been changed.
English
Release 2012-09
139 / 214
SIPLUS CMS X-Tools - User Manual - 05 - Monitoring System
2.2.4.13
2.2.4.13.1
SIPLUS CMS
Data Style Dialog
Overview
The following screenshot shows an example of a Data Style dialog:
Figure 74: Example of a Data Style Dialog of a MTC ynm T001
2.2.4.13.2
Style Parameters Table
The Style Parameters table contains the visualization style parameters of the currently selected data:
Parameter
Description
Line Type
allows to switch between the available line types
Line Color
allows to enter the desired line color
Line Strength
allows to switch between the available line strengths
Mark Type
allows to switch between the available mark types
Mark Color
allows to enter the desired mark color
Mark Strength
allows to switch between the available mark strengths
Rendering Mode
N/A
Interpolation Mode
allows to switch between the available interpolation modes
Example
displays an example curve according to the specified data style
A value of “Default” can be assigned to each style parameter. In case “Default” is being chosen, the according
value from the Chart Styles dialog is being used for the visualization of the data.
English
Release 2012-09
140 / 214
SIPLUS CMS X-Tools - User Manual - 05 - Monitoring System
SIPLUS CMS
Interpolation Mode
Interpolation Mode
Description
Default
When the interpolation mode is set to “Default”, the interpolation mode setting is being taken from
the parent definition within the Chart Styles dialog.
Bars with User-defined Color
When the interpolation mode “Bars with User-defined Color” is chosen for a data, the visualization
displays one bar in y direction for each present value. The color of the displayed bars of each data
can be configured by the user.
Bars with Height-dependent Color
When the interpolation mode “Bars with Height-dependent Color” is chosen for a data, the visualization displays one bar in y direction for each present value. The color of each displayed bar is
dependent to its height – depending to the height, the according color from the color gradient is
being used for the visualization of the whole bar.
Bars with Color Gradient
When the interpolation mode “Bars with Color Gradient” is chosen for a data, the visualization
displays one bar in y direction for each present value. The color gradient is applied to each displayed bar so that its color is changing from the bottom to the top
Grid
When the interpolation mode “Grid” is chosen for a data, the visualization connects all known
points of each present data within the 3-dimensional space to a grid. One grid is being visualized
for each of the data which is present within the MTC ynm T001.
Surface
When the interpolation mode “Surface” is chosen for a data, the visualization connects all known
points of the each present data within the 3-dimensional space to a surface. One surface is being
visualized for each of the data which is present within the MTC ynm T001.
2.2.4.13.3
Menu Button
Menu Bar
Description
Restore Defaults
Sets all styles back to their default settings.
OK
Closes the dialog and takes over all user inputs.
Cancel
Closes the dialog and discards all user inputs.
Apply
Takes over all user inputs without closing the dialog. This control is enabled only in case the styles
within the dialog have been changed.
2.2.4.14
2.2.4.14.1
Select Style Dialog
Overview
The following screenshot shows an example of a Select Style dialog:
Figure 75: Example of a Select Style Dialog of a MTC ynm T001
The functionality of the Select Style dialog matches the functionality of the Data Style dialog (see point
2.2.4.13).
English
Release 2012-09
141 / 214
SIPLUS CMS X-Tools - User Manual - 05 - Monitoring System
2.2.4.15
SIPLUS CMS
Manual scale x-Axis Dialog
2.2.4.15.1
Overview
The following screenshot shows an example of a Manual scale x-Axis dialog:
Figure 76: Example of a Manual scale x-Axis Dialog of a MTC ynm T001
2.2.4.15.2
x-Axis Parameters Table
The x-Axis Parameters table contains the parameters of a currently selected x-axis:
Parameter
Description
Auto scale Axis
allows to switch between the available auto scale axis modes
Minimum Value
allows to enter the minimum value of the scaling
Minimum Value Exponent
allows to switch between the supported minimum value exponents
Maximum Value
allows to enter the maximum value of the scaling
Maximum Value Exponent
allows to switch between the supported maximum value exponents
Auto set Scaling Interval
allows to switch between the available modes for the automatic scaling interval
Scaling Interval
allows to enter the scaling interval
Scaling Interval Exponent
allows to switch between the supported scaling interval exponents
Minor Scaling Divider
allows to switch between the available minor scaling dividers
Auto scale Axis
Auto scale Axis
Description
On
In this mode, the MTC ynm T001 constantly sets the scaling of the x-axis so that all available
values of the data at the x-axis stay visible.
Off
In this mode, the MTC ynm T001 uses the specified Minimum Value and Maximum Value parameters for the scaling of the x-axis.
Auto set Scaling Interval
Auto set Scaling Interval
Description
On
In this mode, the MTC ynm T001 constantly sets the scaling interval of the x-axis according to the
currently displayed time interval.
Off
In this mode, the MTC ynm T001 uses the specified Scaling Interval and Scaling Interval Exponent parameters for the scaling interval of the x-axis. In case the specified parameters would lead
to overlapping numbers, the automatic scaling interval is being used automatically until the specified parameters allow a valid scaling again.
English
Release 2012-09
142 / 214
SIPLUS CMS X-Tools - User Manual - 05 - Monitoring System
2.2.4.15.3
SIPLUS CMS
Menu Bar
Menu Button
Description
OK
Closes the dialog and takes over all user inputs.
Cancel
Closes the dialog and discards all user inputs.
Apply
Takes over all user inputs without closing the dialog. This control is enabled only in case the settings within the dialog have been changed.
2.2.4.16
2.2.4.16.1
Manual scale y-Axis Dialog
Overview
The following screenshot shows an example of a Manual scale y-Axis dialog:
Figure 77: Example of a Manual scale y-Axis Dialog of a MTC ynm T001
The functionality of the Manual scale y-Axis dialog matches the functionality of the Manual scale x-Axis dialog
(see point 2.2.4.15).
2.2.4.17
2.2.4.17.1
Manual scale z-Axis Dialog
Overview
The following screenshot shows an example of a Manual scale z-Axis dialog:
Figure 78: Example of a Manual scale z-Axis Dialog of a MTC ynm T001
The functionality of the Manual scale z-Axis dialog matches the functionality of the Manual scale x-Axis dialog
(see point 2.2.4.15).
English
Release 2012-09
143 / 214
SIPLUS CMS X-Tools - User Manual - 05 - Monitoring System
2.2.4.18
SIPLUS CMS
Manual scale Color Gradient Dialog
2.2.4.18.1
Overview
The following screenshot shows an example of a Manual scale Color Gradient dialog:
Figure 79: Example of a Manual scale Color Gradient Dialog of a MTC ynm T001
2.2.4.18.2
Color Gradient Parameters Table
The Color Gradient Parameters table contains the parameters of the color gradient:
Parameter
Description
Auto scale Color Gradient
allows to switch between the available auto scale modes
Minimum Value
allows to enter the minimum value for “violet”
Minimum Value Exponent
allows to switch between the supported minimum value exponents
Maximum Value
allows to enter the maximum value for “red”
Maximum Value Exponent
allows to switch between the supported maximum value exponents
Auto scale Color Gradient
Auto scale Axis
Description
On
In this mode, the MTC constantly sets the minimum and maximum values of the color gradient to
the currently present minimum and maximum values of the displayed data.
Off
In this mode, the MTC uses the specified Minimum Value and Maximum Value parameters for the
color gradient.
2.2.4.18.3
Menu Bar
Menu Button
Description
OK
Closes the dialog and takes over all user inputs.
Cancel
Closes the dialog and discards all user inputs.
Apply
Takes over all user inputs without closing the dialog. This control is enabled only in case the settings within the dialog have been changed.
English
Release 2012-09
144 / 214
SIPLUS CMS X-Tools - User Manual - 05 - Monitoring System
2.2.4.19
SIPLUS CMS
Drag&Drop sensitive Areas
The following screenshot shows the places within a MTC ynm T001 onto which data can be dropped in order to
open a new Monitoring Chart:
Figure 80: Dropping of Data in order to open a new Monitoring Chart
The following screenshot shows the places within a MTC ynm T001 onto which data can be dropped in order to
add the data to the existing MTC ynm T001:
Figure 81: Dropping of Data in order to add it to the existing MTC ynm T001
English
Release 2012-09
145 / 214
SIPLUS CMS X-Tools - User Manual - 05 - Monitoring System
2.2.5
SIPLUS CMS
MTC yt T001
2.2.5.1
Overview
The MTC yt T001 is used in order to visualize, create and edit y = f(t) charts of numerical and/or binary data
within a Monitoring View Editor. Multiple charts of this type can be opened and used simultaneously within
one Monitoring View Editor and/or within multiple Monitoring View Editors.
The following screenshot shows an example of a MTC yt T001:
Figure 82: Example of a MTC yt T001
Each control of the MTC yt T001 has a defined task and provides certain functionalities. The following major
controls are provided by the MTC yt T001:
• Curve Area
• t-Axes Area
• y-Axes Area
• Legend Area
• Toolbar Area
• Measurement Cursors
• Measurement Cursors Table
• Chart Options Dialog
• Chart Styles Dialog
• Data Style Dialog
• Select Style Dialog
• Manual scale t-Axis Dialog
• Manual scale y-Axis Dialog for numerical y-Axes
• Manual scale y-Axis Dialog for binary y-Axes
• Drag&Drop sensitive Areas
English
Release 2012-09
146 / 214
SIPLUS CMS X-Tools - User Manual - 05 - Monitoring System
2.2.5.2
SIPLUS CMS
Curve Area
The Curve Area of the MTC yt T001 is used in order to visualize data of the function y = f(t). Via mouse and
keyboard operations the user is able to zoom, scroll and maintain the available data.
The following screenshot shows an example of the Curve Area of a MTC yt T001:
Figure 83: Example of the Curve Area of a MTC yt T001
Background Grid
The background grid of the MTC yt T001 extends the lines from the axis labeling into the Curve Area. It is represented as a grid of horizontal and vertical lines in the background of the Curve Area.
Always exactly one t-axis and exactly one y-axis are bound to the background grid and extend their axis labeling
via it. The context menus of the Axis Areas are used in order to specify the t- and y-axis which shall use the
background grid to extend their axis labeling.
The appearing and scaling of the background grid is configured via the Manual scale t-Axis dialog (for the vertical grid lines) and via the Manual scale y-Axis dialog (for the horizontal grid lines).
In case the current background grid configuration is set to “manual” and the vertical and/or horizontal grid lines
can not be drawn (because the grid lines would be too close to each other), the background grid automatically
switches to automatic distribution of the grid lines for the affected orientation(s). The manual settings are used
again as soon as the scaling of the MTC yt T001 reaches a value which allows using the manual configuration.
Curve Visualization
The data interpolation defines how two successive points of an already rendered data are connected when they
are displayed. All supported data interpolation modes are defined by the description of the Data Style dialog.
The data style defines how a data is visualized graphically. It contains the parameters for the color/strength/style
of the line as well as the parameters for the color/strength/style of the mark and the rendering/interpolation
methods. The styles of each data can be defined at different levels by the user.
The style of each data can be set at the following levels, where the settings of a higher level overwrite the settings of a lower level (top = high, bottom = low):
• Data Style dialog of the MTC yt T001
• default data style of the MTC yt T001
English
Release 2012-09
147 / 214
SIPLUS CMS X-Tools - User Manual - 05 - Monitoring System
SIPLUS CMS
Keyboard Operations
The following operations can be performed via the keyboard:
Keyboard Operation
Description
<+>
zooms into the t- and y-axes simultaneously
<Shift> + <+>
zooms only into the t-axes
<x> + <+>
behaves like <Shift> + <+>
<Ctrl> + <+>
zooms only into the y-axes
<y> + <+>
behaves like <Ctrl> + <+>
<->
zooms out from the t- and y-axes simultaneously
<Shift> + <->
zooms only out from the t-axes
<x> + <->
behaves like <Shift> + <->
<Ctrl> + <->
zooms only out from the y-axes
<y> + <->
behaves like <Ctrl> + <->
<F>
fits the scaling of the t- and y-axes simultaneously
<Shift> + <F>
fits the scaling only of the t-axes
<x> + <F>
behaves like <Shift> + <F>
<Ctrl> + <F>
fits the scaling only of the y-axes
<y> + <F>
behaves like <Ctrl> + <F>
<Ctrl> + <Z>
undoes the latest operation from the undo buffer
<Shift> + <Ctrl> + <Z>
undoes all operations from the undo buffer
<Ctrl> + <Y>
redoes the latest operation from the redo buffer
<Shift> + <Ctrl> + <Y>
redoes all operations from the redo buffer
Operations via the Left Mouse Button
The following operations can be performed via the left mouse button:
Operation
Description
single click with keeping the button
A single click of the left mouse button with keeping the button starts a zoom operation. While the
left mouse button is kept down, a rectangle from the position where the left mouse button has
been pressed to the current position of the mouse cursor is shown in order to indicate the zooming
area. The actual zooming is performed when the left mouse button is released:
•
[left mouse button down] + [mouse move] zooms into the specified area of the t- and yaxes simultaneously
•
<Shift> + [left mouse button down] + [mouse move] zooms only into the specified area of
the t-axes
o
•
<Ctrl> + [left mouse button down] + [mouse move] zooms only into the specified area of
the y-axes
o
•
English
Release 2012-09
<x> + [left mouse button down] + [mouse move] behaves like <Shift> + [left mouse button down] + [mouse move]
<y> + [left mouse button down] + [mouse move] behaves like <Ctrl> + [left mouse button down] + [mouse move]
<Esc> cancels the current operation without changing of any axis scaling
148 / 214
SIPLUS CMS X-Tools - User Manual - 05 - Monitoring System
SIPLUS CMS
Operations via the Right Mouse Button
The following operations can be performed via the right mouse button:
Operation
Description
single click with releasing the button
A single click of the right mouse button with releasing the button above the Curve Area opens the
context menu for the Curve Area.
single click with keeping the button
A single click of the right mouse button with keeping the button starts a shift operation. The actual
shifting is performed when the mouse is moved:
•
[right mouse button down] + [mouse move] moves all curves within the Curve Area into the
direction of the mouse move
o
when the <Shift> key is being pressed during the shift operation, the curves are shifted
only in horizontal direction
o
when the <Ctrl> key is being pressed during the shift operation, the curves are shifted
only in vertical direction
•
when <x> key is being pressed during the shift operation, the behavior is like if the
<Shift> key is being pressed during the shift operation
when <y> key is being pressed during the shift operation, the behavior is like if the
<Shift> key is being pressed during the shift operation
<Esc> cancels the current operation and sets all axes scaling back to the values which
they had before the shift operation had been started
In case of running data, shifting can be performed into the y direction, only. The shifting into t
direction is done automatically by the chosen speed of the running data.
Operations via the Mouse Wheel
The following operations can be performed via the mouse wheel:
Operation
Description
scrolling
Scrolling with the mouse wheel can be used to shift or zoom the Curve Area. The actual operation
is performed when the mouse wheel is scrolled:
•
[mouse wheel down] zooms out of the current mouse position of the t- and y-axes simultaneously
•
[mouse wheel up] zooms into the current mouse position of the t- and y-axes simultaneously
•
<Shift> + [mouse wheel down] moves all curves within the Curve Area to the left
o
•
<Shift> + [mouse wheel up] moves all curves within the Curve Area to the right
o
•
<x> + [mouse wheel up] behaves like <Shift> + [mouse wheel up]
<Ctrl> + [mouse wheel down] moves all curves within the Curve Area up
o
•
<x> + [mouse wheel down] behaves like <Shift> + [mouse wheel down]
<y> + [mouse wheel down] behaves like <Ctrl> + [mouse wheel down]
<Ctrl> + [mouse wheel up] moves all curves within the Curve Area down
o
<y> + [mouse wheel up] behaves like <Ctrl> + [mouse wheel up]
In case of running data, shifting can be performed into the y direction, only. The shifting into t
direction is done automatically by the chosen speed of the running data.
English
Release 2012-09
149 / 214
SIPLUS CMS X-Tools - User Manual - 05 - Monitoring System
SIPLUS CMS
Drag&Drop of Data
When a time series data is dropped into the Curve Area, it is added to the currently present data of the MTC yt
T001:
• [left mouse button up] ends the Drag&Drop operation and adds the dragged data(s) to the default t- and
y-axes.
• <Alt> + [left mouse button up] ends the Drag&Drop operation, creates a new t- and a new y-axis and
adds the dragged data to these new axes.
• In case the current Drag&Drop operation has been started within the MTC yt T001 onto which the drop is
performed, a move operation is being performed by default (the default operation can be changed, see
below).
• In case the current Drag&Drop operation has been started outside the MTC yt T001 onto which the drop
is performed, a copy operation is being performed by default (the default operation can be changed, see
below).
• In case the current Drag&Drop operation would copy the currently selected data into the MTC yt T001,
<Shift> can be pressed in order to perform a move instead of a copy.
• In case the current Drag&Drop operation would move the currently selected data into the MTC yt T001,
<Ctrl> can be pressed in order to perform a copy instead of a move.
Context Menu
The following specific context menu items are provided:
Context Menu Item
Description
Fit to Chart
sets the scaling of all t- and y-axes so that the complete values of all data within the MTC yt T001
become visible
Fit to Charts
sets the scaling of all Monitoring Charts within the parent Monitoring View Editor so that the
complete values of all data within all Monitoring Charts become visible
Zoom in
zooms in at all t- and y-axes simultaneously; the new scaling interval is half of the old scaling
interval and the center of the zooming is the current mouse position
Zoom out
zooms out at all t- and y-axes simultaneously; the new scaling interval is the double of the old
scaling interval and the center of the zooming is the current mouse position
Chart Options…
opens the Chart Options dialog
Copy Chart Options
copies the options of the MTC yt T001 below the current mouse position
Paste Chart Options
pastes the currently copied MTC yt T001 options onto the MTC yt T001 below the current mouse
position
Chart Styles…
opens the Chart Styles dialog
Copy Chart Styles
copies the styles of the MTC yt T001 below the current mouse position
Paste Chart Styles
pastes the currently copied MTC yt T001 styles onto the MTC yt T001 below the current mouse
position
Show Background Grid > …
sets the visibility of the background grid to the state which is specified via the submenu of this item
Show Legend > …
sets the visibility of the Legend Area to the state which is specified via the submenu of this item
Show Toolbar > …
sets the visibility of the Toolbar Area to the state which is specified via the submenu of this item
Show t-Axes > …
sets the visibility of the t-Axes Area to the state which is specified via the submenu of this item
Show y-Axes > …
sets the visibility of the y-Axes Area to the state which is specified via the submenu of this item
Print Screenshot
prints the screenshot of the Monitoring View
Save Screenshot
saves the screenshot of the Monitoring View
Close Chart
closes the MTC yt T001
English
Release 2012-09
150 / 214
SIPLUS CMS X-Tools - User Manual - 05 - Monitoring System
2.2.5.3
SIPLUS CMS
t-Axes Area
The t-Axes Area of the MTC yt T001 is used in order to display the scaling of the present t-axes. Via mouse
operations the user is able to zoom, scroll and maintain the available data.
The following screenshot shows an example of the t-Axes Area of a MTC yt T001:
Figure 84: Example of the t-Axes Area of a MTC yt T001
Operations via the Left Mouse Button
The following operations can be performed via the left mouse button:
Operation
Description
single click with releasing the button
Single and multiple t-axes can be selected/deselected through a left mouse button click:
●
[left mouse button down] above any t-axis selects the below t-axis
●
<Ctrl> + [left mouse button down] is used in order to select/deselect t-axis after t-axis
●
<Shift> + [left mouse button down] is used in order to select/deselect all t-axis from the last
selected t-axis to the t-axis below the current mouse position
○
single click with keeping the button
double click
in case there is no t-axis selected at the moment, only the below t-axis is selected
●
multiple t-axes can be selected/deselected after each other through combinations of the
above methods
●
in case there is a selection of items already and the user clicks onto any t-axis which is not
selected currently without pressing the <Shift> or <Ctrl> keys, the currently selected items
of the clicked Monitoring Chart are deselected and the clicked t-axis becomes selected
instead
•
in case the [left mouse button] or the [right mouse button] is being pressed anywhere outside the t-Axes Area, the currently selected items of the clicked Monitoring Chart are deselected
A single click of the left mouse button with keeping the button starts a zoom operation. The actual
zooming is performed when the mouse is moved:
•
[left mouse button down] + [mouse move right] zooms out of the t-axis from the t position
where the left mouse button has been pressed
•
[left mouse button down] + [mouse move left] zooms into the t-axis from the t position
where the left mouse button has been pressed
•
<Esc> cancels the current operation and sets the axes scaling back to the values which
they had before the zooming operation had been started
A double click of the left mouse button onto any t-axis opens the Manual scale t-Axis dialog for
the t-axis below the current mouse position.
Operations via the Right Mouse Button
The following operations can be performed via the right mouse button:
Operation
Description
single click with releasing the button
A single click of the right mouse button with releasing the button above the t-Axes Area opens the
context menu for the t-Axes Area.
single click with keeping the button
A single click of the right mouse button with keeping the button starts a shift operation. The actual
shifting is performed when the mouse is moved:
•
[right mouse button down] + [mouse move right] moves the t-axis right
•
[right mouse button down] + [mouse move left] moves the t-axis left
•
<Esc> cancels the current operation and sets all axes scaling back to the values which
they had before the shift operation had been started
In case of running data, shifting into t direction can not be performed manually because it is done
automatically by the chosen speed of the running data.
English
Release 2012-09
151 / 214
SIPLUS CMS X-Tools - User Manual - 05 - Monitoring System
SIPLUS CMS
Operations via the Mouse Wheel
The following operations can be performed via the mouse wheel:
Operation
Description
scrolling
Scrolling with the mouse wheel can be used to shift or zoom the t-Axes Area. The actual operation
is performed when the mouse wheel is scrolled:
•
[mouse wheel down] moves the t-axis left
•
[mouse wheel up] moves the t-axis right
•
<Shift> + [mouse wheel down] zooms out of the t-axis from the current t position of the
mouse cursor
•
<Shift> + [mouse wheel up] zooms into the t-axis from the current t position of the mouse
cursor
Drag&Drop of Data
When a data is dropped onto an existing t-axis, it is added to the currently present data of this t-axis:
• [left mouse button up] ends the Drag&Drop operation and adds the dragged data(s) to the t-axis below
the current mouse position and to the default y-axis
• <Alt> + [left mouse button up] ends the Drag&Drop operation, creates a new t-axis and adds the dragged
data(s) to this new t-axis and to the default y-axis
• In case the current Drag&Drop operation has been started within the MTC yt T001 onto which the drop is
performed, a move operation is being performed by default (the default operation can be changed, see
below).
• In case the current Drag&Drop operation has been started outside the MTC yt T001 onto which the drop
is performed, a copy operation is being performed by default (the default operation can be changed, see
below).
• In case the current Drag&Drop operation would copy the currently selected data into the MTC yt T001,
<Shift> can be pressed in order to perform a move instead of a copy.
• In case the current Drag&Drop operation would move the currently selected data into the MTC yt T001,
<Ctrl> can be pressed in order to perform a copy instead of a move.
English
Release 2012-09
152 / 214
SIPLUS CMS X-Tools - User Manual - 05 - Monitoring System
SIPLUS CMS
Context Menu
The following specific context menu items are provided:
Context Menu Item
Description
Show t-Axes > …
sets the visibility of the t-Axes Area to the state which is specified via the submenu of this item
Fit to Axis
sets the scaling of all selected t-axes so that the complete values of their contained data are visible
Set Background Grid Axis
sets the t-axis from which the context menu has been called as the t-axis which is providing the
vertical background grid lines; the t-axis which provides the vertical background grid lines also is
the t-axis to which the Measurement Cursors are bound
Set Default Axis
sets the t-axis from which the context menu has been called as the t-axis which is the default taxis for newly dragged data
Manual scale t-Axis…
opens the Manual scale t-Axis dialog for the selected t-axes
Copy t-Axis Scaling
copies the scaling of the t-axis below the current mouse position
Paste t-Axis Scaling
pastes the currently copied t-axis scaling onto the t-axis below the current mouse position
Rescale t-Axis after Open > …
sets the rescale type of the t-axis after opening of the Monitoring View File to the type which is
specified via the submenu of this item
Rescale t-Axis after Action > …
sets the rescale type of the t-axis after an action to the type which is specified via the submenu of
this item
Remove Axis
removes all selected t-axes with all of their data from the MTC yt T001
… > Fit to grouped t-Axes
fits all axes in group
… > Group
groups the selected t-axes
… > Ungroup
dissolves the group of the selected t-axes
… > Remove from Group
removes the selected t-axes from the group
Print Screenshot
prints the screenshot of the Monitoring View
Save Screenshot
saves the screenshot of the Monitoring View
Close Chart
closes the MTC yt T001
2.2.5.4
y-Axes Area
The y-Axes Area of the MTC yt T001 is used in order to display the scaling of the present y-axes. Via mouse
operations the user is able to zoom, scroll and maintain the available data.
The following screenshot shows an example of the y-Axes Area of a MTC yt T001:
Figure 85: Example of the y-Axes Area of a MTC yt T001
English
Release 2012-09
153 / 214
SIPLUS CMS X-Tools - User Manual - 05 - Monitoring System
SIPLUS CMS
Operations via the Left Mouse Button
The following operations can be performed via the left mouse button:
Operation
Description
single click with releasing the button
Single and multiple y-axes can be selected/deselected through a left mouse button click:
●
[left mouse button down] above y-axis selects the below y-axis
●
<Ctrl> + [left mouse button down] is used in order to select/deselect y-axis after y-axis
●
<Shift> + [left mouse button down] is used in order to select/deselect all y-axis from the last
selected to the y-axis below the current mouse position
●
multiple y-axes can be selected/deselected after each other through combinations of the
above methods
●
in case there is a selection of items already and the user clicks onto any y-axis which is not
selected currently without pressing the <Shift> or <Ctrl> keys, the currently selected items
of the clicked Monitoring Chart are deselected and the clicked y-axis becomes selected
instead
•
in case the [left mouse button] or the [right mouse button] is being pressed anywhere outside the y-Axes Area, the currently selected items of the clicked Monitoring Chart are deselected
○
single click with keeping the button
double click
in case there is no y-axis selected at the moment, only the below y-axis is selected
A single click of the left mouse button with keeping the button starts a zoom operation. In case of
binary y-axis, a zoom operation at the y-axis changes the height of the displayed binary bars. The
actual zooming is performed when the mouse is moved:
•
[left mouse button down] + [mouse move down] zooms out of the y-axis from the y position
where the left mouse button has been pressed
•
[left mouse button down] + [mouse move up] zooms into the y-axis from the y position
where the left mouse button has been pressed
•
<Esc> cancels the current operation and sets the axes scaling back to the values which
they had before the zooming operation had been started
A double click of the left mouse button onto any y-axis opens the Manual scale y-Axis dialog for
the y-axis below the current mouse position.
Operations via the Right Mouse Button
The following operations can be performed via the right mouse button:
Operation
Description
single click with releasing the button
A single click of the right mouse button with releasing the button above the y-Axes Area opens the
context menu for the y-Axes Area.
single click with keeping the button
A single click of the right mouse button with keeping the button starts a shift operation. The actual
shifting is performed when the mouse is moved:
•
[right mouse button down] + [mouse move down] moves the y-axis down
•
[right mouse button down] + [mouse move up] moves the y-axis up
•
<Esc> cancels the current operation and sets all axes scaling back to the values which
they had before the shift operation had been started
Operations via the Mouse Wheel
The following operations can be performed via the mouse wheel:
Operation
Description
scrolling
Scrolling with the mouse wheel can be used to shift or zoom the y-Axes Area. The actual operation is performed when the mouse wheel is scrolled:
English
Release 2012-09
•
[mouse wheel down] moves the y-axis up
•
[mouse wheel up] moves the y-axis down
•
<Ctrl> + [mouse wheel down] zooms out of the y-axis from the current y position of the
mouse cursor
•
<Ctrl> + [mouse wheel up] zooms into the y-axis from the current y position of the mouse
cursor
154 / 214
SIPLUS CMS X-Tools - User Manual - 05 - Monitoring System
SIPLUS CMS
Drag&Drop of Data
When a data is dropped onto an existing y-axis, it is added to the currently present data of this y-axis:
• [left mouse button up] ends the Drag&Drop operation and adds the dragged data(s) to the y-axis below
the current mouse position and to the default t-axis
• <Alt> + [left mouse button up] ends the Drag&Drop operation, creates a new y-axis and adds the
dragged data(s) to this new y-axis and to the default t-axis
• In case the current Drag&Drop operation has been started within the MTC yt T001 onto which the drop is
performed, a move operation is being performed by default (the default operation can be changed, see
below).
• In case the current Drag&Drop operation has been started outside the MTC yt T001 onto which the drop
is performed, a copy operation is being performed by default (the default operation can be changed, see
below).
• In case the current Drag&Drop operation would copy the currently selected data into the MTC yt T001,
<Shift> can be pressed in order to perform a move instead of a copy.
• In case the current Drag&Drop operation would move the currently selected data into the MTC yt T001,
<Ctrl> can be pressed in order to perform a copy instead of a move.
English
Release 2012-09
155 / 214
SIPLUS CMS X-Tools - User Manual - 05 - Monitoring System
SIPLUS CMS
Context Menu
The following specific context menu items are provided:
Context Menu Item
Description
Show y-Axes > …
sets the visibility of the y-Axes Area to the state which is specified via the submenu of this item
Auto scale Axis > …
sets whether all selected y-axes shall automatically adopt their scaling so that always the complete values of their contained data are visible
Fit to Axis
for numerical y-axes: sets the scaling of all selected y-axes so that the complete values of their
contained data are visible
for binary y-axes: sets the scaling of all selected y-axes so that the lowest bar is displayed (minimal height of each bar) above the bottom border of the MTC yt T001 and sets the height of each
displayed bar to (minimal height of each bar)
Set Background Grid Axis
sets the y-axis from which the context menu has been called as the y-axis which is providing the
horizontal background grid lines; this context menu is enabled for numerical y-axes, only
Set Default Axis
sets the y-axis from which the context menu has been called as the y-axis which is the default yaxis for newly dragged data
Set Axis Type > …
sets the type of the y-axis from which the context menu has been called to the type which is specified via the submenu of this item
the default value is dependent to the type of the data which has been dragged onto the y-axes as
first data and matches the type of this first dragged data
Manual scale y-Axis…
opens the Manual scale y-Axis dialog for the selected y-axes
Copy y-Axis Scaling
copies the scaling of the y-axis below the current mouse position
Paste y-Axis Scaling
pastes the currently copied y-axis scaling onto the y-axis below the current mouse position
Rescale y-Axis after Open > …
sets the rescale type of the y-axis after opening of the Monitoring View File to the type which is
specified via the submenu of this item
Rescale y-Axis after Action > …
sets the rescale type of the y-axis after an action to the type which is specified via the submenu of
this item
Remove Axis
removes all selected y-axes with all of their data from the MTC yt T001
Print Screenshot
prints the screenshot of the Monitoring View
Save Screenshot
saves the screenshot of the Monitoring View
Close Chart
closes the MTC yt T001
2.2.5.5
Legend Area
The Legend Area displays all of the data which are present within the MTC yt T001 at the moment.
All of the present data are arranged via legend trees. All data which is assigned to a common axis (either t or y)
is shown together within a common legend tree. The Legend Area can be switched between the legend trees of
the t-axes and the legend trees of the y-axes so that the user is able to make independent grouping for the tand y-axes.
• The t-axis view of the Legend Area shows the currently defined legend trees of data at the present taxes. One legend tree is displayed for each defined t-axis and all of the data which are present at this taxis at the moment.
• The y-axis view of the Legend Area shows the currently defined legend trees of data at the present yaxes. One legend tree is displayed for each defined y-axis and all of the data which are present at this yaxis at the moment.
The following screenshot shows an example of the Legend Area of a MTC yt T001:
Figure 86: Example of the Legend Area of a MTC yt T001
English
Release 2012-09
156 / 214
SIPLUS CMS X-Tools - User Manual - 05 - Monitoring System
SIPLUS CMS
Operations via the Left Mouse Button
The following operations can be performed via the left mouse button:
Operation
Description
single click with releasing the button
Selecting of data within the Legend Area is performed identically to the selecting of items within
the other trees of the X-Tools Client.
In case a data within the Legend Area is being selected, all items of other type (e.g. t-axes and yaxes) of the clicked Monitoring Chart are deselected automatically.
single click with keeping the button
A single click of the left mouse button with keeping the button down onto any text within the Legend Area starts a Drag&Drop operation for the currently selected data(s) as soon as the mouse
cursor is moved:
•
a Drag&Drop operation within the same MTC yt T001 moves the dragged data(s) to the
new position
o
•
a Drag&Drop operation to another MTC yt T001 copies the dragged data(s) to the new position
o
•
double click
<Ctrl> can be pressed in order to execute a copy operation instead of the move operation within the same MTC yt T001
<Shift> can be pressed in order to execute a move operation instead of the copy operation to the other MTC yt T001
<Esc> cancels the current operation without moving or copying anything
A double click of the left mouse button onto any text within the Legend Area opens the Data Style
dialog for the data below the current mouse position.
Operations via the Right Mouse Button
The following operations can be performed via the right mouse button:
Operation
Description
single click with releasing the button
A single click of the right mouse button with releasing the button above the Legend Area opens
the context menu for the Legend Area.
single click with keeping the button
A single click of the right mouse button with keeping the button above the Legend Area starts a
shift operation for the legend texts. The actual shifting is performed when the mouse is moved:
•
[right mouse button down] + [mouse move down] moves the Legend Area down
•
[right mouse button down] + [mouse move up] moves the Legend Area up
•
<Esc> cancels the current operation and sets the position of the Legend Area back to the
place which it had before the shift operation had been started
The shifting of the legend texts is enabled only in case not all of the available legend texts fit into
the currently available vertical space.
English
Release 2012-09
157 / 214
SIPLUS CMS X-Tools - User Manual - 05 - Monitoring System
SIPLUS CMS
Drag&Drop of Data
During all Drag&Drop of data into the Legend Area, the following rules apply:
• In case the current Drag&Drop operation has been started within the MTC yt T001 onto which the drop is
performed, a move operation is being performed by default (the default operation can be changed, see
below).
• In case the current Drag&Drop operation has been started outside the MTC yt T001 onto which the drop
is performed, a copy operation is being performed by default (the default operation can be changed, see
below).
• In case the current Drag&Drop operation would copy the currently selected data into the MTC yt T001,
<Shift> can be pressed in order to perform a move instead of a copy.
• In case the current Drag&Drop operation would move the currently selected data into the MTC yt T001,
<Ctrl> can be pressed in order to perform a copy instead of a move.
• In order to add a data as root of a certain legend tree, the desired data has to be dropped above the current root data of the target legend tree. In case multiple data take part in the current Drag&Drop operation, the first of them becomes the new root of the target legend tree and all others are listed directly below it.
• In order to add a data in between two present data of the legend tree, the desired data has to be dropped
in between the two desired data of the target legend tree. In case multiple data take part in the current
Drag&Drop operation, all of them are inserted in between the two desired data of the target legend tree.
• In order to add a data at the end of a certain legend tree, the desired data has to be dropped below the
last data of the target legend tree. In case multiple data take part in the current Drag&Drop operation, all
of them are added to the end of the target legend tree.
• In order to remove a data from the legend tree with the mouse, the desired data has to be dragged to
any position within the X-Tools Client which does not accept data.
In order to drag a data from the legend tree to another area of the MTC yt T001, the desired data has to be
dragged from its legend tree to the target area. This functionality can be used in order to copy/move the data
onto another (t or y) axis or to create a new (t or y) axis for it. The actual operation which is performed depends
to the area of the MTC yt T001 where the dragged data is dropped.
Context Menu
The following specific context menu items are provided:
Context Menu Item
Description
Show Legend > …
sets the visibility of the legend to the state which is specified via the submenu of this item
Legend Tree Mode > …
specifies whether the legend trees shall assort the data with common t-axes or with common yaxes
Show Data Sources > …
specifies whether the legend trees shall display the name of the source server together with the
data name or not
Create new t-Axis
creates a new t-axis and moves the selected data(s) onto this new t-axis
Create new y-Axis
creates a new y-axis and moves the selected data(s) onto this new y-axis
Create new t- and y-Axes
creates a new t- and a new y-axis and moves the selected data(s) onto these new t- and y-axes
Data Style…
opens the Data Style dialog for the selected data(s)
Copy Data Style
copies the style of the data below the current mouse position
Paste Data Style
pastes the currently copied data style onto the data below the current mouse position
Remove Data
removes the selected data(s) from the MTC yt T001
Print Screenshot
prints the screenshot of the Monitoring View
Save Screenshot
saves the screenshot of the Monitoring View
Close Chart
closes the MTC yt T001
English
Release 2012-09
158 / 214
SIPLUS CMS X-Tools - User Manual - 05 - Monitoring System
2.2.5.6
SIPLUS CMS
Toolbar Area
The Toolbar Area displays the buttons which are provided for fast access to frequently used functionalities.
The following screenshot shows an example of the Toolbar Area of a MTC yt T001:
Figure 87: Example of the Toolbar Area of a MTC yt T001
Operations via the Left Mouse Button
The following operations can be performed via the left mouse button:
Operation
Description
single click onto the On/Off Measurement Cursors button
A single click of the left mouse button onto the On/Off Measurement Cursors button toggles the
measurement cursors between on and off.
single click onto the Undo button
A single click of the left mouse button onto the Undo button undoes the last operation from the
undo buffer.
single click onto the Redo button
A single click of the left mouse button onto the Redo button redoes the last operation from the
redo buffer.
single click onto the Continue Visualization button
A single click of the left mouse button onto the Continue Visualization button continues the visualization.
This button applies to all currently present data independently to whether they are paused or running at the moment. The Continue Visualization button sets the visualization of all data of all (t and
y) axes to running.
single click onto the Pause Visualization button
A single click of the left mouse button onto the Pause Visualization button pause the visualization.
This button applies to all currently present data independently to whether they are paused or running at the moment. The Pause Visualization button sets the visualization of all data of all (t and y)
axes to paused.
single click onto the Store Data Snap- A single click of the left mouse button onto the Store Data Snapshot button starts the storing of the
shot button
data which are contained within the MTC yt T001.
While the storing is in progress, the Storage Progress dialog shows the current progress of the
storing and also can be used in order to cancel the storing.
See also tutorial, chapter “Storing of Data Snapshots out of the Monitoring System”.
Operations via the Right Mouse Button
The following operations can be performed via the right mouse button:
Operation
Description
single click with releasing the button
A single click of the right mouse button with releasing the button above the Toolbar Area opens
the context menu for the Toolbar Area. The displayed context menu is dependent to the clicked
toolbar button as described below.
Context Menu
The following specific context menu items are provided for the On/Off Measurement Cursors button:
Context Menu Item
Description
Show Toolbar > …
sets the visibility of the toolbar to the state which is specified via the submenu of this item
Show Measurement Cursors > …
sets the visibility of measurement cursors to the state which is specified via the submenu of this
item
Restore Measurement Cursors
restores the positions of the measurement cursors so that both of them are visible at the screen
again
Auto-scroll Measurement Cursors
(Running) > …
sets whether the measurement cursors of running visualizations shall scroll with the t-axis to the
state which is specified via the submenu of this item
Auto-scroll Measurement Cursors
(Paused) > …
sets whether the measurement cursors of paused visualizations shall scroll with the t-axis to the
state which is specified via the submenu of this item
Print Screenshot
prints the screenshot of the Monitoring View
Save Screenshot
saves the screenshot of the Monitoring View
Close Chart
closes the MTC yt T001
English
Release 2012-09
159 / 214
SIPLUS CMS X-Tools - User Manual - 05 - Monitoring System
SIPLUS CMS
The following specific context menu items are provided for the Undo button:
Context Menu Item
Description
Show Toolbar > …
sets the visibility of the toolbar to the state which is specified via the submenu of this item
Undo
undoes the last operation from the undo buffer
Undo all
undoes all operations from the undo buffer
Clear Undo/Redo Buffer
removes all entries from the undo/redo buffer of the MTC yt T001
Change Undo/Redo Buffer Size
opens the Chart Options dialog, sets the input focus to the Undo/Redo Buffer Size edit control
and puts it into editing mode
Print Screenshot
prints the screenshot of the Monitoring View
Save Screenshot
saves the screenshot of the Monitoring View
Close Chart
closes the MTC yt T001
The following specific context menu items are provided for the Redo button:
Context Menu Item
Description
Show Toolbar > …
sets the visibility of the toolbar to the state which is specified via the submenu of this item
Redo
redoes the last operation from the redo buffer
Redo all
redoes all operations from the redo buffer
Clear Undo/Redo Buffer
removes all entries from the undo/redo buffer of the MTC yt T001
Change Undo/Redo Buffer Size
opens the Chart Options dialog, sets the input focus to the Undo/Redo Buffer Size edit control
and puts it into editing mode
Print Screenshot
prints the screenshot of the Monitoring View
Save Screenshot
saves the screenshot of the Monitoring View
Close Chart
closes the MTC yt T001
The following specific context menu items are provided for the Pause Visualization button:
Context Menu Item
Description
Show Toolbar > …
sets the visibility of the toolbar to the state which is specified via the submenu of this item
Pause Visualization
pauses the visualization, which stops the automatic update of all data
Continue Visualization
continues the visualization, which continues the automatic update of all data
Print Screenshot
prints the screenshot of the Monitoring View
Save Screenshot
saves the screenshot of the Monitoring View
Close Chart
closes the MTC yt T001
The following specific context menu items are provided for the Continue Visualization button:
Context Menu Item
Description
Show Toolbar > …
sets the visibility of the toolbar to the state which is specified via the submenu of this item
Pause Visualization
pauses the visualization, which stops the automatic update of all data
Continue Visualization
continues the visualization, which continues the automatic update of all data
Print Screenshot
prints the screenshot of the Monitoring View
Save Screenshot
saves the screenshot of the Monitoring View
Close Chart
closes the MTC yt T001
English
Release 2012-09
160 / 214
SIPLUS CMS X-Tools - User Manual - 05 - Monitoring System
SIPLUS CMS
The following specific context menu items are provided for the Store Data Snapshot button:
Context Menu Item
Description
Show Toolbar > …
sets the visibility of the toolbar to the state which is specified via the submenu of this item
Store Data Snapshot
starts the storing of the data which are contained within the MTC yt T001
Data Snapshot Scope > …
sets the scope for data snapshots to the setting which is specified via the submenu of this item
Print Screenshot
prints the screenshot of the Monitoring View
Save Screenshot
saves the screenshot of the Monitoring View
Close Chart
closes the MTC yt T001
2.2.5.7
Measurement Cursors
The Measurement Cursors are represented through two vertical lines. The Measurement Cursors can be shifted
independently in horizontal direction.
The following screenshot shows an example of the Measurement Cursors of a MTC yt T001:
Figure 88: Example of the Measurement Cursors of a MTC yt T001
Automatic Scrolling
The scrolling of the Measurement Cursors can be set to the following values via the context menu of the On/Off
Measurement Cursors button of the Toolbar Area and via the Chart Options dialog. The configuration can be
done independently for running and paused visualizations:
Auto-scroll Cursors
Description
Yes
When the Measurement Cursors are configured to scroll automatically with a t-axis, their position
in time stays constant together with the time of the t-axis and the positions of the Measurement
Cursors are changed in relation to the framework of the MTC yt T001 when the t-axis is shifted or
zoomed.
In case multiple t-axes are present, the position in time of the Measurement Cursors stay constant
in relation to the default t-axis.
No
English
Release 2012-09
When the Measurement Cursors are configured to keep their static position within the framework
of the MTC yt T001, their position stays constant in relation to the framework of the MTC yt T001
and the position in time is moving when the time of their t-axis is shifted or zoomed.
161 / 214
SIPLUS CMS X-Tools - User Manual - 05 - Monitoring System
SIPLUS CMS
Operations via the Left Mouse Button
The following operations can be performed via the left mouse button:
Operation
Description
single click with keeping the button
A single click of the left mouse button with keeping the button starts a shift operation. The actual
shifting of the measurement cursor is performed when the mouse is moved:
•
[left mouse button down] + [mouse move] shifts the targeted measurement cursor horizontally to the new mouse position
The values which are displayed by the Measurement Cursors table are updated automatically
while the measurement cursor is shifted.
Operations via the Right Mouse Button
The following operations can be performed via the right mouse button:
Operation
Description
single click with keeping the button
A single click of the right mouse button with keeping the button starts a shift operation. The actual
shifting of the measurement cursors is performed when the mouse is moved:
•
[right mouse button down] + [mouse move] shifts both measurement cursors horizontally
simultaneously with keeping the time interval between them
The values which are displayed by the Measurement Cursors table are updated automatically
while the measurement cursors are shifted.
2.2.5.8
Measurement Cursors Table
The Measurement Cursors table contains the measurement values of all MTC yt T001s which are present
within the parent Monitoring View Editor. The following screenshot shows an example for the Measurement
Cursors table for a MTC yt T001:
Figure 89: Example of a Measurement Cursors table of a MTC yt T001
It is opened within the Cursor Area of the parent Monitoring View Editor of the MTC yt T001:
Column
Description
No.
contains the row number
Chart
contains the name of the chart from which the data comes
Data
contains the name of the data
Unit
contains the unit of the data
T1
contains the time of the data at the position of cursor 1
in case data with relative timestamps is present within the Cursor Table, the unit of this column
can be changed via its context menu
Y1
contains the value of the data at the position of cursor 1
T2
contains the time of the data at the position of cursor 2
in case data with relative timestamps is present within the Cursor Table, the unit of this column
can be changed via its context menu
Y2
contains the value of the data at the position of cursor 2
T2-T1
contains the difference between T2 and T1
the unit of this column can be changed via its context menu
1 / (T2-T1)
contains 1 divided by the difference between T2 and T1 (frequency)
the unit of this column can be changed via its context menu
Y2-Y1
contains the difference in between Y2 and Y1
Min
contains the minimal value of the data for the time period in between the two cursors
Max
contains the maximal value of the data for the time period in between the two cursors
English
Release 2012-09
162 / 214
SIPLUS CMS X-Tools - User Manual - 05 - Monitoring System
SIPLUS CMS
The contents of the Measurement Cursors table can be copied to the clipboard of Windows. From there, they
can be inserted into any other compatible application.
2.2.5.9
2.2.5.9.1
Chart Options Dialog
Overview
The following screenshot shows an example of a Chart Options dialog:
Figure 90: Example of a Chart Options Dialog of a MTC yt T001
English
Release 2012-09
163 / 214
SIPLUS CMS X-Tools - User Manual - 05 - Monitoring System
2.2.5.9.2
SIPLUS CMS
Chart Options Table
The Chart Options table contains the chart options of the MTC yt T001:
Parameter
Description
Chart Name
allows to enter a name for the chart
Time Domain
allows to choose the time domain
Time Base
allows to choose the time base
Show Background Grid
allows to choose whether the background grid shall be shown within the Curve Area
Show Legend
allows to choose whether the Legend Area shall be shown
Show Toolbar
allows to choose whether the Toolbar Area shall be shown
Show t-Axes
allows to choose whether the t-Axes Area shall be shown
Show y-Axes
allows to choose whether the y-Axes Area shall be shown
Show Names of binary Data
allows to choose whether the names of binary data shall be displayed directly within the Curve
Area
Rescale t-Axes after Open
allows to choose whether the t-axes shall be scaled automatically after the Monitoring View File
has been opened
Rescale t-Axes after Action
allows to choose whether the t-axes shall be scaled automatically after the displayed data have
been modified outside the MTC yt T001 or after a new data has been dropped into the MTC yt
T001
Rescale y-Axes after Open
allows to choose whether the y-axes shall be scaled automatically after the Monitoring View File
has been opened
Rescale y-Axes after Action
allows to choose whether the y-axes shall be scaled automatically after the displayed data have
been modified outside the MTC yt T001 or after a new data has been dropped into the MTC yt
T001
Group new t-Axes automatically
allows to choose whether the t-axes of matching time domain shall be added to a group automatically when they are created
Auto-scroll Cursors (Running)
allows to choose whether the cursors of running visualizations shall scroll automatically with the taxis
Auto-scroll Cursors (Paused)
allows to choose whether the cursors of paused visualizations shall scroll automatically with the taxis
Undo/Redo Buffer Size
allows to enter the total size of undo/redo operations which shall be remembered by the MTC yt
T001
Data Snapshot Scope
allows to choose whether data snapshots shall store only the data from the currnet Monitoring
Chart or from the whole Monitoring View
Chart Name
The Chart Name is used by other modules in order to identify a certain MTC yt T001. Within the current Monitoring View, the Chart Name of each MTC yt T001 must be unique.
Time Domain
The following time domains are supported by the Chart Options dialog of the MTC yt T001:
• Online Data with absolute Timestamps
• Offline Data with absolute Timestamps
• Offline Data with relative Timestamps
The Time Domain cell displays the time domain which is currently being used by all t-axes of the MTC yt T001.
In case more than one time domain is being used currently, the Time Domain cell stays empty.
When another time domain is being chosen via the Time Domain cell, the chosen time domain is applied to all
of the t-axes of the MTC yt T001. As a result, all t-axes use the data with the known name and specified time
domain for their visualization. In case there is no data with the known name and matching time domain, the
affected data becomes marked as not present.
In case the time domain of a t-axis is being changed, the t-axis can be updated automatically in case the Rescale t-Axis after Action option is being set to “Yes”.
English
Release 2012-09
164 / 214
SIPLUS CMS X-Tools - User Manual - 05 - Monitoring System
SIPLUS CMS
Time Base
The chosen time base specifies how the time stamps of each probe, which are being stored in GMT internally,
are being represented by the MTC yt T001. In case online data is being displayed and the option “Use the local
Time of the Offline Data” is being chosen, the time base for all online data is taken from the time base setting of
the Monitoring View (like if “Default” would have been chosen for the time base of the MTC yt T001).
Rescale t-Axes after Open
The rescale type for the t-axes after open can be modified for each t-axis independently via the context menu of
the t-Axes Area in order to overwrite the global setting of the MTC yt T001.
Rescale t-Axes after Open
Description
Yes
In case the rescale mode for the t-axes after open is set to “Yes”, the MTC yt T001 automatically
rescales its t-axes after the Monitoring View File has been opened so that all values from all data
of all t-axes become visible.
No
In case the rescale mode for the t-axes after open is set to “No”, the MTC yt T001 does not touch
the scaling of its t-axes after the Monitoring View File has been opened and leaves it at the stored
values from the Monitoring View File.
Rescale t-Axes after Action
The rescale type for the t-axes after an action can be modified for each t-axis independently via the context
menu of the t-Axes Area in order to overwrite the global setting of the MTC yt T001.
Rescale t-Axes after Action
Description
Yes
In case the rescale mode for the t-axes after an action is set to “Yes”, the MTC yt T001 automatically rescales its t-axes after an external action has modified the displayed data so that all values
from all data of the affected t-axes become visible.
The following actions result in an automatic rescale of the t-axes in case this mode is chosen:
No
•
another part of a contained data has been opened/appended/overwritten
•
a contained data has been recalculated
•
another data is added to the MTC yt T001
In case the rescale mode for the t-axes after an action is set to “No”, the MTC yt T001 does not
touch the scaling of its t-axes after an external action has modified the displayed data and leaves
it at the current values.
Rescale y-Axes after Open
The rescale type for the y-axes after open can be modified for each y-axis independently via the context menu
of the y-Axes Area in order to overwrite the global setting of the MTC yt T001.
Rescale y-Axes after Open
Description
Yes
In case the rescale mode for the y-axes after open is set to “Yes”, the MTC yt T001 automatically
rescales its y-axes after the Monitoring View File has been opened so that all values from all data
of all y-axes become visible.
No
In case the rescale mode for the y-axes after open is set to “No”, the MTC yt T001 does not touch
the scaling of its y-axes after the Monitoring View File has been opened and leaves it at the stored
values from the Monitoring View File.
Rescale y-Axes after Action
The rescale type for the y-axes after an action can be modified for each y-axis independently via the context
menu of the y-Axes Area in order to overwrite the global setting of the MTC yt T001.
Rescale y-Axes after Action
Description
Yes
In case the rescale mode for the y-axes after an action is set to “Yes”, the MTC yt T001 automatically rescales the y-axes after an external action has modified the displayed data so that all values
from all data of the affected y-axes become visible.
The following actions result in an automatic rescale of the y-axes in case this mode is chosen:
No
English
Release 2012-09
•
another part of a contained data has been opened/appended/overwritten
•
a contained data has been recalculated
•
another data is added to the MTC yt T001
In case the rescale mode for the y-axes after an action is set to “No”, the MTC yt T001 does not
touch the scaling of its y-axes after an external action has modified the displayed data and leaves
it at the current values.
165 / 214
SIPLUS CMS X-Tools - User Manual - 05 - Monitoring System
SIPLUS CMS
Group new t-Axes automatically
Group new t-Axes automatically
Description
Yes
In case the automatically grouping of t-axes is set to “Yes”, the MTC yt T001 automatically adds
each newly created t-axis to the group of t-axes which match its time domain and takes over the
time interval settings of the group for its initial scaling.
In case there are multiple groups of t-axes of matching time domain present at the moment, a
newly created t-axis is not being added to any group automatically.
No
2.2.5.9.3
In case the automatically grouping of t-axes is set to “No”, the MTC yt T001 does not add a newly
created t-axis to any of the possible present groups of t-axes.
Menu Bar
Menu Button
Description
Restore Defaults
Sets all options back to their default settings.
Set as Standard
Sets the current options as standard options for each new MTC yt T001. The options of already
existing MTC yt T001s are not being changed by this operation.
OK
Closes the dialog and takes over all user inputs.
Cancel
Closes the dialog and discards all user inputs.
Apply
Takes over all user inputs without closing the dialog. This control is enabled only in case the settings within the dialog have been changed.
English
Release 2012-09
166 / 214
SIPLUS CMS X-Tools - User Manual - 05 - Monitoring System
2.2.5.10
2.2.5.10.1
SIPLUS CMS
Chart Styles Dialog
Overview
The following screenshot shows an example of a Chart Styles dialog:
Figure 91: Example of a Chart Styles Dialog of a MTC yt T001
2.2.5.10.2
Default Styles of Data Table
The Default Styles of Data table contains the default styles of data within the MTC yt T001:
Parameter
Description
Data #01 … Data #32
displays the currently chosen color and style for the according data
A double-click into the Color column of this control opens the Select Color dialog for the according row.
A double-click into the Example column of this control opens the Select Style dialog for the according row.
English
Release 2012-09
167 / 214
SIPLUS CMS X-Tools - User Manual - 05 - Monitoring System
2.2.5.10.3
SIPLUS CMS
Styles of Controls Table
The Styles of Controls table contains the styles of the controls of the MTC yt T001:
Parameter
Description
Chart Background
displays the currently chosen color for the chart background
Background Grid
displays the currently chosen style for the background grid
Cursor 1
displays the currently chosen color for the first cursor
Cursor 2
displays the currently chosen color for the second cursor
Zooming Frame
displays the currently chosen style for the zooming frame
Text of selected Items (Active)
displays the currently chosen color of the text of active selected items
Text of selected Items (Inactive)
displays the currently chosen color of the text of inactive selected items
Background of selected Items (Active) displays the currently chosen color of the background of active selected items
Background of selected Items (Inactive)
displays the currently chosen color of the background of inactive selected items
A double-click into the Color column of any row opens the Select Color dialog for the according row.
A double-click into the Example column of a row which supports different styles opens the Select Style dialog
for the according row. In case different styles are not supported by a row, a double-click into the Example column opens the Select Color dialog for the according row.
2.2.5.10.4
Menu Bar
Menu Button
Description
Restore Defaults
Sets all styles back to their default settings.
Set as Standard
Sets the current styles as standard styles for each new MTC yt T001. The styles of already existing MTC yt T001s are not being changed by this operation.
OK
Closes the dialog and takes over all user inputs.
Cancel
Closes the dialog and discards all user inputs.
Apply
Takes over all user inputs without closing the dialog. This control is enabled only in case the styles
within the dialog have been changed.
2.2.5.11
2.2.5.11.1
Data Style Dialog
Overview
The following screenshot shows an example of a Data Style dialog:
Figure 92: Example of a Data Style Dialog of a MTC yt T001
English
Release 2012-09
168 / 214
SIPLUS CMS X-Tools - User Manual - 05 - Monitoring System
2.2.5.11.2
SIPLUS CMS
Style Parameters Table
The Style Parameters table contains the visualization style parameters of the currently selected data:
Parameter
Description
Line Type
allows to switch between the available line types
Line Color
allows to enter the desired line color
Line Strength
allows to switch between the available line strengths
Mark Type
allows to switch between the available mark types
Mark Color
allows to enter the desired mark color
Mark Strength
allows to switch between the available mark strengths
Rendering Mode
allows to switch between the available rendering modes
Interpolation Mode
allows to switch between the available interpolation modes
Example
displays an example curve according to the specified data style
A value of “Default” can be assigned to each style parameter. In case “Default” is being chosen, the according
value from the Chart Styles dialog is being used for the visualization of the data.
Rendering Mode
From the point of view of the MTC yt T001, each column of pixels at the screen represents a time interval. The
start time and stop time of the represented time interval depend to the total amount of available columns of pixels and to the time interval which has to be visualized within these columns.
As for each time interval of a column of pixels there may be more than one measurement value available, the
rendering must be used in order to calculate the value which shall be visualized for each column of pixels.
In case there is no measurement value available within the time interval of a column of pixels, the rendering
does not deliver any value for the visualization. The interpolation mode is used then in order to define how two
succeeding, rendered values have to be connected together.
Rendering Mode
Description
Default
This setting keeps the default value for the rendering mode of the data.
Fast
When the rendering mode is set to “Fast”, the value of the last known measurement within the
time interval of each column of pixels is taken as value for the visualization.
Minimal Value
When the rendering mode is set to “Minimal Value”, the smallest value of the values within the
time interval of each column of pixels is taken as value for the visualization.
Maximal Value
When the rendering mode is set to “Maximal Value”, the biggest value of the values within the
time interval of each column of pixels is taken as value for the visualization.
Minimal and Maximal Value
When the rendering mode is set to “Minimal and Maximal Value”, the smallest and biggest values
of the values within the time interval of each column of pixels are taken as values for the visualization. In this mode, two rendered values are calculated for each column of pixels for each data.
Interpolation Mode
Interpolation Mode
Description
Default
This setting keeps the default value for the interpolation mode of the data.
Lines
When the interpolation mode “Lines” is chosen for a data, the visualization connects two rendered
pixels at the screen via a line interpolation. The data curve always is visualized from the last rendered value to the next rendered value via a straight connection.
In case a next rendered value is not available, the data curve stops at the last rendered value.
Stairs
When the interpolation mode “Stairs” is chosen for a data, the visualization connects two rendered
pixels at the screen via a stairs interpolation. The data curve always is visualized from the last
rendered value to the newer time horizontally until the next rendered value.
In case a next rendered value is not available, the last rendered value is extended horizontally to
the newer time.
English
Release 2012-09
169 / 214
SIPLUS CMS X-Tools - User Manual - 05 - Monitoring System
2.2.5.11.3
SIPLUS CMS
Menu Bar
Menu Button
Description
Restore Defaults
Sets all styles back to their default settings.
OK
Closes the dialog and takes over all user inputs.
Cancel
Closes the dialog and discards all user inputs.
Apply
Takes over all user inputs without closing the dialog. This control is enabled only in case the styles
within the dialog have been changed.
2.2.5.12
2.2.5.12.1
Select Style Dialog
Overview
The following screenshot shows an example of a Select Style dialog:
Figure 93: Example of a Select Style Dialog of a MTC yt T001
The functionality of the Select Style dialog matches the functionality of the Data Style dialog (see point
2.2.5.11).
English
Release 2012-09
170 / 214
SIPLUS CMS X-Tools - User Manual - 05 - Monitoring System
2.2.5.13
SIPLUS CMS
Manual scale t-Axis Dialog
2.2.5.13.1
Overview
The following screenshot shows an example of a Manual scale t-Axis dialog:
Figure 94: Example of a Manual scale t-Axis Dialog of a MTC yt T001
2.2.5.13.2
t-Axis Parameters Table
The t-Axis Parameters table contains the parameters of a currently selected t-axis:
Parameter
Description
Auto scale Axis
allows to switch between the available auto scale axis modes (currently, only “Off” is available)
Time Input Mode
allows to switch between the available time input modes
Minimum Time Format
allows to switch between the available input formats for the minimum time
Minimum Time Value
allows to enter the minimum time of the scaling
Time Interval Format
allows to switch between the available input formats of the time interval
Time Interval Value
allows to enter the time interval of the scaling
Maximum Time Format
allows to switch between the available input formats for the maximum time
Maximum Time Value
allows to enter the maximum time of the scaling
Scale
allows to switch between the available scale methods
Auto set Scaling Interval
allows to switch between the available modes for the automatic scaling interval
Scaling Interval Format
allows to switch between the available input formats for the scaling interval
Scaling Interval
allows to enter the scaling interval
Minor Scaling Divider
allows to switch between the available minor scaling dividers
Auto set Scaling Interval
Auto set Scaling Interval
Description
On
In this mode, the MTC yt T001 constantly sets the scaling interval of the t-axis according to the
currently displayed time interval.
Off
In this mode, the MTC yt T001 uses the specified Scaling Interval Format and Scaling Interval
parameters for the scaling interval of the t-axis. In case the specified parameters would lead to
overlapping numbers, the automatic scaling interval is being used automatically until the specified
parameters allow a valid scaling again.
English
Release 2012-09
171 / 214
SIPLUS CMS X-Tools - User Manual - 05 - Monitoring System
2.2.5.13.3
SIPLUS CMS
Menu Bar
Menu Button
Description
OK
Closes the dialog and takes over all user inputs.
Cancel
Closes the dialog and discards all user inputs.
Apply
Takes over all user inputs without closing the dialog. This control is enabled only in case the settings within the dialog have been changed.
2.2.5.14
Manual scale y-Axis Dialog for numerical y-Axes
2.2.5.14.1
Overview
The following screenshot shows an example of a Manual scale y-Axis dialog for numerical y-axes:
Figure 95: Example of a Manual scale y-Axis Dialog for numerical y-Axes of a MTC yn T001
2.2.5.14.2
y-Axis Parameters Table
The y-Axis Parameters table contains the parameters of a currently selected y-axis:
Parameter
Description
Auto scale Axis
allows to switch between the available auto scale axis modes
Minimum Value
allows to enter the minimum value of the scaling
Minimum Value Exponent
allows to switch between the supported minimum value exponents
Maximum Value
allows to enter the maximum value of the scaling
Maximum Value Exponent
allows to switch between the supported maximum value exponents
Auto set Scaling Interval
allows to switch between the available modes for the automatic scaling interval
Scaling Interval
allows to enter the scaling interval
Scaling Interval Exponent
allows to switch between the supported scaling interval exponents
Minor Scaling Divider
allows to switch between the available minor scaling dividers
Auto scale Axis
Auto scale Axis
Description
On
In this mode, the MTC yt T001 constantly sets the scaling of the y-axis so that all available values
of the data at the y-axis stay visible.
Off
In this mode, the MTC yt T001 uses the specified Minimum Value and Maximum Value parameters for the scaling of the y-axis.
English
Release 2012-09
172 / 214
SIPLUS CMS X-Tools - User Manual - 05 - Monitoring System
SIPLUS CMS
Auto set Scaling Interval
Auto set Scaling Interval
Description
On
In this mode, the MTC yt T001 constantly sets the scaling interval of the y-axis according to the
currently displayed value interval.
Off
In this mode, the MTC yt T001 uses the specified Scaling Interval and Scaling Interval Exponent
parameters for the scaling interval of the y-axis. In case the specified parameters would lead to
overlapping numbers, the automatic scaling interval is being used automatically until the specified
parameters allow a valid scaling again.
2.2.5.14.3
Menu Bar
Menu Button
Description
OK
Closes the dialog and takes over all user inputs.
Cancel
Closes the dialog and discards all user inputs.
Apply
Takes over all user inputs without closing the dialog. This control is enabled only in case the settings within the dialog have been changed.
2.2.5.15
Manual scale y-Axis Dialog for binary y-Axes
2.2.5.15.1
Overview
The following screenshot shows an example of a Manual scale y-Axis dialog for binary y-axes:
Figure 96: Example of a Manual scale y-Axis Dialog for binary y-Axes of a MTC yt T001
2.2.5.15.2
y-Axis Parameters Table
The y-Axis Parameters table contains the parameters of a currently selected y-axis:
Parameter
Description
Minimum Value of logical 0
allows to enter the minimum value of a data which has to be interpreted as logical 0
Maximum Value of logical 0
allows to enter the maximum value of a data which has to be interpreted as logical 0
2.2.5.15.3
Menu Bar
Menu Button
Description
OK
Closes the dialog and takes over all user inputs.
Cancel
Closes the dialog and discards all user inputs.
Apply
Takes over all user inputs without closing the dialog. This control is enabled only in case the settings within the dialog have been changed.
English
Release 2012-09
173 / 214
SIPLUS CMS X-Tools - User Manual - 05 - Monitoring System
2.2.5.16
SIPLUS CMS
Drag&Drop sensitive Areas
The following screenshot shows the places within a MTC yt T001 onto which data can be dropped in order to
open a new Monitoring Chart:
Figure 97: Dropping of Data in order to open a new Monitoring Chart
The following screenshot shows the places within a MTC yt T001 onto which data can be dropped in order to
add the data to the existing MTC yt T001:
Figure 98: Dropping of Data in order to add it to the existing MTC yt T001
English
Release 2012-09
174 / 214
SIPLUS CMS X-Tools - User Manual - 05 - Monitoring System
2.2.6
SIPLUS CMS
MTC yx T001
2.2.6.1
Overview
The MTC yx T001 is used in order to visualize, create and edit y = f(x) charts of numerical data within a Monitoring View Editor. Multiple charts of this type can be opened and used simultaneously within one Monitoring
View Editor and/or within multiple Monitoring View Editors.
The following screenshot shows an example of a MTC yx T001:
Figure 99: Example of a MTC yx T001
Each control of the MTC yx T001 has a defined task and provides certain functionalities. The following major
controls are provided by the MTC yx T001:
• Curve Area
• x-Axis Area
• y-Axis Area
• Slider Area
• Legend Area
• Toolbar Area
• Measurement Cursors
• Measurement Cursors Table
• Chart Options Dialog
• Chart Styles Dialog
• Data Style Dialog
• Select Style Dialog
• Manual scale x-Axis Dialog
• Manual scale y-Axis Dialog
• Manual scale Renderer Dialog
• Drag&Drop sensitive Areas
English
Release 2012-09
175 / 214
SIPLUS CMS X-Tools - User Manual - 05 - Monitoring System
2.2.6.2
SIPLUS CMS
Curve Area
The Curve Area of the MTC yx T001 is used in order to visualize data of the function y = f(x). Via mouse and
keyboard operations the user is able to zoom, scroll and maintain the available data.
The following screenshot shows an example of the Curve Area of a MTC yx T001:
Figure 100: Example of the Curve Area of a MTC yx T001
Background Grid
The background grid of the MTC yx T001 extends the lines from the axis labeling into the Curve Area. It is represented as a grid of horizontal and vertical lines in the background of the Curve Area.
The appearing and scaling of the background grid is configured via the Manual scale x-Axis dialog (for the
vertical grid lines) and via the Manual scale y-Axis dialog (for the horizontal grid lines).
In case the current background grid configuration is set to “manual” and the vertical and/or horizontal grid lines
can not be drawn (because the grid lines would be too close to each other), the background grid automatically
switches to automatic distribution of the grid lines for the affected orientation(s). The manual settings are used
again as soon as the scaling of the MTC yx T001 reaches a value which allows using the manual configuration.
Curve Visualization
The data interpolation defines how two successive points of an already rendered data are connected when they
are displayed. All supported data interpolation modes are defined by the description of the Data Style dialog.
The data style defines how a data is visualized graphically. It contains the parameters for the color/strength/style
of the line as well as the parameters for the color/strength/style of the mark and the rendering method. The
styles of each data can be defined at different levels by the user.
The style of each data can be set at the following levels, where the settings of a higher level overwrite the settings of a lower level (top = high, bottom = low):
• Data Style dialog of the MTC yx T001
• default data style of the MTC yx T001
English
Release 2012-09
176 / 214
SIPLUS CMS X-Tools - User Manual - 05 - Monitoring System
SIPLUS CMS
Keyboard Operations
The following operations can be performed via the keyboard:
Keyboard Operation
Description
<+>
zooms into the x- and y-axis simultaneously
<Shift> + <+>
zooms only into the x-axis
<x> + <+>
behaves like <Shift> + <+>
<Ctrl> + <+>
zooms only into the y-axis
<y> + <+>
behaves like <Ctrl> + <+>
<->
zooms out from the x- and y-axis simultaneously
<Shift> + <->
zooms only out from the x-axis
<x> + <->
behaves like <Shift> + <->
<Ctrl> + <->
zooms only out from the y-axis
<y> + <->
behaves like <Ctrl> + <->
<F>
fits the scaling of the x- and y-axis simultaneously
<Shift> + <F>
fits the scaling only of the x-axis
<x> + <F>
behaves like <Shift> + <F>
<Ctrl> + <F>
fits the scaling only of the y-axis
<y> + <F>
behaves like <Ctrl> + <F>
<Ctrl> + <Z>
undoes the latest operation from the undo buffer
<Shift> + <Ctrl> + <Z>
undoes all operations from the undo buffer
<Ctrl> + <Y>
redoes the latest operation from the redo buffer
<Shift> + <Ctrl> + <Y>
redoes all operations from the redo buffer
Operations via the Left Mouse Button
The following operations can be performed via the left mouse button:
Operation
Description
single click with keeping the button
A single click of the left mouse button with keeping the button starts a zoom operation. While the
left mouse button is kept down, a rectangle from the position where the left mouse button has
been pressed to the current position of the mouse cursor is shown in order to indicate the zooming
area. The actual zooming is performed when the left mouse button is released:
•
[left mouse button down] + [mouse move] zooms into the specified area of the x- and yaxis simultaneously
•
<Shift> + [left mouse button down] + [mouse move] zooms only into the specified area of
the x-axis
o
•
<Ctrl> + [left mouse button down] + [mouse move] zooms only into the specified area of
the y-axis
o
•
English
Release 2012-09
<x> + [left mouse button down] + [mouse move] behaves like <Shift> + [left mouse button down] + [mouse move]
<y> + [left mouse button down] + [mouse move] behaves like <Ctrl> + [left mouse button down] + [mouse move]
<Esc> cancels the current operation without changing of any axis scaling
177 / 214
SIPLUS CMS X-Tools - User Manual - 05 - Monitoring System
SIPLUS CMS
Operations via the Right Mouse Button
The following operations can be performed via the right mouse button:
Operation
Description
single click with releasing the button
A single click of the right mouse button with releasing the button above the Curve Area opens the
context menu for the Curve Area.
single click with keeping the button
A single click of the right mouse button with keeping the button starts a shift operation. The actual
shifting is performed when the mouse is moved:
•
[right mouse button down] + [mouse move] moves all curves within the Curve Area into the
direction of the mouse move
o
when the <Shift> key is being pressed during the shift operation, the curves are shifted
only in horizontal direction
o
when the <Ctrl> key is being pressed during the shift operation, the curves are shifted
only in vertical direction
•
when <x> key is being pressed during the shift operation, the behavior is like if the
<Shift> key is being pressed during the shift operation
when <y> key is being pressed during the shift operation, the behavior is like if the
<Shift> key is being pressed during the shift operation
<Esc> cancels the current operation and sets all axes scaling back to the values which
they had before the shift operation had been started
Operations via the Mouse Wheel
The following operations can be performed via the mouse wheel:
Operation
Description
scrolling
Scrolling with the mouse wheel can be used to shift or zoom the Curve Area. The actual operation
is performed when the mouse wheel is scrolled:
•
[mouse wheel down] zooms out of the current mouse position of the x- and y-axis simultaneously
•
[mouse wheel up] zooms into the current mouse position of the x- and y-axis simultaneously
•
<Shift> + [mouse wheel down] moves all curves within the Curve Area to the left
o
•
<Shift> + [mouse wheel up] moves all curves within the Curve Area to the right
o
•
<y> + [mouse wheel down] behaves like <Ctrl> + [mouse wheel down]
<Ctrl> + [mouse wheel up] moves all curves within the Curve Area down
o
English
Release 2012-09
<x> + [mouse wheel up] behaves like <Shift> + [mouse wheel up]
<Ctrl> + [mouse wheel down] moves all curves within the Curve Area up
o
•
<x> + [mouse wheel down] behaves like <Shift> + [mouse wheel down]
<y> + [mouse wheel up] behaves like <Ctrl> + [mouse wheel up]
178 / 214
SIPLUS CMS X-Tools - User Manual - 05 - Monitoring System
SIPLUS CMS
Drag&Drop of Data
When a time series data is dropped into the Curve Area, it is added to the currently present data of the MTC yx
T001:
• [left mouse button up] ends the Drag&Drop operation and adds the dragged data(s) to the topmost x-axis
data.
• In case any of the dropped data has a time domain which does not exist within the MTC yx T001 yet, this
data is used as a new x-axis data automatically and all of the following data of equal time domain are
added to the new x-axis data.
• In case the current Drag&Drop operation has been started within the MTC yx T001 onto which the drop
is performed, a move operation is being performed by default (the default operation can be changed, see
below).
• In case the current Drag&Drop operation has been started outside the MTC yx T001 onto which the drop
is performed, a copy operation is being performed by default (the default operation can be changed, see
below).
• In case the current Drag&Drop operation would copy the currently selected data into the MTC yx T001,
<Shift> can be pressed in order to perform a move instead of a copy.
• In case the current Drag&Drop operation would move the currently selected data into the MTC yx T001,
<Ctrl> can be pressed in order to perform a copy instead of a move.
Context Menu
The following specific context menu items are provided:
Context Menu Item
Description
Fit to Chart
sets the scaling of all t- and y-axes so that the complete values of all data within the MTC yx T001
become visible
Fit to Charts
sets the scaling of all Monitoring Charts within the parent Monitoring View Editor so that the
complete values of all data within all Monitoring Charts become visible
Zoom in
zooms in at all t- and y-axes simultaneously; the new scaling interval is half of the old scaling
interval and the center of the zooming is the current mouse position
Zoom out
zooms out at all t- and y-axes simultaneously; the new scaling interval is the double of the old
scaling interval and the center of the zooming is the current mouse position
Manual scale Renderer…
opens the Manual scale Renderer dialog
Chart Options…
opens the Chart Options dialog
Copy Chart Options
copies the options of the MTC yx T001 below the current mouse position
Paste Chart Options
pastes the currently copied MTC yx T001 options onto the MTC yx T001 below the current mouse
position
Chart Styles…
opens the Chart Styles dialog
Copy Chart Styles
copies the styles of the MTC yx T001 below the current mouse position
Paste Chart Styles
pastes the currently copied MTC yx T001 styles onto the MTC yx T001 below the current mouse
position
Show Background Grid > …
sets the visibility of the background grid to the state which is specified via the submenu of this item
Show Legend > …
sets the visibility of the Legend Area to the state which is specified via the submenu of this item
Show Toolbar > …
sets the visibility of the Toolbar Area to the state which is specified via the submenu of this item
Show x-Axis > …
sets the visibility of the t-Axis Area to the state which is specified via the submenu of this item
Show y-Axis > …
sets the visibility of the y-Axis Area to the state which is specified via the submenu of this item
Show Sliders > …
sets the visibility of the Slider Area to the state which is specified via the submenu of this item
Print Screenshot
prints the screenshot of the Monitoring View
Save Screenshot
saves the screenshot of the Monitoring View
Close Chart
closes the MTC yx T001
English
Release 2012-09
179 / 214
SIPLUS CMS X-Tools - User Manual - 05 - Monitoring System
2.2.6.3
SIPLUS CMS
x-Axis Area
The x-Axis Area of the MTC yx T001 is used in order to display the scaling of the present x-axis. Via mouse
operations the user is able to zoom, scroll and maintain the available data.
The following screenshot shows an example of the x-Axis Area of a MTC yx T001:
Figure 101: Example of the x-Axis Area of a MTC yx T001
Operations via the Left Mouse Button
The following operations can be performed via the left mouse button:
Operation
Description
single click with releasing the button
Single and multiple x-axis can be selected/deselected through a left mouse button click:
●
[left mouse button down] above any x-axis selects the below x-axis
●
<Ctrl> + [left mouse button down] is used in order to select/deselect x-axis after x-axis
●
<Shift> + [left mouse button down] is used in order to select/deselect all x-axis from the last
selected x-axis to the x-axis below the current mouse position
●
multiple x-axis can be selected/deselected after each other through combinations of the
above methods
●
in case there is a selection of items already and the user clicks onto any x-axis which is not
selected currently without pressing the <Shift> or <Ctrl> keys, the currently selected items
of the clicked Monitoring Chart are deselected and the clicked x-axis becomes selected
instead
•
in case the [left mouse button] or the [right mouse button] is being pressed anywhere outside the x-Axis Area, the currently selected items of the clicked Monitoring Chart are deselected
○
single click with keeping the button
double click
in case there is no x-axis selected at the moment, only the below x-axis is selected
A single click of the left mouse button with keeping the button starts a zoom operation. The actual
zooming is performed when the mouse is moved:
•
[left mouse button down] + [mouse move right] zooms out of the x-axis from the x position
where the left mouse button has been pressed
•
[left mouse button down] + [mouse move left] zooms into the x-axis from the x position
where the left mouse button has been pressed
•
<Esc> cancels the current operation and sets the axes scaling back to the values which
they had before the zooming operation had been started
A double click of the left mouse button onto any x-axis opens the Manual scale x-Axis dialog for
the x-axis below the current mouse position.
Operations via the Right Mouse Button
The following operations can be performed via the right mouse button:
Operation
Description
single click with releasing the button
A single click of the right mouse button with releasing the button above the x-Axis Area opens the
context menu for the x-Axis Area.
single click with keeping the button
A single click of the right mouse button with keeping the button starts a shift operation. The actual
shifting is performed when the mouse is moved:
English
Release 2012-09
•
[right mouse button down] + [mouse move right] moves the x-axis right
•
[right mouse button down] + [mouse move left] moves the x-axis left
•
<Esc> cancels the current operation and sets all axes scaling back to the values which
they had before the shift operation had been started
180 / 214
SIPLUS CMS X-Tools - User Manual - 05 - Monitoring System
SIPLUS CMS
Operations via the Mouse Wheel
The following operations can be performed via the mouse wheel:
Operation
Description
scrolling
Scrolling with the mouse wheel can be used to shift or zoom the x-Axes Area. The actual operation is performed when the mouse wheel is scrolled:
•
[mouse wheel down] moves the x-axis left
•
[mouse wheel up] moves the x-axis right
•
<Shift> + [mouse wheel down] zooms out of the x-axis from the current x position of the
mouse cursor
•
<Shift> + [mouse wheel up] zooms into the x-axis from the current x position of the mouse
cursor
Drag&Drop of Data
When a data is dropped onto the x-axis, it is added as new x-axis data:
• [left mouse button up] ends the Drag&Drop operation and creates a new x-axis data for each of the
dropped data
• <Alt> + [left mouse button up] ends the Drag&Drop operation, creates a new x-axis and adds the
dragged data(s) to this new x-axis and to the default y-axis
• In case the current Drag&Drop operation has been started within the MTC yx T001 onto which the drop
is performed, a move operation is being performed by default (the default operation can be changed, see
below).
• In case the current Drag&Drop operation has been started outside the MTC yx T001 onto which the drop
is performed, a copy operation is being performed by default (the default operation can be changed, see
below).
• In case the current Drag&Drop operation would copy the currently selected data into the MTC yx T001,
<Shift> can be pressed in order to perform a move instead of a copy.
• In case the current Drag&Drop operation would move the currently selected data into the MTC yx T001,
<Ctrl> can be pressed in order to perform a copy instead of a move.
Context Menu
The following specific context menu items are provided:
Context Menu Item
Description
Show x-Axis > …
sets the visibility of the x-Axis Area to the state which is specified via the submenu of this item
Auto scale Axis > …
sets whether the x-axis shall automatically adopt its scaling so that always the complete values of
its contained data are visible
Fit to Axis
sets the scaling of the x-axis so that the complete values of its contained data are visible
Manual scale Renderer…
opens the Manual scale Renderer dialog
Manual scale x-Axis…
opens the Manual scale x-Axis dialog
Copy x-Axis Scaling
copies the scaling of the x-axis below the current mouse position
Paste x-Axis Scaling
pastes the currently copied x-axis scaling onto the x-axis below the current mouse position
Rescale x-Axis after Open > …
sets the rescale type of the x-axis after opening of the Monitoring View File to the type which is
specified via the submenu of this item
Rescale x-Axis after Action > …
sets the rescale type of the x-axis after an action to the type which is specified via the submenu of
this item
Print Screenshot
prints the screenshot of the Monitoring View
Save Screenshot
saves the screenshot of the Monitoring View
Close Chart
closes the MTC yx T001
English
Release 2012-09
181 / 214
SIPLUS CMS X-Tools - User Manual - 05 - Monitoring System
2.2.6.4
SIPLUS CMS
y-Axis Area
The y-Axis Area of the MTC yx T001 is used in order to display the scaling of the present y-axis. Via mouse
operations the user is able to zoom, scroll and maintain the available data.
The following screenshot shows an example of the y-Axis Area of a MTC yx T001:
Figure 102: Example of the y-Axis Area of a MTC yx T001
Operations via the Left Mouse Button
The following operations can be performed via the left mouse button:
Operation
Description
single click with releasing the button
Single and multiple y-axis can be selected/deselected through a left mouse button click:
●
[left mouse button down] above any y-axis selects the below y-axis
●
<Ctrl> + [left mouse button down] is used in order to select/deselect y-axis after y-axis
●
<Shift> + [left mouse button down] is used in order to select/deselect all y-axis from the last
selected to the y-axis below the current mouse position
○
single click with keeping the button
double click
English
Release 2012-09
in case there is no y-axis selected at the moment, only the below y-axis is selected
●
multiple y-axis can be selected/deselected after each other through combinations of the
above methods
●
in case there is a selection of items already and the user clicks onto any y-axis which is not
selected currently without pressing the <Shift> or <Ctrl> keys, the currently selected items
of the clicked Monitoring Chart are deselected and the clicked y-axis becomes selected
instead
•
in case the [left mouse button] or the [right mouse button] is being pressed anywhere outside the y-Axis Area, the currently selected items of the clicked Monitoring Chart are deselected
A single click of the left mouse button with keeping the button starts a zoom operation. The actual
zooming is performed when the mouse is moved:
•
[left mouse button down] + [mouse move down] zooms out of the y-axis from the y position
where the left mouse button has been pressed
•
[left mouse button down] + [mouse move up] zooms into the y-axis from the y position
where the left mouse button has been pressed
•
<Esc> cancels the current operation and sets the axes scaling back to the values which
they had before the zooming operation had been started
A double click of the left mouse button onto any y-axis opens the Manual scale y-Axis dialog for
the y-axis below the current mouse position.
182 / 214
SIPLUS CMS X-Tools - User Manual - 05 - Monitoring System
SIPLUS CMS
Operations via the Right Mouse Button
The following operations can be performed via the right mouse button:
Operation
Description
single click with releasing the button
A single click of the right mouse button with releasing the button above the y-Axis Area opens the
context menu for the y-Axis Area.
single click with keeping the button
A single click of the right mouse button with keeping the button starts a shift operation. The actual
shifting is performed when the mouse is moved:
•
[right mouse button down] + [mouse move down] moves the y-axis down
•
[right mouse button down] + [mouse move up] moves the y-axis up
•
<Esc> cancels the current operation and sets all axes scaling back to the values which
they had before the shift operation had been started
Operations via the Mouse Wheel
The following operations can be performed via the mouse wheel:
Operation
Description
scrolling
Scrolling with the mouse wheel can be used to shift or zoom the y-Axis Area. The actual operation
is performed when the mouse wheel is scrolled:
•
[mouse wheel down] moves the y-axis up
•
[mouse wheel up] moves the y-axis down
•
<Ctrl> + [mouse wheel down] zooms out of the y-axis from the current y position of the
mouse cursor
•
<Ctrl> + [mouse wheel up] zooms into the y-axis from the current y position of the mouse
cursor
Drag&Drop of Data
When a data is dropped onto an existing y-axis, it is added to the currently present x-axis data as if the data
would have been dropped directly into the Curve Area (see point 2.2.6.2).
Context Menu
The following specific context menu items are provided:
Context Menu Item
Description
Show y-Axis > …
sets the visibility of the y-Axis Area to the state which is specified via the submenu of this item
Auto scale Axis > …
sets whether the y-axis shall automatically adopt its scaling so that always the complete values of
its contained data are visible
Fit to Axis
sets the scaling of the y-axis so that the complete values of its contained data are visible
Manual scale Renderer
opens the Manual scale Renderer dialog
Manual scale y-Axis…
opens the Manual scale y-Axis dialog
Copy y-Axis Scaling
copies the scaling of the y-axis below the current mouse position
Paste y-Axis Scaling
pastes the currently copied y-axis scaling onto the y-axis below the current mouse position
Rescale y-Axis after Open > …
sets the rescale type of the y-axis after opening of the Monitoring View File to the type which is
specified via the submenu of this item
Rescale y-Axis after Action > …
sets the rescale type of the y-axis after an action to the type which is specified via the submenu of
this item
Print Screenshot
prints the screenshot of the Monitoring View
Save Screenshot
saves the screenshot of the Monitoring View
Close Chart
closes the MTC yx T001
English
Release 2012-09
183 / 214
SIPLUS CMS X-Tools - User Manual - 05 - Monitoring System
2.2.6.5
SIPLUS CMS
Slider Area
The Slider Area of the MTC yx T001 is used in order to configure the currently visualized time interval. The total
width of each slider represents the oldest and the newest available time of its x-axis data and the inside slider
button represents the currently visualized time interval out of the total time interval of the data. By dragging of
the slider button, the currently visualized time is modified.
The following screenshot shows an example of the Slider Area of a MTC yx T001:
Figure 103: Example of the Slider Area of a MTC yx T001
Time Domains
Within the Slider Area, there is one slider being available for each data which is assigned to the x-axis. The
order of the displayed sliders from top to bottom matches the order of the currently present data at the x-axis.
Naming of Sliders
Each slider displays its name at its left bottom corner. The name of each slider contains the following components:
• number of the slider
• name of the x-axis data which is assigned to the slider
• name of the used time domain
Available Times
The left border of each slider always displays and represents the oldest time which is available for its x-axis
data.
The right border of each slider always displays and represents the newest time which is available for its x-axis
data.
In case the visualization of online data is running (not paused), the left and right borders of the affected slider
are constantly updated so that they represent the currently available time interval of their x-axis data.
Displayed Times
Below the right border of each slider, the current time of the slider button is being displayed.
In case the visualization of online data is running (not paused), the displayed current time is constantly updated.
English
Release 2012-09
184 / 214
SIPLUS CMS X-Tools - User Manual - 05 - Monitoring System
SIPLUS CMS
Operations via the Left Mouse Button
The following operations can be performed via the left mouse button:
Operation
Description
single click with releasing the button
onto the left step button
A single click of the left mouse button with releasing the button above the left step button shifts the
currently displayed point in time into the past:
•
the next older timestamp from all of the data at the time domain of the slider is being chosen as new current point in time
○
single click with releasing the button
onto the right step button
in case the current point in time already is the oldest available point in time, the left
step button does not change the current point in time any more
A single click of the left mouse button with releasing the button above the right step button shifts
the currently displayed point in time into the future:
•
without additional keys being pressed, the next newer timestamp from all of the data at the
time domain of the slider is being chosen as new current point in time
○
in case the current point in time already is the newest available point in time, the right
step button does not change the current point in time any more
single click with keeping the button
onto the left step button
A single click of the left mouse button with keeping the button down onto the left step button behaves like if the left step button would be clicked with the left mouse button constantly.
single click with keeping the button
onto the right step button
A single click of the left mouse button with keeping the button down onto the right step button
behaves like if the right step button would be clicked with the left mouse button constantly.
single click with keeping the button
onto the slider button
A single click of the left mouse button with keeping the button down onto the slider button allows
to modify the current point in time:
•
in case the mouse is moved to the left, the current point in time is shifted into the past
○
•
in case the mouse is moved to the right, the current point in time is shifted into the future
○
•
the slider button can not be dragged out of the left border of the Slider Area
the slider button can not be dragged out of the right border of the Slider Area
<Esc> cancels the current operation without modifying the current point in time
Operations via the Right Mouse Button
The following operation can be performed via the right mouse button:
Operation
Description
single click with releasing the button
A single click of the right mouse button with releasing the button above the Slider Area opens the
context menu for the Slider Area.
Operations via the Mouse Wheel
The following operations can be performed via the mouse wheel:
Operation
Description
scrolling
Scrolling with the mouse wheel can be used to shift or zoom the Slider Area. The actual operation
is performed when the mouse wheel is scrolled:
•
[mouse wheel down] moves the slider button left (into the past)
○
•
[mouse wheel up] moves the slider button right (into the future)
○
English
Release 2012-09
in case the current begin time of the displayed interval already is the oldest available
point in time (or older), [mouse wheel down] does not change the currently displayed
interval
in case the current end time of the displayed interval already is the newest available
point in time (or newer), [mouse wheel up] does not change the currently displayed interval
185 / 214
SIPLUS CMS X-Tools - User Manual - 05 - Monitoring System
SIPLUS CMS
Drag&Drop of Data
When an yx-compatible data is dropped into the Slider Area, it is added to the currently present data of the MTC
yx T001:
• [left mouse button up] ends the Drag&Drop operation and adds the dragged data(s) to the currently present x-axis data as if the data would have been dropped directly into the Curve Area (see point 2.2.6.2).
• In case the current Drag&Drop operation has been started within the MTC yx T001 onto which the drop is
performed, a move operation is being performed by default (the default operation can be changed, see
below).
• In case the current Drag&Drop operation has been started outside the MTC yx T001 onto which the drop
is performed, a copy operation is being performed by default (the default operation can be changed, see
below).
• In case the current Drag&Drop operation would copy the currently selected data into the MTC yx T001,
<Shift> can be pressed in order to perform a move instead of a copy.
• In case the current Drag&Drop operation would move the currently selected data into the MTC yx T001,
<Ctrl> can be pressed in order to perform a copy instead of a move.
Data of other types are handled according to the definitions which are found later in this document.
Context Menu
The following specific context menu items are provided:
Context Menu Item
Description
Show Sliders > …
sets the visibility of the Slider Area to the state which is specified via the submenu of this item
Manual scale Renderer…
opens the Manual scale Renderer dialog
Pause Visualization
pauses the visualization, which pauses the automatic update of all data which belongs to this
slider
Continue Visualization
continues the visualization, which continues the automatic update of all data which belongs to this
slider
Update Display Time after Open > …
sets the update type of the display time after opening of the Monitoring View File to the type which
is specified via the submenu of this item
Update Display Time after Action > … sets the update type of the display time after an action to the type which is specified via the submenu of this item
Print Screenshot
prints the screenshot of the Monitoring View
Save Screenshot
saves the screenshot of the Monitoring View
Close Chart
closes the MTC yx T001
2.2.6.6
Legend Area
The Legend Area displays all of the data which are present within the MTC yx T001 at the moment.
All of the present data are arranged via legend trees. All data which is assigned to a common x-axis data is
shown together within a common legend tree. The root item of each legend tree represents the x-axis data
whereas the below items of each tree represent the according y-axis data.
The following screenshot shows an example of the Legend Area of a MTC yx T001:
Figure 104: Example of the Legend Area of a MTC yx T001
English
Release 2012-09
186 / 214
SIPLUS CMS X-Tools - User Manual - 05 - Monitoring System
SIPLUS CMS
Operations via the Left Mouse Button
The following operations can be performed via the left mouse button:
Operation
Description
single click with releasing the button
Selecting of data within the Legend Area is performed identically to the selecting of items within
the other trees of the X-Tools Client.
In case a data within the Legend Area is being selected, all items of other type (e.g. x-axis and yaxis) of the clicked Monitoring Chart are deselected automatically.
single click with keeping the button
A single click of the left mouse button with keeping the button down onto any text within the Legend Area starts a Drag&Drop operation for the currently selected data(s) as soon as the mouse
cursor is moved:
•
a Drag&Drop operation within the same MTC yx T001 moves the dragged data(s) to the
new position
o
•
a Drag&Drop operation to another MTC yx T001 copies the dragged data(s) to the new
position
o
•
double click
<Ctrl> can be pressed in order to execute a copy operation instead of the move operation within the same MTC yx T001
<Shift> can be pressed in order to execute a move operation instead of the copy operation to the other MTC yx T001
<Esc> cancels the current operation without moving or copying anything
A double click of the left mouse button onto any text within the Legend Area opens the Data Style
dialog for the data below the current mouse position.
Operations via the Right Mouse Button
The following operations can be performed via the right mouse button:
Operation
Description
single click with releasing the button
A single click of the right mouse button with releasing the button above the Legend Area opens
the context menu for the Legend Area.
single click with keeping the button
A single click of the right mouse button with keeping the button above the Legend Area starts a
shift operation for the legend texts. The actual shifting is performed when the mouse is moved:
•
[right mouse button down] + [mouse move down] moves the Legend Area down
•
[right mouse button down] + [mouse move up] moves the Legend Area up
•
<Esc> cancels the current operation and sets the position of the Legend Area back to the
place which it had before the shift operation had been started
The shifting of the legend texts is enabled only in case not all of the available legend texts fit into
the currently available vertical space.
English
Release 2012-09
187 / 214
SIPLUS CMS X-Tools - User Manual - 05 - Monitoring System
SIPLUS CMS
Drag&Drop of Data
During all Drag&Drop of data into the Legend Area, the following rules apply:
• In case the current Drag&Drop operation has been started within the MTC yx T001 onto which the drop
is performed, a move operation is being performed by default (the default operation can be changed, see
below).
• In case the current Drag&Drop operation has been started outside the MTC yx T001 onto which the drop
is performed, a copy operation is being performed by default (the default operation can be changed, see
below).
• In case the current Drag&Drop operation would copy the currently selected data into the MTC yx T001,
<Shift> can be pressed in order to perform a move instead of a copy.
• In case the current Drag&Drop operation would move the currently selected data into the MTC yx T001,
<Ctrl> can be pressed in order to perform a copy instead of a move.
• A horizontal bar shows where exactly the currently dragged data would be dropped. The bar always is
being displayed between the two existing legend tree entries where the first of the currently dragged data
will be inserted (or at the top or at the bottom of the existing legend tree, in case the mouse cursor is
above or below the current legend tree).
• In order to insert the currently dragged data as x-axis data, the position bar must be placed at the very
left of the legend area. In order to insert the currently dragged data as y-axis data, the position bar must
be placed with a small space from the very left of the legend area.
• In order to remove a data from the legend tree with the mouse, the desired data has to be dragged to
any position within the X-Tools Client which does not accept data.
In order to drag a data from the legend tree to another area of the MTC yx T001, the desired data has to be
dragged from its legend tree to the target area. This functionality can be used in order to copy/move the data
onto another legend tree or to create a new (x or y) axis for it. The actual operation which is performed depends
to the area of the MTC yx T001 where the dragged data is dropped.
Context Menu
The following specific context menu items are provided for each x-axis data:
Context Menu Item
Description
Show Legend > …
sets the visibility of the legend to the state which is specified via the submenu of this item
Show Data Sources > …
specifies whether the legend trees shall display the name of the source server together with the
data name or not
Remove Data
removes the selected data(s) from the MTC yx T001
Print Screenshot
prints the screenshot of the Monitoring View
Save Screenshot
saves the screenshot of the Monitoring View
Close Chart
closes the MTC yx T001
English
Release 2012-09
188 / 214
SIPLUS CMS X-Tools - User Manual - 05 - Monitoring System
SIPLUS CMS
The following specific context menu items are provided for each y-axis data:
Context Menu Item
Description
Show Legend > …
sets the visibility of the legend to the state which is specified via the submenu of this item
Show Data Sources > …
specifies whether the legend trees shall display the name of the source server together with the
data name or not
Move to x-Axis
moves the selected data(s) to the x-axis
Data Style…
opens the Data Style dialog for the selected data(s)
Copy Data Style
copies the style of the data below the current mouse position
Paste Data Style
pastes the currently copied data style onto the data below the current mouse position
Center Cursor 1 > …
sets the automatic centering of cursor 1 to the state which is specified via the submenu of this
item; the center point is calculated by the arithmetic average of the according y-axis data (y-axis
position) and x-axis data (x-axis position)
Center Cursor 2 > …
sets the automatic centering of cursor 2 to the state which is specified via the submenu of this
item; the center point is calculated by the arithmetic average of the according y-axis data (y-axis
position) and x-axis data (x-axis position)
Remove Data
removes the selected data(s) from the MTC yx T001
Print Screenshot
prints the screenshot of the Monitoring View
Save Screenshot
saves the screenshot of the Monitoring View
Close Chart
closes the MTC yx T001
2.2.6.7
Toolbar Area
The Toolbar Area displays the buttons which are provided for fast access to frequently used functionalities.
The following screenshot shows an example of the Toolbar Area of a MTC yx T001:
Figure 105: Example of the Toolbar Area of a MTC yx T001
Operations via the Left Mouse Button
The following operations can be performed via the left mouse button:
Operation
Description
single click onto the On/Off Measurement Cursors button
A single click of the left mouse button onto the On/Off Measurement Cursors button toggles the
measurement cursors between on and off.
single click onto the Undo button
A single click of the left mouse button onto the Undo button undoes the last operation from the
undo buffer.
single click onto the Redo button
A single click of the left mouse button onto the Redo button redoes the last operation from the
redo buffer.
single click onto the Continue Visualization button
A single click of the left mouse button onto the Continue Visualization button continues the visualization.
This button applies to all currently present data independently to whether they are paused or running at the moment. The Continue Visualization button sets the visualization of all data of all (t and
y) axes to running.
single click onto the Pause Visualization button
A single click of the left mouse button onto the Pause Visualization button pause the visualization.
This button applies to all currently present data independently to whether they are paused or running at the moment. The Pause Visualization button sets the visualization of all data of all (t and y)
axes to paused.
single click onto the Store Data Snap- A single click of the left mouse button onto the Store Data Snapshot button starts the storing of the
shot button
data which are contained within the MTC yx T001.
While the storing is in progress, the Storage Progress dialog shows the current progress of the
storing and also can be used in order to cancel the storing.
See also tutorial, chapter “Storing of Data Snapshots out of the Monitoring System”.
English
Release 2012-09
189 / 214
SIPLUS CMS X-Tools - User Manual - 05 - Monitoring System
SIPLUS CMS
Operations via the Right Mouse Button
The following operations can be performed via the right mouse button:
Operation
Description
single click with releasing the button
A single click of the right mouse button with releasing the button above the Toolbar Area opens
the context menu for the Toolbar Area. The displayed context menu is dependent to the clicked
toolbar button as described below.
Context Menu
The following specific context menu items are provided for the On/Off Measurement Cursors button:
Context Menu Item
Description
Show Toolbar > …
sets the visibility of the toolbar to the state which is specified via the submenu of this item
Show Measurement Cursors > …
sets the visibility of measurement cursors to the state which is specified via the submenu of this
item
Restore Measurement Cursors
restores the positions of the measurement cursors so that both of them are visible at the screen
again
Print Screenshot
prints the screenshot of the Monitoring View
Save Screenshot
saves the screenshot of the Monitoring View
Close Chart
closes the MTC yx T001
The following specific context menu items are provided for the Undo button:
Context Menu Item
Description
Show Toolbar > …
sets the visibility of the toolbar to the state which is specified via the submenu of this item
Undo
undoes the last operation from the undo buffer
Undo all
undoes all operations from the undo buffer
Clear Undo/Redo Buffer
removes all entries from the undo/redo buffer of the MTC yx T001
Change Undo/Redo Buffer Size
opens the Chart Options dialog, sets the input focus to the Undo/Redo Buffer Size edit control
and puts it into editing mode
Print Screenshot
prints the screenshot of the Monitoring View
Save Screenshot
saves the screenshot of the Monitoring View
Close Chart
closes the MTC yx T001
The following specific context menu items are provided for the Redo button:
Context Menu Item
Description
Show Toolbar > …
sets the visibility of the toolbar to the state which is specified via the submenu of this item
Redo
redoes the last operation from the redo buffer
Redo all
redoes all operations from the redo buffer
Clear Undo/Redo Buffer
removes all entries from the undo/redo buffer of the MTC yx T001
Change Undo/Redo Buffer Size
opens the Chart Options dialog, sets the input focus to the Undo/Redo Buffer Size edit control
and puts it into editing mode
Print Screenshot
prints the screenshot of the Monitoring View
Save Screenshot
saves the screenshot of the Monitoring View
Close Chart
closes the MTC yx T001
English
Release 2012-09
190 / 214
SIPLUS CMS X-Tools - User Manual - 05 - Monitoring System
SIPLUS CMS
The following specific context menu items are provided for the Pause Visualization button:
Context Menu Item
Description
Show Toolbar > …
sets the visibility of the toolbar to the state which is specified via the submenu of this item
Pause Visualization
pauses the visualization, which stops the automatic update of all data
Continue Visualization
continues the visualization, which continues the automatic update of all data
Print Screenshot
prints the screenshot of the Monitoring View
Save Screenshot
saves the screenshot of the Monitoring View
Close Chart
closes the MTC yx T001
The following specific context menu items are provided for the Continue Visualization button:
Context Menu Item
Description
Show Toolbar > …
sets the visibility of the toolbar to the state which is specified via the submenu of this item
Pause Visualization
pauses the visualization, which stops the automatic update of all data
Continue Visualization
continues the visualization, which continues the automatic update of all data
Print Screenshot
prints the screenshot of the Monitoring View
Save Screenshot
saves the screenshot of the Monitoring View
Close Chart
closes the MTC yx T001
The following specific context menu items are provided for the Store Data Snapshot button:
Context Menu Item
Description
Show Toolbar > …
sets the visibility of the toolbar to the state which is specified via the submenu of this item
Store Data Snapshot
starts the storing of the data which are contained within the MTC yx T001
Data Snapshot Scope > …
sets the scope for data snapshots to the setting which is specified via the submenu of this item
Print Screenshot
prints the screenshot of the Monitoring View
Save Screenshot
saves the screenshot of the Monitoring View
Close Chart
closes the MTC yx T001
English
Release 2012-09
191 / 214
SIPLUS CMS X-Tools - User Manual - 05 - Monitoring System
2.2.6.8
SIPLUS CMS
Measurement Cursors
The Measurement Cursors are represented through two 2-dimensional crosses, where the cross is placed exactly at the point of intersection of both dimensions and moves into all four directions from there, until it reaches
the borders of the Curve Area. The Measurement Cursors can be shifted independently in horizontal and vertical direction.
The following screenshot shows an example of the Measurement Cursors of a MTC yx T001:
Figure 106: Example of the Measurement Cursors of a MTC yx T001
Operations via the Left Mouse Button
The following operations can be performed via the left mouse button:
Operation
Description
single click with keeping the button
A single click of the left mouse button with keeping the button starts a shift operation. The actual
shifting of the measurement cursor is performed when the mouse is moved:
•
[left mouse button down] + [mouse move] shifts the targeted measurement cursor to the
new mouse position
o
in case the left mouse button was pressed above the horizontal line of the cursor, the
cursor is shifted only in vertical direction
o
in case the left mouse button was pressed above the vertical line of the cursor, the
cursor is shifted only in horizontal direction
o
in case the left mouse button was pressed above the point of intersection of both lines
of the cursor, the cursor is shifted in horizontal and vertical direction
The values which are displayed by the Measurement Cursors table are updated automatically
while the measurement cursor is shifted.
English
Release 2012-09
192 / 214
SIPLUS CMS X-Tools - User Manual - 05 - Monitoring System
SIPLUS CMS
Operations via the Right Mouse Button
The following operations can be performed via the right mouse button:
Operation
Description
single click with keeping the button
A single click of the right mouse button with keeping the button starts a shift operation. The actual
shifting of the measurement cursors is performed when the mouse is moved:
•
[right mouse button down] + [mouse move] shifts both measurement cursors simultaneously with keeping the interval between them
o
in case the left mouse button was pressed above the horizontal line of a cursor, the
cursors are shifted only in vertical direction
o
in case the left mouse button was pressed above the vertical line of a cursor, the cursors are shifted only in horizontal direction
o
in case the left mouse button was pressed above the point of intersection of both lines
of a cursor, the cursors are shifted in horizontal and vertical direction
The values which are displayed by the Measurement Cursors table are updated automatically
while the measurement cursors are shifted.
2.2.6.9
Measurement Cursors Table
The Measurement Cursors table contains the measurement values of all MTC yx T001s which are present
within the parent Monitoring View Editor. The following screenshot shows an example for the Measurement
Cursors table for a MTC yx T001:
Figure 107: Example of a Measurement Cursors table of a MTC yx T001
It is opened within the Cursor Area of the parent Monitoring View Editor of the MTC yx T001:
Column
Description
No.
contains the row number
Chart
contains the name of the chart from which the data comes
X1
contains the x-axis value of the data at the position of cursor 1
Y1
contains the y-axis value of the data at the position of cursor 1
X2
contains the x-axis value of the data at the position of cursor 2
Y2
contains the y-axis value of the data at the position of cursor 2
X2-X1
contains the difference in between X2 and X1
Y2-Y1
contains the difference in between Y2 and Y1
Norm |XY|
contains the norm between the position of cursor 1 and the position of cursor 2
The contents of the Measurement Cursors table can be copied to the clipboard of Windows. From there, they
can be inserted into any other compatible application.
English
Release 2012-09
193 / 214
SIPLUS CMS X-Tools - User Manual - 05 - Monitoring System
2.2.6.10
2.2.6.10.1
SIPLUS CMS
Chart Options Dialog
Overview
The following screenshot shows an example of a Chart Options dialog:
Figure 108: Example of a Chart Options Dialog of a MTC yx T001
English
Release 2012-09
194 / 214
SIPLUS CMS X-Tools - User Manual - 05 - Monitoring System
2.2.6.10.2
SIPLUS CMS
Chart Options Table
The Chart Options table contains the chart options of the MTC yx T001:
Parameter
Description
Chart Name
allows to enter a name for the chart
Time Domain
allows to choose the time domain
Time Base
allows to choose the time base
Show Background Grid
allows to choose whether the background grid shall be shown within the Curve Area
Show Legend
allows to choose whether the Legend Area shall be shown
Show Toolbar
allows to choose whether the Toolbar Area shall be shown
Show x-Axis
allows to choose whether the x-Axis Area shall be shown
Show y-Axis
allows to choose whether the y-Axis Area shall be shown
Show Sliders
allows to choose whether the Slider Area shall be shown
Rescale x-Axis after Open
allows to choose whether the x-axis shall be scaled automatically after the Monitoring View File
has been opened
Rescale x-Axis after Action
allows to choose whether the x-axis shall be scaled automatically after the displayed data have
been modified outside the MTC yx T001 or after a new data has been dropped into the MTC yx
T001
Rescale y-Axis after Open
allows to choose whether the y-axis shall be scaled automatically after the Monitoring View File
has been opened
Rescale y-Axis after Action
allows to choose whether the y-axis shall be scaled automatically after the displayed data have
been modified outside the MTC yx T001 or after a new data has been dropped into the MTC yx
T001
Update Display Time after Open
allows to choose whether the display time shall be updated automatically after the Monitoring
View File has been opened
Update Display Time after Action
allows to choose whether the display time shall be updated automatically after the displayed data
have been modified outside the MTC yx T001 or after a new data has been dropped into the MTC
yx T001
Undo/Redo Buffer Size
allows to enter the total size of undo/redo operations which shall be remembered by the MTC yx
T001
Data Snapshot Scope
allows to choose whether data snapshots shall store only the data from the currnet Monitoring
Chart or from the whole Monitoring View
Chart Name
The Chart Name is used by other modules in order to identify a certain MTC yx T001. Within the current Monitoring View, the Chart Name of each MTC yx T001 must be unique.
Time Domain
The following time domains are supported by the Chart Options dialog of the MTC yx T001:
• Online Data with absolute Timestamps
• Offline Data with absolute Timestamps
• Offline Data with relative Timestamps
The Time Domain cell displays the time domain which is currently being used by all x-axis of the MTC yx T001.
In case more than one time domain is being used currently, the Time Domain cell stays empty.
When another time domain is being chosen via the Time Domain cell, the chosen time domain is applied to all
of the x-axis of the MTC yx T001. As a result, all x-axis use the data with the known name and specified time
domain for their visualization. In case there is no data with the known name and matching time domain, the
affected data becomes marked as not present.
In case the time domain is being changed, the x-/y-axis and the display time can be updated automatically in
case the Rescale x-Axis after Action, Rescale y-Axis after Action or Rescale Display Time after Action options
are being set to “Yes”.
English
Release 2012-09
195 / 214
SIPLUS CMS X-Tools - User Manual - 05 - Monitoring System
SIPLUS CMS
Time Base
The chosen time base specifies how the time stamps of each probe, which are being stored in GMT internally,
are being represented by the MTC yx T001. In case online data is being displayed and the option “Use the local
Time of the Offline Data” is being chosen, the time base for all online data is taken from the time base setting of
the Monitoring View (like if “Default” would have been chosen for the time base of the MTC yx T001).
Rescale x-Axis after Open
Rescale x-Axis after Open
Description
Yes
In case the rescale mode for the x-axis after open is set to “Yes”, the MTC yx T001 automatically
rescales its x-axis after the Monitoring View File has been opened so that all values from all data
of the x-axis become visible.
No
In case the rescale mode for the x-axis after open is set to “No”, the MTC yx T001 does not touch
the scaling of its x-axis after the Monitoring View File has been opened and leaves it at the stored
values from the Monitoring View File.
Rescale x-Axis after Action
Rescale x-Axis after Action
Description
Yes
In case the rescale mode for the x-axis after an action is set to “Yes”, the MTC yx T001 automatically rescales its x-axis after an external action has modified the displayed data so that all values
of the x-axis become visible.
The following actions result in an automatic rescale of the x-axis in case this mode is chosen:
No
•
another part of a contained data has been opened/appended/overwritten
•
a contained data has been recalculated
•
another data is added to the MTC yx T001
In case the rescale mode for the x-axis after an action is set to “No”, the MTC yx T001 does not
touch the scaling of its x-axis after an external action has modified the displayed and leaves it at
the current values.
Rescale y-Axis after Open
Rescale y-Axis after Open
Description
Yes
In case the rescale mode for the y-axis after open is set to “Yes”, the MTC yx T001 automatically
rescales its y-axis after the Monitoring View File has been opened so that all values from all data
of the y-axis become visible.
No
In case the rescale mode for the y-axis after open is set to “No”, the MTC yx T001 does not touch
the scaling of its y-axis after the Monitoring View File has been opened and leaves it at the stored
values from the Monitoring View File.
Rescale y-Axis after Action
Rescale y-Axis after Action
Description
Yes
In case the rescale mode for the y-axis after an action is set to “Yes”, the MTC yx T001 automatically rescales the y-axis after an external action has modified the displayed data so that all values
from the y-axis become visible.
The following actions result in an automatic rescale of the y-axis in case this mode is chosen:
No
English
Release 2012-09
•
another part of a contained data has been opened/appended/overwritten
•
a contained data has been recalculated
•
another data is added to the MTC yx T001
In case the rescale mode for the y-axis after an action is set to “No”, the MTC yx T001 does not
touch the scaling of its y-axis after an external action has modified the displayed data and leaves it
at the current values.
196 / 214
SIPLUS CMS X-Tools - User Manual - 05 - Monitoring System
SIPLUS CMS
Update Display Time after Open
Update Display Time after Open
Description
Yes
In case the update mode for the display time after open is set to “Yes”, the MTC yx T001 automatically sets its display time to 10 seconds after the Monitoring View File has been opened:
•
in case of online data, the newest visualized point in time is being set to the current system
time
•
in case of offline data, the newest visualized point in time is being set to the newest common time of the (y- and x-) data of each x-axis
In case the display time is being updated, also the number of to-be-rendered points is being set to
1000.
No
In case the update mode for the display time after open is set to “No”, the MTC yx T001 does not
touch the display time after the Monitoring View File has been opened and leaves it at the stored
value from the Monitoring View File.
Update Display Time after Action
Update Display Time after Action
Description
Yes
In case the update mode for the display time after an action is set to “Yes”, the MTC yx T001
automatically sets its display time to 10 seconds after an external action has modified the displayed data so that all values from the y-axis become visible:
•
in case of online data, the newest visualized point in time is being set to the current system
time
•
in case of offline data, the newest visualized point in time is being set to the newest common time of the (y- and x-) data of each x-axis
The following actions result in an automatic update of the display time in case this mode is chosen:
•
another part of a contained data has been opened/appended/overwritten
•
a contained data has been recalculated
•
another data is added to the MTC yx T001
In case the display time is being updated, also the number of to-be-rendered points is being set to
1000.
No
2.2.6.10.3
In case the update mode for the display time after an action is set to “No”, the MTC yx T001 does
not touch the display time after an external action has modified the displayed data and leaves it at
the current value.
Menu Bar
Menu Button
Description
Restore Defaults
Sets all options back to their default settings.
Set as Standard
Sets the current options as standard options for each new MTC yx T001. The options of already
existing MTC yx T001s are not being changed by this operation.
OK
Closes the dialog and takes over all user inputs.
Cancel
Closes the dialog and discards all user inputs.
Apply
Takes over all user inputs without closing the dialog. This control is enabled only in case the settings within the dialog have been changed.
English
Release 2012-09
197 / 214
SIPLUS CMS X-Tools - User Manual - 05 - Monitoring System
2.2.6.11
2.2.6.11.1
SIPLUS CMS
Chart Styles Dialog
Overview
The following screenshot shows an example of a Chart Styles dialog:
Figure 109: Example of a Chart Styles Dialog of a MTC yx T001
2.2.6.11.2
Default Styles of Data Table
The Default Styles of Data table contains the default styles of data within the MTC yx T001:
Parameter
Description
Data #01 … Data #32
displays the currently chosen color and style for the according data
A double-click into the Color column of this control opens the Select Color dialog for the according row.
A double-click into the Example column of this control opens the Select Style dialog for the according row.
English
Release 2012-09
198 / 214
SIPLUS CMS X-Tools - User Manual - 05 - Monitoring System
2.2.6.11.3
SIPLUS CMS
Styles of Controls Table
The Styles of Controls table contains the styles of the controls of the MTC yx T001:
Parameter
Description
Chart Background
displays the currently chosen color for the chart background
Background Grid
displays the currently chosen style for the background grid
Cursor 1
displays the currently chosen color for the first cursor
Cursor 2
displays the currently chosen color for the second cursor
Axes Color
displays the currently chosen color for the axes
Zooming Frame
displays the currently chosen style for the zooming frame
Text of selected Items (Active)
displays the currently chosen color of the text of active selected items
Text of selected Items (Inactive)
displays the currently chosen color of the text of inactive selected items
Background of selected Items (Active) displays the currently chosen color of the background of active selected items
Background of selected Items (Inactive)
displays the currently chosen color of the background of inactive selected items
A double-click into the Color column of any row opens the Select Color dialog for the according row.
A double-click into the Example column of a row which supports different styles opens the Select Style dialog
for the according row. In case different styles are not supported by a row, a double-click into the Example column opens the Select Color dialog for the according row.
2.2.6.11.4
Menu Bar
Menu Button
Description
Restore Defaults
Sets all styles back to their default settings.
Set as Standard
Sets the current styles as standard styles for each new MTC yx T001. The styles of already existing MTC yx T001s are not being changed by this operation.
OK
Closes the dialog and takes over all user inputs.
Cancel
Closes the dialog and discards all user inputs.
Apply
Takes over all user inputs without closing the dialog. This control is enabled only in case the styles
within the dialog have been changed.
2.2.6.12
2.2.6.12.1
Data Style Dialog
Overview
The following screenshot shows an example of a Data Style dialog:
Figure 110: Example of a Data Style Dialog of a MTC yx T001
English
Release 2012-09
199 / 214
SIPLUS CMS X-Tools - User Manual - 05 - Monitoring System
2.2.6.12.2
SIPLUS CMS
Style Parameters Table
The Style Parameters table contains the visualization style parameters of the currently selected data:
Parameter
Description
Line Type
allows to switch between the available line types
Line Color
allows to enter the desired line color
Line Strength
allows to switch between the available line strengths
Mark Type
allows to switch between the available mark types
Mark Color
allows to enter the desired mark color
Mark Strength
allows to switch between the available mark strengths
Rendering Mode
allows to switch between the available rendering modes
Interpolation Mode
not applicable
Example
displays an example curve according to the specified data style
A value of “Default” can be assigned to each style parameter. In case “Default” is being chosen, the according
value from the Chart Styles dialog is being used for the visualization of the data.
Rendering Mode
In order to visualize data of the function y = f(x), there are two signals necessary. One is defining the value on
the x-axis and the second is defining the value on the y-axis.
The rendering mode can be used in order to configure how the to-be-displayed value shall be calculated.
Rendering Mode
Description
Default
This setting keeps the default value for the rendering mode of the data.
Average Value
When the rendering mode is set to “Average Value”, the arithmetic average value is taken as
value for the visualization (for both axes).
Minimal and Maximal Value (x-Axis)
When the rendering mode is set to “Minimal and Maximal Value (x-Axis)”, the following values are
calculated for each calculation interval:
•
smallest value of the x-axis data
•
biggest value of the x-axis data
•
average value of the y-axis data
In the visualization (and in case the line type is set to “Solid”), a horizontal line is drawn from the
smallest to the biggest x-value at the vertical position of the y-value. In order to connect two calculation intervals, a line is drawn from the previous center of the horizontal line to the next center of
the horizontal line.
Minimal and Maximal Value (y-Axis)
When the rendering mode is set to “Minimal and Maximal Value (y-Axis)”, the following values are
calculated for each calculation interval:
•
average value of the x-axis data
•
smallest value of the y-axis data
•
biggest value of the y-axis data
In the visualization (and in case the line type is set to “Solid”), a vertical line is drawn from the
smallest to the biggest y-value at the horizontal position of the x-value. In order to connect two
calculation intervals, a line is drawn from the previous center of the vertical line to the next center
of the vertical line.
2.2.6.12.3
Menu Bar
Menu Button
Description
Restore Defaults
Sets all styles back to their default settings.
OK
Closes the dialog and takes over all user inputs.
Cancel
Closes the dialog and discards all user inputs.
Apply
Takes over all user inputs without closing the dialog. This control is enabled only in case the styles
within the dialog have been changed.
English
Release 2012-09
200 / 214
SIPLUS CMS X-Tools - User Manual - 05 - Monitoring System
2.2.6.13
2.2.6.13.1
SIPLUS CMS
Select Style Dialog
Overview
The following screenshot shows an example of a Select Style dialog:
Figure 111: Example of a Select Style Dialog of a MTC yx T001
The functionality of the Select Style dialog matches the functionality of the Data Style dialog (see point
2.2.6.12).
2.2.6.14
2.2.6.14.1
Manual scale x-Axis Dialog
Overview
The following screenshot shows an example of a Manual scale x-Axis dialog:
Figure 112: Example of a Manual scale x-Axis Dialog of a MTC yx T001
English
Release 2012-09
201 / 214
SIPLUS CMS X-Tools - User Manual - 05 - Monitoring System
2.2.6.14.2
SIPLUS CMS
x-Axis Parameters Table
The x-Axis Parameters table contains the parameters of a currently selected x-axis:
Parameter
Description
Auto scale Axis
allows to switch between the available auto scale axis modes
Minimum Value
allows to enter the minimum value of the scaling
Minimum Value Exponent
allows to switch between the supported minimum value exponents
Maximum Value
allows to enter the maximum value of the scaling
Maximum Value Exponent
allows to switch between the supported maximum value exponents
Auto set Scaling Interval
allows to switch between the available modes for the automatic scaling interval
Scaling Interval
allows to enter the scaling interval
Scaling Interval Exponent
allows to switch between the supported scaling interval exponents
Minor Scaling Divider
allows to switch between the available minor scaling dividers
Auto scale Axis
Auto scale Axis
Description
On
In this mode, the MTC yx T001 constantly sets the scaling of the x-axis so that all available values
of the data at the x-axis stay visible.
Off
In this mode, the MTC yx T001 uses the specified Minimum Value and Maximum Value parameters for the scaling of the x-axis.
Auto set Scaling Interval
Auto set Scaling Interval
Description
On
In this mode, the MTC yx T001 constantly sets the scaling interval of the x-axis according to the
currently displayed value interval.
Off
In this mode, the MTC yx T001 uses the specified Scaling Interval and Scaling Interval Exponent
parameters for the scaling interval of the x-axis. In case the specified parameters would lead to
overlapping numbers, the automatic scaling interval is being used automatically until the specified
parameters allow a valid scaling again.
2.2.6.14.3
Menu Bar
Menu Button
Description
OK
Closes the dialog and takes over all user inputs.
Cancel
Closes the dialog and discards all user inputs.
Apply
Takes over all user inputs without closing the dialog. This control is enabled only in case the settings within the dialog have been changed.
English
Release 2012-09
202 / 214
SIPLUS CMS X-Tools - User Manual - 05 - Monitoring System
2.2.6.15
SIPLUS CMS
Manual scale y-Axis Dialog
2.2.6.15.1
Overview
The following screenshot shows an example of a Manual scale y-Axis dialog:
Figure 113: Example of a Manual scale y-Axis Dialog of a MTC yx T001
2.2.6.15.2
y-Axis Parameters Table
The y-Axis Parameters table contains the parameters of a currently selected y-axis:
Parameter
Description
Auto scale Axis
allows to switch between the available auto scale axis modes
Minimum Value
allows to enter the minimum value of the scaling
Minimum Value Exponent
allows to switch between the supported minimum value exponents
Maximum Value
allows to enter the maximum value of the scaling
Maximum Value Exponent
allows to switch between the supported maximum value exponents
Auto set Scaling Interval
allows to switch between the available modes for the automatic scaling interval
Scaling Interval
allows to enter the scaling interval
Scaling Interval Exponent
allows to switch between the supported scaling interval exponents
Minor Scaling Divider
allows to switch between the available minor scaling dividers
Auto scale Axis
Auto scale Axis
Description
On
In this mode, the MTC yx T001 constantly sets the scaling of the y-axis so that all available values
of the data at the y-axis stay visible.
Off
In this mode, the MTC yx T001 uses the specified Minimum Value and Maximum Value parameters for the scaling of the y-axis.
Auto set Scaling Interval
Auto set Scaling Interval
Description
On
In this mode, the MTC yx T001 constantly sets the scaling interval of the y-axis according to the
currently displayed value interval.
Off
In this mode, the MTC yx T001 uses the specified Scaling Interval and Scaling Interval Exponent
parameters for the scaling interval of the y-axis. In case the specified parameters would lead to
overlapping numbers, the automatic scaling interval is being used automatically until the specified
parameters allow a valid scaling again.
English
Release 2012-09
203 / 214
SIPLUS CMS X-Tools - User Manual - 05 - Monitoring System
2.2.6.15.3
SIPLUS CMS
Menu Bar
Menu Button
Description
OK
Closes the dialog and takes over all user inputs.
Cancel
Closes the dialog and discards all user inputs.
Apply
Takes over all user inputs without closing the dialog. This control is enabled only in case the settings within the dialog have been changed.
2.2.6.16
Manual scale Renderer Dialog
2.2.6.16.1
Overview
The following screenshot shows an example of a Manual scale Renderer dialog:
Figure 114: Example of a Manual scale Renderer Dialog of a MTC yx T001
2.2.6.16.2
Renderer Parameters Table
The Renderer Parameters table contains the rendering parameters of a currently selected slider:
Parameter
Description
Target Slider
allows to switch between the available sliders
Time Input Mode
allows to switch between the available time input modes
Minimum Time Format
allows to switch between the available input formats for the minimum time
Minimum Time Value
allows to enter the minimum time of the scaling
Time Interval Format
allows to switch between the available input formats of the time interval
Time Interval Value
allows to enter the time interval of the scaling
Maximum Time Format
allows to switch between the available input formats for the maximum time
Maximum Time Value
allows to enter the maximum time of the scaling
Rendered Points
allows to enter the number of points which shall be calculated by the renderer for the current time
interval of interest
2.2.6.16.3
Menu Bar
Menu Button
Description
OK
Closes the dialog and takes over all user inputs.
Cancel
Closes the dialog and discards all user inputs.
Apply
Takes over all user inputs without closing the dialog. This control is enabled only in case the settings within the dialog have been changed.
English
Release 2012-09
204 / 214
SIPLUS CMS X-Tools - User Manual - 05 - Monitoring System
2.2.6.17
SIPLUS CMS
Drag&Drop sensitive Areas
The following screenshot shows the places within a MTC yx T001 onto which data can be dropped in order to
open a new Monitoring Chart:
Figure 115: Dropping of Data in order to open a new Monitoring Chart
The following screenshot shows the places within a MTC yx T001 onto which data can be dropped in order to
add the data to the existing MTC yx T001:
Figure 116: Dropping of Data in order to add it to the existing MTC yx T001
English
Release 2012-09
205 / 214
SIPLUS CMS X-Tools - User Manual - 05 - Monitoring System
2.3
SIPLUS CMS
Monitoring View Editors
2.3.1
Overview
Monitoring View Editors are used in order to edit Monitoring Views. A Monitoring View contains one or more
Monitoring Charts which are used in order to visualize their contained data. Depending to the Monitoring
View Editor, one ore multiple Monitoring Charts can be put into one Monitoring View and different Monitoring
Charts may or may not be allowed to be used simultaneously.
Monitoring View Editors are known and accessed exclusively by the X-Tools Client, the X-Tools Server has
no knowledge about Monitoring View Editors at all. However, the X-Tools Server is responsible to maintain
Monitoring View Files and therefore all Monitoring View reading and writing operations are performed via the XTools Server.
2.3.2
2.3.2.1
Common Controls
Overview
As all Monitoring View Editors are built up in a similar way, they share some common controls (e.g. tables and
the menu bar) which are the same in all Monitoring View Editors.
Each control of a Monitoring View Editor has a defined task and provides certain functionalities. The following
major controls are provided by the Monitoring View Editors. Depending to the Monitoring View Editor, one or
more parts may not be supported (because they are not needed) and one or more parts may be present in addition to the following ones (because they are necessary):
• Monitoring View Settings Table
• Menu Bar
2.3.2.2
Monitoring View Settings Table
The Monitoring View Settings table contains all of the view-dependent settings which can be configured within a
Monitoring View:
Parameter
Description
Target Name
contains the name of the target to which the Monitoring View is stored
Storage Path
contains the path to which the Monitoring View is stored (absolute or symbolic path)
Creation Date
contains the creation date of the Monitoring View
Modification Date
contains the last modification date of the Monitoring View
View Description
contains the description of the Monitoring View
Company Name
contains the company name
Author Name
contains the author name
Target Name
All of the information about the Target Name and Storage Path is set up within the Save As dialog.
English
Release 2012-09
206 / 214
SIPLUS CMS X-Tools - User Manual - 05 - Monitoring System
2.3.2.3
SIPLUS CMS
Menu Bar
Menu Button
Description
New
This button creates a new, empty Monitoring View and initializes the Monitoring View Settings
table with the default values for new Monitoring Views.
In case there is a Monitoring View opened already, it is closed automatically before the new one is
being created.
Open…
This button opens the Open dialog where the user is able to select the file which shall be opened.
Save
This button saves the currently opened Monitoring View to the currently known storage location. In
case the storage location has not been defined yet, the Save As dialog is popping up automatically and the user is able to select the desired storage location.
Save As…
This button opens the Save As dialog where the user is able to select the desired storage location.
Close
This button closes the editor. In case the currently opened Loading Profile is not saved, the editor
asks the user whether the Loading Profile shall be saved before it is closed.
English
Release 2012-09
207 / 214
SIPLUS CMS X-Tools - User Manual - 05 - Monitoring System
2.3.3
2.3.3.1
SIPLUS CMS
MVE Standard T001
Overview
The MVE Standard T001 is used in order to visualize, create and edit Monitoring Views of type “Standard
T001”, where each Monitoring View can contain one or multiple Monitoring Charts. Multiple editors of this type
can be opened and used simultaneously.
The following screenshot shows an example of a MVE Standard T001:
Figure 117: Example of a MVE Standard T001
English
Release 2012-09
208 / 214
SIPLUS CMS X-Tools - User Manual - 05 - Monitoring System
SIPLUS CMS
Each control of the MVE Standard T001 has a defined task and provides certain functionalities. The following
major controls are provided by the MVE Standard T001:
• Monitoring View Settings Table
• Monitoring View Parameters Table
• Automatic Reports Parameters Table
• Automatic Reports Trigger Trable
• Action Area
• Cursor Area
• Menu Bar
• Dropping of Items
2.3.3.2
Monitoring View Settings Table
The standard Monitoring View Settings table is being used by the MVE Standard T001 (see point 2.3.2.2).
2.3.3.3
Monitoring View Parameters Table
The Monitoring View Parameters table contains all of the view-dependent parameters which can be configured
within a Monitoring View:
Parameter
Description
Time Domain
allows to choose the time domain
Time Base
allows to choose the time base
Keep Width of Curve Areas synchronized
allows to configure whether the width of Curve Areas shall be synchronized
Keep Cursors synchronized
allows to configure whether the position of cursors shall be synchronized
Time Domain
The Time Domain cell displays the time domain which is currently being used by all t-axes of all Monitoring
Charts of the MVE Standard T001. In case more than one time domain is being used currently, the Time Domain cell stays empty.
When another time domain is being chosen via the Time Domain cell, the chosen time domain is applied to all
of the t-axes within the MVE Standard T001 and to all of its Monitoring Charts. As a result, all t-axes use the
data with the known name and specified time domain for their visualization. In case there is no data with the
known name and matching time domain, the affected data becomes marked as not present.
Time Base
The Time Base cell displays the time base which is currently being used by all t-axes of all Monitoring Charts
of the MVE Standard T001. In case more than one time base is being used currently, the Time Base cell stays
empty.
When another time base is being chosen via the Time Base cell, the chosen time base is applied to all of the taxes within the MVE Standard T001 and to all of its Monitoring Charts. As a result, all t-axes use the specified
time base for their visualization.
In case online data is being displayed and the option “Use the local Time of the Offline Data” is being chosen,
the time base for all online data is automatically set to “Use the local time of the Server”.
English
Release 2012-09
209 / 214
SIPLUS CMS X-Tools - User Manual - 05 - Monitoring System
SIPLUS CMS
Keep Width of Curve Areas synchronized
Keep Width of Curve Areas synchronized
Description
Yes
In case this parameter is set to “Yes”, the width of the Curve Area of all compatible Monitoring
Charts is kept aligned so that the width of the Curve Area of all compatible Monitoring Charts
always is identical:
•
whenever a y-axis is being added/removed/shown/hidden within any of the present, compatible Monitoring Charts, the width of the Curve Area of all compatible Monitoring
Charts is being recalculated and updated
•
the width of the Curve Areas of all compatible Monitoring Charts is defined by the Monitoring Charts which shows the most y-axes at the moment, because the width of the
Curve Areas of all compatible Monitoring Charts is being set to the width of this Monitoring Charts (= the smallest present width of a present Curve Area)
•
in addition to the width, also the horizontal position of all Curve Areas is identical (all Curve
Areas start from the right border of their Monitoring Charts)
•
the y-axes of each Monitoring Charts start directly at the left of the Curve Area (not at the
left border of the Monitoring Charts)
•
the following Monitoring Charts are compatible to this setting:
o
MTC yt T001
o
MTC yn T001
When this setting is being turned on, the MVE Standard T001 automatically sets the widths of all
present columns (of Monitoring Charts) to an equal width. While this setting is being turned on, it
is not possible to change the width of the present columns.
No
English
Release 2012-09
In case this parameter is set to “No”, each Monitoring Chart calculates the width of its Curve
Area separately and without considering of the other, possible present Monitoring Charts.
210 / 214
SIPLUS CMS X-Tools - User Manual - 05 - Monitoring System
SIPLUS CMS
Keep Cursors synchronized
Keep Cursors synchronized
Description
Yes
In case this parameter is set to “Yes”, the cursors of all compatible Monitoring Charts are kept
aligned so that moving and turning on/off of a cursor within one Monitoring Chart is being propagated to all related Monitoring Chart automatically:
•
whenever a cursor is being moved within one Monitoring Chart, the position of the cursor
in time is being propagated to all t-axis of matching groups (within the other present Monitoring Charts)
o
this is valid for all t-axes groups within the Monitoring Chart within which the cursor is
being moved
o
the cursors of all Monitoring Chart are being updated immediately when the cursor is
being moved (not only at the end of the moving operation)
•
in case the cursors are being turned on/off within one Monitoring Chart, the cursors also
are being turned on/off within all other Monitoring Charts which contain t-axes of matching groups
•
example 1
o
Monitoring Chart 1 contains the t-axes group G1
o
Monitoring Chart 2 contains the t-axes groups G1 and G2
o
Monitoring Chart 3 contains the t-axes groups G2 and G3
o
when the cursor is being moved within Monitoring Chart 1, the cursors within Monitoring Chart 2 are being moved automatically
o
•
•
2.3.3.4
the cursors within Monitoring Chart 3 are not being touched by this moving because
Monitoring Chart 3 does not have any common t-axis with Monitoring Chart 1
example 2
o
the same Monitoring Chart and groups like in example 1 are present
o
the user turns on the cursors within Monitoring Chart 1, which turns the cursors on
automatically in Monitoring Chart 2 (but not in Monitoring Chart 3)
o
afterwards the user turns on the cursors within Monitoring Chart 3, which again turns
on the cursors within Monitoring Chart 2 (it does not turn them off there)
o
if the user finally would turn off the cursors within Monitoring Chart 2, the cursors
automatically also turn off in Monitoring Chart 1 and Monitoring Chart 3
the following Monitoring Charts are compatible to this setting:
o
No
the position of the moved cursor within Monitoring Chart 2 is synchronized via G1
- thus, the cursor within Monitoring Chart 2 is being moved to the same position
in time at G1 as the user has moved the cursor within Monitoring Chart 1
MTC yt T001
In case this parameter is set to “No”, the cursors can be moved and turned on/off within each
Monitoring Chart separately. Moving or turning on/off of the cursors is not being propagated to
other Monitoring Charts in this case.
Automatic Reports Parameters Table
The Automatic Reports Parameters table contains all of the parameters which can be configured for the automatic reports:
Parameter
Description
Width
contains the width, in pixels, which the created report shall have
Height
contains the height, in pixels, which the created report shall have
Target Location
contains the location to which the reports shall be stored
English
Release 2012-09
211 / 214
SIPLUS CMS X-Tools - User Manual - 05 - Monitoring System
2.3.3.5
SIPLUS CMS
Automatic Reports Trigger Table
The Automatic Reports Trigger table contains all of the parameters which are relevant for the triggers of automatic reports:
Parameter
Description
Trigger Mode
contains the trigger mode
Time Domain
contains the time domain of the data onto which shall be triggered
Trigger Data Name
contains the name of the data onto which shall be triggered
Trigger Type
contains the trigger type
Threshold Type
contains the threshold type
Interval Type
contains the interval type
Threshold Value
contains the threshold value
Lower Limit
contains the lower limit of the interval
Upper Limit
contains the upper limit of the interval
Hysteresis Value
contains the hysteresis value
Capture Delay Format
contains the capture delay format
Capture Delay Value
contains the capture delay value
Trigger Mode
Trigger Mode
Description
Once
In this trigger mode, the trigger is creating the report only once. Thus, the Monitoring View is
stopped completely after the first report has been created.
Repeating
In this trigger mode, the Monitoring View is continuing to trigger after each created report and may
create reports infinite times.
Trigger Data Name
The desired trigger data either can be set through Drag&Drop from the MDS Explorer or through typing of its
name by hand.
Trigger Type
Trigger Type
Description
Threshold
In case of this trigger type, the trigger is waiting until the specified threshold is reached.
Interval
In case of this trigger type, the trigger is waiting until the specified interval is reached.
Threshold Type
Threshold Type
Description
Rising Edge with Threshold
In case of this threshold type, the trigger is waiting until a rising edge above the specified threshold is detected.
Falling Edge with Threshold
In case of this threshold type, the trigger is waiting until a falling edge below the specified threshold is detected.
Value > Threshold
In case of this threshold type, the trigger is waiting until a value which is bigger than the specified
threshold is detected.
Value < Threshold
In case of this threshold type, the trigger is waiting until a value which is lower than the specified
threshold is detected.
Interval Type
Interval Type
Description
Join Interval
In case of this interval type, the trigger is waiting until the specified interval is joined.
Leave Interval
In case of this interval type, the trigger is waiting until the specified interval is left.
Inside Interval
In case of this interval type, the trigger is waiting until a value inside the interval is detected.
Outside Interval
In case of this interval type, the trigger is waiting until a value outside the interval is detected.
English
Release 2012-09
212 / 214
SIPLUS CMS X-Tools - User Manual - 05 - Monitoring System
2.3.3.6
SIPLUS CMS
Action Area
The Action Area contains all of the Monitoring Charts of the current Monitoring View. Each present Monitoring
Chart can be configured individually or synchronized with other Monitoring Charts within the same Monitoring
View. Via Drag&Drop, additional Monitoring Charts and additional data can be dragged into the Monitoring
View.
The Monitoring Charts within a Monitoring View can be arranged like all other windows of the X-Tools Client
within their according parent windows.
2.3.3.7
Cursor Area
Each cursor table is represented within the Cursor Area via a separated table. There may be multiple cursor
tables present in case Monitoring Charts of different type are present within the Action Area.
A detailed description of the cursor table of each Monitoring Chart is found together with the description of
each Monitoring Chart.
2.3.3.8
Menu Bar
The standard Menu Bar is being used by the MVE Standard T001 (see point 2.3.2.3).
2.3.3.9
Dropped Item
Dropping of Items
Description
Monitoring View File Branches of type opens the dropped Monitoring View
“MVF Standard T001”
Monitoring Chart Branches
adds the dropped Monitoring Chart to the Action Area of the MVE Standard T001
Offline Data Branches
opens a new Monitoring Chart of matching type for the dropped offline data
Online Data Branches
opens a new Monitoring Chart of matching type for the dropped online data
English
Release 2012-09
213 / 214
SIPLUS CMS X-Tools - User Manual - 05 - Monitoring System
3
SIPLUS CMS
Contact Information
Address
Siemens AG
I IA CE SE
Wuerzburger Strasse 121
90766 Fuerth
Germany
Internet
http://www.siemens.com/siplus-cms
English
Release 2012-09
214 / 214