1
SECURITY ADVICE AND WARNINGS
space
Please read this chapter carefully and examine the equipment carefully for potential damages which might arise during
transport and to become familiar with it before continue to install, energize and work with a measuring instrument.
This chapter deals with important information and warnings that should be considered for safe installation and handling
with a device in order to assure its correct use and continuous operation.
Everyone using the product should become familiar with the contents of chapter »Security Advices and Warnings«.
If equipment is used in a manner not specified by the manufacturer, the protection provided by the equipment may be
impaired.
PLEASE NOTE
By qualified personnel only. ISKRA Company assumes no responsibility in connection with installation This booklet contains
instructions for installation and use of measuring instrument. Installation and use of a device also includes handling with
dangerous currents and voltages therefore should be installed, operated, serviced and maintained and use of the product.
If there is any doubt regarding installation and use of the system in which the device is used for measuring or supervision,
please contact a person who is responsible for installation of such system.
Installation and use of devices also includes work with dangerous currents and voltages, therefore such work shall be
carried out by qualified persons. The ISKRA SISTEMI Company assumes no responsibility in connection with installation and
use of the product. If there is any doubt regarding installation and use of the system in which the instrument is used for
measuring or supervision, please contact a person who is responsible for installation of such system.
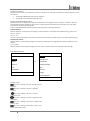
Warnings, information and notes regarding designation of the product
Used symbos:
See product documentation.
Double insulation in compliance with the EN 61010−1standard.
Functional ground potential.
Note: This symbol is also used for marking a terminal for protective ground potential if
it is used as a part of connection terminal or auxiliary supply terminals.
Compliance of the product with directive 2002/96/EC, as first priority, the prevention
of waste electrical and electronic equipment (WEEE), and in addition, the reuse,
recycling and other forms of recovery of such wastes so as to reduce the disposal of
waste. It also seeks to improve the environmental performance of all operators
involved in the life cycle of electrical and electronic equipment.
Compliance of the product with European CE directives.
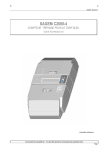
1 Quality Analayser MC774
Before switching the device ON
Check the following before switching on the device:
Nominal voltage,
Supply voltage,
Nominal frequency,
Voltage ratio and phase sequence,
Current transformer ratio and terminals integrity,
Protection fuse for voltage inputs (recommended maximal external fuse size is 6 A)
External switch or circuit-breaker must be included in the installation for disconnection of the devices’ aux. power
supply. --It must be suitably located and properly marked for reliable disconnection of the device when needed.
Integrity of earth terminal
Proper connection and voltage level of I/O modules
Important: A current transformer secondary should be short circuited before connecting the device.
WARNING!
Auxiliary power supply can be LOW range (19-70VDC, 48-77VAC). Connecting device with LOW power supply to higher
voltage will cause device malfunction. Check devices’ specification before turn it on!
Real time clock
As a backup power supply for Real time clock supercap is built in. Support time is up to 2 days (after each power supply
down).
Disposal
It is strongly recommended that electrical and electronic equipment is not deposit as municipal waste. The manufacturer or
provider shall take waste electrical and electronic equipment free of charge. The complete procedure after lifetime should
comply with the Directive 2002/96/EC about restriction on the use of certain hazardous substances in electrical and
electronic equipment.
BASIC DESCRIPTION AND OPERATION
space
The following chapter presents basic information about MC774 Quality Analyser required to understand its purpose,
applicability and basic features connected to its operation.
Besides that, this chapter contains navigational tips, description of used symbols and other useful information for
understandable navigation through this manual.
Regarding the options of a Quality Analyser, different chapters should be considered since it might vary in functionality and
design. More detailed description of device functions is given in chapter Main Features, supported options and
functionality.
Quality Analyser MC774 is available in housing for panel mounting. Specifications of housing and panel cut out for housing
is specified in chapter Dimensions.
Contents
Contents and size of a packaging box can slightly vary depending on type of consignment.
Single device shipment or a very small quantity of devices is shipped in a larger cardboard box, which offers better physical
protection during transport.
This type of contents contains::
-Measuring instrument
-Fixation screws
2 Quality Analayser MC774
-Pluggable terminals for connection of inputs, aux. Power supply and I/O modules
-CD with full version of this document, installation of setting software MiQen, required drivers for -USB (if device is
equipped witd USB communication)
-Short installation manual
When larger amount of devices is sent they are shipped in a smaller cardboard box for saving space and thus reducing
shipment costs. This type of contents contains:
-Measuring instrument
-Fixation screws
-Pluggable terminals for connection of inputs, aux. Power supply and I/O modules
-Short installation manual
This document and settings software MiQen can also be found on our web page http://www.iskra.eu/.
CAUTION
Please examine the equipment carefully for potential damages which might arise during transport!
Description of the Quality Analyser
MC774 Quality Analyser is a comprehensive device intended for permanent monitoring of power quality from its production
(especially renewable), transmission, distribution to final consumers, who are most affected by insufficient quality of
voltage. It is mostly applicable in medium and low voltage markets.
Lack of information about supplied quality of voltage can lead to unexplained production problems and malfunction or even
damage to equipment used in production process. Therefore, this device can be used for utility purposes (evaluation
against standards) as well as for industial purposes (e.g. for monitoring supplied power quality).
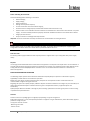
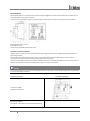
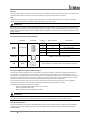
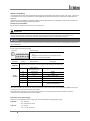
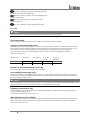
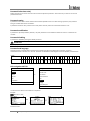
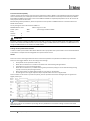
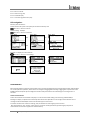
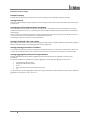
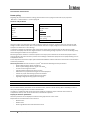
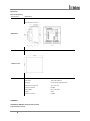
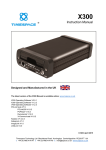
Appearance
12345-
Graphical LCD
Navigation keyboard
A slot with a cover for
memory card
General operation LED
indicators (card/com./alarm)
I/O status LED indicators
Graphical LCD
A graphical LCD with back light is used for high resolution of displayed measuring quantities and for a display of selected
functions when setting the device.
Navigation keyboard
The "OK" key is used for confirming the settings, selecting and exiting the display. Direction keys are used for shifting
between screens and menus.
A slot with a cover Memory card
A Quality Analyser is provided with a slot for a full size MMC or SD card that is used for data transfer from the internal
memory, device setting and software upgrading. A slot protection cover for the card prevents penetration of humidity and
dust into device.
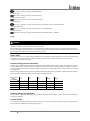
LED indicators
3 Quality Analayser MC774
There are two types of LED indicators positioned on the front panel. General operation LED indicators and I/O status LED
indicators.
General operation LED indicators warns of a certain state of the device. A left (red) indicator indicates the card activity and
that it should not be pulled out. A middle (green) one is blinking when transmitting MC data via communication. A right
(red) one is blinking when the condition for the alarm is fulfilled.
I/O state LED indicators are in operation when additional Modules A and/or B are built in and they have functionality of
Digital input or Relay output. They are indicating the state of a single I/O. Red LED is lit when:
-
Relay output is activated
-
Signal is present on Digital input
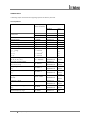
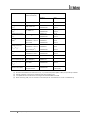
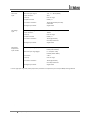
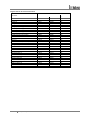
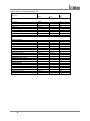
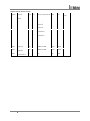
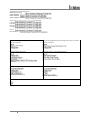
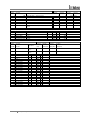
Abbreviation/Glossary
Abbreviations are explained within the text where they appear the first time. Most common abbreviations and expressions
are explained in the following table:
Term
Explanation
RMS
Root Mean Square value
Flash
Type of a memory module that keeps its content in case of power
supply failure
Ethernet
IEEE 802.3 data layer protocol
MODBUS / DNP3
Industrial protocol for data transmission
Memory card
Multimedia memory card. Type MMC and SD supported.
MiQen
Setting Software for Iskra SISTEMI instruments
PA total
Power Angle calculated from total active and apparent power
PAphase
Angle between fundamental phase voltage and phase current
PFphase
Power factor, calculated from apparent and active power (affected by
harmonics)
THD (U, I)
Total harmonic distortion
MD
Max. Demand; Measurement of average values in time interval
FFT graphs
Graphical display of presence of harmonics
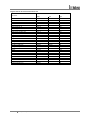
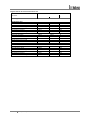
Harmonic voltage − harmonic
Sine voltage with frequency equal to integer multiple of basic
frequency
InterHarmonic voltage −
interharmonic
Sine voltage with frequency NOT equal to integer multiple of basic
frequency
Flicker
Voltage fluctuation causes changes of luminous intensity of lamps,
which causes the so-called flicker
RTC
Real Time Clock
Sample factor
Defines a number of periods for measuring calculation on the basis of
measured frequency
Mp − Average interval
Defines frequency of refreshing displayed measurements
Hysteresis [%]
Percentage specifies increase or decrease of a measurement from a
certain limit after exceeding it.
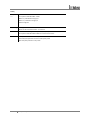
IRIG-B
Serial Inter-range instrumentation group time code
GPS
Satellite navigation and time synchronisation system
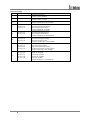
PO
Pulse output module
TI
Tariff input module
RO
Relay output module
BO
Bistable alarm output module
AO
Analogue output module
DI
Digital input module
PI
Pulse input module
AI
Analogue input module
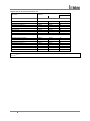
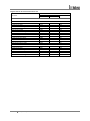
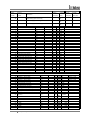
4 Quality Analayser MC774
WO
Status (watchdog) module – for supervision of proper operation
List of common abbreviations and expressions
5 Quality Analayser MC774
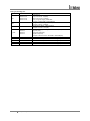
Purpose and use of the device
MC774 Quality Analyser performs measurements in compliance with regulatory requested standard EN 61000-4-30 and
evaluates recorded parameters for analysis according to parameters defined in European supply quality standard EN
50160:2011.
Moreover device stores measurements and quality reports in internal memory for further analysis over recorded
measurements. From multiple devices installed on different locations, user can gain the overall picture of system
behaviour. This can be achieved with regard to its accurate internal real time clock and wide range of synchronization
sources support, which assure accurate, time-stamped measurements from dislocated units.
All required measurements, weekly PQ reports and alarms can also be stored locally in an internal memory. Stored data can
be then transferred to a memory card or accessed through communication for post analysis.
The internal memory capacity enables storing of more than 170,000 variations of the measurements from the standard
values, which enables finding eventual reasons for the problems in network. Limits and required quality in a monitored
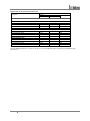
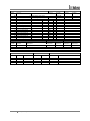
period can be defined for each monitored characteristic. The following characteristics are measured and recorded:
Power Quality indices as defined by EN 50160
Phenomena
PQ Parameters
Frequency variations
Frequency distortion
Voltage variations
Voltage fluctuation
Voltage unbalance
Voltage changes
Rapid voltage changes
Flicker
Voltage events
Voltage dips
Voltage interruptions
Voltage swells
Harmonics & THD
THD
Harmonics
Inter-harmonics
Signalling voltage
6 Quality Analayser MC774
Main Features, supported options and functionality
MC774 Quality Analyser is a perfect tool for monitoring and analysing medium or low voltage systems in power distribution
and industrial segments. It can be used as a standalone PQ monitoring device for detection of local PQ deviations. For this
purpose it is normally positioned at the point-of-common-coupling (PCC) of small and medium industrial and commercial
energy consumers to monitor quality of delivered electric energy or at medium or low voltage feeders to monitor, detect
and record possible disturbances caused by (unauthorized) operation of consumers.
User can select different hardware modules that can be implemented in device. Wide range of variants can cover practically
every user’s requirements.
MC774 Quality Analyser is a compact, user friendly and cost effective device that offers various features to suit most of the
requirements for a demanding power system management:
-PQ analysis in compliance with EN 50160 with automatic report generation
-High accuracy in compliance with Class A (0.1%) EN61000-4-30
-Measurements of instantaneous values of more than 140 quantities including harmonics, flicker, power line signalling
voltage, unbalance…
-Four quadrant energy measurement with class 0.2S for active energy, 8 programmable counters, up to four tariffs, tariff
clock…
th
-Recording all measured parameters including all voltage and current harmonics up to 65 , 32 adjustable alarms, anomalies
and quality reports in the internal memory
-Automatic range selection of 4 current and 4 voltage channels (max. 12.5 A and 1000 Vrms) with 32 kHz sampling rate
-MODBUS and DNP3 communication protocols
-Support for effective sub metering applications (comprehensive counters settings, tariff and cost management)
-Support for GPS, IRIG-B (modulated and digital) and NTP real time synchronisation
-Up to 20 inputs and outputs
-Multilingual support
-User-friendly setting and evaluation software, MiQen
-CE certification
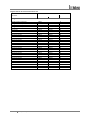
7 Quality Analayser MC774
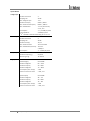
General hardware Features
Default / Optional
General
Class A measuring accuracy according to EN 61000-4-30
Voltage auto range up to 1000Vp-pRMS
Current auto range up to 12.5 A
4 voltage and 4 current channels with 32 us sampling time
Universal power supply type High or type Low
Two independent communication ports (see data below)
Support for GPS, IRIG-B and NTP real time synchronisation
Up to 20 additional inputs and outputs (see data below)
Internal flash memory (8MB)
Real time clock (RTC)
standard 144 mm DIN square panel mounting
Front panel
Graphical LCD display with back light
LED indicator (card/com./alarm)
I/O status LED indicator
SD memory card slot for data transfer
Control keys on front panel (5 keys)
Communication
COM1: Ethernet +USB / USB / Serial (RS232/485)
COM2: Serial (RS232/ RS485 on slot C if other synchronisation modes are in use)
●
○
− Function is supported (default)
− Optional (to be specified with an order)
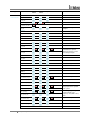
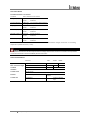
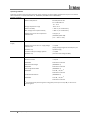
General hardware Features
Default / Optional
Input and output modules
Input / output module 1
2×AO / 2×AI / 2×RO / 2×PO / 2×PI / 2×TI / 1×BO / 2×DI / WO+RO
Input / output module 2
2×AO / 2×AI / 2×RO / 2×PO / 2×PI / 2×TI / 1×BO / 2×DI / WO+RO
Auxiliary input / output module A
I/O A
(1-8) DI / RO
Auxiliary input / output module B
I/O B
(1-8) DI / RO
Synchronisation module C
○/○/○/○/○/○/○/○/○
○/○/○/○/○/○/○/○/○
○/○
○/○
I/O C
GPS + 1pps / IRIG-B / COM2
●
○
Function is supported (default)
Optional (to be specified with an order)
PO
TI
RO
BO
AO
DI
PI
AI
WO
Pulse output module
Tariff input module
Relay output module
Bistable relay output module
Analogue output module
Digital input module
Pulse input module
Analogue input module – U, I or R (PT100/1000)
Status (watchdog) module – for supervision of proper operation
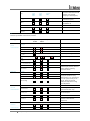
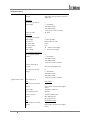
General software Features
Setup wizard
Wrong connection warning
Custom screen settings (3 user defined screens on LCD)
Demonstration screen cycling
8 Quality Analayser MC774
●/●/●
Default / optional
●
●
●
●
●
●
●
●
●/○
○
●/●/○
○
●
●
●
●
●
●
●
●
●/○/○
●
Programmable refresh time
MODBUS and DNP3 communication protocols
Tariff clock
MD calculation (TF, FW, SW)
Wide frequency measurement range 16 – 400 Hz
Programmable alarms (32 alarms)
Alarms recording
Measurements recording (128 quantities)
Measurements graphs (time / FFT)
Evaluation of voltage quality in compliance with EN 50160
Real time clock synchronisation (GPS/IRIG-B/NTP)
9 Quality Analayser MC774
●
●
●
●
●
●
●
●
●
●
●
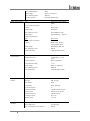
CONNECTION
Space
This chapter deals with the instructions for measuring instrument connection. Both the use and connection of the device
includes handling with dangerous currents and voltages. Connection shall therefore be performed ONLY a by a qualified
person using an appropriate equipment. Iskra Sistemi d.d. does not take any responsibility regarding the use and
connection. If any doubt occurs regarding connection and use in the system which device is intended for, please contact a
person who is responsible for such installations.
A person qualified for installation and connection of a device should be familiar with all necessary precaution measures
described in this document prior to its connection.
Before use:
Before use please check the following:
-
Nominal voltage (UP-Pmax = 1000VACrms; UP-Nmax = 600VACrms),
-
Supply voltage (type HIGH or type LOW),
-
Nominal frequency,
-
Voltage ratio and phase sequence,
-
Current transformer ratio and terminals integrity,
-
Protection fuse for voltage inputs (recommended maximal external fuse size is 6 A)
-
External switch or circuit-breaker must be included in the installation for disconnection of the devices’ aux. power
supply. It must be suitably located and properly marked for reliable disconnection of the device when needed.
See CAUTION below.
-
Integrity of earth terminal
-
Proper connection and voltage level of I/O modules
WARNING!
Wrong or incomplete connection of voltage or other terminals can cause non-operation or damage to the device.
WARNING!
It is imperative that terminal 12 which represents fourth voltage measurement channel is connected to earth pole ONLY.
This terminal should be connected to EARTH potential at all times! This input channel is used only for measuring voltage
between neutral end earth line.
CAUTION
Aux. Supply inrush current can be as high as 20A for short period of time
(<1 ms). Please choose an appropriate MCB for disconnection of aux. Supply.
PLEASE NOTE
After connection, settings have to be performed via a keyboard on the front side of the device that reflect connection of
device to voltage network (connection mode, current and voltage transformers ratio …). Settings can also be done via
communication or a memory card (where available).
10 Quality Analayser MC774
Mounting MC774
MC774 Quality Analyser is intended only for panel mounting. Pluggable connection terminals allow easier installation and
quick replacement should that be required.
This device is not intended for usage as portable equipment and should be used only as a fixed panel mounted device.
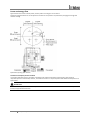
Dimensional drawing and rear connection terminals position
Recommended panel cut out is:
138 x 138 mm + 0.8
Please remove protection foil from the screen.
Electrical connection for MC774
Voltage inputs of a device can be connected directly to low-voltage network or via a voltage measuring transformer to a
high-voltage network.
Current inputs of a device are led through a hole in current transformers to allow uninterrupted current connection.
Connection to network is performed via a corresponding current transformer.
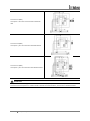
Choose corresponding connection from the figures below and connect corresponding voltages and currents. Information on
electrical consumption of current and voltage inputs is given in a chapter I/O modules.
CAUTION
For accurate operation and to avoid measuring signal crosstalk it is important to avoid driving voltage measuring wires close
to current measuring transformers.
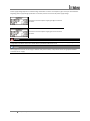
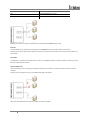
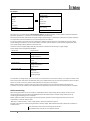
System/ connection
Connection 1b (1W)
Single-phase connection
Connection 3b (1W3)
Three-phase – three-wire connection with balanced load
11 Quality Analayser MC774
Terminal assignment
12 Quality Analayser MC774
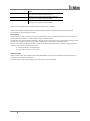
Connection 3u (2W3)
Three-phase – three-wire connection with unbalanced
load
Connection 4b (1W4)
Three-phase – four-wire connection with balanced load
Connection 4u (3W4)
Three-phase – four-wire connection with unbalanced load
PLEASE NOTE
Examples of connections are given for device with built in two input / output modules and RS232 / RS485 communication.
Connection does not depend on a number of built-in modules and communication, and is shown on the device's label.
13 Quality Analayser MC774
Connection of input/output modules for MC774
WARNING!
Check the module features that are specified on the label, before connecting module contacts. Wrong connection can cause
damage or destruction of module and/or device.
PLEASE NOTE
Examples of connections are given for device with built in two input / output modules and RS232 / RS485 communication.
Connection does not depend on a number of built-in modules and communication, and is shown on the devices’ label.
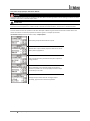
Connect module contacts as specified on the label. Examples of labels are given below and describe modules built in the
device. Information on electrical properties of modules is given in a chapter I/O modules.
I/O module 1 and 2 (terminal numbers 15-20) – output options
Alarm (relay) output module with two outputs.
Bistable alarm output module; keeps the state also in case of
device power supply failure.
Pulse output (solid state) module with two pulse outputs for
energy counters.
Status (watchdog) output module enables proper device
operation supervision on one output (WD) and alarm output
functionality on the other.
Analogue output module with two analogue outputs
(0…20mA), proportional to measured quantities.
14 Quality Analayser MC774
I/O module 1 and 2 (terminal numbers 15-20) – input options
Tariff input module with two tariff inputs for changeover
between up to four tariffs.
Digital input module with two digital inputs enables
reception of impulse signals.
Pulse input module enables reception of pulses from various
counters (water, gas, heat, flow
Analogue input module enables measurements of DC U, I, R
or temp. (PT100, PT1000) values from external sources.
Modules have different hardware, so programming is
possible within one quantity.
WARNING
In case when only one resistance-temperature analogue input is used, the other must be short-circuited.
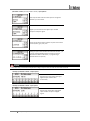
Auxiliary I/O module A and B – output options
Digital output relay module with eight
digital outputs enables alarm
functionality.
Auxiliary I/O module A and B – input options
Digital input module with eight digital
inputs enables reception of digital
signals.
15 Quality Analayser MC774
Synchronisation module C
Synchronisation module is equipped with support for two different
synchronisation methods IRIG-B and GPS modem.
When modulated IRIG-B signal is used it should be connected to
BNC terminal. When level-shift IRIG-B signal is used it should be
connected to 1PPS terminal.
In case of GPS modem, 1pps signal should be connected to 1PPS
terminal and serial RS232 signal should be connected to RS232
terminals.
When IRIG-B (modulated or level-shift) or 1PPS signal is used for
time synchronisation serial communication interface (RS232 or
RS485) can be used as a devices’ secondary communication port
(COM2).
PLEASE NOTE
Communication port on Module C is primarily dedicated to receive serial coded date and time telegram from a GPS receiver
in order to synchronise internal real time clock (RTC). When other methods are used for synchronising RTC this
communication port can be used as a secondary general purpose communication port.
Please note that either RS232 or RS485 should be used and not both at a time. Connector terminals that are not used
should remain unconnected otherwise the communication could not work properly.
CAUTION
RTC synchronisation is essential part of Class A instrument. If no proper RTC synchronisation is provided device operates as
Class S instrument.
CAUTION
Max consumption of +5V supply terminal is 100mA. When GPS with consumption greater the 100mA is used it is advisable
to use external power supply.
Memory card
MC7XX is equipped with a front panel slot for a SD memory card that supports capacity up to 2 GB.
CAUTION
When memory slot is not used it should be covered with attached cover to avoid penetration of dust and small objects.
Memory card is useful for transferring stored data and performing other system operations (downloading settings,
firmware update) when device is not connected to communication.
Memory card allows different operations. Immediately after insertion of a memory card devices’ menu changes to show
memory card options
Transferring data stored in internal memory
All data (readings, alarms, PQ reports and details), which are stored in internal memory can be transferred to a memory
card.
PLEASE NOTE
16 Quality Analayser MC774
Measurements cannot be directly recorded to a memory card. Only data previously stored in internal memory can be
transferred to a memory card.
Upload and download settings
This is a very convenient way of programming devices. Settings can be manually programmed once and stored to a memory
card by Upload settings. Using that memory card more devices can be programmed very fast with identical settings.
Firmware update
When new features are added or when certain fixes should be implemented it is necessary to update devices’ firmware.
This can again be performed fastest by using memory card. New firmware should be transferred to a memory card from
computer once. After that multiple devices can be updated only with memory card.
CAUTION
During firmware update aux. power supply must not be interrupted.
17 Quality Analayser MC774
Communication connection for MC774
Primary communication interface (COM1) type is normally specified when placing an order. Device can support several
types of communication:
-serial RS232/ 485 communication designed as a pluggable 5-pole screw terminal connector,
-Ethernet communication designed as standard RJ-45 terminal and USB communication designed as standard USB-B type
terminal
-Single USB communication designed as standard USB-B type terminal
PLEASE NOTE
When connecting serial communication please note that only RS232 or RS485 should be used and not both at a time.
Connector terminals that are not used should remain unconnected otherwise the communication could not work properly.
Beside primary communication port the device has built in a secondary communication port (COM2) as a part of a real time
synchronisation module C. Its operation is described in a chapter referring to a real time synchronisation Serial
communication via Synchronisation module C (COM2).
Connect a communication line by means of a corresponding terminal. Communication parameters are stated on the device
label, regarding the selected/equipped type of communication. Connector terminals are marked on the label on a devices’
rear side. More detailed information on communication is given in chapter Communication.
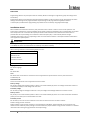
Example of a label for RS232 and RS485 communication with
a pluggable screw terminal connector
Example of a label for Ethernet/USB communication module
equipped with RJ−45 and USB-B type connector
Example of a label for USB communication with USB-B type
connector
Communicaton connection RS232
RS232 communication is intended for direct connection of the Measuring centre to the personal computer. For proper
operation it is necessary to assure the corresponding connection of individual terminals (see table: Survey of
communication connection).
Serial RS232 as secondary communication, COM2 additional communication module
Operates as an independent communication. Separate communication parameters can be set for this communication
module.
Communicaton connection RS485
RS485 communication is intended for connection of devices to network where several devices with RS485 communication
are connected to a common communication interface. We suggest using one of the Iskra Sistemi d.d. communication
interfaces! For proper operation it is necessary to assure the corresponding connection of individual terminals (see table on
next page).
Serial RS485 as secondary communication, COM2 additional communication module
Operates as an independent communication. Separate communication parameters can be set for this communication
module.
Communication for Analogue extender EX104, COM2 additional communication module
Operates as an predefined RS485 communication that can be used for data transfer between measuring centre and
analogue extenders EX104.
18 Quality Analayser MC774
Ethernet
Ethernet communication is used for connection of device to the Ethernet network for remote operation. Each device has its
own MAC address that at some cases needs to be provided and is printed on the label on the device.
USB
USB communication serves as a fast peer-to-terminal data link. The device is detected by host as a USB 2.0 compatible
device. The USB connection is provided through a USB standard Type B connector.
PLEASE NOTE
When device is connected to a PC through USB communication for the first time, a user is prompted to install a driver. The
driver is provided on the CD, enclosed in the original shipment package, or can be downloaded from the Iskra Sistemi web
page www.iskrasistemi.si. With this driver installed, USB is redirected to a serial port, which should be selected when using
MiQen software.
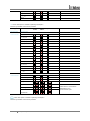
Survey of communication connection MC774
Connector
RS485
RS232
Terminals
Position
Data direction
Description
21
To/From
A
22
To/From
B
23
To
Data reception (Rx)
24
−
Grounding ()
25
From
Data transmission (Tx)
Screw terminal
Ethernet
RJ−45
100BASE-T CAT5 cable recommended
USB
USB-B
Standard USB 2.0 compatible cable recommended (Type B plug)
Connection of Real Time Synchronization module C
Synchronized real-time clock (RTC) is an essential part of any Class A analyzer for proper chronological determination of
various events. To distinct cause from consequence, to follow a certain event from its origin to manifestation in other
parameters it is very important that each and every event and recorded measurement on one instrument can be compared
with events and measurements on other devices. Even if instruments are dislocated, which is normally the case in electro
distribution network events have to be time-comparable with accuracy better than a single period.
Synchronisation module is used to synchronise RTC of the device and to maintain its accuracy for correct aggregation
intervals and time stamps of recorded events appearing in monitored electro distribution network.
Different types of RTC synchronisation are possible:
-
IRIG-B modulated; 1 kHz modulation with <1ms resolution.
IRIG-B unmodulated (level shift)
1PPS + RS232 Date & Time telegram (from GPS)
PLEASE NOTE
For safety purposes it is important that all three wires (Line, Neutral and Protective Earth) are firmly connected. They
should be connected only to the designated terminals as shown on the label above as well as on the front foil.
GPS time synchronization:
1pps and serial RS232 communication with NMEA 0183 sentence support. GPS interface is designed as 5 pole pluggable
terminal (+5V for receiver supply, 1pps input and standard RS232 communication interface). Proposed GPS receiver is
GARMIN GPS18x
19 Quality Analayser MC774
IRIG time code B (IRIG-B):
Unmodulated (DC 5V level shift) and modulated (1 kHz) serial coded format with support for 1pps, day of year, current year
and straight seconds of day as described in standard IRIG-200-04. Supported serial time code formats are IRIG-B007 and
IRIG-B127
Interface for modulated IRIG-B is designed as BNC-F terminal with 600 Ohm input impedance. Interface for unmodulated
IRIG-B is designed as pluggable terminal (see table 3).
Network time protocol (NTP):
Synchronization via Ethernet requires access to a NTP server.
PLEASE NOTE
NTP can usually maintain time to within tens of milliseconds over the public Internet, but the accuracy depends on
infrastructure properties - asymmetry in outgoing and incoming communication delay affects systematic bias. It is
recommended that dedicated network rather than public network is used for synchronisation purposes.
CAUTION
RTC synchronisation is essential part of Class A instrument. If no proper RTC synchronisation is provided device operates as
Class S instrument.
Survey of synchronisation connection
Terminals
Connector type
BNC for modulated IRIG-B
and
Pluggable screw terminals for level-shift IRIG-B, GPS
modem or serial RS232 or RS485
Connector
Position
BNC
connector
600 Ohm input impedance: standard Coaxial cable (55 Ohm) recommended
53
Screw
terminal
Data direction
1PPS (GPS) or
IRIG-B (level shift)
Description
Synchronisation pulse
54
To/From (A)
RS485
55
To/From (B)
RS485
56
To
Data reception (Rx)
57
GND
Grounding
58
From
Data transmission (Tx)
59
+5V
AUX voltage +5V
(supply for GPS modem)
When IRIG-B or 1PPS signal is used for time synchronisation serial communication interface (RS232 or RS485) can be used
as a devices’ secondary communication port (COM2).
More information regarding use of Synchronisation module C is in a chapter Synchronisation module C and Serial
communication via Synchronisation module C (COM2).
Connection of aux. Power supply
Device can be equipped with either of two types of universal (AC/DC) switching power supply.
Type High:
70...300 V DC
80...276 V AC; 40...65 Hz
Type Low:
19...70 V DC
48...77 V AC; 40...65 Hz
20 Quality Analayser MC774
Power supply voltage depends on ordered voltage. Information on electric consumption is given in chapter Technical data .
Regarding power supply voltage specification on the label, choose and connect the power supply voltage:
Connection of universal power supply type High to terminals
13 and 14.
Connection of universal power supply type Low to terminals
13 and 14.
WARNING!
Auxiliary power supply can be LOW range (19-70VDC, 48-77VAC). Connecting device with LOW power supply to higher
voltage will cause device malfunction. Check devices’ specification before turn it on!
CAUTION
Aux. supply inrush current can be as high as 20A for short period of time (<1 ms). Please choose an appropriate MCB for
connection of aux. supply.
21 Quality Analayser MC774
FIRST STEPS
space
Programming device is very transparent and user friendly. Numerous settings are organized in groups according to their
functionality.
Programming device can be performed using the keypad and display on the front panel. Due to representation of certain
settings not all settings can be programmed this way. All settings can be programmed using MiQen software.
In this chapter you will find basic programming steps which can be accessed by using keypad and display.
Installation wizard
After installation and electrical connection, basic parameters have to be set in order to assure correct operation. The
easiest way to achieve that is use the Installation wizard. When entering the Installation menu, settings follow one another
when the previous one is confirmed. All required parameters shall be entered and confirmed. Exit from the menu is
possible when all required settings are confirmed or with interruption (key several times) without changes.
Installation wizard menu may vary, depending on built in communication modules. In description below is marked which
menu appears for specific option.
PLEASE NOTE!
All settings that are performed through the Installation wizard can be subsequently changed by means of the Settings menu
or via MiQen by means of communication or a Memory card (where available).
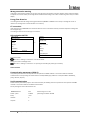
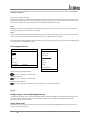
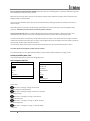
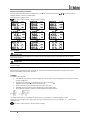
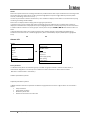
When entering installation wizard following display is shown:
Installation
Welcome to the
Installation Wizard.
Press OK to continue.
< Main menu
Language
Set device language.
Date
Set device date.
Time
Set device time. If instrument is connected to one of supported time synchronisation sources, date and time are
automatically set.
Connection mode
Choose connection from a list of supported connection modes.
Primary voltage
Set primary voltage of monitored system if a device is connected indirectly by means of a voltage transformer. If device is
connected to directly to a low voltage enter this value.
Secondary voltage
Set secondary voltage if a voltage transformer is used; set voltage of low voltage network if connection is direct.
Primary current
Set primary current of monitored system if a device is connected indirectly by means of a current transformer. Otherwise
primary and secondary current should remain the same.
Secondary current
Set secondary current of current transformer or the value of nominal current if connection is direct.
Common energy counter resolution
Define Common energy counter resolution as recommended in table below, where Individual counter resolution is at
default value 10. Values of primary voltage and current determine proper Common energy counter resolution. For detailed
information about setting energy parameters see chapter Energy.
22 Quality Analayser MC774
Suggested Common energy counter resolutions:
Current
1A
5A
50 A
100 A
1000 A
110 V
100 mWh
1 Wh
10 Wh
10 Wh
100 Wh
230 V
1 Wh
1 Wh
10 Wh
100 Wh
1 kWh
1000 V
1 Wh
10 Wh
100 Wh
1 kWh
10 kWh
30 kV
100 Wh
100 Wh
1 kWh
10 kWh
10 kWh *
Voltage
* − Individual counter resolution should be at least 100
Device address
Set MODBUS address for the device. Default address is 33.
Baud rate
Set communication rate. Default rate is 115200 b/s. This setting is available only when RS232 / RS485 communication is
built in.
Parity
Set communication parity. Default value is “None”. This setting is available only when RS232 / RS485 communication is built
in.
Stop bit
Set communication stop bits. Default value is 2. This setting is available only when RS232 / RS485 communication is built in.
IP Address
Set correct IP address of the device. Default setting is 0.0.0.0 and represents DHCP addressing. This setting is available only
when Ethernet communication is built in.
TCP Port
Set TCP communication Port. Default value is 10001. This setting is available only when Ethernet communication is built in.
Subnet mask
Set network subnet mask. Default value is 255.255.255.0. This setting is available only when Ethernet communication is
built in.
23 Quality Analayser MC774
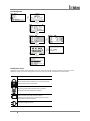
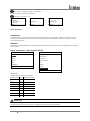
LCD Navigation
Notification icons
Navigation keys and LCD enable application and basic instrument settings. During the operation some icons can be
displayed in upper part of LCD. The significance of icons (from right to left) is explained in the table below.
Icon
Meaning
Device is locked with a password of the second level (L2).
The first level (L1) can be unlocked.
Device can be wrongly connected at 4u connection.
Energy flow direction is different by phases.
A built-in battery (for RTC) shall be replaced.
A battery test is carried out at power supply connection
(for devices with built in battery)
The device supply is too low.
24 Quality Analayser MC774
Clock not set
(for devices with built in super cap)
(when disconnected from aux. supply for more then 2 days)
25 Quality Analayser MC774
SETTINGS
Settings of measuring centre can be performed via the front keypad and display or remotely using communication and
MiQen software version 2.1 or higher. Setting is faster and easier by using MiQen. Basic and simpler settings are accessible
via navigation keypad. For new setting to be activated settings file should be transferred to the device via communication
(MiQen) or a memory card (where available). Setting done via navigation keypad comes in to function after confirmation
(OK button) fallowed by a bit longer sound notification (beep).
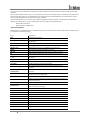
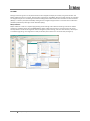
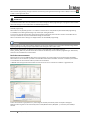
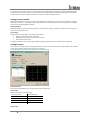
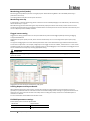
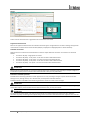
MiQen software
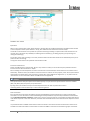
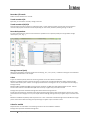
MiQen software is a tool for a complete programming and monitoring of Iskra Sistemi measuring instruments. Remote
operation is possible by means of serial (RS485/RS232), USB or TCP/IP communication in connection with a PC. A userfriendly interface consists of five segments: devices management, device settings, real-time measurements, data analysis
and software upgrading. These segments are easily accessed by means of five icons on the left side (see Figure 2).
26 Quality Analayser MC774
MiQen programming and monitoring software
MiQen version 2.0 or higher is required for programming and monitoring MC774Quality Analyser. Software installation is
stored on a CD as a part of consignment or it can be downloaded from www.iskrasistemi.si.
PLEASE NOTE
MiQen has very intuitive help system. All functions and settings are described in Info window on the bottom of MiQen
window.
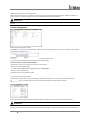
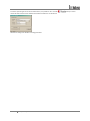
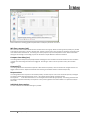
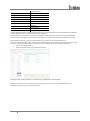
Devices management
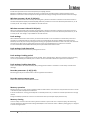
MiQen Device Management window
With MiQen it is very easy to manage devices. If dealing with the same device that has been accessed before it can be easily
selected from a favourite’s line.
This way is Communication port set automatically as it was during last access.
To communicate with new device following steps should be fallowed:
Connect a device to a communication interface
-Depending on type of communication interface connect a device:
-Directly to a PC using RS232 cable
-To comm. adapter RS485 / RS232 (suggested adapter is ISKRA MI485)
-Directly to a PC using USB cable
-Network connection using Ethernet cable
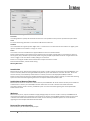
Set Communication port parameters
Under Communication port current communication parameters are displayed. To change those parameters click on
button. A Communication port window opens with different communication interfaces.
Choose correct communication interface (Modbus, Ethernet or USB) and set correct communication parameters.
PLEASE NOTE
When device is connected to a PC through USB communication for the first time, a user is prompted to install a driver. The
driver is provided on the CD, enclosed in the original shipment package, or it can be downloaded from the Iskra Sistemi d.d.
27 Quality Analayser MC774
web page www.iskrasistemi.si. With this driver installed, USB is redirected to a serial port, which should be selected when
using MiQen setting software.
For more information regarding parameters for serial, USB and Ethernet communication see chapters Serial
Communication, USB communication and Ethernet communication.
Set device Modbus address number
Each device connected to a network has its unique Modbus address number. In order co communicate with that device an
appropriate address number should be set.
Factory default Modbus address for all devices is 33. Therefore it is required to change Modbus address number of devices
if they are connected in the network so each device will have its unique address number.
Start communicating with a device
Click on REFRESH button and devices information will be displayed
When devices are connected to a network and a certain device is required it is possible to browse a network for devices.
For this purpose choose
Scan the network when device is connected to a RS485 bus
Browse ethernet devices when device is connected to the Ethernet
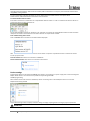
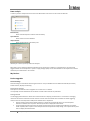
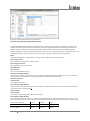
Device settings
Programming devices can be performed ONLINE when device is connected to aux. power supply and is communicating with
MiQen. When device is not connected it is possible to adjust settings OFFLINE.
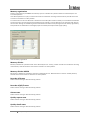
ONLINE programming
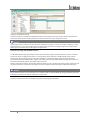
After communication with a device is established, choose icon Settings from a list of MiQen functions on a left side.
MiQen Device Setting window
Choose Read settings button to display all devices settings and begin adjusting them according to project requirement.
PLEASE NOTE
28 Quality Analayser MC774
When finished programming, changes should be confirmed by pressing Download settings button in MiQen menu bar (
or with a mouse right click menu.
)
PLEASE NOTE
When finished programming, all settings can be saved in a setting file (*.msf file). This way it is possible to archive settings
in combination with a date. It is also possible to use saved settings for offline programming or to programme other devices
with same settings. For more information see OFFLINE programming.
OFFLINE programming
When device is not physically present or is unable to communicate it is still possible to perform OFFLINE programming.
From MiQen Device Setting window (Figure 4) choose Open setting file button.
From a list of *.msf files choose either previously stored file (a setting file, which has been used for another MC774 and
stored) or a file MC774.msf, which holds default settings for this device.
When confirmed all device settings are displayed similar as with ONLINE programming.
CAUTION
MXxxx.msf file or any other original device setting file should not be modified as it contains device default settings. Before
adjusting settings according to project requirements save setting file under another name.
When finished programming, all settings can be saved in a setting file with a meaningful name (e.g.
MXxxx_location_date.msf). This file can be then transferred to a Memory card and used for programming on filed devices,
which are not accessible with communication.
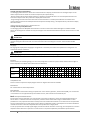
Real time measurements
Measurements can be seen ONLINE when device is connected to aux. power supply and is communicating with MiQen.
When device is not connected it is possible to see OFFLINE measurements simulation.The latter is useful for presentations
and visualisation of measurements without presence of actual device.
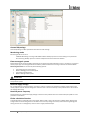
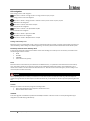
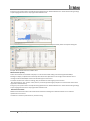
In ONLINE mode all supported measurements and alarms can be seen in real time in a tabelaric or graphical form.
Online measurements in tabelaric form
Online measurements in graphical form – phaser diagram and daily total active power consumption histogram
Different measuring data can be accessed by means of tabs (Measurements, Min/Max…) in the lower part of MiQen
window.
29 Quality Analayser MC774
For further processing of the results of measurements, it is possible to set a recorder (
device that will record and save selected measurements to MS Excel .csv file format.
Window for setting local database recording parameters
30 Quality Analayser MC774
button) on active
Data analysis
In order to perform analysis data source has to be defined first. Data source can be one of the selected:
Read memory
Data is read directly from a devices internal memory
Open data file
Data is read from a local database
Import SD data
Data is imported from a SD memory card
Window for a choice of memory data to be analysed
After data is read or imported recorded quantities can be monitored in a tabular or a graphical form. The events that
triggered alarms can be analyzed or a report on supply voltage quality can be made. All data can be exported to an Access
data base, Excel worksheets or as a text file.
My Devices
Device upgrades
General Settings
General settings are essential for measuring Iinstruments. They are divided into four additional sublevels (Connection,
Communication, Display and Security).
Description & Location
Description is intended for easier recognition of a certain unit in a network.
It is especially used for identification of the device on which measurements are performed.
Average interval
The averaging interval defines a refresh rate of measurements on display, communication. It is used also as averaging
interval for minimum and maximum values stored in recorder and actual alarm value calculation for alarm triggering.
Interval can be set from 8 periods to 256 periods. Default value is 64 periods.
Shorter average interval means better resolution in minimum and maximum value in to recorded period
detection and faster alarm response. Also data presented in display will refresh faster.
Longer average interval means lower minimum and maximum value in recorded period detection and slower
alarm response (alarm response can be delayed also with Compare time delay setting – See chapter Alarms). Also
data on display will refresh slower.
31 Quality Analayser MC774
Average interval for measurements
The averaging interval defines a refresh rate of measurements on display, communication and analogue outputs. It also
defines response time for alarms set to Normal response (see chapter Alarms).
-Shorter average interval means better resolution in minimum and maximum value in to recorded period detection and
faster alarm response. Also data presented in display will refresh faster.
-Longer average interval means lower minimum and maximum value in recorded period detection and slower alarm
response (alarm response can be delayed also with Compare time delay setting – See chapter Alarms). Also data on display
will refresh slower.
Interval can be set from 0.1 to 5 s. Default value is 1 s.
Average interval for Min/Max values
The averaging interval for Min/Max values defines an interval on which values will be averaged to track Min and Max
values. By choosing shorter interval also very fast changes in the network will be detected. Interval can be set form 1 to 256
periods.
PLEASE NOTE
This setting applies only for min. and max. values displayed on LCD and accessible on communication. These values are not
used for storing into internal recorder. For more information about recording min. and max. values see Min and Max
values.
Language
Set language for display. When language is changed from or to Russian, characters of the password are changed too. For
overview of character translation.
PLEASE NOTE
If a wrong language is set, a menu of languages is displayed by simultaneous pressing up and down keys.
Currency
Choose currency for evaluating energy cost. A currency designation consists of up to four letters taken from the English or
Russian alphabet and numbers and symbols stated in table below.
English
A B
C
D
E
a b
c
d
e
!
"
#
$
А Б
В
Г
Д
а б
в
г
д
Symbols
Russian
F
G
H
I
J
f
g
h
i
j
%
&
'
(
)
Е
Ж
З
И
Й
е
ж
з
и
й
K
L
M N
O
P
Q
k
l
m
n
o
p
q
*
+
,
-
.
/
К
Л М Н
O
П
P
С
к
Л
o
п
p
с
м
н
R
S
T
U
r
s
t
u
v
w
x
y
z
:
;
<
=
>
?
@
Т
У
Ф
Х
Ц
Ч
Ш Щ
т
у
ф
х
ц
ч
ш щ
0 to 9
V W
X
Y
Z
Temperature unit
Choose a unit for temperature display. Degrees Celsius or degrees Fahrenheit are available.
Date format
Set a date format for time stamped values.
Date and time
Set date and time of the device. Setting is important for correct memory operation, maximal values (MD), etc. If instrument
is connected to one of supported time synchronisation sources, date and time are automatically set.
Real Time Synchronisation Source
Synchronized real-time clock (RTC) is an essential part of any Class A analyzer for proper chronological determination of
various events. To distinct cause from consequence, to follow a certain event from its origin to manifestation in other
parameters it is very important that each and every event and recorded measurement on one device can be compared with
events and measurements on other devices. Even if devices are dislocated, which is normally the case in electro distribution
network events have to be time-comparable with accuracy better than a single period.
For this purpose devices normally support highly accurate internal RTC. Still this is not enough, since temperature is location
dependant and it influences its precision. For that reason it is required to implement periodical RTC synchronization.
32 Quality Analayser MC774
CAUTION
RTC synchronisation is essential part of Class A instrument. If no proper RTC synchronisation is provided device operates as
Class S instrument.
This setting is used to choose primary synchronisation source.
NO synchronisation (not advisable, see CAUTION above)
NTP synchronisation
MODULE C synchronisation
Synchronisation status can be checked on display when set to INFO display.
Notification icon N shows successful
NTP synchronisation
Notification icon G shows successful
GPS synchronisation. If only 1pps
signal is present (without date and
time feed) notification icon G is
present
Notification icon I shows successful
IRIG synchronisation
Auto Summer/Winter time
If Yes is chosen, time will be automatically shifted to a winter or a summer time, regarding the time that is momentarily set.
Maximum demand calculation (MD mode)
The device provides maximum demand values from a variety of average demand values:
-Thermal function
-Fixed window
-Sliding windows (up to 15)
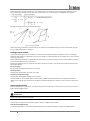
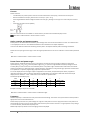
Thermal function
A thermal function assures exponent thermal characteristic based on simulation of bimetal meters.
Maximal values and time of their occurrence are stored in device. A time constant can be set from 1 to 255 minutes and is 6
times thermal time constant (t. c. = 6 × thermal time constant).
Example:
Mode:
Time constant:
Running MD and maximal MD:
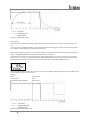
Thermal function
8 min.
Reset at 0 min.
33 Quality Analayser MC774
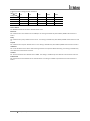
Operation of thermal MD function
Fixed window
A fixed window is a mode that calculates average value over a fixed time period. Time constant can be set from 1 to 255
min.
»Time into period« as displayed in MiQen – help tip actively shows the remaining time until the end of the period in which
current MD and maximal MD from the last reset are calculated.
When displays for Pt(+/−), Qt(L/C), St, I1, I2 and I3 are updated, a new period and measurement of new average values are
started. »TIME INTO PERIOD« then shows 0 of X min where X is Time Constant.
A new period also starts after a longer interruption of power supply (more than 1 s). If time constant is set to one of the
values of 2, 3, 4, 5, 6, 10, 12, 15, 20, 30 or 60 minutes, »TIME INTO PERIOD« is set to such value that one of the following
intervals will be terminated at a full hour. In other cases of time constants, »TIME INTO PERIOD« is set to 0.
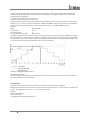
Figure above shows display of MD measurement for current I1. Running MD is displayed (0 mA), max. value of MD since last
reset is displayed and its time of occurrence.
Example:
Mode:
Time constant:
Running MD and maximal MD:
Fixed window
8 min.
Reset at 0 min.
Operation of Fixed window MD function
34 Quality Analayser MC774
A mode of sliding windows enables multiple calculations of average in a period and thus more frequent refreshing of
measuring results. Average value over a complete period is displayed. A running MD is updated every sub-period for
average of previous sub-periods.
A number of sub-periods can be set from 2 to 15.
A time constant can be set from 1 to 255 minutes.
A new period also starts after a longer interruption of power supply (more than 1 s). If time constant is set to one of the
values of 2, 3, 4, 5, 6, 10, 12, 15, 20, 30 or 60 minutes, »TIME INTO PERIOD« is set to such value that one of the following
intervals will be terminated at a full hour. In other cases of time constants, »TIME INTO PERIOD« is set to 0.
Example:
Mode:
Time constant:
No. of sub-periods:
Running MD and maximal MD:
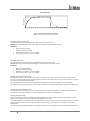
Sliding windows
2 min.
4
Reset at 0 min.
A complete period lasts for 8 minutes and consists of 4 sub-periods that are 2 minutes long. A running MD and a maximal
MD are reset at 0 min. "Time into period" is data for a sub period so that the values for a running MD and a maximal MD
are refreshed every two minutes. After 4 sub-periods (1 complete period) the oldest sub period is eliminated when a new
one is added, so that average (a window) always covers the last 4 sub-periods.
Operation of Sliding window MD function
MD Time constant (min)
The instrument provides maximum demand values based on a thermal function. Thermal function time constant can be
selected via keyboard or via communication.
+
Thermal function
A thermal function assures exponent thermal characteristic based on simulation of bimetal meters.
Maximal values and time of their occurrence are stored in device. A time constant (t. c.) can be set from 1 to 255 minutes
and is 6 − time thermal time constant (t. c. = 6 * thermal time constant).
Example:
Mode: Thermal function
Time constant: 8 min.
Current MD and maximal MD: Reset at 0 min.
35 Quality Analayser MC774
Measured value
Thermal function
0
1
2
3
4
5
6
7
8
9
10 11 12 13 14 15 16 17 18 19 20
Time [min.]
Present MD
MD peak
Input
Maximum demand reset mode
This setting defines a mode of resetting Max demand values. It can be set to:
Manual: User resets max demand value with keypad or setting software (see chapter Reset)
Automatic:
Daily: every day at 00:00,
Weekly: on Monday at 00:00,
Monthly: the first day in a month at 00:00,
Yearly: the first day in a year 1.1. at 00:00
Min/Max reset mode
This setting defines a mode of resetting stored Min/Max values. It can be set to.
Manual: User resets min/max values with keypad or setting software (see chapter Reset).
Automatic:
Daily: every day at 00:00,
Weekly: on Monday at 00:00,
Monthly: the first day in a month at 00:00,
Yearly: the first day in a year 1.1. at 00:00
Starting current for PF and PA (mA)
All measuring inputs are influenced by noise of various frequencies. It is more or less constant and its influence to the
accuracy is increased by decreasing measuring signals. It is present also when measuring signals are not present or are very
low. It causes very sporadic measurements.
This setting defines the lowest current that allows regular calculation of Power Factor (PF) and Power Angle (PA).
The value for starting current should be set according to conditions in a system (level of noise, random current fluctuation
…)
Starting current for all powers (mA)
Noise is limited with a starting current also at measurements and calculations of powers. The value for starting current
should be set according to conditions in a system (level of noise, random current fluctuation …)
Starting voltage for SYNC
Device needs to synchronize its sampling with measuring signals period to accurately determine its frequency. For that
purpose, input signal has to large enough to be distinguished from a noise.
If all phase voltages are smaller than this (noise limit) setting, instrument uses current inputs for synchronization. If also all
phase currents are smaller than Starting current for PF and PA setting, synchronization is not possible and frequency
displayed is 0.
The value for starting voltage should be set according to conditions in a system (level of noise, random voltage fluctuation
…)
36 Quality Analayser MC774
Harmonics calculation
Relative harmonic values can be different according to used base unit. According to requirements relative harmonics can be
calculated as:
percentage of RMS signal value (current, voltage) or
percentage of the fundamental (first harmonic).
Reactive power & energy calculation
Harmonic distortion can significantly influence reactive power and energy calculation. In absence of harmonic distortion
both described methods will offer the same result. In reality harmonics are always present. Therefore it is up to project
requirements, which method is applicable.
User can select between two different principles of reactive power and energy calculation:
Standard method:
With this method a reactive power and energy are calculated based on assumption that all power (energy), which is not
active, is reactive.
Q2 = S2 – P2
This means also that all higher harmonics (out of phase with base harmonic) will be measured as reactive power (energy).
Displacement method:
With this method, reactive power (energy) is calculated by multiplication of voltage samples and by 90° displaced current
samples.
Q = U × I|+90°
With this method, reactive power (energy) represents only true reactive component of apparent power (energy).
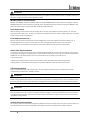
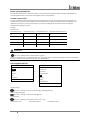
LCD navigation MC774
Main menu
Settings
Measurements
General
Settings
Date & Time
Resets
Connection
SD card
Communication
Info
LCD
Installation
Security
14.11.2012
16:53:36
Energy
Inputs/Outputs
Main menu
Average interval:
Main menu > Settings > General > Average interval
Language:
Main menu > Settings > General > Language
Currency:
Main menu > Settings > General > Currency
Temperture unit:
Main menu > Settings > General > Temperature unit
Date format:
Main menu > Settings > Date & Time > Date format
Date and time:
Main menu > Settings > Date & Time > Date / Time
Auto Summer/Winter time:
37 Quality Analayser MC774
Main menu > Settings > Date & Time > Automatic S/W time
Maximum demand calculation (MD mode):
Main menu > Settings > General > MD mode / MD time const.
MD time constant (min):
Main menu > Settings > General > MD time constant
Min/Max reset mode:
Main menu > Settings > General > Min/Max reset mode
Connection
CAUTION
Settings of connections shall reflect actual state otherwise measurements could not be valid.
Connection mode
When connection is selected, load connection and the supported measurements are defined.
Setting of current and voltage ratios
Before setting current and voltage ratios it is necessary to be familiar with the conditions in which device will be used. All
other measurements and calculations depend on these settings. Up to five decimal places can be set (up / down). To set
decimal point and prefix (up / down) position the cursor (left /right) to last (empty) place or the decimal point.
Aux CT transformer ratios can be set separately from phase CT ratios since Aux CT could differ from phase CTs.
Range of CT and VT ratios:
Settings range
VT primary
VT secondary
CT, Aux CT
primary
CT, Aux CT
secondary
Max value
1638,3 kV
13383 V
1638,3 kA
13383 A
Min value
0,1 V
1 mV
0,1 A
1 mA
Neutral line Primary/Secondary current (A)
Primary /Secondary current of neutral line current transformer.
Used voltage/current range (V/A)
Setting of the range is connected with all settings of alarms, analogue outputs and a display (calculation) of energy and
measurements recording, where 100% represents 500 V. In case of subsequent change of the range, alarms settings shall
be correspondingly changed, as well.
CAUTION
In case of subsequent change of those ranges shall be alarm and analogue output settings correspondingly changed as well.
Already recorded values will not be valid after change of used voltage and current range!
Frequency nominal value (Hz)
Nominal frequency range can be selected from a set of predefined values. A valid frequency measurement is within the
range of nominal frequency ±32 Hz.
This setting is used for alarms and recorders only.
Max. demand current for TDD (A)
Select maximum current (CT or fuse rating) at a point of instrument connection for proper TDD calculation. TDD is unlike
THD a measure of harmonics relative to fixed value of max. demand current. Therefore TDD is a demand independent
measure of current harmonics.
38 Quality Analayser MC774
Wrong connection warning
If all phase currents (active powers) do not have same sign (some are positive and some negative) and/or if phase voltages
and phase currents are mixed, the warning will be activated if this setting is set to YES. This warning is seen only on remote
display.
Energy flow direction
This setting allows manual change of energy flow direction (IMPORT to EXPORT or vice versa) in readings tab. It has no
influence on readings sent to communication or to memory.
CT connection
If this setting is set to REVERSED it has the same influence as if CT’s would be reversely connected. All power readings will
also change its sign.
This setting is useful to correct wrong CT connections.
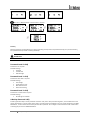
LCD navigation MC774
Main menu
Settings
Measurements
General
Settings
Date & Time
Resets
Connection
SD card
Communication
Info
LCD
Installation
Security
14.11.2012
16:53:36
Energy
Inputs/Outputs
Main menu
Connection mode:
Main menu > Settings > Connection > Connection mode
Setting of current and voltage ratios:
Main menu > Settings > Connection > VT primary/VT secondary/CT primary/CT secondary
Communication
Communication parameters (COM 1)
They define parameters that are important for the operation in RS485 network or connections with PC via RS232
communication. Factory settings of communication are #33\115200,n,8,2 (address 1 to 247\rate 2400 to 115200 b/s,
parity, data bits, stop bit).
Serial communication
Communication parameters (only for main communication port COM1), which are important for the operation in RS485
network or connections with PC via RS232 communication.
Factory settings for serial communication are:
MODBUS Address
#33
address range is 1 to 247
Comm. speed
115200
speed range is 2400 to 115200
Parity
none
data bits
8
stop bits
2
39 Quality Analayser MC774
PLEASE NOTE
Additional settings referring to secondary communication port COM2 via synchronisation module C (in MiQen software) can
be found in chapter RTC Synchronisation Module C, COM2.
Modbus table for measurements
Modbus table (MI400 or MT500 compatible): With this setting a MODBUS table for measurements and settings is defined.
MODBUS addresses for measurements and settings can be compatible with previous family of transducers (MI400) or with
more advanced family of transducers (MT500). See Modbus table definitions.
Push Data Format
With this setting a required data format for sending data to receiver using PUSH communication mode is set. Currently
supported format is XML-smart. For more information about PUSH communication mode and XML data format see chapter
Communication modes and appendix D.
Push Response Time (sec )
With this setting a maximum waiting time for acknowledgement of sent data in PUSH communication mode is set. If
acknowledgement from a client is not sent within this time, scheduled data will be resend in next push period.
* Setting comes in to consideration only if device is connected to MiSmart system via serial communication.
(Push) Time Synchronisation
In case where no other synchronisation source is available (GPS, IRIG-B, NTP), RTC can be synchronised by push data client.
This type of synchronisation strongly depends on communication infrastructure and it is not as accurate as required by IEC
61000-4-30. It has the lowest priority and cannot override RTC synchronised by any of other sources.
Time synchronization
* Which type of communication is used for synchronization of time for PUSH communication mode purpose.
* Setting comes in to consideration only if device is connected to MiSmart system via serial communication.
USB Communication
There is no special setting for USB communication. For more detailed information how to handle device with USB
communication use Help section in MiQen software.
PLEASE NOTE
Device supports only a single communication input (USB or Ethernet) at a time when using primary communication port
COM1. Priority has USB communication. If communication using ethernet is in progress, do not connect to USB since it will
terminate ethernet connection. When USB cable is unplugged from the device ethernet communication is again available.
PLEASE NOTE
When device is connected to a PC through USB communication for the first time, a user is prompted to install a driver. The
driver is provided on the CD, enclosed in the original shipment package, or it can be downloaded from the Iskra Sistemi d.d.
web page www.iskrasistemi.si. With this driver installed, USB is redirected to a serial port, which should be selected when
using MiQen setting software.
Service USB Communication
Has no setting. Device is automatically recognized in Windows environment if device driver has been correctly installed. For
more detailed information how to handle device with USB communication use Help section in MiQen software.
40 Quality Analayser MC774
PLEASE NOTE
Service USB is intended only for parameterisation of the meter and is not galvanic separated. Advantage is that in this case
meter does not need a power supply to communicate. Communication via service port is time limited.
PLEASE NOTE
Service USB communication is not galvanic separated!
When using service USB communication, power supply and measuring voltages need to be disconnected!
Enthernet communication
Ethernet communication is used for connection of device to the Ethernet network for remote operation. Each device has its
own MAC address that at some cases needs to be provided and is printed on the label on the device.
Device Address
Device Address: Device address is important when user is trying to connect to device via MiQen software. Usable range of
addresses is from 1 to 247. Default address number is 33. (Not important when Ethernet communication is used.)
IP Address
Communication interface should have a unique IP address in the Ethernet network. Two modes for assigning IP are
possible:
Fixed IP address:
In most installations a fixed IP address is required. A system provider usually defines IP addresses. An IP address should be
within a valid IP range, unique for your network and in the same subnetwork as your PC.
DHCP:
Automatic (dynamic) method of assigning IP addressed (DHCP) is used in most networks. If you are not sure if DHPC is used
in your network, check it at your system provider.
IP Hostname
It is the nickname that is given to a device. Hostnames may be simple names consisting of a single word or phase or they
may be structured. The setting is used in automatic (DHCP) mode only.
Local port
When using Ethernet communication device has opened two local ports.
-Fixed port number 502, which is a standard MODBUS port. Device allows multiple connections to this port.
-User defined port. Any port number is allowed except reserved ports (Table 7). Only a single connection is
allowed to this port. When this port is used all other connections (including connection to port 502) are disabled.
This is a terminal type of connection.
Terminal type of connection is used when due to a performed function other connections are not allowed. This is the case
when firmware update is performed. In other cases it is advised to use port 502.
When port 502 is used a remote application(s) can access device regardless the setting for Local Port in a device. This
setting is applicable only when terminal access is required.
Reserved TCP Port numbers
Important port numbers
41 Quality Analayser MC774
Function
1 – 1024, 9999, 30718, 33333
Reserved numbers!!!
502
Standard MODBUS port – fixed
33333
UDP port used for Device Discovery Service
Multiple connections to a device are possible when port 502 (special MODBUS port) is used
Port 502
Is standardized port to communicate with the device via MODBUS/TCP communication protocol and is fixed.
Communication via this port allows multiple connections to the device. Communication over this port does not block any
other traffic.
Port 33333
This UDP port is reserved for Discovery Service, a service run by MiQen software, to discover devices connected in to local
Ethernet communication network.
Other available Ports
Other, allowed TCP ports, are acting as terminal port and when connected to it, it blocks all other connections until it is
released.
Priority, when connected to this port, has PUSH functionality of the device.
When any other allowed port is used only a single connection is possible
42 Quality Analayser MC774
Subnet Mask
It is used to determine what subnet an IP address belongs to.
Gateway Address
It is a gateway that connects separate network segments (LAN, WAN or internet).
NTP Server
IP address of a NTP server used for time synchronisation of the device.
NTP can usually maintain time to within tens of milliseconds over the public Internet, but the accuracy depends on
infrastructure properties - asymmetry in outgoing and incoming communication delay affects systematic bias.
PLEASE NOTE
It is recommended that dedicated network rather than public network is used for synchronisation purposes.
Factory settings of Ethernet communication are:
IP Address
DHCP (automatically)
TCP Port (Terminal Port)
10001
Subnet Mask
255.255.255.0
Push communication settings
When PUSH communication mode is used, data can be sent (pushed) to two different servers. Within this setting, all
parameters relevant to used servers should be set, as well as data type for sent data, time synchronization source and
server response time.
For more information about PUSH communication mode and XML Data format see chapter Communication modes.
TCP Link 1 and TCP Link 2 (Push data clients)
IP address
IP address of the server collecting data from devices.
IP port
IP port of the serve collecting data from devices.
Data Format
With this setting a required data format for sending data to receiver using PUSH communication mode is set. Currently
supported format is XML-smart. For more information about PUSH communication mode and XML data format see
Communication modes on page and appendix D.
Response Time (sec)
With this setting a maximum waiting time for acknowledgement of sent data in PUSH communication mode is set. If
acknowledgement from a client is not sent within this time, scheduled data will be resend in next push period.
For devices connected in communication network with slow communication speed, values over 10 seconds needs to be
selected.
If value lower than 10 second is selected, historical data from recorders are pushed immediately one after another. If value
is higher than 10 seconds, automatic time delay length of 10% of set value is integrated between the sent packets.
MAC Address
Read only information about device MAC address.
43 Quality Analayser MC774
Firmware version
Read only information about communication module firmware version.
Sending data
When PUSH communication mode is used, data can be send (pushed) to two different servers. Within this setting, all
parameters relevant to used servers should be set, as well as data type for sent data, time synchronization source and
server response time.
For more information about PUSH communication mode and XML data format and appendix D .
Communication modes
MC774 Quality Analyser supports two communication modes to suit all demands about connectivity and flexibility.
Standard POLL communication mode is used for most user interaction purposes in combination with monitoring and setting
software MiQen, SCADA systems and other MODBUS oriented data acquisition software.
PUSH communication mode is used for sending unsolicited data to predefined links for storing data do various data bases.
POLL communication mode
This is most commonly used communication mode. It services data-on-demand and is therefore suitable for direct
connection of setting and / or supervising software to a single device or for a network connection of multiple devices, which
requires setting up an appropriate communication infrastructure.
Data is sent from device when it is asked by external software according to MODBUS RTU or MODBUS TCP protocol.
This type of communication is normally used for a real-time on-demand measurement collection for control purposes.
To set up PULL communication mode, only basic communication settings are required according to communication type
(serial, USB, ETHERNET).
PUSH communication mode
PUSH communication mode is mainly used for Iskra Sistemi MiSmart system for remote monitoring, analysis and reporting.
The most extensive benefits when using MC774 Quality Analyser are achieved when device is used as a part of an energy
monitoring system comprising of strategically positioned meters connected to MiSMART software solution. This three-tier
middleware software represents a perfect tool for utility companies, energy suppliers and other parties present on both
ends of supply-demand chain.
MiSMART data collector with “push” communication system allows automatic records of all predefined measuring
parameters. They are stored in
MiSMART database, while leaving a copy of same parameters stored locally in memory of each device as a backup copy.
Database records in XML format can be searched and viewed in tabelaric and graphical form using
MiSMART client or used by third-party application software.
Database records can involve numerous parameters of three-phase system, power quality parameters, physical parameters
(temp., pressure, wind speed…) as well as alarms and event logs.
44 Quality Analayser MC774
MiSMART client window
Explanation
When in this communication mode, device (master) is sending values of predefined quantities in predefined time intervals
to two independent servers (data collectors - slave), who collect data into data base for further analysis.
This mode of communication is very useful for a periodic monitoring of readings in systems where real-time data are not
required, but on the other side, reliability for collecting data is essential (e.g. for billing purposes, post processing and
issuing trend warnings).
On the other hand, when operating in this mode, the device will send information about alarms immediately as they occur
(real time alarm monitoring).
This type of communication also optimizes communication traffic.
Protocol and data format
Device uses XML format to send the data, which is very common and easy to use also for third party software solutions.
Protocol used for data transmission is TCP/IP.
All sent readings are time-stamped for accurate reconstruction of received data (if communication is lost and data is sent
afterwards). Therefore time synchronization of client and server is essential. For that purpose, server sends synchronization
data packet to the device within every response to received data. If time difference is higher than +/- 2s, device resets its
internal clock. For more information about used XML format see Appendix D.
CAUTION
Time synchronisation with push system has the lowest priority. If any of other time synchronisation sources is available
(GPS, NTP, IRIG-B) they have priority to synchronise RTC.
By using time synchronisation with push functionality device does not meet requirements for Class A
measuring device and can be used only as a Class S measuring device.
Data transmission
Every transmission from master side (device) must be acknowledged from client side (server) to verify successful data
transmission. In case client fails to receive acknowledgment after predefined response time (see Ethernet communication
on page Napaka! Zaznamek ni definiran.) it will retry to send it in next time interval. This repeating of sending data will last
until master responses to sent data. After that, client will send all available data from the moment it lost response from the
master.
It is possible for PULL and PUSH communication mode to be active at the same time. Both communication modes can be
handled at the same time if PULL communication is made over COM2 or over Ethernet module through port reserved for
45 Quality Analayser MC774
communication over MODBUS communication protocol (port 502 see chapter Ethernet communication on page Napaka!
Zaznamek ni definiran.).
Supported quantities and settings
Sending data in PUSH communication mode is closely related with storing measurements in a recorder. Device can sent to
the selected server(s) a block of measure quantities that are stored in memory. For each memory division (recorders A to D,
alarms recorder and quality reports with details recorder) separate settings can be made.
Step 1
With MiQen software set proper PUSH Communication settings where time synchronization source, response time, data
format and receiving server’s parameters are defined.
Step 2
Define data (quantities) for recorder / transmission. For each part of the recorder select to which of the server(s) data will
data be sent. This setting can be made for Alarms, Recorder A to D, Quality reports and details.
More information about PUSH data transfer and MiSmart system for collecting of this data can be found on ISKRA web page
or in documentation about MiSmart system.
LCD navigation MC774
Main menu
Settings
Measurements
General
Settings
Date & Time
Resets
Connection
SD card
Communication
Info
LCD
Installation
Security
14.11.2012
16:53:36
Energy
Inputs/Outputs
Main menu
Communication parameters (COM 1):
Main menu > Settings > Communication
Serial communication:
Main menu > Settings > Communication
Enthernet communication:
Main menu > Settings > Communication > (all settings are not supported on keypad)
Display
Display settings: Contrast/Black light intersity
A combination of setting of the contrast and back light defines visibility and legibility of a display. Display settings shall be
defined in compliance with the conditions in which it will be monitored. Economizing mode switches off back light
according to the set time of inactivity.
Saving mode (min)
Defines the time in minutes for the instrument to get into energy saving mode (backlight off). Enter value 0 if you don’t
want to use energy saving mode.
46 Quality Analayser MC774
Demo cycling period (sec)
For demonstration purposes it is useful for device to automatically switch between different displays of measurements.
This setting defines time in seconds for each displayed screen of measurements.
Custom screen 1/2/3
For easier and faster survey of measurements that are important for the user, three settings of customized screens are
available. Each customized screen displays three measurements. When setting customized screens the designations are
displayed in shorter form, with up to 4 characters. For survey of all designations see chapter Survey of supported
measurements regarding connectio.
Example:
Desired result:
Customized screen 1
Customized screen 2
Customized screen 3
Combined customized screen 4
U1
ITOT
1-3_RMS
U1
UP-P_avg
INM
f
UP-P_avg
UUNBALANCE
IAVG
THD-I1
UUNBALANCE
-
-
-
ITOT
-
-
-
INM
PLEASE NOTE
Customized screens defined here are selected in menu.
Main menu > Measurements > Present values > Custom
th
Setting can be made only for 3 customized screens. 4 customized screen is showing 5 parameters, three from Customized
screen 1 and first two from Customized screen 2. See example above.
LCD navigation MC774
Main menu
Settings
Measurements
General
Settings
Date & Time
Resets
Connection
SD card
Communication
Info
LCD
Installation
Security
14.11.2012
16:53:36
Energy
Inputs/Outputs
Main menu
Display settings:
Main menu > Settings > LCD > Contrast / Back light / Back light time off
Demo cycling period (sec):
Main menu > Settings > LCD > Demo cycling period
Custom screen:
Main menu > Settings > LCD > Custom screen 1 / 2 / 3 / (4)
Customized screen 1
Customized screen 2
47 Quality Analayser MC774
Customized screen 3
Main menu > Measurements > Present values > Custom
Security
Settings parameters are devided into four groups regarding security level: PL0 >password level 0), PL1 >password level 1),
PL2 >password level 2) and BP >a backup password).
PLEASE NOTE
A serial number of device is stated on the label and is also accessible with MiQen software.
Password-Level 0 >PL0)
Password is not required.
Available settings:
language
contrast and
LCD back light.
Password-Level 1 >PL1)
Password for first level is required.
Available settings:
RTC settings
Energy meters reset
Max. Demand reset
Active tariff setting
Password-Level 2 >PL2)
Password for second level is required.
Available settings:
All settings are available
A Backup Password->BP)
A backup password >BP) is used if passwords at levels 1 >PL1) and 2 >PL2) have been forgotten, and it is different for each
device >depending on a serial number of the device). The BP password is available in the user support department in ISKRA
SISTEMI d.d., and is entered instead of the password PL1 or/and PL2. Do not forget to state the device serial number when
contacting the personnel in ISKRA SISTEMI d.d.
48 Quality Analayser MC774
Password locks time >min)
Defines the time in minutes for the instrument to activate password protection. Enter value 0 if you want to use manual
password activation.
Password setting
A password consists of four letters taken from the British alphabet from A to Z. When setting a password, only the letter
being set is visible while others are hidden.
A password of the first >PL1) and the second >PL2) level is entered, and time of automatic activation is set.
Password modification
A password is optionally modified; however, only that password can be modified to which the access is unlocked at the
moment.
Password disabling
A password is disabled by setting the "AAAA" password.
PLEASE NOTE
A factory set password is "AAAA" at both access levels >L1 and L2). This password does not limit access.
Password and language
Language change is possible without password input. When language is changed from or to Russian, character
transformation has to be taken in to account. Character transformation table >English or Russian alphabet) is stated below.
English
Russian
A B C D E
А Б В Г
F G
Д Е Ж
H I
З
J
K L
M
И Й К Л М
LCD navigation MC774
Main menu
Settings
Measurements
General
Settings
Date & Time
Resets
Connection
SD card
Communication
Info
LCD
Installation
Security
14.11.2012
16:53:36
Energy
Inputs/Outputs
Main menu
The access to the device serial number via a keyboard.
Example:
Main menu > Info
OK
Password Level 1:
49 Quality Analayser MC774
N O
P
Q
R S T U
V W
X Y
Z
Н
П P
С Т У Ф
Х Ц
Ч Ш
Щ
O
Main menu > Settings > Security > Password level 1
Password Level 2:
Main menu > Settings > Security > Password level 2
Password locks time >min):
Main menu > Settings > Security > Password lock time
Password setting:
Main menu > Settings > Security > Password level 1 / Password level 2 / Password lock time
Password modification:
Main menu > Settings > Security > Password level 1 / Password level 2
Password disabling:
Main menu > Settings > Security > Password level 1 / Password level 2 > "AAAA" O
Energy
WARNING!
Before modification, all energy counters should be read or if energy values are stored in recorders, recorder should be read
with MiQen software to assure data consistency for the past.
After modification of energy parameters, the energy meters (counters) should be reset. All recorded measurements from
this point back might have wrong values so they should not be transferred to any system for data acquisition and analysis.
Data stored before modification should be used for this purpose.
Active Tariff
When active tariff is set, one of the tariffs is defined as active; switching between tariffs is done either with a tariff clock or
a tariff input. For the operation of the tariff clock other parameters of the tariff clock that are accessible only via
communication must be set correctly.
Common Energy Counter Resolution
Common energy exponent defines minimal energy that can be displayed on the energy counter. On the basis of this and a
counter divider, a basic calculation prefix for energy is defined (−3 is 10−3Wh = mWh, 4 is 104Wh = 10 kWh). A common
energy exponent also influences in setting a number of impulses for energy of pulse output or alarm output functioning as
an energy meter.
Define common energy exponent as recommended in table below, where counter divider is at default value 10. Values of
primary voltage and current determine proper Common energy exponent.
Current
1A
5A
50 A
100 A
1000 A
110 V
100 mWh
1 Wh
10 Wh
10 Wh
100 Wh
230 V
1 Wh
1 Wh
10 Wh
100 Wh
1 kWh
1000 V
1 Wh
10 Wh
100 Wh
1 kWh
10 kWh
30 kV
100 Wh
100 Wh
1 kWh
10 kWh
10 kWh *
Voltage
* − Individual counter resolution should be at least 100.
Common Energy Cost Exponent
Setting enables resolving the cost display. On the basis of this and a counter divider constant, a basic calculation prefix for
energy cost is defined.
Counter divider
The counter divider additionally defines precision of a certain counter, according to settings of common energy exponent.
An example for 12.345kWh of consumed active energy:
50 Quality Analayser MC774
Common energy exponent
0
2
2
Counter divider
1
1
100
12.3 kWh
0.01 MWh
Example of result, displayed 12.345 kWh
Common Tariff Price Exponent
Exponent and price represent energy price (active, reactive, common) in a tariff. The tariff price exponent is used for
recording the price without decimal places. For example, to set a price for tariff 1 to 0,1567 €/kWh, the number in Price for
energy in tariff 1 field should be 1567 and Common tariff price exponent should be -4 (1567 x 1E-4 = 0,1567)
An example for 12.345kWh of consumed active energy in the first tariff (price 0,1567 €/kWh):
Common Energy Counter Resolution
100 Wh
100 Wh
Individual Energy Counter Resolution 1
1
100
Common Energy Cost Exponent
−3
−2
0
Common Tariff Price Exponent
−4
−4
−4
Price for energy in Tariff 1
1567
1567
1567
Unit
EUR
EUR
EUR
12.345 kWh
12.3 kWh
0.01 MWh
1,934 EUR
1.93 EUR
1 EUR
Example of result, displayed
1 Wh
1 kWh Price in Tariff (1,2,3,4)
The price for 1kWh active energy in selected tariff. The entered value is multiplied with tariff price exponent: Tariff price =
Price * 10 ^ Exponent.
1 kvarh Price in Tariff (1,2,3,4)
The price for 1 kvarh reactive energy in selected tariff. The entered value is multiplied with tariff price exponent: Tariff price
* 10 ^ Exponent.
1 kVAh Price in Tariff (1,2,3,4)
The price for 1 kvarh reactive energy in selected tariff. The entered value is multiplied with tariff price exponent: Tariff price
* 10 ^ Exponent.
LED Energy Counter
Set one of four different Energy counters, witch are connected to LED.
LED Number of pulses
Number of pulses per energy unit for LED.
LED Pulse Length (ms)
Pulse length for LED in milliseconds.
51 Quality Analayser MC774
Measured Energy
For each of eight (8) counters different measured quantities can be selected. User can select from a range of predefined
options referring to measured total energy or energy on single phase. Or can even select its own option by selecting
appropriate quantity, quadrant, absolute or inverse function.
To energy counter also pulse / digital input can be attached. In this case Energy counter counts pulses from an outside
source (water, gas, energy... meter).
Individual counter Resolution
The individual counter resolution additionally defines precision of a certain counter, according to settings of common
energy counter resolution.
Tariff Selector
Defines tariffs where counter is active.
Tariff Clock
Basic characteristics of a program tariff clock:
4 tariffs (T1 to T4)
Up to 4 time spots in each Day program for tariff switching
Whichever combination of valid days in a week or holidays for each program
Combining of day groups (use of over 4 time spots for certain days in a week)
Separate settings for 4 seasons a year
Up to 20 settable dates for holidays
Day program sets up to 4 time spots (rules) for each day group in a season for tariff switching. A date of real time clock
defines an active period. An individual period is active from the period starting date to the first next date of the beginning
of other periods.
The order of seasons and starting dates is not important, except when two dates are equal. In that case the season with a
higher successive number has priority, while the season with a lower number will never be active.
If no starting date of a season is active, the active period is 1.
If the present date is before the first starting date of any period, the period is active with the last starting date.
Example of settings:
Season
Season start day
Season 1:
15.02
Season 2:
30.10
Season 3:
-
Season 4:
01.06
Date
Active season
01.01. - 14.02.
2 (last in the year)
15.02. - 31.05.
1
01.06. - 29.10.
4
30.10. - 31.12.
2
52 Quality Analayser MC774
Days in a week and selected dates for holidays define time spots for each daily group in a period for tariff switching. Dates
for holidays have priority over days in a week.
When the real time clock date is equal to one of a date of holidays, tariff is switched to holiday, within a period of active
daily group with a selected holiday.
If there is no date of holidays that is equal to the real time clock date, all daily groups with the selected current day in a
week are active.
Several daily groups can be active simultaneously, which enables more than 4 time spots in one day (combine of day
programs). If the time spot is not set for a certain day, tariff T1 is chosen.
Time of a real time clock defines an active tariff regarding currently active day program. A selected tariff T1 to T4 of
individual time spot is active from the time of the time spot to the first next time of the remaining time spots.
The order of time spots is not important, except when two times are equal. In that case the time with a higher successive
number has priority (if several time spots are active, times of higher time spots have higher successive numbers), while the
time spot with a lower number will never be active.
If current time is before the first time of any time spot of active spots, the time spot with the last time is chosen.
If no time spot of active programs is valid, tariff T1 is chosen.
Time selected tariff T1 to T4 or fixed selected tariff (via communication) defines activity of an energy counter.
Holidays/Holiday date 1-20
Year days (holidays) with the special cost management rules.
LCD navigation MC774
Main menu
Settings
Measurements
General
Settings
Date & Time
Resets
Connection
SD card
Communication
Info
LCD
Installation
14.11.2012
Security
16:53:36
Energy
Inputs/Outputs
Main menu
Active Tariff:
Main menu > Settings > Energy > Active tariff
Common Energy Counter Resolution:
Main menu > Settings > Energy > Common en. exponent
LED Energy Counter:
Main menu Settings Energy LED Counter
Led Number of pulses:
Main menu Settings Energy LED No. of pulses
LED Pulse Length (ms):
Main menu Settings Energy LED Pulse lenght
Tariff Clock:
53 Quality Analayser MC774
Main menu Settings Energy Tariff Clock
Example of display for selected Active tariff:
Main menu > Info OK
or
or
Inputs and outputs
space
Introduction
I/O functionality is a powerful tool of measuring instrument Using various I/O modules device can be used not only for
monitoring main electrical quantities but also for monitoring process quantities (temp., pressure, wind speed…) and for
various control purposes.
Welcome
Device can be equipped with different I/O modules with different functionality. For its technical specifications see chapter
Technical data.
Inputs and outputs: LCD navigation MC774
Main menu
Settings
Measurements
General
Settings
Date & Time
Resets
Connection
SD card
Communication
Info
LCD
Installation
Security
14.11.2012
16:53:36
Energy
Inputs/Outputs
Main menu
I/O Modules
The following I/O modules are available:
MODULE TYPE SLOT NUMBER I/O /SLOT
AO
1,2
2
AI
1,2
2
AL
1,2
2
PO
1,2
2
PI
1,2
2
TI
1,2
2
BI
1,2
1
WO
1,2
1+1xalarm output
PLEASE NOTE
All modules have double input or output functionality, except Bistable alarm output and Watchdog output module. All
modules with a double input or output are in MiQen presented as two separate modules.
54 Quality Analayser MC774
An alarm output and a pulse output can also be selected with the keypad and display. When selecting settings of energy
and quadrants for a certain counter, only preset selection is possible, while more demanding settings are accessible via
communication. For other modules, information on a built-in module is available via LCD.
Analogue output module
Analogue output module is useful for control and measurement visualisation purposes. It can be connected to analogue
meters, PLC controllers… It has defined output range 20mA DC. Quantity and shape (up to 6 break points) of an analogue
output can be assigned by MiQen software.
Output parameter
Output parameter can be any measured value that is required for monitoring, recording, visualisation or control. Value is
chosen from a drop-down menu.
Output signal
Output signal can be adjusted to meet all required purposes.
Shape of output signal (linear, Quadratic)
Number of break points for zoom function (up to 6)
Start and End output value
For better visualisation of set output signal parameters, graphical presentation of transfer function is displayed.
Analogue output
Each of up to four analog outputs is fully programmable and can be set to any of 6 full-scale ranges. Within each of those 6
ranges, other required output ranges can be set. For example,
4 … 20 mA range can be set when ± 20 mA full-scale range is selected:
Output parameter
Set the measured parameter to be transformed onto the analog output.
Output range
Defines analog output full-scale ranges:
DC current output
DC voltage output
-1 … 0 … 1 mA
-1 … 0 … 1 V
-5 … 0 … 5 mA
-10 ... 0 ... 10 mA
-10 … 0 … 10 V
-20 ... 0 ... 20 mA
Output range
55 Quality Analayser MC774
Defines the shape and up to 5 break points of an analog output. For intrinsic-error for analog outputs with bent or linear
zoom characteristic multiply accuracy class with correction factor (c). Correction factor c (the highest value applies):
Example of settings with linear and bent characteristic:
Average interval for analog output
Defines the average interval for measurements on the analog output. Available settings are from 1 period (0.02 sec by 50
Hz) up to 128 periods (2.56 sec by 50 Hz).
Analogue input module
Three types of analogue inputs are suitable for acquisition of low voltage DC signals from different sensors. According to
application requirements it is possible to order current, voltage or resistance (temperature) analogue input. They all use the
same output terminals.
MiQen software allows setting an appropriate calculation factor, exponent and required unit for representation of primary
measured value (temperature, pressure, flux…)
Signals from Analogue input can also be stored in built-in memory of a device. They can also be included in alarm function
(see chapter Alarms)
DC current range:
Range setting allows bipolar ±20 mA max. input value
DC voltage range:
Range setting allows bipolar ±10 V max. input value
Resistance / temperature range:
Range setting allows 2000Ω or 200 Ω max. input value
It is also possible to choose temperature sensor (PT100 or PT1000) with direct translation into temperature (-200°C to
+850°C). Since only two-wire connection is possible it is recommended that wire resistance is also set, when long leads are
used.
Alarm output module
Alarm output module is a relay switch. Its main purpose is to be used as an alarm output, but can also be used as a pulse or
general purpose digital output.
PLEASE NOTE!
A parallel RC filter with time constant of at least 250 μs (R·C ≥ 250 μs) should be used in case of a sensitive pulse counter.
RC filter attenuates relay transient signals.
For description of output functionality see chapter Functions of Digital output modules.
General purpose digital output
This functionality allows user to enable / disable digital output by software settings for example from SCADA system.
56 Quality Analayser MC774
For this operation MODBUS registers need to be accessed by means of software. By modifying appropriate MODBUS
registers (from SCADA) digital output can be set or reset.
For corresponding MODBUS registers and their values see table below.
MODBUS registers and their values for remotely driving digital outputs:
MODULE NUMBER
MODBUS REGISTER
REGISTER VALUE
Module 1 (if installed)
40722
3 - ON
4 - OFF
Module 2 (if installed)
40725
3 - ON
4 - OFF
Module 3 (if installed)
40728
3 - ON
4 - OFF
Module 4 (if installed)
40731
3 - ON
4 - OFF
Pulse output module
Pulse output is a solid state, opto-coupler open collector switch. Its main purpose is pulse output for selected energy
counter, but can also be used as an alarm or general purpose digital output.
Calculation of recommended pulse parameters
Number of pulses per energy unit should be in certain limits according to expected power. Otherwise the measurement
from pulse output can be incorrect. Settings of current and voltage transformer ratios can help in estimation of expected
power.
Principle described below for pulse setting satisfies EN 62053−31: 2001 standards pulse specifications:
e … exponent (k, M, G)
p … pulses
Examples:
Expected power
Pulse output settings
150 − 1500 kW
1 p / 1kWh
1,5 − 15 MW
100 p / 1MWh
15 − 150 MW
10 p / 1MWh
150 − 1500 MW
1 p / 1MWh
Digital input module
Module has no settings. General purpose is to collect digital signals from various devices, such as intrusion detection relay,
different digital signals in transformer station, industry ... It is available in three different hardware versions.
It can also be included in alarm function (see chapter Alarms).
Pulse input module
Module has no settings. It is general purpose pulse counter from external meters (water, gas, heat …). Its value can be
assigned to any of four energy counters. See chapter Energy. It can also be used as digital input and included in alarm
function to monitor signals from different sensors (see chapter Alarms).
Pulse input module has only one hardware configuration (5…48 V DC).
Tariff input module
Module has no setting. It operates by setting active tariff at a tariff input (see chapter Tariff clock). The device can have
maximal one module with 2 tariff inputs only. With the combination of 2 tariff inputs maximal 4 tariffs can be selected.
Active tariff selection table:
Active tariff
Signal presence on tariff input
Input T1
Input T2
Tariff 1
0
0
Tariff 2
1
0
Tariff 3
0
1
Tariff 4
1
1
57 Quality Analayser MC774
Bistable alarm output module
A Bistable alarm module is a relay type. The only difference between relay alarm output and bistable relay alarm output is
that it keeps the condition at output in case of device power failure.
Alarm Output
If Digital output is defined as an Alarm output, its activity (trigger) is connected to Alarm groups. Multiple alarm groups can
be attached to it and different signal shapes can be defined. For more information on how to define alarm groups, see
chapter Alarms.
Main menu > Settings > Inputs/Outputs > I/O 1 / 2 / 3 / 4 > (Settings of alarm output)
Two parameters should be defined for each alarm output:
The source for assigned alarm (alarm group 1, 2 or both)
Type of output signal when alarm is detected.
Output signal types
Normal − A relay is closed as long as condition for the alarm is fulfilled.
Normal inverse − A relay is open as long as condition for the alarm is fulfilled. After that relay goes to closed state
Latched − A relay is closed when condition for the alarm is fulfilled, and remains closed until it is manually reset.
Latched inverse − A relay is open when condition for the alarm is fulfilled, and remains open until it is manually reset.
Pulsed − an impulse of the user set length is activated always when condition for the alarm is fulfilled.
Pulsed inversed – Normally relay is activated. An impulse of the user set length deactivates it always when condition for the
alarm is fulfilled.
Always switched on / off (permanent) – A relay is permanently switched on or off irrespective of the condition for the alarm
(general purpose digital output functionality).
Check an example in chapter Alarms for graphical demonstration of alarm functionality.
Status (Watchdog) and Relay output module
Watchdog and relay module is a combination of two functionalities. One output is used for Watchdog functionality, the
other acts as a Relay output module.
The purpose of a Watchdog relay is to detect potential malfunction of device or auxiliary power supply failure. This module
can be set for normal operation (relay in close position) or for test purposes to open position (manual activation). After test
module should be set back to normal operation.
For description of output functionality see chapter Functions of Digital output modules below.
Fast analog output module
Functionality of fast analog output module is the same as with standard analog output module.
The only difference is its faster response time (≤ 50 ms), and consequential higher ripple. For a proper behavior of fast
analog output module (fast response), average interval shall be set to minimum (1 periode).
2nd Communication module (COM2)
Module is preset for RS485 communication on I/O 4 terminals.
Module settings define parameters that are important for the operation in RS485 network. Factory settings of
communication are #33\115200,n,8,2 (address 1 to 247\rate 2400 to 115200 b/s, parity, data bits, stop bit). By default,
addresses of COM1 and COM2 are the same (#33). In this case, change of COM1 address sets COM2 to the same address.
When COM1 and COM2 addresses are not equal, change of COM1 address has no influence on COM2 address. Change of
COM2 address has no influence on COM1 address. (U)MT5xx can be connected to the same network using COM1 or COM2
(if available).
Auxiliary I/O Modules A & B
MC774 Quality Analyser is equipped with two auxiliary I/O slots. The biggest difference in functionality between main and
auxiliary I/O modules is in response time. Digital inputs and outputs do not have as fast response time as with main I/O
modules.
The following auxiliary I/O modules are available:
List of available auxiliary I/O modules
Module type
Number of modules per slot
Digital output (DO)
8
58 Quality Analayser MC774
Digital input (DI)
8
State of the built in input and/or output module can be monitored also via LEDs on the front panel of the device.
Digital input module
Module has no settings. Their purpose is to collect digital signals from various devices, such as (intrusion detection relay,
different digital signals in transformer station, industry …).
According to input voltage range it is available in three different hardware versions. For technical specifications see chapter
Technical data.
Digital input can also trigger an alarm (see chapter Alarms).
State of digital inputs can also be monitored for control purposes with SCADA system by reading appropriate MODBUS
registers.
Relay output module
Relay output module is a relay switch. Its main purpose is to be used as an alarm output.
For the difference to Relay output module of main I/O module 1 or 2, also a single alarm can be used to trigger each output
(when using Relay output module of main I/O module 1 or 2 only a single or a combination of alarm groups can be used as a
trigger for each output).
For additional information regarding alarms, see chapter Alarms..
RTC Synchronization module C
In order use Module C for synchronisation purposes it has to be defined as a synchronisation source. See chapter Real time
synchronisation source.
CAUTION
RTC synchronisation is essential part of Class A instrument. If no proper RTC synchronisation is provided device operates as
Class S instrument.
Quality Analyzer MC774 supports three types of RTC synchronization:
GPS time synchronisation (via Synchronisation module C)
IRIG-B time synchronisation (via Synchronisation module C)
NTP time synchronisation (via Ethernet module)
Instructions regarding connection of Synchronisation module C can be found in chapter Connection of Synchronisation
module C.
PLEASE NOTE
Serial communication built in Synchronisation module C can, under certain conditions, be used as an independent
secondary communication.
GPS time synchronization
For proper GPS synchronisation two signals are required.
1pps with TTL voltage level and
NMEA 0183 coded serial RS232 communication sentence
GPS interface is designed as 5 pole plugable terminal (+5V for receiver supply, 1pps input and standard RS232
communication interface).
Proposed GPS receiver is GARMIN GPS18x
PLEASE NOTE
When connecting GPS to serial RS232 communication interface please take into consideration required communication
parameters. For proposed GPS receiver default communication speed is 4800 b/s.
IRIG time code B (IRIG-B)
Unmodulated (DC 5V level shift) and modulated (1 kHz) serial coded format with support for 1pps, day of year, current year
and straight seconds of day as described in standard IRIG-200-04.
Supported serial time code formats are IRIG-B007 and IRIG-B127. For technical specifications see chapter Technical data.
59 Quality Analayser MC774
Serial communication (COM2)
If device uses RTC synchronisation over NTP server (via Ethernet module), IRIG-B or only 1PPS without date synchronisation,
serial communication port of RTC Synchronisation module C is free to be used as a secondary communication port COM2.
Either RS232 or RS485 communication can be used. COM1 and COM2 are completely independent and can be used for the
same purpose and at the same time.
Module settings define parameters, which are important for the operation in RS485 network or connections with PC via
RS232 communication.
Factory settings for serial communication COM2 are:
MODBUS Address #33
address range is 1 to 247
Comm. speed
4800
Parity
none
data bits
8
stop bits
2
speed range is 2400 to 115200
PLEASE NOTE
By default, addresses of COM1 and COM2 are the same (#33). In this case, change of COM1 address sets COM2 to the same
address. When COM1 and COM2 addresses are not equal, change of COM1 address has no influence on COM2 address and
change of COM2 address has no influence on COM1 address.
Settings of RTC Synchronisation module C
In order to enable synchronisation with GPS or IRIG time code a proper Real Time synchronisation source should be defined
as described in a chapter General settings/Real Time synchronisation source.
Alarms
Alarms are used for alarming exceeded set values of measured quantities and quantities from different input modules.
Alarms can also trigger different actions according to their settings:
Visual (alarms cause special alarm LED to it)
When alarm is switched on a red LED on the device front side is blinking. See figure below.
Sound (alarms can cause sound signalisation)
When alarm is switched on, an audible alarm is given by the device (a beep). It cen be switched off by pressing
any key on the front plate (see figure below).
Alarm ouput (alarms can switch digital outputs on main and aux. I/O modules)
According to the alarm signal shape the output relay will behave as shown on figure below.
Alarm condition can be set for any measured quantity, also for quantities measured on Analogue inputs or signals from
Digital / Pulse input.
CAUTION
New values of alarms are calculated in percentage. At every modification of connection settings crosscheck if set alarm
values are correct.
60 Quality Analayser MC774
Alarms PUSH functionality
When PUSH communication mode is active, all alarms can be sent (pushed) to a predefined location inside local or wide
area network. Settings allow choosing an appropriate destination for alarm data to be sent.
Alarm data is sent to the server immediately as alarm(s) occur. If they cannot be sent immediately due to communication
problems, they are sent at next alarm event or data sending interval (whichever occurs first).
Alarms and time stamps of occurrence are also stored into internal memory.
For more information about PUSH functionality and XML data format see chapter PUSH Communication mode
Push data to link
When PUSH communication mode is used a data receiving server (client) link should be defined. Data can be sent
(according to a type of used communication interface) to COM1, TCP link 1 or TCP link 2. For definition of PUSH links see
PUSH communication settings. Alarms are unlike recorded values sent to chosen link immediately after occurrence.
Therefore settings for pushing period and time delay are not applicable.
Pushing period
Defines a time period for pushing data to clients. Readings, events and PQ reports, which are recorded in internal memory,
can be also periodically (user defined) sent to a client. For more information about Push system see Users manual.
Pushing time delay
Defines if data should be send immediately after pushing period condition achieved, or a time delay is used for client
discharge.
Alarms group settings
Measuring instrument supports recording and storing of 32 alarms that are divided into 4 groups of 8 alarms. Each group of
alarms has some common settings applicable for all alarms within this group.
Alarm settings
Measuring centre supports alarm functionality. 16 alarms divided in 2 groups (2 x 8 alarms) can be set. For each group of
alarms a time constant of maximal values in thermal mode, a delay time and alarm deactivation hysteresis can be defined.
Quantity, value (a current value or a MD – thermal function) and a condition for alarm switch-on are defined for every
individual alarm.
MC350 TH also supports storing of alarms in internal memory.
WARNING!
New values of alarms are calculated in percentage at modification of connection settings.
Alarm statistics reset
Device evident all triggered alarms and stores it in internal RAM. Statistic is valid since last power supply On and could be
reset with MiQen - help tip software (See chapter Reset operations).
This setting is only for resetting online alarms statistics displayed in MiQen - help tip software.
61 Quality Analayser MC774
Alarms statistics for showing graphical representation of frequency of alarms occurrence.
MD Time constant (min)
Sets a thermal mode maximum demands time constant for the alarm group. When monitoring certain quantity it is possible
to monitor its actual value or its max. demand value. If latter is chosen then a time constant for calculation of thermal mode
max. demand value should be set. This setting is for alarm purposes only and is independent of max. demand calculation
settings for monitoring and recording purposes as described in chapter Maximum demand calculation.
Compare time delay (sec)
This setting defines delay time (if required) between satisfying the alarm condition and alarm activation. If alarm condition
is shorter then this setting alarm will not be triggered. This setting is used to rule out sporadic and very short duration
triggers.
Histeresis (%)
This setting defines alarm deactivation hysteresis. When monitord quanitity is close to set limit line its slight variation can
trigger numerous alarms. Hysteresis should be sett according to estimated variation of monitored quantity.
Response time
This setting defines alarm response on monitored quantity. Normal response: In this case monitored quantity is averaged
according to display averaging settings (0.1 to 5s – see chapter General settings / Average interval)
Fast response:
In this case alarms react on non-averaged measurements (1 signal period). This setting should be used
according to required functionality. Fast response is more prone to glitches and transient effects in a system but reaction
time is fast.
Individual alarm settings
For each individual alarm different settings are possible.
62 Quality Analayser MC774
Individual Alarms settings
Parameter
This setting defines a quantity that should be monitored. It is also possible to select process quantities from I/O modules.
Value
For chosen monitoring parameter an actual value or MD value should be set.
Condition
It is a combination of a logical operator “Higher than” or “Lower than” and a limit value of the condition. For digital / pulse
input it is possible to set condition is “Is high” or “Is low”.
Action
This section is consists of checkboxes that applies different functions to individual alarms.
Switch on Relay checkbox can be selected if user wants this alarm to trigger output(s) that are connected to its group of
alarms (pulse, relay or bistable output module). When using relay outputs of I/O module A or B also a single alarm can be
used as a trigger. In this case Switch on Relay setting has no influence.
Switch on sound signal checkbox would activate built in beeper if this alarm is active.
Alarm enabled checkbox, activates alarm setting.
Memory/Recorders
space
Introduction
Measurements, alarms, PQ reports and details can be stored in a built in memory of measuring instrument 8MB flash. This
amount of memory suffices for storing EN 50160 compliant PQ reports with details for more than 12 month. All records
stored in memory are accessible by communication or memory card and can be displayed with MiQen software.
Device has also a built in function that enables scheduled transmission of data, stored in memory, to remote data collecting
system. For more information regarding this feature see chapter PUSH Communication mode.
Intrduction to Memory/Recorders
Measurements and alarms are stored in a built in memory in the 8MB flash. All records stored in memory are accessible via
communication or memory card with MiQen software. Device also has a built in function that enables scheduled
transmission of data, stored in memory, to MiSmart system. For more information regarding this check chapter PUSH
Communication mode.
Welcome
Measurements, alarms, reports and details of supply voltage quality are stored in a built in memory in the 8MB flash. All
records stored in memory are accessible via communication or memory card with MiQen software. Device also has a built
in function that enables scheduled transmission of data, stored in memory, to MiSmart system. For more information
regarding this check chapter PUSH Communication mode.
Reserved for network quality
Reserved memory for the network quality analysis.
63 Quality Analayser MC774
Memory organisation
Devices’ internal memory has 8MB of total memory space. It is divided into 5 partitions which size is defined by the user
and 2 fixed partitions.
User defined partitions are A, B, C and D recorders that are intended for recording of measurements, while all alarms that
occurred are recorded in an alarm partition.
C and D recorders can be user defined as a standard trend recorders (like recorders A and B) or can be defined as dedicated
harmonic recorders. As such they will record all 63 harmonics, voltage or current depends on user setting for each of those
two recorders. Settings are available in general tab of Standard recorders section (see figure Internal memory organisation).
Fixed partitions are dedicated for recording PQ reports and details (see chapter Power supply quality).
Internal memory organisation
Memory division
Memory is divided into 5 partitions which size is defined by the user. The A, B, C and D recorders are intended for recording
measurements, while all alarms that occurred are recorded in an alarm partition.
Memory division MC350
MC memory is divided into 3 partitions which size is defined by the user. Measurements are stored in A and B partitions,
while all alarms that occurred are recorded in an alarm partition.
Recorder A/B state
Defines if data is storing to selected memory partition.
Recorder A/B/C/D state
Defines if data is storing to selected memory partition.
Alarms state
Defines if data is storing to selected memory partition.
Quality reports state
Defines if data is storing to selected memory partition.
Quality details state
Defines if data is storing to selected memory partition.
64 Quality Analayser MC774
Recorder C/D mode
Defines function mode for the recorder.
Trend recorder A/B
Separately, for each of the recorders, settings can be set.
Trend recorder A/B/C/D
General purpose recorder consists from 4 partitions (A, B, C and D). General purpose recorder does not include alarm
recorder or PQ reports and details recorder. Separately, for each of four partitions, following settings can be set:
Recorded quantites
For each of measurement, which is to be recorded it is possible to set a required quantity and its type within storage
interval (min., max., avg. …)..
Stored parameter settings
Storage interval (min)
Which type of parameter should be stored each interval (avg., min., max., actual…) is defined in settings for each individual
parameter described later in this chapter.
Value
A type of a selected quantity within set monitoring interval can be set to different conditions.
Minimum and Maximum value represents minimum or maximum of recorded averaged values within selected storage
interval. Note that min./max. value is not a single period value but an average (0.1 s to 5 s; see chapter General settings /
Average interval).
Minimum (MD) and Maximum (MD) value represents calculation of a MD value with applied thermal function. Thermal
function time constant is described above (MD Time constant). It applies only to recorders A and B
Average value represents calculated average value within selected storage interval
Actual value represents first momentary value within selected storage interval. Note that momentary value is not a single
period value but an average (0.1 s to 5 s; see chapter General settings / Average interval). It applies only to recorders C and
D.
Minimum and Maximum (Period) values represent min. or max. value within selected storage interval calculated in a single
period. This function allows recording of very fast changes. It applies only to recorders C and D.
Value for mc350
Representation of a value within set monitoring interval can be set to different conditions.
Average value represents calculated average value
65 Quality Analayser MC774
Actual value represents value of recorded quantity at sampling intervals
Minimum and Maximum value represents minimum or maximum of recorded quantity in selected storage interval.
Minimum or maximum in this case represents averaged value according to average interval selected in General settings.
MD time constant 1-8 and 17-24 (min)
When max. demand needs to be recorded, this setting sets a period for calculation of maximum and minimum value in
thermal mode (Minimum (MD) or Maximum (MD)). Different parameters can be set for Recorded parameters 1-8, 17-24
and 9-16, 25-32. This setting is only available for recorders A and B.
MD time constant 9-16 and 25-32 (min)
When max. demand needs to be recorded, this setting sets a period for calculation of maximum and minimum value in
thermal mode (Minimum (MD) or Maximum (MD)). Different parameters can be set for Recorded parameters 1-8, 17-24
and 9-16, 25-32. This setting is only available for recorders A and B.
Push settings
When PUSH communication mode is active, all measurements which are set to be written to the memory can be sent
(pushed) to a predefined location inside local or wide area network (from the time that PUSH functionality has been
activated, not for the past records). Settings allow choosing an appropriate destination for data to be sent, time interval of
sent data and a delay time for sending data if they cannot be sent immediately due to restrictions in network.
For more information about PUSH functionality see chapter PUSH Communication mode.
Push settings: Push data to link
Defines the communication channel for pushing data to clients.
Push settings: Pushing period
Defines a time period for pushing data to clients. Reading, events and PQ reports, witch are recorded in internal memory,
can be also periodically (user defined) sent to a client. For more information about Push system see Users Manual.
Push settings: Pushing time delay
Defines if data should be send immediately after pushing period condition is achieved or a time delay is used for client
discharge.
Recorder parameter (1-16)/(1-32)
Monitoring quantity can be selected from a list of supported measurements.
Recorder measurements group
Defines the measurements which will be recorded.
Memory operation
Memory functions in a cyclic mode in compliance with the FIFO method. This means that only the latest records are stored
in the memory that will replace the oldest ones.
A size of stored data or a storing period depends on selected partition size, a number of recorded quantities and a storage
interval.
Storage availability of partitions is shown in the Information menu (see chapter Display of device info).
Memory clearing
There is usually no need to clear the memory, because it works in cyclic mode. If it is required anyway, the data storing
must be stopped first. Read the device settings with MiQen and set “Recorder state” in Memory setting group to “stopped”
as shown in a figure below.
66 Quality Analayser MC774
Enabling or disabling data storage
Download changes to the device and open Memory info form and Format tab. Choose memory partitions required to be
cleared and click format button. After partitions are cleared set “Recorder state” setting back to active.
CAUTION
It is strongly advised to download recorder data before applying any changes to recorder or changes of settings for energy,
type of connection, current and voltage transformer settings and used current and voltage ranges. These changes might
have impact on recorded history so data might no longer be valid.
Conformity of voltage with EN 50160 standard
The EN 50160 standard deals with voltage characteristics of electricity supplied by public distribution systems. It specifies
the limits or values of voltage characteristics in normal operation within public low or middle voltage system network.
Fallowing this definition the measuring instrument is adapted for monitoring voltage characteristics of a distribution
systems according to EN 50160 standard. Together with setting and monitoring software MiQen voltage characteristics can
be monitored and weekly reports about power quality are issued.
Based on requirements stated in the standard, default parameters are set in the device according to which supervision of all
required characteristics is performed. Parameters can also be changed in detailed settings for individual characteristics.
CAUTION
Factory default settings for PQ characteristics are in compliance with standard EN 50160. By changing individual parameters
conformity of weekly reports with this standard is no longer valid.
Parameters of PQ characteristics are settable only by means of setting software MiQen.
67 Quality Analayser MC774
General PQ settings
General PQ settings are basic parameters that influence other settings.
Monitoring mode
Monitoring mode can be set to:
-EN50160: Monitoring according to EN 50160 enabled. Weekly reports are issued according to set parameters
-No monitoring: Weekly reports for network compliance with the standard are disabled
Electro energetic system
Requirements for PQ monitoring differ regarding type of a monitored public distribution system. Therefore it is essential o
choose proper type. This setting influences some of the predefined limit lines according to relevant standard EN 50160.
Measuring instrument can monitor PQ within following systems:
Low Voltage grid connected system
Medium Voltage grid connected system
Low Voltage islanded system
Medium Voltage isladed system
PLEASE NOTE
Choosing one of listed distribution systems automatically sets PQ characteristics according to requirements in EN 50160 for
that particular system.
Nominal supply voltage
Set a voltage level of a monitored system. This value is used as a reference for calculation of power quality indices and is
usually equal to nominal network voltage (also marked as Udin in various standards). Factory default value is EU standard
low voltage value 230 V.
Nominal power frequency
Nominal frequency of monitored supply voltage is selected. Factory default value is EU standard frequency 50Hz. It is also
possible to choose 60 Hz.
Flicker calculation function
Low voltage level for residential lamps can be either 230V or 110V. Function for detection of flicker differs regarding this
voltage. Since actual low voltage level can be different as secondary voltage of used VT (nominal measuring voltage) this
setting must be set to a voltage level, which is used to supply residential lamps.
68 Quality Analayser MC774
Monitoring period (weeks)
Monitoring period predefines period for issuing PQ reports. When Monitoring Mode is set to EN 50160, monitoring is
performed continuously.
This setting defines how often should reports be issued.
Monitoring start day
A starting day in a week for monitoring period is selected. It starts at 00:00 (midnight) in the selected day. The selected day
will be the first day in a report.
After Monitoring period and Monitoring start day are defined, PQ reports will be continuously issued at the end of each
monitoring period. All reports and associated anomalies within monitored period are stored in devices internal memory and
can be analysed by means of MiQen software.
Flagged events setting
Flagged evens setting specifies actions on data (recorded events) that has been flagged (marked) according to flagging
concept IEC 61000-4-30.
Flagged data are power quality records, which has been influenced by one or more voltage events (interruptions, dips,
swells).
The purpose of flagging data is to mark recorded parameters when certain disturbances might influenced measurements
and caused corrupted data. For example, voltage dip can also trigger occurrence of flicker, interharmonics... In this case all
parameters which were recorded at a time of voltage events are marked (flagged). In later evaluation those flagged records
can be omitted from final report by choosing appropriate setting.
PLEASE NOTE
Regardless of this setting, readings will be always stored in recorder and available for analysis. Flagging only influences PQ
reports as a whole.
Flagged data can be included or excluded from a PQ report
Sending Reports and Report Details
When PUSH communication mode is active, reports about quality and report details for each parameter can be sent
(pushed) to a predefined location inside local or wide area network. Settings allow choosing an appropriate destination for
data to be sent, time interval of sent data and a delay time for sending data if they cannot be sent immediately due to
restrictions in network.
For more information about PUSH Communication mode.
EN 50160 parameters settings
Power Quality indices as defined by EN 50160
Phenomena
PQ Parameters
Frequency variations
Frequency distortion
Voltage variations
Voltage fluctuation
69 Quality Analayser MC774
Voltage unbalance
Voltage changes
Rapid voltage changes
Flicker
Voltage events
Voltage dips
Voltage interruptions
Voltage swells
Harmonics & THD
THD
Harmonics
Inter-harmonics
Signalling voltage
Standard EN 50160 describes in details PQ parameters and corresponding limit lines for monitoring whereas distribution
system voltage operates in accordance with mentioned standard.
Settings of limit lines and required percentage of appropriate indices resembles requirements of standard EN 50160.
When monitoring according to this standard is required there is no need to make changes to PQ parameters settings.
More detailed description of certain parameter monitoring procedures is in a chapter Measurments.
There are some PQ parameters which are interesting for monitoring but are not required to be part of PQ reports. These
settings do not have standardised limit values and an be set according to distribution network requirements.
Short term flicker (limit Pst = 1)
Interharmonics (10 values of user defined frequencies)
Settings for power quality parameters are set with setting and monitoring software MiQen
MiQen HELP description clearly marks PQ parameters, which are not required as a part of EN 50160 PQ report.
Below figure shows settings for interharmonic values:
70 Quality Analayser MC774
Settings for 10 user defined interharmonic frequencies
Conformity of voltage with SIST EN 50160 standard
The SIST EN 50160 standard deals with voltage characteristics of electricity supplied by public distribution systems. This
specifies the limits or values within which a customer can expect voltage characteristics to lie. Within this definition the
Network analyzer is adapted for supervising the compliance of distribution systems with the SIST EN 50160 standard.
Based on requirements stated in the standard, default parameters are set in the meter according to which supervision of all
required parameters is done. Parameters can also be changed in detailed setting of individual characteristic.
Reset
During normal operation of a device different counter s values need to be reset from time to time.
Reset energy counter
All or individual energy meters (counters) are reset.
Reset energy counter Cost
All or individual energy costs are reset.
Reset MD values
Thermal mode:
Current and stored MDs are reset.
Fixed interval / Sliding windows:
The values in the current time interval, in all sub-windows for sliding windows and stored MD are reset. In the same time,
synchronization of time interval to the beginning of the first sub-window is also performed.
Reset last period MD
Thermal mode:
Current MD value is reset.
Fixed interval / Sliding windows:
Values in the current time interval and in all sub-windows for sliding windows are reset. In the same time, synchronization
of the time interval is also performed.
Synchronize MD
Thermal mode:
In this mode, synchronization does not have any influence.
Fixed interval / Sliding windows:
Synchronization sets time in a period or a sub-period for sliding windows to 0 (zero). If the interval is set to 2, 3, 4, 5, 6, 10,
12, 15, 20, 30 or 60 minutes, time in a period is set to such value that some intervals will be terminated at completed hour.
Time constant (interval)
15 min
10 min
7 min
Synchronization start time
10:42
10:42
10:42
Time in a period
12 min
2 min
0 min
71 Quality Analayser MC774
First final interval
10:45
10:50
10:49
Alarm relay [1/2/3/4] Off
When using MiQen, each alarm output can be reset separately. On device (manually) only all alarm outputs together can be
reset.
Reset Min/Max values
All Min/Max values are reset.
Reset alarm statistic
Clears the alarm statistic. It can be made by MiQen software under Alarm settings. This setting is only for resetting online
alarms statistics displayed in MiQen software.
Reset alarm output
All alarms are reset.
72 Quality Analayser MC774
LCD navigation
Reset energy counter: LCD navigation
Main menu > Resets > Energy counters > Energy counter E1 / E2 / E3 / E4
Reset energy counter Cost: LCD navigation
Main menu > Resets > Energy counters > All Cost counters / Cost counter E1 / E2 / E3 / E4
Reset MD values: LCD navigation
Main menu > Resets > MD values >Yes/No
Reset last period: LCD navigation
Main menu > Resets > Last period MD >Yes/No
Synchronize MD: LCD navigation
Main menu > Resets > Synchronize MD
Reset Min/Max values: LCD navigation
Main menu > Resets > Min/Max values >Yes/No
Settings and memory card
Measuring centre is provided with a built in slot for a full size SD memory card that is used for measurements transfer from
internal memory, device setting and software upgrading. The memory card shall be formatted with the FAT16 file system.
Directory structure on a memory card
A structure of directories is defined and enables correct data handling via a memory card. The memory card shall contain
the following directories and files:
DATA
SETTING
UPGRADE
File: Automenu.txt (option)
DATA
Records from the internal memory are collected in the DATA directory. To upload data of several devices to the memory
card, each device checks and, if necessary, creates its own subdirectory before data transfer. Each subdirectory uses a
device serial number as its name and stores files with data in it. Each file name contains date (year, month and day) and a
record sequence number of that day.
WARNING
When uploading data file to memory card and there is a file with sequence number 99 of that day, a file with sequence
number 00 is generated. File with sequence number 00 of that day, is overwritten in case of any further uploading data that
day.
SETTING
Settings are stored in the directory using two recording modes:
With a type designation and a sequence number from 1 to 9
With an device serial number
UPGRADE
A file with upgrades is available for upload with the MiQen software. A file has a name of a corresponding device type
designation and suffix fl2 (e.g. MC7XX.FL2).
73 Quality Analayser MC774
Automenu.txt
For faster and easier upgrading of the firmware there is »Automenu.txt« file in the root directory. When an memory card
with a file is inserted and if upgrade version is higher, display automatically jumps into the memory card menu and suggests
the Software upgrade menu, otherwise it automatically jumps into the Save data menu. When upgrading is finished and the
OK key is pressed and memory card is removed, the menu that was displayed before inserting the memory card is
displayed.
Automenu.txt file can be created by the user by means of the text editor. A new file has to be opened and saved under the
correct name (Automenu.txt) and without content.
Example:
DATA
MC003973
06050301.MMC
MC003974
06050301.MMC
06070301.MMC
MC009424
06060301.MMC
06070301.MMC
SETTING
MC003973.MSF
MC774−1.MSF
MC774−2.MSF
MC750−1.MSF
UPGRADE
MC760.FL2
Automenu.txt
74 Quality Analayser MC774
Handling memory card
Quality Analyser is on the front panel equipped with a slot for a Memory card. Slot is protected with a protection cover that
can be simply removed before inserting the card. The protection cover shall be fixed back after work is done.
CAUTION
While memory card activity LED is blinking it should not be pulled out of the slot.
Save data
Sections
For each section define whether it is included for a record in a file.
Date
Since the last transfer, all available data from the last official reading with a password is included. For the Last week and the
Last month, all data of the last complete unit (a week, a month) with the beginning in the first day at 00:00 is included. The
selected date defines a day with the beginning at 00:00 from which further on to the current time of data transfer. When all
data is selected, all data for an individual section, that are stored in the memory up to the moment when reading is started,
are transferred.
Official reading
If official reading is selected date of reading is stored in device, and is applied at the next official reading.
Save settings
File of current device settings is stored in SETTING directory. File name consists of device serial number and MSF extension.
In case of file already stored on memory card, the device warns if file should be overwritten.
Load settings
For loading settings, the files that correspond to the device type are displayed on LCD. When a file is selected, it is necessary
to choose the segments of settings that will be overwritten. A number of registers that will be modified is written next to
each segment. After settings transfer, a warning on errors could be displayed. Errors occur when the module setting and a
memory capacity differ from the used ones in the device. A number of settings (registers) that do not match and are neither
modified is displayed after warning.
Basic settings
At transfer of basic settings, settings of connections, ratios, used voltage and current ranges as well as nominal frequency
are not changed. New settings can influence energy counters if recorded in a memory.
Alarms
Settings of all alarms are changed, but old alarms with previous settings remain in the memory.
Recorders
Recorder overwriting enables modified setting of connection, ratio, used voltage and current ranges as well as nominal
frequency. All other data in a memory is lost.
Firmware upgrading
Before upgrading files on memory card are checked first, this can last some time (approx. 1 minute). When both versions
are displayed, upgrade can be performed if the device software version is lower or equal to the version in a file.
WARNING
When upgrading firmware software remove memory card and do not interrupt power supply - the device could become
inoperative!
Repairing of device in this case is to be done by authorized service.
Upgrade error codes:
Error 1: memory card not inserted
Error 2: Error on FAT16 file system
Error 3: File not exist (.fl2)
75 Quality Analayser MC774
Error 4: Error in .fl2 file
Error 5: File too long (.fl2)
Error 6: Invalid file (.fl2)
Error 7: Incorrect upgrade version (.fl2)
LCD navigation:
Memory card information:
Device checks a file system and capacity of the inserted memory card.
Main menu > SD card > SD info
Official reading - Example:
Main menu > SD card > Save data
OK
OK
Example of a display on LCD for MC774:
Main menu > SD card > Load settings
OK
MEASUREMENTS
space
MC774 Quality Analyser performs measurements with a constant sampling frequency 31 kHz. Measurement methods differ
for normal operation quantities, where values are averaged and aggregated according to aggregation requirements of IEC
61000-4-30 standard (Class A) and voltage events where half-period values are evaluated again according to Class A
standard.
Online measurements
Online measurements are available on display or can be monitored with setting and monitoring software MiQen.
Readings on display are performed continuously with refresh time dependent on set average interval whereas rate of
readings monitored with MiQen is fixed and refreshed approx. each second.
For better overview over numerous readings, they are divided into several groups, which contain:
basic measurements, min. and max. values, alarms, harmonics and PQ parameters (presented groups depend on
measurements and function supported in selected device).
76 Quality Analayser MC774
Each group can represent data in visually favoured graphical form or detailed tabelaric form. Latter allows freezing readings
and/or copying data into various report generation software tools.
Exemple: Online measurements in graphical form - phaser diagram and daily total active power consumption histogram
Exemple: Online measurements in tabelaric form
Measurements (online)
Online measurements are available on display or can be monitored with setting and monitoring software MiQen.
Readings on display are performed continuously with refresh time dependent on set average interval whereas rate of
readings monitored with MiQen is fixed and refreshed approx. each second.
For better overview over numerous readings, they are divided into several groups, which contain:
basic measurements, min. and max. values, alarms, harmonics (presented groups depend on measurements and function
supported in selected device).
Each group can represent data in visually favoured graphical form or detailed tabelaric form. Latter allows freezing readings
and/or copying data into various report generation software tools.
Interactive instrument
Additional communication feature of a device allows interactive handling with a dislocated device as if it would be
operational in front of user.
This feature is useful for presentations or product training.
77 Quality Analayser MC774
MC774
Online harmonic measurements in graphical form and interactive instrument.
Supported measurements
Selection of supported measurements of individual instrument type is changed with the connection settings. All supported
measurements could be read via communication (MiQen) or displayed on display(depends on device hardware).
Available connections
Different electric connections are described more in detail in chapter Electrical connection. Connections are marked as
follows:
Connection 1b (1W) − Single phase connection
Connection 3b (1W3) − Three-phase – three-wire connection with balanced load
Connection 4b (1W4) − Three-phase – four-wire connection with balanced load
Connection 3u (2W3) − Three-phase – three-wire connection with unbalanced load
Connection 4u (3W4) − Tree-phase – four-wire connection with unbalanced load
PLEASE NOTE
Measurements support depends on connection mode the device type. Calculated measurements (for example voltages U1
and U2 when 3-phase, 4-wire connection with a balanced load is used) are only informative.
Selection of available quantities
Available online measuring quantities and their appearance can vary according to set type of power network and other
settings such as; average interval, max. demand mode, reactive power calculation method…
Complete selection of available online measuring quantities is shown in a table on the next page.
PLEASE NOTE
Measurements support depends on connection mode the device type. Calculated measurements (for example voltages U1
and U2 when 3-phase, 4-wire connection with a balanced load is used) are only informative.
PLEASE NOTE
For 3b and 3u connection mode, only phase to phase voltages are measured. Because of that factor √3 is applied to
calculation of quality considering nominal phase voltage. For 4u connection mode measurements support is same as for 1b.
78 Quality Analayser MC774
Meas. type
Measurement
Phase
Voltage
measurements
U1-3_RMS
3-phase
4-wire
3-phase
3-wire
1-phase
comments
1ph
UAVG_RMS
Uunbalance_neg_RMS
Uunbalance_zero_RMS
U1-3_DC
1ph
DC component of phase
voltages
Current
I1-3_RMS
1ph
ITOT_RMS
IAVG_RMS
Power
P1-3_RMS
1ph
PTOT_RMS
Q1-3_RMS
1ph
QTOT_RMS
S1-3_RMS
reactive power can be
calculated as a squared
difference between S and P
or as delayed sample
1ph
STOT_RMS
PF1-3_RMS
1ph
1-3_RMS
1ph
PA – Power angle
Harmonic analysis
THD-U1-3
1ph
THD-I1-3
1ph
TDD-I1-3
1ph
U1-3_harmonic_1-63_%
1ph
U1-3_harmonic_1-63_ABS
1ph
U1-3_harmonic_1-63_
1ph
U1-3_inter-harmonic_%
1ph
U1-3_inter-harmonic_ABS
1ph
U1-3_signaling_%
1ph
U1-3_signaling_ABS
1ph
monitoring of signaling
(ripple) voltage of set
frequency. % of RMS or % of
base
I1-3_harmonic_1-63_%
1ph
% of RMS or % of base
I1-3_harmonic_1-63_ABS
1ph
I1-3_harmonic_1-63_
1ph
Flickers
79 Quality Analayser MC774
% of RMS or % of base
monitoring up to 10 different
fixed frequencies. % of RMS
or % of base
Pi1-3
1ph
Instantaneous flicker
sensation measured with 150
samples / sec (original
sampling is 1200 smpl/sec)
Pst1-3
1ph
10 min statistical evaluation
(128 classes of CPF)
Plt1-3
1ph
derived from 12 Pst acc. to
EN 61000-4-15
Miscellaneous
K-factor1-3
1ph
Current Crest
factor1-3
1ph
Further description is available in following subchapters
Selection of available measurement quantities
Meas. type
Measurement
Phase to
phase
Voltage
measurements
Upp1-3_RMS
3-phase
4-wire
3-phase
3-wire
1-phase
comments
UppAVG_RMS
THD-Upp1-3
x-y_RMS
Upp1-3_harmonic_1-63_%
Phase-to-phase angle
Upp1-3_harmonic_163_ABS
Metering
1ph
1ph
Upp1-3_harmonic_1-63_
1ph
Uunderdeviation
1ph
Uoverdeviation
1ph
each counter can be dedicated to
any of four quadrants (P-Q,
import-export, L-C). Total energy
is a sum of one counter for all
tariffs. Tariffs can be fixed,
date/time dependent or tariff
input dependent
E_TOT_1-8
Active tariff
channel
measurements
Uunder. and Uover. are
calculated for phase or phase-tophase voltages regarding
connection mode.
Energy
Counter E1-8
Auxiliary
% of RMS or % of base
Aux. line
UNEUTRAL-EARTH
aux. voltage is dedicated for
neutral-earth meas. only
INEUTRAL_meas
measured neutral current with
th
4 current input
INEUTRAL_calc
calculated neutral current
INEUTRAL_err
error neutral current (difference
between measured and
calculated)
Maximum
Maximum demand
demand
MD_I1-3
measurements
MD_Pimport
80 Quality Analayser MC774
1ph
MD_Pexport
MD_Qind
MD_Qcap
MD_S
Further description is available in following subchapters
Selection of available measurement quantities
Meas. type
Measurement
3-phase
4-wire
3-phase
3-wire
1-phase
Min and max
Min and max
measurements
U1-3_RMS_MIN
1ph
U1-3_RMS_MAX
1ph
comments
Upp1-3_RMS_MIN
Upp1-3_RMS_MAX
I1-3_RMS_MIN
1ph
I1-3_RMS_MAX
1ph
P1-3_RMS_MIN
1ph
P1-3_RMS_MAX
1ph
PTOT_RMS_MIN
1ph
PTOT_RMS_MAX
1ph
S1-3_RMS_MIN
1ph
S1-3_RMS_MAX
1ph
STOT_RMS_MIN
1ph
STOT_RMS_MAX
1ph
freqMIN
freqMAX
Other
Miscellaneous
measurements
freqMEAN
Internal temp.
Date, Time
Last Sync. time
UTC
GPS Time
GPS Longitude
GPS Latitude
GPS Altitude
Further description is available in following subchapters
Selection of available measurement quantities
81 Quality Analayser MC774
If GPS receiver is connected to
dedicated RTC time
synchronization input
Explanation of basic concepts
Sample frequency
A device measures all primary quantities with a constant sampling rate of 31 kHz (625 sample/per at 50 Hz).
Average interval
Operation of MC774 Quality Analyser depends on several Average intervals, which should all be well understood and set to
a proper value.
Average interval for measurements and display
Due to readability of measurements from LCD and communication, an Average interval can be selected from a range of
predefined values (from 0.1s to 5 s). The Average interval (see chapter Average interval) defines refresh rate of displayed
measurements.
Alarms response time is influenced by general average interval if their response time setting is set to “Normal response”. If
it is set to “Fast response” alarms depend on a single period measurement.
This average interval has no influence on PQ measurements.
Average interval for min. max. values
Min. and max. values often require special averaging period, which enables or disables detection of short measuring spikes.
With this seeting is possible to set averaging from 1 period to 256 periods.
Average (storage) interval for recorders
This storage interval defines a period for writing data into internal memory. It can be set from 1 min to 60 min. At the end
of every interval different types of measured data can be stored into recorder (see General purpose recorder settings)..
Average (aggregation) interval for PQ parameters
Standard IEC61000-4-30 defines different aggregation intervals and procedures for aggregation of measured PQ
parameters.
For each PQ parameter it is possible to set required aggregation interval. Standard aggregation intervals are:
10 periods (12 for 60 Hz system)
150 periods (180 for 60 Hz system)
10 sec
10 min (also basic time synchronisation tick interval)
2h
It is also possible to set other aggregation intervals according to requirements. MC774 Quality Analyser supports additional
aggregation intervals; 30 sec, 1 min, 15 min, 1 h.
82 Quality Analayser MC774
Power and energy flow
Figures below show a flow of active power, reactive power and energy for 4u connection.
Display of energy flow direction can be adjusted to connection and operation requirements by changing the Energy flow
direction settings.
Explanation of energy flow direction
Calculation and display of measurements
This chapter deals with capture, calculation and display of all supported quantities of measurement. Only the most
important equations are described; however, all of them are shown in a chapter Equations with additional descriptions and
explanations.
PLEASE NOTE
Calculation and display of measurements depend on the connection used. For more detailed information see chapter
Survey of supported measurements.
83 Quality Analayser MC774
Keyboard and display presentation
For entry and quitting measurements display menu, the OK key is used. Direction keys () are used for passing
between displays as show in example below.
Example for 4u connection mode:
Main menu > Measurements > Present values > Voltage
<
<
>
>
<
<
>
>
<
<
>
>
Present values
PLEASE NOTE
Since measurement support depends on connection mode some display groups can be combined in to one, within
Measurements menu.
PLEASE NOTE
Display of present values depends on connection mode. Therefore display organisation slightly differs from one connection
mode to another.
All measuring instruments may not support all the measurements. Overview of supportive instruments you can see
Selection of available measurement quantities.
Voltage
The device measurements:
real effective (rms) value of all phase voltages (U1, U2, U3), phase-to-phase voltages (U12, U23, U31) and neutral
to earth voltage (Un).
Average phase voltage (U ) and average phase-to-phase voltage (U)
Negative and zero sequence unbalance ratio (Uu, U0)
Phase and phase-to-phase voltage angles (1-3, 12, 13, 23)
Signalling phase and phase-to-phase voltages (Us1-3, Us12, Us13, Us23)
DC component of phase and phase-to-phase voltages including neutral line
All voltage measurements are available on communication and standard or customized displays on LCD.
Main menu > Measurements > Present values > Voltage
84 Quality Analayser MC774
«
Device warns if input signal is too large. In this case signal representation is not correct. Indicator
parameter unit:
is shown above
Current
Device measures
real effective (rms) value of phase currents and neutral measured current (Inm), connected to current inputs
Neutral calculated current (Inc), Neutral error current (Ie = |Inm – Inc|),
Phase angle between Neutral voltage and Neutral Current (In), Average current (Ia) and a sum of all phase currents
(It)
Crest factor of phase currents (CRI1-3)
All current measurements are available on communication, standard and customized displays on LCD.
Main menu > Measurements > Present values > Current
Active, reactive and apparent power
Active power is calculated from instantaneous phase voltages and currents. All measurements are seen on communication
or are displayed on LCD. For more detailed information about calculation see chapter Equations.
There are two different methods of calculating reactive power. See chapter Reactive power and energy calculation..
Device warns if input signal is too large. In this case signal representation is not correct. Indicator is shown above parameter
unit:
Main menu > Measurements > Present values > Power
Power factor and power angle
Power angle (or displacement Power Factor) is calculated as quotient of active and apparent power for each phase
separately (cos1, cos2, cos3) and total power angle (cosT). It represents angle between first (base) voltage harmonic
and first (base) current harmonic for each individual phase. Total power angle is calculated from total active and reactive
power (see equation for Total power angle, chapter Equations). A symbol for a coil (positive sign) represents inductive load
and a symbol for a capacitor (negative sign) represents capacitive load.
For correct display of PF via analogue output and application of the alarm, ePF (extended power factor) is applied. It
illustrates power factor with one value as described in the table below. For a display on LCD both of them have equal
display function: between −1 and −1 with the icon for inductive or capacitive load.
Presentation of extended PF (ePF)
Load
C
L
Angle *°+
−180
−90
0
+90
+180 (179.99)
PF
−1
ePF
−1
0
1
0
−1
0
1
2
3
Example of analogue output for PF and ePF:
Main menu > Measurements > Present values > PF & Power angle
Frequency
Network frequency is calculated from time periods of measured voltage. Instrument uses synchronisation method, which is
highly immune to harmonic disturbances.
Device always synchronises to a phase voltage U1. If signal on that phase is too low it (re)synchronises to next phase. If all
phase voltages are low (e.g. short circuit) device synchronises to phase currents. If there is no signal present on any voltage
or current channels, device shows frequency 0 Hz.
Additionally frequency with 10−second averaging interval is displayed.
85 Quality Analayser MC774
Main menu > Measurements > Present values > Frequency
Energy counters
Three ways of Energy - counters display are available:
by individual counter,
by tariffs for each counter separately and
energy cost by counter
At a display of measured counter by tariffs, the sum in the upper line depends on the tariffs set in the instrument.
There are two different methods of calculating reactive energy. See chapter Reactive power and energy calculation.
Additional information, how to set and define a counter quantity is explained in chapter ENERGY.
Main menu > Measurements > Present values > Energy
86 Quality Analayser MC774
MD values
MD values and time stamp of occurrence are shown for:
Three phase currents
Active powers (import and export)
Reactive power (ind. and cap.)
Apparent power
Main menu > Measurements > Present values > MD values
Dynamic demands are continuously calculated according to set time constants and other parameters.
Reset demands are max. values of Dynamic demands since last reset.
Harmonic distortion
Device calculates different harmonic distortion parameters:
THD is calculated for phase currents, phase voltages and phase−to−phase voltages and is expressed as percent of high
harmonic components regarding to fundamental harmonic
Device uses measuring technique of real effective (rms) value that assures exact measurements with the presence of high
harmonics up to 63rd harmonic (see chapter Calculation of harmonics).
Main menu > Measurements > Present values > THD
Harmonic distortion MC774
Device calculates different harmonic distortion parameters:
THD is calculated for phase currents, phase voltages and phase−to−phase voltages and is expressed as percent of high
harmonic components regarding to fundamental harmonic
TDD is calculated for phase currents (only MC774)
K-factor is calculated for phase currents (only MC774)
Device uses measuring technique of real effective (rms) value that assures exact measurements with the presence of high
harmonics up to 63rd harmonic (see chapter Calculation of harmonics).
Main menu > Measurements > Present values > THD
Customized screens
Here 4 different customised screens are shown. First three screens show 3 different user defined values. Fourth screen
displays 5 different values as a combination of 3 values of first screen and first 2 values of second screen.
See chapter Settings of customized screens.
Main menu > Measurements > Present values > Custom
WARNING!
When, due to mode of connection, unsupported measurement is selected for customized screen an undefined value is
displayed.
87 Quality Analayser MC774
Overview
It combines several measurements on each display as the following screens are displayed:
Screen 1:
Current phase measurements
U
Average voltage U
1
~
Current phase measurements
V
P
Total active power Pt
W
Phase voltage U1
V
P1 Active power P1
W
2
Phase voltage U2
V
P2 Active power P2
W
3
Phase voltage U3
V
P3 Active power P3
W
I
Average current I~
A
Q
var
1
Current I1
A
Q1 Reactive power Q1
var
2
Current I2
A
Q2 Reactive power Q1
var
3
Current I3
A
Q3 Reactive power Q1
var
Total reactive power Qt
Screen 2:
Current phase-to-phase measurements
U
Average phase-to-phase U
~
V
12
Phase-to-phase voltage U12
V
23
Phase-to-phase voltage U23
31
Phase-to-phase voltage U31
Current phase-to-phase measurements
Frequency f
Hz
φ
Power angle φ1
°
V
φ
Power angle φ2
°
V
φ
Power angle φ3
°
~
PF
Total power factor
φ
Average phase-to-phase angle φ
°
PF1
Power factor PF1
φ
Power angle φ12
°
PF2
Power factor PF2
φ
Power angle φ23
°
PF3
Power factor PF3
φ
Power angle φ1
°
Screen 3:
Dynamic MD values
Maximal MD values
P+
MD active power P (positive)
W
MD active power P (positive)
W
P−
MD active power P (negative)
W
φ
MD active power P (negative)
W
Q
MD reactive power Q−L
var
φ
MD reactive power Q−L
var
Q
MD reactive power Q−C
var
φ
MD reactive power Q−C
var
S
MD apparent power S
VA
φ
MD apparent power S
VA
I1
MD current I1
A
φ
MD current I1
A
I2
MD current I2
A
φ
MD current I2
A
I3
MD current I3
A
φ
MD current I3
A
Example for MC774 at connection 4u:
Main menu Measurements Present values Overview
Min/Max values
All Min/Max values are displayed similar as Present values.
Average interval for min. max. values
Min. and max. values often require special averaging period, which enables or disables detection of short measuring spikes.
With this seeting is possible to set averaging from 1 period to 256 periods.
88 Quality Analayser MC774
Display of min. and max. values
Present values are displayed with larger font in the middle of the screen, while minimal and maximal values are displayed
smaller above and below the present values.
Example of Min/Max screens :
Tabelaric presentation of min. max. values
Graphical presentation of min. max. values
In graphical presentation of min. and max. values relative values are depicted. Base value for relative representation is
defined in general settings/Connection mode/used voltage, current range.
For phase voltages and for phase-to-phase voltages the same value is used.
89 Quality Analayser MC774
Alarms
Alarms are important feature for notifying exceeded user predefined values. Not only for visualisation and recording certain
events with exact time stamp. Alarms can be connected to digital/alarm outputs to trigger different processes (switch
closures, line breaking, motors start or stop ...).
It is also very convenient to monitor alarms history. This is enabled on display and even better on communication by using
monitoring and setting software MiQen.
Alarm menu on display enables surveying state of ongoing and past alarms.
In the alarm menu, groups of alarms with states of individual alarms are displayed. Also connected alarm outputs are
displayed in the bottom line. If displayed alarm output is highlighted means it is active (relay closed). For each active alarm
a number of alarms is written in a certain group at a certain place: Group 1: 1458. Dot stands for alarm not
active.
In example below there was 1 alarm, which happened under condition defined in Group1/Alarm1 (middle picture).
Condition for that alarm was U1 > 250.00 V (right picture). Alarm activated Relay output 2 (middle picture, highlighted
Out2).
OK
OK
Alarms: LCD
MC774
Main menu
Measurements
Measurements
Present values
Settings
Min/Max values
Resets
Alarms
SD card
Graphs time
Info
Graphs FFT
Installation
14.11.2012
Power supply quality
16:53:36
Demo cycling
Main menu
Survey of alarms
In a detailed survey alarms are collected in groups. A number of a group and alarm is stated in the first column, a
measurement designation in the second, and a condition for alarm in the third one. Active alarm is marked.
Main menu > Measurements > Alarms OK / >
Tabelaric presentation of alarms
Graphical presentation of alarms
In MiQen software all alarms are presented in tabelaric and graphical form as shown in figures above. For each alarm is
shown:
Group association
Group Alarm conditions
Momentary alarm state
Number of alarm events since last reset
90 Quality Analayser MC774
Demonstration measurements
Demo cycling
Regarding the period that is defined in settings, measurement screen cycling is started until any key is pressed.
Main menu Measurements Demo cycling OK
Harmonic analysis MC774
Main menu
Measurements
Measurements
Present values
Settings
Min/Max values
Resets
Alarms
SD card
Graphs time
Info
Graphs FFT
Installation
14.11.2012
Power supply quality
16:53:36
Demo cycling
Main menu
Harmonic analysis is an important part of PQ monitoring. Frequency converters, inverters, electronic motor drives, LED,
halogen and other modern lamps. All this cause harmonic distortion of supply voltage and can influence other sensitive
equipment to malfunction or even damage.
In particular vulnerable are distribution level compensation devices whose capacitor banks act like a drain for higher
harmonics and amplify their influence. Higher harmonic currents flowing through capacitors can cause overheating and by
that shortening their lifetime or even explosions.
Monitoring harmonic distortion is therefore important not only to prevent malfunction of household equipment and to
prolong operation of motors but also to prevent serious damage to distribution equipment and to people working close to
compensation devices.
Due to importance of harmonic analysis special standard IEC 61000-4-7 defines methods for measurement and calculation
of harmonic parameters.
rd
Measuring instrument measures harmonics up to 63 and evaluates following harmonic parameters:
Phase Voltage harmonic signals and THD UP-N
Phase-to-phase Voltage harmonic signals and THD UP-P
Current harmonic signals and THD I
TDD total demand distortion for phase currents
CREST factor for proper dimensioning of connected equipment
K factor for proper dimensioning of power transformers
Interharmonics (10 user defined interharmonic values)
Signalling voltage (monitoring ripple control signal)
PLEASE NOTE
Interharmonics are available only on communication.
All of the listed harmonic parameters can be monitored online, stored in internal memory (where avaliable) (not all at a
time) and compared against alarm condition threshold limit.
The latter is in combination with alarm relay output suitable for notification and/or automatic disconnection of
compensation devices, when too much harmonics could threaten capacitors.
Display of harmonic parameters
Harmonic parameters can be displayed on devices LCD in graphical form and as a data.
Representation of individual harmonics consists of:
Absolute value
Relative value
Phase angle between base and observed harmonic
91 Quality Analayser MC774
PLEASE NOTE
Relative value can be calculated as a percentage of base unit or as a percentage of RMS value. Setting for choice of this
relative factor is under General settings (see Harmonic calculation setting).
Main menu > Measurements > Graphs time / Graphs FFT
Display of a Phase Voltage in time space diagram. Displayed
are also peak value of monitored phase voltage and its RMS
value. Similar display is also for phase-to-phase voltages.
Display of a Current in time space diagram. Displayed are also
peak value of monitored current and its RMS value
Display of a Phase Voltage in frequency space diagram.
Displayed are also RMS value, unit value (100%), system
frequency and THD value. Similar display is also for phase-tophase voltages.
Display of a Current in frequency space diagram. Displayed are
also RMS value, unit value (100%), system frequency and THD
value.
More information about harmonic parameters, especially individual harmonic values, can be obtained when device is
connected to communication and monitoring and setting software MiQen is used.
Tabelaric presentation of phase voltage harmonic components
Graphical presentation of phase voltage harmonic components
PLEASE NOTE
According to standard IEC 61000-4-7 that defines methods for calculation of harmonic parameters, harmonic values and
interharmonic values do not represent signal magnitude at exact harmonic frequency but weighted sum of cantered
(harmonic) values and its sidebands. More information can be found in mentioned standard.
Tabelaric presentation of 10 phase voltage interharmonic components
Graphical presentation of phase voltage interharmonic component
92 Quality Analayser MC774
PQ Analysis
Main menu
Measurements
Measurements
Present values
Settings
Min/Max values
Resets
Alarms
SD card
Graphs time
Info
Graphs FFT
Installation
14.11.2012
Power supply quality
16:53:36
Demo cycling
Main menu
PQ analysis is a core functionality of MC774 Quality Analyser. PQ (Power Quality) is a very common and well understood
expression. However it is not exactly in accordance with its actual meaning.
PQ analysis actually deals with Quality of Supply Voltage. Supply Voltage is a quantity for quality of which utility companies
are responsible. It influences behaviour of connected apparatus and devices.
Current and power on the other hand are consequence of different loads and hence responsibility of consumers. With
proper filtering load influence can be restricted within consumer internal network or at most within single feeder while
poor supply voltage quality influences much wider area.
Therefore indices of supply voltage (alias PQ) are limited to anomalies connected only to supply voltage:
Power Quality indices as defined by EN 50160
Phenomena
PQ Parameters
Frequency variations
Frequency distortion
Voltage variations
Voltage fluctuation
Voltage unbalance
Voltage changes
Rapid voltage changes
Flicker
Voltage events
Voltage dips
Voltage interruptions
Voltage swells
Harmonics & THD
THD
Harmonics
Inter-harmonics
Signalling voltage
For evaluation of voltage quality, device can store main characteristics in the internal memory. The reports are made on the
basis of stored data. Data of the last 300 weeks and up to 170,000 variations of the measured quantities from the standard
values are stored in the report, which enables detection of anomalies in the network.
MiQen software offers a complete survey of reports with a detailed survey of individual measured quantities and
anomalies. A survey of compliance of individual measured quantities in previous and actual monitored periods is possible.
Online monitoring
When all PQ parameters are set and analysis is enabled (information about settings for PQ analysis can be found in a
chapter Conformity of PQ according to EN 50160) PQ starts with defined date and starts issuing weekly reports (if
monitoring period setting is set to one week).
MiQen software enables monitoring state of actual period and of previous monitoring period. Both periods can be
overviewed on a devices display as well.
Main menu > Measurements > Power supply quality > Actual period/Previous period
Example of PQ report for actual period generated on devices display. More detailed information about PQ is available on
communication.
Basic information about actual monitoring period. Period is
not completed and currently not in compliance with EN
93 Quality Analayser MC774
50160
Display of current status of PQ parameters. Some are
currently not in compliance with EN 50160
Display of current status of PQ parameters. Some are
currently not in compliance with EN 50160
Display of current status of PQ parameters. Some are
currently not in compliance with EN 50160
Online monitoring PQ parameters and over viewing reports is easier with MiQen.
Tabelaric presentation of PQ parameters and overall compliance status for actual and previous monitoring period
For all parameters basic information is shown:
Actual quality
Actual quality is for some parameters expressed as a percentage of time, when parameters were inside limit lines and for
others (events) is expressed as a number of events within monitored period.
Actual quality is for some parameters measured in all three phases and for some only in a single phase (frequency). Events
can also occur as Multi-Phase events (more about multiphase events is described in following chapters)
Events are according to EN 50160 evaluated on a yearly basis. Actual quality information is therefore combined from two
numbers (x / y) as shown in a figure above, where:
X … number of events in monitored period
Y … total number of events in current year
Required quality
Required quality is limit for compliance with standard EN 50160 and is directly compared with actual quality. Result of
comparison is actual status of compliance.
More information about required quality limits can be found in standard EN 50160.
94 Quality Analayser MC774
PLEASE NOTE
To make the complete quality report the aux. power supply for the device should not be interrupted during the whole
period for which the report is requested. If firmware is updated or power supply is interrupted within a monitoring period,
quality report is incomplete − Status: Not complete.
Graphical presentation of PQ parameters and overall compliance are available only for actual monitoring period
Darker green colour marks required quality
Light green colour marks actual quality
Red colour marks incompliance with standard EN 50160
Grey colour at events marks number of events
MP at events marks Multi phase events
PQ records
Even more detailed description about PQ can be obtained by accessing PQ reports with details about anomalies in internal
memory.
Structure and operation of internal memory and instructions on how to access data in internal memory is described in
chapters Device management and Internal memory).
After memory has been read information about downloaded data is shown.
Information about downloaded data with tabs for different memory partitions
All information about PQ is stored in Quality reports tab.
Main window of recorded PQ reports
Main window is divided into two parts. Upper part holds information about recorded periodic PQ reports and lower part
holds detailed information about each of upper reports.
For each of monitored parameters it is possible to display anomaly report. This represents a complete list of accurately time
stamped measurements that were outside PQ limit lines.
By clicking on “Show details” for each PQ parameter MiQen displays time-stamped measurements (events), which were
outside limit lines
Flagged data evaluation
Flagged data represent data (recorded events) that has been flagged (marked) according to flagging concept
IEC 61000-4-30.
Flagged data are power quality records, which has been influenced by one or more voltage events (interruptions, dips,
swells).
The purpose of flagging data is to mark recorded parameters when certain disturbances might influenced measurements
and caused corrupted data. For example, voltage dip can also trigger occurrence of flicker, interharmonics ... In this case all
parameters which were recorded at a time of voltage events are marked (flagged).
PQ report will omit or include flagged data according to appropriate setting (see chapter Flagged events setting.
PLEASE NOTE
Regardless of this setting, readings will be always stored in recorder and available for analysis. Flagging only influences PQ
reports as a whole.
In evaluation of PQ parameter details it is possible to show
All events
Non-flagged events
as depicted in a figure below.
95 Quality Analayser MC774
Display of all or non-flagged events
Multiphase events
According to standard EN 50160 events (interruptions, dips, swells) should be multiphase aggregated.
Multiphase aggregation is a method where events, which occur in all phases at a same time, are substituted with a single
multiphase event since they were most likely triggered by a single anomaly in a network.
However, to eliminate possibility of lose of information all events should be recorded. Therefore during multiphase
anomaly four events are recorded. Three events for each phase and an additional multiphase event.
rd
“Phase” column in a list of events marks multiphase event with “-“. In this example two events occur in 3 line and events
are multiphase events.
Definition for multiphase dip and swell is:
“Multiphase event starts when voltage on one or more phases crosses threshold line for event detection and ends when
voltage on all phases is restored to normal value”
Definition for multiphase interruption is:
“Multiphase interruption starts when voltage on all three phases crosses threshold line for interruption detection and ends
when voltage on at least one phase is restored to normal value”
Graphical presentation of multiphase (PDIP, PINT, PSWL) event detection
Voltage event details are displayed in two ways. First as a list of all events with all details and second in a table according to
UNIPEDE DISDIP specifications.
Presentation of Dips and Interruptions in a list (only four events) and in a statistics table
Time graphical display (Graphs time)
All time graphs of measured signals are made in the same way. In the upper part of LCD there is a measurement
designation that is followed by a pea-to-peak signal value, and on the extreme right there is RMS value. In the central part
of LCD a signal shape is drawn. For a better survey of the measured signal a scale is automatically adapted to the peak-topeak signal value.
Example:
Main menu > Measurements > Graphs time > Phase voltage OK
OK
Phase voltage
Display of time flow of voltage signals U1, U2 and U3.
Main menu > Measurements > Time graphs > Phase voltage OK / >
Phase-to-phase voltage
Display of time flow of phase-to-phase voltage signals U12, U23 and U31.
Main menu > Measurements > Time graphs > Phase–phase voltage OK / >
Current
Display of time flow of current signals I1, I2 and I3.
Main menu > Measurements > Time graphs > Current OK / >
96 Quality Analayser MC774
FFT graphical display (Graphs FFT)
All FFT graphs of the measured signals are made in the same way. In the upper right angle of LCD the following
measurements are stated:
Designation of measurement with current RMS value
Value of first harmonic
Current frequency
THD signal value
The remaining part is used for a (bar) graphic display of relative values of harmonics regarding the first one. For better
resolution, first harmonic is not displayed and rating is automatically adapted according to highest harmonic values.
Example:
Main menu > Measurements > Graphs FFT > Phase voltage OK
OK
Phase voltage
Display of harmonics of phase voltage signals U1, U2 and U3.
Main menu > Measurements > Time FFT > Phase voltage OK / >
Phase-to-phase voltage
Display of harmonics phase-to-phase voltage signals U12, U23 and U31.
Main menu > Measurements > Time FFT > Phase−phase voltage OK / >
Current
Display of harmonics of current signals I1, I2 and I3.
Main menu > Measurements > Time FFT > Current OK / >
Demonstration measurements
Demo cycling
Regarding the period that is defined in settings, measurement screen cycling is started until any key is pressed.
Main menu > Measurements > Demo cycling OK
97 Quality Analayser MC774
TEHNICAL DATA
In following chapter all technical data regarding operation of device is presented.
Accuracy MC774
Measured values
Measuring Range
Accuracy class
(Direct connection)
Standard
Active power
Class
1.8 – 18 kW (In = 5 A) IEC61557-12
0.2
0 – 1.8 kW (In = 1 A)
IEC61557-12
0.5
Reactive power
0 – 18 kvar
IEC61557-12
1
Apparent power
0 – 18 kVA
IEC61557-12
0.2
Active energy
9 digit
IEC61557-12
0.2S
Reactive energy
9 digit
IEC61557-12
2
Apparent energy
9 digit
IEC61557-12
0.2
Rms current
0,001 to 12.5 Arms
IEC61557-12
(I1, I2, I3, Iavg)
In = 1 A or 5A
(In_meas)
In = 1 A or 5A
0.2
(In_calc)
In = 1 A or 5A
0.5
Rms phase voltage
Umeas:10 - 600 V L-N
IEC61557-12
0.1
(U1, U2, U3, Un-g, Uavg)
Udin = 120/230V
IEC61000-4-30
Class A
IEC61557-12
0.1
IEC61000-4-30
Class A
IEC61557-12
0.2
IEC61000-4-30
Class A
IEC61557-12
0.2
IEC61000-4-30
Class A
Rms phase-to-phase voltage
18 - 1000 V L-L
(U12, U23, U31, Uavg)
Voltage negative sequence unbalance
(2)
(u2)
Voltage zero sequence unbalance
0.1
(1)
10 - 600 V L-N
(2)
(u0)
Voltage flicker
(Pst, Plt)
Frequency – actual
(f)
Frequency - (10 s average)
(f10s)
Nominal frequency range
98 Quality Analayser MC774
10 - 600 V L-N
0.2 Pst – 10 Pst
50 / 60Hz
50 / 60 Hz
16…400 Hz
IEC61000-4-15
IEC61000-4-30
Class F1
(2)
Class A
IEC61557-12
0.02
IEC61000-4-30
Class A
IEC61557-12
0.02
IEC61000-4-30
Class A
IEC61557-12
0.02
Measured values
Measuring Range
Accuracy class
(Direct connection)
Standard
Class
IEC61557-12
0.5
IEC61557-12
0.2, ±1 cyc
IEC61000-4-30
Class A
IEC61557-12
0.2, ±1 cyc
IEC61000-4-30
Class A
IEC61557-12
±1 cyc
IEC61000-4-30
Class A
10 – 200% of
IEC61557-12
0.3
IEC61000-4-2 Class 3
IEC61000-4-7
Class I
Up to 4kHz
IEC61000-4-30
Class A
10 – 200% of
IEC61557-12
0.15
IEC61000-4-2 Class 3
IEC61000-4-7
Class I
IEC61000-4-30
Class A
Voltage interharmonics 10 – 200% of
IEC61000-4-7
Class I
(UIh)
IEC61000-4-2 Class 3
IEC61000-4-30
Class A
Up to 4kHz
IEC61557-12
0.3
Up to 4kHz (63 )
IEC61557-12
0.5
Up to 3kHz
IEC61000-4-30
Class A
Power factor (PFA)
Voltage swells
(Uswl)
Volatge dips
(Udip)
Voltage interruptions
(Uint)
(3)
THDU
Voltage harmonics
(Uh_l-n, Uh_l-l)
THDI
(4)
Current harmonics (Ih)
Signalling voltage
(Umsv)
Real time clock (RTC)
(1)
(2)
(3)
(4)
−1(C)…0…+1(L)
100 – 120 % Udin
5 – 100 % Udin
0 – 5 % Udin
rd
Up to 4kHz (63 )
rd
synchronised
unsynchronised
IEC61000-4-30
Class A
< ±1 sec/day
Accurate measurements of neutral current (In_meas) at lower frequencies (16Hz – 30Hz) are possible up to 6Arms
Voltage unbalance is measured as amplitude and phase unbalance Unb
Test specifications for flickermeter according to standard IEC61000-4-15:2010
When measuring THD, user can set how it is calculated (as a % of fundamental or as a % from RMS value)
99 Quality Analayser MC774
Inputs MC774
Voltage input
(1)
Number of channels
4
Sampling rate
31 kHz
Min. voltage for sync.
1 Vrms
Nominal value (UN)
500 VLN , 866 VLL
Max. measured value (cont.)
600 VLN ; 1000 VLL
Max. allowed value
1.2 × UN permanently
2 × UN ; 10 s
2
Consumption
< U / 4.2 MΩ per phase
Input impedance
4.2 MΩ per phase
(1)
th
4 channel is used for measuring U EARTH-NEUTRAL
Current input
Number of channels
4
Sampling rate
31 kHz
Nominal value (IN)
1A, 5 A
Max. measured value
12.5 A sinusoidal
Max. allowed value (thermal)
15 A cont.
≤ 300 A; 1s
2
Consumption
< I × 0.01Ω per phase
Nominal frequency (fn)
50, 60 Hz
Measuring range
16…400 Hz
Standard (high):
CAT III 300V
Nominal voltage AC
80 … 276 V
Nominal frequency
40 … 65 Hz
Nominal voltage DC
70 … 300 V
Consumption (max. all I/O)
< 8VA
Power-on transient current
< 20 A; 1 ms
Optional (low):
CAT III 300V
Nominal voltage AC
48 … 77 V
Nominal frequency
40 … 65 Hz
Nominal voltage DC
19 … 70 V
Consumption (max. all I/O)
< 8VA
Power-on transient current
< 20 A; 1 ms
Frequency
Supply
100 Quality Analayser MC774
Connection MC774
Permitted conductor cross-sections
Terminals
Max. conductor cross-sections
Voltage inputs (4)
2,5 mm
4 mm
2
2
solid wire
Current inputs (4)
Ø 6 mm
Supply (3)
2,5 mm
4 mm
Modules 1, 2 (2 x 3)
4 mm
Modules A, B (2 x 9)
Module C (1 x 7)
4 mm
1
with pin terminal
with pin terminal
solid wire
2
2
2,5 mm
one conductor with insulation
solid wire
2
2
2,5 mm
4 mm
2
2
2,5 mm
with pin terminal
with pin terminal
solid wire
2
2
with pin terminal
solid wire
1
Insulation for current connection wire should be at least PVC with 4kV dielectric strength and at least +75 °C working
temperature (+100°C short time; <1 min)
WARNING
It is imperative that terminal 12 which represents fourth voltage measurement channel is connected to earth pole ONLY.
This terminal should be connected to EARTH potential at all times!
Communication MC774
Ethernet
USB
Type of connection
Network
Direct
Max. connection length
30 m
2m
3m
Terminals
RJ−45
USB - B
Screw terminals
Insulation
In accordance with EN 61010−1:2010 standard
Transfer mode
Asynchronous
Protocol
MODBUS TCP / DNP3 auto detect
Transfer rate
10/100Mb/s
101 Quality Analayser MC774
RS232
RS485
Network
1000 m
MODBUS RTU / DNP3 auto
detect
2.400 to 115.200
bit/s
I/O Modules MC774
Digital input module
Main module (1, 2)
Purpose
Tariff input, Pulse input, General purpose
digital input
Tariff input
No. of inputs per module
2
Rated voltage
5 ... 48 V AC/DC *
110 ±20% V AC/DC *
230 ±20% V AC/DC *
* Depends on a built in hardware
Frequency range
45…65 Hz
Pulse input
No. of inputs per module
2
Rated voltage
5 – 48 V DC (±20%)
Max. Current
8 mA (at 48 V DC + 20%
Min. pulse width
0.5 ms
Min. pulse period
2 ms
SET voltage
40 ... 120 % of rated voltage
RESET voltage
0 ... 10 % of rated voltage
General purpose digital input
No. of inputs per module
2
Voltage
5 ... 48 V AC/DC *
110 ±20% V AC/DC *
230 ±20% V AC/DC *
* Depends on built in hardware
Auxiliary module (A, B)
Purpose
General purpose digital input
No. of inputs per module
8
Voltage
5 ... 48 V AC/DC *
110 ±20% V AC/DC *
230 ±20% V AC/DC *
* Depends on built in hardware
Digital output module
Main module (1, 2)
Type
Relay switch
No. of outputs per module
2
Purpose
Alarm output, General purpose digital
output
Rated voltage
230 VAC/DC ± 20% max
Max. switching current
1000 mA
Contact resistance
≤ 100 mΩ (100 mA, 24V)
Impulse
Max. 4000 imp/hour
Min. length 100 ms
Type
Bistable Relay switch
No. of outputs per module
1
Purpose
Alarm output, General purpose digital
output
102 Quality Analayser MC774
Digital output module
Max. switching power
40 VA
Rated voltage
230 VAC/DC ± 20% max
Max. switching current
1000 mA
Contact resistance
≤ 100 mΩ (100 mA, 24V)
Type
Optocoupler open collector
switch
No. of outputs per module
2
Purpose
Pulse output
Rated voltage
40 VAC/DC
Max. switching current
30 mA (RONmax = 8Ω)
Pulse length
programmable (2 … 999 ms)
Auxiliary module (A, B)
Status (Watchdog)
output module
Analogue output
module
Time sync. input
module C
Type
Relay switch
No. of outputs per module
8
Purpose
Alarm output, General
purpose digital output
Rated voltage
230 VAC/DC ± 20% max
Max. switching current
100 mA
Contact resistance
≤ 100 mΩ (100 mA, 24V)
Type
Relay switch
Number of outputs
1 x watchdog + 1 x relay
output
Normal operation
Relay in ON position
Failure detection delay
1.5 s
Rated voltage
230 VAC/DC ±20% max
Max. switching current
1000 mA
Contact resistance
≤ 100 mΩ (100 mA, 24V)
Output range
0…20 mA
Accuracy
0.5% of range
Max. burden
150 Ω
Linearization
Linear, Quadratic
No. of break points
5
Output value limits
120% of nominal output
Response time
(measurement and
depends on set general
average interval
analogue output)
(0.1s – 5s)
Residual ripple
< 1 % p.p.
Digital input
GPS or IRIG-B TTL
1pps voltage level
TTL level (+5V)
Max. consumption on +5V terminal
100 mA
103 Quality Analayser MC774
Time code telegram
RS232 (GPS)
DC level shif (IRIG-B)
AM analog input
IRIG-B AM modulated
Carrier frequency
1 kHz
Input impedance
600 Ohms
Amplitude
2.5VP-Pmin, 8VP-Pmax
Modulation ration
3:1 – 6:1
104 Quality Analayser MC774
ž
DC current
input
DC voltage
input
Nominal input range 1
–20 … 0 … 20 mA (±20%)
input resistance
20 Ω
accuracy
0.5 % of range
temperature drift
0.01% / °C
conversion resolution
16 bit (sigma-delta) internally
referenced
Analogue input mode
Single-ended
Nominal input range1
–10 … 0 … 10 V (±20%)
input resistance
100 kΩ
accuracy
0.5 % of range
temperature drift
0.01% / °C
conversion resolution
16 bit (sigma-delta)
internally referenced
Resistance/
temperature
Input module
Analogue input mode
Single-ended
Nominal input range (low)*
0 - 200 Ω (max. 400 Ω)
PT100 (-200°C–850°C)
Nominal input range (high)*
0 – 2 kΩ (max. 4 kΩ)
PT1000 (-200°C–850°C)
connection
2-wire
accuracy
0.5 % of range
conversion resolution
16 bit (sigma-delta)
internally referenced
Analogue input mode
Single-ended
* Low or high input range and primary input value (resistance or temperature) are set by the MiQen setting software
105 Quality Analayser MC774
Safety
Safety
protection class II
In compliance with EN 61010−1:2010
600 V rms, installation category II
300 V rms, installation category III
Pollution degree 2
Test voltage
Uaux against SELV circuits - 3.51 kV rms
Other circuits to functional earth – 2.21 kV rms
EMC
Directive on electromagnetic compatibility 2004/108/EC
In compliance with EN 61326-1:2006 for industrial environment
Protection
In compliance with EN 60529: 1997/A1:2000
Front side (with protection cover for memory slot): IP40
Rear side (with protection cover): IP20
106 Quality Analayser MC774
Operating conditions
Operating conditions which have been tested for proper operation of a device within specified accuracy are in accordance
with requirements in standards IEC61557-12, IEC61326-1, IEC61000-4-30 and IEC61000-4-7
Ambient conditions
Ambient temperature
K55 temperature class
Acc. to EN 61557-12
-10 … 55 °C
Storage temperature range
-40 to +70 °C
Ambient humidity
75% r.h. (no condensation)
Max. storage and transport humidity
90% r.h. (no condensation)
Voltage and Current max. temperature
influence limit
± 20 ppm / K
(10V-600V; 0,05A-10A)
(Tamb : -30°C to +70°C)
Influence of Auxiliary
Supply
Voltage and Current max. aux. supply change
influence limit
< ± 0,02 %
(IEC61557-12)
(Supply voltage magnitude and frequency in a
specified range)
Common mode input voltage rejection
< ± 0,08 %
(IEC61557-12)
(common mode voltage at 500V)
External A.C. field
< ±0,02 %
IEC61326-1
Performance criteria A
Electrostatic discharges
(IEC61000-4-2)
IEC61326-1
Performance criteria B
Electromagnetic RF fields
(IEC61000-4-3)
IEC61326-1
Limit 1%; < ±0,4 %
Influence of EMC
(a)
Performance criteria A
Conducted disturbances
(IEC61000-4-6)
IEC61326-1
Limit 1%; < ±0,4 %
(a)
Performance criteria A
(a)
Test performed my measuring active energy with pulse output. Error (0.4%) is due to short
measuring time
107 Quality Analayser MC774
Dimensions
Dimensional drawing
Construction
Appearance
All dimensions are in mm
Dimensions
Panel cut-out
Enclosure
Dimensions
144 × 144 ×100 mm
Mounting
Panel mounting 144×144 mm
Required mounting hole
137 × 137 mm
Enclosure material
PC/ABS
Flammability
Acc. to UL 94 V-0
Weight
550 g
Enclosure material
PC/ABS
APENDICES
space
APPENDIX A: MODBUS communication protocol
Communication protocols
108 Quality Analayser MC774
Modbus and DNP3 protocol are enabled via RS232 and RS485 or Ethernet communication. Both communication protocols
are supported on all communication ports of the device. The response is the same type as the request.
Modbus
Modbus protocol enables operation of device on Modbus networks. For device with serial communication the Modbus
protocol enables point to point (for example Device to PC) communication via RS232 communication and multi drop
communication via RS485 communication. Modbus protocol is a widely supported open interconnect originally designed by
Modicon.
In this document main modbus registers are listed. For complete, latest, Modbus table please visit ISKRA SISTEMI web site.
The memory reference for input and holding registers is 30000 and 40000 respectively.
PLEASE NOTE
For the latest and complete MODBUS table please visit Iskra Sistemi web page.
109 Quality Analayser MC774
Register table for the actual measurements
Parameter
Actual time
Frequency
Voltage U1
Voltage U2
Voltage U3
~
Average phase Voltage U
Phase to phase voltage U12
Phase to phase voltage U23
Phase to phase voltage U31
Average phase to phase Voltage Upp~
Voltage neutral to ground Uno~
Current I1
Current I2
Current I3
Neutral Current Inc (calculated)
Neutral Current Inm (measured)
Average Current
Total Current I
Real Power P1
Real Power P2
Real Power P3
Total Real Power P
Reactive Power Q1
Reactive Power Q2
Reactive Power Q3
Total Reactive Power Q
Apparent Power S1
Apparent Power S2
Apparent Power S3
Total Apparent Power S
110 Quality Analayser MC774
MODBUS
Register
Start
30101
30105
30107
30109
30111
30113
30118
30120
30122
30124
30485
30126
30128
30130
30132
30134
30136
30138
30142
30144
30146
30140
30150
30152
30154
30148
30158
30160
30162
30156
End
30104
30106
30108
30110
30112
30114
30119
30121
30123
30125
30486
30127
30129
30131
30133
30135
30137
30139
30143
30145
30147
30141
30151
30153
30155
30149
30159
30161
30163
30157
Type
T_Time
T5
T5
T5
T5
T5
T5
T5
T5
T5
T5
T5
T5
T5
T5
T5
T5
T5
T6
T6
T6
T6
T6
T6
T6
T6
T5
T5
T5
T5
Register table for the actual measurements cont.
Parameter
Power Factor PF1
Power Factor PF2
Power Factor PF3
Total Power Factor PF
Power Angle U1−I1
Power Angle U2−I2
Power Angle U3−I3
Angle between In and Un
Power Angle atan2(Pt, Qt)
Angle U1−U2
Angle U2−U3
Angle U3−U1
Angle Un−U1
Voltage unbalance Uu
Voltage unb. zero sequence Uo
U1 Signal voltage Abs
U2 Signal voltage Abs
U2 Signal voltage Abs
THD I1
THD I2
THD I3
THD U1
THD U2
THD U3
THD U12
THD U23
THD U31
Internal Temperature
111 Quality Analayser MC774
MODBUS
Register
Start
30166
30168
30170
30164
30173
30174
30175
30488
30172
30115
30116
30117
30487
30176
30177
30592
30594
30596
30188
30189
30190
30182
30183
30184
30185
30186
30187
30181
End
30167
30169
30171
30165
30593
30595
30597
Type
T7
T7
T7
T7
T17
T17
T17
T17
T17
T17
T17
T17
T17
T16
T16
T5
T5
T5
T16
T16
T16
T16
T16
T16
T16
T16
T16
T2
Register table for the actual measurements cont.
MODBUS
Register
Start
End
MD Real Power P (positive)
MD Real Power P (negative)
MD Reactive Power Q − L
MD Reactive Power Q − C
MD Apparent Power S
MD Current I1
MD Current I2
MD Current I3
Dynamic Demand Values
30542
30548
30554
30560
30536
30518
30524
30530
30543
30549
30555
30561
30537
30519
30525
30531
T6
T6
T6
T6
T5
T5
T5
T5
MD Real Power P (positive)
MD Real Power P (negative)
MD Reactive Power Q − L
MD Reactive Power Q − C
MD Apparent Power S
MD Current I1
MD Current I2
MD Current I3
30510
30512
30514
30516
30508
30502
30504
30506
30511
30513
30515
30517
30509
30503
30505
30507
T6
T6
T6
T6
T5
T5
T5
T5
Parameter
Type
Max Demand Since Last RESET
Actual counter is calculated:
Cnt.× 10
exponent
112 Quality Analayser MC774
Register table for the actual measurements cont.
Parameter
MODBUS
Register
Start
End
Type
Energy
Energy Counter 1 Exponent
Energy Counter 2 Exponent
Energy Counter 3 Exponent
Energy Counter 4 Exponent
Counter E1
Counter E2
Counter E3
Counter E4
Counter E1 Tariff 1
Counter E2 Tariff 1
Counter E3 Tariff 1
Counter E4 Tariff 1
Counter E1 Tariff 2
Counter E2 Tariff 2
Counter E3 Tariff 2
Counter E4 Tariff 2
Counter E1 Tariff 3
Counter E2 Tariff 3
Counter E3 Tariff 3
Counter E4 Tariff 3
Counter E1 Tariff 4
Counter E2 Tariff 4
Counter E3 Tariff 4
Counter E4 Tariff 4
Counter E1 Cost
Counter E2 Cost
Counter E3 Cost
Counter E4 Cost
Active tariff
113 Quality Analayser MC774
30401
30402
30403
30404
30406
30408
30410
30412
30414
30416
30418
30420
30422
30424
30426
30428
30430
30432
30434
30436
30438
30440
30442
30444
30446
30448
30450
30452
30405
30407
30409
30411
30413
30415
30417
30419
30421
30423
30425
30427
30429
30431
30433
30435
30437
30439
30441
30443
30445
30447
30449
30451
30453
T2
T2
T2
T2
T3
T3
T3
T3
T3
T3
T3
T3
T3
T3
T3
T3
T3
T3
T3
T3
T3
T3
T3
T3
T3
T3
T3
T3
T1
Register table for the actual measurements cont.
Parameter
MODBUS
Register
Start
End
Type
Flickers
Flicker Pst1
Flicker Pst2
Flicker Pst3
Flicker Plt1
Flicker Plt2
Flicker Plt3
Flicker Pf5 - L1
Flicker Pf5 - L2
Flicker Pf5 - L3
Phase voltage harmonic data
U1 Harmonic Data
Base for % calculation
U1 1 Harmonic Abs %
U1 1 Harmonic Phase Angle
U1 Harmonics from 2 to 62
U1 63 Harmonic Abs %
U1 63 Harmonic Phase Angle
U2 Harmonic Data
Base for % calculation
U2 1 Harmonic Abs %
U2 1 Harmonic Phase Angle
U2 Harmonics from 2 to 62
U2 63 Harmonic Abs %
U2 63 Harmonic Phase Angle
U3 Harmonic Data
Base for % calculation
U3 2 Harmonic Abs %
U3 2 Harmonic Phase Angle
U3 Harmonics from 3rd to 30th
U3 63 Harmonic Abs %
U3 63 Harmonic Phase Angle
114 Quality Analayser MC774
30580
30581
30582
30583
30584
30585
30586
30588
30590
31001
31003
31004
30587
30589
30591
31002
31127
31128
31129
31131
31132
31383
31384
T5
T16
T17
T16
T17
31130
31255
31256
31257
31259
31260
T17
T17
T17
T17
T17
T17
T5
T5
T5
T5
T16
T17
T16
T17
31258
T5
T16
T17
T16
T17
Register table for the actual measurements cont.
Parameter
MODBUS
Register
Start
End
Type
Line voltage harmonic data
U12 Harmonic Data
Base for % calculation
U12 1 Harmonic Abs %
U12 1 Harmonic Phase Angle
U12 Harmonics from 2 to 62
U12 63 Harmonic Abs %
U12 63 Harmonic Phase Angle
U23 Harmonic Data
Base for % calculation
U23 1 Harmonic Abs %
U23 1 Harmonic Phase Angle
U23 Harmonics from 2 to 62
U23 63 Harmonic Abs %
U23 63 Harmonic Phase Angle
U31 Harmonic Data
Base for % calculation
U31 2 Harmonic Abs %
U31 2 Harmonic Phase Angle
U31 Harmonics from 3rd to 30th
U31 63 Harmonic Abs %
U31 63 Harmonic Phase Angle
115 Quality Analayser MC774
31385
31387
31388
31386
31511
31512
31513
31515
31516
T16
T17
31514
31639
31640
31641
31643
31644
31767
31768
T5
T16
T17
T5
T16
T17
T16
T17
31642
T5
T16
T17
T16
T17
Register table for the actual measurements cont.
Parameter
MODBUS
Register
Start
End
Type
Phase current harmonic data
I1 Harmonic Data
Base for % calculation
I1 1 Harmonic Abs %
I1 1 Harmonic Phase Angle
I1 Harmonics from 2 to 62
I1 63 Harmonic Abs %
I1 63 Harmonic Phase Angle
I2 Harmonic Data
Base for % calculation
I2 1 Harmonic Abs %
I2 1 Harmonic Phase Angle
I2 Harmonics from 2 to 62
I2 63 Harmonic Abs %
I2 63 Harmonic Phase Angle
I3 Harmonic Data
Base for % calculation
I3 2 Harmonic Abs %
I3 2 Harmonic Phase Angle
I3 Harmonics from 3rd to 30th
I3 63 Harmonic Abs %
I3 63 Harmonic Phase Angle
116 Quality Analayser MC774
31769
31771
31772
31770
31895
31896
31897
31899
31900
T16
T17
31898
32023
32024
32025
32027
32028
32151
32152
T5
T16
T17
T5
T16
T17
T16
T17
32026
T5
T16
T17
T16
T17
Register table for the actual measurements cont.
Parameter
MODBUS
Register
Start
End
Type
Phase voltage interharmonic data
U1 Interharmonic Data
Base for % calculation
1. Interharmonic Abs %
2. Interharmonic Abs %
3. - 10 Interharmonic
U2 Interharmonic Data
Base for % calculation
1. Interharmonic Abs %
2. Interharmonic Abs %
3. - 10 Interharmonic
U3 Interharmonic Data
Base for % calculation
1. Interharmonic Abs %
2. Interharmonic Abs %
3. - 10 Interharmonic
32153
32155
32156
32157
32154
3271
32173
32174
32175
3272
32189
32191
32192
32193
32190
32164
32182
32200
T5
T16
T16
T16
T5
T16
T16
T16
T5
T16
T16
T16
All other MODBUS regiters are a subject to change. For the latest MODBUS register defenitions go to ISKRA web page
www.iskra.eu
117 Quality Analayser MC774
Register table for the basic settings
Register
Content
Type
Ind
Values / Dependencies Min
Max
Pass.
Level
40143
Connection
Mode
T1
0
No mode
5
2
1
1b - Single Phase
2
3b - 3 phase 3 wire
balanced
3
4b - 3 phase 4 wire
balanced
4
3u - 3 phase 3 wire
unbalanced
5
4u - 3 phase 4 wire
unbalanced
1
40144
CT Secondary
T4
mA
2
40145
CT Primary
T4
A/10
2
40146
VT Secondary
T4
mV
2
40147
VT Primary
T4
V/10
2
40148
Current input
range (%)
T16
10000 for 100%
5,00
200,00
2
40149
Voltage input
range (%)
T16
10000 for 100%
2,50
100,00
2
40150
Frequency
nominal value
T1
Hz
10
1000
2
118 Quality Analayser MC774
Data types decoding
Type
Bit mask
T1
T2
T3
T4
bits # 15…14
bits # 13…00
T5
bits # 31…24
bits # 23…00
T6
bits # 31…24
bits # 23…00
T7
bits # 31…24
bits # 23…16
bits # 15…00
T9
bits # 31…24
bits # 23…16
bits # 15…08
bits # 07…00
Description
Unsigned Value (16 bit)
Example: 12345 = 3039(16)
Signed Value (16 bit)
Example: -12345 = CFC7(16)
Signed Long Value (32 bit)
Example: 123456789 = 075B CD 15(16)
Short Unsigned float (16 bit)
Decade Exponent(Unsigned 2 bit)
Binary Unsigned Value (14 bit)
Example: 10000*102 = A710(16)
Unsigned Measurement (32 bit)
Decade Exponent(Signed 8 bit)
Binary Unsigned Value (24 bit)
Example: 123456*10-3 = FD01 E240(16)
Signed Measurement (32 bit)
Decade Exponent (Signed 8 bit)
Binary Signed value (24 bit)
Example: - 123456*10-3 = FDFE 1DC0(16)
Power Factor (32 bit)
Sign: Import/Export (00/FF)
Sign: Inductive/Capacitive (00/FF)
Unsigned Value (16 bit), 4 decimal places
Example: 0.9876 CAP = 00FF 2694(16)
Time (32 bit)
1/100s 00 - 99 (BCD)
Seconds 00 - 59 (BCD)
Minutes 00 - 59 (BCD)
Hours 00 - 24 (BCD)
Example: 15:42:03.75 = 7503 4215(16)
119 Quality Analayser MC774
Data types decoding cont.
Type
Bit mask
T10
bits # 31…24
bits # 23…16
bits # 15…00
T16
T17
T_float
T_Str4
T_Str6
T_Str8
T_Str16
T_Str40
bits # 31
bits # 31
bits # 31
Description
Date (32 bit)
Day of month 01 - 31 (BCD)
Month of year 01 - 12 (BCD)
Year (unsigned integer) 1998..4095
Example: 10, SEP 2000 = 1009 07D0(16)
Unsigned Value (16 bit), 2 decimal places
Example: 123.45 = 3039(16)
Signed Value (16 bit), 2 decimal places
Example: -123.45 = CFC7(16)
IEEE 754 Floating-Point Single Precision Value (32bit)
Sign Bit (1 bit)
Exponent Field (8 bit)
Significand (23 bit)
Example: 123.45 stored as 123.45000 = 42F6 E666(16)
Text: 4 characters (2 characters for 16 bit register)
Text: 6 characters (2 characters for 16 bit register)
Text: 8 characters (2 characters for 16 bit register)
Text: 16 characters (2 characters for 16 bit register)
Text: 40 characters (2 characters for 16 bit register)
120 Quality Analayser MC774
APPENDIX B: DNP3 communication protocol
Communication protocols
Modbus and DNP3 protocol are enabled via RS232 and RS485 or Ethernet communication. Both communication protocols
are supported on all communication ports of the device. The response is the same type as the request.
DNP3
DNP3 protocol enables operation of a device on DNP3 networks. For device with serial communication the DNP3 protocol
enables point to point (for example device to PC) communication via RS232 communication and multi drop communication
via RS485.
Device automatically responses to MODBUS or DNP3 request.
PLEASE NOTE
For the latest and complete DNP3 table please visit Iskra Sistemi web page.
DNP 3.0
Device Profile Document
Issue: E
Date: 8 Jan 2013
Device Name: Measurement centre
Vendor Name: Iskra d.d.
Models Covered: MC774
Highest DNP Level Supported:
For Requests: 1
For Responses: 1
Device Function:
Notable objects, functions, and/or qualifiers supported in addition to the Highest DNP Levels Supported (the complete list is
described in the DNP V3.0 Implementation table).
Maximum
Data
Link
Frame
Transmitted:
292
Received:
249
Maximum Data Link Re-tries:
Size
Requires Data Link Layer Confirmation:
Configurable
Requires Application Layer Confirmation:
Timeouts while waiting for:
Data Link Confirm:
Complete Appl. Fragment:
Application Confirm:
Complete Appl. Response:
Others:
121 Quality Analayser MC774
(octets):
Maximum Application Fragment Size (octets):
Transmitted:
2048
Received:
249
Maximum Application Layer Re-tries:
Sends/Executes Control Operations:
WRITE Binary Outputs
SELECT/OPERATE
DIRECT OPERATE
DIRECT OPERATE – NO ACK
Count > 1
Pulse On
Pulse Off
Latch On
Latch Off
Configurable
Queue
Clear Queue
Reports Binary Input Change Events when no specific
variation requested:
Reports time-tagged Binary Input Change Events when no specific
variation requested:
-time-tagged
Sends Unsolicited Responses:
Sends Static Data in Unsolicited Responses:
No other options are permitted.
supported
Default Counter Object/Variation:
Counters Roll Over at:
Point-by-point list attached
Point-by-point list attached
Sends Multi-Fragment Responses:
122 Quality Analayser MC774
Object
Object
Variation
Number Number
0
0
0
0
0
0
0
Description
242
243
246
248
250
252
Device Attributes - software version
Device Attributes – hardware version
Device Attributes – user assigned ID
Device Attributes – serial number
Device Attributes – product name
Device Attributes – manufacture name
Device Attributes – nonspecific all attributes
254
request
255 Device Attributes – list of attribute variation
0
Points for object 0
0 Software version
0 Hardware version
0 user assigned ID
0 serial number
0 product name
0 manufacture name
Object
Object
T_Str3
T_Str2
T_Str2
T_Str8
T_Str16
T_Str20
Variation
Description
Number Number
10
10
Points for object 10
0 Relay 1
1 Relay 2
2 Relay 3
3 Relay 4
4 Slot A - Relay 1
5 Slot A - Relay 2
6 Slot A - Relay 3
7 Slot A - Relay 4
8 Slot A - Relay 5
9 Slot A - Relay 6
10 Slot A - Relay 7
11 Slot A - Relay 8
12 Slot B - Relay 1
13 Slot B - Relay 2
14 Slot B - Relay 3
15 Slot B - Relay 4
16 Slot B - Relay 5
17 Slot B - Relay 6
18 Slot B - Relay 7
19 Slot B - Relay 8
Request
Function
Codes
(dec)
Binary output
status
Binary output
2
status
123 Quality Analayser MC774
1 00, 06
Response
Function
Qualifier
var
var
var
var
var
var
Qualifier
Codes (hex) Codes (dec) Codes (hex)
1 00, 01, 06
1 00, 01, 06
Data
Data
Data
Data
Data
Data
Data
Data
Data
Data
Data
Data
Data
Data
Data
Data
Data
Data
Data
Data
0
0
0
0
0
0
0
0
0
0
0
0
0
0
0
0
0
0
0
0
129 00, 01
1
1
1
1
1
1
1
1
1
1
1
1
1
1
1
1
1
1
1
1
Qualifier
Codes (hex)
00, 17
00, 17
00, 17
00, 17
00, 17
00, 17
1 00, 06
Data
Data
Data
Data
Data
Data
0
T1
T1
T1
T1
T1
T1
T1
T1
T1
T1
T1
T1
T1
T1
T1
T1
T1
T1
T1
T1
Request
Response
Function
Qualifier
Function
Codes (dec) Codes (hex) Codes (dec)
1
0
129
1
0
129
1
0
129
1
0
129
1
0
129
1
0
129
129 00, 5B
242
243
246
248
250
252
Object
Object
Variation
Number
Number
Request
Function
Description
30
0 16-Bit Analog Input without flag
30
2 16-Bit Analog Input with flag
30
4 16-Bit Analog Input without flag
Points for object 30
0 U1
1 U2
2 U3
3 Uavg (phase to neutral)
4 U12
5 U23
6 U31
7 Uavg (phase to phase)
8 I1
9 I2
10 I3
11 I total
12 I neutral (calculated)
13 I neutral (measured)
14 Iavg
15 Active Power Phase L1 (P1)
16 Active Power Phase L2 (P2)
17 Active Power Phase L3 (P3)
18 Active Power Total (Pt)
19 Reactive Power Phase L1 (Q1)
20 Reactive Power Phase L2 (Q2)
21 Reactive Power Phase L3 (Q3)
22 Reactive Power Total (Qt)
23 Apparent Power Phase L1 (S1)
24 Apparent Power Phase L2 (S2)
25 Apparent Power Phase L3 (S3)
26 Apparent Power Total (St)
27 Power Factor Phase 1 (PF1)
28 Power Factor Phase 2 (PF2)
29 Power Factor Phase 3 (PF3)
Points for object 30 cont.
30 Power Factor Total (PFt)
31 CAP/IND P. F. Phase 1 (PF1)
32 CAP/IND P. F. Phase 2 (PF2)
33 CAP/IND P. F. Phase 3 (PF3)
34 CAP/IND P. F. Total (PFt)
35 j1 (angle between U1 and I1)
36 j 2 (angle between U2 and I2)
37 j 3 (angle between U3 and I3)
38 Power Angle Total (atan2(Pt,Qt))
39 j 12 (angle between U1 and U2)
40 j 23 (angle between U2 and U3)
41 j 31 (angle between U3 and U1)
T16
T16
T16
T16
T16
T16
T16
T16
T16
T16
T16
T16
T16
T16
T16
T17
T17
T17
T17
T17
T17
T17
T17
T16
T16
T16
T16
T17
T17
T17
Response
Qualifier Function
Qualifier
Codes
Codes (dec)
Codes (dec) Codes (hex)
(hex)
00, 01,
1
06
00, 01,
1
129 00, 01
06
00, 01,
1
129 00, 01
06
Data
Data
Data
Data
Data
Data
Data
Data
Data
Data
Data
Data
Data
Data
Data
Data
Data
Data
Data
Data
Data
Data
Data
Data
Data
Data
Data
Data
Data
Data
-Un
-Un
-Un
-Un
-Un
-Un
-Un
-Un
-In
-In
-In
-In
-In
-In
-In
-Pn
-Pn
-Pn
-Pt
-Pn
-Pn
-Pn
-Pt
-Pn
-Pn
-Pn
-Pt
-1
-1
-1
T17
T17
T17
T17
T17
T17
T17
T17
T17
T17
T17
T17
Data
Data
Data
Data
Data
Data
Data
Data
Data
Data
Data
Data
42 Frequency
T17
Data
43
44
45
46
47
48
49
50
T16
T16
T16
T16
T16
T16
T16
T16
Data
Data
Data
Data
Data
Data
Data
Data
U unbalace
I1 THD%
I2 THD%
I3 THD%
U1 THD%
U2 THD%
U3 THD%
U12 THD%
124 Quality Analayser MC774
+Un
+Un
+Un
+Un
+Un
+Un
+Un
+Un
+In
+In
+In
+In
+In
+In
+In
+Pn
+Pn
+Pn
+Pt
+Pn
+Pn
+Pn
+Pt
+Pn
+Pn
+Pn
+Pt
-1
-1 CAP
-1 CAP
-1 CAP
-1 CAP
-100°
-100°
-100°
-100°
-100°
-100°
-100°
Fn10Hz
-100%
-100%
-100%
-100%
-100%
-100%
-100%
-100%
1
1
1
1
+1
+1
+1
+1
+100°
+100°
+100°
+100°
+100°
+100°
+100°
Fn+10Hz
100%
100%
100%
100%
100%
100%
100%
100%
300% for -1 IND
300% for -1 IND
300% for -1 IND
300% for -1 IND
51 U23 THD%
52 U31 THD%
MAX DEMAND SINCE LAST RESET
53 Active Power Total (Pt) - (positive)
54 Active Power Total (Pt) - (negative)
55 Reactive Power Total (Qt) - L
56 Reactive Power Total (Qt) - C
57 Apparent Power Total (St)
58 I1
59 I2
60 I3
DYNAMIC DEMAND VALUES
61 Active Power Total (Pt) - (positive)
Active Power Total (Pt) - (negative)
Reactive Power Total (Qt) - L
Reactive Power Total (Qt) - C
Apparent Power Total (St)
I1
I2
I3
ENERGY
Energy Counter 1
Energy Counter 2
Energy Counter 3
Energy Counter 4
Energy Counter 1 Cost
Energy Counter 2 Cost
Energy Counter 3 Cost
Energy Counter 4 Cost
Total Energy Counter Cost
Aktiv Tariff
Internal Temperature
125 Quality Analayser MC774
T16
T16
Data
Data
-100%
-100%
T16
T16
T16
T16
T16
T16
T16
T16
Data
Data
Data
Data
Data
Data
Data
Data
-Pt
-Pt
-Pt
-Pt
-Pt
-In
-In
-In
+Pt
+Pt
+Pt
+Pt
+Pt
+In
+In
+In
T16
Data -Pt
+Pt
T16
T16
T16
T16
T16
T16
T16
Data
Data
Data
Data
Data
Data
Data
T17
T17
T17
T17
T17
T17
T17
T17
T17
T1
T17
Data
Data
Data
Data
Data
Data
Data
Data
Data
Data
Data
-Pt
-Pt
-Pt
-Pt
-In
-In
-In
100%
100%
+Pt
+Pt
+Pt
+Pt
+In
+In
+In
(32-bit value) MOD 20000
(32-bit value) MOD 20000
(32-bit value) MOD 20000
(32-bit value) MOD 20000
(32-bit value) MOD 20000
(32-bit value) MOD 20000
(32-bit value) MOD 20000
(32-bit value) MOD 20000
(32-bit value) MOD 20000
-100°
+100°
Object
Object
Variation
Number
Number
40
40
Points for object 40
0 Analog output 1
1 Analog output 2
2 Analog output 3
3 Analog output 4
4 Slot A - Analog output 1
5 Slot A - Analog output 2
6 Slot A - Analog output 3
7 Slot A - Analog output 4
8 Slot B - Analog output 1
9 Slot B - Analog output 2
10 Slot B - Analog output 3
11 Slot B - Analog output 4
Object
Object
Variation
Number
Number
50
50
Points for object 50
0 Time and Date
Object
Object
Variation
Number
Number
60
60
60
60
*only object 30
Description
0 16-bit Analog output status
2 16-bit Analog output status
T1
T1
T1
T1
T1
T1
T1
T1
T1
T1
T1
T1
Data
Data
Data
Data
Data
Data
Data
Data
Data
Data
Data
Data
0 Time and Date – absolute time
1 Time and Date – absolute time
T_Time
CLASS 0 DATA
CLASS 1 DATA
CLASS 2 DATA
CLASS 3 DATA
Response
Function
Codes (dec)
Qualifier
Codes (hex)
1 00, 01, 06
1 00, 01, 06
129 00, 01
Response
Function
Codes (dec)
Qualifier
Codes (hex)
2
2
7
7
Data
Request
Function
Codes (dec)
1
1,22*
1,22*
1,22*
126 Quality Analayser MC774
Response
Function
Codes (dec)
Qualifier
Codes (hex)
6
6
6
6
Qualifier
Codes (hex)
0
0
0
0
0
0
0
0
0
0
0
0
Request
Function
Codes (dec)
Description
Description
1
2
3
4
Request
Function
Codes (dec)
Qualifier
Codes (hex)
129
Qualifier
Codes (hex)
7
APPENDIX C: EQUATIONS
Definitions of symbols
No Symbol Definition
1
MP
Average interval
2
Uf
Phase voltage (U1, U2 or U3)
3
Uff
Phase-to-phase voltage (U12, U23 or U31)
4
N
Total number of samples in a period
5
n
Sample number (0 ≤ n ≤ N)
6
x, y
Phase number (1, 2 or 3)
7
in
Current sample n
8
ufn
Phase voltage sample n
9
ufFn
Phase-to-phase voltage sample n
10
f
Power angle between current and phase voltage f ( 1,
11
Uu
Voltage unbalance
12
Uc
Agreed supply voltage
127 Quality Analayser MC774
2
or
3)
128 Quality Analayser MC774
129 Quality Analayser MC774
APPENDIX D: XML DATA FORMAT
Explanation of XML data format
All data, which is prepared to be sent at next time interval is combined into element <data>. It comprises of elements
<value>, which contain all information regarding every single reading.
Attributes of element <value> are:
logId: Identification code of data package. It is used as a confirmation key and should therefore be unique for
each device.
app: application type ??
storeType: data type ("measurement" or “alarm”) or quality report??
dataProvider: "xml001" ??
controlUnit: Serial number of the device that sent this data
part: rekorder ??
datetimeUTC: UTC date and time of the beginning of current time interval in which data was sent (yyyy-mm-dd
hh:mm:ss).
ident: ID code of particular reading
tFunc: thermal function (1= ON / 0 = OFF)
cond: condition (1 = lower than; 0 = higher then)
condVal: limit value
almNum: alarm serial number.
unit: Measuring Parameter Unit (V, A, VA, W, VAr …)
tInterval: sampling interval in minutes
dst: (daylight savings time) in minutes
tzone: timezone in minutes
Example of alarms <data> package
<data logId="033350088" app="ML" storeType="alarm" dataProvider="xml001" controlUnit="MC004475" part="E"
datetimeUTC="2009-07-15 21:29:07" dst="60" tzone=" 60">
<value ident="U1 " unit="V " tFunc="0" cond="0" condVal="200,00" almNum="01">100</value>
<value ident="U2 " unit="V " tFunc="0" cond="0" condVal="200,00" almNum="02">101</value>
<value ident="U3 " unit="V " tFunc="0" cond="0" condVal="200,00" almNum="03">99</value>
</data>
130 Quality Analayser MC774
Example of readings <data> package
<data logId="033324218" app="ML" storeType="measurement" dataProvider="xml001" controlUnit="MC004475" part="B"
datetimeUTC="2009-09-16 3:00:00" dst="60" tzone=" 60" tInterval="015">
<value ident="U1 " unit="V ">234,47</value>
<value ident="U2 " unit="V ">234,87</value>
<value ident="U3 " unit="V ">234,52</value>
<value ident="I1 " unit="A ">1,14</value>
<value ident="I2 " unit="A ">1,50</value>
<value ident="I3 " unit="A ">3,58</value>
<value ident="P1 " unit="W ">-0,063e+03</value>
<value ident="P2 " unit="W ">-0,101e+03</value>
<value ident="P3 " unit="W ">0,281e+03</value>
<value ident="P " unit="W ">0,11e+03</value>
<value ident="Q " unit="var ">-1,37e+03</value>
<value ident="E1 " unit="Wh">19620e+01</value>
<value ident="E2 " unit="varh">6e+01</value>
<value ident="E3 " unit="Wh">1303391e+01</value>
<value ident="E4 " unit="varh">2999595e+01</value>
<value ident="ePF " unit=" ">0,0820</value>
</data>
Example of acknowledgement package:
<ack logId="033220002" datetimeUTC ="2008-01-31 23:00:50:000"></ack>
131 Quality Analayser MC774
Printed in Slovenia • Subjects to change without notice • GB 022.601.446
132 Quality Analayser MC774