1
Professional
User Manual
Euronav Limited, 20 The Slipway, Port Solent, Portsmouth, Hampshire, England, P06 4TG
Tel : +44 (0) 23 92373855, Fax: +44 (0) 23
1 92325800, web www.euronav.co.uk
-
Disclaimer
This product is designed to ease and speed up navigational calculations. It is not
designed to replace official printed paper charts, nor the navigators responsibility to
exercise common prudence.
Neither Euronav, nor their distributors accept responsibility or liability either to the
product user or their estate for any accident,
accident, loss, injury or damage whatsoever
arising out of the use or of liability to use this product. You may be required by law to
carry suitable paper charts for the passage intended.
This product uses data copyrighted to third parties. This copyright must at all times be
respected; failure to do so may result in civil or criminal prosecution against you.
Insurance
The security device (or dongle) allows you to access seaPro and the Electronic
charts you have brought. It has significant value since it represents the replacement
cost of seaPro and all the electronic charts, which require its presence.
The dongle requires no special attention over and above the normal caution you
would exercise when taking a valuable device abroad a vessel, but you should protect
it against immersion, physical and electrical damage.
It is not possible to replace lost or stolen dongles without charge for the full
replacement value of both software and charts, therefore in addition to exercising
due care against the risk of theft and loss, you must make sure that your dongle is
insured against these risks. Contact your boat insurer for details of cover available.
To help you when upgrading your system or ordering more charts record your
dongle number below:
Dongle Serial Number: ……………………….
We strongly advise that you keep all original paperwork, installation CD’s and chart
release codes together. This will enable you to simply re-install programs and charts
in the event of you losing your computer or experiencing a hard-drive failure.
-
2
Introduction
Welcome
Thank you for choosing seaPro.
SeaPro is advanced and powerful charting and navigation system that combines
paper-quality charting with practical navigation features including tidal planning,
position monitoring and navigation management.
this
is manual
About th
This manual assumes you have ;
•
A working knowledge of navigation and are capable of navigating using
traditional means
•
Reasonable knowledge of Microsoft Windows operating systems
What seaPro will not do for you ;
•
It will not take away your responsibility or decision making for navigation.
•
It does not give any more information than could be obtained by
conventional means.
•
It does not remove the need for checking that your passage plans are safe.
•
It does not remove the need to keep a proper log book.
•
It does not remove the need to keep paper charts for the journeys planned.
Please take time to read this manual so that you get maximum benefit from seaPro.
-
3
-
4
Contents
-
1.
Getting Started
2.
Using seaPro
3.
Charts
4.
Waypoints, Routes & Passage Planning
5.
Log
6.
Tides
7.
Setup
8.
Radar
9.
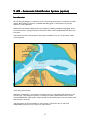
AIS – Automatic Identification System (option)
10.
Weather
11.
Appendix A – Step-by step Installation guide
12.
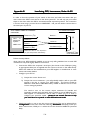
Appendix B – Connecting a GPS and Instruments
&
Appendix C – Frequently asked questions
5
-
6
1
Getting Started
Quick Start
seaPro is designed to be quick and easy to install on most standard PCs. You are probably
keen to get going straight away so if you are reasonably familiar with computers, can answer
yes to the following questions and have already purchased your charts, it shouldn’t take you
any longer than about ten minutes to install seaPro and your charts and be up and running.
step--by
by--step guide, see Appendix A “StepIf you prefer to follow a full step
“Stepbyby-Step Installation” at the back of this manual.
Before installing seaPro check that you have a PC with the following ;
Microsoft Windows 95 edition 2/ 98/ME/ 2000/ NT4.0 or XP
A free 9-pin serial port for connection to a GPS
Additional serial ports (or USB ports that can be fitted with a USB to serial
converter) to interface to instruments and/ or Radar NMEA data.
A minimum of 300 Megabytes (MB) of free hard disk space (note the exact
amount of space required will depend on the operating system being used and
the charts required).
A CD-ROM drive to install from the seaPro CD.
A parallel (printer) port or spare USB port to connect the Security device
(dongle).
Recommended system requirements
SeaPro is a graphics program and operates best with a high resolution (1024 x 768 or
better) screen with high resolution graphics card. As memory is extensively used for chart
redrawing a minimum 256MB of RAM is highly recommended.
Installing seaPro
Note: If you already have a version of seaPro installed on your PC, you must uninstall that
version before installing this new one. DO NOT PLUG IN THE DONGLE UNTIL YOU
HAVE INSTALLED THE SOFTWARE!
1) Quit all other applications and programs you may be running so that they do not
interfere with the installation process.
2) Insert the seaPro CD-ROM in your computer’s CD-ROM drive. Most standard
CD-ROM drives will identify that the disk has been inserted and will start the
seaPro presentation program automatically. Note: If your CD does not auto-run,
this may be because your CD-ROM drive is not set up to auto-detect CD-ROMS.
For further help, please refer to the step-by-step instructions in the Appendix.
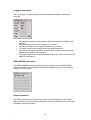
3) Select an appropriate language from the list
4) Select the Install Euronav products and upgrades option.
5) Select the seaPro Installation option.
6) Choose the appropriate language from the list and press OK.
7) Follow the instructions on screen to install.
-
7
8) You will then be asked to restart your computer.
9) Once your computer has restarted plug in the dongle and run seaPro.
SeaPro should now be successfully installed. Once the installation is completed you
will have the option of reading the Readme file. This file contains last minute
information and some Frequently Asked Questions. Please read this information.
Installing Charts
Once the program has been successfully installed and you have familiarized yourself with it
using the tutorial, the next step is to choose and install your charts. How you add charts to
your seaPro program depends upon what kind of charts you have ordered. SeaPro is able to
support multiple chart formats, with both vector and raster charts.
Livecharts (Vector charts)
If you have ordered vector Livecharts, you will be issued with either an unlock code or an
“ems” unlock file to unlock them from your seaPro CD. (Note: an ems file is simply an
automatic way of installing multiple charts rather than having to enter many unlock codes).
•
Place the seaPro CD in the CD ROM Drive
•
The installer should self-start. Select a language option then choose UNLOCK and a
small screen will appear with a selection menu.
•
To unlock charts with an unlock code ; select the Unlock menu and Unlock by codes or
features. Enter the 16 digit unlock code and then click unlock.
•
To unlock charts using an “ems” file, save the file to a floppy or temporary folder and
close all programs. Insert the seaPro CD-ROM and allow it to auto-run. Select an
appropriate language from the list and then select the LivechartLivechart-chart installation and
Unlock option. Then select an appropriate language from the list and select Unlock from
the main menu. From the drop-down menu select Unlock by file. Locate the “ems” file
using the browse button and then click on Install .
When the charts have been loaded you will need to create a folio (electronically link the
charts together). If you are not automatically prompted to do this then select the Chart
menu and Build folio option. Click the Create Folio button and the charts will be linked.
A full stepstep-byby-step guide is given in Appendix A.
A.
-
8
Raster Charts
When you order Raster charts you will need to give
gi ve the ARCS permit and PIN number
which are provided on a separate sheet with seaPro. This is a license number unique to you,
please keep a record of this as you will need to use it when ordering further charts.
You need to have your Permit disk and Area CD and chart update disk if issued.
To install Raster charts (either ARCS, Seafarer or BSB), start seaPro and select the Chart
menu and then Install Charts.
Choose the ARCS/HCRF Raster Chart box and click Next .
Follow the installation wizard by clicking Next .
If you are installing charts for the first time, choose Yes - installing new permits. (If
you are installing additional charts and already have your permit installed then
choose No and follow the wizard through the installation).
chartt permits for new chart installations.
Choose Install char
Choose Install Permits from disk (the permit disk is the floppy disk supplied with
your ARCS CD ROMs). Insert the Floppy disk in to the floppy drive.
The disk should now be read and the charts installed automatically.
When complete click on the Finish button.
After installing the permits follow the wizard which will guide you through
installation of the charts and/or updates.
You now need to ‘build a folio’ which will tell seaPro you have new charts installed.
Choose the Chart menu, then Folio and choose Build Folio.
Connecting to a GPS
Connect the supplied serial data cable to your NMEA0183 GPS, according to the
accompanying wiring instructions. seaPro is configured to expect NMEA0183 input from
serial port COM1: as standard. If you are using another serial port, you will need to set this
up from within seaPro once you have started the program. See Appendix B at the back of
the manual for wiring and installation details.
Now you should be ready to use seaPro. Once you have indicated which serial port the
serial data cable is plugged into, you should see the GPS LAT and LNG position in the
navigator display, with a green ‘traffic light’ and your vessel’s position should be shown on
the chart. See Frequently Asked Questions at the end of this guide for more information if
this is not the case.
-
9
Getting Help
seaPro is a comprehensive navigation system and therefore may appear complex to
inexperienced users. For this reason, we suggest you take things slowly and use caution
when operating the system. Do not change settings unless you fully understand what you are
doing, and have read the relevant section of this User Guide.
seaPro has been designed to install and operate easily on most PCs, but there may be
occasions when you obtain unexpected results. There are a number of resources available
which will help you to identify and rectify any problems you may experience.
1) This User Guide is the prime source of help from the seaPro system. The user guide is
not intended as a basic manual for computers or their operation, nor as a textbook on
navigation. It is assumed that you are familiar with both the operation of Windows
operating system and of normal navigation practices. You should ensure you have read
the User Guide thoroughly before trying to obtain further help.
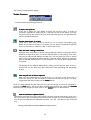
2) “Read Me First” files – When seaPro is first installed, a file entitled README.TXT is also
added to your system. The file contains important up-to-date information which may not
be included in the User Guide. The file is not only helpful should you experience any
problems but should be read carefully to help familiarise yourself with the programme.
To view the file, select the “seaPro Read Me First ” icon on your computers desktop, or
select it from the Windows Start menu.
3) seaPro supports “Tool Tips” – If you are not sure what a particular button “does”,
move the mouse cursor over it and wait a moment. A small window will pop-up which
gives information about the function of that button.
4) OnOn-line help – (Available in English only) seaPro is equipped with an on-line help system
which is available while the program is running. To access the help system, select the
Help option and from the drop-down menu, select the item you need help on.
5) Tutorial - We have included a tutorial within seaPro, which guides you through some
common tasks and will help to familiarize you with the program. To run the tutorial,
select the Help option, and then select Tutorial – the navy blue Tutorial should then
appear on your screen.
If you have exhausted these resources and still need help:
•
Contact the dealer you bought the product from – they are familiar with seaPro
and should be able to guide you through any problems you are having.
•
If you are unable to obtain help from your dealer, you may contact Euronav
Navigation; see our contact details on the front page of this manual.
Note: support is limited to the seaPro navigation product. If your problem is with
basic computer operation or Microsoft Windows problems, WE WILL BE UNABLE
TO HELP YOU.
-
10
2
Using seaPro
Starting and Exiting seaPro
Close down any non-essential programs before running seaPro. Although it has been
designed specifically for Windows multitasking, you should consider that each program
which is running uses memory (RAM) and processing power even if it is minimized. By
closing any non-essential programs down, you will make the maximum amount of PC
resources available to seaPro, thus ensuring optimum performance.
Whenever you installed seaPro, the installer will also have installed a file entitled
README.TXT. This is a very important file, containing up-to-date information about seaPro
that may not be included in this printed User Manual. Be sure to read it for any last minute
information.
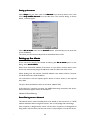
Starting seaPro
How you start seaPro depends upon choices you made when installing it. You may have
chosen either one of following:
•
On the Desktop – simply double click on the seaPro Icon
•
At the top of the Start menu – Click on the Start button and move the cursor up
the Start menu until it is over the seaPro entry, click again.
There will be a short delay while the program loads. A disclaimer window will then appear
on the screen.
You may also use buttons on the disclaimer window to access the on-line help system, or to
confirm which version of seaPro you have and which options have been included.
On the disclaimer screen there are also two “tick boxes”. One enables you to turn off the
start-up sound. The other tick box concerns how seaPro will start up in the future, when
this box is ticked, seaPro will remember previous settings. Sometimes, this is not desirable,
so you may un-tick this box. seaPro will then start in its ‘out of the box’ mode.
Exiting seaPro
In common with most other Windows programs, there are several ways to stop
running seaPro.
seaPro. These are often referred to as ‘quitting’ or ‘exiting’ the program. All
of the following methods are valid ways of exiting seaPro.
Click on the button marked with an “X” in the top right hand corner of the seaPro
window.
Select the Chart option from the main menu and from the drop-down menu select
Exit.
Click on the flag symbol in the top left hand corner of the seaPro window and from
the drop-down menu select Close.
whilst holding down the Alt key, press the F4 key on your keyboard.
Quitting seaPro in any one of these ways closes all of its files down properly and releases
RAM and system resources to other programs. You should never simply switch off your PC
-
11
while the seaPro program or any other program is still running. This may result in data
corruption. Windows provides a Shut Down feature, accessible from the Start menu, which
you should always use.
-
12
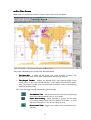
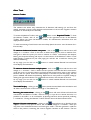
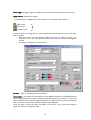
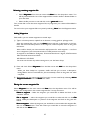
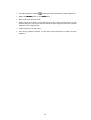
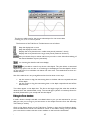
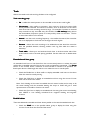
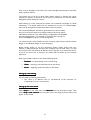
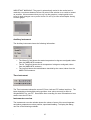
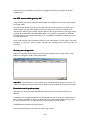
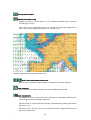
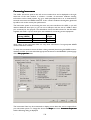
seaPro Main Screen
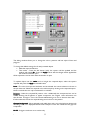
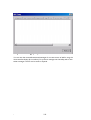
When seaPro is started, you will see a screen similar to the one shown below.
The Screen is divided up into several areas, described below:
•
The Menu Bar – is where you can access most of the functions of seaPro. The
function of each entry in the menu is described in the following sections.
•
The Graphic Toolbar – displays the latitude (LAT) and longitude (LNG) of the
mouse cursor as you move around the chart. It also displays local and UTC (GMT)
time. The Graphic Toolbar gives you quick and convenient access to the following
frequently used functions:
Most icons are toggle (on/off) indicated by a green/red light.
The Measure Tool - Allows measurement of distances and bearings
from the vessel and between two or more points.
Chart AutoAuto-scrolling – When switched on (green), this will keep
your vessels position within the chart window at all times – to scroll
elsewhere click again to turn auto-scrolling off (red).
Show Vessel Track. Toggles your vessels track on/off (shown as a
red line).
-
13
Marker Flag - When placed on your chart will give constantly
updated steering information for reaching its position – use in
conjunction with the panel and Marker Flag option.
ARPA radar targets – when connected to suitable radar, seaPro
displays radar targets on the charts.
Chart AutoAuto-detail – toggles detail shown on charts. Auto-detail helps
to give a clear display by automatically selecting the level of detail
according to the level of zoom. If turned off you will force all detail
to be shown, which could create a cluttered screen when zooming
out.
Folio Mode – Off – displays the current selected chart only.
On – automatically selects charts for you.
Raster
Rast er chart 1:1 zoom – shows raster charts at a scale of 1 to 1.
Show Navigator Window – details on GPS fix.
Alarm Status. Click on this to display details of any alarm state.
The Main T
Toolbar
oolbar – the grey toolbar provides further sets of buttons, grouped to
particular tasks.
- provides a quick
The Main Toolbar and easy way of accessing often used functions within seaPro.
When you click on one of the buttons on the Main Toolbar, it is replaced by another
toolbar, which contains options specific to that function. Each of the toolbars are shown
below.
Each toolbar includes a button entitled Main, which you can click on to return to the
Main Toolbar.
The button entitled Panel is a special case of toolbar in that it is called upon from the
main Toolbar, but behaves differently from the other toolbars. The Panel is described
fully in the Setup chapter.
The View Toolbar This Toolbar gives access to seaPro’s View feature, whereby you can easily save and
recall views of charts.
X--Line Toolbar The X
When passage-monitoring, seaPro shows an extended heading line ( X-line) in front of
the vessel. This is a projection of its current course over the ground (COG) or Gyro
heading, the length of which indicates how much distance is likely to be covered in a
given time.
The Route Toolbar This Toolbar is used in planning and modifying routes.
It can either be accessed from the Route button on the main Toolbar, or by choosing
Route from the main menu and then selecting New or Modify from the drop-down
menu. See the chapter on Waypoints, Routes and Passage Planning chapter for more
details.
-
14
Floating Toolbars
In addition to the toolbars described above, seaPro also offers Floating Toolbars. These
also combine related functions, but are designed to be moved around the screen into
convenient positions. Unlike the fixed Toolbars, the Floating Toolbars are not accessed
from the Main Toolbar, but as per the instructions below.
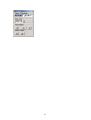
The Tidal Curve Toolbar
This toolbar is accessed by selecting the Tides
option from the main menu and Tidal curve
from the drop-down menu. The tidal Curve
Toolbar allows you to view times and heights
of high and low water at selected ports. Tidal
Curve functions are explained in the Tides
chapter. Note all tides are referenced to UTC
which is almost identical to GMT.
The Tidal Atlas Toolbar
This toolbar is accessed by selecting Tides from the main menu and Tidal Atlas from the
drop-down menu. This toolbar lets you view tidal streams for areas where that data
exists. The tidal atlas is also used to indicate the effect of tidal streams on planned
passages, providing full tidal-passage planning functions.
The Measure Toolbar
This toolbar allows easy and quick measurements to be taken from the charts on screen.
It is also able to show the magnetic variation and rate of change at any point on Earth.
•
The Chart Window – this is the main area of the program, devoted to displaying
one or more high-quality electronic charts.
•
The Instrument Panel – this is where incoming data from navigation instruments is
displayed. It may be turned on or off as you desire.
Chart Windows
A chart window is simply an area of the screen, which is filled with a chart. It is
characterized by having a title bar at the top which shows the following information:
•
•
•
•
•
•
Chart Number – each chart has a unique number e.g. BA2182a
Scale – e.g. with a 1:75 000, one centimeter on the original paper chart equals 75
000 cm on the Earths surface.
Depth units – either Metres, Feet, or Fathoms and Feet
Zoom Factor – indicates the extent to which the chart has been “zoomed into”.
Horizontal datum – this indicates whether the chart has been prepared to the same
horizontal.
Chart Name
Each chart window may contain one chart, unless seaPro is operating in Cell Mode.
-
15
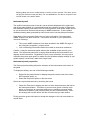
Selecting Charts
Each chart window is automatically filled with the world overview. You then load your
desired chart in one of two ways:
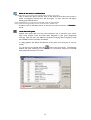
•
•
If you know the chart number, select Chart from the main menu and Select from
the drop down menu. The Select a Chart to view dialog will then appear on your
screen. Select the chart you wish to load and then Finish.
Move the mouse cursor over the area covered by the required chart ad click
once with the left button. The required chart will then be displayed. This may
be difficult if the required chart is a large-scale chart and therefore very small,
or if there are many other charts in the same area. If this is the case, zoom in to
the area your desired chart is in (see below) until it is easier to identify the
chart you require.
Multiple chart windows
seaPro allows you to have more than one chart window open. Your position, log and route will be
shown on all windows at the same time. You can view different charts, different parts of the same chart
or even the same part of the same chart but at different scales, in the windows. You may have just one
window open, or as many as you like (subject to your computers processing ability). You can use this
facility to your advantage in several ways:
When passage planning, open three or more windows to display your points of departure
and arrival in large scale, with a smaller scale overview of the entire route.
When en-route, use one or two windows to view your current passage in large or small
scales and another window to plan a different passage.
This facility is particularly useful because it saves the navigator a large amount of zooming-in
and out and moving around charts.
Opening a new chart window
To create a new chart window, select Chart and New Window . seaPro will create a
new window, pre-loaded with the world overview chart. You may then select a chart
to view.
ReRe- sizing chart windows
Chart windows can be resized by moving the mouse cursor over the edge of the window
until it changes to a double-headed arrow. To do this, click and hold down the left mouse
button and drag the window to the desired shape. Then release the mouse button. SeaPro
will now re-draw the chart within the new shaped window. You will notice that if you get
practiced at dragging the edge of the window at one of its corners as opposed to along its
edges, you can resize it two dimensions at once.
Rearranging chart windows
Chart windows can be moved in the usual Windows manner (by clicking on the chart
windows title bar with the left mouse button, holding the button down and dragging it to the
desired location).
When you click within the chart area of a chart window, or click on its title bar, that chart
becomes the current chart window. It may overlap or even hide any other chart windows
-
16
on your screen. If you want to view a chart that has become hidden you can do one of the
following:
• Resize one or more chart windows yourself to reveal the hidden chart.
• Use one of the automatic rearrangement methods described below.
To automatically rearrange the chart windows, choose one of the following options
from the Window menu:
o
o
o
Tile horizontal – to tile the charts within the available client area of the main
menu with a bias towards minimizing the number of window columns. This tends
to suit horizontal format charts.
Tile Vertical – to tile the charts within the available client area of the main
window with a bias towards minimizing the number of window rows. This tends
to suit vertical format charts.
Cascade – to produce a series of diagonally overlapped chart windows, this is not
especially useful for navigation and will make chart redrawing slow, but may be
useful if you want to keep several charts on-screen while still keeping their size
large.
Closing Chart Windows
You can close a chart window in any one of three ways:
• Click on the button marked with an “X” in the top right hand corner of the
chart Window
• Click on the button marked with a dot in the top left hand corner of the chart
window and select Close.
• Press the F4 key on your keyboard, whilst holding down the Ctrl key.
The Chart Context Menu
If you right-press on the title bar of the current chart window, a menu will appear. This
allows you quick access to functions, some of which relate to that one chart only.
You may use the Chart Context Menu for several different functions:
•
To zoom out
•
To display information about the chart in that window,
•
To change the way the chart in that window is displayed,
•
To query mark and line features on Livecharts,
•
To query the current log file or the route being planned.
The functions available from the Chart Context Menu are described in the relevant sections.
-
17
Movingg around charts
Viewing and Movin
One of the major benefits of the seaPro navigation system is the ease and flexibility involved
in viewing and moving around your charts, and in ensuring a suitable amount of chart detail
is always shown. All moving and zooming may be done with the mouse, over the chart,
without the need to click on fiddly ‘zoom in’ and ‘zoom out’ buttons away from the chart
area.
Additionally, there are some useful keyboard shortcuts to speed up things even further,
although these may not work with all “compact” keyboards on some laptop computers.
Zooming in
To zoom into a particular area of a chart •
Move the mouse cursor to a point bottom-left or top-right of the area you want to
look at.
•
Then click, and while holding the left mouse button down, move the cursor towards
and past the area in question
•
When you have outlined the area you want to zoom into, release the left mouse
button and seaPro will fill the window with a larger scale view of the area you have
defined.
Note; that the shape of the box you create as you move the mouse is constrained to be
the same aspect-ratio as the window you are working in. this is to ensure you fill the
maximum area of the window with chart data.
Overzoom
There is a maximum level that you may zoom to each chart. This is because to zoom in
further would exceed the accuracy of the original survey and chart production method, and
so would be unsafe for navigation.
In seaPro using Livecharts, it is possible to enter a mode called Overzoom, where it is
possible to zoom in much farther than normal. This is of particular use in fishing and diving
applications, where there is a need to use seaPro large scale plotting facility (usually in
conjunction with Differential GPS) as opposed to general navigation.
Note: at these zoom levels it is unsafe to use the system for navigation, so a warning is
displayed. At very high zoom levels, you may experience odd result as artefacts from the
chart creation process appear.
Zooming out
To zoom out:
-
•
click once over the chart window with the left mouse button and seaPro will zoom
out one level.
•
Click again and it will zoom out again, you can continue doing this until you are able
to view the whole chart.
18
Panning
When you move the mouse cursor close to the edge of the chart window, you will find that
it changes into a relatively large blue arrow. Clicking with the left mouse button, while the
cursor is in this state, causes seaPro to pan the chart in that direction.
Keyboard Shortcuts
In addition to using the mouse, there are several keyboard shortcuts that may be used to
move around the current chart window:
PgUp – Zooms in
PgDn – Zooms out
Home – zooms out giving a full view of the current chart
End – Zooms right out to the world overview chart.
Using the Arrow keys will pan the chart in the relevant direction.
On some laptop computer displays, you may find the mouse cursor difficult to see in certain
lighting conditions pressing the F3 key will center the mouse cursor in seaPro’s window so
you may locate it more easily.
Note that on some laptop computers, with non-standard compact keyboards, some of these
keyboard shortcuts may not work.
1:1 Zoom
With raster chart types, there is a facility called 1:1 Zoom. Selecting this feature shows
raster charts at a 1 to 1 scale with the original paper chart, for maximum clarity.
There are two ways of selecting 1:1 zoom :
•
button on the Graphical Toolbar. This affects all chart windows, so
Click on the
all chart windows containing raster charts will zoom to 1:1.
•
If you only wish to view the chart in the current window at 1:1, right-click on the
Title Bar to call up the Chart Context Menu and then select Raster (HCRF/BSB)
Zoom 1:1.
Note: on some raster chart types and at some scales, selecting 1:1 zoom may result in
the chart window showing only a very limited geographical area, if this is the case, it is
prudent to either have another smaller scale view of the same area visible in another
window, or at least, to make the current window as large as possible. This is especially
important for fast moving vessels.
If you make a mistake when zooming or panning, you can re-draw the previous
view by using the F2 key
Views
SeaPro allows you to save and instantly recall views to your current chart window.
To save a view:
-
19
•
Select the required chart area using the normal method
•
Click on the View button on the Main Toolbar and then click on the Save button
•
Click on the number you would like to save the view under.
To recall a view, simply click on the View button on the Main Toolbar to call up the View
Toolbar and click on the number of the view you would like to see.
Chart Auto Scroll
When seaPro is receiving position data from a GPS, the vessel position is shown overlaid
onto the electronic chart. Selecting Auto Scroll means that seaPro will move the chart to
ensure that the vessel is always visible.
button on the Graphical Toolbar. When it is on,
Chart Auto Scroll is selected from the
the button shows a green indicator, when it is off, it shows a red indicator.
Note; This is a global setting, i.e. this will ensure that the vessel is shown centred in all chart
windows.
There are times when this option is not desirable, for example, when monitoring a passage
in one window, and planning a route in a different geographical area in another window.
Because of this, chart Auto Scroll may be disabled for the current chart window by right
clicking on the Title Bar to select the Chart Context menu and selecting Properties and then
Prevent
Auto--Scroll. Once Auto Scroll is disabled, this will remain in effect until you either
Pre
vent Auto
re-enable it, or you close the chart window.
-
20
Other Tools
Measure Toolbar
The measure tool allows easy measurement of distances and bearings (to and from the
vessel), estimates of great circle distances and estimates of the current magnetic variation
anywhere on the earth (at zero altitude).
button on the Graphical Toolbar. To close
To access the Measure Toolbar, click on the
button at the right-hand corner of the Measure
the Measure Toolbar, click on the
Toolbar. When you close the Measure Toolbar, all measurement information that was
displayed will be erased.
To view the meaning of each button use the tooltips (leave the cursor over the button for a
few seconds).
button and the cursor will
To measure the distance between two points – click on the
change to a “crosshair”. Click on the chart to select the point you want to measure from,
and again to select the point you want to measure to. seaPro will measure the distance,
bearing and reciprocal bearing and report it at the bottom of the Measure Toolbar. If Text
Label Display is switched on (see next page) you will also see a small box showing the
distance and bearing.
At any stage, you can click on the
button to switch between Rhumb Line and Great
Circle display and calculation.
button and the cursor will
To measure distances between multiple points – click on the
change to a “crosshair”. Click to select the start position and click the left mouse button,
move the cursor to the next position and click the left mouse button again; a line is drawn
between the two points and if Text Label Display is switched on (see next page), the first
point is labelled with distance and bearing. Repeat this as many times as required, ending by
clicking the right mouse button. Te total distance is shown in the title bar of the tool.
At any stage, you can click on the
button to switch between Rhumb Line and Great
Circle display and calculation.
button causes the text labels to be switched on and
Text Label Display – clicking on the
off. When the button has a red cross through it, Text Label is off.
button will erase all lines and text boxes
Removing the measure lines – clicking on the
created from the Measure Toolbar, without closing it. If you do not remove the lines, it is
possible to use seaPro to do a manual fix, by plotting lines from known points ad producing
a ”cocked-hat”. Closing the Measure Toolbar will also remove all lines and text boxes.
Magnetic Variation measurement – clicking on the
button allows you to find the current
magnetic variation at any place on Earth. The cursor will change to a “crosshair”, which you
may place over the desired location and click again, seaPro will then generate a small box
close to this position, containing the current magnetic variation at that location. The box
-
21
also states the current annual rate of increase or decrease (shown with a minus sign). Repeat
as required.
As with the distance measurement the information remains on the screen until it is either
erased or the Measure Toolbar is closed.
Note: this is only a prediction model, and should be regarded as liable to be incorrect – but
probably no more so than the data supplied on paper charts.
EnEn- route tools
Marker Flag
The
button on the Graphical Toolbar turns the Marker flag facility on and off. When a
manual marker flag is placed on a chart, the instrument panel can give constantly update
steering information for reaching that position, and NMEA sentences can be sent to external
instruments such as RADAR display so that the marker can be used as a RADAR “lollipop”.
One marker flag can be active at a time in seaPro.
-
•
When the light in the top right corner of the button is red the facility is off.
•
Left-clicking the button while in this state causes the cursor to change to a crosshair
while over any chart windows; left-click on a chart to drop a maker flag there.
•
Right-clicking the button while in this state causes a manual entry dialog to be
displayed; type in the absolute position of the marker flag or type in a bearing and
distance from the current vessel position then click the apply button.
•
When the light in the top right corner of the button is green, the facility is on. The
marker flag is shown on any charts covering its position, the marker flag instrument
is operative and configured marker flag NMEA sentences will be transmitted if the
marker flag serial port has been enabled.
•
Left or right clicking the button while in this state cancels the active marker flag.
22
Alarms
seaPro allows the current position of the vessel to be detected with respect to user defined
area(s), the alarm can be triggered when:
•
The vessel enters an area (exclusion zone)
•
The vessel leaves an area (anchor)
•
The vessel enters or leaves an area.
The alarm is given by an audible indication and a message in the alarm status box (alarm will
go red to indicate a changed condition).
Note: this is a different system to the radar alarm that detects external APRA targets
entering and alarm area.
Warning: if you have a sound card fitted you may not hear the audible alarm if the audio
system is switched off or volume turned down. Due to the ambient noise level, you may not
be able to hear the audible alarm unless connected to an external alarm system.
Safety: the alarm system should only be used to assist with normal good watch
keeping/navigation practices and not to replace them.
See Chapter 7 Setup for more details.
-
23
-
24
3
Charts
Using Charts with seaPro
seaPro supports many different chart formats including various raster and vector types.
Currently the following formats are supported;
Vector ; Livecharts, S57
Raster ; ARCS, SeaFarer, BSB
If you have not yet purchased your charts, you may have some questions regarding which
make and type of charts to purchase and which type of correction service to use.
Raster and Vector Charting
Electronic charts are available in two main types – raster and vector. In some cases, they
appear to be quite similar without too much noticeable difference, until you take a closer
look.
Raster Charts
A raster-scanned electronic chart is like an electronic photocopy of a paper chart. On
screen, it looks identical to a paper chart and is produced by the British Admiralty in England
and by official hydrographic offices in a number of other countries. Raster charts are
available in single charts or geographical folios and are distributed on CD-ROM.
Raster charts are normally produced by passing the original paper chart through a device
called a scanner that rasterises the chart i.e. it makes a computer file which contains the
visual information form the chart stored as a series of dots of varying colour and density.
Raster images are also larger in file size. They take longer to print and consume more disk
storage space. Raster images cannot contain any "live" data. For example, when text is
rasterised it is no longer editable because it is now seen as an "image", a collection of
coloured dots.
Raster charts include
•
•
•
ARCS - A worldwide chart set derived directly from the master paper chart films of
the UK Hydrographic Office – giving the best possible accuracy. The format is
known as HCRF.
Seafarer Charts – HCRF format from the Australian Hydrographic Office, covering
Australasian waters
BSB charts are raster charts scanned from NOAA (National Oceanographic &
Aeronautical Administration) in the USA. Because they are royalty free, these charts
represent good value for money.
BSB format charts covering USA waters are now marketed by Maptech as
ChartKit/NOAA charts. Do not confuse these with Maptech ChartPacks which are
an older, less useful format and which will not work with seaPro.
Other companies are starting to release raster charts in BSB format: although
Euronav can offer no guarantees due to differing interpretations of the format by the
manufacturers, some of these charts work with seaPro. Customers are advised to
-
25
check with the manufacturers before purchasing non-Maptech BSB format charts for
use with seaPro.
Vector Charts
To create a high-quality vector chart a paper chart is digitised accurately by tracing the
outlines and exact positions of all the features on the scanned raster chart into a series of
mathematical representations (vectors). Features on the chart are stored onto separate
layers of information.
Storing these types of data on separate layers makes it possible for the resulting vector chart
to have some “intelligence” i.e. software is able to display information from the chart
selectively, or indeed may interrogate the vector chart, for example “what is the charted
depth of water 100 metres ahead of the current vessel position?”
Vector charts tend to have smaller size files and can be zoomed in to a greater extent than a
raster chart. The first thing to notice is the clarity of the vector charts. Due to their
mathematical nature, vector charts remain sharp and clear at all zoom levels or orientations.
Vector charts incorporate navigationally useful “intelligence” in their format, and due to the
way they are constructed can require far less storage space, can display faster, and may be
easier to update than raster charts.
Those who have used vector charts in the past are undoubtedly familiar with a vector charts
ability to hide and display different “layers”. Layers include things like depth contours, land
features, navigation aids etc. the ability to hide or display different layers makes it easier for
the mariner to only display the information that is relevant to him/her.
Vector formats include:
•
•
•
Livechart vector charts – very high quality charts based on BA paper charts. They
are numbered the same as the paper chart it was taken from.
S57 Vector charts (including encoded Primar charts) - official digital data from
Hydrographic Offices. This data will eventually replace paper charts for commercial
vessels but are currently in limited supply. Please contact Euronav for more
information on this format.
Eurodems – an additional layer for the above vector formats to show chart relief
rendering (this is similar to the atlas style contouring and colouring and is used for
passenger information systems and land based applications). Some low-resolution
data is provided with the standard package and high quality data is available as an
option.
The Chart Folio
To manage and work with the charts you may wish to use, seaPro needs to create a Chart
Folio. This forms a complete list of all charts installed in the system. The charts can be
shown on your display as folio boxes, which represent the boundaries of each chart. It is
possible to work with just a single chart (folio mode OFF) or for seaPro to automatically
select the best chart (folio mode ON).
Note: You must create a new folio each time you install or uninstall a chart; failure to do so
may cause unexpected results and prevent selection of any newly installed charts.
-
26
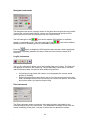
Creating the Folio
1) Select Chart from the main menu and Folio from the drop-down menu. You will be
presented with a dialog box from which you can choose which chart types to rebuild
into the folio.
2) Select the Create Folio option to build the folio, seaPro will then examine each chart in
turn and add it to your folio.
If you have a lot of charts, this operation may take some time.
3) When the dialog reports it has completed building the folio, click the Finished button.
seaPro will look for charts in the folder you have specified, if you believe you have more
charts than the Create Folio dialog reports, check that you have installed them into the
folders you have specified (check the Chart Directories tab on the Settings dialog, which is
on the Chart Menu).
Using Folio Mode
A major feature of seaPro is it’s ability to operate in folio mode, both while planning
passages and while monitoring your vessels progress.
This means that when you are moving across a chart and reach the edge of it, seaPro will
automatically choose the next available chart. If the next chart is at a larger scale, seaPro will
choose that in preference to a smaller-scale chart. If the next chart available is at a smaller
scale than the current chart, seaPro will use that one.
Similarly when zooming in and out, seaPro determines which is the best scale to use from
those available. Where other electronic navigation programs expect you to always choose
charts by number, seaPro automatically shows you the best chart for the area you are
looking at.
With seaPro, folio mode even works with different chart types, allowing you to specify
which kind of chart (raster of vector) you wish to use as preference. seaPro can display
multiple chart formats at the same time, these settings are controlled within the Folio dialog
and Chart – Settings – Chart Directories dialog (tick which formats to use).
Folio mode is switched on and off by clicking on the
button on the Graphical Toolbar.
When folio mode is on, the “light” on the button is green. In this mode seaPro will
automatically select the chart. When folio mode is off the “light” is red and seaPro will only
use the chart selected. Folio mode may also be turned on and off by selecting Folio from the
Chart menu and clicking on the Enable Folio setting.
Folio mode is a global setting i.e. when switched on, it affects all chart windows. It is not
possible for safety reasons to have some windows operating in folio mode and some not.
-
27
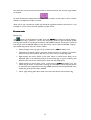
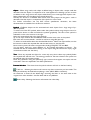
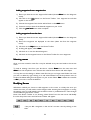
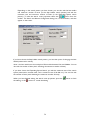
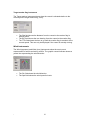
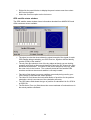
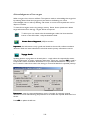
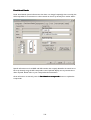
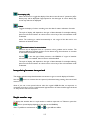
Chart Overlays
SeaPro supports the use of overlays. The Overlay feature allows the user to add his/her own
information that may be shown overlaid on navigational charts.
Overlay features enables;
• The addition of text, lines, marks and areas to be drawn
• the display of up to two overlays at the same time
• enhanced editing features
• the ability to save and load an infinite number of overlays (subject to the amount of
disk space available).
• A chart corrections module – allowing you to perform Notice to Mariners (NM) on
both raster and vector charts yourself.
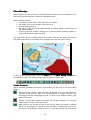
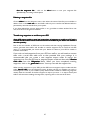
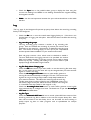
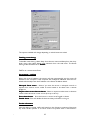
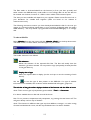
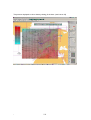
The image below shows a screen captured from seaPro. Not that the point, line and area
type data overlaid onto an Arcs Raster chart (overlays also work with vector charts).
To bring up the Overlay toolbar, select the Chart menu and Show Overlay Toolbar from
the drop-down menu. The floating toolbar will then appear on your screen.
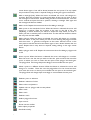
Toolbar Functions
Unless otherwise specified the functions of the buttons are the same as for the standard
toolbar.
Selects lines and polygons. When this button is selected, the cursor will change to a
crosshair, which you may place over the desired line or polygon and click. The
line/polygon will then be highlighted in red. To return to the Overlay toolbar, rightclick on the mouse.
Clicking on this button undoes the overlay that has been selected. You may then
select another overlay or exit this function.
Adds a line (or any number of lines) to the overlay. When this button is selected,
the cursor will change to a crosshair. Place the crosshair on the location you wish to
add a line to and left-click. Move the cursor to the next position and click the left
-
28
mouse button again; a line will be drawn between the two points. You may repeat
this procedure as many times s required. Ending by clicking the right mouse button.
Adds a rectangle (line). When this button is selected, the cursor will change to a
crosshair. Place the crosshair on a point south West of the area you want to draw
the rectangle on and left click. While holding the left mouse button down, move the
cursor towards and past the area in question, drawing a rectangle. Click again and
the rectangle will become shaded.
Adds a circle. Repeat the instructions above for adding a rectangle.
Adds points to the start/end of a line. When this button is selected, the cursor will
change to a crosshair. Place the crosshair at the start or the end of the line
(depending in which direction you which to extend the line) where you wish to
where you wish to add the point to and left click. The line will then extend to where
the new point ahs been added.
Adds a polygon. When this button is selected, the cursor will change to a crosshair.
Move the cursor to the point where you wish to start drawing the polygon and left
click the mouse – a green dot will appear on the screen. Move the cursor to the
next position and click the left mouse button again; a line is drawn between the two
points. Repeat this as many times as required, ending clicking on the right mouse
button.
Adds a polygon with no fill. Repeat the instructions above for adding a polygon with
no fill.
Inserts a point. When this button is selected, the cursor will change to a crosshair.
Place the cursor over the area you wish to insert the point and click, then move the
cursor to where you wish to insert the new point of the polygon and click again.
The polygon/line will change shape accordingly to accommodate the new point.
Moves a point to a different location. When this button is selected, the cursor will
change to a crosshair. Place this over the polygon/line of to be moved and click,
now move the cursor to where you would like the new point to be and click again.
The polygon/line will change shape accordingly to accommodate the new point.
Deletes a point or selection.
Deletes a selection of a line.
Select colours and patterns.
Updates a line or polygon with current palette.
Adds a mark.
Edits a mark.
Deletes a mark.
builds a polygon from lines.
Layer control.
Shows numeric toolbar.
Select object properties.
Show/hide overlay.
-
29
Edits list.
Note: All editing take place on overlay 1 only. Overlay 2 can be selected from the overlay
tab in the chart settings notebook but is non-editable.
Both overlay 1 and overlay 2 can be selected from the settings notebook and if the show flag
is in the notebook the overlays will be automatically displayed when the software is next
used.
Snap – to snap to a previously entered point while adding line or polygon points, hold down
the shift key when pressing the left mouse button. The next point will be placed at the same
location as the nearest point to the cursor.
-
30
Chart Corrections
seaPro includes the ability to correct both vector and raster charts with Notice to Mariners
corrections.
Note: ARCS; if you are using the ARCS Navigator service it is probably inappropriate to use
this facility with these charts.
Note: Livecharts. This chart correction system is not compatible with charts that have been
corrected with the DOS or classic version of the charting system. Any corrected charts
should be used with the correction mode switched off or preferably re-installed.
Alternatively use the ‘Remove corrections button (Waste paper basket icon) on the
corrections toolbar to remove the changes to the chart, similarly charts corrected with this
system should not be used on DOS or classic versions of this product.
Charts might also be subject to a new edition that is outside Notice to Mariners corrections
– contact your Euronav Dealer or Euronav directly to purchase an update.
How Corrections work
Each corrected chart has associated with it an overlay. The corrections overlays are very
similar to a normal GFX overlay except that they are specific to a single chart, and are
loaded automatically when the chart is selected, and removed when another chart is
selected. If you have 4 different charts selected, for example, 4 different correction overlays
may be loaded.
There is a difference between vector and raster charts, with the Livechart vector charts, a
mark that is edited is flagged in the original chart data as being deleted and s not displayed n
the screen, and a new edited version of the mark is displayed. On a raster chart, the original
mark will still be visible and any correction will be overlaid over this.
Note: On Livecharts, the original chart marks can be deleted and edited, but the contours
cannot. This is due to the sheer complexity of the line and polygon data that makes it
unsuitable for corrections editing. Where large changes or inserts are required, you should
purchase an updated version of the chart. However, small changes can be indicated by
marking up the lines that have been deleted and adding new lines as required. This is no
worse than correction of a paper chart.
Important: all chart corrections should be done with the chart datum mode set to local
chart datum so as to be compatible with the Notice to Mariners information.
When a chart is finally updated by the manufacturer, the associated corrections file should
be removed using the delete correction facility (below).
To add a chart correction, select the chart correction toolbar option from the Chart option
on the main menu. The floating toolbar will then appear on your screen.
Toolbar Functions
Add a line - Allows a line to be drawn on the overlay. Move the cursor over the place
to start drawing the line, note the cursor shows the waypoint placement shape. Use
-
31
the left mouse button to place the point on the overlay, repeat the process until the
required line has been drawn. Press the right mouse button to end the entries.
The line style (dot, dash etc.), thickness and colour can be selected prior to drawing
using the palette function (below).
Add points to the end of a line - Move the cursor over the line end to add the points
to, press the left mouse button. Drag the new point to the required position. Press
the right button to end.
Add a polygon - Allows a polygon to be drawn on the overlay. Move the cursor over
the place to start drawing the polygon, note the cursor shows the waypoint placement
shape. Use the left mouse button to place the point on the overlay, repeat the process
until the required polygon has been drawn. Press the right mouse button to end the
entries.
The polygon fill pattern, color and transparency can be selected prior to drawing using
the palette function (below).
Insert an extra point on to a line - Additional points can be inserted into the line.
Move the cursor close to the line where the point needs to be inserted, press the left
button, drag the cursor to position the new point. Press the right key to end the
entry.
Move a point on a line - A point can be moved by moving the cursor over the
required line, pressing the left mouse button, dragging the point with the mouse
(notice the lines rubber band), pres the left mouse button to place the point, or the
right mouse button to cancel.
Delete a point – A point on a line can be erased by moving the cursor over the point
and pressing the left mouse button. Confirmation to continue the deletion will be
prompted for.
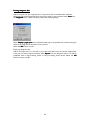
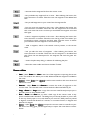
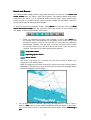
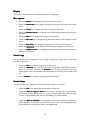
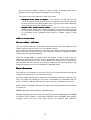
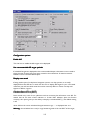
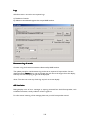
- Select colours and patterns
- Update a line or polygon with current palette.
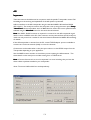
Select either of these two buttons on the toolbar and a dialog box will appear on the screen
as shown below.
-
32
The dialog window allows you to change the colors, patterns and line styles of lines and
polygons.
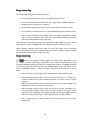
To change the default settings for all newly created objects
• Make the required selection
• Then either - Press the OK button (tick), the options will be updated and the
window will closed, Or - Press the Apply button and the changes will be applied but
the window will be left open.
Other operations can be done while the window is open.
To update objects use the select tool to hi-light the required object, select the options
required and press the Apply to selected button
Lines - The color, line style and thickness can be selected; the current selection is shown in
the pre-view area. Select the required color and line style by clicking on the required option.
Note: Line thickness can only be selected for a solid line.
Polygons - Select the required fill pattern, color. Additionally the transparent box can be
ticked, allowing the fill pattern to appear transparent, the original chart information can
then be seen through it. This is the recommended setting so as not to obscure chart data.
If left unselected, choose the required background colour for the pattern.
Opaque background - When selected single width lines with a non-solid style are drawn with
the background color displayed between the solid parts of the line. Otherwise the gaps are
transparent.
No fill - Polygons are drawn as an outline only
-
33
Show edges - Polygons edges are displayed in the currently selected line pattern and color
Apply button - Applies the changes
To selected button - Applies the current selection to all selected overlay objects.
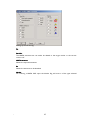
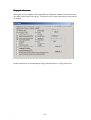
- Add a mark
- Edit a mark
- Delete a mark
A mark is either a buoyage item (or other symbol) with associated text or just a text item
with no symbol.
• Move the cursor over the required position (to enter a position by typing, click
anywhere on the chart and edit the position) click the left mouse button (right to
cancel).
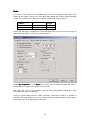
• A dialog box will appear as shown below:
Position - Enter or edit the position for the buoy
Zoom level - The overlays have the ability to show different objects at a user defined level of
zoom. Use this feature to prevent overlays becoming cluttered as you zoom out. The zoom
level is defined as the maximum diagonal distance in nautical miles (nm) that the displayed
chart must have on the screen before the object will be displayed.
Enter the level at which the mark will appear on the chart. The current chart diagonal
distance is shown in the adjacent field.
-
34
Object - When using marks, each object is defined using its object code, a unique code that
describes what the object is irrespective of its visual appearance. Although you do not have
to adhere to this, using the correct object codes allows you to interrogate the object in use.
Select a description for the object from the pull down list.
Overlays are stored in a standard GXF format, here every object can be given a code to
describes what the object is, irrespective of the symbol or colors used.
For further information see the GXF format specification document, the latest
documentation is available from the Euronav web site.
Symbols - Different shapes can be associated with each object from a large range of prdefined symbols.
To select one of the 255 symbols, either select the symbol number using the spin control or
press the list button to view and select the symbols graphically. The color of the symbol is
selected from the color buttons to the right.
Select any required light blip color (light symbol).
Up to two tops mark can also be selected, these have the same color as the symbol.
Each mark can have associated a text file as well as an image file (picture)
To select an attached file select the Attached files button . Select the required files, use the
list buttons to select the required files and the view button to view the files.
Most common picture formats are supported including PCX,JPEG, TIFF and BMP.
You can easily build up a visual database of for example approaches to harbors . The
attached files can be viewed when clicking on the object using the information inquiry (right
mouse button while over the chart).
Text - Enter any required text (Hint: for a text only entry, don’t select any symbols). Select
the required text size and color. The starting position for the text relative to the symbol can
be selected using the compass arrows.
Note: Any characters using the {ESCxxxx} type construct that appear are simple rich text
commands. These are explained in the GXF specifications.
Preview Window - This shows how the symbol and text will look on the final overlay.
Trash can - Selecting this button will remove any chart corrections you have made. This
facility should always be used before updating a chart (ARCS, BSB or Livechart).
On Livecharts it resets all the delete flags, returning the chart to the same state as the
original chart when installed – the files dates will be very different.
Online help - Selecting this button will activate the online help.
-
35
Colours
When using seaPro in low lighting levels such as at night on a ships bridge, it is necessary to
reduce glare from the PCs screen so as not to destroy the navigator/watch keeper’s night
vision.
It is not sufficient to simply dim the screen brightness and contrast controls, since this
results in a screen image which is unclear and difficult to work with.
SeaPro achieves correct glare reduction by changing the colour mapping on the chart
palettes for the charts. Settings for three lighting levels are provided:
Day – charts look very similar to their paper equivalent.
Dusk – usually a darker shading or the colours may be totally changed (with ARCS)
Night – darker and different colours.
The three lighting levels are also used to dim the computer system colours. The system
colours will be restored when the charting system is exited.
To change the screen brightness and contrast, select the Chart option from the main menu
and Colour from the drop-down menu. Select the desired colour scheme and then press
OK.
Note: if you select the night colour scheme during bright light conditions, it may be very
difficult to see the dialog to re-set colours to the day or dusk colour schemes. Be careful
when choosing this colour scheme during daylight.
The final colours used for each selection vary depending on the chart type in use, for
example ARCS charts have preset colours defined by the UK Hydrographic Office, and may
vary between charts. Livechart colours are set by the program and are the same for each
chart.
-
36
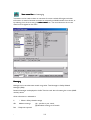
Chart Catalog
The chart catalog allows you to:
•
Browse a list of the available vector charts for your system giving details of chart
number, chart scale, title, date of issue etc. You can add selected charts to a ‘pick
list’
•
View the approximate area covered by each chart on screen
•
To interrogate each chart visually by clicking over the on screen chart box, to add
the selected chart to the pick list.
•
To visually select all the charts covering an area, including those covering the area
(smaller scale) and those within the area (larger scale) charts. To add selected charts
from the list to the pick list.
The printed output can be used to easily order any charts you require.
There are three types of chart catalogs available:
•
•
•
Livechart vector charts + value packs
ARCS raster charts + value packs
BSB charts
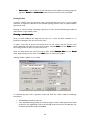
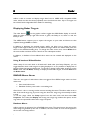
Using the Chart Catalog
Note: do not enter or use the Catalog while using seaPro for navigation. This is because the
Catalog reduces or obscures important navigational chart data.
1) From the main menu select the Chart option.
2) Select Catalog from the drop-down menu.
Your chart display will be re-drawn with a set of labelled chart boxes; the chart number
is shown in the left-hand corner of each box. If a number does not appear, simply zoom
in to the displayed area as the chart numbers only appear at certain zoom levels so as
to prevent crowding of the screen
Any chart you have already purchased and installed in your system will be shown by its
surrounding being coloured and not grey.
-
37
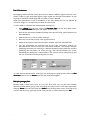
The Catalog Toolbar will also appear;
Toolbar Functions
- its buttons have the following functions:
Create a new pick list
A Pick List is where you store details of charts you may like to buy. A variety of
convenient methods for adding charts to the Pick List are shown below. You may
only have one Pick List active at any one time and creating a new one will delete any
that are already in existence
Further information on a chart
Click over a chart that may be of interest to you. A window will appear giving
details of the chart. If this chart is of interest, you can click on the button to add this
chart to your Pick List, otherwise, click on the Cancel button.
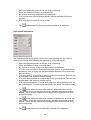
View the chart catalog in text form
Although many may prefer to choose charts graphically, seaPro’s Catalog also allows
selection of charts from lists. This button lists all charts in the Catalog. From here,
they may be selected and added to the Pick List. You may select just one, or several
charts using the standard Windows selection methods. When selection is complete,
click on the Add selected charts to pick list button. This can be done multiple times
if required.
The display can be ordered differently by clicking on the titles for each column, a
second click on the same title, will reverse the order (ascending and descending
orders).
View the pick list of charts required
After you have added charts to the Pick List, you can have a look at the list to
review the charts you are interested in. If there are charts that you do not want,
simply select the charts, and press the delete button.
Once you have finalised the Pick List, you can print out the list of charts for purchase by
pressing the Print button. When you have finished using the Pick List, select the Finished
button to save any changes you have made, or the Cancel button to discard them.
Notice to Mariners update checker
This feature will check all of your charts against the latest catalog of livecharts, giving you a
list of your charts with outstanding notice to mariners on them. To use this feature you can
visit the Euronav Website and download the latest “.cat” file. This file can then be pasted
into:
C:\ProgramFiles\Euronav\seaPro2000\Catalogs\Livecharts
-
38
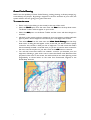
Select all the charts in a defined area
This facility allows you to easily select all the charts covering a given area.
Click to select this option and click close to the required area. Move the mouse to
create a rectangular selection box and click again. A chart view box will appear
showing the selected charts.
Charts marked with a [] symbol are all contained within the required field.
Charts marked with a ][ symbol all cover the area but at a smaller scale.
As before, click to add these charts to the pick list, print out the list, or Finished to
cancel.
View chart folio packs
Special chart packs offer any easy and convenient way to purchase your charts.
They cover popular areas and have been designed to give good navigational
coverage. They are also cost effective compared to buying charts singularly. Packs
are available both for Livecharts and ARCS.
A dialog appears that allows the selection of the packs to be view (one or more at
a time)
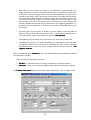
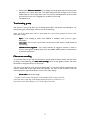
button from the tool bar. The following
To use this tool you should select the
window will open, allowing you to select one or more folios, which you can either
view graphically as boxes or as a list.
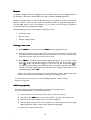
-
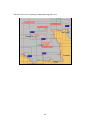
39
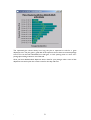
The charts that are in the pack(s) are displayed hi-lighted in red:
-
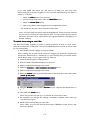
40
4
Waypoints, Routes and Passage Planning
seaPro contains very powerful facilities for planning passages and for evaluating the effect of
the tide on those passages. It is possible to produce in seconds a full tidal passage-plan that
may take hours to produce by hand; and to produce several alternatives equally quickly in
case expected conditions change.
Routes may be stored for later re-use, modified, reversed etc., you can even do your
passage planning ashore using seaPro and then transfer your route to a handheld GPS for
use on-board smaller vessels.
Tidal passage planning with seaPro is a three-stage process:
•
Create a Route
Rout e – choose or create a sequence of waypoints for your intended
passage
•
Set up and calculate the Plan – use seaPro to calculate the effect of the tide on your
intended route for a particular parameters
•
Review/Modify the Plan – examine expected ground track, ETA etc., if unsuitable, replan with different departure time etc.
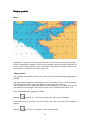
Waypoints
seaPro’s passage facilities are waypoint based, a waypoint may be defined for the purposes of
this User Guide as a position on the oceans surface, referenced by Latitude (LAT) and
Longitude (LNG).
On the PC, this LAT and LGN position is stored, along with a reference number and a
description, in a waypoint file on your computer’s disk drive. You may have as may waypoint
files as you like on your computer and each file may have as many waypoints in it as you like,
subject to availability space on your disk drive.
It is a good idea to have several smaller waypoints files, covering different areas, rather than
one big file, containing all your waypoints.
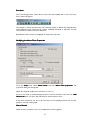
Creating a waypoint file
Select Waypoints from the main menu and New from the drop-down menu. A dialog will
appear on the screen and you will be ask to specify a name for the new file to hold your list
of waypoints. Type in the name of the file and click on the green tick button.
seaPro will create an empty waypoint file for you to add your waypoints to.
Click on the Insert button to add your waypoint. (see Adding Waypoints, below).
-
41
Selecting a existing waypoint file
•
Select Waypoints from the main menu and Select from the drop-down menu. You
will be presented with a list of the waypoint files stored in seaPro’s Routes folder on
your disc drive.
•
Select the file you want to use and click on the green tick button.
Your chosen file is now the active waypoint file, any waypoints you create will be added to
this file.
You can look at your waypoint file at any time by selecting View from the Waypoints menu.
Adding Waypoints
With seaPro, you can create waypoints in several ways:
1) Type in a known position, maybe from an almanac, cruising guide or pilotage notes
View the waypoint file, click on the Insert button and type a description in the box.
Enter the LAT and LNG position of the waypoint, when complete, click on the green
tick button.
Note: seaPro checks you have entered a valid position for each waypoint – it will not
store a waypoint if you have entered the LAT LNG position incorrectly:
A waypoint to be added at 50 degrees, 30 minutes North and 1 degree, 23.456 minutes
West should be entered as follows:
050 30N and 1 23.456W
You must use the zero key when entering zeros, not the letter O key.
2) Point and click. Select Waypoints from the Main menu and Add from the drop-down
menu.
When you have clicked on a position, seaPro will ask you to enter a description,
having filled in the LAT and LNG for you automatically. Click on the green tick when
complete.
3) Alternatively you can create waypoints from your current route file by selecting Add to
Waypoint Database from the Route main menu.
Editing the current waypoint file
Select Waypoint
Waypoint from the main menu and View from the drop-down menu. You will be
shown a list of waypoints in the current waypoint file. You may choose to:
Delete a waypoint – Select the waypoint you would like to delete and click on the
“trashcan” button.
Edit a waypoint
waypoint - select the waypoint you would like to edit and click on the Edit
button. Modify the description or position of the waypoint and click on the green tick
button.
Move a waypoint - select the waypoint you would like to move within the waypoint file,
click on the Move button. Then click where you would like to move the waypoint to
and click on the Move button.
-
42
Sort the waypoints file – click on the Sort button to sort your waypoint file
alphabetically, according to description.
Deleting a waypoint file
Choose Select from the Waypoint menu, then select the name of the file you would like to
delete. Click on the trash can icon and seaPro will ask you to confirm the deletion before it
permanently removes that file from your system.
If you have deleted the current waypoint file, it is a good idea to select another file to use
now, then click on the green tick button.
Transferring waypoints to and from your GPS
Some GPS units are able to send and receive lists of waypoints to and from a PC with a
suitable interface cable. Check the documentation included with your GPS to see whether it
has this capability.
Due to the vast number of GPS units on the market and their varying capabilities, Euronav
cannot guarantee that seaPro will be able to transfer waypoint lists to and from all GPS
units. It is recommended you check with your dealer for advice if your GPS is unable to
interface with seaPro.
If you wish to load waypoints from your GPS into seaPro, you will need to connect
them with a serial data cable such as that provided with your package. It is
recommended that you create a new waypoint export mode to import the
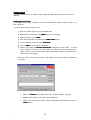
waypoints into. Put the GPS into its waypoint export mode and then select Receive
from Nav from the Waypoints Menu. When you have completed receiving
waypoints, click on the green tick button. You may now edit the waypoint list.
When sending waypoints to your GPS, put the GPS into its waypoint import mode and then
select Send to Nav from the Waypoints menu. A dialog will ask you whether you wish to
send waypoint names or just numbers (many GPS units are unable to handle long waypoint
names). Enter the number of the first waypoint to export (or enter –1 to export names) and
seaPro will commence sending the waypoints, reporting when it has sent all of them.
-
43
Printing Waypoint files
seaPro can print out your waypoint lists to any printer that is installed under Windows.
Make sure the current waypoint file is the one you wish to print and then select Print from
the Waypoint menu. seaPro will then present the following dialog:
Select Display a page open if you would like each page to be printed with a title showing the
name of the waypoint file and when it was printed.
Select the OK button to print.
Exporting Waypoint files
seaPro can export lists to a text file on your disc drive. Make sure the current waypoint file
is the one you wish to export and then select Export from the Waypoint menu. You will be
presented with an export dialog similar to the print dialog shown above. Select the OK
button to export the file.
-
44
Routes
A route is simply a series of waypoints that you select, either from a waypoint file, or
by clicking on the chart, which seaPro can use to create a passage plan from.
Routes are stored in files on your PCs disk drive and you may have as many as you have disk
space for. seaPro routes may also contain an unlimited number of waypoints, although it is
recommended that you limit the waypoints in your routes to avoid long plan calculation
times and excessively complicated passages.
Broadly speaking there are three stages for planning a route ;
•
Create the route
•
Plan the route
•
Review/ modify the plan
Creating a new route
1) Select Route from the main menu and New from the drop-down menu.
2) A dialog will appear on the screen asking you to name the route file. You will notice
that seaPro has automatically created a route file name, so you do not need to enter
a name for the new route, but may do so if you wish.
3) Press Open to continue. A Route Select dialog will appear on your screen, asking
you if you wish to change the log file to match the route you are planning. If you
select No, seaPro will continue logging to the current log file; if you select Yes, a
new log file will be created, with the same name as the new route file you have just
created. It is usually a good idea to start off with a new log file for each route, so it is
recommended you select Yes.
seaPro now enters route-creating mode and the Route Toolbar replaces the Main
toolbar to show buttons which relate to creating and modifying routes.
You may now start to create your route by adding waypoints. There are three
ways you can do this –
Add them graphically
This is the simplest method that produces a basic route containing one or
more un-named waypoints. To add them graphically ;
1) Choose a chart that shows the area you want to plan your route in.
2) Left click on the Add button on the route toolbar – you are now in add mode.
3) Left click on the chart where you want to place a waypoint.
4) Left click again until you have all the waypoints you want. When you have stopped
adding waypoints, seaPro numbers each waypoint sequentially
5) Right click to exit the Add mode.
-
45
Adding waypoints from a waypoint list
1) Ensure you have the correct waypoint file loaded (choose Select from the Waypoint
menu).
2) Left click on the Wpt button on the Route Toolbar. Your waypoint list will then
appear on the screen.
3) Choose the waypoint from the list and left click on the Add button.
4) Continue until you have all the desired waypoints in your route.
5) Click the green tick button when complete.
Adding waypoints from the chart
1) Ensure you have the correct waypoint file loaded (choose Select from the Waypoint
menu).
2) Ensure the waypoints are displayed on the chart (select this from the waypoint
menu).
3) Left click on the Wpt button on the Route Toolbar.
4) A dialog will appear, select chart .
5) Left click on or near the desired waypoint.
6) Left click on the waypoint button on the Route Toolbar for more waypoints.
Selecting routes
Once you have created a route file, it may be selected at any time and used as the current
route.
To load an existing route from your disc drive., choose Route from the main menu and
Select from the drop-down menu. Choose the route file from the list and select Open.
You may also use this dialog to delete route files that you no longer need. Select the route
you wish to delete by right clicking on it and select Delete from the drop-down menu. A
Confirm file delete dialog box will appear on your screen. Select Yes to delete the route file
or No if you wish to cancel the deletion.
Modifying Routes
Whichever method you choose to add waypoints to the route, it is likely that once you
review the route, you will need to make changes, either inserting extra waypoints or moving
the existing ones to avoid hazards such as shallow water or prohibited areas. These changes
can be made using the Route Toolbar.
Note if the Route Toolbar is not showing, select Route from the main menu and Modify
from the drop-down menu and the Route Toolbar will appear.
- lets you add a waypoint to the end of a current route by clicking on the
chart.
-
46
- removes the last waypoint file from the current route.
- lets you delete any waypoint from a route – after selecting this button, the
cursor becomes a crosshair. Place this over the waypoint to be deleted and
click.
- lets you add waypoints to your route from the waypoint file.
- lets you move any waypoint in the route – after selecting this button, the
cursor becomes a crosshair. Place this over the waypoint to be moved and
click, now move the cursor to where you would like the waypoint to be and
click again.
- inserts a waypoint anywhere in the route – after selecting this button, the
cursor becomes a crosshair. Place this over the leg of the route where you
would like to insert a waypoint and click. Now move the cursor to where
you would like the new waypoint to be and click again.
- adds a waypoint, which is the vessels current position, to the current
route.
- lets you edit the name of waypoints – after selecting this button, the
cursor becomes a crosshair. Place this over the waypoint to be edited and
click. Enter the new description for the waypoint and click the green tick
button.
- enters the plan setup dialog, in advance of calculating the plan.
- closes the route toolbar and shows the Main Toolbar.
Route utilities
-
•
View – select Route then View to see a list of the waypoints comprising the current
route. This window also allows you to add, delete and edit the waypoints included in
the route.
•
Append – select Route then Append to add a route stored on disk onto the end of
the current route.
•
Reverse – select Route then Reverse to reverse the order of waypoints in the
current route. The reversed route is stored under the file name ROUTE_RV
•
Copy – Route then Copy makes a copy of the current route file and prompts you to
provide a name to store the file under.
•
Print – Route then Print lets you take a hard copy of the current route to any
printer installed under Windows. The dialog lets you choose whether to print a title
at the top of each paper or not, and whether you want LAT LNG positions printed
in degrees, minutes and decimals of a minute, or in numeric format, i.e. degrees and
decimals of a degree.
•
Export – select Route then Export to export the current route to a text file on your
disk drive. The dialog gives you the opportunity to export the route data in numeric
format.
47
•
Send to Nav – If your GPS is on and connected, and is capable of receiving waypoint
type data, Route then Send to Nav will transmit the current route to the GPS.
Passage Plans
A route is of little use to the navigator since it cannot be used on its own, it is just a useful
collection of waypoints relevant to the intended passage. Routes must be planned before
they can be used.
Planning, or more correctly “calculating a plan from a route” involves calculating the effect of
tidal streams on the vessels course.
Creating a calculated plan
Once you have added all the waypoints you want to a route, and have reviewed it, it is
possible to calculate a plan for the current route.
To plan a route, first of all you must ensure that it is the current one (the current route
name is displayed in the bar at the top of the screen). Choose Select from the Route menu if
the route you wish to plan is not the current one.
Once you have chosen the route you wish to plan, select Calculate Plan from the Route
menu. Alternatively, you can click on the Plan button on the Route Toolbar.
A dialog will then appear on you screen:
To calculate the plan and to generate course and ETA info, seaPro needs the following
information:
-
•
Intended departure date and time
•
Your expected average speed (in knots) through the water. If the speed of the vessel
varies from this significantly, even if the average remains the same, the tidal plan may
be inaccurate and should be recalculated.
48
•
How often you want seaPro too perform the calculations (a good interval for a
sailing vessel for a route that should take several hours is 30 minutes of track time.
A vessel on a shorter passage, where more accurate calculations are required, for
example, when racing, may be 10 minutes of track time). The smaller the interval the
more accurate the tidal estimation will be but the longer the calculations will take.
The interval should be chosen to be much smaller than the time taken on the
shortest leg in your route. For example, if your shortest leg is 5 miles and you have
entered a speed of 5 knots then the leg would take 1 hour neglecting tidal effects. A
calculation interval of between 1 and 5 minutes would be a reasonable value to use
for this plan.
•
The dialog gives you the option of whether you want seaPro to take the effect of
tides into account when calculating the plan. This is calculated automatically but to
cancel this option, simply remove the tick in the box ‘Use tidal data”
Note: Before using this facility you should ensure you have created a tidal atlas.
•
The dialog also gives you the option of whether you want seaPro to take the effect
of magnetic variation into account when calculating the plan. This is calculated
automatically but to cancel this option, simply remove the tick in the box “Use
magnetic variation”.
When completed click the Calculate button. You will immediately be presented with the full
plan information window.
There are two plan information windows ;•
Full Plan - the full information for each leg is displayed in a separate window
•
Overview - shown as a line per leg, displays all the important information required.
The Full Plan Information Window shows the results of planning a route, one leg at a time.
-
49
The following information is shown:
•
Start and end waypoint positions and names
•
Departure and arrival times
•
Leg distance and true bearing
•
Tidal effects on the leg
Click on the buttons at the top of the window to move between each legs panels.
It is a good idea to review this plan and if necessary, re-plan the route with different
parameters such as departure time, speed through the water etc.
Once you are satisfied with the plan of your route, you can obtain a hard copy by clicking on
the Printer icon
.
Select the Plan Overview option from the Route menu and the Window will appear :
The Print button will print the data in a similar format. It is recommended to set the printer
to print in landscape mode.
To exit the Plan Overview Window, press the OK button.
Passage optimization
As well as calculating routes and expected times of arrival for a given departure date, seaPro
can optimise a route to work out the best departure for a given set of conditions. The
system calculates the plan 12 times, stepping the departure time one hour at a time, through
the next twelve hours, thus covering a full range of tides.
To optimise a route:
1) select Route from the main menu and Calculate plan from the drop down menu.
2) Instead of clicking on the Calculate button, click on Build Graph or View Graph.
SeaPro will then perform twelve iterations of the plan calculation and the plot should
look similar to the one below:
-
50
The optimised plan shows clearly how long the plan is expected to take for a given
departure time. The plot gives a good idea of the optimum time to leave to minimise passage
time. ETA.s can be back-calculated from tidal gate, or lock opening times to work out a
passage plan making maximum use of the tide.
Once you have decided which departure time is best for your passage, make a note of that
departure time and re-plan the current route for that day and time.
-
51
Fuel Calculations
By supplying seaPro with fuel consumption and cost data for different engine revolutions, the
system is able to graph boat speed against range, engine revs and fuel consumption, as well
as giving an estimation of fuel usage and cost when a route is planned.
Note: Fuel Calculation is only a calculation of the fuel needed and can be affected by
numerous things, so it is important you allow for reserve fuel..
To allow seaPro to calculate the estimated fuel consumption:
Select Route from the main menu and Calculate Plan from the drop down menu.
The Calculate Plan dialog box will appear on the screen.
Enter all the information needed (including start date and time, vessel speed etc) as
described above.
Make sure there is a tick in the Est. Fuel box.
Enter the cost of fuel per litre in the appropriate box.
When all the relevant information has been entered, select the Calculate Plan/
You will immediately be presented with the full plan information window. As
described above, there are two plan information windows, the Full Plan window
(displaying information for each leg in a separate window) and the Overview window
(displaying the information on a line per leg). The Fuel Calculations part of the
Calculated plan dialog box is shown below. The amount of fuel used (in litres) and
the cost of the fuel is shown per leg and as a total.
To, view the fuel calculations for each leg on the same page in a graph format, select the Plan
Overview option from the Route menu and the window will appear.
Multiple passage plans
Because seaPro stores each route on your PCs disk drive, you can plan and calculate
alternative routes before going to sea, and call-up the one you wish to use when required by
selecting Route from the main menu and Select from the drop-down menu. From the list of
routes in the directory, right click on the route you wish to select and then press OK.
-
52
Executing passage plans
When you have created your route, planned it and reviewed it, you are now in a position to
execute it or to start following it.
Once you have a current plan, by either calculating a new route, or by loading a previously
calculated plan from disk, you must tell seaPro you wish to start following it.
You need to have the Panel displayed (from the toolbar click on the Panel Icon) and also
have the Actual (plan) instrument option displayed within the Panel. If the Actual instrument
is not visible, scroll the Panel up or down to see it: if it is not on the panel, place the cursor
over the blue title bar at the top of the Panel and right click. From the drop-down menu
select Properties. A Panel Properties dialog box will appear on your screen, Make sure there
is an X in the Plan Actual box. To exit click on the green tick button.
You can start navigating to the planned route by selecting the
(leg +) button on the
Actual (plan) instrument option on the Panel, or select Start (Nav) from the Route menu.
SeaPro will work out which waypoint is likely to be next, show that waypoint in red on the
chart window, and display information relating to that waypoint and the leg towards it in the
fields of the Actual instrument.
Note that waypoints are numbered from zero, i.e. the start of the route is waypoint zero,
subsequent waypoints are numbered logically 1,2,3 …etc
You may manually select a different waypoint as being the “next” waypoint by using the
and
on the Actual instrument on the Panel.
Route Planning whilst enen- route
You may only have one plan active at a time, therefore if you are at sea following a route
and wish to load and create another route, seaPro will a) stop sending information to the
autopilot (because it will now be meaningless) and b) warn you that you need to re-select a
leg, i.e. a waypoint to head for.
During this procedure, seaPro will continue to maintain a plot of your vessel position.
Quick Plan
This feature allows you to easily plan a route form the vessels current position. This may be
useful, for example, if you receive an adverse weather report, gear damage, or failure occurs
or the crew becomes incapacitated – you can very quickly create a route from your current
position to a safe haven, plan it, and even send steering information to your autopilot with a
few simple mouse clicks.
Reroute
Often you may find that you are not performing as expected against your passage plan and it
may be desirable to re-calculate the remainder of the plan from the current position.
For example, consider the case where you have created a 7 waypoint route and are
currently heading for waypoint 2. If you decide to abandon part of your trip and want to
head straight for waypoint 5, then do the following:
-
53
-
•
Use the leg selection button
•
Select the reroute option on the route menu
•
Enter a name for the new route
•
seaPro will then provide a route directly from the current vessel position to the
selected waypoint. The route will also include all other waypoints after the selected
waypoint in the original route.
•
Create a plan for the new route
•
Use the leg selection buttons on the plan actual instrument to select the new
waypoint.
on the plan actual instrument to select waypoint 5
54
Search and Rescue
This creates standard SAR patterns taking tidal information into account. The search and
rescue toolbar helps you create a quick search pattern. The operator defines three points
inside which the search is to be conducted. seaPro will then plan a search pattern giving
courses to steer or autopilot control. seaPro will also consider any tidal effects. There is a
choice of three popular search patterns available.
To bring up the Search and Rescue toolbar, select Route from the main menu and Show
search and rescue toolbar from the drop-down menu. The toolbar, as shown below, will
then appear at the top left hand side of the screen.
Firstly it is important you open a new route file. To do so, select New from
the Toolbar. The route file dialog box will appear on the screen and you will
be asked to specify a name for the new file. You will notice that seaPro has
automatically created a route file name, so you do not need to enter a name
for the new route, but you may do so if you wish. Click on the ok button to
continue. Then select one of the following search patterns:
- Step ladder search
- Expanding Square Search
- Sector Search
The cursor will change to a crosshair and you will be asked to define your
waypoints for the search pattern.
When the waypoints have been entered, the system will create a search pattern
depending on the pattern you have chosen from the toolbar. An expanding Square
Search, for example, is shown below:
You can then choose to calculate a plan using the waypoints as a route. To do so,
select the Plan option form the toolbar and the plan dialog will appear on the screen.
For instructions as to how to calculate a plan, see the earlier section Calculating a
plan.
-
55
Depending on the search pattern you have chosen, you can also edit the lane widths
and maximum number of lanes (in the Step Ladder search pattern) and edit the
maximum size and maximum number of lanes (in the Expanding Square search
option from the
pattern). To edit the search route properties select the
toolbar. The Search and Rescue Configuration dialog box, as shown below, will then
appear on the screen.
If you have chosen the Step Ladder search pattern, you have the option of changing the Lane
Width (measured in metres).
Note: the Lane width must be a multiple of 50m and be between 50m and 20000m. You can
also edit the number of lanes (with 100 being the maximum number of lanes).
If you have chosen the Expanding Square Search, you edit the maximum size of the search
square (measured in nautical miles, with a maximum size of 20 000 nm). You can also edit
the number of lanes (with 100 being the maximum number of lanes).
When you have finished editing the search route properties, press the
the editing, or the
-
button to cancel the editing.
56
button to finish
Great Circle Planning
SeaPro has the capability of Great Circle Planning, making planning an Ocean passage (e.g.
trans-Atlantic) very simple. By putting a waypoint at the start and finish of your route, the
system will fill in the rest, giving you a great circle track.
To create the route:
-
•
Zoom out (by right-clicking on the mouse) to the map of the world.
•
Select the Route option from the main menu and New from the drop-down menu.
The Route Toolbar will then appear on your screen.
•
Select the Add option on the Route Toolbar and the cursor will then change to a
crosshair.
•
Left click on the mouse to place a waypoint at your start position, and then left-click
again to place a second waypoint at the end of you route.. Right-click to finish.
•
Planning
Then select Route from the main menu and Great Circle Planni
ng from the dropdown menu. A dialog box will appear on the screen and you will be asked to specify
a name for the new file to hold your list of waypoints. You will notice that seaPro
has automatically created a route file name, so you do not need to enter a name for
the new route, but may do so if you wish. Click on the OK button to continue.
•
You will then notice that seaPro has created a route for you between your two
waypoints, following a great circle route to create the fastest route. Because of the
projection of the chart on the screen, this will look like an ark when planning routes
longitudinally, as shown below on the route from Portsmouth, England, to the
Florida Keys, America.
57
-
58
5
Log
seaPro can maintain a log of your vessels position, and other information including course
over the ground (COG) and speed over the ground (SOG) and additional data depending on
the instruments connected to the PC.
To turn logging on or off, select Setup from the main menu, then Nav Properties from the
drop-down menu and then Log from the dialog box that appears on the screen.
To enable logging make sure that the Log Recording checkbox is ticked.
You may choose the frequency with which the log is updated and which items are logged.
Creating Logs
When you start seaPro, it automatically opens the last log being used and adds data to it.
Therefore unless you create a new log file from time to time, the log will get very large and
unwieldy. This can be made worse by having seaPro record data too frequently.
A useful idea is to create a new log file at the beginning of each passage, if the passage is no
more than a couple of days or so, or to start a new log every day or couple of days, if the
passage is longer.
To help you, when you start a new route, seaPro asks you if you would like to start a new
log file to match the route.
If you wish to create a new log file manually, select Log from the main menu and select from
the drop down menu. seaPro will suggest a name for the new log based on the date – accept
this by clicking on the tick button, or type in your own name and tick OK. seaPro will create
an empty log file and begin recording straight away.
Selecting Logs
You may select any log that has been stored on disk by choosing Log from the main menu
and Select from the drop-down menu. This will close the current log and open the log file
you have selected. Unless you have switched off the data logging, seaPro will continue to add
logged data to this log.
Making manual log entries
To make a manual log entry, select Log from the main menu and Add from the drop-down
menu. The cursor will change to a crosshair which you may click on the position where you
wish to make the log entry, seaPro presents a dialog where you may add observed
information and adds this to the log.
Alternatively, you can add the vessels current position to the log, irrespective of it automatic
updating by clicking on the Fix button on the Enroute Toolbar.
You may also make manual log entries with the Log Fix Instrument (this appears in the
Panel as a set of flags)::
•
-
Left-clicking a flag button will cause it to be dropped at the current vessel position (if
a NMEA position is available).
59
•
Right-clicking any flag button allows you to move the mouse cursor over any chart,
whereupon the mouse cursor turns into a crosshair symbol: left click at the position
where you want to drop the flag.
As well as appearing on the chart display, these entries will also appear in the log.
Man overboard marker
The left-hand flag of the log fix flags is intended for use as a man-overboard marker and
behaves in the same way as the log fix marker flags
Viewing Logs
The current vessel log may be viewed by selecting Log from the main menu and View from
the drop-down menu. Scroll to the bottom of the list to see the most recent log entries.
You can “filter” the log entries by setting the time interval to a higher value – normally its
set to one second and therefore shows every log entry, you can speed up display of large log
files by setting a larger value.
Select the Format button to decide what data should be displayed when you view the log.
Log Import/ Export
seaPro supports a full range of import, export and printing functions with the log.
Obviously, printing the log out from time to time is good practice, and seaPro supports any
windows printer.
By exporting log data, it is possible to analyse it in external programs, seaPro also allows you
to import positional (LAT LNG) data from an external source and view it overlaid onto a
chart. For the best idea of how to prepare a file for import to seaPro, export an existing log
file first and look at the structure.
Animation
seaPro has the ability to play back previously recorded log files. Select Log from the main
menu and Animation from the drop-down menu. A VCR style dialog will appear on the
screen where you can stop, start and rewind the current log file and view it in convenient
steps.
-
60
-
61
-
62
6
Tides
Tides
seaPro contains sophisticated tidal features as standard. Where suitable tidal data is
available, you may obtain very accurate tidal passage plans, observe tidal streams in
real time and examine times and heights of high and low water worldwide.
You may even add and edit your own tidal information.
Note; Tidal prediction is just that – prediction. There is no guarantee as to the
accuracy of tidal data used within seaPro. The prediction can be dramatically
affected by changes in atmospheric pressure and other weather conditions, locally
and many hundreds of miles away.
Tidal Atlas
SeaPro’s tidal information is obtained from tidal “diamonds”, digitised from the original
official admiralty paper chart. Most Livecharts contain some tidal diamonds and this
information is extracted from the charts by seaPro and built into a Tidal Atlas. Of course,
you can only get the tidal diamonds included with each Livechart, so if you want to get the
best accuracy, you need to buy larger scale charts to get the accuracy of those charts tidal
diamonds. Alternatively, a full tidal atlas is available as an option, which includes tidal
diamonds extracted from all Livecharts which have them. This is a good option because it
gives you access to better accuracy to tidal calculations without meaning you have to buy all
the charts covering your area.
SeaPro displays tidal stream arrows independently of the chart type, i.e. if you have access to
the seaPro tidal atlas, streams will show on top of both raster and vector charts.
Creating the Tidal Atlas
•
•
Select Chart from the main menu and Folio from the drop-down menu.
Select the Create Tidal Atlas button
SeaPro extracts tidal information from each Livechart installed on your system. This may
take some time, especially if you have a large number of Livecharts on your system. You
should re-create the tidal atlas every time you add a new Livechart.
Tidal Atlas Toolbar
This Toolbar gives you access to seaPro’s tidal stream functions and is accessed by selecting
Tides from the main menu and Tidal Atlas from the drop-down menu. It is a floating
Toolbar; it will stay on top of the other windows and may be moved to a convenient
location so as not to obscure important chart data.
You will also see a number (quantity depends upon how many Livecharts you have) of blue
arrows, each one representing the rate and direction of the tidal stream at that point at the
current time.
Note: all tidal operations are based on UTC time, irrespective of the current local time.
-
63
Toolbar Functions
The functions of the Tidal Atlas Toolbar are as follows;
Shows the tidal stream one hour later (UTC time is shown in the Tidal Atlas Toolbars
title bar.
Shows the tidal stream one hour earlier (UTC time is shown in the Tidal Atlas
Toolbars title bar).
Calls up a dialog which allows you to choose a particular date and time for tidal stream
display, this dialog also allows you to select the current system time for Atlas
operation.
Turns “atlas Auto Update” on or off. As standard, this feature is turned on, so the
tidal diamond will update in real time. You can choose how often the tidal Atlas display
is updated when in automatic mode by selecting Chart from the main menu, settings
from the drop-down menu and then Cartography 2.
Lets you get an idea of the rate and direction at a location between diamond arrows.
Note: this is only a rough estimate.
Allows you to display just the tidal arrows, or to show the rate and direction of
stream as well as for each diamond.
Each tidal diamond will have a variable accuracy – some may be regarded as being
accurate over a very wide area, some are only accurate over small geographic area.
This button lets you see an estimate of the area the diamond is considered to affect.
Tidal Curves
In addition to comprehensive tidal stream information, seaPro also lets you check the time
and heights of high and low water at selected ports worldwide.
Each port has a set of harmonic constants which remain relatively constant over time. The
change in ports tidal curve over time (as a result of varying planetary influences) is defined by
the angles and factors from table VII of the Admiralty Tables (ATT).
Note: Euronav publishes a worldwide tidal curve database disk each year, which contains
this information, this is available as an option – contact your local agent or Euronav for
more details.
The results from the SHM are only predictions and the actual depths and times may vary
considerably from the predictions generated using this method. An adequate safety margin
both in time and for depth should be allowed.
To display the Tidal Curves Toolbar, select Tides from the main menu and Show Tidal
Curve from the drop-down menu. A dialog box will then appear on the screen.
-
64
This shows a tidal curve for the current selected port for the current date
covering a 3, 6, 12 or 24 hour period.
The functions of the Tidal Curve Toolbar buttons are as follows:
Steps the display back in time.
Steps the display forward in time.
Displays the curve plotted over a smaller time period (minimum 3 hours)
Displays the curve plotted over a larger time period (maximum 24 hours)
Lets you choose the port whose tidal curve you wish to view. Also allows editing of
the internal database of ports (see below).
for choosing the date for tidal curve display
lets you add an onset for any known chart depth. This then allows an estimated
depth for any point, such as a bar or an anchorage to be displayed. The chart depth is shown
on the tidal curve as a solid blue rock below the main curve. The vessels draft is show as a
dotted red line.
Use of the tidal curve is very straightforward and can be done in two ways:
•
•
use the mouse to drag the intersecting lines to the date and time required and read
off the depth
use the mouse to drag the intersecting lines to the depth required and read off the
date and time.
Two values appear in the depth box. The first is the height range (the value that would be
obtained from the standard tidal curve). The second figure (shown in brackets) allows for
the drift (if entered for your vessel) and the chart depth.
Editing the Ports database
If seaPro doesn’t already hold tidal curve details about a port you are interested in, you can
add your own port as long as you have access to the simple harmonics from the Admiralty
Tide Table (or similar).
Click on the Station button on the Tidal Curve Toolbar to show the Port Selection dialog.
Click the Add button and fill in the details as shown on the tables, making sure you add the
port name and its number and time zone in addition to the harmonics themselves.
-
65
Similarly if updated harmonics become available for a port, which is already in seaPro, you
may select Edit and make any necessary changes. Click the green tick button to save and
exit.
High Water Database
seaPro uses an annual tidal database, which allows it to perform its tidal calculations.
A different database is required for each year and for the following sailing areas:
EU – Europe
NZ- New Zealand
AS – Australia
CA – Caribbean
To enter the data you should complete the following:
1. Run the annual tidal data update program, as supplied by your distributor or
Euronav.
Start seaPro and select Tides then select Tidal Atlas properties. This will open a new
window. From this window select ADD and then select the database you have added. E.g.
HW2002
-
66
7
Setup
This menu list contains setup parameters for seaPro, these should be changed with care as
they will effect the operation of seaPro.
Navigation Properties
The navigation properties sheet allows you to set up your own preferences for the way in
which seaPro handles navigational data input and output and displays it on your charts.
Note: It is suggested that you also look at Appendix B – Connecting a GPS and Instruments
in collaboration with this chapter.
The property sheets contains a number of pages:
Navigator
This sheet allows general navigation properties to be configured, master controls for NMEA
input and output and autopilot control.
•
•
•
-
NMEA On – enables NMEA input and output control via the PC serial
communication port. This allows external instruments such as a GPS receiver and
instrument systems to supply data to seaPro. It also allows seaPro to supply data to
an autopilot but only if the Transmit box is also checked.
Transmit - Check the Transmit box to allow seaPro to send NMEA data out of the
PC to external instruments, such as an autopilot.
GPS Warnings - allows any changes in the status of the data supplied by an external
GPS receiver to be shown in a pop-up window.
•
Autopilot - This group allows you to define how seaPro will act when it detects that
you have reached the end of the current leg in the active plan.
•
Auto advance - instructs seaPro to determine when your vessel has reached a
destination waypoint and automatically advance the active plan to the next leg.
Uncheck this box to make seaPro stop and show a warning once your vessel has
reached the destination waypoint, before proceeding to the next waypoint
(recommended on high speed craft to avoid sudden course changes).
•
Leg - shows the leg currently being used in the active plan. Changing this to a
different leg number will cause seaPro to change to that leg.
•
Waypoint arrival circle - the distance from a waypoint which seaPro is to consider
as equivalent to your having reached that waypoint - a default radius of 0.1nm is
assumed.
67
Track
Allows the vessel track and track log facilities to be configured.
recording
ing group
Track record
•
On - enables the vessel position to be recorded to the current track log file.
•
Use memory - allow seaPro to maintain a list in memory of the most recent 1000
vessel positions received. This allows a smoother curve to be drawn on the charts
even when the track recording interval is large. For example, if position is received
every second but only recorded every 30 seconds, the Use memory facility allows
the intermediate 29 position points to be temporarily drawn on the chart. The list
is reset when seaPro is first started.
•
Interval - sets the track recording frequency - the smaller the interval, the smoother
the curve displayed on the charts but the larger the track log file.
•
Distance - allows the track recording to be inhibited until the vessel has moved at
least the specified distance, allowing smaller track log files while the vessel is
stationary.
•
Track width - allows port and starboard track lines to be draw either side of the
central vessel track at the total spacing specified. Set the value to 0 to disable these
lines.
Extended track lines group
An extended track line is a line drawn from the current vessel position to where the vessel
will be after a specified interval if the current course and speed are maintained. The X-Line
button on the Toolbar allows a selection of time intervals in minutes to be specified. The
fixed option draws a fixed length line which is not related to time or vessel speed.
•
Check the Enable box to allow seaPro to display extended track lines on the charts
when the vessel is actually moving.
•
Check the COG box to display an extended track line using the current Course
Over the Ground of the vessel.
Note; if the heading of the vessel is available then the vessel outline can be setup to be
the vessel heading and the extended heading line setup as COG will give a visual
representation of the effect of tide on the vessel.
•
Check the Gyro box to display an extended track line using the current true heading
from NMEA or true heading calculated from magnetic heading and magnetic
variation.
Parallel Indices
These are additional extended track lines drawn parallel to the central extended track line.
•
-
Check the COG box in the parallel indices group to display the lines using the
current Course Over the Ground of the vessel.
68
•
Check the Gyro box in the parallel indices group to display the lines using the
current true heading from NMEA or true heading calculated from magnetic heading
and magnetic variation.
•
Wdith - set the total separation between the port and starboard lines in the width
edit box.
Log
The Log page of the Navigation Properties property sheet allows the vessel log recording
facility to be configured.
•
Check the On box to turn the overall vessel logging facility on. If this box is not
checked then no logging can take place. Note that this does not affect the track log
in any way.
•
sub--groups
Log recording sub
The Log recording group contains a number of log recording subgroups. Each one enables the recording of position plus certain other
parameters to the vessel log - the exact list is displayed in the sub-group
title. The choice of which group(s) to use is up to your requirements
and the spread of data available from your external instruments.
Each sub-group contains a box, which must be checked to enable it.
The time field allows the logging interval to be specified; the number
fields can be edited directly or the spin controls can be used to change
values step by step. Clicking and holding a spin control makes it cycle
rapidly through the allowable range of values.
-
•
Log File Daily Name Change group
Check the Off radio button if you want seaPro to use the same log file name every
day. In this mode, the log file name will only be changed when you select another
log file or create a new one.
Check the At midnight UTC time button to make seaPro generate a
new log file name automatically at midnight UTC time. This ensures that
log files do not get too large and provides a handy daily breakdown of
your vessel movements. This affects the vessel log and the track log.
The file name chosen is always of the format YYMMDD00 (where YY is
the lowest 2 digits of the year, MM is the month number in the range 01
to 12 and DD is the day number in the range 01 to 31).
Check the At midnight local time button to make seaPro generate a new log file
name automatically at midnight local time. The details are as per the At midnight
UTC time described above.
•
Log File Type
Check the Additional ASCII text file box to record a plain-ASCII text version of the
vessel log and track log files in addition to the normal compact binary files. Most
users will not need to use this facility, but it can be useful for those wishing to
quickly export log data to other programs such as spreadsheets for analysis
purposes.
69
Display
This controls what information is displayed and how it is displayed.
Plot options
•
Check the Route box to display the active route on the charts.
•
Check the Route text box to display the waypoint names for the active route on the
charts.
•
Check the Track box to display the active track log on the charts.
•
Check the Previous track box to display the currently selected previous track log on
the charts.
•
Check the Plan box to display the active plan on the charts.
•
Check the Plan text box to display the leg text information for the active plan on the
charts.
•
Check the Plan ETA box to display estimated time of arrival at each waypoint
•
Check the Waypoints box to display the active waypoint database on the charts.
•
Check the Waypoint text box to display the waypoint names for the active waypoint
database on the charts.
Vessel rings
This group allows the configuration of the range rings drawn around the current vessel
position on the charts.
•
Check the On box to display range rings on the charts.
•
Check the Autosize box to fix the size of the ring regardless of the scale or level of
zoom of each chart. Uncheck the Autosize box to make the radius of the ring
exactly equal to the size specified in the Radius field as the charts are zoomed in and
out.
•
Set the number of concentric rings using the Number field.
Vessel shape
This group allows the configuration of the vessel shape drawn on the charts.
-
•
Check the On box to display the vessel shape on the charts.
•
Check the Show as ring at < 1knot box to revert to showing just a ring around the
vessel position when the vessel is not moving. This alleviates the problem of trying
to show a vessel heading when the current heading is not determinable.
•
Check the Show as unscaled box to display the vessel shape scaled to a fixed size in
pixels regardless of the scale or level of zoom of each chart. The size specified in the
vessel shape file is scaled by the value in the Magnify field.
70
•
Uncheck the Show as unscaled box to display the vessel shape equal to the scale size
specified in the vessel shape file. The vessel shape will then change to the correct
scaled shape for the current chart view. The accuracy will depend on the chart scale
and amount of over zoom. Magnify has no effect in this mode.
The default is on.
True heading group
The options in this group allow you to decide how seaPro will obtain true heading for use
when plotting the vessel shape. Choose one of the following.
Note; that if the chosen data source is unavailable the vessel will be plotted as a black circle
rather than a shape:
Gyro - true heading is taken from NMEA, if available, such as from a gyro
instrument.
Use COG - the current Course Over the Ground of the vessel is used instead of
true heading.
Calculate from magnetic - the current estimate of magnetic variation is used to
correct the magnetic heading taken from any NMEA HDM sentence received from
an external instrument.
auto--scrolling
Chart auto
To scroll the chart so that the current position of the vessel is always shown, the auto chart
scrolling is used. Selecting the chart autoauto-scrolling button on the graphic toolbar will cause
the vessel to always be shown on the screen.
The chart scroll position is set at approximately 20%., i.e. the chart will be scrolled when the
vessel is within 20% of the edge of the chart display. The chart is then scrolled so that the
vessel is placed in approximately the centre of the chart display.
Scroll when x % of chart edge
Use this to select when ‘look ahead’ is Not enabled. This sets how close the
vessel can move to the edge of the display before the chart is scrolled. 45 % is
close to the centre of the display, 1 % is at the edge of the chart.
-
71
Look ahead
The look-ahead settings allow the vessel to be scrolled so as to display more
information ahead of the vessel (based on its current heading). The facility will only
operate if there is valid COG input and the SOG is greater than 2knots (so value of
COG is valid).
On Scrolling - position vessel x % of chart
Use this to select how far from the edge of the display the vessel should be
displayed after a scroll. 45 % is close to the centre of the display, 1 % is at the edge
of the chart.
Slider bar
Use this to select whether the vessel is moved or whether the vessel’s position is
fixed on the display and the chart is scrolled underneath.
The slider can be moved to the left, to allow the vessel to continuously move across
the chart till the scroll point is reached, or to the right to allow the vessel remain
fixed.
These two settings correspond to the ECDIS terms ‘True motion’ – vessel moving
across chart and Relative motion display vessel remains stationary.
Moving the slider between the two ends, gives a relative mix of the two. Here the
vessel will be allowed to move across the chart for a certain distance and then the
chart is scrolled underneath it.
This has the advantage of reducing the processing power required for the full chart
scroll especially if databases (logs and gxf files) or multiple charts and cells are being
displayed.
-
72
NMEA Rx
The NMEA Rx page of the Navigation Properties property sheet allows the handling of
various NMEA sentences to be configured.
Note that this page does not prevent reception of these sentences, it merely determines
whether or not seaPro will actually use the data from them if and when they are received.
The NMEA monitor window shows all incoming NMEA sentences regardless of whether or
not they are enabled in the NMEA Rx page. This may prove helpful in identifying which
NMEA sentences are sent by your GPS receiver.
Position
Position sentences
This group allows the selection of the main source of vessel position
information for seaPro. It is possible to select only one, so you will need to
experiment when setting up your system if you do not know which NMEA
sentences are sent by your GPS receiver. Ideally setup your GPS receiver first
then match the sentence being output by the GPS within seaPro.
•
Check the RMC box to use position, COG and SOG from the RMC sentence.
•
Check the GGA box to use position and GPS status from the GGA sentence.
•
Check the GLL box to use position from the GLL sentence.
•
Check the GCA box to use position from the GCA sentence.
•
Check the GXP box to use position from the GXP sentence.
•
Check the Sat.Com. box to use position from the satellite communications
interface. This facility is not available on all versions
•
Check the Any of the above if you are not sure which sentence your position
fixer is using.
Note: If you are using differential GPS, you should not select this option, as having
the GGA and any another sentence present may cause the navigate change of status
warning messages to be repeatedly displayed.
Ignore from talker II option
If you connect your GPS directly into seaPro, and then output this to your
Integrated Instrument (II) system, the II system may resend this information back to
seaPro. This is then resent back to the II system, resulting in a ‘howl round’ effect.
This may result in lost information or corrupted position information being sent
from the II system as it struggles to keep up with the data overload.
To overcome this effect, select Ignore from talker II, all position and COG/SOG
information will be blocked that has the talker ID of II (Integrated Instrument).
Information from your GPS input will not be effected.
If the II system is the originator of the position information, then you should Not
use this option, but make sure seaPro is not re-sending position information.
-
73
Other group
This group allows the selection of other instrument NMEA sentences for decoding,
displaying in the instrument panel and writing to the vessel log. Choose as many as
you require.
•
Check the RMC box to use just COG and SOG from the RMC sentence. This
option is unavailable if you have already selected RMC in the Position group.
•
Check the VLW box to use log from the VLW sentence.
•
Check the VHW box to use speed and heading log from the VHW sentence.
•
Check the VWR/MWV box to use wind speed and angle from the VWR and
MWV sentences.
•
Check the DBT/DPT box to use depth from the DBT and DPT sentences.
•
Check the VTG box to use COG and SOG from the VTG sentence.
•
Check the VDR box to use tidal set/drift from the VDR sentence.
•
Check the MTW box to use water temperature from the MTW sentence.
•
Check the TOB box to use battery voltage from the TOB sentence.
•
Check the HD
HDT
T box to use true heading from the HDT sentence.
•
Check the HDM/HDG box to use magnetic heading from the HDM and HDG
sentences.
•
Check the MTA box to use air temperature from the MTA sentence.
Max GPS speed
Some GPS/PC configurations can cause occasionally jumps in the GPS values
received. These jumps are very transient (<1 second) and large and so obviously
incorrect that they do not present a navigation problem. They can, however, cause
erratic scrolling of the chart (auto-scroll mode) and create false entries in the log as
well as untidy tracks.
To filter out these jumps seaPro monitors the maximum rate of change of position.
Enter the Max rate of change (GPS speed) you expect, a value of 500 kts. is good for
most sea or ground applications. The value should be a lot greater than your
expected max speed as the time difference used to calculate the value is short (<
1second) resulting in very approximate rate changes.
The delay value controls over how long a period the speed is checked for. After this
period of time the current position is considered to be correct. As the values are
transient a value of 5-30 seconds is suitable.
Note: If the position on the GPS display is also incorrect, then there is probably a
fault with the GPS system itself.
Special
Speci al Air operations
-
74
This allows the product to be used in an aircraft allowing GPS altitude to
be interpreted as depth values – and displayed in the appropriate
instruments.
NMEA Tx
The NMEA Tx page of the Navigation Properties property sheet allows the transmission of
various NMEA sentences to be configured.
Position/speed group
This group allows the selection of one or more position and speed
NMEA sentences to transmit. The position and speed used is the latest
recorded for the vessel for as long as it remains valid.
Echo Rx to Tx group
This group allows selected incoming NMEA sentences to be retransmitted to the
active NMEA output port. This is particularly useful when you are not running an
NMEA instrument network on your vessel and need to feed information on to other
instruments.
Autopilot group
This group allows the selection of NMEA sentences for the control of an external
autopilot. Please refer to the manual for your autopilot to determine which
sentences are required.
Interval
The Repeat Interv
al slider sets up the interval at which the set of sentences is
sent to the autopilot.
Setting the precision for position sentences
Some earlier GPS sets and autopilots are not able to work with the NMEA 183
sentences that have a position resolution of more than two decimal places. Use
this option to set the required resolution (recommended value is 3 for most
systems).
-
75
Radar
The RADAR page of the Navigation Properties property sheet allows the configuration of
data to be received from one or more ARPA Radars connected to a PC serial port and the
manner in which seaPro is to use this data.
Receive NMEA Sentences
This allows the selection of various NMEA sentences that may be sent by an ARPA
RADAR. seaPro will accept the common NMEA sentences for own ships data and
tracked tardets which are output by most commercial and leisure systems.
•
Check the OSD box to enable reception and use of the Own Ships Position.
•
Check the TTM box to enable reception and use of the list of targets tracked by
the ARPA RADAR
Target Display Group
This group allows the display of tracked targets to be controlled
•
Check the Show track box to show the recent track followed by each target on
the charts
•
Use the target colour drop-down list to select the colour used for the targets
drawn on the charts
•
Use the Track colour drop-down list to select the colour used for the track
followed by targets drawn on the charts.
Note: the number of targets displayed is limited to 32.
Logging Group
This group allows the control of tracked targets data to be logged to the RADAR log
file.
•
Check the On box to enable the log recording.
•
The time field allows the logging interval to be specified; the number fields can
be edited directly or the spin controls can be used to change values step by step.
Clicking and holding a spin control makes it cycle rapidly through the allowable
range of values.
Alarm Areas group
This group allows you to select whether or not RADAR alarm areas are to be shown on
the charts.
•
-
Check the Own vessel area box to show the alarm areas around your own
vessel.
76
•
Check the Defined areas box to show the user-defined alarm areas.
•
Use the alarm radius edit box to specify the alarm area radius, which is common
to all alarm areas.
Note: changes made to the settings of the controls in these pages will only be applied if
the OK button is used to close the property sheet.
Radar band switching
This feature enables vessels fitted with both an X band and S band ARPA radar to show
either radar targets on the chart screen.
It is necessary to select the correct com port that each radar is connected to, to enable
seaPro to know which are the X band targets and which are the S band targets.
When the correct ports are allocated the appropriate radar may be chosen under the
Radar menu. Choosing the X band option will cause the X band tracked targets to be
displayed, whereas selecting the S band option will cause the S band tracked targets to
be displayed. Targets market on the screen will now be preceded by either X or S to
indicate which radar they come from (e.g. X 01, X 02 or S 01, S 02 etc).
Selecting serial communication ports
Select the Serial ports option from the Setup menu.
The Port Assignment group on this page shows the serial ports currently selected, note:
-
•
The NMEA Rx check boxes show from which serial ports incoming NMEA
sentences will be accepted.
•
The NMEA Tx radio buttons allow the selection of one serial port from which
outgoing NMEA sentences such as autopilot commands will be transmitted.
77
•
The Marker Tx radio buttons allow the selection of one serial port from which
outgoing target marker flag NMEA sentences will be transmitted. This may be
set to the same port as the NMEA Tx port if required.
•
The Power Cable check boxes allow serial ports to be set up to provide
electrical power to the electronics contained in a Euronav NMEA interface cable
when used.
Note: In the seaPro Standard version, only two serial ports may be used to cover all the
above options. In the seaPro Plus and Professional versions more than two ports may
be used. An error will be displayed if you try to select more than 2 ports on the
Standard version.
The Control group contains settings that apply to all serial ports simultaneously:
•
•
Check the Use checksums box to make seaPro reject incoming NMEA
sentences that do not have the correct checksum.
Check the Disable all ports box to turn off all serial ports in seaPro.
Note: Changes made to this dialog do not take effect until the OK button is pressed
AND you have exited and restarted seaPro.
-
78
Networking
This option is only available on seaPro Plus and Professional versions.
seaPro can share data in a number of ways:
Using a Network dongle (red dongle)
If you have purchased this option you will be able to run more than one copy of seaPro
across your network. This allows you to have one set of charts to be used by multiple
users.
The licensing for networked charts varies depending on the application. Please call
Euronav sales or your local supplier for more details.
Using the network
network NMEA sharing
Note: this is only available on plus versions and above
If you have a TCP/IP Network, you can share the data received from the NMEA 0183
interface (GPS position, Wind, radar ARPA targets etc) on one computer running
seaPro with another computer running seaPro. The system is also compatible with the
Euronav Passenger Information system, which can act as a client for seaPro.
The computer receiving the NMEA data is designated the server; all the other
computers are designated as being clients.
You need to have a copy of seaPro for each computer (this can be a central network
dongle or an individual dongle on each computer).
Before setting seaPro to use the networking facility, please ensure that your network is
fully operational and that each computer can see each other. You will also need to know
the network IP address of the computer to be used as the server. If you do not know
how to use this, please seek the advice of your network supervisor.
Note: the server can have either a fixed address or one issued by a name server.
-
79
Setting up the server
Select Setup from the Main menu and Network from the drop down menu, then
select Setup NMEA Network from the side menu. The network dialog, as shown
below, will then appear.
Select Act as server, then tick the Auto IP address (alternatively you can enter the
server IP address).
The server port should normally be left at the default value of 720.
Setting up the clients
As for the server (above), but instead of selecting the Act as server option on the
dialog, select Act as Client.
Either enter the fixed IP address of the server or if you have a network with a name
server that automatically assigns IP addresses, enter the full name of the server.
When sending over the Internet, a fixed IP address is the easiest solution, however
not all ISP will issue a fixed IP address.
You will need to tick the required option button to allow access to the required
entry field.
The port value should be the same as the server (default 720).
If the network is operating correctly, the NMEA data being received by the server,
data should then appear in each of the seaPros.
Network Route Sharing
Route Sharing across a Network
This feature allows routes and tidal plans to be shared in real time across a TCP/IP
network between seaPro navigation stations, such as a fly bridge and main bridge..
One computer is designated the server; all the other computers are designated as
being clients. All the clients will use the current route and plan in use by the server.
-
80
If the route is changed on the server, this is then changed automatically on the client
seaPro systems stations
The system can be set up to allow other seaPro stations to become the server
(master) on request, or the server can be set up to prevent this i.e. the main seaPro
Navigation system always has control.
Note: Setting up of the system does require some technical knowledge of TCP/IP
networking. If in doubt, please ask for assistance from your IT consultant/dept.
Once set up the operation of shared routes is then very simple.
The route and tidal plan information generated on the server will be
sent out to all of the clients. Any changes made on the server will be
reflected on the clients. The route sharing is independent of the NMEA
data networking facility – for example, a computer that is acting as a
server of NMEA data may be a route-sharing client.
You need to have a copy of seaPro for each computer (this can be a central network
dongle or an individual dongle on each computer).
Before setting seaPro to use the networking facility, please ensure that your
network is fully operational, and that each computer can see each other. You will
also need to know the network IP address of the computer to be used as the server.
If you do not know how to find this out, please seek the advise of your network
supervisor.
Each copy of seaPro will be in one of the following states;
•
Disabled – not participating in the route sharing
•
Client – receiving route information from the server
•
Server – supplying route information to the clients
Setting up route sharing
You will need the following information
The name or IP address (such as 192.168.0.23) of the computer (or
computers) to act as a route servers
Setting up the route server
Select Setup from the main menu and Network from the drop-down menu. Then
select Setup route network from the side menu. The dialog as shown below will
appear on the screen
-
81
.
The options available will change depending on which boxes are ticked
Disabling routeroute-sharing
To disable route sharing, select Setup from the main menu and Setup from the dropdown menu, then select Setup route Network from the side menu. The Route
sharing mode should be set to Disable.
SeaPro as a route server/host
Act as server – tick box
Either click Auto IP address, the system will then automatically use the correct IP
address for the computer. If the computer has multiple IP addresses, leave this unticked and manually enter the IP address in the Server IP address below.
Relinquish Server status - Select if you want this server to relinquish control on
request from another server, useful if control needs to be taken from a remote
bridge etc.
Request other servers become clients – Select to request another server to become
a client when this server comes on line (if set up to do so)
Show clients button - Press this button to view a list of logged on clients
Disable clients -This will disable all clients and they will need to re-log on
Further information
informati on
Once the dialog is closed, seaPro will search its list of hosts to ascertain if there are
any other servers present. If no other servers are present then it will become a
-
82
server and will be ready for clients to connect. If there is already another server
present then this copy of seaPro will disable its route sharing.
Two options control the behaviour of the route server
•
•
Relinquish server status on request – if this option is set then this host will
honour any requests from other hosts for it to give up its host status. If this not
set then this server will refuse requests for it to give up server status, effectively
preventing other computers becoming servers.
Request other servers become clients – if this is set then if this computer
detects another server then it will send a request to that server asking it to give
up server status and become a client (whether this request is honored depends
on the setting of the “Relinquish server status on request” option on that
server).
seaPro as a route client
Act as a client – tick box
You now need to add a list of potential route host/servers, the client needs to know
which computers may be a server, so it can request a service.
You can add and delete computers in the server host list by pressing the appropriate
button; the server can either be the servers computer’s name or the specific IP address
of the server (has to be fixed address).
Once the settings dialog is closed, seaPro will attempt to find a server using the
addresses in the hosts list. When a server is detected this copy of seaPro will register as
a client. Route information is sent out periodically from the server to all of its clients.
This includes both the route and any tidal plan. Control of the active leg of the route
and hence autopilot control is controlled by the individual clients.
More information
The hosts list - If connection to the server is lost, then a client will search through the
computers in the host list to try to find a new server.
At startup, seaPro will attempt to resume the route-sharing mode that it was last using.
Thus, if a system was operating as the server it will attempt to re-establish itself as a
server – however it will first check that no other computer is operating as the server.
When a client is restarted it will search through its host list and attempt to find a server
to connect to.
NMEA connection status window (window menu)
Messages regarding the status of the route-sharing network are displayed on the NMEA
connections status window. To distinguish between route and NMEA data network
messages, those from the route share system are prefixed with ‘ROUTE:’.
-
83
Target marker Flag
The Target Marker flag has a number of features:
•
Can be dropped anywhere on the chart display using the cursor
•
Can be automatically controlled from the Target marker NMEA 183 input –
allowing remote control from a radar etc.
•
Gives distance, bearing, and Time To Go for the vessel to reach the marker
•
Can be used to send information to a second NMEA 183 output channel (radar)
•
When used in the Performance Sailing version, the sailing instruments will take
this as the next waypoint rather than the route waypoint allowing the sailing
laylines to be displayed from the target flag
When receiving a waypoint through the target marker flag NMEA 183 input channel
(typically from a radar or MOB button) the position can be recorded into the log.
When receiving waypoint information WPL to move the marker from an external
source, the position will only be updated when the position changes, making it suitable
for senders that continuously send the same data
Target marker flag
The
button on the graphic toolbar toggles the Target marker flag facility on and
off. When a manual marker flag is placed on a chart, the instrument panel can give
constantly-updated steering information for reaching that position, and NMEA sentences
can be sent to external instruments such as a RADAR display so that the marker can be
used as a RADAR “lollipop”. Only one target marker flag can be active at a time in
seaPro.
•
When the light in the top right corner of the button is red the facility is off.
•
Left-clicking the button while in this state causes the cursor to change to a
cross-hair while over any chart windows; left-click on a chart to drop a marker
flag there.
Right-clicking the button while in this state causes a manual entry dialog to be
displayed into which you may type the position.
•
-
•
When the light in the top right corner of the button is green, the facility is on.
The marker flag is shown on any charts covering its position, the target marker
flag instrument is operative and configured target marker flag NMEA sentences
will be transmitted if the target marker flag serial port has been enabled.
•
Left or right-clicking the button while in this state cancels the active target
marker flag.
84
Setting up the marker flag
Tx
Send for
The NMEA sentence sent can either be related to the target marker or the current
route or off
NMEA sentence
Selects the required sentences
Rx
Selects the sentences to be decoded
Marker
On receiving a NMEA WPL input the Marker flag will treat it of the type selected
-
85
Alarms
seaPro allows the current position of the vessel to be detected with respect to user
defined area(s), the alarm can be triggered when
•
•
•
The vessel enters an area (exclusion zone)
The vessel leaves an area (anchor)
The vessel enters or leaves an area.
Differences between the different seaPro versions:
•
•
Standard version and plus ;
A single circular area can be defined.
Pro versions ;
Multiple alarm areas can be defined as circles, rectangles or polygons.
The alarm is given by an audible indication and a message in the alarm status box (alarm
button will go red to indicate a changed condition).
Note: This is a different system to the radar alarm that detects external ARPA targets
entering and alarm area.
WARNING:
If you have a sound card fitted you may not hear the audible alarm if the audio system is
switched off or volume turned down.
Due to the ambient noise level, you may not be able to here the audible alarm unless
connected to an external alarm system.
SAFETY
The alarm system should only be use to assist with normal good watch
keeping/navigation practices and not to replace them.
Cancelling an alarm
Press the alarm button on the main toolbar. The alarm status window will be displayed
and the alarm silenced.
Standard/plus alarm
From the settings menu, select Alarm zones, and then Modify Alarm zone, move the
cursor over the centre of the required circle, press the left mouse key and drag the
circle created to the required radius.
-
86
Pro alarm
From the settings menu, select Alarm zones, and then Modify Alarm zone, the alarm
zone toolbar will appear
The toolbar is used in the same way as the overlay toolbar, to define the required alarm
areas. Different alarm zones can be created, modified and saved as required. The last
one selected is used for the alarm detection.
By default the alarm zones are displayed as transparent red areas.
Modifying the
the Alarm Zone Properties
From the setup menu, select Alarm zones, and then Alarm Zone properties. The
properties dialog box will appear.
Select the required condition for the alarm to occur on.
If you do not want to actually display the alarm zone on the charts, then tick the ‘Hide
alarms area’ box. The alarm will still function will still function if set.
If the alarm properties are set to off, the areas are not displayed unless the tool bar
(plus/pro version) is being used.
Alarm Sounds
When an alarm condition occurs, an audible alarm can be triggered.
-
87
Selecting Beep will issue a standard beep to the PC’s built in speaker. The Wave option
will play the selected sound (wav file). You can add different .wav files as required to the
‘Sounds’ folder in the seaPro folder.
Instrument panel
The seaPro instrument panel is the tall, narrow window displayed at the right hand
side of the main window. It is customisable and can contain a number of instrument
sub-windows showing information such as vessel position, wind speed, depth and so
on, as received from external instruments via NMEA sentences . It also contains
windows showing data generated by seaPro such as the current plan performance.
Note: Many of the instrument fields can only show information if an appropriate
NMEA sentence has been received - if any fields are blank on your system then
check the following:
•
•
The correct NMEA sentences have been enabled in the NMEA Rx page of
the (Navigator properties ) property sheet.
Your instrument(s)/instrument network are able to send those sentences.
Caution: Using the instrument panel reduces the available screen area for your
charts. The instrument panel size is largely determined by the fonts used for text
displays in the instruments. Regardless of your screen resolution, the only way to
minimize the screen area used is to make sure the Windows display settings in your
system specify "small fonts" rather than "large fonts".
Instrument panel properties
The Panel properties dialog allows the selection of the instruments to be shown in
the panel.
To display the dialog, use one of the following methods:
•
•
Right-click the panel title bar to display the panel context menu then select
the Properties option, or
Select the Properties option on the Inst menu.
Select the required instruments by checking the boxes.
•
Check the Titles box to display the name of each instrument as a title bar for
the instrument window. This takes up more screen space vertically in the
panel, so if space is at a premium and you are confident you know which
instrument is which in your selection then you can uncheck this box. Note:
this change will not take effect until the next time that you start seaPro.
Finally press the green tick button to accept the changes or the red cross button to
cancel them.
-
88
Navigator instrument
The Navigator instrument is always shown in the panel and occupies the top position.
It shows the current vessel position, course over the ground and speed over the
ground as received from an instrument such as a GPS receiver.
The left-hand light of the
icon shows whether GPS position is available
(green) or unavailable (red). The right-hand light of the
DGPS position is available (green) or unavailable (red).
icon shows whether
Press the
button to display the GPS satellite status window, which can display
information regarding satellites currently in track as received from certain GPS
receivers.
Log fix instrument
The Log fix “instrument” allows you to drop marker flags onto a chart. The flags will
also appear as entries in the vessel log. The left-hand flag is intended for use as a
man-overboard marker, but has no other additional properties.
•
•
Left-clicking a flag button will cause it to be dropped at the current vessel
position if available.
Right-clicking any flag button allows you to move the mouse cursor over any
chart, whereupon the mouse cursor turns into a cross-hair symbol, left click at
the position where you want to drop the flag.
Plan instrument
The Plan instrument shows a summary of the data originally calculated for the
currently selected leg of the active plan. The data bears no relation to how well the
vessel is adhering to the plan. If no plan is active then no data will be shown.
-
89
•
•
•
•
•
Wpt is the waypoint number at the end of the current leg.
Dist is the distance of that leg in nautical miles.
BrT is the true bearing between the two waypoints.
CTS is the course to steer taking magnetic variation and tidal effects into
account.
ETA is the expected time of arrival at Wpt.
•
The
button allows the Plan information window to be displayed.
Plan actual instrument
The Plan actual instrument shows a summary of data showing how the vessel is
currently performing while following the selected leg of the active plan .
•
•
•
•
•
•
•
-
Wpt is the waypoint number at the end of the current leg.
Dist is the distance to Wpt in nautical miles.
BrT is the true bearing to Wpt from the current vessel position.
XT is the cross track error, showing the direction to steer to get back onto the
planned leg (Left or Right) and the perpendicular distance of the vessel from
the planned leg.
TTG is the time to go until Wpt is reached, at the current speed. This can only
be displayed if the vessel is actually moving.
ETA is the expected time of arrival at Wpt, at the current speed. This can only
be displayed if the vessel is actually moving.
ETR is the expected time of arrival at the end of the whole planned route , at
the current speed. This can only be displayed if the vessel is actually moving.
•
button allows the plan to be manually advanced to the next leg.
The
This enables you to give up trying to reach a waypoint and choose another
instead. This is also the method for selecting the first waypoint when using
the reroute facility.
•
button allows the plan to be manually retarded to the previous leg.
The
This enables you to give up trying to reach a waypoint and choose another
instead. This is also the method for selecting the first waypoint when using
the reroute facility.
•
The
button allows the Plan information window to be displayed.
90
Target marker flag instrument
The Target marker instrument shows how the vessel is situated relative to the
currently active target marker flag, if any.
•
•
•
The Dist field shows the distance from the vessel to the marker flag in
nautical miles.
The BrT field shows the true bearing from the vessel to the marker flag.
The TTG field shows the time to go until the marker flag is reached, at the
current speed. This can only be displayed if the vessel is actually moving.
Wind instruments
The Wind (apparent) and Wind (true) instruments show the most recent
measurement of wind received by seaPro. The graphic vessel indicator shows a
yellow line representing the wind direction.
•
•
-
The Dir field shows the wind direction.
The Spd field shows the wind speed in knots.
91
Log/gyro instrument
The Log and gyro instrument shows the latest speed and distance information
received.
•
•
•
•
•
•
The Speed field shows vessel speed in knots, taken from the NMEA VHW
sentence.
The Gyro field shows the true heading of the vessel.
The Hd M field shows the magnetic heading of the vessel.
The Depth field shows the depth below the depth transducer.
The Trip field shows the distance travelled by the vessel on the current trip,
taken from the NMEA VLW sentence.
The Log field shows the total distance travelled by the vessel, taken from the
NMEA VLW sentence.
ARPA RADAR instrument
The ARPA RADAR instrument shows target information from compatible ARPA
radar. This facility is not available on the seaPro Standard version. See the Radar
Chapter for more details.
Depth instrument
The Depth instrument shows the most recently received depth below the vessel
depth transducer in meters and also displays a real-time graph of the last 150 depth
soundings received by seaPro.
-
92
IMPORTANT WARNING! The graph is automatically scaled in the vertical axis to
make the curve drawn between those 150 points fit the window to as useful an extent
as possible. We recommend that you only use the graph as a simple guide to the
trend in depth changes over a period in time. Do not try to infer actual depths directly
from the graph!
Auxiliary instrument
The Auxiliary instrument shows the following information:
•
•
•
The Water(C) field shows the water temperature in degrees centigrade, taken
from the NMEA MTW sentence .
The Air Temp field shows the air temperature in degrees centigrade, taken
from the NMEA MTA sentence.
The Log field shows the total distance travelled by the vessel, taken from the
NMEA VLW sentence.
Time instrument
The Time instrument shows the current PC time, both as UTC and as local time. The
latter depends on the daylight-saving and time zone values currently in effect in
Windows95/NT for your PC. See seaPro time recording for more information on how
seaPro uses the PC time.
Instruments overview
The Instruments overview window shows the values of some of the most important
navigation parameters such as position, speed and heading. To display the dialog,
use one of the following methods:
-
93
•
•
Right-click the panel title bar to display the panel context menu then select
the Overview option.
Select the Overview option on the Inst menu.
GPS satellite status window
The GPS satellite status window shows information decoded from NMEA GSV and
GGA sentences where available.
•
•
•
•
•
•
-
The signal to noise bar chart shows the signal strength of the signal for each
GPS satellite being tracked by your GPS receiver, together with the identity
number (PRN) of the satellite.
The sky view plot shows a view of the sky taken as though you are looking
upwards, with North at the top and therefore East at the left, West at the right
and South at the bottom. The center of the plot is straight up in the air, while
the outer circle is the horizon. The numbers plotted are the satellite PRN
numbers and show where each satellite is currently located.
The Using field shows how many satellites are actually being used by your
GPS receiver to calculate the vessel position.
The Horiz.Dil. field shows the horizontal dilution of precision for the position
calculation, which is a measure of the calculation accuracy.
The GPS status field shows the type of position fix calculated: No fix, GPS fix
or DGPS fix.
The Est.Horiz. Error (m) field shows the current estimate of horizontal error in
the actual position calculated.
94
8
Radar
seaPro is able to receive and display target data from an NMEA 0183 compatible ARPA
radar, which can then be shown (repeated) over the electronic chart. Up to 32 targets can
be tracked. See the Appendix B for details on interfacing.
Displaying Radar Targets
on the graphic toolbar toggles the ARPA Radar display on and off.
The radar button
When the light in the top right hand corner is green, the facility is on; when it is red, the
facility is off.
The ARPA feature requires you to acquire the targets on your radar and these are then
repeated through NMEA to seaPro.
In addition to displaying the tracked targets, seaPro can allow you to change the vector
length of the target so that you can see where the target will be in a defined time (much the
same as the extended heading line). To change the radar vector time, choose Radar from
the main toolbar and then choose a time from the subsequent toolbar.
In addition, a database of user-defined alarm areas can be created and displayed on the
charts.
Using X band and S Band Radars
When setup for use with both an X band and S band radar (see Setup Chapter), you can
toggle between which radar targets are being displayed. It is not possible to display both X
band and S band targets simultaneously. To choose to display X band radar targets, from the
Radar menu select X Band, similarly, to display S band radar targets, choose S band from
the Radar menu.
RADAR Alarm Areas
There are two types of radar alarms that are triggered if an ARPRA target enters an alarm
radar zone:
•
Own vessel alarm zone
•
Database of alarm points with a surrounding area
Own Vessel – this is a moving circular area surrounding the vessel. The alarm radius is set to
that of the vessel range ring, if you are using the ‘Auto size’ range ring, the manually set value
is used.
To set the range: select the Setup option from the main menu and then select Nav
Properties. Then select the Display tab. If using auto range ring, unselect the option, set the
ring radius as required. Re-select auto range if required.
Database Alarm
seaPro supports an unlimited list of RADAR alarm areas. The vessel area is the same as the
vessel range ring defined by the user. In addition, the same radius of circle can be applied to
the current own-ships position.
-
95
When your own vessel enters or leaves an alarm area, a warning is sounded and a text
description is added to the alarm system.
The alarm areas are stored in a database. To select, create or edit a database, use the Alarm
Database option on the Radar menu.
Alarm Database Menu
This menu gives control over the currently selected Radar alarm database file, which
contains the list of active alarm areas.
•
Use the Select option to select an existing database to the current one.
•
Use the New option to create a new empty database.
•
Use the Add option to start a new entry of a new alarm area. The cursor will
change to a cross-hair symbol when over a chart. Move the cursor to the required
centre position and click the left mouse button to select that position as an alarm
area. Alternatively, click the right mouse button to cancel.
Note: the alarm circle will not be displayed on the chart unless the Defined areas box is
checked on the Radar page of the Navigation Properties property sheet.
-
•
Use the View option to view a text list of the alarm areas in the database.
•
Use the print option to provide a printed copy of the text list of the alarm areas in
the database.
96
9. AIS - Automatic Identification System (option)
Introduction
One of the great dangers to vessels at sea is not knowing the position or intentions of other
vessels. Blind calling of vessels is unreliable and ARPA gives no information on who the
vessel is or their intentions.
UAIS (often shortened to AIS) solves this problem by enabling suitably AIS equipped vessel
to know the name, call sign and other information about other vessels fitted with AIS in the
local area.
The system has other characteristics that make it suitable for use in VTS and other traffic
control systems.
seaPro AIS graphical display
AIS uses a transponder (a transmitter/ receiver) working on allocated VHF channels in the
marine band. Technically the system is a similar (but more sophisticated) version of the
marine GMDSS DSC VHF system, where vessels can send information to shore stations with
their position, status etc.
The AIS system can be controlled by a shore station (VTS centre etc) or will work
independently away from any control of a coast station.
-
97
The AIS transponder is basically a black box device, and for commercial carriage
requirements has a minimum keyboard and display system giving very little useful
information or benefit to the user. When interfaced to an electronic chart system such as
seaPro, the AIS system turns into a very powerful, but easy to use tool for monitoring the
current traffic situation of AIS fitted vessels.
There is a rolling introduction of mandatory carriage requirements for categories of
commercial ships and in certain waters for all vessels over a given length. The downside is
not all vessels are required to be fitted with AIS.
The seaPro AIS interface allows the information from the transponder to be displayed on
the seaPro navigation display giving a clear view of the traffic situation in relation to own
ships movement. seaPro enables the sending of messages and alteration of dynamic voyage
information to the transponder, a task that is not particularly easy on the small display
interfaces supplied with most transponders.
The seaPro AIS interface will work with any Transponder that supports the standard NMEA
183 AIS sentences.
seaPro has the ability to build a network of AIS units for collecting and sharing vessel
information over local area networks/ Internet or simply on multiple navigation displays on
you own vessel.
AIS Display Icons
There are 4 basic styles of icon (IMO recommended symbols)
Active icon - vessel is current moving
Sleep vessel - vessel is stationary (or is moving very slowly)
Lost target (it flashes until acknowledged)
Base station
Each target is shown with its own track, hi-lighted if selected.
Selecting a vessel using the target Icon in the toolbar causes the chosen vessel to be outlined
in a dotted magenta selection box as shown below
-
98
UAIS Toolbar
The AIS functionally is controlled through a single floating toolbar. The AIS toolbar
can be accessed from the Setup menu->Show AIS toolbar
Toolbar buttons
Select vessel – Enables selection of any one vessel to provides a new window
with full details on that vessel.
Left click the cursor over the target of interest, the vessel becomes the
current AIS target. The vessel is hi-lighted to indicate selection
A vessel information window will pop up displaying all available AIS data on the selected
target.
The pop up window
can be moved to any
location
on
the
screen, for example
docked over the right
panel
area.
This
location of the window
is saved when exiting
seaPro
The selected targets track will change from a dashed pattern to a solid line and is hi-lighted
in a bright magenta (day colors). The selected target is the one any address Safety Related
messages are sent to.
-
99
Acknowledgement of lost targets
When a target is lost, the icon will flash. The operator needs to acknowledge the target loss
by selecting Select Vessel Icon (target icon) and click on the flashing icon. Once
acknowledged, the icon will stop flashing, and remain on screen until required time out for
objects is reached.
To clear all lost targets use the Log settings memory ‘Reset’ button (this doesn’t delete
target information from the log) - targets will be re-acquired.
To allow your own vessel to be the viewed again, select the View vessel list
button on the AIS toolbar, and press deselect vessel.
Closest Point of Approach (CPS) list window
Important; this information is only a guide and should not be used for collision avoidance
decisions. Radar and visual observations should be used as primary information sources.
Voyage details
Updating dynamic voyage data can be easily done - simply select the required information,
such as vessel status, at anchor, underway, destination, towing etc., and press OK to send to
transponder. seaPro remembers destinations so as you add new destinations a drop down
list is created to select from rather than having to re-enter full details for repeated journeys.
Destination - enter the required destination name. A number of previously entered
destinations can be selected using the pull down arrow. Select the required destination from
the list.
Press OK to update the AIS unit.
-
100
View vessel list and messaging
This feature can be used to obtain an overview of current tracked AIS targets and other
information. A vessel of interest can either be selected by its MMSI number from the list, or
by selecting from the chart using the select vessel icon. The vessel becomes the current
vessel and is hi-lighted on the chart.
Messaging
Messages can be sent between vessels using either Text Messages or Safety Related
Messages (SRM).
Received messages are displayed in the Rx Texts list with date of receiving the source (MMSI
number) vessel.
Other information is indicated as
S
* When a Safety related message
AB
Address message
Res
* Responce required
-
(A) – specific to your vessel,
(B) Broadcast message to all vessels
101
To send messages
Type in the required text in the message window
Note: The AIS system is limited to the type of characters that can be sent. For example
Upper case characters only.
Select Channel to be used, default is Auto.
Note: Selecting A+B may result in some transponders displaying the message twice.
To broadcast to all vessel tick the broadcast box, or select the required vessel from the list.
Note: If the vessel is not in the list you cannot send a message to it (not on air or out of
range)
Press to send as either Safety Related Message (SRM) or a Text Message (Telegram)
Turn on/ off AIS display
Toggles ON/ OFF display of AIS targets and information on the chart display. Use this to
turn off all AIS targets if you need to quickly have a clear view of the chart. Click the
Icon again to resume the display of targets.
Note:
e: AIS logging etc continues in the background – only the display is changed.
Not
Settings
The settings button displays a property sheet allowing the set up of the target details you
want to display and vessel parameters for the transponder.
Configuration
This allows configuration of how targets are displayed on the screen.
-
102
Configuration options
Enable AIS
Tick this box to enable the AIS targets to be displayed.
Use recommended AIS target symbols
If ticked AIS targets are displayed as the recommended shapes, otherwise icons are used to
show the type of vessel, the icons being rotated to show direction of vessel movement.
Default is to use recommended shapes.
Display own vessel
If being used as part of a ship-board navigation system, own ship position is normally
displayed from the GPS set, so untick this box not to display AIS target for your own vessel
otherwise you will have both vessel Icon and an own-ship AIS Icon. Note; own-ship still
appears in AIS list, logs etc.
Calculate Rate of Turn (ROT)
( ROT)
Some vessels carry rate of turn indicators and can transmit this information over AIS. For
vessels that do not have a ROT indicator or if their ROT indicator does not function
correctly, this option gives you the ability to display a calculated ROT(~).The default setting
is off.
Note; Where the rate is calculated the approximation sign ’ ~’ is displayed next to it.
Warning; the calculated rate is only a rough estimate/ guide of the real ROT of the target,
-
103
and its accuracy is limited by many factors including the frequency of updates of the AIS
transmissions.
Use GPS antenna offset given by AIS
Target vessel positions are normally shown based on the GPS position location reported by
the target vessel.
For commercial vessels of some size, the GPS antenna may be at the stern or bow of the
vessel and this may give a distorted position of the target icon. seaPro can calculate the
centre of the vessel to give a better representation of the target location, if the target vessel
provides vessel dimensions and GPS offset details. Tick the box to get seaPro to calculate
the offset position and relocate the target icon. The default is unticked as vessels may enter
incorrect dimensions.
Note; Unfortunately some vessels broadcast incorrect dimensions, so this option may cause
problems. If using this option always consider the possibility the positioning may be
incorrect.
Closest point of approach
seaPro can calculate the approximate closest points of approach for vessels. Click on the
title bar to change the order of the listed vessels.
Important: This information is only a guide, and is limited by AIS transmission rates etc. For
collision avoidance purposes primary source of data should be Radar and visual observations
Extended tracks
tracks & predicted path
AIS targets can be shown with extended track lines based on various time scales (3 to
60mins)
In addition to the simple Extended Track a Predicted Path can be used, this is based on the
Rate of Turn (received from target or calculated if set). The predicted path does not allow
for vessel characteristics, so the prediction is only suitable for short periods.
Predicted paths should be used with caution.
Note: if predicted path is not used then a ROT tag is shown.
-
104
-
105
Details
ls
Fixed Vessel Detai
Fixed vessel details (vessel information that does not change frequently) that is used by the
AIS transponder for transmission to other vessels can be set up directly from within seaPro.
Specific information such as MMSI and IMO number that uniquely identifies the vessel has to
be set up directly using the AIS transponders own Keyboard/ display unit as passwords are
often required. Please refer to your transponders documentation.
Once information is entered, press the Send details
details to transponder button to update the
transponder.
-
106
Displayed Information
AIS targets shown on display can be appended with a label with additional information about
the vessel such as name, call sign etc.. The amount of on screen information can be altered
as required.
Further information can be obtained by using the enquire button or using the list view.
-
107
Logs
AIS information is stored in two separate logs:
a). Database of vessels
b). Reference vessel details against the unique MMSI number
Movement Log of vessels
Contains a log of all vessel movements referenced by MMSI number
The update period for the Movement log can be set as required. If required the ‘Current
displayed vessels’ Reset button can be pressed, this will remove all targets from the display,
and only new active/sleeping targets will be displayed.
Note: This does not reset any of the logs only the on-screen display
AIS Unit faults
Dialog displays a list of error messages or warning received from the AIS transponder, such
as failed transmission, aerial problems no ROT signal etc.
For information/ meaning of the message please see your AIS transponder manual.
-
108
Safety - Related Messages (SRM)
You can view the received/transmitted messages for current session of seaPro using the
View vessel list facility (from toolbar). For previous messages use the Safety tab to view
earlier messages. The list can be reset as required.
-
109
AIS Database information
Technical information
There are a number of databases and logs associated with the AIS system
The data is stored in the following sub folders
In the folder UAIS\Database
UAISVessels.vdb
Database of the static vessel data (MMSI,Name etc) of each vessel
UAISLog.vdb
The main database containing dynamic vessel information such Position, COG/SOG etc.
In the folder UAS\log
UAISStrings.log
A log of received AIS NMEA strings – this is useful for diagnostic purposes and is the file that
should be sent to Euronav if requested.
UAISOutputs.log
Log of sent messages
-
110
-
111
10
Weather
seaPro software supports two means of obtaining weather information, through ‘fax images’
or active digital data files that can be animated over a period of time (generally 3 – 5 days).
Weather Fax Images
This features requires an external Weather fax program or unit that can output the weather
faxes in a standard image format. These images are usually free to receive.
To view a weatherfax image, ensure it has been exported from your weatherfax
software/system in a suitable graphics format such as .jpg,pcx,tif.
Select the Weather option from the main menu and Display image file from the drop
down menu. Then size the window as required.
files
es (Grib
Grib files)
Display digital data fil
files
This format enables weather information to be displayed and animated over a period of time
over the chart. Although there is free data available on the Internet, you will may need to
take out a data supply contract with a suitable supplier if you require more detailed weather
information.
Grib files are a standard format used by the International Meteorological Community for the
exchange of weather information in a highly compressed form.
The software supports the following data
•
Wind speed and direction
•
Wave height, direction and period
•
Mean sea level
•
Current
•
Temperature ºC
•
Pressure
•
Precipitation (Total and Convective)
Note : Although the system supports the above general data types, some weather
organization may produce the weather data using more specialized identification code so as
to indicate a different meaning to the data. If this is the case, the weather information will
not be displayed.
WARNING: The data is only a prediction of what might happen, and like any weather
forecast, may not reflect the final wind, wave height etc.
The data is usually supplied as a forecast for a number of hours from a given time. For
example from 12:00 on the 14th Feb at 12 hour intervals might give data for 0,12, 24, 48 60
and 72 hours from the forecast time.
-
112
The Data needs to be downloaded from the Internet (or from your dara provider) and
either saved in the GRIB directory under seaPro or onto a floppy disk. At sea, this data can
be received over Irridium, Inmarsat ‘C’, GSM or other mobile communication system.
The data you have available will depend on your supplier. Please contact Euronav Ltd. or
your distributor for suitable data suppliers (these are listed on our website at
www.euronav.co.uk).
The following instructions assume you have already downloaded the file for the area you
require (e.g. Europe) and have saved these on your computer (preferably under the seaPro
GRIB directory – this is by default c:\program files\euronav\seaPro2000\grib) or on a floppy
disk.
To view a Grib file
Select Weather from the main menu and then Weather (Grib) from the drop-down menu.
The GRIB toolbar, as shown below, will then appear on your screen.
The toolbar functions are as follows:
- File selection –
Allows the selection of the required Grib files. The files will usually have the
extension .grb when received. You may need to copy (and possibly rename) the files
to the grib directory.
Display data of type
Select the required data to display (use the tool tips to view the meaning of each
button).
Use the
to see the type of data present in the GRIB file. If a type of weather
information is not available, then its button will be disabled and will appear ‘greyed out’.
T he title bar of the grib toolbar displays the date of the forecast and the offset in hours.
Note: There are two type of precipitation types available - Total and Convective
If no data is available then no date and time will be shown.
Hint: For air pressure, temperature and precipitation, try pressing the text button off. This
will give a density contour map of the data.
Note: The forecast for different data types may have different coverage’s, so when moving
forwards and backwards in time, the data may be blanked out if no data is available.
-
113
Show pressure isobars
Weather forecaster’s map
Displays the data in a format similar to a TV weather forecasters map, more than
one data type is shown;
Hint; Click on the temperature button to remove the coloured background to
clearly see the wind speed and direction over the chart area.
Weather map showing wind speed and direction.
Back, Start and forward time arrows.
Press arrow as required to step forwards or backwards in the time sequence.
Auto sequence
Select the button to animate the data over the available forecast period.
Data interpolation
The display can show time shorter time increments by interpolating between time
entries to give a smoother display of the data.
Use the button to increase the time period (to decrease keep pressing, the interval
will return to +1).
Important: This is not extra data, but an estimate of what it might be based on the
previous and next value
-
114
Text display (off)
Select this button to toggle the display of the data in text format. If pressed in (off) a
density map will be displayed if appropriate for the data type. A colour density key
to the map will also be displayed.
Colour
Toggles the display of colour encoding over the data for easier indication of trends.
The style of display will depend on the type of data selected, for example selecting
pressure will show Pressure as isobars and a colour key if the coloured data mode
is selected.
Note: The colouring is scaled automatically to the range of the data and is not
indicative of absolute values.
Decrease Isobars/ Increase Isobars
Pressure can be displayed both as a pressure colour gradient and as isobars. The
pressure difference between isobars can be altered using these buttons to increase
or decrease the number of isobars.
Use the
to see the type of data present in the GRIB file. If a type of weather
information is not available, then its button will be disabled.
The style of display will depend on the type of data selected, for example selecting
pressure will show Pressure as isobars and a colour key if the coloured data mode
is selected.
Interpolating between time periods
The display will also interpolate between time entries to give a smooth display of the data.
Use the
button to increase the time period (to decrease keep pressing, the interval will
return to +1).
Note: If you use a time period shorter than the original GRIB file data, its important to
remember that this is only an a mathematical approximation of what the data might be based
on the previous and next true value.
Simple weather
weather map
To display the weather data in a style similar to weather maps seen on Television, press the
button (actual display depends on the data in the GRIB file).
Hint: Try different combinations of
-
and
to get different effects.
115
Display symbols
Wind
Displayed as a simple arrow indicating the direction of the wind, the velocity of the wind (in
knots) is indicated by the feather ( as shown ion the diagram above). A feather represents 10
knots of wind and half a feather 5 knots. The feathers are placed at the opposite end to the
arrowhead i.e. to the North on a north wind arrow.
Wind symbols
The graphical representation follows that used by the World Metrological Organization
(WMO).
The wind speed and direction is displayed as arrows with feathers. The arrow shaft pointing
in the direction the wind is blowing to (feathers at the aft part of the arrow).
The wind speed (in kts) is visually indicated by number of feathers on the shaft of the arrow.
The feathers have two lengths, ten knots for the long ones, 5 knots for the shorter ones.
If the wind exceeds 50kts a diagonal is added.
Example:
Wind 55 kts. 135° from the south east, and south of the equator
If the wind velocity is low then no arrow is drawn, and a dot and a value of 0 is displayed
instead.
Example:
-
tip of arrow is the position of the wind prediction
116
Here the wind is coming from the North West (45°) with an estimated speed of 25kts.
The position of the feathers on the arrow shaft indicates if the arrow point is north or South
of the equator.
Wind 30 kts. 270° (from the east) and south of the equator
Wind 35 kts. 315° (from the North east) and north of the equator
Wave
Displays an arrow indicating the direction (not scaled for height) and the wave height in text.
Temperature
Displayed as simple numerical values, for best effect use colour-coding with a black sea
option.
-
117
Temperature displayed as colour density shading of the data (text button off).
-
118
-
119
Appendix A
Stepby--Step Installation Instructions
Step-by
If you followed the quick start instructions and successfully installed seaPro, you may not
need to read this section. The following provides detailed instructions for installing seaPro.
DO NOT PLUG THE DONGLE INTO YOUR COMPUTER UNITL SEAPRO HAS BEEN
INSTALLED!
INSTALLED
Note: You should verify that you have sufficient disk storage space to take both seaPro and
the charts you have purchased. You will need a minimum of 300 Megabytes (MB) for seaPro
(although the exact amount will depend on the operating system being used and charts
required) and should allow the following (guide) amount per chart for each type:
Livechart
ARCS
BSB
0.3MB e.g. 10 charts require 3 MB of disk space.
2MB e.g. 10 charts require 20 MB of disk space.
2.5MB e.g. 10 charts require 25 MB of disk space.
1) If you already have a version of seaPro installed on your PC, you must uninstall that
version before installing a new one. The un-installation program will remove any
seaPro programs and system files which were originally installed on your system.
Note; To uninstall, select the Settings option from the Windows Start Menu and
then select the Windows Control Panel
Panel. Then select the Add/Remove Programs and
scroll through the list of installed programs and select Euronav Charting System.
System
Windows will then run the Euronav un-installation program, select Automatic and
then click on the Finish button to complete the un-installation.
2) Quit all other applications you may be running.
3) Insert the seaPro CD-ROM in your computer’s CD-ROM drive. Most standard CDROM drives will automatically identify that the disk has been inserted and will start
the seaPro installation program automatically. However, if your CD-ROM drive does
not start the installer after a few seconds, you can do one of the following:
a. Double click on the My Computer icon on your Desktop and then select
the CD-ROM drive (this should be indicated by a Euronav icon and then
select the CD-ROM drive and the seaPro screen should appear.
b. Or…from the Start menu, select Run and the run dialog should appear on
your screen. Click on the Browse button and locate the application file
Setup.exe on your CD-ROM drive - click on it to highlight it, then press the
Open button on the browser. Finally press the OK button on the Run
dialog.
Once the seaPro presentation program has started 4) Select an appropriate language from the list.
5) Select the Install Euronav products and upgrades option.
6) Select the seaPro Installation option
7) Choose the appropriate language from the list and press OK.
OK
8) Follow the instructions on screen to install.
9) You will now be asked where on your computer you would like to install seaPro
Fishing. You would not normally want to change this from the suggested location,
-
120
but if you wish to do so, click on the Browse button, select a location, and click OK.
Click Next to continue.
10) Similarly, you may choose where to install the electronic charts seaPro Professional
will use, although it is recommended you leave these locations as suggested as well.
11) You will then be asked if you wish to replace tidal and folio data. In most cases it
would be good practice to replace these.
12) Finally, you will be asked where you would like to install the shortcuts which you
will use to start seaPro Professional. You may choose to have shortcuts installed in
all three of the locations offered, two of them or just one.
13) Click Next to continue and the seaPro installer will proceed to load all the required
files onto your hard drive. When completed, you will need to click the Finish button.
seaPro Professional is now installed on your computer, but in order to use it effectively, you
will need to add charts for your sailing area.
You will now need to restart your computer before using seaPro.
Once your computer has restarted you may plug in your dongle
dongle..
Note; If you normally have a printer plugged into this port, you may plug it
into the back of the dongle, which is “transparent” to printer control
signals.
If you do not have a parallel port a USB dongle is available – please contact Euronav for
more information.
You may now decide whether to go straight into installing charts now or to run seaPro
Professional and familiarise yourself with its features, before returning to chart installation.
-
121
Installing Charts
How you add charts to your seaPro program depends upon what kind of charts you have
ordered.
Installing Vector Charts
If you have chosen vector Livecharts, you will be issued with either an unlock code or an
ems unlock file.
To unlock charts using an unlock code:1) Insert the seaPro CD into your CD ROM drive.
2) Start seaPro by clicking on the seaPro icon on your desktop
Chart.
3) Select the menu option Chart
4) From the drop down menu select the Install charts option.
5) You should then choose to install Livecharts.
6) Click on Next to continue the installation.
7) After a short delay the Euronav unlock box will appear on the screen. You will
find 5 windows to enter your unlock code into. Enter the unlock code putting 4
digits in each of the first four boxes and the chart/pack number in the last box as
per the instructions given.
Note: the codes are not case sensitive - this means you can enter either small letters
or capitals.
•
Select the Unlock button and wait for the “unlock complete” message.
•
Repeat these steps for any other chart installations
•
-
When all of the charts and their unlock codes have been entered, click on the
Close option.
122
If you have added new charts you will need to re-build your chart folio (this
electronically joins the charts together so you can zoom seamlessly from one chart to
another). To do this:
•
Select the Chart option from the menu.
•
From the drop-down menu, select the Build Folio option
•
Select the Create Folio option
•
Click on the button with the green tick to complete the process.
You should now see your charts outlined on the screen.
Note : You must keep the unlock codes & CD-ROM safe. These cannot be re-issued
and you cannot re-install the charts without them. You can make a back-up copy of
the charts, and these can be copied back if the original installation is damaged (or to
another machine).
To unlock charts using an “ems” file:file: ems files are normally supplied, via email, to unlock purchases of three or more charts,
which do not feature in a chart pack. The ems file effectively enters a series of unlock codes
for you automatically.
1) Save the file to either a floppy or temporary folder.
Note: If during this process the file name has changed (e.g. should be 1234.ems but
has become 1234.ems.dat or 1234.ems.zip or even 1234.zip) then you should rename
the file before using it, to its original name e.g. 1234.ems
2) Close all other programs including seaPro.
3) Insert the seaPro CD-ROM and allow it to auto-run.
4) Select an appropriate language from the list.
5) Select the Livechart – chart installation and unlock option.
6) Select an appropriate language from the list.
7) Select the unlock option form the Menu and from the drop-down menu then select
unlock by file (ems).
8) Using the browse button, find the ems file on your computer and double click on
it.
6) Then select the Install option.
Note: This process may take up to 15 minutes for some chart orders.
7) On completion you will get the message “installation complete”, after which you
can close the program.
8) Restart seaPro and rebuild your chart folio.
Note : Make sure the ems file and the Euronav CDROM are kept secure, they
cannot be replaced.
-
123
Installing Raster (ARCS, Seafarer & BSB ) charts
The installation for ARCS Skipper and Navigator charts is built into seaPro . Raster chart
installation requires the following:
Appropriate Area CD-ROMS, these will be supplied when you purchase the charts
A permit file normally supplied on floppy disk
Update CDs (if applicable)
To install an ARCS chart:
1) Insert the CD and floppy disk into their respective drives
2) Start seaPro and select Chart from the main menu and from the drop-down menu
select Install charts.
3) You should then choose to install ARCS/HCRF charts.
4) Follow the prompts on screen to complete the installation
Installing BSB charts
BSB installation requires the following:
CD-ROM which contains the chart you wish to install.
To install a BSB chart :
1) Insert the CD-ROM into your PCs CD-ROM drive.
2) Select Chart from the main menu and from the drop-down menu select Install
charts.
3) You should then choose to install BSB charts.
Follow the prompts on screen to complete the installation.
-
124
-
125
Appendix B
Interfacing GPS, Instruments, Radar & AIS
In order to show the position of your vessel on the chart and other instrument data you
must connect the GPS or Instruments to the chart system PC. You will only see your vessel
shape on the chart when the GPS is connected and has acquired a position. The connection
is via two wires using a protocol know as NMEA0183 – and you will need to connect this to
the serial port of your PC.
GPS NMEA cable or interface
connector
PC serial Connector
Data in +
Data out + (Tx)
GPS
or
Instrument
System NMEA 183
Data out -
Common
Data in PC Data out (Tx)
Data in + (Rx)
(Data into GPS is not required if
you just need position information)
(2)
(5)
(3)
Female D Type
9 Pin connector
Follow the steps below:
Note: Have your GPS handbook available as we can only offer guidelines here as each GPS
manufacturer may have slightly different instructions.
•
Connect the GPS to the computer’s serial port (also known as the COM port) using
an appropriate cable (one is supplied with the colours as shown in the table above).
GPS to PC cables are also available from your GPS supplier or manufacturer or most
marine instrument dealers.
•
Configure your GPS to ;
1) Output the correct format and
2) Output the correct sentences – you will probably need to refer to your GPS
manual to do this or contact your GPS supplier. The format should be
NMEA 2.0 0183 data at 4800 Baud. Many models of GPS are not set to the
correct settings by default.
You need to turn on the correct output sentences for latitude and
longitude; normally these are RMC, GLL or GGA. In case of difficulties, your
GPS supplier or manufacturer will be able to advise you as to how to
configure your particular model – please do not contact Euronav to help
you with this as it is specific to each GPS make and model.
•
Check that seaPro is set to use the correct serial port. This can be selected from
‘Configuration’ on the main menu then selecting ‘Ser
‘Serial
ial Ports’. Generally, unless you
have a serial mouse, COM port 1 will be the correct choice for NMEA Rx (received
data).
-
126
-
•
You can check the incoming data from the GPS by using the NMEA Monitor
window. Select Configuration from the main menu then select View NMEA input . If
the GPS is connected correctly, this window should show the raw data as it comes
in from the GPS (something like $xxRMC,,,,,, with data between the commas) – as
shown in the diagram below.
•
When the GPS signal is correctly wired the ‘traffic light’ on the Panel will be
displayed green. The second traffic light is to indicate if DGPS is operational, note
this is only appropriate if you are using a Differential GPS receiver.
127
Connecting IInstruments
nstruments
The seaPro instrument panel is the tall, narrow window that can be displayed at the right
hand side of the main window. It contains a number of instrument windows showing
information such as vessel position, log, gyro, wind speed, depth and so on, as received from
external instruments via NMEA sentences. It also contains windows showing data generated
by seaPro such as the current plan performance.
The Instrument system is wired using the same two wire interface as the GPS, so you will
need an additional serial port (or you can use a USB port with the use of a USB to Serial
port converter) for this purpose. The table below shows the cable colours for the data cable
supplied with seaPro. Up to 8 serial ports are available for connecting various equipment.
Instrument
wiring (NMEA)
Data out +
Data out -
Data direction
Instrument to PC
Ground
PC 9 pin
D Type
Pin 2
Pin 5
Note: Many of the instrument fields can only show information if an appropriate NMEA
sentence has been received:
To setup the instruments ensure the data is being received (check using the NMEA monitor
window) and that you have ticked the appropriate sentences in the NMEA RX (receive) page
of the Nav properties sheet.
The Instrument Panel can be customised to display various data that can be received from
your instrument system. To change this choose the Setup menu then Instrument Properties
and the following dialog is displayed;
-
128
Select the appropriate data and the data will then appear on the Panel.
-
129
Radar
If you have a radar which has an NMEA output, this can be interfaced with seaPro. The
sentences that seaPro receives are Own Ships Data (OSD) and Tracked Targets Message
(TTM). The connections are the same as that for the GPS and the Instruments;
Radar wiring
(NMEA)
Data out +
Data out -
Data direction
PC 9 pin
D Type
Pin 2
Pin 5
Radar to PC
Ground
Check that the radar is configured to output the data and is set for the correct output as
above. Now set seaPro so that it can receive the data;
Under Nav Properties, in the Setup menu, select the two sentences OSD and TTM to
enable seaPro to accept incoming data from the radar.
The radar data can now be toggled on and off using the graphical toolbar (for more
information see chapter on Radar).
Note; for vessels fitted with two radars (normally X band and S band) it is possible to
interface both using different com ports. Once connected, seaPro enables tracked targets
from either radar to be displayed over the chart.
-
130
AIS
Important
These instructions should be used in conjunction with the specific Transponder manual. Full
knowledge on the working and capabilities of the AIS system is presumed.
seaPro interfaces to the AIS transponder using the standard NMEA 183 interface /RS422
(IEC 61162-1). The serial port used on the computer is set up using the menu option SetupSetup
>Serial
Serial Ports.
Ports Most transponders work at 38400 baud so ensure the correct speed has been
selected using the Advanced button for the serial channel selected.
Note: An RS232 - RS422 converter is required to convert from the AIS transponder signal
levels to those of RS232 of the PC. If the converter can be powered from the PC serial port,
make sure the power box is ticked for the serial channel selected. See NMEA 183 interfacing
for details.
If the AIS transponder is remote from the PC, a serial TCP/IP adaptor option is available to
connect via a local area network (LAN) or across the Internet.
Connections can be made either to the pilot port socket or to the ECDIS output from the
Transponder depending on your application.
Use the NMEA monitor window to check that you are receiving the AIS sentences. This
shows data from the serial ports and data coming from a TCP/IP server.
Note: If certain functions do not work as expected it is worth checking that you have the
latest software updates installed in your transponder.
Note: The terms UAIS and AIS are used equivalently.
-
131
Appendix C
Euronav File Formats
seaPro File Formats
Route files
•
All route related files are located in the Route folder beneath the seaPro installation
folder.
•
The route is contained in a dBaseIII file with extension .rut . To import this directly
into a database or spreadsheet such as Microsoft Access/Excel usually requires the
file to be renamed with the extension .dbf first. We suggest you make a copy of the
file, which you can then rename, otherwise seaPro will no longer be able to find the
original route file.
•
The route can be exported to an ASCII text file using the Export… command on
the Route menu. This produces a file with the extension .txt which can be directly
imported into other data processing applications. The latitude and longitude values
can be exported in decimal degrees (50.5000°) or degrees and decimal minutes (50°
30.00’). Warning: this will overwrite any exported data log file of the same name
that is present in the Route folder, since both exported file types share the .txt
extension!
Waypoint files
•
All waypoint related files are located in the Route folder beneath the seaPro
installation folder.
•
A waypoint database file is contained in a dBase III file with extension .wpt . To
import this directly into a database or spreadsheet such as Microsoft Access/Excel
usually requires the file to be renamed with the extension .dbf first. We suggest you
make a copy of the file, which you can then rename, otherwise seaPro will no longer
be able to find the original waypoint file.
•
The route can be exported to an ASCII text file using the Export… command on
the Waypoint menu. This produces a file with the extension .txt which can be
directly imported into other data processing applications. The latitude and longitude
values can be exported in decimal degrees (50.5000°) or degrees and decimal
minutes (50° 30.00’).
Log files (non(non-fishing version)
-
•
All log related files are located in the Route folder beneath the seaPro installation
folder.
•
There are several log files, each taking the same filename but with different
extensions:
132
•
The vessel track is a binary file in a Euronav proprietary format. It contains just
time-stamped vessel positions and is stored in a file with extension .lb0 and is used
for rapid drawing of the track on the charts.
•
The full data log is a binary file in a Euronav proprietary format. It contains timestamped positions and other instrument data and is stored in a file with extension
.lb1 .
•
An optional ASCII text version of each the vessel track and data log files can be
written by seaPro at the same time that the binary log files are being created. To
enable these to be created and written, use the Nav command on the Setup menu
to display the Nav properties dialog. On the Log page of this dialog check the box
labelled Additional ASCII text file. The vessel track is subsequently written to a file
with extension .a00 while the data log is written to a file with extension .a01 .
•
If the optional ASCII text log files have not been enabled but an ASCII text version
of the log is required at a later date, it is possible to export the binary log files to an
ASCII text format using the Export… command on the Log menu. These files may
then be directly imported into other data processing applications. The latitude and
longitude values can be exported in decimal degrees (50.5000°) or degrees and
decimal minutes (50° 30.00’).
•
The vessel track is exported to a file with the extension .txk .
•
The data log is exported to a file with the extension .txt.
Warning: this will overwrite
overwrite any exported route file of the same name that is
present in the Route folder, since both exported file types share the .txt
extension!
-
133
Appendix C
Frequently Asked Questions
This appendix details frequently asked questions relating to common questions asked when
installing or using seaPro. This is not intended to be an exhaustive list, but is designed to
help.
"seaPro is slow when zooming in and out"
This is a common problem that is generally easy to solve. You need to turn down your
graphics acceleration a step or two.
On your computer desktop click on My Computer and Control Panel . Click on Display and
then Settings. Under Settings there is a button called Advanced, click on this. Depending on
your operating system there will be a tab named Troubleshoot or Advanced – click on this
and there will be a slide bar. Generally moving the slider back one notch from full hardware
acceleration normally solves the problem. After moving the slider click Apply then OK. You
will then need to restart the computer and restart seaPro.
"When I connect my GPS (or instruments) to seaPro, I do not seem to get any position
information in the Navigator window or a position plot on any charts. What is wrong?"
We suggest you look at several things
a) Within seaPro, check that you have selected the correct serial COM port.
This can be found by selecting Serial Ports… from the Setup menu. If you
make any changes to this page, press the Save button or the button with the
green tick symbol, then exit seaPro and restart the program to make the
changes take effect.
b)
Be aware that some PCs use a "Serial Mouse" which requires to be plugged
into a serial COM port. If your mouse seems to be misbehaving in seaPro
or stops working altogether, then make sure that seaPro is not configured
to use the mouse COM port by mistake!
"PS/2" and "BUS" mice are no problem because they do not need a serial
COM port.
c) Within seaPro, check that you have selected the correct NMEA sentences
to match your GPS. These can be found by selecting Nav.. from the Setup
menu, then selecting the RX tab of the properties sheet that gets displayed.
Try putting a cross in each of the RMC, GGA, GLL and VTG boxes initially.
Later you can remove those that are not required, by trial and error.
d) Within seaPro, see if the program is actually receiving NMEA data. To do
this, select the NMEA Monitor Window from the Window menu to cause
the NMEA monitor window to be displayed. Within this window, seaPro will
display all incoming NMEA data as strings. The display can be scrolled to see
previous messages that are no longer on the screen.
For example, a line that begins thus
COM1: $GPGGA,.....
means that a GGA NMEA sentence has been received on serial COM port 1.
-
134
e) The NMEA interface standard which governs the signals appearing from
your GPS and other NMEA equipment specifies an electrical signal protocol
called RS-422. However, your PC almost certainly uses the RS-232
protocol, which although similar to RS-422 is subtly different and is not
guaranteed to be compatible. For 100% reliable communications between
NMEA equipment and a PC, an interface cable is required which converts
the data signals from the voltage requirements of RS-422 to those of RS-232
and vice versa and which also electrically isolates the signals for safety.
Euronav are able to supply such a cable – please contact your dealer or
Euronav directly for details of the NMEA interface cable.
f)
If you cannot see any data displayed in the NMEA monitor window then it is
possible your PC is not set up correctly for serial data input at all. Please
refer to your hardware supplier or try using the Hyper Terminal program
supplied by Microsoft as part of Windows 95/98/NT. The settings required
are 4800 band, 8 data bits, 1 stop bit, no parity and no flow control. If you
see no data after using the 2connect” button then there is no way seaPro
will be able to see data either.
g) If all the above fails to cure the problem, contact us. We will talk you
through running diagnostics to test your PC with seaPro. Please install it
from the seaPro CD-ROM if you have not done so already.
"Whenever I try to use the chart scroll down facility by placing the mouse near the bottom
of a chart window at the bottom of the screen, the Windows95 task bar pops up and stops
me doing the scroll. What is wrong?"
This is caused by you having configured your Windows95 system to automatically hide the
task bar. We recommend that you either turn of auto-hiding before using seaPro or you
drag the task bar to the top of the screen rather than have it at the bottom.
-
135
"When I view the log, not all my entries seem to be there. What is wrong?"
When seaPro finds more than one leg entry for a given point in time, only the first is
displayed in the Log View window, unless you set the interval field to 00:00:00 in which case
ALL entries are loaded (but beware of huge log files which will take a long time to load).
"Sometimes when I try to close a window, it does not close and I cannot access anything
else in seaPro!
seaPro! What is wrong?"
Occasionally there is a little hesitancy in the Windows95 system. What has happened is that
the mouse down-click has been detected but the up-click (which causes the closing action)
has been lost. If this is the case, you will find that if you move the mouse away from the
“close” button the button appears to pop up and if you move the mouse back over the
button it sinks down again. Clicking the button again should close the window.
"seaPro
seaPro seems sluggish and unresponsive when I have
have incoming NMEA data. Some buttons
do not seem to depress when clicked yet they still do their job. What is wrong?"
When NMEA vessel data is incoming, chart updates occur within a second of any CHANGE
in vessel situation (position/speed/heading/GPS quality etc) these updates take time to
perform, the time taken being roughly proportional to I) the number of chart windows being
displayed, ii) the size of the screen area occupied by each chart and iii) the number of bytes
used by the Windows95/NT screen driver for colour information (256 colour is a lot faster
than higher colour settings such as 16.7 million colour mode. During a chart update, the rest
of seaPro is put on temporary hold which causes a small delay in responding to button
presses.
"The
The program
program looks normal but wherever I click within the seaPro main window I get a
beep but nothing else happens. What is wrong?"
It Is highly likely that a “modal” dialog such as a warning is being displayed by seaPro but has
become hidden behind another window rather than being at the front of the screen. Check
the task bar to see if a seaPro dialog is there, activate it by clicking on the relevant task bar
button, then deal with the dialog as appropriate before continuing with seaPro…
“Some
Some shapes, such as vessel range ring circles, contour and land areas etc do not draw
correctly in seaPro. What is wrong?”
Some early released of graphic cards have been found to be faulty, including Riva TNT. The
problem is usually resolved by getting the latest driver from your graphics cad supplier,
otherwise try turning off any graphics accelerator options.
“why
why does the instrument panel seem to take up so much screen area?”
On low resolution displays such as 640x480 the panel will certainly appear large as its size is
determined by the fonts used for text displays in the instruments. Regardless of your screen
resolution though, the only way to minimize the screen area is to make sure the Windows95
video settings in your system specify small fonts rather than large fonts – double click the
Display icon on the Windows95 control panel then look at the Settings page of the resultant
properties sheet.
-
136
“My
My Livecharts seem to be covered in dense black areas that obscure all the chart details.
What is wrong?”
EITHER: you have chart auto-detail mode turned off, so seaPro is showing all details
regardless of how far in or out you are zoomed the “chart detail Autozoom Mode” button
on the graphic toolbar probably showing a red light – click it once again to turn it back to
green, the normal mode. See the seaPro online help for more information.
OR: you have enabled display of a large waypoint database on the charts with waypoint
name display enabled. Look on the waypoints menu – if the “display waypoints on charts”
entry is ticked the waypoints are being displayed (white blobs with a black outline and a
black number by them); if the ”display waypoint text on charts” entry is ticked then the
names of the waypoints are also being displayed and are probably the cause of the dense
black areas. Select the “display waypoint text on charts” entry to turn the name display off.
Frequently –asked question on ARCS charts.
Please read the notes below and try the suggestions before calling us….
“when
when building my ARCS folio I get the following error message. What does this mean?
“Chart<chart number>. Not properly installed either you are missing data or you need to
install the latest chart”
One possible problem is that you have not installed the Update data that arrived with your
chart. We recommend that in future you install the Updata when the installation wizard
prompts you for the Update CD-ROM that came with your chart. This guarantees that you
will have installed the latest correctional information for the chart in question.
To solve the problem for this installation, start the installation again with the weekly Update
CD-ROM in the drive instead of the Area CD-ROM. There is no need to install the permits
again from the floppy disk. The installation wizard chart list will include the charts you did
not update previously.
-
137
“After
After installing my ACS charts I get the following error message displayed in the bottom
right hand corner of the chart. What does this mean?”
ARCS Error 18: Arcs Chart<chart number>. Warning – License is valid to NtoM
correction<NM number>. The chart is correct to NtoM correction<NM number>.
Corrections are missing. Please load update CD that contains NtoM correction<NM
number>.
Where <NM Number> is the “Notice to Mariners” number.
This error means that you are currently viewing a chart that does not contain the latest
correctional information for which your license is valid. You need to load the chart from the
Update CD-ROM that contains the specified NM number.
To check which Update CD-ROM you need to use you should consult your ARCS Schedule
A transaction document, on that document will be a list of charts, locate the chart number
and check that the document NM number matches the NM number that the error told you
to load corrections for.
Once you have found the correct document NM number you need to find the update CDROM that this chart is located on. The number is the transaction document and will start
with WK.
“I have installed some of my charts but have permits for more charts. When installing those
first charts the installation wizard did not give me the opportunity to install the rest of the
charts I have purchased. Why not?”
This is a very common problem. Typically you will find that the Admiralty have supplied you
with one or more Area CD-ROMs e.g. RC1 and RC2, together with a weekly Update CDROM e.g. WH01_98
-
138