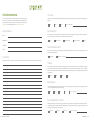
1
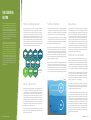
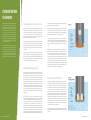
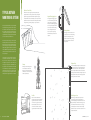
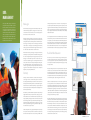
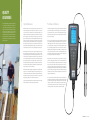
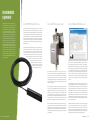
MONITORING OXYGEN
AT HYDROPOWER FACILITIES
A GUIDE TO UNDERSTANDING AND ESTABLISHING DISSOLVED OXYGEN AS A REAL-TIME MONITORING SOLUTION
WHAT’S INSIDE
01
Regulatory Approaches: Overview of FERC Licensing
02
The Essential Factor
04
Dissolved Oxygen Technology
06
Typical DO Monitoring System
08
Monitoring Stations
10
Data Management
12
Quality Assurance
14
Recommended Equipment
16
Purchase or Rent?
17
About Fondriest Environmental
18
System Configuration Tool
WHY MONITORING MATTERS
There are around 2500 hydropower facilities in the United States, generating approximately 7% of the US’s electrical energy. In addition to
being a renewable power source, these dams can also function as a water supply and flood control point. As a river obstruction, hydropower
dams affect water flow, spawning migrations, and water quality.
To ensure that they have a minimal impact on the environment and natural stream flow, state and federal regulations are set in place for
minimum water quality standards. One such regulation is dissolved oxygen monitoring. Dissolved oxygen is the leading factor in water
quality, and hydropower dams can drastically alter normal levels. Water that is diverted through a hydropower facility is typically much lower
in dissolved oxygen than the rest of ecosystem. When this under-aerated water is released downstream, it decreases the oxygen content
of the rest of the river, threatening aquatic life below the dam. A dissolved oxygen monitoring system ensures that the dissolved oxygen
levels above and below the dam are consistently similar.
The Federal Energy Regulatory Commission (FERC) and other federal and state agencies have established reporting procedures and dissolved oxygen limits for hydropower facility operations. These monitoring and reporting procedures work to minimize dam impacts on
the local aquatic habitats. The FERC also suggests mitigation measures when dissolved oxygen concentrations fall below accepted levels.
Dissolved oxygen monitoring efforts allow operations managers to immediately implement these mitigation measures and minimize ecosystem degradation.
REGULATORY
APPROACHES
Overview of FERC Licensing
Nearly all non-federal hydroelectric facilities in operation are required to
report to the Federal Energy Regulatory Commission (FERC). While FERC is
responsible for issuing an operating license, detailed environmental regulations and requirements within that license are influenced by state and other
federal agencies.
A state Department of Natural Resources (DNR) will often mandate a Section
401(a) Water Quality Certification under the Clean Water Act. This certification lists monitoring requirements to maintain compliance with state water
quality standards. Any recommended or obligatory monitoring and mitigation efforts are generally incorporated into the FERC hydropower license.
The FERC license establishes facility-specific duties, conditions and measures for operation. These can include minimum flow, mitigation, measurement standards (such as dissolved oxygen minimums) and narrative criteria
(habitat and aquatic life). These rules will vary from state to state and even
from site to site based on the dam structure and potential for environmental degradation. Both compliance with and deviation from the established
license articles must be reported.
Most FERC hydropower licenses are issued for a 30-50 year term. While
periods of uncontrolled non-compliance (due to weather or natural events)
must still be reported and corrected, penalties are not incurred. Deliberate
or systematic non-compliance, however, may be assessed a penalty.
Impoundment-type hydroelectric facilities tend to face more licensing regulations than most. The creation of a reservoir or other deep impoundment
can drastically alter the local landscape and aquatic habitats. In addition to
the risks of flooding, erosion and dislocation, water quality above and below
the dam can suffer. Still waters, like reservoirs, stratify easily, essentially creating two environments within the water: top and bottom. The bottom layer
of water often becomes hypoxic (low dissolved oxygen levels) due to a lack
of aeration and excess oxygen demand. When coupled with a deep hydro
intake, the oxygen-depleted water is released downstream, lowering the
dissolved oxygen content of the entire river.
To minimize this impact, FERC licenses may require dissolved oxygen monitoring upstream, downstream and within the impoundment. The frequency
of this monitoring is dependent on state-specific regulations, but continuous or near-continuous monitoring is common for deep hydro intake dams.
When monitoring dissolved oxygen at hydropower facilities, real-time availability of data is crucial to instigating timely mitigation efforts. Even when
sampling intervals are on a weekly basis, the ability to respond quickly will
minimize the adverse effects of low dissolved oxygen and re-establish compliance with FERC.
THE ESSENTIAL
FACTOR
One of the biggest impacts that hydropower plants
have on the local environment is reduced dissolved
oxygen levels downstream. This consequence is one
of concern, as dissolved oxygen (DO) is vital to the survival of aquatic organisms. Most freshwater organisms
need levels above 5 mg/L for optimum growth, and
species like salmon require even higher concentrations. When DO levels decrease, fish and other aquatic
life may abandon the area or die.
While dissolved oxygen concentrations fluctuate
naturally due to wind effects, underwater photosynthesis and organism respiration, hydropower dams
may cause a far more sudden and steep change. As
reservoirs are usually deep enough to stratify, the drop
in DO levels is often due to released water from the
bottom of the reservoir (low DO), as opposed to the
top (higher DO). This low dissolved oxygen content
can also be caused by an overgrowth of algae that
consume the oxygen in the impoundment. To minimize any environmental risk from the dam, dissolved
oxygen levels should be continuously monitored for
atypical changes.
Why is Dissolved Oxygen Important?
The Effects of Stratification
Oxygen Depletion
Dissolved oxygen is necessary to survive for many forms of aquatic life
including fish, invertebrates, bacteria and plants. These organisms use
oxygen in respiration, similar to organisms on land. Fish and crustaceans
obtain oxygen for respiration through their gills, while plant life and phytoplankton require dissolved oxygen for respiration when there is no light
for photosynthesis. The amount of dissolved oxygen needed varies from
creature to creature. Bottom feeders, crabs, oysters and worms need minimal
amounts of oxygen (1-6 mg/L), while riverine fish need higher levels (4-15
mg/L). Even microbes such as bacteria and fungi require dissolved oxygen
to decompose organic material at the bottom of a body of water.
Stratification separates a body of water into layers. This layering can be based
on temperature or dissolved substances (like oxygen) with both factors
often playing a role. The stratification of water has been commonly studied
in lakes, and frequently occurs in reservoirs and deep impoundments.
Oxygen depletion can come from two causes. First, oxygen is used by fish,
bacteria and plants (at night) in a process called respiration. When respiration (oxygen consumption) is greater than the amount of oxygen received
from the air or from photosynthesis, dissolved oxygen levels will decrease.
Second, microbes at the bottom of a lake bed use oxygen to decompose
the organic material. If there is an excess of decaying organic material (from
dying algae and other organisms), the oxygen use increases. As there is no
aeration and little photosynthesis in the lower layer of the water, this oxygen
is not replenished. That means that in a stratified body of water, the oxygen
at lower water levels will get used up, leaving an anoxic (no-oxygen) zone at
the bottom of the water body. When the dam intake is below the stratified
boundary, the released water will also be depleted of oxygen. This in turn
can negatively affect water quality downstream.
BLUEGILL
BASS
SALMON
TROUT
5
5
6
7
WALLEYE
CARP
PERCH
5
5
5
BACTERIA
PIKE
MUSKIE
1
2
4
OXYGEN
REQUIREMENTS
(mg/L)
Where does DO Come From?
Dissolved oxygen enters water through the air or as a plant byproduct. From
the air, oxygen can slowly diffuse across the water’s surface from the surrounding atmosphere, or be mixed in quickly through aeration. Dissolved
oxygen is also produced as a waste product of photosynthesis from phytoplankton, algae, seaweed and other aquatic plants. As such, dissolved
oxygen concentrations are constantly affected by diffusion and aeration,
photosynthesis, respiration and decomposition. They are even affected
by water temperature, salinity and pressure changes. That means that dissolved oxygen levels can range from less than 1 mg/L to more than 20 mg/L
depending on how all of these factors interact.
For most healthy freshwater rivers and streams, DO levels seasonally range
from 6 mg/L to 15 mg/L. Freshwater lakes may have slightly lower ranges
due to the effects of stratification.
2
MONI TO RING OX YGEN
In a stratified impoundment, the top and bottom of a reservoir is divided by
a boundary called the thermocline. This boundary keeps the layers of water
from mixing, and there will often be a noticeable difference in temperature
and dissolved oxygen levels between the two layers.
The uppermost layer of the impoundment is exposed to solar radiation and
contact with the atmosphere, keeping it warmer and air-saturated. Due to
the contact with the air, potential for aeration (wind) and the byproducts of
photosynthesis, dissolved oxygen in the top layer usually remains near 100%
saturation. The exact levels of DO vary depending on the temperature of the
water, the amount of photosynthesis occurring and the quantity of dissolved
oxygen used for respiration by aquatic life.
At the bottom of the impoundment, bacteria and fungi use dissolved oxygen
to decompose organic material. This organic material comes from dead
algae and other organisms that sink to the bottom. The dissolved oxygen
used in decomposition is not replaced – there is no atmospheric contact,
aeration or photosynthesis to restore DO levels in the lower strata. Thus
the process of decomposition consumes all of the oxygen within this layer.
DO Units and Percent Air Saturation
Dissolved oxygen is usually reported in milligrams per liter (mg/L) or as a
percent of air saturation (%). However, some studies will report DO in parts
per million (ppm). 1 mg/L is equal to 1 ppm, while the relationship between
% air saturation and other units will fluctuate based on environmental factors
such as water temperature, pressure and salinity. This is due to the definition of air saturation as a partial pressure, rather than a measured quantity.
In a stable body of water with no stratification, dissolved oxygen will be at
100% air saturation. 100% air saturation means that the water is holding as
many dissolved gas molecules as it can in equilibrium. At equilibrium, the
percentage of each gas in the water would be equivalent to the percentage
of that gas in the atmosphere – i.e. its partial pressure.
It is important to note that while two bodies of water may both be at 100%
air saturation, they do not necessarily have the same concentration of dissolved oxygen. The actual amount of dissolved oxygen (in mg/L) will vary
depending on temperature, pressure and salinity.
How do environmental factors affect oxygen solubility? First, the solubility of oxygen decreases as temperature increases. This means that warmer
surface water requires less dissolved oxygen to reach 100% air saturation
than deeper, cooler water. For example, at sea level (1 atm or 760 mmHg)
and 4°C (39°F), 100% air-saturated water would hold 10.92 mg/L of dissolved
oxygen. But if the temperature were raised to room temperature, 21°C (70°F),
there would only be 8.68 mg/L DO at 100% air saturation. Second, dissolved
oxygen decreases exponentially as salinity increases. Third, dissolved oxygen
will increase as pressure increases. This is true of both atmospheric and
hydrostatic pressures. Water at lower altitudes can hold more dissolved
oxygen than water at higher altitudes.
F ON DR IE ST.COM
3
DISSOLVED OXYGEN
TECHNOLOGY
The Winkler titration method has long been heralded
as the standard for dissolved oxygen (DO) measurements. However, titrations are time-consuming and
difficult to conduct in the field. Instead, dissolved
oxygen sensors are used as they offer real-time
results and have a proven accuracy rivaling the
Winkler method. DO sensors can be used in real-time
monitoring systems or for spot sampling and quality
assurance. There are several types of dissolved oxygen
sensors on the market, including polarographic, rapidpulsing, galvanic and optical.
Hydropower facilities’ dissolved oxygen monitoring
systems typically use a submerged rapid-pulsing
or optical sensor to measure DO. These sensors can
continually monitor dissolved oxygen levels above
and below the dam, providing instantaneous water
quality data. Timely control measures can then be initiated based on a facility’s impacts on the ecosystem.
Electrochemical Dissolved Oxygen Sensors
returned luminescence is measured by a photodetector, and can be used to
calculate the dissolved oxygen concentration.
Electrochemical dissolved oxygen sensors are among the most economical DO sensors on the market. There are two types of electrochemical DO
sensors: galvanic and polarographic. Both galvanic and polarographic DO
sensors use two polarized electrodes, an anode and a cathode, in an electrolyte solution. The electrodes and electrolyte solution are isolated from
the sample by a thin, semi-permeable membrane.
At low concentrations, dissolved oxygen (as measured by its partial pressure)
is inversely proportional to luminescence lifetime. At high concentrations,
this measurement is non-linear. Most meters account for this by modifying
their internal algorithms if a higher concentration is measured.
When taking measurements, dissolved oxygen diffuses across the membrane at a rate proportional to the pressure of oxygen in the water. The
dissolved oxygen is then reduced and consumed at the cathode. This reaction produces an electrical current that is directly related to the oxygen
concentration.
These sensors are only recommended for spot sampling as they are flow
dependent and must be stirred in solution. When the oxygen is consumed,
the sensors can produce an artificially low DO reading in no-flow situations.
Electrochemical dissolved oxygen sensors should be stirred in the sample
until the dissolved oxygen readings no longer increase.
Optical Dissolved Oxygen Sensors
Optical dissolved oxygen sensors measure the interaction between oxygen
and certain luminescent dyes. When exposed to blue light, these dyes
become excited (electrons gaining energy) and emit light as the electrons
return to to their normal energy state. When dissolved oxygen is present,
the returned wavelengths are limited or altered due to oxygen molecules
interacting with the dye. The measured effect is inversely proportional to
the partial pressure of oxygen. While some of these optical DO sensors are
called fluorescent sensors, this terminology is technically incorrect. These
sensors emit blue light, not ultraviolet light, and are properly known as
optical or luminescent DO sensors. Optical dissolved oxygen sensors can
measure either the intensity or the lifetime of the luminescence, as oxygen
affects both.
An optical DO sensor consists of a semi-permeable membrane, sensing
element, light-emitting diode (LED) and photodetector. The sensing element
contains a luminescent dye that is immobilized in sol-gel, xerogel or other
matrix. The dye reacts when exposed to the blue light emitted by the LED.
Some sensors will also emit a red light as a reference to ensure accuracy.
This red light will not cause luminescence, but simply be reflected back by
the dye. The intensity and luminescence lifetime of the dye when exposed
to blue light is dependent on the amount of dissolved oxygen in the water
sample. As oxygen crosses the membrane, it interacts with the dye, limiting
the intensity and lifetime of the luminescence. The intensity or lifetime of the
4
MONI TORIN G OX YGEN
Optical dissolved oxygen sensors tend to be more accurate than their electrochemical counterparts, and are not affected by hydrogen sulfide or other
gases that can permeate an electrochemical DO membrane. They are also
capable of accurately measuring dissolved oxygen at very low concentrations.
Optical DO sensors are ideal for long-term monitoring programs due to their
minimal maintenance requirements. They can hold a calibration for several
months and exhibit little (if any) calibration drift. These dissolved oxygen
sensors also do not require any warm-up time or stirring when taking a
measurement. Over a long period of time, the dye degrades and the sensing
element and membrane will need to be replaced, but this replacement is
very infrequent compared to electrochemical sensor membrane replacement. Luminescence lifetime-measuring sensors are less affected by dye
degradation than intensity-measuring sensors, which means that they will
maintain their accuracy even with some photodegradation.
Pulsed Polarographic DO Sensors
Like optical sensors, pulsing polarographic dissolved oxygen sensors remove
the need to stir a sample for accuracy when measuring dissolved oxygen. A
rapid-pulse DO sensor is similar to a steady-state polarographic DO sensor
as both utilize a gold cathode and silver anode. Both steady-state and rapidpulse sensors also measure dissolved oxygen by producing a constant
voltage to polarize the electrodes. However, these pulsing polarographic
DO sensors turn on and off approximately every four seconds, allowing the
dissolved oxygen to replenish at the membrane and cathode surface. This
replenishing creates a flow dependence of almost zero. In order to consistently polarize and de-polarize the electrodes for these short time periods, a
pulsing polarographic DO sensor includes a third, silver reference electrode,
separate from the silver anode. The electrochemical reaction (silver oxidation and oxygen reduction) remains the same.
As rapid-pulse polarographic sensors reduce flow dependence when taking
DO measurements, the water sample does not need to be stirred when using
this sensor.
F ON DR IE ST.COM
5
TYPICAL OXYGEN
MONITORING SYSTEM
Hydroelectric Power Facility
While there are several types of hydroelectric power plants,
hydropower dams are used to generate electricity through the
potential energy of impounded water. The potential energy of
the impoundment increases with depth, as does the potential for
stratification. Water that is released from the impoundment flows
through the dam, generating electricity as it spins a turbine.
For many hydropower facilities, it is required by FERC
to monitor dissolved oxygen levels in order to prevent
the destruction and dispersal of aquatic habitats.
This is usually done with three monitoring stations:
one upstream (for background data), one within the
impoundment (for risk analysis) and one downstream
(at a location affected by the dam release).
To be effective, dissolved oxygen monitoring data
should be provided in real time. The easiest and most
efficient way to do this is with an integrated telemetry
system. A data logger can support sensors at multiple
depths, while logging measurements at pre-defined
intervals. With telemetry, the system can then securely
transmit the data to the Internet in real time for access
from any computer.
Integrated data logging and telemetry stations are
customizable based on FERC license requirements.
They can house as many sensors as needed, and
all equipment is powered via a central battery and
recharging solar panel system. With multiple telemetry options to choose from, continuous real-time data
are available from any computer. This ensures that the
hydropower facility’s operations continue smoothly,
and any control measures can be implemented immediately if dissolved oxygen falls below a set minimum.
6
MONI TO RING OX YGEN
Integrated Data Logging System
An integrated data logging system
is a real-time monitoring station that
houses the data logger, telemetry
module, and power/charging supply.
Since it is generally cost-prohibitive
to run AC power to the monitoring
location, integrated solar panels
are used to continuously charge
the 12VDC battery for autonomous
operation.
Mounting Hardware
Data loggers can be mounted to a wall
or pole based on location and reporting
requirements. These systems can be
installed on the dam or along bridges,
piers or other structures in the river or
along the bank.
Deployment Pipe
Telemetry
Telemetry sends monitoring data to
a central computer or web-based
datacenter in real time. The wireless
communication can be radio-to-shore,
cellular or satellite based.
PVC or metal deployment pipes are installed to protect
the dissolved oxygen sensors in the water. The pipe is
perforated near the sensor to allow adequate water
flow for a representative measurement. In addition to
shielding the sensors from debris, the pipe helps secure
the equipment in a fixed position for quality data and
offers easy removal for calibration.
Live Data
Dissolved Oxygen Sensor
Data can be made available 24/7
through an online datacenter. Dissolved
oxygen measurements can be viewed
in real time, or as a graph to see trends.
Automated alerts can be sent via text
or email in real time when dissolved
oxygen falls below minimum standards.
Dissolved oxygen (DO) is a primary indicator of
water quality as aquatic organisms require it to
survive. Rapid-pulsing and optical DO sensors can be
deployed remotely to measure dissolved oxygen up
and downstream from the dam. Sensors can hang
at multiple depths in the water column to identify
stratification issues and can monitor standalone or in a
multi-parameter sonde.
F ON DR IE ST.COM
7
MONITORING
STATIONS
The number and location of FERC mandated monitoring stations will largely depend on license requirements
and the facility’s structure. Common requirements for
dissolved oxygen monitoring involves three stations.
Each station should include a data logging telemetry
system and as many sensors as are required. These stations can be buoy-based or mounted to a structure.
Selecting the Location
Required monitoring locations can be upstream, downstream, or within
the impoundment. Upstream monitoring stations can be incorporated for
background data if water quality standards are not dictated by the state.
Impoundment stations can monitor multiple depths for stratification data,
or simply monitor dissolved oxygen near the intake. Downstream stations
can be found at the outlet, in the stilling basin or tailrace, following a weir,
or further downstream of the facility.
Dissolved oxygen monitoring stations should be set at fixed locations for
accurate data. Mounted systems can be placed on a structure on the shoreline or in the water, including on a pier, bridge, dam, or locks construction.
Whether they are mounted to a wall or pole, the sensor should be suspended
in a perforated PVC or metal pipe in the water. Structure-based telemetry
systems are easy to set up wherever monitoring is needed.
If it is necessary to collect comprehensive water-column data, a buoy-based
system may be more effective. Data buoys are often used within a reservoir
for a complete water quality profile. Buoy-based systems provide a stable
platform that can be setup anywhere in the waterway. These systems can
support multiple sensors between the surface and the bottom of the water
column, providing greater insight into stratification. Like structure-based
systems, data buoys house a data logger, solar-powered battery pack, and
telemetry for remote communication and long deployments. While data
buoys come in several sizes based on sensor load and water conditions,
buoys with 150 to 450 lb. net buoyancy are generally adequate for reservoir
and river monitoring.
Upstream
Upstream monitoring stations can be structure or buoy based. These
systems are usually required if state water quality standards are flexible or
not applicable. A monitoring system upstream of the hydropower dam provides background data on expected dissolved oxygen levels, as this water
has not yet been affected by the facility. These data can then be compared
to measurements made downstream of the dam to see how much effect the
power plant has on water quality.
Reservoir / Impoundment
Intake
Some FERC licenses require dissolved oxygen monitoring specifically at
the dam’s intake point. This is the point where water enters the facility for
power generation. Intake monitoring is usually done by a mounted telemetry system, as the equipment can easily be attached to the dam structure
with the sensor hanging fixed in the water. Deep hydro intakes are more
likely to pull de-oxygenated water through the facility, and monitoring at
the intake and outlet will provide data on how much that water will impact
the river system.
Outlet/Tailrace
The hydropower outlet is the most important dissolved oxygen monitoring
location. It is at this point that oxygen-depleted water is released into the
river, affecting the rest of the aquatic system. Outlet-monitoring stations are
typically mounted, though they can also be buoy based. Data from an outlet
dissolved oxygen monitoring station will determine how much the released
water will impact the environment, and if mitigation measures should be
employed.
Stilling Basin
A stilling basin can be found directly below the dam. While most hydropower dam concerns revolve around too-low dissolved oxygen levels, the
stilling basin can face the opposite issue, particularly if the outlet is further
downstream. This basin is used to contain and slow down spillway water,
which is often supersaturated with air. While the spillway water entrains
oxygen for the fish below, super-saturation can cause gas bubble disease.
Monitoring stations in a stilling basin often measure total dissolved gases in
addition to dissolved oxygen to ensure quality DO levels while preventing
supersaturated water.
Downstream
Downstream dissolved oxygen monitoring will provide data that show the
actual effects of the de-oxygenated water on the river system. As opposed to
relying on flow models based on intake/outlet data, downstream monitoring reveals the actual impacts of the hydropower facility. However, as they
are further away, they will not allow for as quick of a mitigation response if
levels are below the accepted minimum.
Pre-Deployment
To ensure accurate data, all sensors should be calibrated prior to installation
and thereafter on a regular basis. If using a buoy-based system, the platforms
should be fully assembled on shore prior to deployment. Regardless of the
station setup and location, each complete dissolved oxygen monitoring
system (sensors, data logger, telemetry, software) should be tested before
deploying. While this process ensures that all equipment is functioning
within specifications, it also gives everyone the chance to familiarize themselves with the system prior to deployment. Issues are always easier to deal
with before installation than after.
Mounted Deployment
Mounted dissolved oxygen monitoring systems can be set up anywhere
that there is a structure. Common deployment locations include pole or
wall mounting on the dam, bridges, piers, docks, railroad trestles, and lock
structures. The system can include a stainless steel enclosure to protect the
data logger and telemetry modem from harsh weather and vandalism. The
sensors hang from the station into the water within a perforated PVC or
metal pipe. This pipe protects sensors from debris in the water while still
permitting water flow for accurate measurements. The use of a deployment
pipe also secures the sensors in a fixed position for quality data, while allowing easy removal from the water for recalibration.
Buoy-Based Deployment
In order to maintain a fixed position in the water, a buoy-based system must
be moored to the bottom. When monitoring dissolved oxygen in a reservoir, a two-point mooring is recommended. A two-point setup keeps the
water column below the data buoy open for sensors to hang, without risking
entanglement with the anchor lines. It also offers greater stability if there
are any currents or turbulence at the station. Mooring hardware usually
includes two marker buoys, stainless steel mooring lines, bottom chains,
and anchors. To provide the most comprehensive water quality profile, the
buoy should be deployed in the deepest part of the water way. This allows
for multiple measurement depths and will best reflect the characteristics of
the impoundment as a whole.
Lake habitats are very different from river habitats. As the flow is slower, and
the water column is deeper, many characteristics of the water will change.
Data buoys are typically used to monitor water quality changes in reservoirs.
Deep impoundments and reservoirs are much more likely to stratify, which
creates two separate aquatic ecosystems, top and bottom, often with very
different dissolved oxygen concentrations. As data buoys can be centered in
the deepest part of the reservoir and support multiple sensors throughout
the water column, they are ideal for these monitoring conditions.
8
MONI TO RING OX YGEN
F ON DR IE ST.COM
9
DATA
MANAGEMENT
A major part of FERC reporting is collecting and
accessing the monitoring data. While it is possible
to manually measure and record data on site, the
use of a data logger and telemetry system is more
cost effective. The ability to save, send and view
measurement data in real time is efficient and convenient, particularly when frequent monitoring
intervals are required to maintain compliance. Realtime data and alerts also allow for a faster response
time when adverse conditions occur.
Data Logger
As the name implies, a data logger is an instrument that stores data. In environmental monitoring applications, data loggers can be used not only to
collect data from sensors and sondes, but to control sampling rates and
transmit data to a central location in real time.
While sondes often have the ability to log their own data, a separate, dedicated data logger can gather data from any and all attached sensors, while
ensuring that no data are lost. If telemetry (wireless communication) is available, the logger can remotely control sensor sampling rates and transmit
collected data to a central project computer. Data loggers with telemetry
technology can provide real-time dissolved oxygen data and remote access
via a cellular modem, radio transmission or satellite modem.
When housed in a data buoy, a data logger is charged by a marine battery
and the buoy’s solar power system. Most mounted DO monitoring systems
also offer a rechargeable battery and charging solar panel to power the
data logger. For dam-mounted systems near an AC power source, an AC
converter can be used. Data loggers can be configured with a number of
sensor ports for connection to industry-standard digital and analog interfaces, including RS-485, SDI-12 or 0-2.5 VDC. Dissolved oxygen sensors can
connect to a logger directly or through a multi-parameter sonde. A data
logger can also handle additional water quality sensors or temperature
strings if they are required by the FERC license.
Telemetry
Telemetry, or wireless communication, is a useful tool for monitoring dissolved oxygen in real time. Common telemetry options are cellular and
radio, though satellite telemetry can be used in more remote locations. The
deciding factor when determining the most cost-effective telemetry option
should be the local site conditions and proximity to a project computer. All
three of these options permit real-time updates for water quality above and
below the hydropower facility.
Radio telemetry is recommended when all equipment is in close proximity. If
equipped with a license-free spread-spectrum radio, a data logger can communicate with a shore-side or dam-mounted radio base station. This range
may vary depending on the logger and base station used. Spread-spectrum
radio technology may allow a range as far as five miles (line-of-sight) or a few
hundred feet (non-line-of-sight). The radio base station serves as a central
hub for any compatible data logger in range, and offers the ability to send
the collected data to a project computer.
Cellular telemetry offers more geographic flexibility than radio, though it
does require a cellular data plan. This small, additional cost permits data
transmissions from anywhere that receives a cellular signal. With cellular
10
MONI TO RING OX YGEN
telemetry, monitoring stations do not need to be in close proximity, nor is a
base station required. If multiple monitoring stations are required, each data
logger can send information individually to a central database. All the data can
then be accessed wirelessly from any computer via the Internet. Data loggers
may be equipped with cellular modems from different providers, including
AT&T, Verizon and Sprint.
For remote applications where radio and cellular telemetry are not feasible,
satellite telemetry can be used. The Iridium communications network maintains a dynamic, cross-linked constellation of Low Earth Orbiting (LEO) satellites, providing coverage all over the world. This means that data loggers with
an Iridium satellite modem can transmit data in real time from anywhere on
Earth. As with cellular networks, the data is sent to a central gateway, which
then transfers the data over the Internet to any project computer or cell phone.
Real-Time Online Datacenter
The easiest way to share and view dissolved oxygen monitoring data is
through a web-based datacenter. An online datacenter offers 24/7 instant
access to project data via any web browser. DO monitoring and other data
can be exported into the datacenter directly from the data logger, or through
the project software.
This project management service can be password protected or public, and
allows users access to the collected data in real time. In addition to any FERClicense information, the online interface can provide dynamic area maps, overlaid with weather information, recent and historical data, time series graphs
and statistical summaries. Visitors can interact with the project maps and view
real-time monitoring data or dissolved oxygen level trends over time.
But these cloud-based datacenters are more than just a pretty face. Many
can be programmed to send out automated alarm notifications when DO
levels fall below pre-defined limits. These limits are determined by collecting
background data, usually from upstream of the hydropower facility. Once an
allowable dissolved oxygen range has been set, the data are entered into the
online database. If DO levels drop below the recommended range during dam
operations, the datacenter will immediately issue an alert (text and/or email)
to the appropriate dam manager or operator.
With the availability of real-time data and the datacenter’s auto-alert system,
dam operators can be notified immediately when dissolved oxygen levels fall.
This means that timely control procedures can be implemented to improve
DO levels through a dam release or other operation until the DO concentration rises above the minimum allowable limit. The online datacenter can also
transmit this alert back to the data logger in order to respond to the fallen
dissolved oxygen concentration. Automated responses may include taking
more frequent readings during low DO periods, then resuming regular log
intervals when levels return to normal.
F ON DR IE ST.COM
11
QUALITY
ASSURANCE
Accurate data will help a hydropower facility remain
in compliance with FERC license regulations. In
order to maintain the highest levels of accuracy,
best practice recommends cleaning and calibrating the sensors at regular intervals. Cross-checking
sensor data with a separate instrument is also recommended. This cross-check verifies that the data is
accurate and within sensor specifications. It will also
confirm whether or not the power plant is compliant with the license.
System Maintenance
Performance Verification
While a FERC license may not explicitly require maintenance intervals for
monitoring equipment, periodic upkeep and calibration is necessary in
order to prevent sensor drift and ensure a longer instrument life. Sensor
maintenance includes cleaning (especially if an instrument is not self-wiping) and replacing any deteriorating or missing O-rings to prevent water
ingress. If a monitoring station is measuring additional parameters beyond
dissolved oxygen (such as temperature or total dissolved gases), further
field servicing may be required. Maintenance intervals are largely dependent on the sensor technology used, site conditions and variables such as
the potential for bio-fouling. Dissolved oxygen sensors should be checked
and calibrated every 2-4 weeks or as recommended by the manufacturer.
In addition to keeping the monitoring equipment calibrated, it’s important
to periodically verify that the dissolved oxygen sensors are providing accurate data. The best way to achieve this is by checking dissolved oxygen at
the monitoring station using a separate, portable instrument. This is also
known as spot sampling.
Dissolved oxygen sensors only require a single-point calibration, though a
two-point calibration can be used to verify accuracy across the entire measurement range. A single-point calibration is typically done at 100% air saturation, while a two-point calibration includes a zero oxygen solution. The
100% air saturation calibration solution can be achieved with air-saturated
water or water-saturated air. For long-term studies, it is recommend to calibrate with air-saturated water, though water-saturated air calibrations are
easier to conduct in the field. If a two-point calibration is performed, the zero
oxygen solution can be made or purchased.
When monitoring dissolved oxygen at a hydropower dam, it is useful to have
a spare sensor or sonde available. Keeping a spare dissolved oxygen sensor
on hand will reduce downtime due to unforeseen sensor failure, which could
affect FERC reporting. If needed, the spare DO sensor can easily be field
swapped during calibration or routine maintenance checks.
For greater details regarding maintenance requirements and sensor calibration, the manufacturer’s user manual should be referenced.
12
MONI TO RING OX YGEN
There are several portable dissolved oxygen measurement methods that
can be used for spot sampling. The first method uses a sensor attached to a
handheld display, also known as a dissolved oxygen meter. The sensor can
be connected directly to the display or through a multi-parameter sonde.
The spot sampling equipment can be lowered into the water column to a
depth that matches the stationary sensors. While it is at that depth, a dissolved oxygen measurement can be taken and immediately displayed on
the meter. The portable system data can then be compared to the stationary
monitoring system and checked for discrepancies.
When used for spot sampling, a dissolved oxygen sensor can be optical,
galvanic or polarographic. Optical DO sensors are recommended for their
accuracy and comparability to deployed instruments (as most deployed
DO sensors are optical). Galvanic and polarographic sensors are more economical and can take quicker readings than optical sensors, but they are
flow dependent. This means that the sensors must be stirred if the waterway
has low or no flow. Spot sampling sondes are recommended if the deployed
instrument is also a sonde, so that all measured parameters can be checked
using similar instrumentation.
The second portable verification method uses titration. The Winkler titration method requires taking a water sample, and then fixing and titrating it
to determine the dissolved oxygen concentration. This can be done with
a field kit or in the lab. However, as this method uses a sample instead
of an in-situ measurement, it is more time-consuming to conduct and
a water sample will need to be taken at each measurement depth.
F ON DR IE ST.COM
13
RECOMMENDED
EQUIPMENT
While there are a variety of dissolved oxygen monitoring instruments to choose from, some stand
out above the rest. Fondriest Environmental has
selected these products as the best in their field for
their accuracy, dependability and value. Together,
they provide an innovative and responsive real-time
dissolved oxygen monitoring system. The In-Situ
RDO PRO-X optical dissolved oxygen sensor combines advanced luminescent technology with the
reliability of a smart sensor – including calibration
storage and a digital output. The NexSens MAST
data logging system arrives fully assembled, tested
and operational with integrated solar power and
a choice of real-time radio, cellular, and satellite
communications. Alone, real-time data are good,
but with remote data collection, 24/7 access from
any computer, instant alarm notifications and trend
tracking, the intuitive WQData LIVE takes real-time
data to the next level.
In-Situ RDO PRO-X Optical DO Sensor
NexSens MAST Data Logging System
The In-Situ RDO PRO-X Optical Dissolved Oxygen Sensor is an extremely
stable, accurate, low-maintenance optical dissolved oxygen sensor for longterm environmental monitoring. The RDO PRO-X sensor measures dissolved
oxygen using the latest dynamic luminescence quenching technology that
offers many advantages over Clark-type DO sensors, including stir-independence and insensitivity to interferences such as hydrogen sulfide, chloride,
and ammonium. A user-replaceable sensor cap with pre-loaded calibration
coefficients is replaced annually, eliminating the need for bi-monthly membrane replacements.
The In-Situ RDO PRO-X Optical Dissolved Oxygen Sensor includes a 10m
cable terminating in bare wires for connection to data loggers and PLCs.
For custom cable lengths, the sensor is available with a Twist-Lock cable
connection. Using the Twist-Lock connection, sensor cables can easily
be swapped or extended using a Twist-Lock cable extender, and custom
lengths are available up to 4000 feet. The sensor is constructed
with inert material and pressure-rated to 500 PSI,
making it an ideal solution for highly saline or
deep water environments. Common applications include dam discharge monitoring,
multi-point dissolved oxygen profiling,
and municipal process monitoring.
The iSIC-MAST system includes the data logger and solar panel premounted to a 2” diameter pole to create a truly plug-and-play data collection and sensor interface platform. The system integrates a NexSens iSIC
data logger and 20-watt solar power kit - all in a compact, pre-configured
package. Simply thread the system to any 2” NPT male pipe thread, connect
the solar panel & battery, wire the sensors, and setup a project using iChart
software - it’s that simple!
14
MONI TO RING OX YGEN
NexSens WQData LIVE Web Datacenter
WQData LIVE is a web-based project management service that allows users
24/7 instant access to data collected from NexSens remote environmental data logging & telemetry systems. More than just an online database,
WQData LIVE offers the ability to generate automated reports, configure
alarms to notify project personnel when data values exceed threshold limits,
create FieldBooks to store calibration forms, notes and media and much
more. Projects are password protected with the ability to configure a public
portal or presentation view to share data with the general public. Project
Administrators have the ability to edit project descriptions and information, while users given Collaborator access are limited to data viewing and
form entry.
The iSIC data logger arrives ready for long-term deployment. All electronics are housed in a rugged, NEMA 4X enclosure constructed of heavy-duty
fiberglass. The built-in 8.5 amp-hour sealed lead acid battery provides 12
volt power to the system, and the battery is continuously charged using
solar power. Polymer-coated circuit boards, sealed connectors, corrosionresistant stainless steel hardware and built-in lightning protection ensure
reliable performance in the harshest conditions. All sensors are cabled
through Sealcon gland fittings to ensure protection from the elements.
The Google Maps view shows all project sites on a map with zoom, scroll
and drag capability. Mousing over a site on the map displays the most recent
data values, and clicking on the site navigates to a display showing the last
reading or tabular data that can be downloaded to Excel and sent via email
or FTP. FieldBooks can be created to store notes recorded during field visits,
including forms to store calibration data, which can be submitted from the
WQData LIVE mobile app. This eliminates the need for conventional fieldbooks while keeping critical project information in a single, easy-to-access
location. Site photos can even be placed onto FieldBook pages or uploaded
into the project’s Media page.
NexSens iChart Software is a Windows-based program for interfacing to an
iSIC data logger or network of data loggers. The iChart Setup Device Wizard
includes built-in drivers and a step-by-step interface for setting up and configuring remote monitoring sensors and systems. When connected, the user
can quickly configure sample & log intervals, upload data, or troubleshoot
communications.
The WQData LIVE report feature allows data to be shown both graphically
and in a tabular format. Report templates can be saved so that specific
information can quickly be referenced. Project alarms send email or text
messages to project staff for immediate notification of critical conditions.
With this unique set of features, WQData LIVE provides everything needed
to effectively manage an environmental monitoring application.
F ON DR IE ST.COM
15
PURCHASE
OR RENT?
ABOUT
FONDRIEST
When managing a large monitoring project,
purchasing several dissolved oxygen monitoring systems is often the most economical option.
However, for short-term assessments or projects on
a tight budget, it may not be practical to purchase
the necessary DO monitoring equipment. In these
situations, it is much more prudent to rent real-time
monitoring systems. With several lease duration and
extension options available, the flexibility of renting
DO monitoring systems may still be cost effective for
the larger compliance applications as well.
Company
Dissolved oxygen monitoring equipment can be
rented instrument by instrument, or as an entire
system, calibrated and ready to deploy on arrival.
Rental equipment can include sensors, sondes,
handheld displays, data loggers, telemetry systems
data buoys, and web-based datacenter access. Realtime telemetry via radio-to-shore, cellular and satellite can also be incorporated. A large rental pool
also means that most dissolved oxygen monitoring equipment can be shipped same-day for quick
deployment and emergency situations.
We work closely with NexSens Technology, a company that specializes in the
design and manufacture of real-time environmental measurement systems.
A variety of sensor, platform and telemetry options are available to fit the
unique needs of each project. We can provide complete integrated solutions
and support projects from conception to completion. An extensive fleet of
rental equipment is also available for short-term project needs.
Just as with Fondriest purchases, rental projects
have access to a knowledgeable support staff who
will provide personalized service before, during and
after the project.
Located in the Lower Great Lakes and Ohio River Valley region, Fondriest
Environmental is a leading distributor and integrator of equipment for
natural resource professionals and outdoor enthusiasts. Our team of specialists can help customers understand the products they are buying and
make the correct decisions out in the field. We seek to understand project
needs, devise a comprehensive solution, provide the equipment and knowhow to implement it and then offer long-term project support for whatever
needs arise.
Capabilities
Certifications
Fondriest Environmental is a Certified Repair Center for YSI, NexSens & FishSens, offering quick turnaround, affordable labor rates and personalized
service. Our knowledgeable technicians are available for phone, email and
onsite support when the need arises.
Publications
We cover many customer projects in our Environmental Monitor magazine,
which is updated daily online and printed quarterly. We also produce Lake
Scientist, an interactive online resource providing research articles and
news on lake ecology. Informational pages on environmental parameters
and applications are available in the Measurement Sciences section of our
website. And FishSens Magazine, available online, provides anglers, boaters
and fisheries professionals with the latest fish science news.
Commitment
Fondriest Environmental, Inc.
2091 Exchange Court
Fairborn, OH 45324
tel: 888.426.2151
fax: 937.426.1125
[email protected]
16
MONI TO RING OX YGEN
A commitment to integrity and longstanding customer relations are the
standard, rather than the exception, at Fondriest Environmental. We support
professionals, educators and researchers who continuously work to monitor
and protect our global resources by providing them with the products and
services needed to face today’s environmental challenges. Our team of solution-driven experts has years of field experience and a keen eye for finding
the best equipment for each application.
Contact Information
To reach an application specialist, please call (888) 426.2151 or email
[email protected]
F ON DR IE ST.COM
17
SYSTEM CONFIGURATION TOOL
Site Location
Fondriest application specialists will assist with tailoring system configuration and equipment choices on a site-by-site basis to ensure reliability and proper data management. The
questionnaire below can help you get started. Once completed, this form can be faxed to
(937) 426.1125 or, if completed digitally, emailed to [email protected].
The location of a monitoring system can affect what equipment platform best suits the conditions. Please select in what type of water body the system
will reside.
Contact Information
Approximate Depth
Name:
With buoy-based systems, the mooring hardware and cable lengths used for a deployment depends on the distance to the sea floor. An application
specialist can develop the best mooring plan to accommodate the approximate water depth.
Organization:
Telephone:
Email:
Site Conditions
Lake
< 5 ft.
River
Coastal
Other
Between 5 and 25 ft.
Please Specify
Between 25 and 50 ft.
Between 50 and 100 ft.
> 100 ft.
Water Column Measurements
Measuring dissolved oxygen at a single mid-level depth is often sufficient for FERC monitoring. In some cases, however, regulatory agencies may
require readings at multiple depths.
Single Depth
Multiple Depths
Please Specify
Describe the site conditions in a paragraph or two. Please include details regarding levels of wind, waves and boat traffic experienced in the area.
Telemetry
License-free spread-spectrum radio telemetry allows communication with a shore-side NexSens radio base station as far as five miles line-of-sight from
the monitoring site. Cellular telemetry allows greater geographic flexibility and is able to transmit from almost anywhere in the U.S., but it includes
the cost of a cellular data plan. Satellite telemetry can be used nearly anywhere in the world, but it tends to have the highest data cost compared with
cellular telemetry.
Cellular
Radio
Satellite
None
Quality Assurance
A portable dissolved oxygen meter is an ideal way to verify the accuracy of a dissolved oxygen monitoring system. Select a cable length that will allow
you to reach all measurement locations in the water column.
4m
10m
20m
30m
>30m
Please Specify
Project Length (Rental vs. Purchase)
Although it often makes sense to purchase systems outright, many short-term projects make it cost-prohibitive. Fondriest Environmental offers realtime dissolved oxygen monitoring systems with weekly and monthly rental rates to accommodate these operations. An application specialist can make
recommendations on what choice is most cost-effective.
1-3 Months
18
MONI TO RING OX YGEN
3-6 Months
6-12 Months
>1 Year Please Specify
F ON DR IE ST.COM
19
when your
research
demands
quality data
PRSRT STD
US POSTAGE
PAID
DAYTON, OH
PERMIT# 860
Fondriest Environmental, Inc.
2091 Exchange Court
Fairborn, OH 45324
P 888.426.2151
F 937.426.1125
E [email protected]
TAKE YOUR PROJECT TO THE NEXT LEVEL.
CONTACT A FONDRIEST APPLICATION SPECIALIST
888.426.2151