1
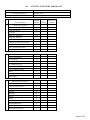
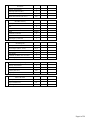
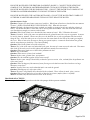
Project WET Kit User Manual Stormwater Coalition of Albany County Source: Project Wet Curriculum and Activity Guide Watercourse/ Project WET and the Council for Environmental Education 2005 Adaptation of Materials for Stormwater Coalition: Christina Chiappetta (Revised by Patricia Shultis) 112 State Street Rm #720 Albany, NY 12207 Special Thanks for Guidance and Support: Diana Strisna NYS DEC, Project WET Coordinator Five Rivers Environmental Education Center Date User Manual Completed: March 19, 2010 Revised: January 5, 2012 Stormwater Coalition of Albany County: Albany County, City of Albany, Town of Bethlehem, City of Cohoes, Town of Colonie, Village of Colonie, Village of Green Island, Village of Menands, Town of New Scotland, Village of Voorheesville, City of Watervliet, SUNY Albany PROJECT WET USER MANUAL TABLE OF CONTENTS I. II. General Information: Page 3 Location and Stewardship of Project WET kits: Page 4 III. Activity Inventory Check List: Pages 5-6 IV. Activities a) Capture, Store, and Release: Pages 7-8 b) Drop in the Bucket: Pages 9-10 c) Macroinvertebrate Mayhem: Pages 11-12 d) Overflow!: Pages 13-16 e) Incredible Journey: Pages 17-20 f) Branching Out: Pages 21-22 g) Just Passing Through: Pages 23-26 h) Sum of the Parts: Pages 27-29 V. Discover the Hudson River: Page 31 I. GENERAL INFORMATION These activities are from the Project WET Curriculum and Activity Guide. In some cases, they have been adapted to fit the needs of the Stormwater Coalition. 1. This particular Project WET kit contains the following activities and materials: a) Capture, Store, and Release -Plastic storage bins with holes (3), Lids for the Bins (3), Sponges, Green Rags, 1 Liter measuring cups (6), Container for water, Identification Tags for bins (3), Poster about How Wetlands Work b) Drop in the Bucket -1 Liter measuring cup, 100mL graduated cylinder, 10mL graduated cylinder, Bucket, Eyedropper, Food coloring, Container for water c) Macroinvertebrate Mayhem -100ft. rope, Environmental stressor tags (4), Dragonfly tags (5), Damselfly Tags (4). Stonefly tags (4), Mayfly tags (5), Caddisfly tags (5), rat-tailed maggot/midge larvae tags (8), Burlap Sacks (5), Macroinvertebrate Poster d) Overflow! -100ft. rope, Pieces of white rope (10), Multicolored tokens (100) e) Incredible Journey -Laminated stations of the water cycle (9), Dice (9), Colored beads (9), Pipe cleaners (30), Poster-“The Hydrologic Cycle” f) Branching Out -Freezer paper (1 roll), Water base pens (60), Spray Bottles (3), Container for water g) Just Passing Through -100ft. rope, Tokens (100), Poster-“Vegetation Helps Prevent Erosion” h) Sum of the Parts -Paper with blue line (30), Final page with lake drawn 2. There are “Activity ‘Lesson’ Plans” for all of the activities, a table cloth with the Stormwater Coalition logo on it if there is a table set-up, and a table-top easel for the visuals. 3. The supplies provided in this kit are enough for groups of up to 30 participants. If there are supposed to be more participants, please contact Nancy Heinzen (518) 447-5645 for additional materials. 4. Some activities will not work with very small groups. Please read about the activity before trying to execute it. 5. Please return all items to the kit (there is an Activity Inventory Check List in the kit). As items are returned, check them against this inventory list. If any items are missing or need to be replenished, contact Nancy Heinzen. 6. If you would like more information about Project WET, go to www.projectwet.org. Page 3 of 31 II. LOCATION AND STEWARDSHIP OF PROJECT WET KITS Page 4 of 31 III. Project Wet Kit # ACTIVITY INVENTORY CHECK LIST Borrowed By: ***Assume Group of 30 Date Borrowed: Activity Inventory Check List Date Returned: Activity/Materials 1 Starting Amount # Missing Needs to be re-stocked Capture, Store, Release Activity 'Lesson'Card 1 Plastic Storage Bin 3 Lid for bin 3 Sponges (Wetland Bin) 1 set Green Rag (Turf Bin) 1 1 Liter Measuring Cup 6 Container for water (also for 2&6) 1 Bin Tags 3 How a wetland works Poster 1 Water Suply 1 2 Drop in the Bucket Activity 'Lesson'Card Food Coloring 1 1 set Container for Water (also for 1&6) 1 1 Liter Measuring Cup 2 100mL Graduated Cylinder 1 10mL Graduated Cylinder 1 Bucket 1 Eyedropper 1 Water Supply 3 Macroinvertebrate Mayhem Activity 'Lesson'Card 1 100ft rope (also for 4&7) 1 Envi. Stressor Tag 4 Dragonfly 5 Damselfly 4 Stonefly 4 Mayfly 5 Caddisfly 5 Rat-tailed/Midge Tag 8 Burlap Bags 5 Macroinvertebrate Poster 1 Page 5 of 31 4 Overflow! Activity 'Lesson'Card 1 100ft rope (also for 3&7) 1 Pieces of White rope 10 Multicolored tokens (also for 7) 100 5 Incredible Journey Activity 'Lesson'Card 1 Dice 9 Stations of Water Cycle 9 Beads 6 9 colors Containers for Beads 9 Pipe Cleaners 30 Hydrologic Cycle Poster 1 Branching Out Activity 'Lesson'Card Freezer Paper (Sheet ~6”x6”) 1 30 pc Water Base Pens 60 Spray Bottle 3 Container for Water (also for 1&2) 1 Water Supply 7 Just Passing Through Activity 'Lesson'Card 1 100ft rope (also for 3&4) 1 Tokens (also for 4) Veg. Helps Prevent Erosion Poster 8 100 1 Sum of the Parts Activity 'Lesson'Card 1 Paper with Blue line 30 Final Page (River/Lake) 1 Page 6 of 31 IV. ACTIVITIES a.) Activity ‘Lesson’ Plan (Project WET Curriculum Book) Capture, Store, Release (Page 133) Age/Grade Level: Upper Elementary, Fun-loving Adults Subject Areas: Earth Science, Geography Duration: Prep Time = 20ins; Activity Time = 1hour MATERIALS: Container with water-enough for demonstration (3)-Plastic Storage Bins with hole at one end (one each for paved surface, turf, and wetland) (3)-Bin Tags (one each for paved surface, turf, and wetland) (3)-Lids for Bins Poster about How Wetlands Work Poster (surface water, ground water, precipitation) Set of sponges for the wetland bin Green rag for the turf bin (6)-1 Liter measuring cups-each bin uses two cups (one with starting water and one to catch the water) Table top to put bins on OBJECTIVE: Recognize that ground water, surface water, and precipitation can contribute water to wetlands; describe how wetlands capture, store, and release water BACKGROUND (Project WET Curriculum Book): Wetlands form a variety of places under myriad conditions – along edges of rivers, streams, lakes, and ponds; in low-lying woods; in highway ditches built to collect rainwater draining from the road; in low areas or fields; even on mountains and hillsides where snowmelt and rainwater constantly run. Although the definition of wetlands is still debated, most agree they are areas where the soil is saturated for all or parts of the year. Wetlands have qualities of both aquatic and terrestrial habitats. Many variables contribute to the formation of wetlands, including soil type, elevation, and water source. The main determinant, however, is always water. Surface water, ground water, and precipitation can each contribute water to wetlands. When it rains, much of the water that hits the ground runs over the surface of the land, until it eventually collects in low spots (e.g., ponds, rivers, or lake). If it saturates the surrounding land, wetlands may form. Wetlands are also formed and fed by ground water seepage from uplands and from waterways. Some wetlands are located where the ground water level is above the surface. When the ground water level drops, the wetland seems to disappear (unless fed by surface water). In this circumstance, any water that enters the now dry wetland will be absorbed by the ground below. The ability of wetlands to hold water is one reason they are valuable for watershed management. Many wetlands store water and slowly release it over time. Although all wetlands capture, store, and release water, significant differences exist among wetlands. One of the primary variables is soil type. If a wetland forms on clay or other semi-impervious soil, a small amount of water infiltrates the ground; standing water will be present. Most of the water in such a wetland will be released into the atmosphere through evaporation. At the other extreme is a wetland located on sandy ground. Water moves into the soil at a rapid pace, and unless the ground water level is above the surface, most of the water will filter underground. ACTIVITY: DIRECTIONS: SET UP THE 3 BINS ON A FLAT SURFACE WITH ONE SIDE PROPPED UP (~45°; THE STORAGE BIN LIDS WORK WELL FOR THIS) AND THEIR APPROPRIATE LABELS: 1) EMPTY-TO REPRESENT PAVEMENT, 2) WASHCLOTH (ONE PIECE)-TO REPRESENT TURF, 3) SPONGES (COVER THE BOTTOM)-TO REPRESENT WETLANDS (SEE DIAGRAM BELOW). MAKE SURE THE LOWER END IS THE SIDE WITH THE HOLE. FILL THREE OF THE MEASURING CUPS WITH WATER. PUT ONE NEXT TO EACH BIN. PUT THE OTHER THREE MEASURING CUPS (EMPTY) NEAR THE HOLES AT THE END OF EACH BIN TO CATCH THE WATER-ONE FOR EACH TYPE OF SURFACE. Page 7 of 31 POUR THE WATER INTO THE FIRST BIN (PACEMENT) SLOWLY. COLLECT THE WATER THAT COMES OUT OF THE BIN IN ANOTHER MEASURING CUP-DO NOT GET RID OF THE WATER. POUR THE WATER INTO THE SECOND BIN (TURF). COLLECT THE WATER THAT COMES OUT OF THE BIN IN ANOTHER MEASURING CUP-DO NOT GET RID OF THE WATER. POUR THE WATER INTO THE LAST BIN (WETLANDS). COLLECT THE WATER THAT COMES OUT OF THE BIN IN ANOTHER MEASURING CUP-DO NOT GET RID OF THE WATER. Question/Answer Script: Question: Compare how much water came out of each bin. Which form of land cover absorbed the most amount of water? (HOLD UP MEASURING CUPS FOR EACH) Why? What does this mean? Answer: Wetlands; this happened because wetlands are capable to storing a lot of water and then releasing it slowly. This means that there is water that can be used by plants and animals. This also means that the water was slowed down enough so it cannot erode the land. Question: Which form of land cover absorbed the least amount of water? Why? What does this mean? Answer: Pavement. None of the water was absorbed into the ground because there was no vegetation. It cannot be used by plants or animals. When water flows over the land like this, it picks up pollutants like litter and oil along the way. All of this ends up in our rivers because the storm drains on the sides of the roads go straight to the rivers. When it rains a lot, the water is flowing over paved surfaces, it cannot be absorbed into the ground, and the storm drains get backed up. This causes flooding. Question: Which form of land cover falls in between? Answer: Turf; some of the water was absorbed by the grass, but most of it came out on the other side. This means that a little of the water can be used by plants and sometimes animals, but not much of it. Question: What type of land cover would collect pollutants the best? Answer: Turf or Wetlands. Question: What sources of water feed wetlands? Answer: Surface water, ground water, precipitation. Question: How do wetlands regulate surface water runoff? Answer: Surface water runoff is absorbed by wetlands to prevent erosion. Also, wetlands filter the pollutants out of the water runoff. Question: What can happen if the amount of water flowing over the land increases like when there is a huge downpour in one hour? Answer: Not all of the water can be absorbed and it can erode the ground. Question: What happens if it only rains a little? Answer: The water will probably all be absorbed by the wetlands. There will not be much, if any, erosion. Question: Which type of land cover is best able to absorb a lot of water (maybe if there is a flood)? Answer: Wetlands; they absorbed the most water in the activity. DIAGRAM OF ACTIVITY: How to set up each bin. This diagram shows the bin with sponges which represents wetlands. Page 8 of 31 b.) Activity ‘Lesson’ Plan (Project WET Curriculum Book) Drop in the Bucket (Page 238) Age/Grade Level: Middle School, Fun-loving Adults Subject Areas: Earth Science, Mathematics, Geography Duration: Prep Time = 30 mins; Activity Time = 30 mins MATERIALS: Container with water-enough for demonstration Food coloring (Blue) to make the starting water is blue Measuring cup- for all the Earth’s water at the beginning and to hold water representing the ocean water 100mL graduated cylinder to hold the 30mL of water representing the fresh water 10mL graduated cylinder to hold the 6mL of water that represents the ice caps Eyedropper to drop the drop of water that is clean and usable into the bucket Bucket OBJECTIVE: Calculate the percentage of freshwater available for human use; explain why water is a limited resource BACKGROUND (Project WET Curriculum Book): Ironically, on a planet extensively (71%) covered with water, this resource is one of the main limiting factors for life on Earth. If all the clean, fresh water were distributed equally among people, there would be about 1.82 million gallons (7 million liters) per person. This is only about 0.003% of the total water on Earth. On a global scale, only a small percentage of water is available, but this percentage represents a large amount per individual. The paradox is that, for some, water may appear plentiful, but for others it is a scarce commodity. Why are some people in need of more water? Geography, climate, and weather affect water distribution. Agriculture, industry, and domestic use also affect availability. ACTIVITY: DIRECTIONS: FILL THE MEASURING CUP WITH WATER. THIS REPRESENTS ALL OF THE WATER ON EARTH. Question/Answer Script: Question: Does anyone know where most of the water is located? Answer: Most of the water on Earth is in the oceans. DIRECTIONS: POUR 30ML FROM THE MEASURING CUP INTO THE 100ML GRADUATED CYLINDER. THIS WATER REPRESENTS THE AMOUNT OF FRESH WATER ON THE PLANET. IT IS ONLY ABOUT 3% OF ALL THE WATER ON EARTH. SHAKE SALT INTO THE REST OF THE WATER LEFT IN THE MEASURING CUP. THIS WATER REPRESENTS THE WATER IN THE OCEANS-SALT WATER. HUMANS CANNOT DRINK THIS WATER. THAT MEANS THAT 97% OF THE WATER ON EARTH IS ALREADY UNUSABLE FOR HUMANS. IT IS NOT GOING TO BE USED AGAIN IN THIS ACTIVITY. Question/Answer Script: Question: What is at the Earth’s poles? Answer: The ice caps. DIRECTIONS: POUR 6ML FROM THE 100ML CYLINDER INTO A 10ML GRADUATED CYLINDER. THE WATER LEFT IN THE LARGER CYLINDER, 24ML, REPRESENTS HOW MUCH OF THE EARTH’S FRESH WATER IS FROZEN IN THE POLES. IT IS ABOUT 2.4% OF THE WATER ON EARTH. Question/Answer Script: Question: Can humans use water if it is frozen in the ice caps? Answer: No. Page 9 of 31 DIRECTIONS: THE WATER IN THIS SMALL CYLINDER, 6ML, REPRESENTS THE NON-FROZEN FRESH WATER. OF THIS, ONLY ABOUT 1.5ML IS SURFACE WATER; THE REST IS UNDERGROUND SO WE STILL CANNOT USE IT. TAKE AN EYDROPPER AND A BUCKET. TAKE ONE DROP OUT OF THE WATER AND DROP IT INTO THE BUCKET. MAKE SURE EVERYONE CAN HEAR IT HIT THE BOTTOM. THIS DROP REPRESENTS HOW MUCH WATER IS CLEAN, FRESH WATER THAT IS NOT POLLUTED OR UNAVAILABLE FOR USE. THAT IS ONLY ABOUT 0.003% OF ALL THE WATER ON EARTH. (SEE DIAGRAM BELOW FOR WATER DISTRIBUTION) Question/Answer Script: Question: Does everyone understand that there is only a small amount of water available for humans? Answer: Yes! Review how all of the water is being used- Salt Water = 970mL/1000mL = 97%; Glaciers/Ice Caps = 24mL/1000mL = 2.4%; Unavailable/Underground/Polluted Freshwater = 6mL/1000mL = 0.6%. There is only 0.003% of the Earth’s water available for human consumption. Question: This precious drop must be managed properly. How can we do that? Answer: We can manage water better by not polluting (litter, oil, fertilizers), conservation efforts (use less water when we shower), telling other people how to be water conscious, etc. Question: Is enough water currently available for people? Answer: Theoretically, there is enough water for the people on the planet right now to have enough for their lifetime. This does not include future generations! Question: Why does more than 1/3 of the population not have access to clean water? Answer: Land forms, vegetation, and distance inhibit getting water for some. Drought, contamination, and flooding affect availability. Also, other organisms use water not only humans. DIAGRAM OF ACTIVITY: The amount of water that is available for humans after accounting for oceans, ice caps, and unavailable fresh water. Page 10 of 31 c.) Activity ‘Lesson’ Plan (Project WET Curriculum Book) Macroinvertebrate Mayhem (Page 322) Age/Grade Level: Upper Elementary, Middle School, Fun-loving Adults Subject Areas: Ecology, Environmental Science, Mathematics Duration: Prep Time = 50 mins; Activity Time = 50 mins NEED AT LEAST 7 PARTICIPANTS FOR THIS TO WORK (ONE PARTICIPANT PER GROUP). IF THERE ARE NOT ENOUGH PARTICIPANTS FOR ALL OF THE TAGS (A TOTAL OF 35), TRY TO INCLUDE AS MANY OF EACH GROUP AS POSSIBLE. THE DIRECTIONS ARE WRITTEN FOR 35 PARTICIPANTS. MATERIALS: 100ft. rope to set the playing field boundaries Name Tags: (4) Environmental Stressor, (4) Damselfly side 1/rat-tailed or midge side 2, (4) Stonefly side 1/rattailed or midge side 2, (5) Dragonfly side 1/rat-tailed or midge side 2, (5) Mayfly side 1/rat-tailed or midge side 2, (5) Caddisfly side 1/rat-tailed or midge side 2, and (8) Rat-tailed/Midge; Rat-tailed/Midge are interchangeable because they both have a high pollution tolerance Burlap bags are for the caddisflies Macroinvertebrate Poster to show each organism’s environmental role OBJECTIVE: Illustrate how tolerance to water quality conditions varies among macroinvertebrate organisms; explain how population diversity provides insight into the health of an ecosystem BACKGROUND (Project WET Curriculum Book): Macroinvertebrates (organisms that lack an internal skeleton and are large enough to be seen with the naked eye) are an integral part of wetland and stream ecosystems. Examples of macroinvertebrates include mayflies, stoneflies, dragonflies, rat-tailed maggots, scuds, snails, and leeches. These organisms may spend all or part of their lives in water; usually in their immature phases (larvae and nymphs) are spent entirely in water. Larvae do not show wing buds and are usually very different in appearance from the adult versions of the insects. (Maggot is the term used for the larva of some flies.) Nymphs generally resemble adults, but have no developed wings and are usually smaller. A variety of environmental stressors can impact macroinvertebrate populations. Urban and/or agricultural runoff can produce conditions that some macroinvertebrates cannot tolerate. Sewage and fertilizers added to streams induce the growth of algae and bacteria that consume oxygen and make it unavailable for macroinvertebrates. Changes in land use from natural vegetation to a construction site or to poorly protected cropland may add sediment to the water. Sedimentation destroys habitats by smothering the rocky areas of the streams where macroinvertebrates live. The removal of trees along the banks of a river and alteration of stream velocity can both alter normal water temperature patterns in the stream. Some organisms depend on certain temperature changes to regulate changes in their life cycles. Other stressors include the introduction of alien species and stream channelization. Some macroinvertebrates, such as the mayfly and stonefly nymphs and caddisfly larvae, are sensitive (intolerant) to changes in stream conditions brought about by pollutants. Some of these organisms will leave to find more favorable habitats, but others will be killed or will be unable to reproduce. Macroinvertebrates (e.g., rat-tailed maggots and midge larvae) that may thrive in polluted conditions are called tolerant organisms. Other organisms, called facultative organisms (e.g., dragonfly and damselfly nymphs) prefer good stream quality but can survive polluted conditions. Water quality researchers often sample macroinvertebrate populations to monitor changes in stream conditions over time and to assess the cumulative effects of environmental stressors. Environmental degradation will likely decrease the diversity of a community by eliminating intolerant organisms and increasing the number of tolerant organisms. If the environmental stress if severe enough, species of intolerant macroinvertebrates may disappear altogether. For example, if a sample of macroinvertebrates in a stream consists of rat-tailed maggots, snails, and dragonfly nymphs, the water-quality conditions of that stream are probably poor (i.e., low oxygen level, increased sediment, contaminants). If, on the other hand, the sample contains a diversity of organisms, the stream conditions are likely good. However, baseline data is essential because some healthy streams may contain only a few macroinvertebrate species. A variety of food sources, adequate oxygen levels, and temperatures conducive to growth all characterize a healthy stream. ACTIVITY: DIRECTIONS: SET UP BOUNDARIES TO AREA USING ROPE (MAKE A LARGE SQUARE). SHOW THE PARTICIPANTS THE PLAYING FIELD/SET BOUNDARIES. PICK FOUR PARTICIPANTS TO BE THE ENVIRONMENTAL STRESSORS, LIKE POLLUTION. Page 11 of 31 DIVIDE THE REST OF THE CLASS INTO 6 GROUPS. ASSIGN EACH GROUP A MACROINVERTEBRATE (CADDISFLY, MAYFLY, STONEFLY, DRAGONFLY, DAMSELFLY, AND RAT-TAILED MAGGOT/MIDGE LARVAE). DISTRIBUTE IDENTIFICATION LABELS-THE TAGS SHOULD BE FLIPPED TO THE SIDE WITH THE INTOLERANT OR FACULTATIVE ORGANISM (CADDISFLY, MAYFLY, STONEFLY, DAMSELFLY, DRAGONFLY) FACING OUT. FOR THE RATTAILED/MIDGE TAG, EITHER SIDE IS FINE. RECORD HOW MANY OF EACH MACROINVERTEBRATE ARE PRESENT. OXYGEN LEVELS IN THE WATER DECREASE WHEN THERE IS A LOT OF POLLUTION. FOR THE PARTICIPANTS REPRESENTING CADDISFLIES, THEY HAVE TO HOP IN THE PLAYING FIELD IN A POTATO SAC. EVERY 5 HOPS, THEY HAVE TO STOP FOR A BREATH BECAUSE THE CADDISFLY HAS A HARD TIME LIVING IN WATER THAT HAS LOW OXYGEN. STONEFLIES HAVE TO DO A PUSH-UP EVERY 10 STEPS BECAUSE WHEN THERE IS LOW OXYGEN IN THE WATER THEY UNDULATE (ROLL) THEIR ABDOMENS TO INCREASE THE FLOW OF WATER OVER THEIR BODIES. THIS HELPS THEM BREATHE. ALL MAYFLIES HAVE TO FLAP THEIR ARMS AND SPIN IN CIRCLES WHILE CROSSING PLAYING AREA BECAUSE MAYFLIES NEED TO INCREASE OXYGEN ABSORPTION BY MOVING THEIR GILLS. ALL THE MACROINVERTEBRATES START AT ONE END OF THE PLAYING AREA. THEY ALL HAVE TO TRY TO GET ACROSS THE FIELD WITHOUT GETTING TAGGED BY THE STRESSORS IN THE MIDDLE. IF A PARTICIPANT GETS TAGGED, HE/SHE HAS TO FLIP HIS/HER IDENTIFICATION TAG OVER TO THE RAT-TAILED/MIDGE SIDE. ONCE IT IS FLIPPED TO THE OTHER SIDE, IT CANNOT BE FLIPPED AGAIN. TELL PARTICIPANTS TO MAKE SURE THEY DO ANY ASSIGNED MOVEMENTS. START THE FIRST ROUND-A ROUND ENDS WHEN ALL PARTICIPANTS ARE ON THE OPPOSITE SIDE OF THE PLAYING FIELD FROM WHERE THEY STARTED. RECORD THE NEW NUMBERS OF EACH MACROINVERTEBRATE AT THE END OF THE FIRST ROUND. REPEAT THIS PROCESS FOR 3 ROUNDS TOTAL. Question/Answer Script: Question: What are different ways that the stream can become polluted? Answer: Sedimentation, sewage, fertilizer, etc. Question: Compare how many of each group was present at the beginning of the activity compared to the end. Answer: At the end of each round, there were more and more rat-tailed maggots and midge larvae. There were much less of the other macroinvertebrates (caddisfly, mayfly, stonefly, dragonfly nymph, damselfly nymph). Question: What does this mean? Answer: The pollution was killing off the other macroinvertebrates-this causes less biodiversity; rat-tailed maggots and midge larvae are more pollution tolerant; they can live in bad water conditions; environmental stressors really take a toll on the intolerant species. Question: In the beginning, there were a lot of different types of macroinvertebrates. What does that mean? Answer: The water was relatively healthy. The pollution sensitive organisms were present. Question: What can we do to make sure that the water stays healthy? Answer: Do not pollute, do not use lawn fertilizers or chemicals that can get in the waterways, do not litter, do not promote erosion/sedimentation etc.; we can clean up after ourselves and plant vegetation near stream edges to make the water a nice place for all living things. Page 12 of 31 d.) Activity ‘Lesson’ Plan (Project WET Curriculum Book) Overflow! (Adapted from Super Bowl Surge Page 353) Age/Grade Level: Upper Elementary, Middle School, High School, Fun-loving Adults Subject Areas: Government, Environmental Science, Health Duration: Prep Time = 15 mins; Activity Time = 30 mins MATERIALS: 100 ft. rope to represent the underground sewer pipe Short pieces of white rope: 1 to represent the overflow pipe and the rest to connect the houses to the main sewer pipe Red tokens represent waste materials coming from each house Blue tokens represent pollution picked up from stormwater runoff when it rains and stormwater runoff in general OBJECTIVE: Illustrate how demands on some sewage treatment plants cause an overflow of combined stormwater runoff and sanitary waste into waterways; explain water quality issues and propose solutions to this water management problem. BACKGROUND (Project WET Curriculum Book): Most urban communities depend on wastewater treatment plants to ensure that water used by residences and businesses returns to nature clean. Engineers and city planners consider many factors when they design wastewater treatment plants. These considerations include: current and projected population growth, types of businesses, high usage periods, financial resources available to build appropriate treatment systems, and government regulations (laws and standards). In addition to this, some systems also have stormwater runoff going into them. This is a combined sewage stormwater system. However, as an area becomes more urbanized with more houses and impervious surfaces, like roads, being built, stormwater is less likely to be absorbed into the ground and instead is washed over the ground and ends up in the storm drains. As populations grow (sometimes far exceeding the expectations of planners) and as the infrastructure of plants age, treatment plants may be unable to handle the increased output of residential waste combined with increasing amounts of stormwater. In heavy rain events the excess amount of stormwater going into the system combined with the wastewater can cause the wastewater treatment plant to back up. During times of overflow, some plants must dump excess waste directly into a body of water, such as a river or an overflow pond. Unsightly and odorous, untreated waste leads to multiple health hazards for humans and wildlife. Sewage contains bacteria, protozoa, and viruses that normally live in the intestines of humans and other animals. Waterborne diseases such as dysentery and hepatitis are transmitted by contaminated water. Organic waste promotes the growth of many microorganisms. When populations of bacteria and other singlecelled organisms increase dramatically (bloom), they use more than their share of oxygen and nutrients. Toxins, produced by the microorganisms, and reduced oxygen levels endanger plants and animals. When sewage ends up in waterways, humans are warned not to eat shellfish and other aquatic life because the may harbor poisons released by the microorganisms. To treat increased amounts of waste and stormwater, several alternatives are evaluated by managers. Options include building larger treatment plants, building green infrastructure to help absorb the stormwater before it gets into the system, or separating the stormwater and sewage systems. Residents can conserve water by limiting daily toilet flushes, placing a bottle in their tanks to reduce the water used per flush, and installing toilets that use very little water. Sometimes, water management policies must change. This involves government planning boards consulting experts on methods to alleviate the problem. Boards evaluate plans based on available funds and on the needs and expectations of their communities. ACTIVITY: DIRECTIONS: RUN LONG ROPE DOWN CENTER OF ROOM AND ATTACH ANOTHER SHORT ROPE PERPENDICULAR TO IT TOWARDS ONE END. THE LONG ROPE REPRESENTS A SEWER PIPE RUNNING UNDERGROUND AND THE SHORTER ROPE REPRESENTS THE OVERFLOW PIPE THAT LEADS TO THE RIVER. YOU (THE INSTRUCTOR) WILL STAND AT THE END OF THE LONG ROPE PAST THE OVERFLOW PIPE. YOU WILL REPRESENT THE TREATMENT PLANT. YOU WILL BE RESPONSIBLE FOR COLLECTING TOKENS AND COUNTING OFF 3 SECONDS. RED TOKENS WILL REPRESENT SANITARY WASTEWATER AND BLUE TOKENS WILL REPRESENT STORMWATER Page 13 of 31 RUNOFF. IT TAKES 3 SECONDS FOR THE TREATMENT PLANT TO CLEAN WASTE FROM EACH HOUSEHOLD. ON EITHER SIDE OF THE LONG ROPE, ARRANGE CHAIRS, BOOKS OR OTHER OBJECTS THAT WILL REPRESENT HOUSES. (IF OUTSIDE, A STANDING INDIVIDUAL CAN REPRESENT A HOUSE.) MAKE ENOUGH HOUSES SO THAT EACH HOUSE WILL HAVE EXACTLY 3 PARTICIPANTS. FOR EXAMPLE, IF THERE ARE 15 PARTICIPANTS THEN THERE WILL BE 5 HOUSES. IF THERE ARE EXTRA PARTICIPANTS THEY CAN BE THE TREATMENT PLANT. (ONE CAN COUNT ONE CAN COLLECT TOKENS OR ONE CAN DO BOTH.) CONNECT A SHORT ROPE FROM THE MAIN SEWER PIPE TO EACH HOUSE ON THE GROUND. EACH OF THE SHORTER ROPES REPRESENTS THE PIPE THAT CONNECTS TO THE LARGE SEWER PIPE THAT GOES TO THE TREATMENT FACILITY. (SEE DIAGRAM BELOW) GIVE EACH PARTICIPANT IN EACH HOUSE A RED TOKEN (WASTE MATERIAL.) ASK 3 PARTICIPANTS TO LINE UP AT EACH HOUSE. ASSIGN THE STUDENTS NUMBERS 1 THROUGH 3. AS YOU SAY “FLUSH!” AND A NUMBER, THE PARTICIPANT WITH THAT NUMBER PICKS UP A TOKEN, LEAVES HIS/HER HOME, AND WALKS DOWN THE PIPES TOWARDS THE SEWAGE PLANT. EACH PARTICIPANT STANDS AN ARMS LENGTH AWAY FROM EACH OTHER AS THEY WALK DOWN THE MAIN PIPE. WHEN THEY GET TO THE PLANT, ASK THEM TO HAND THEIR TOKEN TO THE COLLECTOR. THE TREATMENT PLANT COUNTS TO 3 AFTER THE FIRST TOKEN IS COLLECTED. A SECOND TOKEN CANNOT BE TAKEN UNTIL 3 SECONDS HAS PASSED. IF ALL THE STUDENTS IN THE LINE GET THEIR WASTE TREATED, THE WASTE WATER SYSTEM HAS NOT OVERFLOWED. FOR THE FIRST TRIAL, THIS SHOULD BE DONE WITH ONLY ONE PARTICIPANT FROM EACH HOUSE. Script: Flush! One! DIRECTIONS: PARTICIPANTS WITH THE NUMBER “ONE” SHOULD BE WALKING DOWN THE SEWER PIPE TO THE PLANT. ALL OF THEIR WASTE SHOULD BE TREATED IN THE ALLOTTED TIME. REPEAT THE SAME PROCEDURES AS THE FIRST TRIAL, BUT FOR NUMBERS 2 AND 3 IN THE SAME FLUSH. (E.G., “Flush! Two, three!”, ALL PARTICIPANTS SHOULD MAKE IT THROUGH THE TREATMENT PLANT. Script: Flush! Two, three! Question/Answer Script: Question: Does anyone have any pollution chips? Where are they? Answer: No; in the treatment plant. Question: So what does that mean about the water that just went into the River? Answer: It’s clean. Question: Did the treatment plant do its job? Answer: Yes. DIRECTIONS: HAVE ALL OF THE PARTICIPANTS RETURN TO THEIR HOUSES AND PUT THE RED TOKENS BACK IN FRONT OF THE HOUSES. ALL OF THE PARTICIPANTS WITH THE NUMBER 3 SHOULD COME FORWARD. THEY ARE GOING TO BE POLLUTED STORMWATER RUNOFF, (“RAINDROPS”.) GIVE THEM EACH A BLUE TOKEN AND SPREAD THEM OUT BETWEEN THE HOUSES AND ALONG THE SIDES OF THE MAIN LINE. THIS REPRESENTS THE POLLUTION THAT IS IN STORMWATER IN GENERAL. THIS TIME WHEN YOU FLUSH, THE “RAINDROPS” (BLUE TOKEN) GO INTO THE PIPE AS WELL. IN THIS TRIAL, IT IS ONLY LIGHTLY RAINING. Script: Flush! One! Page 14 of 31 FOR THE SECOND FLUSH EXPLAIN THAT THE RAIN HAS STOPPED AND IT IS SUNNY AGAIN. SINCE THERE IS ONLY TWO PARTICIPANTS LEFT PER HOUSE, YOU WILL ONLY SAY “Flush! Two!” ALL OF THE PARTICIPANTS SHOULD MAKE IT THROUGH THE TREATMENT PLANT. Script: Flush! Two! Question/Answer Script: Question: Does anyone have any pollution chips? Where are they? Answer: No; in the treatment plant. Question: So what does that mean about the water that just went into the River? Answer: It’s clean. Question: Did the treatment plant do its job? Answer: Yes DIRECTIONS: HAVE THE PARTICIPANTS RETURN TO THEIR HOUSES AND THE “RAINDROPS” (POLLUTED STORMWATER) BACK TO THEIR SPOTS AND GIVE BACK THEIR CHIPS. THIS NEXT TRIAL WILL BE A HEAVY RAIN. HAVE THE PARTICIPANTS WITH THE NUMBER 2 COME FORWARD. THEY GET A BLUE CHIP AND WILL NOW ALSO BE RAINDROPS. THIS TIME WHEN YOU SAY FLUSH, EVERYONE WILL GO INTO THE SYSTEM. THE MAXIMUM AMOUNT OF WATER THE TREATMENT PLANT CAN TAKE BEFORE IT OVERFLOWS IS THE NUMBER OF PARTICIPANTS THAT WERE LET THROUGH DURING THE “Flush! Two, three!” OF TRIAL ONE. THIS NUMBER OF PARTICIPANTS SHOULD BE TWICE THE NUMBER OF HOUSES. EXAMPLE: 4 HOUSES, ONLY 8 PEOPLE (INCLUDING THOSE ACTING AS RAINDROPS) CAN GO THROUGH THE TREATMENT PLANT BEFORE IT OVERFLOWS. AFTER THE DETERMINED OVERFLOW NUMBER OF PARTICIPANTS PASS THROUGH THE SYSTEM, STOP AND YELL “Overflow!” THE REST OF THE PARTICIPANTS MUST GO DOWN THE OVERFLOW PIPE AND LEAVE THEIR POLLUTION CHIP IN THE RIVER. Question/Answer Script: Question: Where is the pollution? Does the treatment plant have it all? Answer: Treatment plant and river. No some is in the river. Question: What does that mean for the river? Answer: That dirty water is getting into the river and making the river polluted. Question: Compare how the different trials and whether the system worked or there was overflow. Answer: For Trial #1, there was no overflow because there was not too much waste for the plant to handle. There was not a huge surge of waste water. There was more waste water to handle as it began to rain and people were flushing their toilets but the plant could still handle it. In the last trial, there was so much waste running down the sewer pipes and stormwater entering the system because it was raining really hard, that the treatment plant could not take all of it in. Question: Is it understandable that some treatment plants cannot handle all of the waste water and added stormwater? Answer: Yes; there are times when there is a lot of waste water like when it is raining hard. If there are a lot of people in one area and a lot of rain, then it makes sense that the sewer line will overflow. Question: What happens when wastewater combined with stormwater enters the river untreated? Answer: Bacteria grows and can infect humans and wildlife, the bacteria uses up a lot of oxygen that other organisms in the water need, smells bad, etc. Question: The second time we went through the system there was a little rain and the system still worked. How can we make it more like that? Answer: We use design practices so that more stormwater runoff goes into the ground, rather than enter the combined wastewater and stormwater system. These practices are called green infrastructure and include rain gardens, stormwater planters, tree plantings, porous pavement etc… We can also separate the stormwater and sewage systems so that we don’t have that much water going to the treatment plant. Page 15 of 31 DIAGRAM OF ACTIVITY: How to set up the houses, pipes, and treatment plant. Page 16 of 31 e.) Activity ‘Lesson’ Plan (Project WET Curriculum Book) The Incredible Journey (Page 161) Age/Grade Level: Upper Elementary, Middle School, Fun-loving Adults Subject Areas: Earth Science Duration: Prep Time = 50 mins; Activity Time = 1.5 hours MATERIALS: (9)-Posters for each station of the water cycle (9)-Dice for the students to roll to see where they move next in the water cycle; there is one designated for each station (what is written on dice corresponds to station) (9)-Colored beads to represent each of the stations in the water cycle Poster of the Hydrologic Cycle Pipe cleaners-one for each student; tracks where the student moved in the cycle OBJECTIVE: Describe the movement of water within the water cycle; identify the states of water as it moves through the water cycle. BACKGROUND (Project WET Curriculum Book): While water does circulate from one point or state to another in the water cycle, the paths it can take are variable. Heat energy directly influences the rate of motion of water molecules. When the motion of the molecule increases because of an increase in heat energy, water will change from a solid to liquid to gas. With each change in state, physical movement from one location to another usually follows. Glaciers melt to pools which overflow to streams, where water may evaporate into the atmosphere. Gravity further influences the ability of water to travel over, under, and above Earth’s surface. Water as a solid, liquid, or gas has mass and is subject to gravitational force. Snow on mountaintops melts and descends through watersheds to the oceans of the world. One of the most visible states in which water moves is the liquid form. Water is seen flowing in streams and rivers and tumbling in ocean waves. Water travels slowly underground, seeping and filtering through particles of soil and pores within rocks. Although unseen, water’s most dramatic movements take place during its gaseous phase. Water is constantly evaporating, changing from a liquid to a gas. As a vapor, it can travel through the atmosphere over Earth’s surface. In fact, water vapor surrounds us all the time. Where it condenses and returns to Earth depends upon loss of heat energy, gravity, and the structure of the Earth’s surface. Water condensation can be seen as dew on plants or water droplets on the outside of a glass of cold water. In clouds, water molecules collect on tiny dust particles. Eventually, the water droplets become too heavy and gravity pulls the water to Earth. Living organisms also help move water. Humans and other animals carry water within their bodies, transporting it from one location to another. Water is either directly consumed by animals or is removed from foods during digestion. Water is excreted as a liquid or leaves as a gas, usually through respiration. When water is present on the skin of an animal (for example, as perspiration), evaporation may occur. The greatest movers of water among living organisms are plants. The roots of plants absorb water. Some of this water is used within the body of the plant, but most of it travels up through the plant to the leaf surface. When water reaches the leaves, it is exposed to the air and the sun’s energy and is easily evaporated. This process is called transpiration. All these processes work together to move water around, through, and over the Earth. ACTIVITY: Question/Answer Script: Let’s start by talking about all of the different places water can go as it moves through the water cycle. Question: Can you name some of the different places water can go through the water cycle? Answer: Clouds, ocean, lakes, rivers, animals, plants, soil, groundwater, and glaciers. DIRECTIONS: PUT ALL OF THE STATIONS (THE 9 PLACES WATER CAN MOVE TO) AROUND THE ROOM. PUT THE RESPECTIVE DIE AT EACH STATION. PUT ONE CONTAINER OF BEADS AT EACH STATION. Page 17 of 31 DIVIDE THE PARTICIPANTS EVENLY THROUGHOUT THE STATIONS. EVERYONE PARTICIPATING IS GOING TO BECOME A WATER MOLECULE MOVING THROUGH THE WATER CYCLE. Question/Answer Script: Question: Where can water go from each station? Answer: From Soil, To Plants, water is absorbed by plant roots Rivers, soil is saturated so water runs-off Groundwater, water is pulled up by gravity and filters down into the soil Clouds, heat energy is added to the water so it evaporates Stay, remains on the surface From Plants, To Clouds, water leaves the plant through transpiration Stay, the water can be used by the plant in the cells From River, To Lake, water flows into the lake Groundwater, water is pulled up by gravity and filters down into the soil Ocean, water flows into the ocean Animal, an animal drinks the water Clouds, heat energy is added to the water so it evaporates Stay, water stays in the current of the river From Clouds, To Soil, water condenses and falls on soil Glacier, water condenses and falls as snow onto a glacier Lake, water condenses and falls into a lake Ocean, water condenses and falls into the ocean Stay, water remains as a water droplet clinging to a dust particle in the sky From Ocean, To Clouds, heat energy is added to the water so it evaporates Stay, water remains in the ocean From Lake, To Ground water, water is pulled up by gravity and filters down into the soil Animal, an animal drinks the water River, water flows into a river Clouds, heat energy is added to the water so it evaporates Stay, water remains within the lake or estuary From Animal, To Soil, water is excreted through feces and urine Clouds, water is respired or evaporated from the body Stay, water is incorporated into the body From Ground Water, To River, water filters into a river Lake, water filters into a lake Stay, water stays underground From Glacier, To Ground water, ice melts and water filters into the ground Clouds, ice evaporates and water goes to the clouds (sublimation) River, ice melts and flows into a river Stay, ice stays frozen in the glacier DIRECTIONS: IN THIS GAME, A ROLL OF THE DIE AT THE STATION DETERMINES WHERE THE PARTICIPANT WILL GO NEXT (SEE DIAGRAM BELOW). AS THE PARTICIPANT MOVES TO EACH STATION, HE/SHE ADDS A BEAD FROM THAT STATION ONTO HIS/HER PIPE CLEANER SO MOVEMENT THROUGH THE WATER CYCLE CAN BE TRACKED. IF A PARTICIPANT ROLLS A “STAY,” HE/SHE Page 18 of 31 ADDS ANOTHER BEAD FROM THAT STATION TO HIS PIPE CLEANER. LINE EVERYONE UP BEHIND THE DIE AT EACH STATION. LET THE PARTICIPANTS ROLL THE DICE AND MOVE THROUGH THE WATER CYCLE UNTIL EACH STATION HAS ROLLED AT LEAST 10 TIMES. Question/Answer Script: Question: By looking at the beads on your pipe cleaners, which station were you at the most? Answer: Cloud station; most of the water on Earth turns into vapor at some point and ends up there. Question: What phase, solid, liquid, or gas, will water move in the most? Answer: Most of the movement will take place when water is in liquid form. But when it moves to clouds, it is in the form of vapor. Question: What conditions were necessary for water to move from station to station? Answer: Heat energy makes water move to the clouds as vapor; Heat energy can also cause glaciers to melt and the water moves to the oceans or as round water in liquid form; A change of phase due to heat energy being added, water cooling and condensing, transpiration, evaporation, water flowing, water being used by plants or animals, excretion, gravity Question: If there was water in a stream, where could the water move? What phases does it move in? Answer: To ground water if it filters into the soil as a liquid, into an animal if it drinks it as a liquid, to an ocean if it flows into an ocean as a liquid, to the clouds if it evaporates as vapor. Question: Did any of you go back to the same station that you started at? Answer: Yes, the water was cycling. Even though the water changed phases and moved to different places, it is possible for water to move through all of the stations repeatedly. DIRECTIONS: RETURN BEADS AND PIPE CLEANERS TO KIT. SEE DIAGRAM ON THE NEXT PAGE Page 19 of 31 DIAGRAM OF ACTIVITY: How the participants move from station to station. The activity varies from the one in the curriculum book as it does not call for participants moving in pairs between stations. Page 20 of 31 f.) Activity ‘Lesson’ Plan (Project WET Curriculum Book) Branching Out (Page 129) Age/Grade Level: Middle School, Fun-loving Adults Subject Areas: Earth Science, Geography Duration: Prep Time = 50 mins; Activity Time = 1.5 hours MATERIALS: Container of water-enough for demonstration Freezer paper-there needs to be enough so each person can have one (Sheet ~6”x6”) Water based pens are used to draw on the freezer paper; each person need two colors (preferably blue for water and green for land) Spray bottles are used to spray the freezer paper after it has been drawn on so everyone can see the flow of water in the watershed when the colors start to run OBJECTIVE: Predict where water will flow in watersheds; describe drainage patterns in watersheds BACKGROUND (Project WET Curriculum Book): When the ground is saturated or impermeable to water during heavy rains or snowmelt, excess water flows over the surface of the land as runoff. Eventually, this water collects in channels such as streams. The land area that drains water into the channels is called the watershed or drainage basin. Watersheds are separated from each other by areas of higher elevation called ridge lines or divides. Near the divided of a watershed, water channels are narrow and can contain fast-moving water. At lower elevations, the slope of the land decreases, causing water to flow more slowly. As smaller streams merge together, the width of the channel increases. Eventually, water collects in a wide river that empties into a body of water such as a lake or ocean. From an aerial view, drainage patterns in watersheds resemble a network similar to the branching pattern of a tree. Tributaries, similar to twigs and small branches, flow into stream, the main branches of the tree. Streams eventually empty into a large river, comparable to the trunk. Like other branching patterns (e.g., road maps, veins in a leaf, the human nervous system), the drainage pattern consists of smaller channels merging into larger ones. Watersheds are either closed or open systems. In closed systems, such as Crater Lake in southwest Oregon or the Great Salt Lake in Utah, water collects at a low point that lacks an outlet. The only way water naturally leaves the system is through evaporating or seeping into the ground. Most watersheds are open: water that collects in smaller drainage basins overflows into outlet rivers and eventually empties into the sea. ACTIVITY: DIRECTIONS: HAND OUT A PIECE OF FREEZER PAPER TO EACH PARTICIPANT ALONG WITH 2 MARKERS (BLUE=WATER; GREEN=RIDGES). ALL PARTICIPANTS NEED TO CRUMPLE UP THE FREEZER PAPER. ASK THEM TO UNWRINKLE IT, BUT DO NOT FLATTEN IT OUT ALL THE WAY. YOU WANT THEM TO HAVE HIGH PARTS LIKE MOUNTAINS AND LOW PARTS LIKE VALLEYS. USE THE GREEN MARKER COLOR ON THE HIGH RIDGES AND USE THE BLUE MARKER TO COLOR IN THE LOW VALLEYS. USE THE WATER BOTTLE TO SPRAY THE MODELS A FEW TIMES UNTIL WATER STARTS TO FLOW. BE SURE TO SPRAY FROM ABOVE THE RIDGES. Question/Answer Script: Question: Where do you think the water would go in your model if there was a rainstorm? Answer: To the low points-where there is water. Question: Does all of the water collect at one site? What kind of watershed do you have, open or closed? Answer: Yes-open watershed because it is not contained; No-closed watershed because it is still contained in the paper at a low point. Question: Looking at the paper in front of you, can everyone see that the smaller streams at the ridges eventually flow into larger waterbodies? Answer: Yes, small streams where the water started out and then flowed down. Question: What does the smaller streams getting bigger and connecting to the larger streams look like? Answer: The way tree branches look; a nervous system in a human. Page 21 of 31 Question: How does where water flows impact drainage? Answer: Water cannot be absorbed into the ground; it will flow over the land. If there is a lot of water and nowhere for it to drain, there will be an increase in the amount of flooding in the area. Also, flooding can be caused when the rivers and streams overflow their natural channels. If the water is in a more open watershed, it can drain more easily. Question: Did everyone notice that the color that was used to color the high points drained into the low areas? What does this mean? Answer: Yes; if there are a lot of places that water is coming from into one low point, there might be drainage problems because of the amount of water. Page 22 of 31 g.) Activity ‘Lesson’ Plan (Project WET Curriculum Book) Just Passing Through (Page 166) Age/Grade Level: Upper Elementary, Middle School, Fun-loving Adults Subject Areas: Earth Science, Environmental Science, Ecology Duration: Prep Time = 50 mins; Activity Time = 1.5 hours MATERIALS: 100ft. rope to represent the river in this activity Tokens are used to represent pollution or debris Poster-“Vegetation Helps Prevent Erosion” OBJECTIVE: Compare how fast water flows down slopes with and without plant cover; identify Best Management Practices that can be used to reduce erosion BACKGROUND (Project WET Curriculum Book): As it flows over and through soil, water filters through spaces among particles and around plant roots and vegetative matter. This process slows the movement of water. Sediment (soil and other natural materials carried by water) may be removed from the water as it is captured and stored by vegetation, lakes, ponds, and wetlands. Vegetation also helps hold soil in place. When vegetation is removed, (by human or natural causes), soil particles are more likely to be dislodged and carried away by water. This is called erosion. Soil being carried by water is a natural, ongoing process. Erosion has occurred since water appeared on the planet. (Consider the formation of the Grand Canyon or the gradual leveling of the Appalachian Mountains.) When soil and organic matter are carried by water from one location to another, the destination site may be enriched and its surface area increased (e.g., the floodplain of a river or delta). However, the effects of erosion are not always desirable. Erosion of topsoil decreases the fertility of soil, and sediment build-up in streams and lakes can harm aquatic life. Ensuring that the condition of a land area does not promote deleterious erosion and other water resource problems involves the use of Best Management Practices (BMPs). Watershed managers rely on BMPs that reduce erosion and nonpoint source pollution problems. BMPs that prevent erosion include: landscaping areas to promote plant cover; replanting areas cleared by logging; monitoring water that enters and leaves cut areas; building terraces, catch basins, and natural filters to mitigate sediment deposition in lakes, streams, etc.; and leaving a green or planted zone in riparian areas. ACTIVITY: DIRECTIONS: MAKE A MEANDERING STREAM ON THE FLOOR WITH THE LONG ROPE. Simulation #1-Plant Cover: HALF OF THE PARTICIPANTS STAND AT THE TOP OF THE STREAM TO REPRESENT RAINDROPS. EVERYONE ELSE IS GOING TO BE VEGETATION (SEE DIAGRAM #1 BELOW). THEY CAN STAND ANYWHERE AS LONG AS IT IS BETWEEN THE RAINDROPS AND THE STREAM. WHEN YOU SAY “RAIN,” THE RAINDROPS START TO WALK DOWN FROM THE TOP, THROUGH THE VEGETATION. THOSE REPRESENTING VEGETATION TRY TO TAG THE RAINDROPS AS THEY WALK PAST THEM; VEGETATION CAN PIVOT AROUND ONE FOOT, BUT CANNOT WALK AROUND. IF A RAINDROP IS TAGGED, HE/SHE MUST WALK AROUND THE VEGETATION 5 TIMES. THIS REPRESENTS THE WATER GETTING ABSORBED INTO THE GROUND. AFTER THAT, THE RAINDROPS CRAWL THE REST OF THE WAY TO THE STREAM. THIS SHOWS HOW THE WATER MOVES UNDERGROUND TOWARDS THE STREAM ONCE IT IS ABSORBED. ONCE IN THE STREAM, PARTICIPANTS CAN WALK TO REST OF ITS LENGTH. TIME HOW LONG IT TAKES VARIOUS PARTICIPANTS TO GET TO THE END OF THE STREAM. Script: Ready? Rain! DIRECTIONS: START TIMING. RECORD THE TIMES OF VARIOUS PARTICIPANTS ON A PIECE OF PAPER. THIS SIMULATION TAKES THE LONGEST BECAUSE THE RAINDROPS ARE GETTING STOPPED BY THE VEGETATION. THIS SIMULATION CAN BE REPEATED SO ROLES CAN BE SWITCHED. Page 23 of 31 Simulation #2-Barren: REPEAT THE PROCEDURES FOR SIMULATION#1, BUT ANYONE WHO WAS VEGETATION NOW SITS ON THE FLOOR TO REPRESENT A SMALL ROCK (SEE DIAGRAM #2 BELOW). THIS TIME, WHEN A RAINDROP BUMPS INTO A ROCK, PARTICIPANTS CAN WALK AROUND THE ROCK AND GO INTO THE STREAM. TIME HOW LONG IT TAKES VARIOUS PARTICIPANTS TO GET TO THE END OF THE STREAM. Script: Ready? Rain! DIRECTIONS: START TIMING. RECORD THE TIMES OF VARIOUS PARTICIPANTS ON A PIECE OF PAPER. IT TAKES LESS TIME THAN THE FIRST SIMULATION BECAUSE THE RAINDROPS ARE NOT GETTING STOPPED BY THE VEGETATION. THIS SIMULATION CAN BE REPEATED SO ROLES CAN BE SWITCHED. DIRECTIONS: Simulation #3-Plant Cover and Sediment: REPEAT THE PROCEDURES FOR SIMULATION#1. THIS TIME, SCATTER SEVERAL TOKENS ON THE GROUND IN THE AREA BETWEEN THE RAINDROPS AND THE VEGETATION TO REPRESENT LOOSE SEDIMENT. RAINDROPS PICK UP TOKENS THAT ARE IN THEIR PATH TO THE STREAM. WHEN A RAINDROP IS TAGGED BY VEGETATION, PARTICIPANTS LEAVE THE TOKENS AT THE BASE OF THE VEGETATION AND CONTINUE ONTO THE STREAM. THIS SYMBOLIZES SOIL FILTERING RAINDROPS AND REMOVING SEDIMENT. IF A PARTICIPANT DOES NOT ENCOUNTER VEGETATION, HE/SHE TAKES THE TOKENS INTO THE STREAM AND THEN LEAVES IT AT THE END OF THE STREAM. RECORD HOW MANY TOKENS ARE AT THE END OF THE STREAM. Script: Ready? Rain! DIRECTIONS: THERE SHOULD ONLY BE VERY FEW TOKENS AT THE END OF THE STREAM. THIS SIMULATION CAN BE REPEATED SO ROLES CAN BE SWITCHED. Simulation #4-Barren and Sediment: REPEAT THE PROCEDURES FOR SIMULATION#2. SCATTER SEVERAL TOKENS ON THE GROUND IN THE AREA BETWEEN THE RAINDROPS AND THE SMALL ROCKS TO REPRESENT LOOSE SEDIMENT. RAINDROPS PICK UP TOKENS THAT ARE IN THEIR PATH TO THE STREAM. WHEN A RAINDROP BUMPS INTO A ROCK, PARTICIPANTS WALK AROUND THE ROCK AND GO INTO THE STREAM, CARRYING THE TOKEN. RECORD HOW MANY TOKENS ARE AT THE END OF THE STREAM. Script: Ready? Rain! DIRECTIONS: THERE SHOULD BE MORE TOKENS AT THE END OF THE STREAM COMPARED TO SIMULATION #3. THIS SIMULATION CAN BE REPEATED SO ROLES CAN BE SWITCHED. Question/Answer Script: Question: Compare how long it took the raindrops to move from the top of the hill to the end of the stream in simulations #1 and #2. Which simulation had faster moving water? Why? Answer: The water was moving faster in simulation #2 than in simulation #1. This happened because there was no vegetation on the hill in simulation #2 to slow the water by absorbing it. Instead, the raindrops that were not absorbed by the vegetation made their way to the end of the stream much faster. Question: What happens to the ground when rain water runs down a hill with no plants? Answer: The water would increase fast moving waters and flooding; would start to erode the land; sediments would end up in the lakes or oceans; increase in erosion of the surrounding area; can kill aquatic life. . Page 24 of 31 Question: Compare how many tokens are at the end of the stream in simulations #3 and #4. Which simulation had more sediment in the stream? Why? Answer: There was more sediment in the stream in simulation #4 than in simulation #3. This happened because there was no vegetation to filter the sediment out of the water drops. The raindrops that were not absorbed by the vegetation made their way to the end of the stream with the sediment. Eventually, this sediment could build up in the waterways. Question: What are some Best Management Practices that people can do to stop erosion? Answer: Make sure not to cut away all vegetation from an area; replant trees or make rain gardens-small gardens that are placed in areas where there is a lot of water flow over the land to slow the water down and absorb it; do not over water areas with a limited amount of vegetation SEE DIAGRAMS ON THE NEXT PAGE Page 25 of 31 DIAGRAMS OF ACTIVITY: 1. Set-up for simulation #1 and #3. Participants are representing vegetation. 2. Set-up for simulation #2 and #4. Participants are representing small rocks. Page 26 of 31 h.) Activity ‘Lesson’ Plan (Project WET Curriculum Book) Sum of the Parts (Page 267) Age/Grade Level: Upper Elementary, Middle School, Fun-loving Adults Subject Areas: Environmental Science, Government Duration: Prep Time = 50 mins; Activity Time = 50 mins MATERIALS: Pieces of paper with a blue line are the plots of land on the river that the participants are going to draw on The final page with a lake goes on the end of all the other papers after they are connected OBJECTIVE: Distinguish between point and nonpoint source pollution; recognize that everyone contributes to/is responsible for a river or lakes water quality; identify Best Management Practices to reduce pollution BACKGROUND (Project WET Curriculum Book): The quality of water in a river (or lake) is, to a large extent, a reflection of land uses and natural factors found in its watershed. If soil near a river or lake naturally erodes, chances are the river has sediment and turbidity problems. If the land has stable vegetative cover, erosion is kept in check. When humans settle and develop land, water quality is affected. Breaking sod, cutting forests, building cities, mining, and other land uses make an impact upon water quality. Everyone bears responsibility for the health of a watershed and the water systems (rivers, lakes, wetlands, etc.) within a drainage basin. Individual actions, both negative and positive, add up. Understanding a river or lake’s water quality and quantity involves investigating the condition of the contributing watershed. If the watershed is polluted, the river will likely be polluted. Watershed investigations are conducted for many reasons. Some investigations monitor changes in river and stream flows over time, to protect fisheries, to regulate floods, or to meet seasonal demands. Other studies determine the best method of protecting a river or lake from pollutants. One aim of a researcher might be to determine which areas of a watershed contribute the highest percentage of contaminants. This information is vital to policymakers and water managers when determining how to spend money for improvements. For example, most lake improvement projects address problems in the watershed as well as those of the lake. It would prove fruitless to spend thousands (or even millions) of dollars to clean up a lake, if problems in the watershed will only pollute the lake again. When watershed managers investigate land use practices that might affect the quality of water, they are concerned with two general sources of pollutants: point and nonpoint. Point source pollution involves pollutants that are discharged from, and can be traced back to, an identifiable point or source, such as a factory’s discharge pipe or a sewage ditch. Nonpoint source (NPS) pollution occurs when the source of a contaminant is unidentifiable; that is, the pollutant can come from one of many places. Examples of nonpoint source pollution include runoff from agricultural fields containing fertilizers and pesticides, motor oil filtering from urban areas, and sediments from eroded stream banks. Surface runoff and ground water can transport both point and nonpoint source pollutants. Since point source pollutants are identifiable, they are easier to monitor. The protection of surface and ground water resources from NPS pollution presents an enormous challenge because of the widespread and diverse nature of the problem. Land and water managers rely on methods called Best Management Practices, or BMPs, to describe land use measures designed to reduce or eliminate NPS pollution problems. ACTIVITY: DIRECTIONS: PARTICIPANTS WILL PRETEND THEY HAVE JUST INHERITED A PIECE OF RIVERFRONT PROPERTY AND A MILLION DOLLARS. HAND OUT THE PIECES OF PAPER WITH A SECTION OF RIVER DRAWN ON EACH. THE BLUE LINE IS WATER AND THE BLANK IS THE LAND EACH PARTICIPANT OWNS. AS THE OWNER OF THE LAND, EACH PARTICIPANT CAN DEVELOP THE LAND HOWEVER HE/SHE. GIVE THEM TIME TO DRAW. WHEN EVERYONE IS FINISHED, LINE UP THE PIECES PF THE RIVER (OR A PORTION IF IT IS A LARGE GROUP). PRETEND THAT THEY ARE ALL ALONG THE SAME RIVER. START WITH POSTER #1 (THE FARTHEST UPSTREAM PARCEL). ASK THE PARTICIPANT TO TELL EVERYONE ABOUT THE PARCEL THAT HE/SHE JUST DEVELOPED. ASK “LEADING QUESTIONS” ABOUT THE PARCEL SINCE EVERYONE DRAWS SOMETHING DIFFERENT (SEE BELOW). TRY TO Page 27 of 31 KEEP TRACK OF SOME OF THE THINGS ENDING UP IN THE RIVER BY WRITING THEM DOWN ON THE LAST PAGE-THE LAKE/POND. AS EACH PARTICIPANT TALKS ABOUT THE POLLUTION HE/SHE IS ADDING TO THE RIVER, HAVE HIM/HER PLACE AN ITEM (E.G. A PENCIL) ON THE PARCEL. Leading Questions based on what was built on property: A house? What did you do with your toilet water? If you have a septic tank, do you check it regularly for leaks? Do you have a dog? Where does it poop? A farm? Do you have animals? Do you let them walk in the stream? If you do, then they probably poop in the stream. Do you want to drink that? Are you growing things? Using fertilizers/pesticides? A factory? Where does the waste from the factory go? Do you treat any waste from the factory before it goes into the river? Do you have a parking lot? Are there any oil spots on the parking lot? They can run-off when it rains. An amusement park? Do you have a parking lot? Are there any oil spots on the parking lot? They can run-off when it rains. What do you do with food waste/containers? What about garbage/litter from the park making its way to the river? No development/Natural? Your land is absorbing pollutants and filtering them Is there anything flowing past your land in the river that you didn’t put there? Where is it coming from? Do you like that? DIRECTIONS: TO SUMMARIZE, MOVE THE ITMES DOWN THE RIVER FROM THE FIRST POSTER TO THE LAKE OR POND. SHOW THE PARTICIPANTS THE LAKE/POND PAGE. PARTICIPANTS ARE ABLE TO VISUALIZE THE ACCUMULATION OF THE POLLUTANTS THAT CAME DOWN THE RIVER AND ENDED UP IN THE LAKE. Question/Answer Script: Question: Can we name major rivers in the United States, local steams in Albany County, or in your town? Answer: Mississippi, Hudson; Normans Kill, Krum Kill, Salt Kill, Patroon Creek, and Kromma Kill etc. Question: Do you think that some of these rivers run through many cities? The countryside? Many neighborhoods? Answer: Yes. Question: Is that land used around these rivers used in different ways? How? Answer: Yes; agricultural, residential, and industrial uses. Question: Do you think that how the land is used can affect the river? Answer: Yes, sediment, fertilizer, chemical, waste runoff into the river and pollute it. Question: What do you think people living downstream would think about the water they get from their upstream neighbors if the land was being used to do all of these things? Answer: They probably wouldn’t like it because it would be full of pollutants. Question: What kind pollutants, point source or nonpoint source, are people who own land more responsible for? Answer: Nonpoint source pollution; this kind of pollution is caused by the things we do in our own backyards including fertilize, wash cars, mow our lawns, etc. Question: Did anyone do anything to their land that polluted or added materials to the waterway? Answer: Yes, sediment, pet waste, fertilizer, chemicals, etc. Question: How did the land owners towards the middle and end of the river or stream feel? Page 28 of 31 Answer: Disgusted; all the pollutants are in the river or stream right next to my house and I didn’t even do it. Question: Can a land owner downstream be affected by the actions of someone upstream? Answer: Yes, all the upstream pollutants flow down the river; downstream plots will have the poorest water quality because that is where all of the pollution ends up. Question: What about the property use plans? Could they be better? Answer: Generally, anything done to a plot of land is going to cause some sort of water pollution. However, land owners can use some BMPs to care for the waterbodies near their land Question: What kind of BMPs could be used to alleviate the water pollution downstream? (SEE BELOW) Answer: BMPs include-erosion control; pick up pet waste; make sure septic system is not leaking; do not overuse fertilizers and pesticides; fix oil leaks; etc Page 29 of 31 This page is intentionally left blank. Page 30 of 31 V. Discover the Hudson River The Hudson River is a highly valuable biological, economic and scenic resource for New York State. It provides habitat for numerous species of birds, fish and other wildlife, recreational opportunities such as boating and fishing, is important for shipping and it is right in our own back yard. In Albany County most of the water from streams as well as from stormwater runoff, drains into the Hudson River. Reasons like these demonstrate the importance of protecting this resource. One way to accomplish this is through education. Below we have provided links to innovative educational material regarding the Hudson River provided by the New York State DEC, Project WET and the Hudson River Estuary Program. We hope that you and your students will find these materials enjoyable as well as informative. a) About the Booklet – This is an Project WET educational activity booklet about the Hudson River and the following is a link to the New York State DEC website which offers general information about the booklet as well as how to obtain a copy of it. • http://www.dec.ny.gov/environmentdec/62720.html b) About the Lesson Plans – The following is a link to a section of the New York State DEC website that contains lesson plans about the Hudson River in various subject areas. • http://www.dec.ny.gov/education/25386.html Page 31 of 31