1
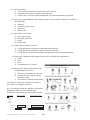
Exploring Streams: Stream Monitoring Curriculum Guide
. SECTION 3: POST FIELD TRIP
(CALCULATION OF RESULTS AND DATA INTERPRETATION)
Section 3 of six curriculum sections
Contents
Activity 1:
Calculating
Transparency Statistics. . . . . . . . . . . . . . . . . . p. 3-3
Activity 2:
Calculating Water
Temperature Statistics. . . . . . . . . . . . . . . . . . . p. 3-3
Activity 3:
Calculating Dissolved
Oxygen in Percent
Saturation and Statistics. . . . . . . . . . . . . . . . p. 3-4
Developed by Kris Stepenuck, University of
Wisconsin-Extension and Wisconsin Dept.
of Natural Resources; and Katie Murphy,
Middle School Science Teacher
For more information about
volunteer stream monitoring
opportunities in Wisconsin, and for
printable pdfs of this curriculum visit:
watermonitoring.uwex.edu/wav
A publication of the University of WisconsinExtension, in cooperation with the Wisconsin
Department of Natural Resources ©2013 by the
Board of Regents of the University of Wisconsin
System. University of Wisconsin-Extension is an
EEO/Affirmative Action employer and provides
equal opportunities.
Learning for life
Activity 4:
Calculating Stream Flow
and Statistics. . . . . . . . . . . . . . . . . . . . . . p. 3-4 to 3-5
Activity 5:
Calculating Habitat
Statistics.. . . . . . . . . . . . . . . . . . . . . . . . . . . . . . . . . . . . . p. 3-5
Activity 6:
Calculating a Biotic Index
Score and Statistics. . . . . . . . . . . . . . . . . . . . . . . p. 3-6
Post-Field-Trip
Optional Activities.. . . . . . . . . . . . p. 3-7 to 3-32
Optional Activities From
Other Sources .. . . . . . . . . . . . . . . . . p. 3-33 to 3-34
HANDS-ON LEARNING ABOUT STREAMS WITHIN & OUTSIDE THE CLASSROOM – FOR MIDDLE & HIGH SCHOOL TEACHERS & STUDENTS
3-1
Exploring Streams
– Stream Monitoring Curriculum Guide
POST FIELD TRIP
Learning Objectives:
• Students will use the data they collected to complete any necessary calculations
to determine results of their monitoring, including completing the data tables
in the student booklet.
• Students will analyze the data and write conclusions for each test completed.
Standards:
Environmental Education A.8.4, A.8.5, A.12.4, B.8.5; Mathematics: Measurement D.8.4, D.12.3
Mathematics: Statistics and Probability E.8.2, E.8.4; Science Inquiry C.8.4, C.8.5, C.8.6, C.8.7,
C.12.3, C.12.4
Materials:
• Data collected on the field trip
• Student workbook (see Section 4)
• Calculators
• Pen or pencil
Time:
Two class periods
Background:
Students will calculate mean, median, mode and range to give them a more comprehensive
picture of the data they collected as a group during the field trip. If the class is reporting results
to the Water Action Volunteers’ online database (see page 3-26), please report the median score
for a site, as this will minimize reporting erroneous results due to poor student performance.
PROCEDURE:
1. Photocopy the summarized data from the station leader forms onto an overhead and project them for
students to copy. This will ensure that all students have all the raw data necessary to complete the
calculations.
2. Students should complete the calculations for each test as specified in post-field trip activities 1-7. (High
school students should also try to determine the degree of precision).
3. Students should also answer any post calculation questions and write a conclusion paragraph for each
test. It is suggested that in the conclusion paragraph they state whether or not their hypotheses were
correct and explain why or why not. They should state the final results of the test and what those results
tell us about the stream quality. They can also address any sources of error that may have influenced their
results. This is also a good place to raise any further questions on each subject and suggest needed
improvements.
Exploring Streams
– Stream Monitoring Curriculum Guide
3-2
. POST FIELD TRIP
Activity 1: CALCULATING TRANSPARENCY STATISTICS
PROCEDURE:
1. Record all groups and their average transparency measurements (cm) in your Student Workbook (Table A).
2. For each average transparency measurement (cm), use the turbidity value conversion chart (page 4-4) to
determine the turbidity value in Nephelometric Turbidity Units (NTU). Record the turbidity values in your
student workbook (Table A).
3. Then rewrite both lists in order from lowest to highest (Table B). Using a spreadsheet such as Excel may be
helpful.
4. Determine the average, median and mode (optional) for transparency (cm) and turbidity (NTU), and
record those in your student workbook (Table C). Use 9 to represent <10 NTU.
5. Determine the ranges of your transparency (cm) and turbidity measurements (NTU) by noting the lowest
and the highest measurements recorded during the field trip. Indicate these ranges in your student
workbook (Table C).
6. Answer the questions below Workbook Table C and write a conclusion paragraph or two about this
parameter. You should state whether or not your hypotheses were correct and why or why not.
You should also state the final results of the test (including average, median, range and mode) and
what those results tell us about the stream quality. Also address any sources of error that may have
influenced your results.
. POST FIELD TRIP
Activity 2: CALCULATING WATER TEMPERATURE STATISTICS
PROCEDURE:
1. Record all groups and their measured air and water temperatures (º C) in your student workbook (Table A).
2. Then rewrite the lists in order from lowest to highest (Table B). Using a spreadsheet such as Excel may be
helpful.
3. Determine the average, median and mode (optional) for water and air temperatures and record those in
your student workbook (Table C).
4. Determine the range of water and air temperatures by noting the lowest and the highest water and air
temperatures recorded during the field trip. Indicate these ranges in your student workbook (Table C).
5. Use the conversion chart on page 4-15 to convert the average, median, mode (if determined) and low and
high water and air temperatures to ° F. Record this information in your student workbook (Table C).
6. Write a conclusion paragraph or two about this parameter. You should state whether or not your
hypotheses were correct and why or why not. You should also state the final results of the test (including
average, median, range and mode) and what those results tell us about the stream quality. Also address
any sources of error that may have influenced your results.
3-3
Exploring Streams
– Stream Monitoring Curriculum Guide
. POST FIELD TRIP
Activity 3: CALCULATING DISSOLVED OXYGEN IN
PERCENT SATURATION AND STATISTICS
PROCEDURE:
1. Record all groups and their dissolved oxygen measurements (mg/L) and water temperature (º C)
measurements in your student workbook (Table A).
2. Determine dissolved oxygen percent saturation for each pair of dissolved oxygen and water temperature
measurements using the Level of Oxygen Saturation Chart and following directions in step 3.
3. Using a straight edge, find the water temperature and align that with the oxygen mg/L scale for the
oxygen measurement for that water temperature. The percentage of saturation is found on the line
inbetween the temperature and oxygen lines. For example, 5° C with 10 mg/L of oxygen aligns with 75%
saturation.
4. Record each dissolved oxygen percent saturation measurement in your student workbook (Table A).
5. Then rewrite the lists of dissolved oxygen in mg/L and percent saturation in order from lowest to highest
(Table B). Using a spreadsheet such as Excel may be helpful.
6. Determine the average, median and mode (optional) for dissolved oxygen in mg/L and in % saturation
and record these in your student workbook (Table C).
7. Determine the range of dissolved oxygen measurements in mg/L and in % saturation by noting the lowest
and the highest measurements recorded during the field trip. Indicate these ranges in your student
workbook (Table C).
8. Write a conclusion paragraph or two about this parameter. You should state whether or not your
hypotheses were correct and why or why not. You should also state the final results of the test (including
average, median, range and mode) and what those results tell us about the stream quality. Describe
results in terms of both mg/L and percent saturation. Also address any sources of error that may have
influenced your results.
. POST FIELD TRIP
Activity 4: CALCULATING STREAM FLOW AND STATISTICS
PROCEDURE:
1. Obtain your original stream flow data sheet from your teacher.
2. Transfer your data onto the data sheet below (see student workbook page 4-27).
3. Determine stream flow in cubic feet per second using the data you collected by following instructions in
the data sheet below, or steps 4 to 9 below.
4. If you measured depth in inches, use the conversion chart to determine each depth in tenths of feet, or
simply divide each depth by 12 to convert to tenths of feet.
5. Determine the average depth at your monitoring site and record this in the appropriate location on your
data sheet.
Exploring Streams
– Stream Monitoring Curriculum Guide
3-4
6. Next, multiply your average depth by the stream width. This is the cross-sectional area (ft 2) of the stream.
Record this in the appropriate box on your data sheet.
7. Determine the average float time (seconds) and record it on your data sheet.
8. Divide the length of your stream segment (i.e., 20 feet) by the average float time (seconds) to determine
the average surface velocity at the site. Record the average surface velocity (ft/sec) on your data sheet.
9. Determine the correction factor below that best describes the bottom of your stream and multiply it by
the average surface velocity measurement to account for the effects of friction with the stream bottom on
water velocity. Record your corrected average surface velocity on your data sheet.
a) Correction factor for rough, loose rocks, coarse gravel or weeds: 0.8
b) Correction factor for smooth mud, sand or bedrock: 0.9
10. Multiply the average cross-sectional area (ft.2) by the corrected average surface velocity (ft/sec) to
determine stream flow. Record stream flow (ft.3/sec or cfs) in the space provided on your data sheet.
11. Report this result to your teacher so other students in the class can obtain this information.
12. Once you have a complete list of stream flow measurements in cfs from everyone in your class, record
these measurements in your student workbook (Table A). Then rewrite them in order from lowest to
highest in Table B. Using a spreadsheet such as Excel may be helpful.
13. Determine the average, median and mode (optional) for stream flow for all samples collected and record
this in your student workbook.
14. Determine the range of stream flow measurements by noting the lowest and the highest measurements
recorded during the field trip and indicate this information in your student workbook.
15. Answer any remaining questions in your student workbook and then write a conclusion paragraph or two
about this parameter. You should state whether or not your hypotheses were correct and why or why not. You
should also state the final results of the test (including average, median, range and mode) and what those
results tell us about the stream quality. Also address any sources of error that may have influenced your results.
. POST FIELD TRIP
Activity 5: CALCULATING HABITAT ASSESSMENT STATISTICS
PROCEDURE:
1. Record all groups and their total habitat scores in your student workbook (Table A).
2. Then rewrite the list in order from lowest to highest (Table B). Using a spreadsheet such as Excel may be helpful.
3. Determine the average, median and mode (optional) for the habitat scores and record these in your
student workbook (Table C).
4. Determine the range of habitat scores by noting the lowest and the highest measurements recorded
during the field trip and indicate this in your student workbook (Table C).
5. Answer any remaining questions in your student workbook and then write a conclusion paragraph or two
about this parameter. You should state whether or not your hypotheses were correct and why or why not.
You should also state the final results of the test (including average, median, range and mode, and type of
bottom substrate (i.e., rocky or soft)) and what those results tell us about stream quality. Also address any
sources of error that may have influenced your results. Tip: You can use the individual questions’ scores on the
Station Leader data sheet to assist with your assessment of habitat at the site.
3-5
Exploring Streams
– Stream Monitoring Curriculum Guide
. POST FIELD TRIP
Activity 6: CALCULATING A BIOTIC INDEX SCORE AND STATISTICS
PROCEDURE:
1. Obtain your biotic index data sheet from your teacher.
2. Calculate your biotic index score for your site by following the directions below:
a.) Count the number of animals circled in each group and write these in the work area below.
b.) Multiply the entered number from each group by the group value.
c.) Do this for all groups.
d.) Total the number of animals circled for all groups.
e.) Total the calculated scores for all groups.
f.) Divide the total score by the total number of types of animals that were found.
g.) Record this number. This is your Biotic Index Score.
SHOW ALL MATH (Use space below to do your math computations)
Group Number
Number of Animals
Group Value
Group 1
_________________
x4
= ____________________________
Group 2
_________________
x3
= ____________________________
Group 3
_________________
x2
= ____________________________
Group 4
_________________
x1
= ____________________________
Total Number =
Total Score
Scoring
Total Score =
/
Total Number
(3.6+=Excellent, 2.6-3.5=Good, 2.1-2.5=Fair, 1.0-2.0=Poor)
=
Biotic Index Score
3. Report this result to your teacher so other students in the class can obtain this information.
4. Once you have a complete list of biotic index scores, record these measurements in your student
workbook (Table A)
5. Then rewrite the list in order from lowest to highest (Table B). Using a spreadsheet such as Excel may be
helpful.
6. Determine the average, median and mode (optional) for biotic index and record it in your student
workbook (Table C).
7. Determine the range of biotic index scores by noting the lowest and the highest measurements recorded
during the field trip and indicate this in your student workbook (Table C).
8. Answer any remaining questions in your student workbook and then write a conclusion paragraph or two
about this parameter. You should state whether or not your hypotheses were correct and why or why not.
You should also state the final results of the test (including average, median, range and mode) and what
those results tell us about the stream quality. Also address any sources of error that may have influenced
your results.
Exploring Streams
– Stream Monitoring Curriculum Guide
3-6
. POST FIELD TRIP OPTIONAL ACTIVITIES
E. COLI SAMPLE INCUBATION, COLONY COUNTING
AND CALCULATING E. COLI STATISTICS
CLASSROOM PROCEDURE FOR E. COLI BACTERIA MONITORING AFTER 24 HOUR INCUBATION OF
3M TM PETRIFILM TM PLATES:
These procedures are also described in the E. coli section of the student workbook.
1. After 24 hours, wearing nitrile or other lab gloves, remove the plates from the incubator and count blue
and blue-purple colonies that have associated gas bubbles and are within the circle. Holding the plates up
to light can help distinguish colonies with gas bubbles.
2. On your data sheet record the number of colonies you
counted.
3. Since you used just 1 mL of sample, multiply the number of
colonies counted by 100 to determine the number of colony
forming units per 100 mL of sample.
4. After you have counted colonies, place all of the Petrifilm
plates in a Ziploc bag that has had about two tablespoons of
bleach added to it. Seal the bag and throw it away in the
regular rubbish. The bleach will disinfect the plates.
STATISTICS CALCULATIONS PROCEDURE:
All 10 examples depict various bubble patterns
associated with gas-producing colonies. Each
numbered picture would be counted as one
colony. (From 3MTM PetrifilmTM interpretation
guide)
1. Record all groups and their E. coli scores in your student
workbook (Table A).
2. Then rewrite the list in order from lowest to highest (Table
B). Using a spreadsheet such as Excel may be helpful.
3. Determine the average, median, and mode (optional) for the E.
coli scores and record these in your student workbook (Table C).
4. Determine the range of E. coli scores by noting the lowest and
the highest measurements recorded during the field trip and
indicate this in your student workbook (Table C).
5. Answer any remaining questions in your student workbook and
write a conclusion paragraph or two about this parameter. You
should state whether or not your hypotheses were correct and
why or why not. You should also state the final results of the
test (including average, median, range and mode, and what
those results tell us about the stream quality). Also address any
sources of error that may have influenced your results.
3-7
Note:
Petrifilm E. coli plates with colonies
that are too numerous to count
(TNTC) have one or more of the
following characteristics: many small
colonies, many gas bubbles, and
deepening of the gel color. High
concentrations of E. coli will cause the
growth area to turn blue, while high
concentrations of coliforms (non-E.
coli) will cause the growth area to
turn dark red. When any of these
occur, you will not be able to count
the sample – and should write TNTC
on your data sheet.
Exploring Streams
– Stream Monitoring Curriculum Guide
. POST-FIELD-TRIP OPTIONAL ACTIVITIES
ASSESSMENT
Learning Objectives:
• Students will show their understanding of streams and stream water quality
Materials:
• Test (see page 3-9)
• Writing instrument
Time:
25 minutes
PROCEDURE:
1. Students complete the test questions to the best of their ability.
2. Teachers score the tests.
3. Teachers and students can compare the pre-test score to the post-test score to measure learning of the
individual student during this mini-unit.
Exploring Streams
– Stream Monitoring Curriculum Guide
3-8
Name: _____________________________________________
Date: ______________________________________________
Period: _____________________________________________
Stream Water Monitoring Test
Matching: Write the letter for the correct vocabulary word on the line next to the definition.
A. Turbidity
F. Riparian zone
B. Respiration
G. Photosynthesis
C. Macroinvertebrates
H. Riffle
D. Substrate
I. Impervious surface E. Watershed
J. Transparency
_____1. Cloudiness in the water caused by suspended particles
_____2. A measure of water clarity
_____3. The stream bottom surface on which plants and animals attach or live
_____4. Small animals without backbones that are visible to the human eye
_____5. An area of land that drains to a main body of water
_____6. Shallow area in stream where water flows swiftly over rocks
_____7. The cellular process in which plants and animals use oxygen and release carbon dioxide
_____8. The land between the water’s edge and the upper edge of the floodplain
_____9. The process in which green plants convert carbon dioxide and water, using the sun’s energy, into
simple sugars and oxygen
_____10. A surface that does not allow water to pass through it
Multiple Choice: Choose the best answer for each question and write the corresponding letter on the line.
_____11. Warm water holds _____________ dissolved oxygen than/as cold water.
A.Less
B.More
C. The same amount of
_____12. Streams with greater turbidity will likely
A. Be colder
B. Have less light penetration
C. Have more dissolved oxygen
_____13. Water clarity can be a useful indicator of
A. Industrial discharges
B. Runoff from construction sites or fields
C. Both A and B
3-9
Exploring Streams
– Stream Monitoring Curriculum Guide
_____14. The biotic index is
A. A list of macroinvertebrates found in the back of a book
B. A reference book often used when studying biology
C. A scale used to evaluate stream health based on its macroinvertebrate population
_____15. Food sources, spawning areas and migration paths of fish and other wildlife are all affected
and defined by:
A.Substrate
B. Stream flow and velocity
C. Riffle zone
D. Both B and C
_____16. Signs of fish stress include
A. Faster scale growth
B. Increased respiration
C.Death
D. Both B and C
_____17. Streams that are healthy will have
A. A large population of pollution-tolerant macroinvertebrates
B. A large population of pollution-sensitive macroinvertebrates
C. A wide variety of both pollution-tolerant and pollution-sensitive macroinvertebrates
______18. What types of habitats would support a more diverse fish and insect population?
A.Riffles
B.Pools
C.Runs
D. A combination of A, B and C
_____19. What can the shape and condition of the
streambank provide clues to
A. Land uses in the adjacent watershed
B. How much water to expect during
snowmelt season
C. The number of animals living nearby
Short Answer: Answer the following to the best of
your ability. Use complete sentences.
20. If you collected caddisflies, mayflies, riffle beetles,
amphipods, and both non-red midges and
bloodworms, what would your biotic index score be?
Group Number
total)
Number of Animals
Group 1
_________________
x4
= ____________________________
Group 2
_________________
x3
= ____________________________
Group 3
_________________
x2
= ____________________________
Group 4
_________________
x1
= ____________________________
Total Number =
Total Score
Scoring (add the 4 groups for
Total Score =
/
Total Number
=
(3.6+=Excellent, 2.6-3.5=Good, 2.1-2.5=Fair, 1.0-2.0 =Poor)
Exploring Streams
– Stream Monitoring Curriculum Guide
Biotic Index Score
3-10
21. List at least three factors that can influence stream flow and velocity. (Complete sentences are not
necessary on this question).
22. Explain why dissolved oxygen levels may be higher in the day than they are at night.
23. What are some advantages to using macroinvertebrates to identify water quality as compared to
studying other physical or chemical aspects of water quality?
24. What impact(s), if any, might a cheese factory have on a nearby stream?
25. What would you expect to find in a healthy riparian zone? What purpose does the riparian zone
serve for the health of the stream?
3-11
Exploring Streams
– Stream Monitoring Curriculum Guide
.
POST FIELD TRIP OPTIONAL ACTIVITIES – ASSESSEMENT
Name: _____________________________________________
Date: ______________________________________________
Period: _____________________________________________
Stream Water Monitoring Test (KEY)
Matching: Write the letter for the correct vocabulary word on the line next to the definition.
A. Turbidity
F. Riparian zone
B. Respiration
G. Photosynthesis
C. Macroinvertebrates
H. Riffle
D. Substrate
I. Impervious surface E. Watershed
J. Transparency
__A__1. Cloudiness in the water caused by suspended particles
__J__2. A measure of water clarity
__D__3. The stream bottom surface on which plants and animals attach or live
ntact
ase co
e
l
p
,
s
:
__C__4. Small animals without backbones that are visible todthe
human
nswer eye
u es a mation, see
l
c
n
i
t
r
a
o
h
f
t
n
i
)
s onlybody ofowater
ntact
__E__5. An area of land that drainsac
to armain
u/wav
te he nator. For c g.uwex.ed
r
o
f
(
di
orin
sion
Coorwater
onitswiftly
a verin
erm
__H__6. Shallow
stream
flows
over rocks
t
For area
a
e WAVwhere
w
th
/
/
http :
__B__7. The cellular process in which plants and animals use oxygen and release carbon dioxide
__F__8. The land between the water’s edge and the upper edge of the floodplain
__G__9. The process in which green plants convert carbon dioxide and water, using the sun’s energy, into
simple sugars and oxygen
__I__10. A surface that does not allow water to pass through it
Multiple Choice: Choose the best answer for each question and write the corresponding letter on the line.
__A__11. Warm water holds _____________ dissolved oxygen than/as cold water.
A.Less
B.More
C. The same amount of
__B__12. Streams with greater turbidity will likely
A. Be colder
B. Have less light penetration
C. Have more dissolved oxygen
__C__13. Water clarity can be a useful indicator of
A. Industrial discharges
B. Runoff from construction sites or fields
C. Both A and B
Exploring Streams
– Stream Monitoring Curriculum Guide
3-12
.
POST FIELD TRIP OPTIONAL ACTIVITIES – ASSESSEMENT
__C__14. The biotic index is
A. A list of macroinvertebrates found in the back of a book
B. A reference book often used when studying biology
C. A scale used to evaluate stream health based on its macroinvertebrate population
__B__15. Food sources, spawning areas and migration paths of fish and other wildlife are all affected
and defined by:
A.Substrate
B. Stream flow and velocity
C. Riffle zones
__D__16. Signs of fish stress include
A. Faster scale growth
B. Increased respiration
C.Death
D. Both B and C
A.Riffles
B.Pools
C.Runs
D. A combination of A, B and C
ac t
e cont
s
a
e
l
p
__C__17. Streams that are healthy will have
swers,
des an ation, see :
u
l
c
n
i
A. A large population of pollution
tolerant
inform
) that macroinvertebrates
s only or contact .edu/wav
r
e
h
c
a
B. A large population
macroinvertebrates
ex
r. F
osensitive
or teof pollution
ng.uw
rdinat tolerant
sion (fof both
itoriand
oo
n
C
o
C.Fo
Arwide
pollution
pollution
sensitive macroinvertebrates
V
a vervariety
m
A
r
the W ttp ://wate
h
__D___18. What types of habitats would support a more diverse fish and insect population?
__A__19. What can the shape and condition of the streambank provide clues to
A. Land uses in the adjacent watershed
B. How much water to expect during snowmelt season
C. The number of animals living nearby
Short Answer: Answer the following to the best of your ability.
Use complete sentences.
Biotic Index (size of illustrations not proportional)
Group 1: These are sensitive to pollutants. Circle each animal found.
20. If you collected caddisflies, mayflies, riffle beetles, amphipods,
and both non-red midges and bloodworms, what would your
biotic index score be?
Group 2: These are semi-sensitive to pollutants. Circle each animal found.
Caddisfly Larva*
Number of Animals
Group 1
________0_______
x4
= _____________0______________
Group 2
________3_______
x3
= _____________9______________
Group 3
________2_______
x2
= _____________4______________
Group 4
________1_______
x1
= _____________1______________
6
Total Score =
Total Number =
Total Score
14
/
Water
Penny
Dragonfly
Larva
*All Caddisfly Larvae = 1
Group Number
Water
Snipe Fly
Larva
Alderfly Larva
Dobsonfly
Larva
Stonefly
Larva
Crawfish
Scoring (add the 4 groups for total)
Total Number
14
6
(3.6+=Excellent, 2.6-3.5=Good, 2.1-2.5=Fair, 1.0-2.0=Poor)
Crane Fly
Larva
Freshwater Mussel
or Fingernail clam
Mayfly
Larva
Damselfly tail
(side view)
Riffle Beetle
Larva*
Riffle Beetle
Adult*
*All Riffle Beetles = 1
Damselfly Larva
Group 3: These are semi-tolerant of pollutants. Circle each animal found.
Black Fly
Larva
Non-Red
Midge
Larva
Snails: Orb or Gilled (right side opening)
Amphipod or Scud
*All Snails = 1
Group 4: These are tolerant of pollutants. Circle each animal found.
=
2.3
Index Score
Bloodworm
Midge Larva
Pouch Snail
(left side opening)
3-13
Isopod or
Aquatic Sowbug
Exploring Streams
(red)
Leech
Tubifex
Worm
– Stream Monitoring Curriculum Guide
.
POST FIELD TRIP OPTIONAL ACTIVITIES – ASSESSEMENT
21. List at least three factors that can influence stream flow and velocity. (Complete sentences are not
necessary on this question).
Teachers use your judgment. Student answers may include but are not limited to the following:
Rainfall, snowmelt, drought
Soil type, vegetation and slope in the watershed
Withdrawals for irrigation or domestic or industrial purposes
Dams
Development (increased impervious surface near stream)
22. Explain why dissolved oxygen levels may be higher in the day than they are at night.
During the day, plants photosynthesize and produce oxygen as a byproduct. At night plants and animals respire
and take in oxygen while they produce carbon dioxide.
ontact
ease c
l
p
,
s
r
e:
answe
ludes rmation, se
c
n
i
t
a
23. What are some advantages to using macroinvertebrates
to
identify
water
quality
as compared to
o
h
f
t
n
i
)
v
ac t
s only ofowater
eraspects
contquality?
du/wa
h
r
e
c
studying other physical or chemical
.
a
x
F
e
e
.
t
r
(for
g.uw
inato
ersion
nitorin
Coord
For a v the WAV ://watermo
ttp conditions might be like over a longer period of time. Other
Macroinvertebrates tell us what thehstream
measurements (e.g., temperature and dissolved oxygen) only tell us what the stream was like at the exact moment
that we collected the sample.
24. What impact(s), if any, might a cheese factory have on a nearby stream?
A cheese factory might release heated water that was used in the manufacturing process into the stream thereby
causing an increase in temperature to the stream water.
25. What would you expect to find in a healthy riparian zone? What purpose does the riparian zone
serve for the health of the stream?
A healthy riparian zone should contain a combination of trees, shrubs and/or long grasses. Having a variety of
types of plants present will help ensure that a wide diversity of animals will be able to utilize the area for habitat.
Plus, this vegetation will help to buffer any runoff before it enters the stream.
Exploring Streams
– Stream Monitoring Curriculum Guide
3-14
. POST-FIELD-TRIP OPTIONAL ACTIVITIES
COMPUTER GRAPHING AND PRESENTATIONS
Learning Objectives:
• Students will learn to use computer software to organize their data in an
appropriate type of graph or chart.
• Students will compare their results to previous data collected for that same
stream (if available).
• Students will look for trends and patterns existing in the data and explain
their observations to an audience.
Standards:
Environmental Education A.8.6, A.12.5; Information and Technology Literacy A.8.1, A.12.1,
B.8.1, B.8.2, B.8.3, B.8.4, B.8.5, B.8.6, B.8.7; Mathematics: Statistics and Probability E.8.1, E.8.2,
E.12.1; Science Inquiry C.8.8, C.8.9, C.8.10, C.8.11, C.12.5, C.12.6
Materials:
• Completed student workbook (Section 4)
• Computers with graphing software and Internet access (if data have been
entered to WAV database)
• Water Action Volunteers Volunteer Stream Monitoring DVD Set Disc #1 (optional)
• Field Manual for Water Quality Monitoring (optional)
• Computer (to access Internet) and/or library access
Time:
Two class periods on the computers, one class period to present with a group to an audience
3-15
Exploring Streams
– Stream Monitoring Curriculum Guide
.
POST FIELD TRIP OPTIONAL ACTIVITIES – COMPUTER GRAPHING AND PRESENTATION
PROCEDURE:
1. Have students produce appropriate graphs to represent the available data. If previous data are available, it
is suggested to create one graph for each of the tests with the parameter’s value plotted on the y-axis and
date on the x-axis. If multiple sites have been monitored, graphs might be made that demonstrate the
value of the parameter at the various locations. Note: If past years’ data have been entered to the WAV
database, the database can automatically develop graphs and table of data to compare a site over time or
to compare between sites. See the User’s Guide for Searching the Data in the WAV Database at:
http://www.uwex.edu/erc/wavdb/help/docs/SearchManual2009.pdf for explicit instructions. Graphs
produced by the database can be displayed in student presentations by having the students use the “print
screen” button and pasting the graphs into their presentation program. Student use of Excel or other
spreadsheet program will allow more manipulation of output graphs for use in presentations.
2. Have students research one or two parameters and develop a
presentation to share their findings and make suggestions
about why the results were as they were found to be. Questions
they might address include: What do the results suggest about
the quality of the water at the site? What land uses may have
affected the results? Has water quality changed over time?
What possible sources of error may have been introduced
during the monitoring? Note: Depending on age and ability of
the students, it may work best to have students present in small
groups and to have each group focus on presenting one aspect
of the data (e.g., one group presents information on
macroinvertebrates, one group on dissolved oxygen, etc.).
3. Have students present their findings to an audience and field
any questions. Optional: You may wish to ask students to
develop a poster to explain their results, which they will use to
support their presentation.
Exploring Streams
– Stream Monitoring Curriculum Guide
3-16
Note:
Resources students might use
to find out more about the
parameters include the
“Understanding Your Data”
video available on the Water
Action Volunteers DVD Set disc
#1 (from the main menu on
Disc 1, choose “Understanding
Your Data,” Run time: 5:19) and
the Field Manual for Water
Quality Monitoring as well as
countless other resources available
online and through the library.
. POST-FIELD-TRIP OPTIONAL ACTIVITIES
COMMUNITY OUTREACH: LETTER TO THE EDITOR
Learning Objectives:
• Students will write a letter to a community leader or newspaper explaining
results of their monitoring, how land use affects water quality, and possible
effects of the resulting water quality on humans.
Standards:
Environmental Education A.8.4, A.8.5, A.8.6, A.12.4, A.12.5, B.8.5., B.8.10, B.8.15, B.8.17, B.8.18,
B.8.21, B.12.3, D.8.1, D.8.5, D.12.5, E.12.3; Information and Technology Literacy B.8.1, B.8.2,
B.8.3, B.8.4, B.8.5, B.8.6, B.8.7; Science in Personal and Social Perspectives: H.8.2, H.8.3, H.12.1,
H.12.4, H.12.5, H.12.6, H.12.7
Materials:
• Completed Student Workbook (Section 4)
• Water Action Volunteers Volunteer Stream Monitoring DVD Set Disc #1
• Field Manual for Water Quality Monitoring or other resources for students to
learn more about the data they collected
• Computer with Internet access
• Local newspapers and news resources
Time:
One or two class periods and/or homework or extra credit assignment
PROCEDURE:
1. Have students review their conclusions in their student workbook.
2. Have students use additional resources such as Understanding Your Data video available on the Water Action Volunteers DVD Set disc #1 (from the main menu on Disc 1, choose “Understanding Your Data,”
Run time: 5:19), the Field Manual for Water Quality Monitoring, or other print or web resources to
research their findings in more depth.
3. In addition, have students review local news (either in print, online or on television) to assess
environmental issues in your area and make linkages between current issues and their findings.
4. Next, have students locate and review guidelines for sending a letter to the editor in your local newspaper.
3-17
Exploring Streams
– Stream Monitoring Curriculum Guide
.
POST FIELD TRIP OPTIONAL ACTIVITIES – COMMUNITY OUTREACH: LETTER TO THE EDITOR
5. Finally, have students write a letter to the editor of your local newspaper about one aspect of their results
they feel is particularly important in relation to local environmental issues in your area. Within the letter
have students advocate a solution or combination of solutions to a problem they identified through their
monitoring. The following tips, prepared by UW-Madison graduate student Elizabeth Goers, may be useful
to the students as they prepare their letters:
• Keep letters short. Ideally a letter to the editor is 100-200 words long, and does not exceed
250 words.
• Submit your letter in the format that is preferred by your local newspaper – whether that
• Use your real name. Most newspapers no longer accept anonymous submissions.
• Include contact information in case the editor has any questions.
• Try to make the letter relevant or timely to an issue at hand (e.g., start of monitoring
• Use spell check and have a friend or a family member proofread your letter.
• Do not generalize; rather use a specific instance and/or data to get your points across.
is using an email submission form, or sending a direct email to the editorial staff or a hard
copy via mail.
season, construction on a stream, pollution problem, focusing on positive activities to
protect a stream in your community, or an event such as Earth Day (April 22) Exploring Streams
– Stream Monitoring Curriculum Guide
3-18
. POST-FIELD-TRIP OPTIONAL ACTIVITIES
COMMUNITY OUTREACH: VIDEO/POWERPOINT
PRESENTATION OF PROJECT
Developed based on suggestions from Ann Kronke, Platteville School District
Learning Objectives:
• Students will share results of their monitoring efforts, including what
monitoring they conducted, their findings, and how those results relate to
land use and possible effects on human health.
• They will present possible solutions to problems they may have discovered.
Standards:
Agricultural Education B.8.3, E.8.2; Environmental Education A.8.4, A.8.5, A.8.6, A.12.4, A.12.5,
B.8.5, B.8.8, B.8.10, B.8.15, B.8.17, B.8.18, B.8.21; Information and Technology Literacy A.8.1, A.12.1;
Science in Personal and Social Perspectives: H.8.2, H.8.3, H.12.1, H.12.4, H.12.5, H.12.6, H.12.7
Materials:
• Video or digital camera (to take on field trip)
• Computer (to which video and photos can be downloaded, videos and photos
can be edited as needed, and video or PowerPoint presentation can be developed)
• LCD projector or TV
• Water Action Volunteers Volunteer Stream Monitoring DVD Set Disc #1 (optional)
• Field Manual for Water Quality Monitoring (optional)
Time:
Several class periods and/or as a homework assignment
PROCEDURE:
1. Have students take a camera and/or video camera on the field trip to record events from the day.
2. Have the students use these videos and photos to summarize the procedures they followed, and activities
that occurred.
3. Have students include data results in a PowerPoint/video presentation summarizing the day and their
findings. Note: Resources that students might use to find out more about the parameters include the
“Understanding Your Data” video available on the Water Action Volunteers DVD Set disc #1 (from the
main menu on Disc 1, choose “Understanding Your Data,” Run time: 5:19) and the Field Manual for Water
Quality Monitoring.
4. Have students share their presentations with local community groups.
3-19
Exploring Streams
– Stream Monitoring Curriculum Guide
. POST-FIELD-TRIP OPTIONAL ACTIVITIES
COMMUNITY ISSUE-BASED RESEARCH AND ROLE PLAY
Learning Objectives:
• Students will research a local water resources issue, assess current proposals
being discussed in the community, and weigh possible resulting outcomes
based on the various viewpoints.
• They will present a proposed solution to the situation at-hand.
• Students will role play the situation to experience difficulties in decisionmaking that result from competing interests (e.g., environmental, economic,
health and safety) in community development.
Standards:
Agricultural Education B.8.3, E.8.2; Environmental Education: C.8.3, C.12.1; Information and
Technology Literacy B.8.1, B.8.2, B.8.3, B.8.4, B.8.5, B.8.6, B.8.7; Life and Environmental Science
F.12.7, F.8.10 Science in Personal and Social Perspectives: H.8.2, H.8.3, H.12.1, H.12.2, H.12.3,
H.12.4, H.12.5, H.12.6, H.12.7
Materials:
• Local news sources
• Computer (to access web resources to learn about the situation) and/or access
to library
Time:
A homework assignment and one class period
PROCEDURE:
1. Assign students the task of researching a current local water resource issue. This can be an issue you allow
them to identify and choose on their own, or an issue you know is happening in the community.
2. Each student should identify the following in their research: the issue; the primary players involved in the
community discussion; the main viewpoints being presented; the potential health, environmental and
economic outcomes of each viewpoint.
3. Each student should prepare a 2-3 page paper to present this information, and conclude with a proposed
decision on the issue. They should state why they support the decision being proposed.
4. Following completion of their research and report, hold an in-class role playing period. If students chose
their own topic, a generic situation (see below) can be used during the role playing period. If you assign a
topic, identify players involved in the situation and have students play those specific roles.
a. Each 1-3 students will represent a specific player or group of players in the discussion.
b. Hand out role assignments randomly.
Exploring Streams
– Stream Monitoring Curriculum Guide
3-20
.
POST FIELD TRIP OPTIONAL ACTIVITIES – COMMUNITY ISSUE-BASED RESEARCH AND ROLE PLAY
c. Instruct students to take five minutes to review their assignment and prepare to play the role of
the person or group they have been assigned.
d. Begin the role playing session by explaining the setting (e.g., a town board meeting where a
crisis that has arisen based on a water resource issue that needs to be dealt with within a matter
of hours) and have students introduce themselves (in their roles) to the group. Explain that the
goal of the meeting is to make a decision about the issue at hand, and that each player should
express his/her opinion as the role they have been assigned.
e. For younger students, a facilitated discussion will likely work best. Each student or group of
students (depending on class size and time available) should be given the opportunity to
present their side. For older students, small group conversations can take place between the
various players, with interim pauses for a town crier (an assigned role) to present the current
state of discussions and opinions that have been shared among players.
f. Assist as needed to facilitate development of a plan of action which the group can come to
consensus upon to move forward to address the issue at hand (or a proposition that can be
voted upon by the group.)
g. After all sides have had the opportunity to share their opinions with the group, ask the students
to vote or decide upon a plan of action.
h. Following the decision, discuss the outcome of the vote with the students. How may the
decision affect health, economics and the environment? How did various students feel in their
roles? Did they feel their voice was heard during discussions? What challenges arose during the
discussion? Do they have suggestions for improving the outcome so that health, environmental
or economic issues could be better addressed?
Generic Scenario and Roles
Scenario: The Town of Pleasantville has a crystal clear babbling brook meandering through it
from northwest to southeast. Numerous Town parks provide access for villagers to swim in and
gain access to the brook for fishing, and kayaking, canoeing and tubing. The brook’s headwaters
begin towards the northwest edge of town with a cluster of springs. Most townsfolk have private
wells from which they obtain drinking water. A farm is being proposed that will operate in the
entire northwestern land area of the town. The farm will bring in at least 50 jobs to the
community that has been suffering economically since the grain mill shut down and the train
tracks that serviced the mill were removed from the area. Not only will be farm itself bring jobs,
but there is hope that the farm, a beef operation, will promote need for a meat packaging plant,
which would spark additional job opportunities, and bring families to the community. This
would help schools grow and bring job opportunities for teachers, as well as numerous jobs in
local restaurants and stores. Home builders are also hopeful the influx to the area will mean
more new homes will be built.
3-21
Exploring Streams
– Stream Monitoring Curriculum Guide
.
POST FIELD TRIP OPTIONAL ACTIVITIES – COMMUNITY ISSUE-BASED RESEARCH AND ROLE PLAY
Other local farmers are also supportive as they may be able to assist with producing grain the
new farm may need. Currently the town relies heavily upon money earned by those in the
tourism industry. The recreational opportunities the brook provides brings people from hundreds
of miles to fish, boat and swim in its waters. This supports a small but thriving bed and
breakfast industry and a few long-time restaurants. Tourism officials are worried that the farm,
slated to have at least 1,000 head of cattle, will produce so much manure that the brook will
become polluted with manure and the fish populations will be at risk. Plus, the crystal clear
nature of the stream will be put in jeopardy due to cattle entering it and causing erosion along
its banks. This may hurt the recreational industry. The farm plans to grow crops on hundreds of
acres to feed the cattle. Although nutrient management plans will be followed, there is concern
that nitrogen levels will greatly increase both in the brook as well as in groundwater in the
community. High levels of nitrogen are known to be dangerous to infants, so a group of young
mothers has begun campaigning against the farm in the name of their children’s safety. The
Town Board must decide upon whether to approve the farm or not. They must weigh
environmental, health and economic factors in their decision.
The Players:
• Town Board Chair and members
• Farmers (local and ones proposing the new farm)
• Home Builders Association
• Meat packaging Plant Operator (who has been out of work for 11 months)
• Restaurant Operators Association
• Realtors
• Farm Bureau representative
• Tourism Office Director
• News Reporter
• Fish Forever, a local nonprofit group that supports the fishing
opportunities and habitat protection efforts in the area
• Nutrient Management Specialist
• Friends of the Brook, a local nonprofit group that supports recreational
use of the brook
• Landowners along the brook who have private wells for drinking water
• Unemployed teacher
• Bed and Breakfast Association
Exploring Streams
– Stream Monitoring Curriculum Guide
3-22
. POST-FIELD-TRIP OPTIONAL ACTIVITIES
SCIENTIFIC REPORTS
Activity developed by Rebecca Bestul, Eau Claire Area School District
Learning Objectives:
• Students will prepare a laboratory report about their monitoring, including
what monitoring they conducted, their findings, and how those results relate
to land use and possible effects on human health.
• They will present possible solutions to problems they may have discovered.
Standards:
Agricultural Education B.8.3, E.8.2; Environmental Education A.8.4, A.8.5, A.12.4, B.8.5, B.8.10,
B.8.15, B.8.17, B.8.18, B.8.21, B,12.18, C.8.3, C.12.1, D.8.1; Information and Technology Literacy
B.8.1, B.8.2, B.8.3, B.8.4, B.8.5, B.8.6, B.8.7; Life and Environmental Science F.8.8, F.8.9, F.8.10;
Science in Personal and Social Perspectives: H.8.2, H.8.3, H.12.1, H.12.4, H.12.5, H.12.6, H.12.7
Materials:
• Completed Student Workbook (Section 4)
• Water Action Volunteers Volunteer Stream Monitoring DVD Set (optional)
• Field Manual for Water Quality Monitoring or other printed resources to aid
student learning
• Computer (to access web-based resources to aid student learning) and/or library
Time:
A homework assignment
PROCEDURE:
Tip:
1. Have students prepare lab reports following common protocol
that includes a title, background, introduction, site description,
methods, results, discussion, conclusion and references. In their
discussion, have students discuss possible solutions to problems
they may have discovered through their monitoring in their
discussion as well as possible sources of error in their data. The following page can be printed and distributed to students as
guidance for preparing their reports.
3-23
Resources students might use to find
out more about the parameters
include the “Understanding Your
Data” video available on the Water
Action Volunteers DVD Set disc #1
(from the main menu on Disc 1,
choose “Understanding Your Data,”
Run time: 5:19), or any of the
presentations from Disc 2 of that set.
Exploring Streams
– Stream Monitoring Curriculum Guide
DEVELOPING A SCIENTIFIC PAPER/LAB REPORT
All scientific studies are written up in essentially the same format. We will be writing our papers similar to
the way they need to be written for the Journal of Ecology (with a few minor differences).
Title Page
Write a brief title that describes the main point of the study. List all authors underneath the title.
Abstract
This is a summary of the entire report. It should be no longer than 250-300 words. Write this after you have
completed the report.
Background
Introduce the main topic of study starting with the broadest and most general ideas and descriptions. Give a general
overview of the area/organism/process being studied, as well as a description of the habitat/behaviors that are most
common.
Introduction
What was the purpose of your study? What were you looking for? What did you measure? Why is this study important? Why
would scientists find it interesting? What unresolved issues are addressed? What problem are you trying to find an answer to?
**Note: Many times, the background and introduction sections are combined, as is the case for the Journal of Ecology.
Site Description
This is an opportunity for you to share regional or geographic information about your site. Describe the location
where you collected your data. What stream was it? What larger watershed(s) is it a part of? What part of the state is
it in? This is the section where a map of the area should be included.
Methods
Describe the methods you used to collect the data and the equipment you used to do this. Describe the way you chose
to analyze the data you collected. If you collected more than one kind of data, break it up into sections.
Results
Provide a written description of the data results you obtained for each parameter monitored. This is the section in
which you should include tables, charts, diagrams of results, and/or graphs. All of these should be labeled and
described in the written description. In this section, you can describe what you found, but do NOT draw any conclusions
from the data. Note: If you broke the methods into sections, report the results using the same breakdown.
Discussion
What do your results mean (explain each finding)? What do they tell you about the area/organism/process being
studied? What do they suggest about the overall quality of the stream? This section is where you draw conclusions
about the data you collected. Start with the most important, general point from the results, then move on to more
specific points. Is there anything that was unexpected in your findings? Is there anything you cannot interpret or
explain? Are there shortcomings of your study? How do your results compare with others?
Conclusion
Summarize your field study. Who else might benefit from the information you found (who can use these data)? What
did you learn? If you had to do this again, what would you change? What recommendations would you make for
next year? Note: Many times the discussion and conclusion sections are combined.
References
Make note of any resources you used to help develop your report. These should be listed in alphabetical order using
the following formats for various types of resources:
•
Books: Last name, First initial of first author; Last name, first initial of next author; etc. (year).
Title. Page number(s). Publisher. City of publication.
•
Journal Articles: Last name, First initial of first author; Last name, first initial of next author; etc.
(year). Article title. Journal title. Volume: pages.
•
Websites: Name of publisher, if listed. Title of website. (year). Web address
Exploring Streams
– Stream Monitoring Curriculum Guide
3-24
. POST-FIELD-TRIP OPTIONAL ACTIVITIES
DATA ENTRY TO THE WATER ACTION VOLUNTEERS
ONLINE DATABASE
Learning Objective:
Note to teachers:
• Students will learn to use an online database to
enter their results.
This only needs to be done once per
field trip.
Standard:
Information and Technology Literacy B.8.5
Materials:
• Calculated medians from compiled classroom set of data
• Computer with Internet access
• Volunteer Monitors’ User Manual for the Water Action Volunteers Online
Database (accessible for download at: http://www.uwex.edu/erc/wavdb/help/)
Time:
10 minutes
PROCEDURE:
1. Go to http://www.uwex.edu/erc/wavdb
2. Follow directions in the Volunteer Monitors’ User Manual to register the site (if not previously registered).
Note: It may take several days for the registration process to be complete, as action is necessary on the
part of the Water Action Volunteers Database Administrator.
3. Once the site is registered, follow directions in the Volunteer Monitors’ User Manual to enter median data
results for the field trip to the online database.
3-25
Exploring Streams
– Stream Monitoring Curriculum Guide
. POST-FIELD-TRIP OPTIONAL ACTIVITIES
THANK YOU NOTES
Learning Objectives:
• Students will recollect one aspect of the field trip in which they learned about
stream ecology and/or one reason (related to stream monitoring) for which
the station leader will remember them.
• Students will recognize the importance of saying thank you.
Materials:
• Blank paper
• Markers, colored pencils, or crayons
Time:
20 minutes
PROCEDURE:
1. Ask students to address thank you notes to station leaders from their field trip and to draw something
they learned about and liked from the event.
2. Collect thank you notes and send to field trip assistants.
Exploring Streams
– Stream Monitoring Curriculum Guide
3-26
. POST-FIELD-TRIP OPTIONAL ACTIVITIES
STORM DRAIN STENCILING
Educate your community about stormwater pollution by stenciling the message: “Dump no Waste –
Drains to Stream” (or River or Lake) next to storm drains. You may choose to distribute or create fliers that
educate the community about stormwater pollution.
Learning Objectives:
• Students will learn about the sources of stormwater pollution.
• Students will understand why stormwater pollution is a threat to the
environment.
• Students will stencil messages next to storm drains to encourage others to be
more aware of stormwater pollution.
Standards:
Agricultural Education A.6-8.3, A.9-12.3; Environmental Education D.8.5, E.12.3
Materials: For each group of 4 to 6:
• 1 or 2 stencils
• Door hanger cards/fliers
• A map of the stenciling area
• Parent/guardian permission slips
• A letter of authorization from the Department of Public Works for stenciling
• 2 cans of spray paint – preferably inverted-tip
white traffic zone latex paint.
Note:
• A wire brush to clean the gutter before painting
One can of latex paint is enough to
paint approximately 10 drains.
• Whisk broom and dust pan
• 1 or 2 pairs of work gloves
• 1 or 2 bright orange safety vests, or have students wear brightly colored clothing
• 2 garbage bags – 1 for wet stencils and 1 for garbage such as tape used on the
stencils and debris cleaned out of the gutter
• Paper towels or rags*
• Traffic cones or flags for use on busy streets*
• Duct tape and scissors*
• Cardboard box the size of stencil*
*optional
3-27
Exploring Streams
– Stream Monitoring Curriculum Guide
.
POST FIELD TRIP OPTIONAL ACTIVITIES – STORM DRAIN STENCILING
Time:
It will take approximately one hour for a team of four to six people to stencil 15 storm drains.
Background:
Why should people be concerned about what enters a storm drain?
Because anything that is flushed down a storm drain is not “treated” before it reaches a stream
or river. This means that oil, antifreeze, paint, grass clippings, household waste, pet wastes or
any other waste on streets and sidewalks goes directly into a nearby stream, river or lake.
The next time you wash your car on your driveway, consider where the water goes. The soapy,
dirty water runs down the street into the storm sewer. This sewer carries the wash water to a
waterbody. In the water, the soap acts like a fertilizer for aquatic plants and causes too much
plant growth, which creates problems for fish.
You can help increase awareness of the storm drain connection. Educate your community about
stormwater pollution by stenciling the street next to storm drains and distributing door hanger cards.
PROCEDURE:
Before You Stencil
1. Get permission to stencil storm drains from the Department of Public Works in your city, village or town.
Be sure to ask for a letter of authorization to provide proof if you are questioned by a road crew or police
officer.
To stencil on private property, contact the landowner, whether the property is a home, business or
apartment complex.
2. Weather conditions are important for the success of this project. You should choose a day when the
pavement is dry and warm. Windy days are not good because the spray paint can drift onto nearby
automobiles and debris can be blown onto the painted surface.
3. Using a neighborhood map, carefully consider the area your group will stencil. Divide the area into routes
and assign a team to each route.
4. A day or two before you plan to paint, distribute door hanger cards or fliers explaining the stenciling
program. If you can’t distribute the information ahead of time, have one or two team members distribute
the cards and fliers while others paint.
Examples of a door hanger card and a flier are posted on the Water Action Volunteers website. If your
group is participating in a large storm drain stenciling project, you may want to make your own door
hangers, fliers or posters, using the opportunity to conduct an all-out education campaign.
How to Stencil
1. Scrub the street area surrounding the storm drain with the wire brush, and use the whisk broom to sweep dirt
into the dust pan. Use your garbage bags to take debris away. Do not sweep dirt and debris into the drain.
Exploring Streams
– Stream Monitoring Curriculum Guide
3-28
.
POST FIELD TRIP OPTIONAL ACTIVITIES – STORM DRAIN STENCILING
2. Position the stencil in the gutter next to the storm drain inlet where the message will be most visible. Tape
or hold the stencil in place. You might place a cardboard box with its bottom removed over the stencil to
create a “wall” to contain drifting paint.
3. Spray paint the stencil message, making sure paint doesn’t get into the storm drain. Two light coats of
paint will work better than one heavy coat. Allow the first coat of paint to dry before applying the second
coat. The stenciled messages last for approximately two years on a paved surface.
4. When you’re done with the project, have one team member check that all storm drains in your area have
been stenciled. It’s easy to miss one.
5. Place the used stencils in a plastic bag for transportation. When storing used stencils, allow the paint to
dry before stacking the stencils. A stencil’s lifespan is determined by use. Discard the stencil when the
message is blurred by excess paint build-up (typically about ten separate events, depending on the
material used to make the stencil).
3-29
Exploring Streams
– Stream Monitoring Curriculum Guide
. POST-FIELD-TRIP OPTIONAL ACTIVITIES
RIVER CLEANUP
Help the environment by removing garbage from a stream or river.
Learning Objectives:
• Students will improve the water quality of a stream or river.
• Students will work with others to clean up a section of a stream or river.
• Students will record the amount of garbage removed from the waterway.
• Students will work cooperatively with city-works departments to coordinate
garbage pickup.
Standards:
Agricultural Education A.6-8.3, A.9-12.3; Environmental Education D.8.5, E.12.3
Materials:
• Stream Walk Worksheet
• Topographic map of the area
• Parent/guardian permission slip
• First aid kit
• Orange cones at any trash collection site along a road
• Life jackets for very young volunteers (optional)
• Camera
• Work gloves
• Trash bags
• Rakes, shovels, and/or pitchforks
• Waders, high rubber boots, old shoes or other
sturdy footwear
• Insect/tick repellent
• Refreshments
Note:
Ask local grocery stores, soft drink
distributors or restaurants to donate
snacks, lunches or a picnic after the
job is done. Local hardware stores,
discount stores or other businesses
may be willing to donate items such
as gloves and trash bags.
Time:
Planning may take several weeks; the actual cleanup will take one afternoon.
Exploring Streams
– Stream Monitoring Curriculum Guide
3-30
.
POST FIELD TRIP OPTIONAL ACTIVITIES – RIVER CLEANUP
Background
When you survey your stream or river site before the actual cleanup, you may notice two kinds
of debris: human-made and natural. Both kinds of debris can have negative impacts on a
stream or river. Human waste such as litter can be especially harmful to aquatic animals that
may view this waste as food or a suitable place to live. Natural debris such as logs, leaves and
soil can be good for wildlife, but too much of a good thing can restrict water flow. Normally,
natural debris such as trees or branches are not removed during stream cleanups. This debris
may provide fish habitat, so you should consult your local Department of Natural Resources
fish manager before removing it.
During a cleanup, it’s important to record the amount of garbage collected. You can use
this information to educate people in your community about the amount of garbage found
in local streams. Many communities have stream and river cleanup campaigns each spring.
You might consider having your class join an established cleanup effort or you may opt to
organize a new effort.
PROCEDURE:
Planning a Clean Up
1. Pick a cleanup date.
2. Choose a stream or river. The site you choose for your cleanup should reflect the size and abilities of your
group. Small groups may want to focus on a stretch of stream in a park or neighborhood. A large group
may want to develop a major cleanup effort. Contact your local parks department or area DNR office for
information about existing stream and river cleanup projects in the area. Organizers of large-scale efforts
need to plan at least six months in advance for fundraising, permits, safety concerns and solicitation of
volunteers. Union approval from city workers may even be necessary.
3. Before you begin to clean up, get permission from landowners who live along the streambank.
4. Use the worksheet in the Stream Walk Survey activity to collect information about the stream or river
you’ve chosen. The survey will help to identify any areas that need cleanup. It will also help you identify
any areas along the stream or river that are not safe for volunteers. Area topographic maps that include
the stream or river can be found online.
5. If you have a large group, organize into several teams with team or area leaders (one for every
6-8 volunteers). Each team leader should know what section of the stream to clean and where the
waste pickup sites are, and keep track of how much waste is collected.
3-31
Exploring Streams
– Stream Monitoring Curriculum Guide
.
POST FIELD TRIP OPTIONAL ACTIVITIES – RIVER CLEANUP
6. Because students will be working near water and may be carrying items, safety is an important
consideration. Advise your students to wear heavy gloves, thick pants, sturdy shoes and safety goggles
(when appropriate). Only adults should pick up hazardous items such as broken glass and syringes.
First aid kits should be available at the cleanup site and someone there should know how to administer
first aid. If needed, contact the highway department to provide warning cones, signs or flags for sites
where volunteers will be leaving garbage for pickup.
7. Parents or guardians may need to give written permission for your students to participate in a cleanup
effort. A permission slip should include an emergency phone contact and permission to seek medical
assistance. Contact you school’s insurance agent for information on liability insurance.
8. Contact the city public works department to arrange for garbage removal or to find out where the
garbage can be taken. Local government agency contacts or developers may be willing to help with
removal. Locate nearby recycling centers for the recyclable products.
9. Notify local newspapers, radio and television stations about your project. Point out your project’s
contribution to improving water quality and to enhancing community pride.
On the Cleanup Day
1. Group leaders should keep track of how much garbage has been collected by either measuring the
number of bags collected or the weight of the garbage.
2. Be sure to take photos of your students in action! You can use “before” and “after” photographs to show
people what your group has accomplished.
3. Arrange for volunteers to help with returning borrowed materials and disposing of garbage or recyclables.
4. Celebrate! Reward yourself, your students and your volunteers with a picnic or party.
After the Cleanup
1. Thank everyone who participated, including property owners, merchants, local government staff,
elected officials and other people who contributed to the success of your project.
2. Tell your community how much garbage was collected from local streams and rivers. Encourage them to
“Make WAVes” through pollution prevention.
3. Enjoy the results! Thanks to your efforts, another Wisconsin waterway will be more enjoyable to view,
safer to swim in, and will provide more suitable habitat for wildlife.
Exploring Streams
– Stream Monitoring Curriculum Guide
3-32
OPTIONAL ACTIVITIES FROM OTHER SOURCES
Suggested Optional Activities from Project Wild Aquatic
Overall Experience
.
Aquatic Times – “Students will investigate, write and produce a newspaper
that features aquatic information and issues.”
.
To Dam or Not to Dam – “Students will role play individuals representing
differing perspectives and concerns related to a complex issue.”
.
Alice in Waterland – “Students will use a simulated field trip, lecture-discussion
and student-gathered data to explore water use and its effects on wildlife habitat.”
.
Where Have All The Salmon Gone? – “Students will graph and interpret
actual fish population data in relation to historical events.”
Other
Community Connections
.
Watered Down History – “Students will investigate the history of a chosen
waterway through standard reference sources as well as taped personal
interview and public records, where available, and then display their findings
on a mural.”
.
Living Research: Aquatic Heroes and Heroines – “Students will identify people
through news media, current events or other means who have made
contributions to conserving or preserving aquatic environments; research
their contributions, including by interviewing them; and write a biography.”
.
Wild Bill’s Fate (listed in “Aquatic Extensions to Project WILD Activities” found
in the indices in the back of the Project WILD Aquatic guide) – “Students will
investigate pending legislation affecting wildlife.”
.
Wildlife issues: Community Attitude Survey (listed in “Aquatic Extensions to
Project WILD Activities” found in the indices in the back of the Project WILD
Aquatic guide) – “Students will develop a questionnaire and conduct a
community survey.”
Habitat
.
Riparian Retreat – “Students will build awareness of a riparian zone through
the use of a simulated field trip and art work.”
.
Wetland Metaphors – “Students are presented with a selection of hands-on
objects for investigation as metaphors for natural functions of wetlands.”
.
Blue Ribbon Niche – “Students will create a variety of representations of
animals that live in riparian habitats.”
3-33
Exploring Streams
– Stream Monitoring Curriculum Guide
.
POST FIELD TRIP OPTIONAL ACTIVITIES
Suggested Optional Activities from Project WET
Overall Experience
.
wAteR in moTion – Students will create artwork that simulates the movement
and sounds of water in nature.
.
Water: Read All About It – Students will develop a Special Edition on water.
.
Water Write – Students will explore feelings about and perceptions of water
topics through writing exercises.
.
Who’s Problem Is It? – Students will analyze the scope and duration of water
issues to determine personal and global significance.
.
Humpty Dumpty – Students will simulate a restoration project by putting
pieces of an ecosystem back together.
Suggested Optional Activities from Hook, Line & Thinker
.
Taking Stock – Students will study and take part in a model of the factors
affecting fishery populations in Lake Michigan. Through a game, they will
investigate how decisions by commercial fishermen, recreational anglers,
fisheries biologists and lawmakers influence and are influenced by economics
and by the abundance and scarcity of fish.
.
Making Decisions – Students will brainstorm ideas about “Hot Topics” in
natural resources and work together to craft a resolution on a natural
resources policy they would like to see changed. Students will present their
resolutions to each other, and, if the class finds a resolution compelling,
introduce that resolution at a hearing.
.
Great Conservationists – Students will write a reflective one-page paper on a
quote by a conservation leader – samples are provided to help get them started.
Suggested Optional Activities from Give Water A Hand Action Guide
.
Ask an Expert – Students will learn about water experts in their community
and share their findings with these people.
.
Choose a Service Project – Students will learn to match their skills with their
ideas in order to implement a water service project
.
Plan for Action – Students will outline steps of what and when they will
complete activities to carry out their chosen service project.
.
Keep on Track – Students will learn how to be sure their work is most effective
and how to measure their successes.
.
Celebrate Success – Students will evaluate their service project and celebrate
their successes.
Exploring Streams
– Stream Monitoring Curriculum Guide
3-34