1
FUJITSU SEMICONDUCTOR
SOFTWARE SUPPORT MANUAL
CM41-00313-7E
F2MC-16 FAMILY
SOFTUNETM Workbench
USER'S MANUAL
F2MC-16 FAMILY
SOFTUNETM Workbench
USER'S MANUAL
FUJITSU SEMICONDUCTOR LIMITED
PREFACE
■ What is the SOFTUNE Workbench?
SOFTUNE Workbench is support software for developing programs for the F2MC-16 family of
microprocessors / microcontrollers.
It is a combination of a development manager, simulator debugger, emulator debugger, monitor debugger,
and an integrated development environment for efficient development.
■ Purpose of this manual and target readers
This manual explains functions of SOFTUNE Workbench.
This manual is intended for engineers designing several kinds of products using SOFTUNE Workbench.
Other company names and products names are trademarks or registered trademarks of their respective
companies.
■ Trademarks
REALOS, SOFTUNE are trademark of Fujitsu Semiconductor Limited, Japan.
Note: F2MC is the abbreviation of FUJITSU Flexible Microcontroller.
Microsoft, Windows and Windows Media are either registered trademarks of Microsoft Corporation in the
United States and/or other countries.
The company names and brand names herein are the trademarks or registered trademarks of their respective
owners.
■ Organization of This Manual
This manual consists of the following 2 chapters.
CHAPTER 1 BASIC FUNCTIONS
This chapter describes the basic functions on the SOFTUNE Workbench.
CHAPTER 2 DEPENDENCE FUNCTIONS
This chapter describes the functions dependent on each Debugger.
i
•
•
•
•
•
•
•
The contents of this document are subject to change without notice.
Customers are advised to consult with sales representatives before ordering.
The information, such as descriptions of function and application circuit examples, in this document are presented solely for the
purpose of reference to show examples of operations and uses of FUJITSU SEMICONDUCTOR device; FUJITSU
SEMICONDUCTOR does not warrant proper operation of the device with respect to use based on such information. When you
develop equipment incorporating the device based on such information, you must assume any responsibility arising out of such
use of the information. FUJITSU SEMICONDUCTOR assumes no liability for any damages whatsoever arising out of the use
of the information.
Any information in this document, including descriptions of function and schematic diagrams, shall not be construed as license
of the use or exercise of any intellectual property right, such as patent right or copyright, or any other right of FUJITSU
SEMICONDUCTOR or any third party or does FUJITSU SEMICONDUCTOR warrant non-infringement of any third-party's
intellectual property right or other right by using such information. FUJITSU SEMICONDUCTOR assumes no liability for any
infringement of the intellectual property rights or other rights of third parties which would result from the use of information
contained herein.
The products described in this document are designed, developed and manufactured as contemplated for general use, including
without limitation, ordinary industrial use, general office use, personal use, and household use, but are not designed, developed
and manufactured as contemplated (1) for use accompanying fatal risks or dangers that, unless extremely high safety is secured,
could have a serious effect to the public, and could lead directly to death, personal injury, severe physical damage or other loss
(i.e., nuclear reaction control in nuclear facility, aircraft flight control, air traffic control, mass transport control, medical life
support system, missile launch control in weapon system), or (2) for use requiring extremely high reliability (i.e., submersible
repeater and artificial satellite).
Please note that FUJITSU SEMICONDUCTOR will not be liable against you and/or any third party for any claims or damages
arising in connection with above-mentioned uses of the products.
Any semiconductor devices have an inherent chance of failure. You must protect against injury, damage or loss from such
failures by incorporating safety design measures into your facility and equipment such as redundancy, fire protection, and
prevention of over-current levels and other abnormal operating conditions.
Exportation/release of any products described in this document may require necessary procedures in accordance with the
regulations of the Foreign Exchange and Foreign Trade Control Law of Japan and/or US export control laws.
The company names and brand names herein are the trademarks or registered trademarks of their respective owners.
Copyrights © 2004-2012 FUJITSU SEMICONDUCTOR LIMITED All rights reserved.
ii
READING THIS MANUAL
■ Configuration of Page
In each section of this manual, the summary about the section is described certainly, so you can grasp an
outline of this manual if only you read these summaries.
And the title of upper section is described in lower section, so you can grasp the position where you are
reading now.
iii
iv
CONTENTS
CHAPTER 1
BASIC FUNCTIONS ..................................................................................... 1
1.1
Workspace Management Function ..................................................................................................... 2
1.2
Project Management Function ............................................................................................................ 3
1.3
Project Dependence ........................................................................................................................... 5
1.4
Make/Build Function ........................................................................................................................... 6
1.4.1
Customize Build Function .............................................................................................................. 7
1.5
Include Dependencies Analysis Function ........................................................................................... 9
1.6
Functions of Setting Tool Options ..................................................................................................... 10
1.7
Error Jump Function ......................................................................................................................... 11
1.8
Editor Functions ................................................................................................................................ 13
1.9
Storing External Editors .................................................................................................................... 14
1.10 Storing External Tools ...................................................................................................................... 16
1.11 Macro Descriptions Usable in Manager ............................................................................................ 17
1.12 Setting Operating Environment ......................................................................................................... 21
1.13 Debugger Types ............................................................................................................................... 22
1.14 Memory Operation Functions ........................................................................................................... 23
1.15 Register Operations .......................................................................................................................... 24
1.16 Line Assembly and Disassembly ...................................................................................................... 25
1.17 Symbolic Debugging ......................................................................................................................... 26
1.17.1 Referring to Local Symbols ......................................................................................................... 28
1.17.2 Referring to Variable of C Language .......................................................................................... 29
CHAPTER 2
DEPENDENCE FUNCTIONS ..................................................................... 31
2.1
Simulator Debugger ..........................................................................................................................
2.1.1
Setting Operating Environment ...................................................................................................
2.1.1.1 Boot ROM File Automatic Execution ........................................................................................
2.1.2
Instruction Simulation ..................................................................................................................
2.1.3
Memory Simulation ......................................................................................................................
2.1.4
I/O Port Simulation ......................................................................................................................
2.1.5
Interrupt Simulation .....................................................................................................................
2.1.6
Reset Simulation .........................................................................................................................
2.1.7
Low-Power Consumption Mode Simulation .................................................................................
2.1.8
STUB Function ............................................................................................................................
2.1.9
Break ...........................................................................................................................................
2.1.9.1 Code Break ...............................................................................................................................
2.1.9.2 Data Break ................................................................................................................................
2.1.9.3 Trace-Buffer-Full Break ............................................................................................................
2.1.9.4 Guarded Access Break .............................................................................................................
2.1.9.5 Forced Break ............................................................................................................................
2.1.10 Measuring Execution Cycle Count ..............................................................................................
2.1.11 Trace ...........................................................................................................................................
2.1.11.1 Setting Trace ............................................................................................................................
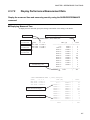
2.1.11.2 Displaying Trace Data ..............................................................................................................
v
32
34
35
36
37
38
39
40
41
42
43
44
46
47
48
49
50
52
53
54
2.1.11.3 Searching Trace Data ............................................................................................................... 55
2.1.11.4 Saving Trace Data .................................................................................................................... 56
2.1.12 Measuring Coverage ................................................................................................................... 57
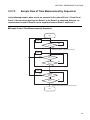
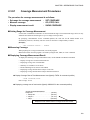
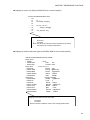
2.1.12.1 Coverage Measurement Procedures ........................................................................................ 58
2.1.13 Checking Debugger Information .................................................................................................. 61
2.2
Emulator Debugger (MB2141) .......................................................................................................... 63
2.2.1
Setting Operating Environment ................................................................................................... 64
2.2.1.1 MCU Operation Mode ............................................................................................................... 65
2.2.1.2 Debug Area .............................................................................................................................. 67
2.2.1.3 Memory Area Types ................................................................................................................. 68
2.2.1.4 Memory Mapping ...................................................................................................................... 71
2.2.1.5 Timer Minimum Measurement Unit .......................................................................................... 73
2.2.2
Notes on Commands for Executing Program .............................................................................. 74
2.2.3
Commands Available during Execution of User Program ........................................................... 76
2.2.4
On-the-fly Memory Access .......................................................................................................... 77
2.2.5
Break ........................................................................................................................................... 79
2.2.5.1 Code Break ............................................................................................................................... 80
2.2.5.2 Data Break ................................................................................................................................ 82
2.2.5.3 Sequential Break ...................................................................................................................... 83
2.2.5.4 Guarded Access Break ............................................................................................................. 84
2.2.5.5 Trace-Buffer-Full Break ............................................................................................................ 85
2.2.5.6 Performance-Buffer-Full Break ................................................................................................. 86
2.2.5.7 Forced Break ............................................................................................................................ 87
2.2.6
Events .......................................................................................................................................... 88
2.2.6.1 Operation in Normal Mode ....................................................................................................... 90
2.2.6.2 Operation in Multi Trace Mode ................................................................................................. 92
2.2.6.3 Operation in Performance Mode .............................................................................................. 94
2.2.7
Control by Sequencer .................................................................................................................. 96
2.2.7.1 Setting Sequencer .................................................................................................................... 97
2.2.7.2 Break by Sequencer ................................................................................................................. 99
2.2.7.3 Trace Sampling Control by Sequencer ................................................................................... 100
2.2.7.4 Time Measurement by Sequencer ......................................................................................... 102
2.2.7.5 Sample Flow of Time Measurement by Sequencer ................................................................ 103
2.2.8
Real-time Trace ......................................................................................................................... 105
2.2.8.1 Single Trace ........................................................................................................................... 106
2.2.8.2 Setting Single Trace ............................................................................................................... 108
2.2.8.3 Multi trace ............................................................................................................................... 110
2.2.8.4 Setting Multi Trace .................................................................................................................. 112
2.2.8.5 Displaying Trace Data Storage Status ................................................................................... 113
2.2.8.6 Specify Displaying Trace Data Start ....................................................................................... 114
2.2.8.7 Display Format of Trace Data ................................................................................................. 115
2.2.8.8 Reading Trace Data On-the-fly ............................................................................................... 119
2.2.8.9 Saving Trace Data .................................................................................................................. 121
2.2.9
Measuring Performance ............................................................................................................ 122
2.2.9.1 Performance Measurement Procedures ................................................................................. 123
2.2.9.2 Display Performance Measurement Data ............................................................................... 125
2.2.10 Measuring Coverage ................................................................................................................. 126
vi
2.2.10.1 Coverage Measurement Procedures ......................................................................................
2.2.11 Execution Time Measurement ...................................................................................................
2.2.12 Sampling by External Probe ......................................................................................................
2.2.13 Checking Debugger Information ................................................................................................
2.3
Emulator Debugger (MB2147-01) ...................................................................................................
2.3.1
Setting Operating Environment .................................................................................................
2.3.1.1 Monitoring Program Automatic Loading .................................................................................
2.3.1.2 MCU Operation Mode .............................................................................................................
2.3.1.3 Debug Area ............................................................................................................................
2.3.1.4 Memory Area Types ...............................................................................................................
2.3.1.5 Memory Mapping ....................................................................................................................
2.3.1.6 Debug Function ......................................................................................................................
2.3.1.7 Event Mode ............................................................................................................................
2.3.2
Notes on Commands for Executing User Program ...................................................................
2.3.3
Commands Available during Execution of User Program .........................................................
2.3.4
Break .........................................................................................................................................
2.3.4.1 Code Break .............................................................................................................................
2.3.4.2 Data Break ..............................................................................................................................
2.3.4.3 Monitoring Data Break ............................................................................................................
2.3.4.4 Sequential Break ....................................................................................................................
2.3.4.5 Guarded Access Break ...........................................................................................................
2.3.4.6 Trace-Buffer-Full Break ..........................................................................................................
2.3.4.7 Performance-Buffer-Full Break ...............................................................................................
2.3.4.8 External Trigger Break ............................................................................................................
2.3.4.9 Forced Break ..........................................................................................................................
2.3.5
Control by Sequencer ................................................................................................................
2.3.5.1 Setting Sequencer ..................................................................................................................
2.3.6
Real-time Trace .........................................................................................................................
2.3.6.1 Setting Single Trace ...............................................................................................................
2.3.6.2 Multi Trace ..............................................................................................................................
2.3.6.3 Setting Methods of Multi Trace ...............................................................................................
2.3.6.4 Displaying Trace Data Storage Status ...................................................................................
2.3.6.5 Specify Displaying Trace Data Storage Status .......................................................................
2.3.6.6 Display Format of Trace Data .................................................................................................
2.3.6.7 Reading Trace Data On-the-fly ...............................................................................................
2.3.6.8 Saving Trace Data ..................................................................................................................
2.3.7
Measuring Performance ............................................................................................................
2.3.7.1 Performance Measurement Procedures .................................................................................
2.3.7.2 Display Performance Measurement Data ...............................................................................
2.3.8
Measuring Coverage .................................................................................................................
2.3.8.1 Coverage Measurement Procedures ......................................................................................
2.3.9
Real-time Monitoring .................................................................................................................
2.3.10 Execution Time Measurement ...................................................................................................
2.3.11 Power-on Debugging .................................................................................................................
2.3.12 RAM Checker ............................................................................................................................
2.3.13 Checking Debugger Information ................................................................................................
2.4
Emulator Debugger (MB2147-05) ...................................................................................................
vii
127
131
133
135
137
138
139
140
141
142
144
146
147
148
150
152
153
155
156
157
158
159
160
161
162
163
165
167
170
171
174
176
177
178
182
183
184
185
187
188
189
192
193
195
196
200
202
2.4.1
Setting Operating Environment .................................................................................................
2.4.1.1 Monitoring Program Automatic Loading .................................................................................
2.4.1.2 MCU Operation Mode .............................................................................................................
2.4.1.3 Debug Area ............................................................................................................................
2.4.1.4 Memory Area Types ...............................................................................................................
2.4.1.5 Memory Mapping ....................................................................................................................
2.4.2
Notes on Commands for Executing Program ............................................................................
2.4.3
Commands Available during Execution of User Program .........................................................
2.4.4
Break .........................................................................................................................................
2.4.4.1 Code Break .............................................................................................................................
2.4.4.2 Data Break ..............................................................................................................................
2.4.4.3 Guarded Access Break ...........................................................................................................
2.4.4.4 Trace-Buffer-Full Break ..........................................................................................................
2.4.4.5 Forced Break ..........................................................................................................................
2.4.5
Real-time Trace .........................................................................................................................
2.4.5.1 Setting Trace ..........................................................................................................................
2.4.5.2 Displaying Trace Data Storage Status ...................................................................................
2.4.5.3 Specifying Displaying Trace Data Start ..................................................................................
2.4.5.4 Display Format of Trace Data .................................................................................................
2.4.5.5 Reading Trace Data On-the-fly ...............................................................................................
2.4.5.6 Saving Trace Data ..................................................................................................................
2.4.6
Measuring Execution Cycle Count ............................................................................................
2.5
Emulator Debugger (MB2198) ........................................................................................................
2.5.1
Setting Operating Environment .................................................................................................
2.5.1.1 Monitoring Program Automatic Loading .................................................................................
2.5.1.2 Boot ROM File Automatic Execution ......................................................................................
2.5.1.3 MCU Operation Mode .............................................................................................................
2.5.1.4 Operation Frequency Control .................................................................................................
2.5.2
Notes on Commands for Executing Program ............................................................................
2.5.3
Commands Available during Execution of User Program .........................................................
2.5.4
Break .........................................................................................................................................
2.5.4.1 Code Break .............................................................................................................................
2.5.4.2 Data Break ..............................................................................................................................
2.5.4.3 Guarded Access Break ...........................................................................................................
2.5.4.4 Sequential Break ....................................................................................................................
2.5.4.5 Trace-Buffer-Full Break ..........................................................................................................
2.5.4.6 Performance-Buffer-Full Break ...............................................................................................
2.5.4.7 External Trigger Break ............................................................................................................
2.5.4.8 Forced Break ..........................................................................................................................
2.5.5
Control by Sequencer ................................................................................................................
2.5.5.1 Operating of sequencer ..........................................................................................................
2.5.6
Real-time Trace .........................................................................................................................
2.5.6.1 Setting Trace ..........................................................................................................................
2.5.6.2 Displaying Trace Data Storage Status ...................................................................................
2.5.6.3 Specifying Displaying Trace Data Start ..................................................................................
2.5.6.4 Display Format of Trace Data .................................................................................................
2.5.6.5 Saving Trace Data ..................................................................................................................
viii
203
204
205
206
207
209
211
213
214
215
217
218
219
220
221
223
224
225
226
230
231
232
233
234
235
236
237
238
239
240
242
243
245
246
247
248
249
250
251
252
254
256
258
260
261
262
265
2.5.7
Measuring Performance ............................................................................................................
2.5.7.1 Performance Measurement Procedures .................................................................................
2.5.7.2 Display Performance Measurement Data ...............................................................................
2.5.8
Execution Time Measurement ...................................................................................................
2.5.9
Power-On Debugging ................................................................................................................
2.6
Emulator Debugger (MB2100-01) ...................................................................................................
2.6.1
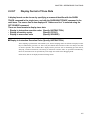
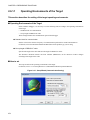
Starting debugging ....................................................................................................................
2.6.1.1 Operating Environments of the Target ...................................................................................
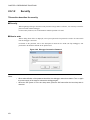
2.6.1.2 Security ...................................................................................................................................
2.6.2
Ending debugging ......................................................................................................................
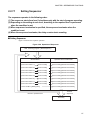
2.6.3
Efficiently Executing Debugging ................................................................................................
2.6.3.1 Increasing Communication Speed during Debugging ............................................................
2.6.3.2 Switching Debug Function ......................................................................................................
2.6.4
Executing Program ....................................................................................................................
2.6.4.1 Setting/Release of Debug Functions ......................................................................................
2.6.4.2 Monitoring ...............................................................................................................................
2.6.4.3 Power-on Debug .....................................................................................................................
2.6.4.4 Notes on Commands for Executing Program .........................................................................
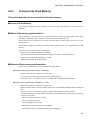
2.6.5
To Access the Flash Memory ....................................................................................................
2.6.6
To Interrupt the Program Execution [Break] ..............................................................................
2.6.6.1 Code Break (Hardware) ..........................................................................................................
2.6.6.2 Code Break (Software) ...........................................................................................................
2.6.6.3 Data Break ..............................................................................................................................
2.6.6.4 Forced Break ..........................................................................................................................
2.6.6.5 Data Watch Break ..................................................................................................................
2.6.6.6 Sequencer ..............................................................................................................................
2.6.7
Measuring the User Program Execution Time ...........................................................................
2.6.7.1 Measuring the User Program Execution Cycle Count [Time Measurement] ..........................
2.6.7.2 Measuring Event-to-Event Execution Cycle Count [Performance Measurement] ..................
2.6.8
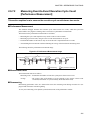
Viewing Program Execution History [Trace] ..............................................................................
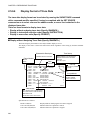
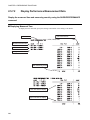
2.6.8.1 Displaying Trace Data ............................................................................................................
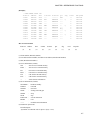
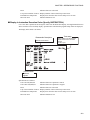
2.6.8.2 Trace Data Display Examples (RAW Data) ............................................................................
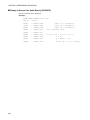
2.6.8.3 Trace Data Display Example (Instruction) ..............................................................................
2.6.8.4 Trace Data Display Example (Source) ...................................................................................
2.6.8.5 Saving Trace Data ..................................................................................................................
2.6.8.6 Searching for Trace Data .......................................................................................................
2.6.9
How to Display the Output Message from User Program to the Debugger ...............................
2.6.10 Checking Debugger Information ................................................................................................
2.7
Monitor Debugger ...........................................................................................................................
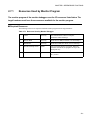
2.7.1
Resources Used by Monitor Program .......................................................................................
2.7.2
Break .........................................................................................................................................
2.7.2.1 Software Break .......................................................................................................................
2.7.2.2 Forced Break ..........................................................................................................................
266
267
268
269
271
272
273
274
276
277
278
279
280
281
282
284
285
287
289
292
293
295
296
297
298
300
303
304
305
308
309
311
312
313
314
315
316
318
320
321
322
323
324
INDEX................................................................................................................................... 325
ix
x
CHAPTER 1
BASIC FUNCTIONS
This chapter describes the basic functions on the
SOFTUNE Workbench.
1.1 Workspace Management Function
1.2 Project Management Function
1.3 Project Dependence
1.4 Make/Build Function
1.5 Include Dependencies Analysis Function
1.6 Functions of Setting Tool Options
1.7 Error Jump Function
1.8 Editor Functions
1.9 Storing External Editors
1.10 Storing External Tools
1.11 Macro Descriptions Usable in Manager
1.12 Setting Operating Environment
1.13 Debugger Types
1.14 Memory Operation Functions
1.15 Register Operations
1.16 Line Assembly and Disassembly
1.17 Symbolic Debugging
1
CHAPTER 1 BASIC FUNCTIONS
1.1
Workspace Management Function
This section explains the workspace management function of SOFTUNE Workbench.
■ Workspace
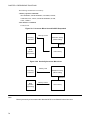
SOFTUNE Workbench uses workspace as a container to manage two or more projects including subprojects.
For example, a project that creates a library and a project that creates a target file using the project can be
stored in one workspace.
■ Workspace Management Function
To manage two or more projects, workspace manages the following information:
• Project
• Active project
• Subproject
■ Project
The operation performed in SOFTUNE Workbench is based on the project. The project is a set of files and
procedures necessary for creation of a target file. The project file contains all data managed by the project.
■ Active Project
The active project is basic to workspace and undergoes [Make], [Build], [Compile/Assemble], [Start Debug],
and [Update Dependence] in the menu. [Make], [Build], [Compile/Assemble], and [Update Dependence]
affect the subprojects within the active project.
If workspace contains some project, it always has one active project.
■ Subproject
The subproject is a project on which other projects depend. The target file in the subproject is linked with the
parent project of the subproject in creating a target file in the parent project.
This dependence consists of sharing target files output by the subproject, so a subproject is first made and
built. If making and building of the subproject is unsuccessful, the parent project of the subproject will not be
made and built.
The target file in the subproject is however not linked with the parent project when:
• An absolute (ABS)-type project is specified as a subproject.
• A library (LIB)-type project is specified as a subproject.
■ Restrictions on Storage of Two or More Projects
Only one REALOS-type project can be stored in one workspace.
2
CHAPTER 1 BASIC FUNCTIONS
1.2
Project Management Function
This section explains the project management function of SOFTUNE Workbench.
■ Project Management Function
The project manages all information necessary for development of a microcontroller system. Especially, its
major purpose is to manage information necessary for creation of a target file.
The project manages the following information:
- Project configuration
- Active project configuration
- Information on source files, include files, other object files, library files
- Information on tools executed before and after executing language tools (customize build function)
■ Project Format
The project file supports two formats: a 'workspace project format,' and an 'old project format.'
The differences between the two formats are as follows:
Workspace project format
- Supports management of two or more project configurations
- Supports use of all macros usable in manager
- Does not support early Workbench versions(*)
Old project format
- Supports management of just one project configuration
- Limited number of macros usable in manager
For details, see Section "1.11 Macro Descriptions Usable in Manager".
- Supports early Workbench versions(*)
When a new project is made, the workspace project format is used.
When using an existing project, the corresponding project format is used.
If a project made by an early Workbench version(*) is used, a dialog asking whether to convert the file to the
workspace project format is displayed. For details, refer to Section "2.13 Reading SOFTUNE Project Files of
Old Versions" of "SOFTUNE Workbench Operation Manual".
To open a project file in the workspace project format with an early Workbench version(*), it is necessary to
convert the file to the old project format. For saving the file in other project formats, refer to Section "4.2.7
Save As" of "SOFTUNE Workbench Operation Manual".
*: F2MC-16: V30L26 or earlier
■ Project Configuration
The project configuration is a series of settings for specifying the characteristics of a target file, and making,
building, compiling and assembling is performed in project configurations.
Two or more project configurations can be created in a project. The default project configuration name is
Debug. A new project configuration is created on the setting of the selected existing project configuration. In
the new project configuration, the same files as those in the original project configuration are always used.
By using the project configuration, the settings of programs of different versions, such as the optimization
3
CHAPTER 1 BASIC FUNCTIONS
level of a compiler and MCU setting, can be created within one project.
In the project configuration, the following information is managed:
- Name and directory of target file
- Information on options of language tools to create target file by compiling, assembling and linking
source files
- Information on whether to build file or not
- Information on setting of debugger to debug target file
■ Active Project Configuration
The active project configuration at default undergoes [Make], [Build], [Compile/Assemble], [Start Debug],
and [Update Dependence].
The setting of the active project configuration is used for the file state displayed in the SRC tab of project
window and includes files detected in the Dependencies folder.
Note:
If a macro function newly added is used in old project format, the macro description is expanded at the
time of saving in old project format. For the macro description newly added, refer to Section "1.11
Macro Descriptions Usable in Manager".
4
CHAPTER 1 BASIC FUNCTIONS
1.3
Project Dependence
This section explains the project dependence of SOFTUNE Workbench.
■ Project Dependence
If target files output by other projects must be linked, a subproject is defined in the project required in
[Project] - [Project Dependence] menu. The subproject is a project on which other projects depend.
By defining project dependence, a subproject can be made and built to link its target file before making and
building the parent project.
The use of project dependence enables simultaneous making and building of two or more projects developed
in one workspace.
A project configuration in making and building a subproject in [Project] - [Project Configuration] - [Build
Configuration] menu can be specified.
5
CHAPTER 1 BASIC FUNCTIONS
1.4
Make/Build Function
This section explains the make/build function of SOFTUNE Workbench.
■ Make Function
Make function generates a target file by compiling/assembling only updated source files from all source files
registered in a project, and then joining all required object files.
This function allows compiling/assembling only the minimum of required files. The time required for
generating a target file can be sharply reduced, especially, when debugging.
For this function to work fully, the dependence between source files and include files should be accurately
grasped. To do this, SOFTUNE Workbench has a function for analyzing include dependence. To perform this
function, it is necessary to understand the dependence of a source file and include file. SOFTUNE
Workbench has the function for analyzing the include file dependence. For details, see Section "1.5 Include
Dependencies Analysis Function".
■ Build Function
Build function generates a target file by compiling/assembling all source files registered with a project,
regardless of whether they have been updated or not, and then by joining all required object files. Using this
function causes all files to be compiled/assembled, resulting in the time required for generating the target file
longer. Although the correct target file can be generated from the current source files.
The execution of Build function is recommended after completing debugging at the final stage of program
development.
Note:
When executing the Make function using a source file restored from backup, the integrity between an
object file and a source file may be lost. If this happens, executing the Build function again.
6
CHAPTER 1 BASIC FUNCTIONS
1.4.1
Customize Build Function
This section describes the SOFTUNE Workbench to set the Customize Build function.
■ Customize Build function
In SOFTUNE Workbench, different tools can be operated automatically before and after executing the
Assembler, Compiler, Linker, Librarian, Converter, or Configurator started at Compile, Assemble, Make, or
Build.
The following operations can be performed automatically during Make or Build using this function:
- starting the syntax check before executing the Compiler,
- after executing the Converter, starting the S-format binary Converter (m2bs.exe) and converting
Motorola S-format files to binary format files.
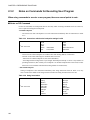
■ Setting Options
An option follows the tool name to start a tool from SOFTUNE Workbench. The options include any file
name and tool-specific options. SOFTUNE Workbench has the macros indicating that any file name and toolspecific options are specified as options.
If any character string other than parameters is specified, it is passed directly to the tool. For details about the
parameters, see Section "1.11 Macro Descriptions Usable in Manager".
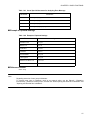
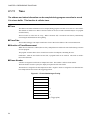
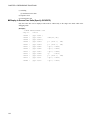
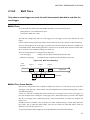
■ Macro List
The Setup Customize Build dialog provides a macro list for macro input. The build file, load module file,
project file submenus indicate their sub-parameters specified.
The environment variable brackets must have any item; otherwise, resulting in an error.
Table 1.4-1 Macro List
Macro List
Macro Name
Build file
%(FILE)
Load module file
%(LOADMODULEFILE)
Project file
%(PRJFILE)
Workspace file
%(WSPFILE)
Project directory
%(PRJPATH)
Target file directory
%(ABSPATH)
Object file directory
%(OBJPATH)
List file directory
%(LSTPATH)
Project construction name
%(PRJCONFIG)
Environment variable
%(ENV[])
Temporary file
%(TEMPFILE)
7
CHAPTER 1 BASIC FUNCTIONS
Note:
When checking [Use the Output window], note the following:
• Once a tool is activated, Make/Build is suspended until the tool is terminated.
• The Output window must not be used with a tool using a wait state for user input while the tool is
executing. The user can not perform input while the Output window is in use, so the tool cannot be
terminated. To forcibly terminate the tool, select the tool on the Task bar and input Control - C, or
Control - Z.
8
CHAPTER 1 BASIC FUNCTIONS
1.5
Include Dependencies Analysis Function
This section describes the function of the Include Dependencies Analysis of SOFTUNE
Workbench.
■ Analyzing Include Dependencies
A source file usually includes some include files. When only an include file has been modified leaving a
source file unchanged, SOFTUNE Workbench cannot execute the Make function unless it has accurate and
updated information about which source file includes which include files.
For this reason, SOFTUNE Workbench has a built-in Include Dependencies Analysis function. This function
can be activated by selecting the [Project] - [Include Dependencies] menu. By using this function, uses can
know the exact dependencies, even if an include file includes another include file.
SOFTUNE Workbench automatically updates the dependencies of the compiled/assembled files.
Note:
When executing the [Project] - [Include Dependencies] menu, the Output window is redrawn and
replaced by the dependencies analysis result.
If the contents of the current screen are important (error message, etc.), save the contents to a file and
then execute the Include Dependencies command.
9
CHAPTER 1 BASIC FUNCTIONS
1.6
Functions of Setting Tool Options
This section describes the functions to set options for the language tools activated from
SOFTUNE Workbench.
■ Function of Setting Tool Options
To create a desired target file, it is necessary to specify options for the language tools such as a compiler,
assembler, and linker. SOFTUNE Workbench stores and manages the options specified for each tool in
project configurations.
Tool options include the options effective for all source files (common options) and the options effective for
specific source files (individual options). For details about the option setting, refer to Section "4.5.5 Setup
Project" of "SOFTUNE Workbench Operation Manual".
- Common options
These options are effective for all source files (excluding those for which individual options are
specified) stored in the project.
- Individual options
These options are compile/assemble options effective for specific source files. The common options
specified for source files for which individual options are specified become invalid.
■ Tool Options
SOFTUNE Workbench the macros indicating that any file name and directory name are specified as options.
If any character string other than parameters is specified, it is passed directly to the tool. For details about the
parameters, see Section "1.11 Macro Descriptions Usable in Manager". For details about the tool options for
each tool, see the manual of each tool.
10
CHAPTER 1 BASIC FUNCTIONS
1.7
Error Jump Function
This section describes the error jump function in SOFTUNE Workbench.
■ Error Jump Function
When an error, such as a compile error occurs, double-clicking the error message displayed in the Output
window, opens the source file where the error occurred, and automatically moves the cursor to the error line.
This function permits efficient removal of compile errors, etc.
The SOFTUNE Workbench Error Jump function analyzes the source file names and line number information
embedded in the error message displayed in the Output window, opens the matching file, and jumps
automatically to the line.
The location where a source file name and line number information are embedded in an error message, varies
with the tool outputting the error.
An error message format can be added to an existing one or modified into an new one. However, the modify
error message formats for pre-installed Fujitsu language tools are defined as part of the system, these can not
be modified.
A new error message format should be added when working the Error Jump function with user register. To
set Error Jump, execute the [Setup] - [Error Jump Setting] menu.
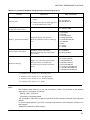
■ Syntax
An error message format can be described in Syntax. SOFTUNE Workbench uses macro descriptions as
shown in the Table 1.7-1 to define such formats.
To analyze up to where %f, %h, and %* continue, SOFTUNE Workbench uses the character immediately
after the above characters as a delimiter. Therefore, in Syntax, the description until a character that is used as
a delimiter re-appears, is interpreted as a file name or a keyword for help, or is skipped over. To use % as a
delimiter, describe as %%. The %[char] macro skips over as long as the specified character continues in
parentheses. To specify "]" as a skipped character, describe it as "\]". Blank characters in succession can be
specified with a single blank character.
Table 1.7-1 List of Special Characters String for Analyzing Error Message
Characters
Semantics
%f
Interpret as source file name and inform editor.
%l
Interpret as line number and inform editor.
%h
Become keyword when searching help file.
%*
Skip any desired character.
%[char]
Skip as long as characters in [ ] continues.
11
CHAPTER 1 BASIC FUNCTIONS
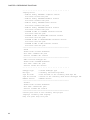
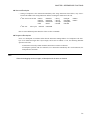
[Example]
***
%f(%l)
%h: or, %[*]
%f(%l)
%h:
The first four characters are "*** ", followed by the file name and parenthesized page number, and then
the keyword for help continues after one blank character.
This represents the following message:
***C :\Sample\sample.c(100)
■ Reference Section
Setup Error Jump
12
E4062C:
Syntax Error:
near /int.
CHAPTER 1 BASIC FUNCTIONS
1.8
Editor Functions
This section describes the functions of the SOFTUNE Workbench built-in standard editor.
■ Standard Editor
SOFTUNE Workbench has a built-in editor called the standard editor. The standard editor is activated as the
Edit window in SOFTUNE Workbench. As many Edit windows as are required can be opened at one time.
The standard editor has the following functions in addition to regular editing functions.
- Keyword marking function in C/assembler source file
Displays reserved words, such as if and for, in different color
- Error line marking function
The error line can be viewed in a different color, when executing Error Jump.
- Bookmark setup function
A bookmark can be set on any line, and instantaneously jumps to the line. Once a bookmark is set, the
line is displayed in a different color.
- Ruler, line number display function
The Ruler is a measure to find the position on a line; it is displayed at the top of the Edit window. A
line number is displayed at the left side of the Edit window.
- Automatic indent function
When a line is inserted using the Enter key, the same indent (indentation) as the preceding line is set
automatically at the inserted line. If the space or tab key is used on the preceding line, the same use is
set at the inserted line as well.
- Function to display, Blank, Line Feed code, and Tab code
When a file includes a Blank, Line Feed code, and Tab code, these codes are displayed with special
symbols.
- Undo function
This function cancels the preceding editing action to restore the previous state. When more than one
character or line is edited, the whole portion is restored.
- Tab size setup function
Tab stops can be specified by defining how many digits to skip when Tab codes are inserted. The
default is 8.
- Font changing function
The font size for character string displayed in the Edit window can be selected.
■ Reference Section
Edit Window (The Standard Editor)
13
CHAPTER 1 BASIC FUNCTIONS
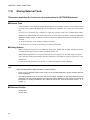
1.9
Storing External Editors
This section describes the function to set an external editor to SOFTUNE Workbench.
■ External Editor
SOFTUNE Workbench has a built-in standard editor, and use of this standard editor is recommended.
However, another accustomed editor can be used, with setting it, instead of an edit window. There is no
particular limit on which editor can be set, but some precautions (below) may be necessary. Use the [Setup] [Editor setting] menu to set an external editor.
■ Precautions
- Error jump function
The error jump cannot move the cursor to an error line if the external editor does not have a function to
specify the cursor location when activated the external editor.
- File save at compiling/assembling
SOFTUNE Workbench cannot control an external editor. Always save the file you are editing before
compiling/assembling.
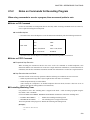
■ Setting Options
When activating an external editor from SOFTUNE Workbench, options must be added immediately after
the editor name. The names of file to be opened by the editor and the initial location of the cursor (the line
number). can be specified. SOFTUNE Workbench has a set of special parameters for specifying any file
name and line number, as shown in the Table 1.9-1. If any other character string are described by these
parameters, such characters string are passed as is to the editor.
%f (File name) is determined as follows:
1. If the focus is on the SRC tab of Project window, and if a valid file name is selected, the selected file
name becomes the file name.
2. When a valid file name cannot be acquired by the above procedure, the file name with a focus in the
built-in editor becomes the file name.
%x (project path) is determined as follows:
1. If a focus is on the SRC tab of project window and a valid file name is selected, the project path is a
path to the project in which the file is stored.
2. If no path is obtained, the project path is a path to the active project.
Also file name cannot be given double-quotes in the expansion of %f macros.
Therefore, it is necessary for you to provide double-quotes for %f. Depending on the editor, there are line
numbers to which there will be no correct jump if the entire option is not given double-quotes.
14
CHAPTER 1 BASIC FUNCTIONS
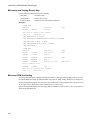
Table 1.9-1 List of Special Characters for Analyzing Error Message
Parameter
Semantics
%%
Means specifying % itself
%f
Means specifying file name
%l
Means specifying line number
%x
Means specifying project path
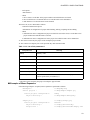
■ Example of Optional Settings
Table 1.9-2 Example of Optional Settings
Editor name
Argument
WZ Editor V4.0
%f /j%l
MIFES V1.0
%f+%l
UltraEdit32
%f/%l/1
TextPad32
%f(%l)
PowerEDITOR
%f -g%l
Codewright32
%f -g%l
Hidemaru for Win3.1/95
/j%l:1 %f
ViVi
/line=%l %f
■ Reference Section
Editor Setup
Note:
Regarding execution of error jump in Hidemaru:
To execute error jump in Hidemaru used as an external editor, use the [Others] - [Operating
Environment] - [Exclusive Control] menu, and then set "When opening the same file in Hidemaru" and
"Opening two identical files is inhibited".
15
CHAPTER 1 BASIC FUNCTIONS
1.10
Storing External Tools
This section describes the function to set an external tool to SOFTUNE Workbench.
■ External Tools
A non-standard tool not attached to SOFTUNE Workbench can be used by setting it as an external tool and
by calling it from SOFTUNE Workbench. Use this function to coordinate with a source file version control
tool.
If a tool set as an external tool is designed to output the execution result to the standard output and the
standard error output through the console application, the result can be specified to output the SOFTUNE
Workbench Output window. In addition, the allow description of additional parameters each time the tool is
activated.
To set an external tool, use the [Setup] - [Setting Tool] menu.
To select the title of a set tool, use the [Setup] - [Activating Tool] menu.
■ Setting Options
When activating an external tool from SOFTUNE Workbench, options must be added immediately after the
external tool name. Specify the file names, and unique options, etc.
SOFTUNE Workbench has a set of special parameters for specifying any file name and unique tool options.
If any characters string described other than these parameters, such characters string are passed as is to the
external tool.
For details about the parameters, see Section "1.11 Macro Descriptions Usable in Manager".
Note:
When checking [Use the Output window], note the following:
• Once a tool is activated, neither other tools nor the compiler/assembler can be activated until the
tool is terminated.
• The Output window must not be used with a tool using a wait state for user input while the tool is
executing. The user cannot perform input while the Output window is in use, so the tool cannot be
terminated. To forcibly terminate the tool, select the tool on the Task bar and input Control - C, or
Control - Z.
■ Reference Section
Setting Tools
Starting Tools
16
CHAPTER 1 BASIC FUNCTIONS
1.11
Macro Descriptions Usable in Manager
This section explains the macro descriptions that can be used in the manager of
SOFTUNE Workbench.
■ Macros
SOFTUNE Workbench has special parameters indicating that any file name and tool-specific options are
specified as options.
The use of these parameters as tool options eliminates the need for options specified each time each tool is
started.
The type of macro that can be specified and macro expansion slightly vary depending on where to describe
macros. The macros usable for each function are detailed below. For the macros that can be specified for
"Error Jump" and "External Editors" see Sections "1.7 Error Jump Function" and "1.9 Storing External
Editors".
■ Macro List
The following is a list of macros that can be specified in SOFTUNE Workbench.
The macros usable for each function are listed below.
- External tools:
Table 1.11-1 and Table 1.11-2
- Customize build: Table 1.11-1 and Table 1.11-2
- Tool options:
Table 1.11-2
The directory symbol \ is added to the option directories in Table 1.11-1 but not to the macro directories in
Table 1.11-2.
The sub-parameters in Table 1.11-3 can be specified in %(FILE), %(LOADMOUDLEFILE), %(PRJFILE).
The sub-parameter is specified in the form of %(PRJFILE[PATH]).
If the current directory is on the same drive, the relative path is used. The current directory is the workspace
directory for %(PRJFILE), and %(WSPFILE), and the project directory for other than them.
17
CHAPTER 1 BASIC FUNCTIONS
Table 1.11-1 List of Macros That Can Be Specified 1
Parameter
Meaning
%f
Passed as full-path name of file. (*1)
%F
Passed as main file name of file. (*1)
%d
Passed as directory of file. (*1)
%e
Passed as extension of file. (*1)
%a
Passed as full-path name of load module file.
%A
Passed as main file name of load module file. (*2)
%D
Passed as directory of load module file. (*2)
%E
Passed as extension of load module file. (*2)
%x
Passed as directory of project file. (*2)
%X
Passed as main file name of project file. (*2)
%%
Passed as %.
Table 1.11-2 List of Macros That Can Be Specified 2
Parameter
Meaning
%(FILE)
Passed as full-path name of file. (*1)
%(LOADMODULEFILE)
Passed as full-path name of load module file. (*2)
%(PRJFILE)
Passed as full-path name of project file. (*2)
%(WSPFILE)
Passed as full-path name of workspace file. (*3)
%(PRJPATH)
Passed as directory of project file. (*2)
%(ABSPATH)
Passed as directory of target file. (*2)
%(OBJPATH)
Passed as directory of object file. (*2)
%(LSTPATH)
Passed as directory of list file. (*2)
%(PRJCONFIG)
Passed as project configuration name. (*2) (*3)
%(ENV [Environment
variable])
Environment variable specified in environment variable brackets is
passed.
%(TEMPFILE)
Temporary file is created and its full-path name is passed. (*4)
The macros in (*1) are determined as follows:
- Customize build
1. Source file before and after executing compiler and assembler
2. Target file before and after executing linker, librarian and converter
3. Configuration file before and after executing configuration
18
CHAPTER 1 BASIC FUNCTIONS
- Tool options
• Null character
- Others
1. File as focus is on the SRC tab of project window and valid file name is selected
2. File on which focus is in internal editor as no valid file name can be obtained in 1
3. Null character if no valid file name can be obtained
The macros in (*2) are determined as follows:
- Customize build and tool options
• Information on configuration of project under building, making, compiling and assembling
- Others
1. Information on active configuration of project in which file is stored as focus is on the SRC tab of
project window and valid file name is selected
2. Information on active configuration of active project if no valid file name can be obtained in 1
*3: The macro can use only the project of the workspace project format.
*4: The content of a temporary file can be specified only with customize build.
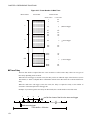
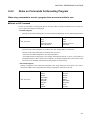
Table 1.11-3 List of Sub parameters 1
Sub parameter
Meaning
[PATH]
Directory of file
[RELPATH]
Relative Path of file
[NAME]
Main file name of file
[EXT]
Extension of file
[SHORTFULLNAME]
Full path name of short file
[SHORTPATH]
Directory of short file
[SHORTNAME]
Main file name of short file
[FOLDER]
Name of folder in which files are stored in the SRC tab of project window
(Can be specified only in %(FILE).)(*)
*: The macro can be used only the project of workspace project format.
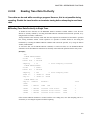
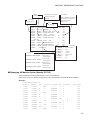
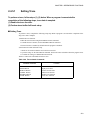
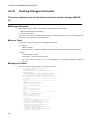
■ Examples of Macro Expansion
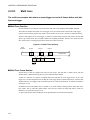
If the following workspace is opened, macro expansion is performed as follows:
Workspace :
C:\Wsp\Wsp.wsp
Active project :
C:\Wsp\Sample\Sample.prj
Active project configuration
Object directory :
Subproject :
Active project configuration
Debug
C:\Wsp\Sample\Debug\Obj\
C:\Subprj\Subprj.prj
Release
Object directory :
C:\Subprj\Release\Obj\
Target file :
C:\Subprj\Release\Abs\Subprj.abs
19
CHAPTER 1 BASIC FUNCTIONS
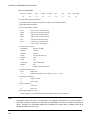
[Example] Macro expansion in external tools
Focus is on Subprj project file in the SRC tab of project window.
%a
: C:\Subprj\Release\Abs\Subprj.abs
%A
: SUBPRJ.abs
%D
: C:\Subprj\Release\Abs\
%E
: .abs
%(FILE[FOLDER])
: Source Files\Common
%(PRJFILE)
: C:\Subprj\Subprj.prj
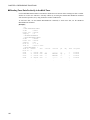
Focus is not in the SRC tab of project window.
%a
: C:\Wsp\Sample\Debug\Abs\Sample.abs
%A
: Sample.abs
%D
: C:\Wsp\Sample\Debug\Abs\
%(PRJFILE)
: C:\Wsp\Sample\Sample.prj
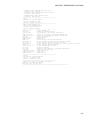
[Example] Macro expansion in customize build
Release configuration of Subprj project is built.
%(FILE)
: C:\Subprj\LongNameFile.c
%(FILE[PATH])
: C:\Subprj
%(FILE[RELPATH])
: .
%(FILE[NAME])
: LongNameFile
%(FILE[EXT])
: .c
%(FILE[SHORTFULLNAME])
: C:\Subprj\LongFi = ~1.c
%(FILE[SHORTPATH])
: C:\Subprj
%(FILE[SHORTNAME])
: LongFi~1
%(PRJFILE[RELPATH])
: ..\Subprj
%(PRJPATH)
: C:\Subprj
%(OBJPATH)
: C:\Subprj\Release\Obj
%(PRJCONFIG)
: Release
%(ENV[FETOOL])
: C:\SOFTUNE
%(TEMPFILE)
: C:\Subprj\Release\Opt\_fs1056.TMP
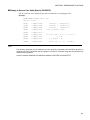
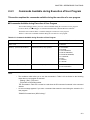
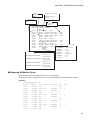
[Example] Macro expansion in tool options
Release configuration of Subprj project is built.
20
%(FILE)
:
%(PRJFILE[RELPATH])
: ..\Subprj
%(PRJPATH)
: C:\Subprj
%(OBJPATH)
: C:\Subprj\Release\Obj
%(PRJCONFIG)
: Release
%(ENV[FETOOL])
: C:\SOFTUNE
CHAPTER 1 BASIC FUNCTIONS
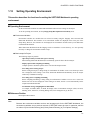
1.12
Setting Operating Environment
This section describes the functions for setting the SOFTUNE Workbench operating
environment.
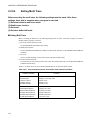
■ Operating Environment
Set the environment variables for SOFTUNE Workbench and some basic setting for the Project.
To set the operating environment, use the [Setup]-[Setup Development Environment] menu.
● Environment Variables
Environment variables are variables that are referred to mainly using the language tools activated from
SOFTUNE Workbench. The semantics of an environment variable are displayed in the lower part of the
Setup dialog. However, the semantics are not displayed for environment variables used by tools added later
to SOFTUNE Workbench.
When SOFTUNE Workbench and the language tools are installed in a same directory, it is not especially
necessary to change the environment variable setups.
● Basic setups for Project
The following setups are possible.
- Open the previously worked-on Project at start up
When starting SOFTUNE Workbench, it automatically opens the last worked-on Project.
- Display options while compiling/assembling
Compile options or assemble options can be viewed in the Output window.
- Save dialog before closing Project
Before closing the Project, a dialog asking for confirmation of whether or not to save the Project to the
file is displayed. If this setting is not made, SOFTUNE Workbench automatically saves the Project
without any confirmation message.
- Save dialog before compiling/assembling
Before compiling/assembling, a dialog asking for confirmation of whether or not to save a source file
that has not been saved is displayed. If this setting is not made, the file is saved automatically before
compile/assemble/make/build.
- Termination message is highlighted at Make/Build
At Compile, Assemble, Make, or Build, the display color of termination messages (Abort, No Error,
Warning, Error, Fatal error, or Failing During start) can be changed freely by the user.
■ Reference Section
Development Environment
Note:
Because the environment variables set here are language tools for the SOFTUNE Workbench, the
environment variables set on previous versions of SOFTUNE cannot be used. In particular, add the
set values of [User Include Directory] and [Library Search Directory] to [Tool Options Settings].
21
CHAPTER 1 BASIC FUNCTIONS
1.13
Debugger Types
This section describes the types of SOFTUNE Workbench debuggers.
■ Type of Debugger
SOFTUNE Workbench integrates three types of debugger: a simulator debugger, emulator debugger, and
monitor debugger. Any one can be selected depending on the requirement.
■ Simulator Debugger
The simulator debugger simulates the MCU operations (executing instructions, memory space, I/O ports,
interrupts, reset, etc.) with software to evaluate a program.
It is used for evaluating an uncompleted system and operation of individual units, etc.
■ Emulator Debugger
The emulator debugger is software to evaluate a program by controlling an emulator from a host through a
communications line (RS-232C, LAN, USB).
Before using this debugger, the emulator must be initialized.
■ Monitor Debugger
The monitor debugger evaluates a program by putting it into an evaluation system and by communicating
with a host. An RS-232C interface and an area for the debug program are required within the evaluation
system.
22
CHAPTER 1 BASIC FUNCTIONS
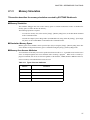
1.14
Memory Operation Functions
This section describes the memory operation functions.
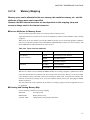
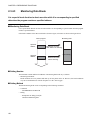
■ Functions for Memory Operations
- Display/Modify memory data
Memory data can be display in the Memory window and modified.
- Fill
The specified memory area can be filled with the specified data.
- Copy
The data in the specified memory area can be copied to another area.
- Compare
The data in the specified source area can be compared with data in the destination area.
- Search
Data in the specified memory area can be searched.
For further details of the above functions, refer to "3.11 Memory Window" in "SOFTUNE Workbench
Operation Manual".
- Display/Modify C variables
The names of variables in a C source file can be displayed in the Watch window and modified.
- Setting Watch point
By setting a watch point at a specific address, its data can be displayed in the Watch window.
For further details of the above functions, refer to "3.13 Watch Window" in "SOFTUNE Workbench
Operation Manual".
23
CHAPTER 1 BASIC FUNCTIONS
1.15
Register Operations
This section describes the register operations.
■ Register Operations
The Register window is opened when the [View] - [Register] menu is executed. The register and flag values
can be displayed in the Register window.
For further details about modifying the register value and the flag value, refer to "4.4.4 Register" in
"SOFTUNE Workbench Operation Manual".
The name of the register and flag displayed in the Register window varies depending on each MCU in use.
For the list of register names and flag names for the MCU in use, refer to "Appendix A Register Name List"
of " SOFTUNE Workbench Operational Manual".
■ Reference Section
Register Window
24
CHAPTER 1 BASIC FUNCTIONS
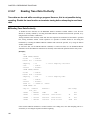
1.16
Line Assembly and Disassembly
This section describes line assembly and disassembly.
■ Line Assembly
To perform line-by-line assembly (line assembly), right-click anywhere in the Disassembly window to
display the short-cut menu, and select [Line Assembly]. For further details about assembly operation, refer to
"4.4.3 Assembly" in "SOFTUNE Workbench Operation Manual".
■ Disassembly
To display disassembly, use the [View]-[Disassembly] menu. By default, disassembly can be viewed starting
from the address pointed by the current program counter (PC). However, the address can be changed to any
desired address at start-up.
Disassembly for an address outside the memory map range cannot be displayed. If this is attempted, "???" is
displayed as the mnemonic.
■ Reference Section
Disassembly Window
25
CHAPTER 1 BASIC FUNCTIONS
1.17
Symbolic Debugging
The symbols defined in a source program can be used for command parameters
(address). There are three types of symbols as follows:
• Global Symbol
• Static Symbol within Module (Local Symbol within Module)
• Local Symbol within Function
■ Types of Symbols
A symbol means the symbol defined while a program is created, and it usually has a type. Symbols become
usable by loading the debug information file.
Furthermore, a type of the symbol in C language is recognized and the command is executed.
There are three types of symbols as follows:
• Global symbol
A global symbol can be referred to from anywhere within a program. In C language, variables and
functions defined outside a function without a static declaration are in this category. In assembler,
symbols with a PUBLIC declaration are in this category.
• Static symbol within module (Local symbol within module)
A static symbol within module can be referred to only within the module where the symbol is defined.
In C language, variables and functions defined outside a function with a static declaration are in this
category. In assembler, symbols without a PUBLIC declaration are in this category.
• Local symbol within function
A local symbol within a function exists only in C language. A static symbol within a function and an
automatic variable are in this category.
- Static symbol within function
Out of the variables defined in function, those with static declaration.
- Automatic variable
Out of the variables defined in function, those without static declaration and parameters for the
function.
■ Setting Symbol Information
Symbol information in the file is set with the symbol information table by loading a debug information file.
This symbol information is created for each module.
The module is constructed for each source file to be compiled in C language, in assembler for each source
file to be assembled.
The debugger automatically selects the symbol information for the module to which the PC belongs to at
abortion of execution (Called "the current module"). A program in C language also has information about
which function the PC belongs to.
26
CHAPTER 1 BASIC FUNCTIONS
■ Line Number Information
Line number information is set with the line number information table in SOFTUNE Workbench when a
debug information file is loaded. Once registered, such information can be used at anytime thereafter. Line
number is defined as follows:
[Source File Name]
$Line Number
27
CHAPTER 1 BASIC FUNCTIONS
1.17.1
Referring to Local Symbols
This section describes referring to local symbols and Scope.
■ Scope
When a local symbol is referred to, Scope is used to indicate the module and function to which the local
symbol to be referred belongs.
SOFTUNE Workbench automatically scopes the current module and function to refer to local symbols in the
current module with preference. This is called the Auto-scope function, and the module and function
currently being scoped are called the Current Scope.
When specifying a local variable outside the Current Scope, the variable name should be specified by the
module and function to which the variable belongs. This method of specifying a variable is called a symbol
path name or a Search Scope.
■ Moving Scope
As explained earlier, there are two ways to specify the reference to a variable: by adding a Search Scope
when specifying the variable name, and by moving the Current Scope to the function with the symbol to be
referred to. The Current Scope can be changed by displaying the Call Stack dialog and selecting the parent
function. For further details of this operation, refer to "4.6.7 Stack" in "SOFTUNE Workbench Operation
Manual". Changing the Current Scope as described above does not affect the value of the PC.
By moving the current scope in this way, you can search a local symbol in parent function with precedence.
■ Specifying Symbol and Search Procedure
A symbol is specified as follows:
[[Module Name] [\Function Name] \] Symbol Name
When a symbol is specified using the module and function names, the symbol is searched. However, when
only the symbol name is specified, the search is made as follows:
1. Local symbols in function in Current Scope
2. Static symbols in module in Current Scope
3. Global symbols
If a global symbol has the same name as a local symbol in the Current Scope, specify "\" or "::" at the start of
global symbol. By doing so, you can explicitly show that is a global symbol.
An automatic variable can be referred to only when the variable is in memory. Otherwise, specifying an
automatic variable causes an error.
28
CHAPTER 1 BASIC FUNCTIONS
1.17.2
Referring to Variable of C Language
C language variables can be specified using the same descriptions as in the source
program written in C language.
■ Specifying C Language Variables
C language variables can be specified using the same descriptions as in the source program. The address of C
language variables should be preceded by the ampersand symbol "&". Some examples are shown in the Table
1.17-1.
Table 1.17-1 Examples of Specifying Variables
Example of Variables
Example of
Specifying
Variables
Regular Variable
int data;
data
Pointer
char *p;
*p
Array
char a[5];
a[1]
Structure
Union
Address of variable
Reference type
struct stag {
char c;
int i;
};
struct stag st;
struct stag *stp;
union utag {
char c;
int i;
} uni;
int data;
int i;
int &ri = i;
st.c
stp- >c
uni.i
&data
ri
Semantics
Value of data
Value pointed to by p
Value of second element of a
Value of member c of st
Value of member c of the structure
to which stp points
Value of member i of uni
Address of data
Same as i
29
CHAPTER 1 BASIC FUNCTIONS
■ Notes on C Language Symbols
The C compiler outputs symbol information with "_" prefixed to global symbols. For example, the symbol
main outputs symbol information _main. However, SOFTUNE Workbench permits access using the symbol
name described in the source to make the debug of program described by C language easier.
Consequently, a symbol name described in C language and a symbol name described in assembler, which
should both be unique, may be identical.
In such a case, the symbol name in the Current Scope normally is preferred. To refer to a symbol name
outside the Current Scope, specify the symbol with the module name.
If there are duplicated symbols outside the Current Scope, the symbol name searched first becomes valid. To
refer to another one, specify the symbol with the module name.
30
CHAPTER 2
DEPENDENCE FUNCTIONS
This chapter describes the functions dependent on each
Debugger.
2.1 Simulator Debugger
2.2 Emulator Debugger (MB2141)
2.3 Emulator Debugger (MB2147-01)
2.4 Emulator Debugger (MB2147-05)
2.5 Emulator Debugger (MB2198)
2.6 Emulator Debugger (MB2100-01)
2.7 Monitor Debugger
31
CHAPTER 2 DEPENDENCE FUNCTIONS
2.1
Simulator Debugger
This section describes the functions of the simulator debugger for the F2MC-16 Family.
■ Simulator Debugger
The simulator debugger simulates the MCU operations (executing instructions, memory space, I/O ports,
interrupts, reset, etc.) with software to evaluate a program.
It is used to evaluate an uncompleted system, the operation of single units, etc.
There are 2 types of simulator debuggers.
- Normal simulator debugger (normal)
- High-speed simulator debugger (fast)
This high-speed simulator debugger provides substantial reductions in simulation time due to a dramatic
review of normal simulator debugger's processing methods.
The high-speed simulator debugger can be instruction processing performance for 10MIPS when it is
operated by PC equipped with Pentium4 2.0GHz.
External I/F for simulator are equipped to high-speed simulator debugger to create peripheral simulation
modules.
Please refer to "Appendix I External I/F DLL for Simulator" in "SOFTUNE Workbench Operation Manual".
■ Operating Condition of High-speed Simulator Debugger
The high-speed simulator debugger requires much more RAM space on the host PC than that of normal
simulator debugger.
The required RAM size depends largely on your program size.
For the required available RAM space, see the table below:
Basic use
Fs907s.exe (This product)
20MB
CODE size of target program
per 64 KB
6MB
DATA size of target program
per 64 KB
1.5MB
Insufficient RAM space will lead to an extreme decrease in simulation speed.
Target program size
CODE
XX(KB)
DATA
YY(KB)
Required RAM space (MB) = 20 + (XX / 64) 6 + (YY / 64) 1.5
However, RAM space larger than the above may be needed depending on program allocation.
Consecutive areas should be reserved as much as possible.
Example: Program with 1 MB of CODE and DATA sizes
Required RAM space (MB) = 20 + (1024 / 64) 6 + (1024 / 64) 1.5 = 140MB
32
CHAPTER 2 DEPENDENCE FUNCTIONS
■ Simulation Range
The simulator debugger simulates the MCU operations (instruction operations, memory space, I/O ports,
interrupts, reset, power-save consumption mode, etc.) Peripheral I/Os, such as a timer, DMAC and serial I/O,
other than the CPU core of the actual chip are not supported as peripheral resources. I/O space to which
peripheral I/Os are connected is treated as memory space. There is a method for simulating interrupts like
timer interrupts, and data input to memory like I/O ports. For details, see the sections concerning I/O port
simulation and interrupt simulation.
- Instruction simulation
- Memory simulation
- I/O port simulation (Input port)
- I/O port simulation (Output port)
- Interrupt simulation
- Reset simulation
- Power-save consumption mode simulation
33
CHAPTER 2 DEPENDENCE FUNCTIONS
2.1.1
Setting Operating Environment
This section explains the operating environment setup.
■ Setting Operating Environment
For the simulator debugger for F2MC-16FX, it is necessary to set the following operating environment. Its
predefined default settings are enabled at startup. Therefore, setup is not required when using the default
settings. Adjusted settings can be used as new default settings from the next time.
• Boot ROM file automatic execution
34
CHAPTER 2 DEPENDENCE FUNCTIONS
2.1.1.1
Boot ROM File Automatic Execution
The simulator debugger for F2MC-16FX automatically loads and executes the Boot ROM
file at the start of debugging.
■ Boot ROM File Automatic Execution
When the simulator debugger for F2MC-16FX is specified, the Boot ROM file is automatically loaded and
then executed at the start of debugging. The Boot ROM file is stored in Lib\907\BootROM under the
directory where Workbench is installed.
The directory containing the Boot ROM file can be displayed using the [Project] - [Setup Project] menu, and
can be modified in the setup project dialog. In addition, it is also possible to automatically execute the Boot
ROM file during the debugger startup or reset of MCU. For details, see the "SOFTUNE Workbench
Operation Manual".
Notes:
• When MCU reset is performed in the simulator debugger, the PC value varies, as shown below,
depending on whether it is F2MC-16FX or not:
F2MC-16FX: Starting address of the Boot ROM file
Other than F2MC-16FX: Entry point in the target file (reset vector)
• As the simulator debugger does not support fixed boot vectors, it always jumps to the reset vector
after the execution of the Boot ROM file. For the operation after the execution of the Boot ROM file,
see the LSI Specification Manual.
35
CHAPTER 2 DEPENDENCE FUNCTIONS
2.1.2
Instruction Simulation
This section describes the instruction simulation executed by SOFTUNE Workbench.
■ Instruction Simulation
This simulates the operations of all instructions supported by the F2MC-16/16L/16LX/16H/16F. It also
simulates the changes in memory and register values due to such instructions.
36
CHAPTER 2 DEPENDENCE FUNCTIONS
2.1.3
Memory Simulation
This section describes the memory simulation executed by SOFTUNE Workbench.
■ Memory Simulation
The simulator debugger must first secure memory space to simulate instructions because it simulates the
memory space secured in the host PC memory.
The following operation is required.
- To secure the memory area, either use the [Setup] - [Memory Map] menu, or the SET MAP command
in the Command window.
- Load the file output by the Linkage Editor (Load Module File) using either the [Debug] - [Load target
file] menu, or the LOAD/OBJECT command in the Command window.
■ Simulation Memory Space
Memory space access attributes can be specified byte-by-byte using the [Setup] - [Memory Map] menu. The
access attribute of unspecified memory space is Undefined using the [Setup] - [Memory Map] menu.
■ Memory Area Access Attributes
Access attributes for memory area can be specified as shown in Table 2.1-1. A guarded access break occurs if
access is attempted against such access attribute while executing a program. When access is made by a
program command, such access is allowed regardless of the attribute, CODE, READ or WRITE. However,
access to memory in an undefined area causes an error.
Table 2.1-1 Types of Access Attributes
Attribute
Semantics
CODE
Instruction operation enabled
READ
Data read enabled
WRITE
Data write enabled
undefined
Attribute undefined (access prohibited)
37
CHAPTER 2 DEPENDENCE FUNCTIONS
2.1.4
I/O Port Simulation
This section describes I/O port simulation executed by SOFTUNE Workbench.
■ I/O Port Simulation (Input Port)
There are two types of simulations in I/O port simulation: input port simulation, and output port simulation.
Input port simulation has the following types:
- Whenever a program reads the specified port, data is input from the pre-defined data input source.
- Whenever the instruction execution cycle count exceeds the specified cycle count, data is input to the
port.
To set an input port, use the [Setup] - [Debug Environment] - [I/O Port] menu, or the SET INPORT
command in the Command window.
Up to 4096 port addresses can be specified for the input port. The data input source can be a file or a
terminal. After reading the last data from the file, the data is read again from the beginning of the file. If a
terminal is specified, the input terminal is displayed at read access to the set port.
A text file created by an ordinary text editor, or a binary file containing direct code can be used as the data
input file. When using a text file, input the input data inside commas (,). When using a binary file, select the
binary radio button in the input port dialog.
■ I/O Port Simulation (Output Port)
At output port simulation, whenever a program writes data to the specified port, writing is executed to the
data output destination.
To set an output port, either use the [Setup] - [Debug Environment] - [I/O Port] menu, or the SET OUTPORT
command in the Command window.
Up to 4096 port addresses can be set as output ports. Select either a file or terminal (Output Terminal
window) as the data output destination.
A destination file must be either a text file that can be referred to by regular editors, or a binary file. To
output a binary file, select the Binary radio button in the Output Port dialog.
Note:
The following method is not supported by high-speed simulator debugger.
• Whenever the instruction execution cycle count exceeds the specified cycle count, data is input to
the port.
Furthermore the setting of memory map is necessary to set I/O port. When deleting memory map, I/O
port is also deleted.
38
CHAPTER 2 DEPENDENCE FUNCTIONS
2.1.5
Interrupt Simulation
This section describes the interrupt simulation executed by SOFTUNE Workbench.
■ Interrupt Simulation
Simulate the operation of the MCU (including intelligent I/O service*) in response to an interrupt request.
Note that intelligent I/O service does not support any end request from the resource.
Provisions for the causes of interrupts and interrupt control registers are made by referencing data in the
install file read at simulator start up.
*: Automatic data transfer function between I/O and memory is called an intelligent I/O service. This
function allows exchange of data between memory and I/O, which was done previously by the interrupt
handling program, using DMA (Direct Memory Access). (For details, refer to the user manual for each
model.)
The methods of generating interrupts are as follows:
- Execute instructions for the specified number of cycles while the program is running (during execution
of executable commands) to generate interrupts corresponding to the specified interrupt numbers and
cancel the interrupt generating conditions.
- Continue to generate interrupts each time the number of instruction execution cycles exceeds the
specified number of cycles.
The method of generating interrupts is set by the [Setup]-[Debug environment]-[Interrupt] menu. If interrupts
are masked by the interrupt enable flag when the interrupt generating conditions are established, the
interrupts are generated after they are unmasked.
MCU operation in response to an interrupt request is also supported for the following exception handling:
- Execution of undefined instructions
- Address error in program access
(Program access to internal RAM area and internal I/O area)
- Stack area error (only for F2MC-16F)
Note:
When an external interrupt is generated while under an interrupt mask at high-speed simulator
debugger, that interrupt factor is eliminated.
39
CHAPTER 2 DEPENDENCE FUNCTIONS
2.1.6
Reset Simulation
This section describes the reset simulation executed by SOFTUNE Workbench.
■ Reset Simulation
The simulator debugger simulates the operation when a reset signal is input to the MCU using the [Debug][Reset MCU] menu and initializes the registers. The function for performing reset processing by operation of
MCU instructions (writing to RST bit in standby control register) is also supported. In this case, the reset
message (Reset) is displayed on the status bar.
40
CHAPTER 2 DEPENDENCE FUNCTIONS
2.1.7
Low-Power Consumption Mode Simulation
This section describes the low-power consumption SOFTUNE Workbench mode
simulation executed by SOFTUNE Workbench.
■ Low-Power Consumption Mode Simulation
The MCU enters the low-power consumption mode in accordance with the MCU instruction operation (Write
to SLEEP bit or STOP bit of standby control register). Once in the sleep mode or stop mode, a message
("sleep" for sleep mode, "stop" for stop mode) is displayed on the Status Bar. The loop keeps running until
either an interrupt request is generated, or the [Debug] - [Abort] menu is executed. Each cycle of the loop
increments the count by 1. During this period, I/O port processing can be operated. Writing to the standby
control register using a command is not prohibited.
41
CHAPTER 2 DEPENDENCE FUNCTIONS
2.1.8
STUB Function
This section describes the STUB function which executes commands automatically when
the breakpoint hit occurs.
■ STUB Function
The STUB function is supported so that a series of commands in the command list can automatically be
executed when a specified breakpoint is hit. The use of this function enables spot processing, such as simple
I/O simulation, external interrupt generation, and memory reprogramming, without changing the main
program. This function is effective only when the simulator debugger is used.
execution starts
Break (STUB) processing
Program execution
Breakpoint is hit
Is there a command list
in breakpoint?
Execution restarts
Yes
Process a command list in
breakpoint (execute commands).
Yes
Re-execute (is NOBREAK
specified)?
Execution stops
execution ends
■ Setting Method
The STUB function can be set by the following commands.
• Dialog
1. Breakpoint Set Dialog - [Code] tab
2. Breakpoint Set Dialog - [Data] tab
• Command
1. SET BREAK
2. SET DATABREAK
42
No
No
CHAPTER 2 DEPENDENCE FUNCTIONS
2.1.9
Break
In the simulator debugger, five types of break functions can be used. When the program
execution is aborted by each break function, the address and the break factor to do the
break are displayed.
■ Break Functions
In this simulator debugger, the following five types of break functions are supported.
• Code break
• Data break
• Trace-buffer-full break
• Guarded break
• Forced break
43
CHAPTER 2 DEPENDENCE FUNCTIONS
2.1.9.1
Code Break
It is a function that the simulator debugger aborts the program execution when the code
access specified while executing the program is done.
■ Flow of Code Break
When the program reaches the breakpoint (Immediately before an instruction memory positional is
executed), the simulator debugger does the following processing.
1) The execution of the program is aborted (Before executing the instruction).
2) When the attainment frequency is checked, and it doesn't reach the attainment frequency of the specified
breakpoint, the program execution is restarted. It moves to 3) when it reaches the attainment frequency.
3) The memory position in which execution was aborted is displayed in the status bar.
The breakpoint can be set up to 65535 points or less.
When a break occurs due to a code break, the following message is displayed on the Status Bar.
Break at [Address] by breakpoint
■ Setting Method
The code break is controlled by the following method.
• Command
- SET BREAK
Refer to "3.1 SET BREAK (type 1)" in "SOFTUNE Workbench Command Reference Manual".
• Dialog
- Breakpoint Set Dialog [Code] tab
Refer to "4.6.4 Breakpoint" in "SOFTUNE Workbench Operation Manual".
• Window
- Source window/Disassembly window
■ Notes on Code Break
There are several points to note in using code break. First, some points affecting code break are explained.
● Invalid Breakpoints
• No break occurs when a breakpoint is set at the instruction immediately after the following instructions.
F2MC-16/16L/16LX/16H: • PCB • DTB • NCC • ADB • SPB • CNR
• MOV ILM,#imm8 • AND CCR,#imm8
• OR CCR,#imm8
• POPW PS
F2MC-16F:
• PCB • DTB • NCC • ADB • SPB • CNR
• No break occurs when breakpoint set at address other than starting address of instruction.
Here are some additional points about the effects on other commands.
44
CHAPTER 2 DEPENDENCE FUNCTIONS
● Dangerous BreakPoints
• Never set a breakpoint at an address other than the instruction starting address.
• If a breakpoint is the last 1 byte of an instruction longer than 2 bytes length, and if such an address is
even, the following abnormal operation will result:
- If instruction executed by STEP command, instruction execution not aborted.
- If breakpoint specified with GO command, set at instruction immediately after such instruction, the
breakpoint does not break.
Note:
[High-speed version simulator debugger]
• When the break function is used, it is necessary to set the memory map beforehand. When the
memory map is deleted, the setting of the breakpoint is deleted.
• When the breakpoint with pass count is set to the reset vector in F2MC-16FX, hit count is cleared
after the Boot ROM file is executed. For details of the execution of the Boot ROM file, refer to "■
Setting Options in [Boot ROM] (Only MB2198)" of section "4.5.5.9 Setting Debug Options" in
"SOFTUNE Workbench Operation Manual".
45
CHAPTER 2 DEPENDENCE FUNCTIONS
2.1.9.2
Data Break
It is a function that the simulator debugger aborts the program execution when the data
access (read and write) specified while executing the program is done.
■ Flow of Data Break
The simulator debugger does the following processing when the program writes in the breakpoint or it reads
it.
1) After the execution of the instruction is completed, the execution of the program is aborted.
2) It moves to 3) when the program execution is restarted when the access frequency is checked, and it
doesn't reach the access frequency of the specified data break, and it reaches the access frequency.
3) When it reaches the access frequency and the program execution is aborted, the memory position of the
instruction in which it is writing (Or, read it) is displayed to the memory position of the data breakpoint
and the memory position in the status bar.
4) Next, the executed memory position is displayed.
The breakpoint can be set up to 65535 points or less.
When a break occurs due to a data break, the following message is displayed on the Status Bar.
Break at [Address] by databreak at Access address
■ Setting Method
The data break is controlled by the following method.
• Command
- SET DATABREAK
Refer to "3.10 SET DATABREAK (type 2)" in "SOFTUNE Workbench Command Reference
Manual".
• Dialog
- Breakpoint Set Dialog [Data] tab
Refer to "4.6.4 Breakpoint" in "SOFTUNE Workbench Operation Manual".
Note:
[High-speed version simulator debugger]
• When the break function is used, it is necessary to set the memory map beforehand. When the
memory map is deleted, the setting of the breakpoint is deleted.
• When the breakpoint with pass count is set to the reset vector in F2MC-16FX, hit count is cleared
after the Boot ROM file is executed. For details of the execution of the Boot ROM file, refer to "■
Setting Options in [Boot ROM] (Only MB2198)" of section "4.5.5.9 Setting Debug Options" in
"SOFTUNE Workbench Operation Manual".
46
CHAPTER 2 DEPENDENCE FUNCTIONS
2.1.9.3
Trace-Buffer-Full Break
It is a function to abort the program execution when the trace buffer becomes full.
■ Trace-Buffer-Full Break
It is a function to abort the program execution when the trace buffer becomes full.
When a break occurs due to a trace-buffer-full break, the following message is displayed on the Status Bar.
Break at [Address] by trace buffer full
■ Setting Method
The trace-buffer-full break is controlled by the following method.
• Command
- SET TRACE/BREAK
Refer to "4.29 SET TRACE(type 1)" in "SOFTUNE Workbench Command Reference Manual".
• Dialog
- Trace Set Dialog
Refer to "4.4.8 Trace" in "SOFTUNE Workbench Operation Manual".
47
CHAPTER 2 DEPENDENCE FUNCTIONS
2.1.9.4
Guarded Access Break
It is a function to abort the program execution when the violation to the access attribute,
doing the access, and guarded (An undefined area cannot be accessed) area are
accessed.
■ Guarded Access Break
It is a function to abort the program execution when the violation to the access attribute, doing the access,
and guarded (An undefined area cannot be accessed) area are accessed.
Guarded access break functions as follows.
• Code guarded
When the instruction execution to the area without the code attribute
• Read guarded
When read the area without the read attribute
• Write guarded
When writing it in the area without the write attribute
When a break occurs due to a guarded break, the following message is displayed on the Status Bar.
Break at [Address] by guarded access {code/read/write} at Access address
48
CHAPTER 2 DEPENDENCE FUNCTIONS
2.1.9.5
Forced Break
It is a function to abort the execution of the program compulsorily.
■ Forced Break
It is a function to abort the execution of the program compulsorily.
When a break occurs due to a forced break, the following message is displayed on the Status Bar.
Break at [Address] by command abort request
49
CHAPTER 2 DEPENDENCE FUNCTIONS
2.1.10
Measuring Execution Cycle Count
This function measures the program execution cycle count.
■ Measurement Items
Measures program execution cycle count and step counts.
● Execution Cycle Count
This is calculated based on the basic cycle count of each instruction described in the Programming Manual.
A compensation value (a, b), which is described in the list of an instruction in Programming Manual, is
calculated as 1.
The maximum measurable value varies, as shown below, whether the normal or the high-speed simulator
debugger is used.
Normal debugger:
Max. (2 to the power of 32 - 1) = 4,294,967,295 cycles
High-speed debugger:
Max. (2 to the power of 64 - 1) = 18,446,744,073,709,551,615 cycles
● Execution Step Count
Measures program execution step counts.
For both the normal simulator debugger and the high-speed simulator debugger, the maximum measurable
count is "2 to the power of 32 - 1", in other words, up to 4,294,967,295 steps.
The measurement is performed whenever a program is executed, and the measurement result displays the
following two values:
• Step counts spent on the previous program execution
• Total step counts spent on the program execution since the previous clearing
■ Displaying Measurement Results
Either of the following methods can be used to display the measurement results.
● Display by dialog
The results appear in the time measurement dialog, which can be displayed by selecting [Debug] – [Time
Measurement] menu.
For details, refer to Section "4.6.8 Time Measurement" in "SOFTUNE Workbench Operation Manual".
● Display by command
Enter the SHOW TIMER command in the command window.
For details, refer to Section "4.27 SHOW TIMER" in "SOFTUNE Workbench Command Reference Manual".
50
CHAPTER 2 DEPENDENCE FUNCTIONS
■ Clearing Measurement Results
Either of the following methods can be used to clear the measurement results.
● Operation by dialog
Click the [Clear] button in the time measurement dialog, which can be displayed by selecting [Debug] –
[Time Measurement] menu.
For details, refer to Section "4.6.8 Time Measurement" in "SOFTUNE Workbench Operation Manual".
● Clearing by command
Enter the CLEAR TIMER command in the command window.
For details, refer to Section "4.28 CLEAR TIMER" in "SOFTUNE Workbench Command Reference Manual".
Note:
Because no simulation was done on pipeline process or cache operation inside the chip, it may differ
from an actual chip for normal simulator debugger and/or high-speed simulator debugger.
51
CHAPTER 2 DEPENDENCE FUNCTIONS
2.1.11
Trace
The address and status information can be sampled during program execution to record
it in a trace buffer. This function is called a trace.
■ Trace
The address and status information can be sampled during program execution to record it in a trace buffer.
This function is called a trace. Data of the trace buffer can be used to make a detailed analysis of a program
execution history.
The trace buffer is in the form of a ring. When it becomes full, it records the next data by automatically
overwriting the buffered data at the beginning.
■ Trace Data
The simulator debugger can sample 1000 frames of trace data for the address of the executed instruction.
■ Abortion of Trace Measurement
While the trace function is enabled, data is always sampled and recorded in the trace buffer during execution
of a user program.
The program execution aborts due to a break factor such as a breakpoint, terminating the trace.
Furthermore, when the trace buffer becomes full, a program break can be invoked. This break is called a
trace buffer full break.
■ Frame Number
A number is assigned to each frame of sampled trace data. This number is called a frame number.
The frame number is used to specify the display start position of the trace buffer.
The number 0 is assigned to the last-sampled trace data. Negative values are assigned to trace data that have
been sampled before the arrival at the triggering position.
Figure 2.1-1 Frame Numbering at Tracing
.
.
.
.
-3
-2
-1
0 (Trigger point)
52
CHAPTER 2 DEPENDENCE FUNCTIONS
2.1.11.1
Setting Trace
You must set the following two items to perform a trace. After that, trace data will be
sampled with the execution of the program.
■ Setting Trace
1. Enable the trace function. This program will startup and will be enabled.
• Dialog
This is done by [Setup] - [Trace] in the trace window shortcut menu.
• Command
Enter the ENABLE TRACE command.
2. Set the trace buffer full break. When the trace buffer is full, you can make a break. When starting up this
program, it is setup for no breaks.
• Dialog
This is done using the trace window shortcut menu [Setup] - [Trace].
• Command
Enter the SET TRACE/BREAK command.
53
CHAPTER 2 DEPENDENCE FUNCTIONS
2.1.11.2
Displaying Trace Data
Data recorded in the trace buffer can be displayed.
■ Displaying Trace Data
The trace window or command window displays how much trace data is stored in the trace buffer.
• Trace window
Select [Refresh] in the trace window shortcut menu.
• Command window
Enter the SHOW TRACE command.
■ Display Format of Trace Data
There are two display formats of the trace data.
• Instruction: The instruction operation is displayed in disassembly units.
• Source: This mode only displays source lines.
■ Clearing Trace Data
Either of the following methods can be used to clear data in the trace buffer.
• Window
Select [Clear] in the trace window shortcut menu.
• Command
Enter the CLEAR TRACE command.
54
CHAPTER 2 DEPENDENCE FUNCTIONS
2.1.11.3
Searching Trace Data
The trace buffer can be searched to locate target data.
■ Searching Trace Data
The trace buffer has 1000 frames, so the target data may not be found immediately. Therefore the trace data
can be searched from data in the trace buffer by specifying an address.
■ How to Search Trace Data
Either of the following methods can be used to search the trace data.
• Window
Select [Find] in the trace window shortcut menu.
• Command
Enter the SEARCH TRACE command.
55
CHAPTER 2 DEPENDENCE FUNCTIONS
2.1.11.4
Saving Trace Data
This section explains how to save trace data.
■ Saving Trace Data
Trace data can be saved in a specified file.
The following two methods are available to save trace data: using GUI (window or dialog) and using only the
command. The same result is obtained from both methods.
● Using GUI for Saving Trace Data
1. Display the trace window.
- Select [View] - [Trace] menu.
2. Specify the name of the file in which to save trace data.
- Right-click on the trace window, and select [Save] from the shortcut menu. The [Save as] dialog
appears.
Specify the file name and where to save trace data. For details, refer to Section "4.4.8 Trace" in
"SOFTUNE Workbench Operation Manual".
● Using Command for Saving Trace Data
1. Save trace data.
- Execute the SHOW TRACE/FILE command.
For details, refer to Section "4.33 SHOW TRACE (type 3)" in "SOFTUNE Workbench Command
Reference Manual".
When additionally saving trace data in an existing file, execute the SHOW TRACE/FILE/APPEND
command.
56
CHAPTER 2 DEPENDENCE FUNCTIONS
2.1.12
Measuring Coverage
In the high-speed version simulator debugger, the C0 coverage measurement function is
provided. Use this function to confirm what percentage of an entire program has been
executed.
■ Coverage Measurement Function
When testing a program, the program is executed with various test data input and the results are checked for
correctness. When the test is finished, every part of the entire program should have been executed. If any part
has not been executed, there is a possibility that the test is insufficient.
It can confirm what percentage of the entire program executed when the coverage function for the high-speed
version simulator debugger to have is used.
In addition, details such as which addresses were not accessed can be confirmed.
In this debugger, the range to measure coverage can be set.
Please set the time base range only to the code area when you do the C0 coverage.
Moreover, the access of the variable can be examined as the variable not used is confirmed by setting the
time base range to the data area.
■ Coverage Measurement Procedures
The procedure for coverage measurement is as follows:
• Set range for coverage measurement:
SET COVERAGE
• Measuring coverage:
GO, STEP, CALL
• Displaying measurement result:
SHOW COVERAGE
■ Coverage Measurement Operation
The following operation can be made in coverage measurement:
• Load/Save of coverage data:
LOAD/COVERAGE. SAVE/COVERAGE
• Clearing coverage data:
CLEAR COVERAGE
• Canceling coverage measurement range:
CANCEL COVERAGE
57
CHAPTER 2 DEPENDENCE FUNCTIONS
2.1.12.1
Coverage Measurement Procedures
The procedure for coverage measurement is as follows:
• Set range for coverage measurement:SET COVERAGE
• Measure coverage:GO, STEP, CALL
• Display measurement result:SHOW COVERAGE
■ Setting Range for Coverage Measurement
Use the SET COVERAGE command to set the measurement range. Up to 32 ranges can be specified.
By specifying /AUTOMATIC for the command qualifier, the code area for the loaded module is set
automatically. However, the library code area is not set when the C compiler library is linked.
[Example]
>SET COVERAGE FF0000..FFFFFF
■ Measuring Coverage
When preparing for coverage measurement, execute the program.
Measurement starts when the program is executed by using the GO, STEP, or CALL command.
■ Displaying Coverage Measurement Result
To display the following coverage measurement result, use the SHOW COVERAGE command.
• Display coverage rate of total measurement area
• Displaying coverage rate of load module
• Summary of 16 addresses as one block
• Details indicating access status of each address
• Displaying coverage measurement result per source line
• Displaying coverage measurement result per machine instruction
● Displaying coverage rate of total measurement area (specify /TOTAL for the command qualifier)
>SHOW COVERAGE/TOTAL
total coverage : 82.3%
● Displaying coverage rate of load module (specify /MODULE for the command qualifier)
>SHOW COVERAGE/MODULE
sample.abs . . . . . . . . . . . . . . (84.03%)
+ - startup.asm . . . . . . . . . . . (90.43%)
+ - sample.c . . . . . . . . . . . . . (95.17%)
+ - samp.c . . . . . . . . . . . . . . (100.00%)
Displays the load modules and the coverage rate of each module.
58
CHAPTER 2 DEPENDENCE FUNCTIONS
● Summary (Specify /GENERAL for command qualifier)
>SHOW COVERAGE/GENERAL
(HEX)0X0
+1X0
+2X0
+---------------+---------------+-----address 0123456789ABCDEF0123456789ABCDEF0123456
FF0000 **3*F*.......
-----... ABCDEF
C0(%)
32.0
Display the access status of every 16 addresses
.
: No access
1 to F : Display the number accessed in 16 addresses by the hexadecimal number.
: Access all of the 16 addresses.
*
● Details (Specify /DETAIL for command qualifier)
Display one line of a
coverage rate
>SHOW COVERAGE/DETAIL FF0000
address +0
FF0000
FF0010
FF0020
.
FF0030
FF0040
FF0050
FF0060
.
FF0070
.
FF0080
.
+1
.
.
.
.
.
+2
.
.
.
.
+3
.
.
.
.
+4
.
.
.
+5
.
.
.
+6
.
.
.
+7
.
.
.
.
+8
.
.
.
.
+9
.
.
.
.
+A
.
.
.
.
+B
.
.
.
.
+C
.
.
.
.
+D
.
.
.
.
+E
.
.
.
.
+F
.
.
.
.
C0(%)
100.0
100.0
18.6
100.0
93.7
100.0
0.0
0.0
0.0
Display the access status of every 1 address
.
-
: No access
: Access
59
CHAPTER 2 DEPENDENCE FUNCTIONS
● Displays per source line (specify /SOURCE for the command qualifier)
>SHOW COVERAGE/SOURCE main
*
70: {
71:
int i;
72:
struct table *value[16];
73:
*
74:
for (i=0; i<16; i++)
*
75:
value[i] = &target[i];
76:
sort_val(value, 16L);
*
77:
.
78: }
Displays execution status of each source line.
.:
No executing
Executing
*:
Blank : Line which the code had not been generated or is outside
the scope of the coverage measurement
● Displays per machine instruction (specify /INSTRUCTION for the command qualifier)
>SHOW COVERAGE/INSTRUCTION F9028F
sample.c$70 {
* F9028F
\main:
#22
LINK
* F9028F 0822
PUSHW RW0
* F90291 4F01
sample.c$74
for (i=0; i<16; i++)
A,#0
MOVN
. F90293 D0
@RW3-02,A
MOVW
. F90294 CBFE
A,@RW3-02
MOVW
. F90296 BBFE
A,#0010
CMPW
. F90298 3B1000
F902B5
BGE
. F9029B FB18
sample.c$75
value[i] = &target[i];
A,@RW3-02
. F9029D BBFE
MOVW
A
LSLW
. F9029F 0C
RW0,A
MOVW
. F902A0 98
A,@RW3-22
MOVEA
. F902A1 71F3DE
RW0,A
ADDW
. F902A4 7700
A,#14
MOV
. F902A6 4214
MULUW A,@RW3-02
. F902A8 7833FE
A,#01A0
ADDW
. F902AB 38A001
Displays execution status of each machine command line.
.:
No executing
Executing
*:
Blank : Instruction outside the scope of the coverage measurement
60
CHAPTER 2 DEPENDENCE FUNCTIONS
2.1.13
Checking Debugger Information
This section explains how to check information about the simulator debugger.
■ Debugger Information
This simulator debugger enables you to check the following information at startup.
• SOFTUNE Workbench file information
If any errors have been discovered during SOFTUNE Workbench operations, check this information and
contact our sales department or support department.
■ How to Check
Use one of the following methods to check debugger information.
• Command
- SHOW SYSTEM
Refer to Section "1.19 SHOW SYSTEM" in "SOFTUNE Workbench Command Reference Manual".
• Dialog
- Version information dialog
Select [Help] - [Version Information] menu.
For details, refer to Section "4.9.3 Version Information" in "SOFTUNE Workbench Operation
Manual".
■ Displayed Contents
F2MC-16 Family SOFTUNE Workbench VxxLxx
ALL RIGHTS RESERVED,
COPYRIGHT(C) FUJITSU SEMICONDUCTOR LIMITED 1997
LICENCED MATERIAL PROGRAM PROPERTY OF FUJITSU SEMICONDUCTOR LIMITED
=======================================================
Cpu information file path: CPU information file path
Cpu information file version: CPU information file version
=======================================================
Add in DLLs
------------------------------------------------------SiCmn
Product name: SOFTUNE Workbench
File Path: SiC907.dll path
Version: SiC907.dll version
- - - - - - - - - - - - - - - - - - - - - - - - - - - SiiEd
File Path: SiiEd3.ocx path
Version: SiiEd3.ocx version
------------------------------------------------------SiM907
Product name: SOFTUNE Workbench
File Path: SiM907.dll path
Version: SiM907.dll version
61
CHAPTER 2 DEPENDENCE FUNCTIONS
- - - - - - - - - - - - - - - - - - - - - - - - - - - Language Tools
- F2MC-16 Family SOFTUNE C Compiler version
File Path: fcc907s.exe path
- F2MC-16 Family SOFTUNE Assembler version
File Path: fasm907s.exe path
- F2MC-16 Family SOFTUNE Linker version
File Path: flnk907s.exe path
- F2MC-16 Family SOFTUNE Librarian version
File Path: flib907s.exe path
- SOFTUNE FJ-OMF to S-FORMAT Converter version
File Path: f2ms.exe path
- SOFTUNE FJ-OMF to INTEL-HEX Converter version
File Path: f2is.exe path
- SOFTUNE FJ-OMF to INTEL-EXT-HEX Converter version
File Path: f2es.exe path
- SOFTUNE FJ-OMF to HEX Converter version
File Path: f2hs.exe path
------------------------------------------------------SiOsM
Product name: Softune Workbench
File Path: SiOsM907.dll path
Version: SiOsM907.dll version
------------------------------------------------------F2MC-16 Series Debugger DLL
Product name: SOFTUNE Workbench
File Path: SiD907.dll path
Version: SiD907.dll version
- - - - - - - - - - - - - - - - - - - - - - - - - - - Debugger type
: Current debbuger type
MCU type
: Currently selected target MCU
VCpu dll name
: Path and name of the currently used VCpu dll
VCpu dll version : Version of the currently used virtual debugger DLL
REALOS version
: REALOS version
------------------------------------------------------SiIODef
Product name: Softune Workbench
File Path: SiIODef.dll path
Version: SiIODef.dll version
=======================================================
Current path: Path of the currently used project
Language: Currently used language
Help file path: Help file path
62
CHAPTER 2 DEPENDENCE FUNCTIONS
2.2
Emulator Debugger (MB2141)
This section explains the functions of the emulator debuggers for the MB2141.
■ Emulator Debugger
When choosing the emulator debugger from the setup wizard, select one of the following emulators. The
following description explains the case when MB2141 has been selected.
MB2141
MB2147-01
MB2147-05
MB2198
The emulator debugger for the MB2141 is software that controls an emulator from a host computer via a
communications line (RS-232C or LAN) to evaluate programs.
The following series can be debugged:
When MB2141-506 pod used
F2MC-16/16H
F2MC-16F
F2MC-16L
F2MC-16LX
When MB2141-507 pod used
F2MC-16F
F2MC-16L
F2MC-16LX
Before using the emulator, the emulator must be initialized.
For further details, refer to "Appendix B Download Monitor Program", and "Appendix C Setting up LAN
Interface" in "SOFTUNE Workbench Operation Manual".
63
CHAPTER 2 DEPENDENCE FUNCTIONS
2.2.1
Setting Operating Environment
This section explains the operating environment setup.
■ Setting Operating Environment
For the emulator debugger for the MB2141, it is necessary to set the following operating environment.
Predefined default settings for all these setup items are enabled at startup. Therefore, setup is not required
when using the default settings. Adjusted settings can be used as new default settings from the next time.
- MCU operation mode
- Debug area
- Memory mapping
- Timer minimum measurement unit
64
CHAPTER 2 DEPENDENCE FUNCTIONS
2.2.1.1
MCU Operation Mode
There are two MCU operation modes as follows:
• Debugging Mode
• Native Mode
■ Setting MCU Operation Mode
Set the MCU operation mode.
There are two operation modes: the debugging mode, and the native mode. Choose either one using the SET
RUNMODE command.
At emulator start-up, the MCU is in the debugging mode.
When the MCU operation mode is changed, all the following are initialized:
- Data breakpoints
- Event condition settings
- Sequencer settings
- Trace measurement settings and trace buffer
- Performance measurement settings and measured result
● Debugging Mode
All the operations of evaluation chips can be analyzed, but their operating speed is slower than that of massproduced chips.
● Native Mode
Evaluation chips have the same timing as mass-produced chips to control the operating speed. Note that the
restrictions the shown in Table 2.2-1 are imposed on the debug functions.
Table 2.2-1 Restrictions on Debug Functions in Native Mode
Applicable series
Restrictions on debug functions
F2MC-16/16H
- Memory mapping setting is disabled and each area is accessed to the MCU
specifications.
- Traces cannot be disassembled.
Common to all series
- When a data read access occurs on the MCU internal bus, the internal bus
access information is not sampled and stored in the trace buffer.
- Even when a data break or event (data access condition) is set for data on the
MCU internal bus, it may not become a break factor or sequencer-triggering
factor.
- The coverage function may fail to detect an access to data on the MCU
internal bus.
65
CHAPTER 2 DEPENDENCE FUNCTIONS
■ MCU Operation Speed
To support a broader range of MCU operation speeds, the emulator adjusts control of the MCU according to
the MCU operation speed.
Normally, set the low-speed operation mode. If the F2MC-16H/16F series is operated at high speed and
malfunctions occur, change the setting to the high-speed operation mode.
Also, to start at low speed and then change to high speed because of the gear setting, etc., use the SET
RUNMODE command to change the setting.
66
CHAPTER 2 DEPENDENCE FUNCTIONS
2.2.1.2
Debug Area
Set the intensive debugging area out of the whole memory space. The area functions are
enhanced.
■ Setting Debug Area
There are two debug areas: DEBUG1, and DEBUG2. A continuous 512KB area (8 banks) is set for each
area.
Set the debug area using the SET DEBUG command.
Setting the debug area enhances the breakpoints/data breakpoints and the coverage measurement function.
- Enhancement of Breakpoints
Up to six breakpoints (not including temporary breakpoints set using GO command) can be set when the
debug area has not been set yet.
When setting the debug area as the CODE attribute, up to 65535 breakpoints can be set if they are within
the area. At this time, up to six breakpoints can be set for an area other than the debug area, but the total
count of breakpoints must not exceed 65535.
- Enhancement of Data Breakpoints
Up to six data breakpoints can be set when the debug area has not been set yet.
When setting the debug area of the data attribute (READ, WRITE), up to 65535 data breakpoints can be
set if they are within the area and have the same attribute. At this time, up to six data breakpoints can be
set for an area other than the area or for a different attribute, but the total number of data breakpoints must
not exceed 65535.
- Enhancement of Coverage Measurement Function
Setting the debug area enables the coverage measurement function. In coverage measurement, the
measurement range can be specified only within the area specified as the debug area.
The attributes for the debug area are "Don't care" as long as it is being used for coverage measurement.
The coverage measurement attribute can be set, regardless of the debug area attributes.
67
CHAPTER 2 DEPENDENCE FUNCTIONS
2.2.1.3
Memory Area Types
A unit in which memory is allocated is called an area. There are seven different area
types.
■ Memory Area Types
A unit to allocate memory is allocated is called an area. There are seven different area types as follows:
- User Memory Area
Memory space in the user system is called the user memory area and this memory is called the user
memory. Up to eight user memory areas can be set with no limit on the size of each area.
Access attributes can be set for each area; for example, CODE, READ, etc., can be set for ROM area, and
READ, WRITE, etc. can be set for RAM area. If the MCU attempts access in violation of these attributes,
the MCU operation is suspended and an error is displayed (guarded access break).
To set the user memory area, use the SET MAP command. The F2MC-16/16H only allows this setup in
the debugging mode.
- Emulation Memory Area
Memory space substituted for emulator memory is called the emulation memory area, and this memory is
called emulation memory.
As emulation memory area, Using MB2145-506 emulation pod, up to seven areas (including mirror area
and internal ROM area described below) each with a maximum size of 64 KB can be set. An area larger
than 64 KB can be set, but the areas are managed internally in 64 KB units.
Using MB2145-507 emulation pod, up to seven areas (including mirror area and internal ROM area
described below) each with a maximum size of 512 KB can be set.
The memory operation command can be executed for this area while executing MCU.
To set the emulation memory area, use the SET MAP command. Attributes are set as for user memory
area.
Note:
Even if the MCU internal resources are set as emulation memory area, access is made to the internal
resources. The F2MC-16/16H only allows this setup in the debugging mode.
- Mirror Area
The mirror area is a region in the emulator memory that makes copies of user memory accesses. The
memory in this area is called a mirror region.
The mirror area is used while it overlaps with a user memory area or undefined area. It is implemented by
the emulation memory. Up to five mirror areas can be defined including emulation memory areas.
Mirror areas are used to reference the user memory during on-the-fly execution (For further details, refer
to Section "2.2.4 On-the-fly Memory Access").
Mirror areas can be set using the SET MAP command. If the memory contents copy option is selected
when a mirror area is set, the contents of the mirror area are always the same contents as the user memory.
68
CHAPTER 2 DEPENDENCE FUNCTIONS
Note:
When the F2MC-16/16H is used, mirror area setup can be performed only in the debugging mode.
- Internal ROM Area
The area where the emulator internal memory is substituted for internal ROM is called the internal ROM
area, and this memory is called the internal ROM memory.
Only one internal ROM area with a size up to 128 KB can be specified. The internal ROM area is capable
to set by the "Setup Map" dialog opening by "Debugger Memory Map... " from "Setup".
Note:
The internal memory area, it is set a suitable area automatically by the selected MCU.
- Internal ROM Image Area (F2MC-16L, F2MC-16LX, F2MC-16F only)
Some types of MCUs have data in a specific area of internal ROM appearing to 00 bank. This specific
area is called the internal ROM image area.
The internal ROM image area is capable to set by the "Setup Map" dialog opening by "Debugger Memory
Map... " from "Setup". This area attribute is automatically set to READ/CODE. The same data as in the
internal ROM area appears in the internal ROM image area.
Note that the debug information is only enabled for either one (one specified when linked). To debug only
the internal ROM image area, change the creation type of the load module file.
Note:
The internal memory area, it is set a suitable area automatically by the selected MCU.
- Internal Instruction RAM Area (F2MC-16H only)
Some types of MCUs have the internal instruction RAM, and this area is called the internal instruction
RAM area.
The internal instruction RAM area, it is capable to set by the "Internal Instruction RAM area" tab in the
"Setup CPU Information" dialog (select menu "project"-"setup project...", select the "MCU" tab, and push
the "CPU Information..." button). The size must be specified to either H'100, H'200, H'400, H'800,
H'1000, H'2000 or H'4000 bytes.
Note:
The internal memory area, it is set a suitable area automatically by the selected MCU.
- Undefined Area
A memory area that does not belong to any of the areas described above is part of the user memory area.
This area is specifically called the undefined area.
The undefined area can be set to either NOGUARD area, which can be accessed freely, or GUARD area,
which cannot be accessed. Select either setup for the whole undefined area. If the area attribute is set to
GUARD, a guarded access error occurs if access to this area is attempted.
69
CHAPTER 2 DEPENDENCE FUNCTIONS
Note:
The F2MC-16/16H only allows this setup in the debugging mode.
70
CHAPTER 2 DEPENDENCE FUNCTIONS
2.2.1.4
Memory Mapping
Memory space can be allocated to the user memory, the emulation memory, etc., and the
attributes of these areas can be specified.
However, the MCU internal resources are not dependent on this mapping setup and
access is always made to the internal resources.
■ Access Attributes for Memory Areas
The access attributes shown in Table 2.2-2 can be specified for memory areas.
A guarded memory access break occurs if access is attempted in violation of these attributes while executing
a program.
When access to the user memory area and the emulation memory area is made using program commands,
such access is allowed regardless of the CODE, READ, WRITE attributes. However, access to memory with
the GUARD attribute in the undefined area, causes an error.
Table 2.2-2 Types of Access Attributes
Area
Attribute
User Memory
Emulation Memory
Undefined
Description
CODE
Instruction Execution Enabled
READ
Data Read Enabled
WRITE
Data Write Enabled
GUARD
Access Disabled
NOGUARD
No check of access attribute
When access is made to an area without the WRITE attribute by executing a program, a guarded access break
occurs after the data has been rewritten if the access target is the user memory. However, if the access target
is the emulation memory, the break occurs before rewriting. In other words, write-protection (memory data
cannot be overwritten by writing) can be set for the emulation memory area by not specifying the WRITE
attribute for the area.
This write-protection is only enabled for access made by executing a program, and is not applicable to access
by commands.
■ Creating and Viewing Memory Map
Use the following commands for memory mapping.
SET MAP:
Set memory map.
SHOW MAP:
Display memory map.
CANCEL MAP:
Change memory map setting to undefined.
71
CHAPTER 2 DEPENDENCE FUNCTIONS
[Example]
>SHOW MAP
address
attribute
000000 .. FFFFFF
noguard
type
The rest of setting area numbers
user = 8
emulation = 5
>SET MAP/USER H'0..H'1FF
>SET MAP/READ/CODE/EMULATION H'FF0000..H'FFFFFF
>SET MAP/USER H'8000..H'8FFF
>SET MAP/MIRROR/COPY H'8000..H'8FFF
>SET MAP/GUARD
>SHOW MAP
address
attribute
type
000000 .. 0001FF
read write
user
000200 .. 007FFF
guard
008000 .. 008FFF
read write
009000 .. FEFFFF
guard
FF0000 .. FFFFFF
read write code
user
emulation
mirror address area
008000 .. 008FFF
copy
The rest of setting area numbers
user = 6
emulation = 3
>
■ Internal ROM Area Setting
The [Setup Map] dialog box is displayed using [Environment] - [Debugger Memory Map] menu. You can set
the internal ROM area using the [Internal ROM Area] tab after the [Map Adding] dialog box is displayed by
clicking on the [Setting] button. Two areas can be set. Both ones require empty Emulation area to be set.
Require empty area is shown below.
(Empty space of the emulation area) (one area size)
You can specify the size up to the size shown above.
Specify the internal ROM area from the ending address H'FFFFFF (fixed) for area 1. Also, it is possible to
delete the internal ROM area.
72
CHAPTER 2 DEPENDENCE FUNCTIONS
2.2.1.5
Timer Minimum Measurement Unit
The timer minimum measurement unit affects the sequencer, the emulation timer and the
performance measurement timer.
■ Setting Timer Minimum Measurement Unit
Choose either 1 s or 100 ns as the timer minimum measurement unit for the emulator for measuring time.
The minimum measurement unit for the following timers is changed depending on this setup.
• Timer values of sequencer (timer conditions at each level)
• Emulation timer
• Performance measurement timer
Table 2.2-3 shows the maximum measurement time length of each timer when 1 s or 100 ns is selected as
the minimum measurement unit.
When the minimum measurement unit is changed, the measurement values of each timer are cleared as well.
The default setting is 1 s.
Table 2.2-3 Maximum Measurement Time Length of Each Timer
1 s selected
100 ns selected
Sequencer timer
About 16 seconds
About 1.6 seconds
Emulation timer
About 70 minutes
About 7 minutes
Performance measurement timer
About 70 minutes
About 7 minutes
Use the following commands to control timers.
SET TIMERSCALE :
Sets minimum measurement unit for timers
SHOW TIMERSCALE :
Displays status of minimum measurement unit setting for timers
[Example]
>SET TIMERSCALE/100N
>SHOW TIMERSCALE
Timer scale : 100ns
>
73
CHAPTER 2 DEPENDENCE FUNCTIONS
2.2.2
Notes on Commands for Executing Program
When using commands to execute a program, there are several points to note.
■ Notes on GO Command
For the GO command, two breakpoints that are valid only while executing commands can be set. However, it
is required to be careful in setting these breakpoints.
- Invalid Breakpoints
No break occurs when a breakpoint is set at the instruction immediately after the following instructions.
F2MC-16L/16LX/16/16H
PCB
NCC
SPB
MOV ILM,#imm8
OR CCR,#imm8
DTB
ADB
CNR
AND CCR,#imm8
POPW PS
F2MC-16F
PCB
NCC
SPB
DTB
ADB
CNR
- No break occurs when breakpoint set at address other than starting address of instruction.
- No break occurs when following two conditions met at one time.
- Instruction for which breakpoint set starts from odd-address,
- Preceding instruction longer than 2 bytes length, and breakpoint already set at last 1-byte address of
preceding instruction (This "already-set" breakpoint is an invalid breakpoint that won't break, because
it has been set at an address other than the starting address of an instruction).
74
CHAPTER 2 DEPENDENCE FUNCTIONS
- Abnormal Breakpoint
Setting a breakpoint at the instruction immediately after string instructions listed below, may cause a
break in the middle of the string instruction without executing the instruction to the end.
F2MC-16L/16LX/16/16H
MOVS
SECQ
WBTS
MOVSWI
SECQWI
MOVSD
SECQD
FILS
FILSW
MOVSW
SECQW
MOVSI
SECQI
WBTC
MOVSWD
SECQWD
FILSI
FILSWI
F2MC-16F
MOVS
SECQ
WBTS
MOVSWI
SECQWI
MOVSD
SECQD
FILS
FILSW
MOVM
MOVSW
SECQW
MOVSI
SECQI
WBTC
MOVSWD
SECQWD
FILSI
FILSWI
MOVMW
■ Notes on STEP Command
- Exceptional Step Execution
When executing the instructions listed in the notes on the GO command as invalid breakpoints and
abnormal breakpoints, such instructions and the next instruction are executed as a single instruction.
Furthermore, if such instructions are continuous, then all these continuous instructions and the next
instruction are executed as a single instruction.
- Step Execution that won't Break
Note that no break occurs after step operation when following two conditions are met at one time.
- When step instruction longer than 2 bytes and last code ends at even address
- When breakpoint already set at last address (This "already-set" breakpoint is an invalid breakpoint that
won't break, because it has been set at an address other than the starting address of an instruction.)
■ Controlling Watchdog Timer
It is possible to select "No reset generated by watchdog timer counter overflow" while executing a program
using the GO, STEP, CALL commands.
Use the ENABLE WATCHDOG, DISABLE WATCHDOG commands to control the watchdog timer.
- ENABLE WATCHDOG
: Reset generated by watchdog timer counter overflow
- DISABLE WATCHDOG
: No reset generated by watchdog timer counter overflow
The start-up default in this program is "Reset generated by watchdog timer counter overflow".
[Example]
>DISABLE WATCHDOG
>GO
75
CHAPTER 2 DEPENDENCE FUNCTIONS
2.2.3
Commands Available during Execution of User Program
This section explains the commands available during the execution of a user program.
■ Commands Available during Execution of User Program
This emulator debugger allows you to use certain commands during the execution of a user program.
For more details, see "■ Debugger" in "SOFTUNE Workbench Command Reference Manual".
The double circle indicates that it is available during the execution of a user program.
Table 2.2-4 shows the commands available during the execution of a user program.
Table 2.2-4 Commands Available during Execution of User Program
Function
Restrictions
MCU reset
-
Major Commands
1.3 RESET
Memory operation (Read/Write)
Emulation memory only operable
Read only enabled in mirror area
5.1 EXAMINE,
5.2 ENTER,
5.3 SET MEMORY,
5.4 SHOW MEMORY,
5.5 SEARCH MEMORY,
5.8 COMPARE,
5.9 FILL,
5.10 MOVE,
5.11 DUMP
Line assembly, Disassembly
Emulation memory only enabled
Mirror area, Disassembly only enabled
6.1 ASSEMBLE,
6.2 DISASSEMBLE
Displaying coverage measurement
data
Displaying event
Disabled in performance mode
4.19 SHOW COVERAGE
3.23 SHOW EVENT
Notes:
• The conditions which allow you to use the commands in Table 2.2-4 are limited to either of the
following cases when a user program is executed.
- [Debug] - [Run] - [Go] menu
- [Go] button on the debug toolbar
The commands in Table 2.2-4 cannot be used when the GO command is entered in the command
window.
• An error message appears if you enter a command that cannot be used during the execution of a
user program.
"E4404S Command error (MCU is busy)."
76
CHAPTER 2 DEPENDENCE FUNCTIONS
2.2.4
On-the-fly Memory Access
While on-the-fly, the area mapped to the emulation memory is Read/Write enabled, but
the area mapped to the user memory area is Read-only enabled.
■ Read/Write Memory while On-the-fly
The user memory cannot be accessed while on-the-fly (when execute the MCU). However, the emulation
memory can be accessed. (The using cycle-steal algorithm eliminates any negative effect on the MCU
speed.)
This emulator allows the user to use part of the emulation memory as a mirror area. The mirror area holds a
copy of the user memory. Using this mirror area makes the Read-only enabled function available while onthe-fly.
Each memory area operates as follows:
- User Memory Area
Access to the user memory is permitted only when the operation is suspended by a break.
- Emulation Memory Area
Access to the emulation memory is permitted regardless of whether the MCU is suspended, or while onthe-fly.
- Mirror Area
The emulation memory with the MIRROR setting can be set up for the user memory area to be referred to
while on-the-fly. This area is specifically called the mirror area.
As shown in Figure 2.2-1, the mirror area performs access to the user memory while the MCU is stopped,
and such access is reflected simultaneously in the emulation memory specified as the mirror area. (Read
access is also reflected in the emulation memory specified as the mirror area).
In addition, as shown in Figure 2.2-2, access to the user memory by the MCU is reflected "as it is" in the
emulation memory of the mirror area.
While on-the -fly, the user memory cannot be accessed. However, the emulation memory specified as the
mirror area can be read instead. In other words, identical data to that of the user memory can be read by
accessing the mirror area.
However, at least one time access must be allowed before the emulation memory of the mirror area has
the same data as the user memory. The following copy types allow the emulation memory of the mirror
area to have the same data as the user memory.
(1) Copying all data when setting mirror area
When, /COPY is specified with the mirror area set using the SET MAP command, the whole area is
specified, as the mirror area is copied.
(2) Copying only required portion using memory access commands
Data in the specified portion can be copied by executing a command that accesses memory.
77
CHAPTER 2 DEPENDENCE FUNCTIONS
The following commands access memory.
- Memory operation commands
SET MEMORY, SHOW MEMORY, EXAMINE, ENTER,
COMPARE, FILL, MOVE, SEARCH MEMORY, DUMP,
COPY, VERIFY
- Data load/save commands
LOAD, SAVE
Figure 2.2-1 Access to Mirror Area while MCU Suspended
Memory access
Executing
command
Emulation memory
(Mirror setting)
Reflected
MCU
operation
(Suspended)
User memory
Figure 2.2-2 On-the-fly Access to Mirror Area
Memory read
Executing
command
Emulation memory
(Mirror setting)
Reflected
MCU
operation
(Operating)
Memory access
User memory
Note:
Memory access by a bus master other than the MCU is not reflected in the mirror area.
78
CHAPTER 2 DEPENDENCE FUNCTIONS
2.2.5
Break
In this emulator debugger, seven types of break functions can be used. When the
program execution is aborted by each break function, the address and the break factor to
do the break are displayed.
■ Break Functions
In this emulator debugger, the following seven types of break functions are supported.
• Code break
• Data break
• Sequential break
• Guarded access break
• Trace-buffer-full break
• Performance-buffer-full break
• Forced break
79
CHAPTER 2 DEPENDENCE FUNCTIONS
2.2.5.1
Code Break
It is a function to abort the program execution by observing the specified address. The
break is done before an instruction the specified address is executed.
■ Code Break
It is a function to abort the program execution by observing the specified address. The break is done before
an instruction the specified address is executed. It is possible to set it in this 65535 debuggers. However, it is
necessary to set the debugging area as a code break area.
When a break occurs due to a code break, the following message is displayed on the Status Bar.
Break at [Address] by breakpoint
■ Setting Method
The code break is controlled by the following method.
• Command
- SET BREAK
Refer to "3.1 SET BREAK (type 1)" in "SOFTUNE Workbench Command Reference Manual".
• Dialog
- Breakpoints set dialog [Code] tab
Refer to "4.6.4 Breakpoint" in "SOFTUNE Workbench Operation Manual".
• Window
- Source window/Disassembly window
■ Notes on Code Break
There are several points to note in using code break. First, some points affecting code break are explained.
● Invalid Breakpoints
• No break occurs when a breakpoint is set at the instruction immediately after the following instructions.
F2MC-16/16L/16LX/16H: • PCB • DTB • NCC • ADB • SPB • CNR
• MOV ILM,#imm8
• AND CCR,#imm8
• OR CCR,#imm8
• POPW PS
F2MC-16F:
• PCB • DTB • NCC • ADB • SPB • CNR
• No break occurs when breakpoint set at address other than starting address of instruction.
• No break occurs when following two conditions met at one time.
- Instruction for which breakpoint set starts from odd-address
- Preceding instruction longer than 2 bytes length, and breakpoint already set at last 1-byte address of
preceding instruction (This "already-set" breakpoint is an invalid breakpoint that won't break, because
it has been set at an address other than the starting address of an instruction.)
80
CHAPTER 2 DEPENDENCE FUNCTIONS
● Abnormal Breakpoint
• Setting a breakpoint at the instruction immediately after string instructions listed below, may cause a
break in the middle of the string instruction without executing the instruction to the end.
F2MC-16/16L/16LX/16H: • MOVS
• MOVSI
• MOVSD
• FILS
• MOVSW
• MOVSWI
• MOVSWD
• FILSI
F2MC-16F:
• MOVMW
Above plus
• MOVM
• SECQ
• SECQI
• SECQD
• FILSW
• SECQW
• SECQWI
• SECQWD
• FILSWI
• WBTS
• WBTC
Here are some additional points about the effects on other commands.
● Dangerous Breakpoints
Never set a breakpoint at an address other than the instruction starting address. If a breakpoint is the last 1
byte of an instruction longer than 2 bytes length, and if such an address is even, the following abnormal
operation will result:
- If instruction executed by STEP command, instruction execution not aborted.
- If breakpoint specified with GO command, set at instruction immediately after such instruction, the
breakpoint does not break.
Note:
When the debugging area is set again, all breakpoints in the area are cleared.
81
CHAPTER 2 DEPENDENCE FUNCTIONS
2.2.5.2
Data Break
The data break is a function to abort the program execution when the data access (read
or write) is done to the address specified while executing the program.
■ Data Break
The data break is a function to abort the program execution when MCU accesses data as for a specified
address.
When a break occurs due to a data break, the following message is displayed on the Status Bar.
Break at [Address] by databreak at Access address
The number to which the data break can be set is as follows.
In debugging area of data attribute: 65535 pieces
Other areas:6 pieces
■ Setting Method
The data break is controlled by the following method.
• Command
- SET DATABREAK
Refer to "3.10 SET DATABREAK (type 2)" in "SOFTUNE Workbench Command Reference
Manual".
• Dialog
- Breakpoints set dialog [Data] tab
Refer to "4.6.4 Breakpoint" in "SOFTUNE Workbench Operation Manual".
Note:
When the debugging area is set again, all breakpoints in the area are cleared.
82
CHAPTER 2 DEPENDENCE FUNCTIONS
2.2.5.3
Sequential Break
A sequential break is a function to abort a executing program, when the sequential
condition is met by event sequential control.
■ Sequential Break
It is a function to discontinue the program execution when the sequential condition consists by the sequential
control of the event. Use a sequential break when the event mode is set to normal mode using the SET
MODE command.
When a break occurs due to a sequential break, the following message is displayed on the Status Bar.
Break at [Address] by sequential break (level = Level No.)
For details of the sequential break function, refer to Section "2.2.7 Control by Sequencer".
■ Setting Method
The sequential break is controlled by the following method.
1. Set event mode (SET MODE)
2. Set events (SET EVENT)
3. Set sequencer (SET SEQUENCE)
83
CHAPTER 2 DEPENDENCE FUNCTIONS
2.2.5.4
Guarded Access Break
The guarded access break is an abortion of the program execution that happens when
the violation to the set access attribute, doing the access, and guarded (An undefined
area cannot be accessed) area are accessed.
■ Guarded Access Break
A guarded access break aborts a executing program when access is made in violation of the access attribute
set by using the [Setup] - [Memory Map] menu, and access is attempted to a guarded area (access-disabled
area in undefined area).
There are three types of the following in Guarded access break.
Code guarded
When the instruction execution is done to the area without the code attribute, the break is done.
Read guarded
When the area without the read attribute is read, the break is done.
Write guarded
When the area without the write attribute is write, the break is done.
If a guarded access occurs while executing a program, the following message is displayed on the Status Bar
and the program is aborted.
Break at [Address] by guarded access {code/read/write} at Access address
Note:
Code Guarded is affected by pre-fetching.
The F2MC-16L/16LX/16/16H family pre-fetch up to 4 bytes. So, when setting the program area
mapping, set a little larger area (5 bytes max.) than the program area actually used.
Similarly, the F2MC-16F family pre-fetch up to 8 bytes. So, when setting the program area mapping,
set a little larger area (9 bytes max.) than the program area actually used.
84
CHAPTER 2 DEPENDENCE FUNCTIONS
2.2.5.5
Trace-Buffer-Full Break
It is a function to abort the program execution when the trace buffer becomes full.
■ Trace-Buffer-Full Break
It is a function to abort the program execution when the trace buffer becomes full.
When a break occurs due to a trace-buffer-full break, the following message is displayed on the Status Bar.
Break at [Address] by trace buffer full
■ Setting Method
The trace-buffer-full break is controlled by the following method.
• Command
- SET TRACE/BREAK
Refer to "4.29 SET TRACE (type 1)" in "SOFTUNE Workbench Command Reference Manual".
• Dialog
- Trace Set Dialog
Refer to "4.4.8 Trace" in "SOFTUNE Workbench Operation Manual".
85
CHAPTER 2 DEPENDENCE FUNCTIONS
2.2.5.6
Performance-Buffer-Full Break
It is a function to abort the program execution when the buffer for the performance
measurement data storage becomes full.
■ Performance-Buffer-Full Break
It is a function to abort the program execution when the buffer for the performance measurement data storage
becomes full.
When a break occurs due to a performannce-buffer-full break, the following message is displayed on the
Status Bar.
Break at [Address] by performance buffer full
■ Setting Method
The performance-buffer-full break is controlled by the following method.
• Command
- SET PERFORMANCE/BREAK
Refer to "4.7 SET PERFORMANCE (type 1)" in "SOFTUNE Workbench Command Reference
Manual".
• Dialog
- Performance set dialog
Refer to "4.4.13 Performance" in "SOFTUNE Workbench Operation Manual".
86
CHAPTER 2 DEPENDENCE FUNCTIONS
2.2.5.7
Forced Break
It is a function to abort the execution of the program compulsorily.
■ Forced Break
It is a function to abort the execution of the program compulsorily.
When a break occurs due to a forced break, the following message is displayed on the Status Bar.
Break at [Address] by command abort request
Note:
A forced break is not allowed while the MCU is in the low-power consumption mode or hold state.
When a forced break is requested by the [Debug] - [Abort] menu while executing a program, the menu
is disregarded if the MCU is in the low-power consumption mode or hold state. If a break must occur,
then reset the cause at user system side, or reset the cause by using the [Debug] - [Reset MCU]
menu, after inputting the [Debug] - [Abort] menu.
When the MCU enters the low-power consumption mode or hold state while executing, the status is
displayed on the Status Bar.
87
CHAPTER 2 DEPENDENCE FUNCTIONS
2.2.6
Events
The emulator can monitor the MCU bus operation, and generate a trigger at a specified
condition called an event.
In this emulator, event triggers are used in order to determine which function event
triggers are used accounting to event modes for the following functions;
• Sequencer
• Sampling condition for multi-trace
• Measuring point in performance measurement
■ Setting Events
Eight events or less can be set.
Table 2.2-5 shows the conditions that can be set for events.
Table 2.2-5 Conditions for Setting Events
Condition
Description
Address
Memory location (Address bit masking enabled)
Data
8-bit data (data bit masking enable)
NOT specified enable
Status
Select from among dada read, data write, instruction execution and data
modify.
External Probe
8-bit data (bit masking enable)
Notes:
• In instruction execution, an event trigger is generated only when an instruction is executed. This
status cannot be specified concurrently with other status.
• The data modify is a function to generate the event trigger when the data of a specified address
rewrites. When the data modify is specified for status, the data specification is disregarded. This
status cannot be specified concurrently with other status.
Use the following commands to set an event.
88
SET EVENT:
Sets event
SHOW EVENT:
Display event setup status
CANCEL EVENT:
Deletes event
ENABLE EVENT:
Enable event
DISABLE EVENT:
Disable event
CHAPTER 2 DEPENDENCE FUNCTIONS
[Example]
>SET EVENT
1,func1
>SET EVENT/WRITE 2,data[2],!d=h'10
>SET EVENT/MODIFY 3,102
An event can be set in the Event window as well.
■ Event Modes
There are three event modes as listed below. To determine which function event triggers are used for, select
one using the SET MODE command. The default is normal mode.
The event value setting are made for each mode, so switching the event mode changes the event settings as
well.
- Normal Mode
Event triggers used for sequencer.
Since the sequencer can perform control at 8 levels, it can control sequential breaks, time measurement
and trace sampling. Real-time tracing in the normal mode is performed by single trace (tracing function
that samples program execution continuously).
- Multi Trace Mode
Event triggers used for multitracing (trace function that samples data before and after event trigger
occurrence).
- Performance Mode
Event triggers are used for performance measurement to measure time duration between two event trigger
occurrences and count of event trigger occurrences.
89
CHAPTER 2 DEPENDENCE FUNCTIONS
2.2.6.1
Operation in Normal Mode
As shown in the figure below, the event trigger set in the normal mode performs input to
the sequencer. In the sequencer, either branching to any level, or terminating the
sequencer, can be specified as an operation at event trigger occurrence. This enables
debugging (breaks, limiting trace, measuring time) while monitoring program flow.
■ Operation in Normal Mode
The termination of sequencer triggers the delay counter. When the delay counter reaches the specified count,
sampling for the single trace terminates. A break normally occurs at this point, but if necessary, the program
can be allowed to run on without a break.
Figure 2.2-3 Operation in Normal Mode
DISABLE TRACE
SHOW TRACE/STATUS
SET TRACE
ENABLE TRACE
Enable/Disable
control
SHOW TRACE/DATA
SET SEQUENCE/NO TRACE
SET SEQUENCE/ENABLE TRACE
CLEAR TRACE
SET SEQUENCE/DISABLE TRACE
SET EVENT
CANCEL EVENT
Enable
Disable
Enable/Disable
control
Measurement ends
CANCEL
SEQUENCE/TIMER
SET
SEQUENCE/TIMER
Events
Single trace measurement
SEARCH TRACE
SHOW SEQUENCE level
Buffer-full break
control
Select event number causing
trigger at each level, set
pass count value.
When each condition at each level met
Timer setup
for each
condition
When count ends
When condition met
Delay
counter
Sequencer
When count ends
SET
SEQUENCE/EVENT
DISABLE EVENT
Timer latch
CANCEL
SEQUENCE/EVENT
SHOW SEQUENCE/ALL
ENABLE EVENT
SHOW EVENT
90
Instructing MCU to
suspend operation
SHOW DELAY
SET DELAY
CHAPTER 2 DEPENDENCE FUNCTIONS
■ Event-related Commands in Normal Mode
Since the real-time trace function in the normal mode is actually the single trace function, the commands can
be used to control.
Table 2.2-6 shows the event-related commands that can be used in the normal mode.
Table 2.2-6 Event-related Commands in Normal Mode
Mode
Normal Mode
Usable Command
Function
SET EVENT
SHOW EVENT
CANCEL EVENT
ENABLE EVENT
DISABLE EVENT
Set event
Displays event setup status
Delete event
Enables event
Disables event
SET SEQUENCE
SHOW SEQUENCE
CANCEL SEQUENCE
ENABLE SEQUENCE
DISABLE SEQUENCE
Sets sequencer
Displays sequencer setup status
Cancels sequencer
Enables sequencer
Disables sequencer
SET DELAY
SHOW DELAY
Sets delay count
Displays delay count setup status
SET TRACE
SHOW TRACE
SEARCH TRACE
ENABLE TRACE
DISABLE TRACE
CLEAR TRACE
Sets trace buffer-full break
Displays trace data
Searches trace data
Enables trace function
Disables trace function
Clears trace data
91
CHAPTER 2 DEPENDENCE FUNCTIONS
2.2.6.2
Operation in Multi Trace Mode
When the multi trace mode is selected as the event mode, the real-time trace function
becomes the multi trace function, and events are used as triggers for multitracing.
■ Operation in Multi Trace Mode
Multitracing is a trace function that samples data before and after an event trigger occurrence. When the
multi trace mode is selected as the event mode, the real-time trace function becomes the multi trace function,
and events are used as triggers for multitracing.
Figure 2.2-4 Operation in Multi Trace Mode
SHOW MULTITRACE/STATUS
SET EVENT
ENABLE MULTITRACE
SET MULTITRACE
CANCEL EVENT
DISABLE MULTITRACE
Enable/Disable control
Enable
Events
Disable
All enabled events
generate trigger
DISABLE EVENT
Buffer full break control
Multitrace measurement
CLEAR MULTITRACE
ENABLE EVENT
SHOW MULTITRACE
SHOW EVENT
92
Instructing
MCU to
suspend
operation
SEARCH MULTITRACE
CHAPTER 2 DEPENDENCE FUNCTIONS
■ Event-related Commands in Multi Trace Mode
Table 2.2-7 shows the event-related commands that can be used in the multi-race mode.
Table 2.2-7 Event-related Commands in Multi Trace Mode
Mode
Multi Trace Mode
Usable Command
Function
SET EVENT
SHOW EVENT
CANCEL EVENT
ENABLE EVENT
DISABLE EVENT
Sets event
Displays event setup status
Deletes event
Enables event
Disables event
SET MULTITRACE
SHOW MULTITRACE
SEARCH MULTITRACE
ENABLE MULTITRACE
DISABLE MULTITRACE
CLEAR MULTITRACE
Sets trace buffer-full break
Displays trace data
Searches trace data
Enables trace function
Disables trace function
Clears trace data
93
CHAPTER 2 DEPENDENCE FUNCTIONS
2.2.6.3
Operation in Performance Mode
Event triggers set in the performance mode are used to measure performance. The time
duration between two event occurrences can be measured and the event occurrences
can be counted.
■ Operation in Performance Mode
The event triggers that are set in the performance mode are used to measure performance. The time duration
between two event occurrences can be measured and the event occurrences can be counted.
Figure 2.2-5 Operation in Performance Mode
SHOW PERFORMANCE/STATUS
SET EVENT
SET PERFORMANCE
CANCEL EVENT
Buffer full break control
Enable
Events
Disable
Limited to following
combinations:
1,2 3,4 5,6 7,8
DISABLE EVENT
Performance measurement
CLEAR PERFORMANCE
ENABLE EVENT
SHOW PERFORMANCE
SHOW EVENT
94
Instructing
MCU to
suspend
operation
CHAPTER 2 DEPENDENCE FUNCTIONS
■ Event-related Commands in Performance Mode
Table 2.2-8 shows the event-related commands that can be used in the performance mode.
Table 2.2-8 Event-related Commands in Performance Mode
Mode
Performance Mode
Usable Command
Function
SET EVENT
SHOW EVENT
CANCEL EVENT
ENABLE EVENT
DISABLE EVENT
Sets event
Displays event setup status
Deletes event
Enables event
Disables event
SET PERFORMANCE
SHOW PERFORMANCE
CLEAR PERFORMANCE
Sets performance
Displays performance setup status
Clears performance measurement data
95
CHAPTER 2 DEPENDENCE FUNCTIONS
2.2.7
Control by Sequencer
This emulator has a sequencer to control events. By using this sequencer, sampling of
breaks, time measurement and tracing can be controlled while monitoring program flow
(sequence). A break caused by this function is called a sequential break.
To use this function, set the event mode to normal mode using the SET MODE command.
Use the SET EVENT command to set events.
■ Control by Sequencer
As shown in Table 2.2-9, controls can be made at 8 different levels.
At each level, 8 events and 1 timer condition (9 conditions in total) can be set.
A timer condition is met when the timer count starts at entering a given level and the specified time is
reached.
For each condition, the next operation can be specified when the condition is met. Select any one of the
following.
- Move to required level.
- Terminate sequencer.
The conditions set for each level are determined by OR. Therefore, if any one condition is met, the sequencer
either moves to the required level, or terminates. In addition, trace sampling abort/resume can be controlled
when a condition is met.
Table 2.2-9 Sequencer Specifications
Function
Specifications
Level count
8 levels
Conditions settable for each level
8 event conditions (1 to 16777216 times pass count can be
specified for each condition.)
1 timer condition (Up to 16 s. in 1 s units or up to 1.6 s. in 100 ns
units can be specified.*)
Operation when condition met
Branches to required level or terminates sequence.
Controls trace sampling.
Other function
Timer latch enable at level branching
Operation when sequencer terminates
Starts delay counter
*: The minimum measurement unit for Timer value can be set to either 1 s or 100 ns using the SET
TIMERSCALE command.
96
CHAPTER 2 DEPENDENCE FUNCTIONS
2.2.7.1
Setting Sequencer
The sequencer operates in the following order:
(1) The sequencer starts from level 1 simultaneously with the start of program executing.
(2) Depending on the setting at each level, branching to the required level is performed
when the condition is met.
(3) When sequencer termination is specified, the sequencer terminates when the
condition is met.
(4) When the sequencer terminates, the delay counter starts counting.
■ Setting Sequencer
Figure 2.2-6 shows the sequencer operation.
Figure 2.2-6 Operation of Sequencer
Start executing program. (Start sequencer.)
Set Conditions
Operation when Condition Met
[Use event number 1-]
[Pass counter]
[Trace control] / [Branch level number]
[Use event number 2-]
[Pass counter]
[Trace control] / [Branch level number]
[Use event number 3-]
[Pass counter]
[Trace control] / [Branch level number]
[Use event number 4-]
[Pass counter]
[Trace control] / [Branch level number]
[Use event number 5-]
[Pass counter]
[Trace control] / [Branch level number]
[Use event number 6-]
[Pass counter]
[Trace control] / [Branch level number]
[Use event number 7-]
[Pass counter]
[Trace control] / [Branch level number]
[Use event number 8-]
[Pass counter]
[Trace control] / [Branch level number]
Timer condition [Waiting time]
[Trace control] / [Branch level number]
Terminat
sequencer
Branch to specified level.
Start delay
97
CHAPTER 2 DEPENDENCE FUNCTIONS
[Setup Examples]
- Terminate sequencer when event 1 occurs.
>SET SEQUENCE/EVENT 1,1,J=0
- Terminate sequencer when event 2 occurs 16 times.
>SET SEQUENCE/EVENT 1,2,16,J=0
- Terminate sequencer when event 2 occurs after event 1 occurred. However, do not terminate sequencer
if event 3 occurs between event 1 and event 2.
>SET SEQUENCE/EVENT 1,1,J=2
>SET SEQUENCE/EVENT 2,2,J=0
>SET SEQUENCE/EVENT 2,3,J=1
- Terminate sequencer if and when event 2 occurs less than 300 s after event 1 occurred.
>SET SEQUENCE/EVENT 1,1,J=2
>SET SEQUENCE/EVENT 2,2,J=0
>SET SEQUENCE/TIMER 2,300,J=1
>SHOW SEQUENCE
Sequencer Enable
level1
Indicates
move to level
2 when event
1 occurs at
level 1
level2
level3
level4
level5
level6
level7
level8
1 |1|->2
| |
| |
| |
| |
| |
| |
| |
2 | |
|2|->end | |
| |
| |
| |
| |
| |
3 | |
| |
| |
| |
| |
| |
| |
| |
4 | |
| |
| |
| |
| |
| |
| |
| |
5 | |
| |
| |
| |
6 | |
| |
| |
| |
7 | |
| |
| |
| |
| |
| |
| |
| |
8 | |
| |
| |
| |
| |
| |
| |
| |
T | |
|T|->1
| |
| |
| |
| |
| |
| |
Indicate s terminating
| |
| |event 2 | |
sequencer
when
occurs
| |at level|2.|
| |
Latch 1 ( -> ) =
| |
| |
Latch 2 ( -> ) =
>SHOW SEQUENCE 2
level no. = 2
98
Indicates move to level 1 if and
when 300
μs passed before
jmp-level1
event 2 occurs at level 2
event
pass-count
2
1
enable
end
timer
00:00:000:300:000
enable
1
trace-cnt1
CHAPTER 2 DEPENDENCE FUNCTIONS
2.2.7.2
Break by Sequencer
A program can suspend program execution when the sequencer terminates. This break
is called a sequential break.
■ Break by Sequencer
A program can suspend program execution when the sequencer terminates. This break is called a sequential
break.
As shown in Figure 2.2-7, the delay count starts when the sequencer terminates, and after delay count ends,
either "break" or "not break but tracing only terminates" is selected as the next operation.
To make a break immediately after the sequencer terminates, set delay count to 0 and specify "Break after
delay count terminates". Use the SET DELAY command to set the delay count and the operation after the
delay count.
The default is delay count 0, and Break after delay count.
Figure 2.2-7 Operation when sequencer terminates
Tracing terminates
Break (Sequential break)
Sequencer
terminates
Delay
counter
Count ends
Tracing terminates
Not break
[Examples of Delay Count Setups]
- Break when sequencer terminates.
>SET DELAY/BREAK 0
- Break when 100-bus-cycle tracing done after sequencer terminates.
>SET DELAY/BREAK 100
- Terminate tracing, but do not break when sequencer terminates.
>SET DELAY/NOBREAK 0
- Terminate tracing, but do not break when 100-bus-cycle tracing done after sequencer terminates.
>SET DELAY/NOBREAK 100
99
CHAPTER 2 DEPENDENCE FUNCTIONS
2.2.7.3
Trace Sampling Control by Sequencer
When the event mode is in the normal mode, real-time trace executing tracing called
single trace.
If the trace function is enabled, single trace samples all the data from the start of
executing a program until the program is suspended.
■ Trace Sampling Control by Sequencer
Sets up suspend/resume trace sampling for each condition at each level of the sequencer. Figure 2.2-8 shows
the trace sampling flow.
For example, it is possible to suspend trace sampling when event 1 occurs, and then resume trace sampling
when event 2 occurs. Trace data sampling can be restricted.
Figure 2.2-8 Trace Sampling Control (1)
Start
Suspend
Resume
Suspend
Resume
Suspend
Program flow
Trace buffer
As shown in Figure 2.2-9, trace sampling can be disabled during the period from the start of a program
execution until the first condition occurs. For this setup, use the GO command or the SET GO command.
[Example]
>GO/DISABLETRACE
>SET GO/DISABLETRACE
>GO
Figure 2.2-9 Trace Sampling Control (2)
Resume
Start
Suspend Resume
Suspend
Resume
Suspend
Program flow
Trace buffer
100
CHAPTER 2 DEPENDENCE FUNCTIONS
[Setup Example]
Suspend trace sampling when event 1 occurs, and then resume at event 2 and keep sampling data until
event 3 occurs.
Start
Level 1
Event 1
occurs
NO
YES
Suspend trace sampling.
Level 2
Event 2
occurs
NO
YES
Resume trace sampling.
Level 3
Event 3
occurs
NO
YES
Suspend trace sampling.
>SET SEQUENCE/EVENT/DISABLETRACE 1,1,J=2
>SET SEQUENCE/EVENT/ENABLETRACE 2,2,J=3
>SET SEQUENCE/EVENT/DISABLETRACE 3,3,J=2
101
CHAPTER 2 DEPENDENCE FUNCTIONS
2.2.7.4
Time Measurement by Sequencer
Time can be measured using the sequencer. A time measurement timer called the
emulation timer is used for this purpose. When branching is made from a specified level
to another specified level, a timer value is specified. Up to two emulation timer values can
be fetched. This function is called the timer latch function.
■ Time Measurement by Sequencer
The time duration between two given points in a complex program flow can be measured using the timer
latch function.
The timing for the timer latch can be set using the SET SEQUENCE command; the latched timer values can
be displayed using the SHOW SEQUENCE command.
When a program starts execution, the emulation timer is initialized and then starts counting. Select either 1 s
or 100 ns as the minimum measurement unit for the emulation timer. Set the measurement unit using the SET
TIMESCALE command.
When 1 s is selected, the maximum measured time is about 70 minutes; when 100 ns is selected, the
maximum measured time is about 7 minutes. If the timer overflows during measurement, a warning message
is displayed when the timer value is displayed using the SHOW SEQUENCE command.
102
CHAPTER 2 DEPENDENCE FUNCTIONS
2.2.7.5
Sample Flow of Time Measurement by Sequencer
In the following sample, when events are executed in the order of Event 1, Event 2 and
Event 3, the execution time from the Event 1 to the Event 3 is measured. However, no
measurement is made if Event 4 occurs anywhere between Event 1 and Event 3.
■ Sample Flow of Time Measurement by Sequencer
Start
Level 1
NO
Event 1
occurs
YES
Branch from level 1 to level 2 (Timer latch 1)
Level 2
YES
Event 4
occurs
NO
Event 2
occurs
YES
Level 3
YES
Event 4
occurs
NO
Event 3
occurs
YES
Sequencer terminates at level 3 (Timer latch 2)
End
103
CHAPTER 2 DEPENDENCE FUNCTIONS
>SET SEQUENCE/EVENT
1,1,J=2
>SET SEQUENCE/EVENT
2,4,J=1
>SET SEQUENCE/EVENT
2,2,J=3
>SET SEQUENCE/EVENT
3,4,J=1
>SET SEQUENCE/EVENT
3,2,J=0
>SET SEQUENCE/LATCH
1,1,2
>SET SEQUENCE/LATCH
2,3,0
Indicates that, if event 3
occurs at level 3, the
sequencer terminates and
let the timer latched.
>SHOW SEQUENCE
Sequencer Enable
Indicates
that, if event
1 occurs at
level 1, move
to level 2 and
let the timer
latched.
level1
level2
level3
level4
level5
level6
level7
level8
1 |1|#>2
| |
| |
| |
| |
| |
| |
| |
2 | |
|2|->3
| |
| |
| |
| |
| |
| |
3 | |
| |
|3|#end
| |
| |
| |
| |
| |
4 | |
|4|->1
|4|->1
| |
| |
| |
| |
| |
5 | |
| |
| |
| |
| |
| |
| |
| |
6 | |
| |
| |
| |
| |
| |
| |
| |
7 | |
| |
| |
| |
| |
| |
| |
| |
8 | |
| |
| |
| |
| |
| |
| |
| |
T | |
|T|->1
| |
| |
| |
| |
| |
| |
Latch 1 (1->2) = 00m02s060ms379.0μs
Latch 2 (3->E) = 00m16s040ms650.0μs
Indicate time values of timer latch 1 and timer latch 2. The time
value, deducting the value of the timer latch 1 from the value of the
timer latch 2, represents the execution time.
Time is displayed in the following format.
104
00 m
00 s 000 ms
minutes
seconds
milliseconds
000.0 μs
microseconds
CHAPTER 2 DEPENDENCE FUNCTIONS
2.2.8
Real-time Trace
While execution a program, the address, data and status information, and the data
sampled by an external probe can be sampled in machine cycle units and stored in the
trace buffer. This function is called real-time trace.
In-depth analysis of a program execution history can be performed using the data
recorded by real-time trace.
There are two types of trace sampling: single trace, which traces from the start of
executing the program until the program is suspended, and multi trace, which starts
tracing when an event occurs.
■ Trace Buffer
The data recorded by sampling in machine cycle units, is called a frame.
The trace buffer can store 32K frames (32768). Since the trace buffer has a ring structure, when it becomes
full, it automatically returns to the start to overwrite existing data.
■ Trace Data
Data sampled by the trace function is called trace data.
The following data is sampled:
• Address
• Data
• Status Information
- Access status: Read/Write/Internal access, etc.
- Device status: Instruction execution, Reset, Hold, etc.
- Queue status: Count of remaining bytes of instruction queue, etc.
- Data valid cycle information: Data valid/invalid
(Since the data signal is shared with other signals, it does not always output data. Therefore, the trace
samples information indicating whether or not the data is valid.)
• External probe data
• Sequencer execution level
■ Data Not Traced
The following data does not leave access data in the trace buffer.
- Data after tool hold
The F2MC-16/16L/16LX/16H/16F family execute the following operation immediately after a break, etc.,
lets MCU suspend (a tool hold). This data is not displayed because it is deleted from the trace buffer.
- Access to address 100
- Access to FFFFDC to FFFFFF
- Portion of access data while native mode.
When operating in the native mode, the F2MC-16/16L/16LX/16H/16F family of chips sometime performs
simultaneous multiple bus operations internally. However, in this emulator, monitoring of the internal
ROM bus takes precedence. Therefore, other bus data being accessed simultaneously may not be sampled
(in the debugging mode, all operations are sampled).
105
CHAPTER 2 DEPENDENCE FUNCTIONS
2.2.8.1
Single Trace
The single trace traces all data from the start of executing a program until the program is
aborted.
■ Function of Single Trace
The single trace is enabled by setting the event mode to normal mode using the SET MODE command.
The single trace traces all data from the start of executing a program until the program is suspended.
If the real-time trace function is enabled, data sampling continues execution to record the data in the trace
buffer while the GO, STEP, CALL commands are being executed.
As shown in Figure 2.2-10, suspend/resume trace sampling can be controlled by the event sequencer. Since
the delay can be set between the sequencer terminating the trigger and the end of tracing, the program flow
after an given event occurrence can be traced. The delay count is counted in pass cycle units, so it matches
the sampled trace data count. However, nothing can be sampled during the delay count if trace sampling is
suspended when the sequencer is terminated.
After the delay count ends, a break occurs normally due to the sequential break, but tracing can be terminated
without a break.
Furthermore, a program can be allowed to break when the trace buffer becomes full. This break is called a
trace-buffer-full break.
Figure 2.2-10 Sampling in Single Trace
Delay counter
Sequencer
Suspend
sampling
Resume
sampling
Sequencer terminates
Trigger
Tracing
terminates
Start program
Program flow
Trace buffer
Delay
106
CHAPTER 2 DEPENDENCE FUNCTIONS
■ Frame Number and Step Number in Single Trace
The sampled trace data is numbered in frame units. This number is called the frame number.
When displaying trace data, the starting location in the trace buffer can be specified using the frame number.
The trace data at the point where the sequencer termination trigger occurs is numbered 0; trace data sampled
before reaching the trigger point is numbered negatively, and the data sampled after the trigger point is
numbered positively (See Figure 2.2-11).
If there is no sequencer termination trigger point available, the trace data sampled last is numbered 0.
Figure 2.2-11 Frame Number in Single Trace
.
.
.
-3
-2
-1
0 (Trigger point)
+1
+2
+3
.
Delayed frames
.
.
This program can analyze the single trace result and sort the buffer data in execution instruction units (only
when the MCU execution mode is the debugging mode).
In this mode, the following information is grouped as one unit, and each information unit is numbered. This
number is called the step number.
- Execution instruction mnemonic information
- Data access information
- Device status information
The step number at the sequencer termination trigger is numbered 0; information sampled before reaching the
trigger point is numbered negatively, and information sampled after the trigger point is numbered positively.
If there is no sequencer termination trigger point, the information sampled last is numbered 0.
107
CHAPTER 2 DEPENDENCE FUNCTIONS
2.2.8.2
Setting Single Trace
The following settings (1) to (4) are required before executing single trace. Once these
settings have been made, trace data is sampled when a program is executed.
(1) Set event mode to normal mode.
(2) Enable trace function.
(3) Set events, sequencer, and delay count.
(4) Set trace-buffer-full break.
■ Setting Single Trace
The following settings are required before executing single trace. Once these settings have been made, trace
data is sampled when a program is executed.
(1) Set event mode to normal mode.
Use SET MODE command to make this setting.
(2) Enable trace function.
Use the ENABLE TRACE command. To disable the function, use the DISABLE TRACE command. The
default is Enable.
(3) Set events, sequencer, and delay count.
Trace sampling can be controlled by setting the sequencer for events. If this function is not needed, there
is no need of this setting.
To set events, use the SET EVENT command. To set the sequencer, use the SET SEQUENCE command.
Furthermore, set the delay count between sequencer termination and trace ending, and the break operation
(Break or Not Break) when the delay count ends. If the data after event occurrence is not required, there is
no need of this setting.
If Not Break is set, the trace terminates but no break occurs. To check trace data on-the-fly, use this setup
by executing the SET DELAY command.
Note:
When the sequencer termination causes a break (sequential break), the last executed machine cycle
is not sampled.
108
CHAPTER 2 DEPENDENCE FUNCTIONS
(4) Set trace-buffer-full break.
The program can be allowed to break when the trace buffer becomes full. Use the SET TRACE command
for this setting. The default is Not Break. Display the setup status using the SHOW TRACE/STATUS
command.
Table 2.2-10 lists trace-related commands that can be used in the single trace function.
Table 2.2-10 Trace-related Commands That Can Be Used in The Single Trace Function
Usable Command
Function
SET EVENT
SHOW EVENT
CANCEL EVENT
ENABLE EVENT
DISABLE EVENT
Sets events
Displays event setup status
Deletes event
Enables event
Disables event
SET SEQUENCE
SHOW SEQUENCE
CANCEL SEQUENCE
ENABLE SEQUENCE
DISABLE SEQUENCE
Sets sequencer.
Displays sequencer setting status
Cancels sequencer
Enables sequencer
Disables sequencer
SET DELAY
SHOW DELAY
Sets delay count value, and operation after delay
Displays delay count setting status
SET TRACE
SHOW TRACE
SEARCH TRACE
ENABLE TRACE
DISABLE TRACE
CLEAR TRACE
Sets trace-buffer-full break
Displays trace data
Searches trace data
Enables trace function
Disables trace function
Clears trace data
109
CHAPTER 2 DEPENDENCE FUNCTIONS
2.2.8.3
Multi trace
The multi trace samples data where an event trigger occurs for 8 frames before and after
the event trigger.
■ Multi Trace Function
Execute multi trace by setting the event mode to the multi trace mode using the SET MODE command.
The multi trace samples data where an event trigger occurs for 8 frames before and after the event trigger.
It can be used for tracing required only when a certain variable access occurs, instead of continuous tracing.
The trace data sampled at one event trigger (16 frames) is called a block. Since the trace buffer can hold 32K
frames, up to 2048 blocks can be sampled. Multi trace sampling terminates when the trace buffer becomes
full. At this point, a executing program can be allowed to break if necessary.
Figure 2.2-12 Multi Trace Sampling
Start
execution
Event 1
Event 2
Event 3
↓
↓
↓
↓
Program flow
Trace buffer
Block
■ Multi Trace Frame Number
Sixteen frames of data are sampled each time an event occurs. This data unit is called a block, and each
sampled block is numbered starting from 0. This is called the block number.
A block is a collection of 8 frames of sampled data before and after the event trigger occurs. At the event
trigger is 0, trace data sampled before reaching the event trigger point is numbered negatively, and trace data
sampled after the event trigger point is numbered positively. These frame numbers are called local numbers
(See Figure 2.2-13).
In addition to this local number, there is another set of frame numbers starting with the oldest data in the
trace buffer. This is called the global number. Since the trace buffer can hold 32K frames, frames are
numbered 1 to 32768 (See Figure 2.2-13).
To specify which frame data is displayed, use the global number or block and local numbers.
110
CHAPTER 2 DEPENDENCE FUNCTIONS
Figure 2.2-13 Frame Number in Multi Trace
Block number
Trace buffer
Frame number
Global number
1
2
2048
Local number
1
2
:
:
8
:
:
15
16
17
18
:
:
24
:
:
31
32
-7
–6
:
:
0
:
:
+7
+8
–7
–6
:
:
0
:
:
+7
+8
32752
32753
:
:
32759
:
:
32767
32768
-7
-6
:
:
0
:
:
+7
+8
Event trigger
Event trigger
Event trigger
111
CHAPTER 2 DEPENDENCE FUNCTIONS
2.2.8.4
Setting Multi Trace
Before executing the multi trace, the following settings must be made. After these
settings, trace data is sampled when a program is executed.
(1) Set event mode to multi trace mode.
(2) Enable trace function.
(3) Set event.
(4) Set trace-buffer-full break.
■ Setting Multi Trace
Before executing the multi trace, the following settings must be made. After these settings, trace data is
sampled when a program is executed.
(1) Set event mode to multi trace mode.
Use the SET MODE command for this setting.
(2) Enable trace function.
Use the ENABLE MULTITRACE command. To disable the function, use the DISABLE MULTITRACE
command.
(3) Set event.
Set an event that sampling. Use the SET EVENT command for this setting.
(4) Set trace-buffer-full break.
To break when the trace buffer becomes full, set the trace-buffer-full break. Use the SET MULTITRACE
command for this setting.
Table 2.2-11 shows the list of trace-related commands that can be used in multi trace mode.
Table 2.2-11 Trace-related Commands That Can Be Used in Multi Trace Mode
Usable Command
112
Function
SET EVENT
SHOW EVENT
CANCEL EVENT
ENABLE EVENT
DISABLE EVENT
Sets events
Displays event setup status
Deletes event
Enables event
Disables event
SET MULTITRACE
SHOW MULTITRACE
SEARCH MULTITRACE
ENABLE MULTITRACE
DISABLE MULTITRACE
CLEAR MULTITRACE
Sets trace-buffer-full break
Displays trace data
Searches trace data
Enables multi trace
Disables multi trace
Clears trace data
CHAPTER 2 DEPENDENCE FUNCTIONS
2.2.8.5
Displaying Trace Data Storage Status
It is possible to Displays how much trace data is stored in the trace buffer. This status
data can be read by specifying /STATUS to the SHOW TRACE command in the single
trace mode, and to the SHOW MULTITRACE command in the multi trace mode.
■ Displaying Trace Data Storage Status
It is possible to Displays how much trace data is stored in the trace buffer. This status data can be read by
specifying /STATUS to the SHOW TRACE command in the single trace mode, and to the SHOW MULTITRACE
command in the multi trace.
Frame numbers displayed in the multi trace mode is the global number.
[Example]
- In Single Trace
>SHOW TRACE/STATUS
en/dis
buffer full
sampling
frame no. =
step no. =
= enable
= nobreak
= end
-00120 to
-00091 to
:
:
:
00050 :
00022 :
Trace function enabled
Buffer full break function disabled
Trace sampling terminates
Frame -120 to 50 store data
Step -91 to 22 store data
>
- In Multi trace
>SHOW MULTITRACE/STATUS
en/dis
= enable
: Multi trace function enabled
buffer full = nobreak
: Buffer full break function disabled
sampling
: Trace sampling terminates
= end
block no. = 1 to 5
: Block 1 to 5 store data
frame no. = 00001 to 00159
: Frame 1 to 159 store data
(Global number)
113
CHAPTER 2 DEPENDENCE FUNCTIONS
2.2.8.6
Specify Displaying Trace Data Start
It is possible to specify from which data in the trace buffer to display. To do so, specify a
frame number with the SHOW TRACE command in the single trace mode, or specify
either a global number, or a block number and local number with the SHOW MULTITRACE
command in the multi trace mode. A range can also be specified.
■ Specifying Displaying Trace Data Start
It is possible to specify from which data in the trace buffer to displays. To do this, specify a frame number
with the SHOW TRACE command in the single trace, and specify either a global number, or a block number
and local number with the SHOW MULTITRACE command in the multi trace. A range can also be
specified.
[Example]
- In Single Trace Mode
>SHOW TRACE/CYCLE -6
: Start displaying from frame -6
>SHOW TRACE/CYCLE -6..10
: Display from frame -6 to frame 10
>SHOW TRACE -6
: Start displaying from step -6
>SHOW TRACE -6..10
: Displays from step -6 to step 10
Note:
A step number can only be specified when the MCU execution mode is set to the debugging mode.
- In Multi trace
>SHOW MULTITRACE/GLOBAL 500
>SHOW MULTITRACE/LOCAL 2
>SHOW MULTITRACE/LOCAL 2,-5..5
114
: Start displaying from frame 500 (Global number)
: Displaying block number 2
: Display from frame -5 to frame 5 of block number 2
CHAPTER 2 DEPENDENCE FUNCTIONS
2.2.8.7
Display Format of Trace Data
A display format can be chosen by specifying a command identifier with the SHOW
TRACE command in the single trace, and with the SHOW MULTITRACE command in the
multi trace. The source line is also displayed if "Add source line" is selected using the
SET SOURCE command.
There are three formats to display trace data:
• Display in instruction execution order (Specify /INSTRUCTION.)
• Display all machine cycles
(Specify /CYCLE.)
• Display in source line units
(Specify /SOURCE.)
■ Display in Instruction Execution Order (Specify /INSTRUCTION.)
Trace sampling is performed at each machine cycle, but the sampling results are difficult to Display because
they are influenced by pre-fetch, etc. This is why the emulator has a function to allow it to analyze trace data
as much as possible. The resultant data is displayed after processes such as eliminating pre-fetch effects,
analyzing execution instructions, and sorting in instruction execution order are performed automatically.
However, this function can be specified only in the single trace while in the debugging mode.
In this mode, data can be displayed in the following format.
115
CHAPTER 2 DEPENDENCE FUNCTIONS
Address
Hexadecimal
Disassemble Description
Indecates instruction
executed
Step Number
Decimal, signed
Data
Display of sequencer level
Indicates sequencer level
executed when trace sampled.
Indicates 0 if sequencer not
in use.
Hexadecimal
>SHOW TRACE/INSTRUCTION -194
step no.
address
mnemonic
level
\sub4:
-00194
: FF0106
LINK
#00
4
-00193
: 000186
internal read access.
10F2
5
-00192
: 1010E6
external write access.
10F2
5
-00191
: 000186
internal write access.
10E6
5
-00190
: FF0108
ADDSP
#F8
5
-00189
: FF010A
MOVL
A,001A
5
-00188
: 10001A
external read access.
0000
5
-00187
: 10001C
external read access.
4000
5
-00186
: FF010E
MOVL
@SP+04,A
5
-00185
: 1010E2
external write access.
0000
5
Device Status
-00184
: FF0111
MOVL
A,0016
5
-00183
:
** RESET **
** STANDBY ** : Hardware standby
>
: Reset
** RESET **
: Tool hold
** THOLD **
Data access
internal read access :
Read access to
internal memory
internal write access :
Write access to
internal memory
external read access :
Read access to
external memory
external write access :
Write access to
external memory
** UHOLD **
** WAIT **
** SLEEP **
** STOP **
: User hold
: Ready pin input
: Sleep
: Stop
■ Displaying All Machine Cycles (Specify /CYCLE.)
Detailed information at all sampled machine cycles can be displayed. In this mode, both single trace and
multi trace data can be displayed in almost identical formats. (In the multi trace mode, the local frame
number and block number are added.)
In this mode, data can be displayed in the following format. For further details, see the descriptions of the
SHOW TRACE, and SHOW MULTITRACE commands. In this mode, source is not displayed regardless of
the setup made using the SET SOURCE command.
116
CHAPTER 2 DEPENDENCE FUNCTIONS
[Example]
>>SHOW TRACE/CYCLE
frame no. address
-00587
:FF0106
-00586
:FF0106
-00585
:FF0106
-00584
:1010E8
-00583
:1010E8
-00582
:1010E8
-00581
:000186
-00580
:000186
-00579
:1010E6
-00578
:1010E6
-00577
:1010E6
-00576
:000186
-587
data
0106
0008
0106
10E8
0102
0102
0186
10F2
10E6
10F2
10F2
0186
a-status
--ECF
----EWA
----IRA
--EWA
-----
d-status
------EXECUTE
EXECUTE
------EXECUTE
EXECUTE
------EXECUTE
------EXECUTE
EXECUTE
-------
Qst
FLH
---------2by
-----------
dfg
@
@
@
@
level
4
4
5
5
5
5
5
5
5
5
5
5
ext-probe
11111111
11111111
11111111
11111111
11111111
11111111
11111111
11111111
11111111
11111111
11111111
11111111
How to read trace data
frame no.
address
data
a-status
d-status
Qst
dfg
level
ext-probe
(1)
(2)
(3)
(4)
(5)
(6)
(7)
(8)
(9)
(1):frame number (Decimal, number)
(2):executed instruction address, and data access address (Hexadecimal number)
(3):data (Hexadecimal number)
(4):access information (a-status)
WA
:
write access to internal memory
EWA
:
write access to external memory
RA
:
read access to internal memory
ERA
:
read access to external memory
ICF
:
code fetch to internal memory
ECF
:
code fetch to external memory
---
:
valid "d-status" information
(5):device information (d-status)
STANDBY :
hardware standby
THOLD
:
tool hold
UHOLD
:
user hold
WAIT
:
waiting with ready pin
SLEEP
:
sleep
STOP
:
stop
EXECUTE
:
execute instruction
RESET
:
reset
-------
:
invalid d-status information
(6):instruction queue status
FLH:flush queue
-by:number of remainder code of queue is -byte(-:1 to 8)
117
CHAPTER 2 DEPENDENCE FUNCTIONS
(7):valid flag
@:valid frame for this data
(8):sequencer level
(9):external probe data
■ Display in Source Line Units (Specify /SOURCE.)
Only the source line can be displayed. This mode is enabled only in the single trace mode while in the
debugging mode.
[Example]
>>SHOW TRACE/SOURCE -194
118
step no.
source
-00194 :
gtg1.c$251 {
-00190 :
gtg1.c$255
-00168 :
gtg1.c$259 {
-00164 :
gtg1.c$264
p = (char *)
&df;
-00161 :
gtg1.c$264
p = (char *)
&df;
-00157 :
gtg1.c$265
*(p++) = 0x00;
-00145 :
gtg1.c$266
*(p++) = 0x00;
-00133 :
gtg1.c$267
*(p++) = 0x80;
-00121 :
gtg1.c$268
*p
-00116 :
gtg1.c$270
p = (char *)
-00111 :
gtg1.c$271
*(p++) = 0xff;
-00099 :
gtg1.c$272
*(p++) = 0xff;
sub5(nf, nd);
= 0x7f;
ⅆ
CHAPTER 2 DEPENDENCE FUNCTIONS
2.2.8.8
Reading Trace Data On-the-fly
Trace data can be read while executing a program. However, this is not possible during
sampling. Disable the trace function or terminate tracing before attempting to read trace
data.
■ Reading Trace Data On-the-fly in Single Trace
To disable the trace function, use the DISABLE TRACE command. Confirm whether or not the trace
function is currently enabled by executing the SHOW TRACE command with /STATUS specified, or by
using the built-in variable, %TRCSTAT.
Tracing terminates when the delay count ends after the sequencer has terminated. If Not Break is specified
here, tracing terminates without a break operation. It is possible to confirm whether or not tracing has
terminated by executing the SHOW TRACE command with /STATUS specified, or by using the built-in
variable, %TRCSAMP.
To read trace data, use the SHOW TRACE command; to search trace data, use the SEARCH TRACE
command. Use the SET DELAY command to set the delay count and break operation after the delay count.
[Example]
>GO
>>SHOW TRACE/STATUS
en/dis
= enable
buffer full
= nobreak
sampling
= on
<- Trace sampling continues.
>>SHOW TRACE/STATUS
en/dis
= enable
buffer ful
= nobreak
sampling
= end
frame no.
= -00805 to
00000
step no.
= -00262 to
00000
<- Trace sampling ends.
>>SHOW TRACE -52
step no.
address
mnemonic
level
-00052
: FF0125
LINK
1
-00051
: 000186
internal read access.
10E6
1
-00050
: 1010D6
external write access.
10E6
1
-00049
: 000186
internal write access.
10D6
1
.
.
.
\sub5:
#02
If the CLEAR TRACE command is executed with the trace ending state, trace data sampling can be reexecuted by re-executing the sequencer from the beginning.
119
CHAPTER 2 DEPENDENCE FUNCTIONS
■ Reading Trace Data On-the-fly in the Multi Trace
Use the DISABLE MULTITRACE command to disable the trace function before reading trace data. Confirm
whether or not the trace function is currently enabled by executing the SHOW MULTITRACE command
with /STATUS specified, or by using the built-in variable %TRCSTAT.
To read trace data, use the SHOW MULTITRACE command; to search trace data, use the SEARCH
MULTITRACE command.
[Example]
>GO
>>SHOW MULTITRACE/STATUS
en/dis
= enable
buffer full = nobreak
sampling
= on
>>DISABLE MULTITRACE
>>SHOW MULTITRACE/STATUS
en/dis
= disable
buffer full = nobreak
sampling
= end
block no.
= 1 to 20
frame no.
= 00001 to 00639
>>SHOW MULTITRACE 1
frame no. address
data
block no. = 1
00001
-7 : 10109C 109C
00002
-6 : 10109C 0000
00003
-5 : 10109C 0000
00004
-4 : FF0120 0120
.
.
120
a-status
d-status
Qst
--EWA
-----
------EXECUTE
EXECUTE
------.
.
--2by
-----
dfg
@
level
ext-probe
1
1
1
1
.
.
11111111
11111111
11111111
11111111
CHAPTER 2 DEPENDENCE FUNCTIONS
2.2.8.9
Saving Trace Data
This section explains how to save trace data.
■ Saving Trace Data
Trace data can be saved in a specified file.
The following two methods are available to save trace data: using GUI (window or dialog) and using only the
command. The same result is obtained from both methods.
● Using GUI for Saving Trace Data
1. Display the trace window.
- Select [View] - [Trace] menu.
2. Specify the name of the file in which to save trace data.
- Right-click on the trace window, and select [Save] from the shortcut menu. The [Save as] dialog
appears.
Specify the file name and where to save trace data. For details, refer to Section "4.4.8 Trace" in
"SOFTUNE Workbench Operation Manual".
● Using Command for Saving Trace Data
1. Save trace data.
- Execute the SHOW TRACE/FILE command.
For details, refer to Section "4.33 SHOW TRACE (type 3)" in "SOFTUNE Workbench Command
Reference Manual".
When additionally saving trace data in an existing file, execute the SHOW TRACE/FILE/APPEND
command.
121
CHAPTER 2 DEPENDENCE FUNCTIONS
2.2.9
Measuring Performance
It is possible to measure the time and pass count between two events. Repetitive
measurement can be performed while executing a program in real-time, and when done,
the data can be totaled and displayed.
Using this function enables the performance of a program to be measured. To measure
performance, set the event mode to the performance mode using the SET MODE
command.
■ Performance Measurement Function
The performance measurement function allows the time between two event occurrences to be measured and
the number of event occurrences to be counted. Up to 32767 event occurrences can be measured.
- Measuring Time
Measures time interval between two events.
Events can be set at 8 points (1 to 8). However, in the performance measurement mode, the intervals,
starting event number and ending event number are combined as follows. Four intervals have the
following fixed event number combination:
Interval
Starting Event Number
Ending Event Number
1
1
2
2
3
4
3
5
6
4
7
8
- Measuring Count
The specified events become performance measurement points automatically, and occurrences of that
particular event are counted.
122
CHAPTER 2 DEPENDENCE FUNCTIONS
2.2.9.1
Performance Measurement Procedures
Performance can be measured by the following procedure:
• Setting event mode.
• Setting minimum measurement unit for timer.
• Specify performance-buffer-full break.
• Setting events.
• Execute program.
• Display measurement result.
• Clear measurement result.
■ Setting Event Mode
Set the event mode to the performance mode using the SET MODE command. This enables the performance
measurement function.
[Example]
>SET MODE/PERFORMANCE
>
■ Setting Minimum Measurement Unit for Timer
Using the SET TIMESCALE command, choose either 1 s or 100 ns as the minimum measurement unit for
the timer used to measure performance. The default is 1 s.
When the minimum measurement unit is changed, the performance measurement values are cleared.
[Example]
>SET TIMERSCALE/1U
<- Set 1 s as minimum unit.
>
■ Specify Performance-Buffer-Full Break
When the buffer for storing performance measurement data becomes full, a executing program can be
broken. This function is called the performance-buffer-full break. The performance buffer becomes full when
an event occurs 32767 times.
If the performance-buffer-full break is not specified, the performance measurement ends, but the program
does not break.
[Example]
>SET PERFORMANCE/NOBREAK
<- Specifying Not Break
>
123
CHAPTER 2 DEPENDENCE FUNCTIONS
■ Setting Events
Set events using the SET EVENT command.
The starting/ending point of time measurement and points to measure pass count are specified by events.
Events at 8 points (1 to 8) can be set. However, in the performance measurement, the intervals, starting event
number and ending event number are fixed in the following combination.
- Measuring Time
Four intervals have the following fixed event number combination.
Interval
Starting Event Number
Ending Event Number
1
1
2
2
3
4
3
5
6
4
7
8
- Measuring Count
The specified events become performance measurement points automatically.
■ Executing Program
Start measuring when executing a program by using the GO or CALL command. If a break occurs during
interval time measurement, the data for this specific interval is discarded.
■ Displaying Performance Measurement Data
Display performance measurement data by using the SHOW PERFORMANCE command.
■ Clearing Performance Measurement Data
Clear performance measurement data by using the CLEAR PERFORMANCE command.
[Example]
>CLEAR PERFORMANCE
>
124
CHAPTER 2 DEPENDENCE FUNCTIONS
2.2.9.2
Display Performance Measurement Data
Display the measured time and measuring count by using the SHOW PERFORMANCE
command.
■ Displaying Measured Time
To display the time measured, specify the starting event number or the ending event number.
Event number
Count of measuring within given time interval
>SHOW PERFORMANCE/TIME 1,9000,18999,1000
Minimum
execution t ime
Maximum
execution t ime
event
= 1 -> 2
min time
= 11637.0
max time
= 17745.0
0.0 -
8999.0
|
0
avr time
= 14538.0
9000.0 -
9999.0
|
0
10000.0 -
10999.0
|
0
11000.0 -
11999.0
|
2
12000.0 -
12999.0
|
19
13000.0 -
13999.0
|
52
14000.0 -
14999.0
|
283
15000.0 -
15999.0
|
92
16000.0 -
16999.0
|
3
17000.0 -
17999.0
|
1
18000.0 -
18999.0
|
0
|
0
Average
execution t ime
Total measuring count
time (µs)
|
count
-----------------------------+---------
19000.0 -
-----------------------------+--------total
|
452
The lower time limit, upper time limit and display interval can be specified. The specified time value is in
1s, when the minimum measurement unit timer is set to 1 s by the SET TIMESCALE command, and in
100 ns when the minimum is set to 100 ns.
>SHOW PERFORMANCE/TIME
event
= 1 -> 2
min time = 11637.0
max time = 17745.0
avr time = 14538.0
Lower time limit for display
Upper time limit for display
1,13000,16999,500
|
count
time (μs)
-----------------------------+--------0.0 12999.0
|
21
13000.0 13499.0
|
13
13500.0 13999.0
|
39
14000.0 14499.0
|
121
14500.0 14999.0
|
162
15000.0 15499.0
|
76
15500.0 15999.0
|
16
16000.0 16499.0
|
2
16500.0 16999.0
|
1
17000.0 17499.0
|
1
-----------------------------+--------total
|
452
125
CHAPTER 2 DEPENDENCE FUNCTIONS
2.2.10
Measuring Coverage
This emulator has the C0 coverage measurement function. Use this function to confirm
what percentage of an entire program has been executed.
■ Coverage Measurement Function
When testing a program, the program is executed with various test data input and the results are checked for
correctness. When the test is finished, every part of the entire program should have been executed. If any part
has not been executed, there is a possibility that the test is insufficient.
This emulator coverage function is used to find what percentage of the whole program has been executed. In
addition, details such as which addresses were not accessed can be confirmed.
This enables the measurement coverage range to be set and the access attributes to be measured.
To execute the C0 coverage, set a range within the code area and set the attribute to Code attribute. In
addition, specifying the Read/Write attribute and setting a range in the data area, permits confirming the
access status of variables such as finding unused variables, etc.
Execution of coverage measurement is limited to the address space specified as the debug area.
Therefore, set the debug area in advance. However, the measurement attribute for coverage measurement can
be specified regardless of attributes of the debug area.
■ Coverage Measurement Procedures
The procedure for coverage measurement is as follows:
- Set range for coverage measurement:
SET COVERAGE
- Measuring coverage:
GO, STEP, CALL
- Displaying measurement result:
SHOW COVERAGE
■ Coverage Measurement Operation
The following operation can be made in coverage measurement:
- Load/Save of coverage data:
LOAD/COVERAGE, SAVE/COVERAGE
- Abortion and resume of coverage measurement:
ENABLE COVERAGE, DISABLE COVERAGE
- Clearing coverage data:
CLEAR COVERAGE
- Canceling coverage measurement range:
CANCEL COVERAGE
Note:
With MB2141 emulator, the code coverage is affected by a prefetch by the MCU. Note the prefetch
when using the COVERAGE function.
126
CHAPTER 2 DEPENDENCE FUNCTIONS
2.2.10.1
Coverage Measurement Procedures
The procedure for coverage measurement is as follows:
• Set range for coverage measurement : SET COVERAGE
• Measure coverage
: GO, STEP, CALL
• Display measurement result
: SHOW COVERAGE
■ Setting Range for Coverage Measurement
Use the SET COVERAGE command to set the measurement range. The measurement range can be set only
within the area defined as the debug area. Up to 32 ranges can be specified.
In addition, the access attribute for measurement can be specified. This attribute can be specified regardless
of the attributes of the debug area.
By specifying /AUTOMATIC for the command qualifier, the code area for the loaded module is set
automatically. However, the library code area is not set when the C compiler library is linked.
[Example]
>SET COVERAGE FF0000 .. FFFFFF
■ Measuring Coverage
When preparing for coverage measurement, execute the program.
Measurement starts when the program is executed by using the GO, STEP, or CALL command.
■ Displaying Coverage Measurement Result
To display the following coverage measurement result, use the SHOW COVERAGE command.
- Display coverage rate of total measurement area
- Displaying coverage rate of load module
- Summary of 16 addresses as one block
- Details indicating access status of each address
- Displaying coverage measurement result per source line
- Displaying coverage measurement result per machine instruction
● Displaying coverage rate of total measurement area (specify /TOTAL for the command qualifier)
>SHOW COVERAGE/TOTAL
total coverage : 82.3%
● Displaying coverage rate of load module (specify /MODULE for the command qualifier)
>SHOW COVERAGE/MODULE
sample.abs . . . . . . . . . . . . . . (84.03%)
+ - startup.asm . . . . . . . . . . . (90.43%)
+ - sample.c . . . . . . . . . . . . . (95.17%)
+ - samp.c . . . . . . . . . . . . . . (100.00%)
Displays the load modules and the coverage rate of each module.
127
CHAPTER 2 DEPENDENCE FUNCTIONS
● Summary (Specify /GENERAL for command qualifier)
>SHOW COVERAGE/GENERAL
(HEX)0X0
+1X0
+2X0
+---------------+---------------+-----address 0123456789ABCDEF0123456789ABCDEF0123456
FF0000 **3*F*.......
-----... ABCDEF
C0(%)
32.0
Display the access status of every 16 addresses
.
: No access
1 to F : Display the number accessed in 16 addresses by the hexadecimal number.
*
: Access all of the 16 addresses.
● Details (Specify /DETAIL for command qualifier)
Display one line of a
coverage rate
>SHOW COVERAGE/DETAIL FF0000
address +0
FF0000
FF0010
FF0020
.
FF0030
FF0040
FF0050
FF0060
.
FF0070
.
FF0080
.
+1
.
.
.
.
.
+2
.
.
.
.
+3
.
.
.
.
+4
.
.
.
+5
.
.
.
+6
.
.
.
+7
.
.
.
.
+8
.
.
.
.
+9
.
.
.
.
+A
.
.
.
.
+B
.
.
.
.
Display the access status of every 1 address
.
-
128
: No access
: Access
+C
.
.
.
.
+D
.
.
.
.
+E
.
.
.
.
+F
.
.
.
.
C0(%)
100.0
100.0
18.6
100.0
93.7
100.0
0.0
0.0
0.0
CHAPTER 2 DEPENDENCE FUNCTIONS
● Displays per source line (specify /SOURCE for the command qualifier)
>SHOW COVERAGE/SOURCE main
*
70: {
71:
int i;
72:
struct table *value[16];
73:
*
74:
for (i=0; i<16; i++)
*
75:
value[i] = &target[i];
76:
sort_val(value, 16L);
*
77:
.
78: }
Displays execution status of each source line.
.:
No executing
Executing
*:
Blank : Line which the code had not been generated or is outside
the scope of the coverage measurement
● Displays per machine instruction (specify /INSTRUCTION for the command qualifier)
>SHOW COVERAGE/INSTRUCTION F9028F
sample.c$70 {
* F9028F
\main:
#22
LINK
* F9028F 0822
PUSHW RW0
* F90291 4F01
sample.c$74
for (i=0; i<16; i++)
A,#0
MOVN
. F90293 D0
@RW3-02,A
MOVW
. F90294 CBFE
A,@RW3-02
MOVW
. F90296 BBFE
A,#0010
CMPW
. F90298 3B1000
F902B5
BGE
. F9029B FB18
sample.c$75
value[i] = &target[i];
A,@RW3-02
. F9029D BBFE
MOVW
A
LSLW
. F9029F 0C
RW0,A
MOVW
. F902A0 98
A,@RW3-22
MOVEA
. F902A1 71F3DE
RW0,A
ADDW
. F902A4 7700
A,#14
MOV
. F902A6 4214
MULUW A,@RW3-02
. F902A8 7833FE
A,#01A0
ADDW
. F902AB 38A001
Displays execution status of each machine command line.
.:
No executing
Executing
*:
Blank : Instruction outside the scope of the coverage measurement
129
CHAPTER 2 DEPENDENCE FUNCTIONS
Note:
With MB2141 emulator, the code coverage measurement is affected by a prefetch. Note when
analyzing.
130
CHAPTER 2 DEPENDENCE FUNCTIONS
2.2.11
Execution Time Measurement
This function measures the program execution time.
■ Measurement Items
Measures time between the start and stop of program execution.
The timer for measuring time is called the emulation timer.
The measurement time depends on as follows by the minimum measurement unit for the emulation timer.
When the minimum measurement unit is 1 s: the maximum is about 70 minutes
When the minimum measurement unit is 100 ns: the maximum is about 7 minutes
The minimum measurement unit at startup is 1 s.
The measurement is performed whenever a program is executed, and the measurement result displays the
following two values:
• Number of cycles spent on the previous program execution
• Total number of cycles executed since the previous clearing
■ Setting the Minimum Measurement Unit
Either of the following methods can be used to set the minimum measurement unit for the emulation timer.
• Set by dialog
Select [Setup] - [Debug Environment] - [Debug Environment] menu to set the results in [emulation] tab in
the debugging environment set dialog.
For details, refer to Section "4.7.2.3 Setting Debug Environment" in "SOFTUNE Workbench Operation
Manual".
• Set by command
Enter the SET TIMERSCALE command in the command window.
For details, refer to Section "1.13 SET TIMERSCALE (type1)" in "SOFTUNE Workbench Command
Reference Manual".
■ Displaying Measurement Results
Either of the following methods can be used to display the measurement results.
• Display by dialog
The results appear in the time measurement dialog, which can be displayed by selecting [Debug] - [Time
Measurement] menu.
For details, refer to Section "4.6.8 Time Measurement" in "SOFTUNE Workbench Operation Manual".
• Display by command
Enter the SHOW TIMER command in the command window.
For details, refer to Section "4.27 SHOW TIMER" in "SOFTUNE Workbench Command Reference Manual".
■ Clearing Measurement Results
Either of the following methods can be used to clear the measurement results.
131
CHAPTER 2 DEPENDENCE FUNCTIONS
• Clearing by dialog
Click the [Clear] button in the time measurement dialog, which can be displayed by selecting [Debug] [Time Measurement] menu.
For details, refer to Section "4.6.8 Time Measurement" in "SOFTUNE Workbench Operation Manual".
• Clearing by command
Enter the CLEAR TIMER command in the command window.
For details, refer to Section "4.28 CLEAR TIMER" in "SOFTUNE Workbench Command Reference Manual".
Note:
The measured execution time is added about ten extra cycles per execution. If the execution cycle is
measured, execute many instructions continuously in order to minimize the effect of error.
132
CHAPTER 2 DEPENDENCE FUNCTIONS
2.2.12
Sampling by External Probe
An external probe can be used to sample (input) data. There are two sampling types:
sampling the trace buffer as trace data, and sampling using the SHOW SAMPLING
command.
■ Sampling by External Probe
There are two sampling types to sample data using an external probe: sampling the trace buffer as trace data,
and sampling using the SHOW SAMPLING command.
When data is sampled as trace data, such data can be displayed by using the SHOW TRACE command or
SHOW MULTITRACE command, just as with other trace data. Sampling using the SHOW SAMPLING
command, samples data and displays its state.
In addition, by specifying external probe data as events, such events can be used for aborting a program, and
as multi trace and performance trigger points.
Events can be set by using the SET EVENT command.
■ External Probe Sampling Timing
Choose one of the following for the sampling timing while executing a program.
- At rising edge of internal clock (clock supplied by emulator)
- At rising edge of external clock (clock input from target)
- At falling edge of external clock (clock input from target)
Use the SET SAMPLING command to set up; to display the setup status use the SHOW SAMPLING
command.
When sampling data using the SHOW SAMPLING command, sampling is performed when the command is
executed and has nothing to do with the above settings.
[Example]
>>SET SAMPLING/INTERNAL
>>SHOW SAMPLING
sampling timing : internal
channel
7 6 5 4 3 2 1 0
1 1 1 1 0 1 1 1
133
CHAPTER 2 DEPENDENCE FUNCTIONS
■ Displaying and Setting External Probe Data
When a command that can use external probe data is executed, external probe data is displayed in 8-digit
binary or 2-digit hexadecimal format. The displayed bit order is in the order of the IC clip cable color code
order (Table 2.2-12). The MSB is at bit7 (Violet), and the LSB is at bit0 (Black). The bit represented by 1
means HIGH, while the bit represented by 0 means LOW. When data is input as command parameters, these
values are also used for input.
Table 2.2-12 Bit Order of External Probe Data
IC Clip
Cable Color
Violet
Blue
Green
Yellow
Orange
Red
Brown
Black
Bit 7
Bit 6
Bit 5
Bit 4
Bit 3
Bit 2
Bit 1
Bit 0
Bit Order
External probe data
■ Commands for External Probe Data
Table 2.2-13 shows the commands that can be used to set or display external probe data.
Table 2.2-13 Commands that can be used External Probe Data
Usable Command
134
Function
SET SAMPLING
SHOW SAMPLING
Sets sampling timing for external probe
Samples external probe data
SET EVENT
SHOW EVENT
Enables to specify external probe data as condition for event
Displays event setup status
SHOW TRACE
Displays external probe trace-sampled (single trace)
SHOW MULTITRACE
Displays external probe trace-sampled (multi-trace)
CHAPTER 2 DEPENDENCE FUNCTIONS
2.2.13
Checking Debugger Information
This section explains how to check information about the MB2141 emulator debugger.
■ Debugger Information
This emulator debugger enables you to check the following information at startup.
• SOFTUNE Workbench file information
• Hardware information
If any errors have been discovered during SOFTUNE Workbench operations, check this information and
contact our sales department or support department.
■ How to Check
Use one of the following methods to check debugger information.
• Command
- SHOW SYSTEM
Refer to Section "1.19 SHOW SYSTEM" in "SOFTUNE Workbench Command Reference Manual".
• Dialog
- Version information dialog
Select [Help] - [Version Information] menu.
For details, refer to Section "4.9.3 Version Information" in "SOFTUNE Workbench Operation
Manual".
■ Displayed Contents
F2MC-16 Family SOFTUNE Workbench VxxLxx
ALL RIGHTS RESERVED,
COPYRIGHT(C) FUJITSU SEMICONDUCTOR LIMITED 1997
LICENCED MATERIAL PROGRAM PROPERTY OF FUJITSU SEMICONDUCTOR LIMITED
=======================================================
Cpu information file path: CPU information file path
Cpu information file version: CPU information file version
=======================================================
Add in DLLs
------------------------------------------------------SiCmn
Product name: SOFTUNE Workbench
File Path: SiC907.dll path
Version: SiC907.dll version
- - - - - - - - - - - - - - - - - - - - - - - - - - - SiiEd
File Path: SiiEd3.ocx path
Version: SiiEd3.ocx version
------------------------------------------------------SiM907
Product name: SOFTUNE Workbench
File Path: SiM907.dll path
Version: SiM907.dll version
135
CHAPTER 2 DEPENDENCE FUNCTIONS
- - - - - - - - - - - - - - - - - - - - - - - - - - - Language Tools
- F2MC-16 Family SOFTUNE C Compiler version
File Path: fcc907s.exe path
- F2MC-16 Family SOFTUNE Assembler version
File Path: fasm907s.exe path
- F2MC-16 Family SOFTUNE Linker version
File Path: flnk907s.exe path
- F2MC-16 Family SOFTUNE Librarian version
File Path: flib907s.exe path
- SOFTUNE FJ-OMF to S-FORMAT Converter version
File Path: f2ms.exe path
- SOFTUNE FJ-OMF to INTEL-HEX Converter version
File Path: f2is.exe path
- SOFTUNE FJ-OMF to INTEL-EXT-HEX Converter version
File Path: f2es.exe path
- SOFTUNE FJ-OMF to HEX Converter version
File Path: f2hs.exe path
------------------------------------------------------SiOsM
Product name: Softune Workbench
File Path: SiOsM907.dll path
Version: SiOsM907.dll version
------------------------------------------------------F2MC-16 Series Debugger DLL
Product name: SOFTUNE Workbench
File Path: SiD907.dll path
Version: SiD907.dll version
- - - - - - - - - - - - - - - - - - - - - - - - - - - Debugger type
: Current debugger type
MCU type
: Currently selected target MCU
VCpu dll name
: Path and name of the currently used VCpu dll
VCpu dll version
: Version of the currently used virtual debugger DLL
DSU type
: Currently used DSU type
Monitor version
: Version of monitor (dependent)
Communication device : Device type
Baud rate
: Baud rate
Host name
: LAN host name
REALOS version
: REALOS version
------------------------------------------------------SiIODef
Product name: Softune Workbench
File Path: SiIODef.dll path
Version: SiIODef.dll version
=======================================================
Current path: Path of the currently used project
Language: Currently used language
Help file path: Help file path
136
CHAPTER 2 DEPENDENCE FUNCTIONS
2.3
Emulator Debugger (MB2147-01)
This section explains the functions of the emulator debuggers for the MB2147-01.
■ Emulator
When choosing the emulator debugger from the setup wizard, select one of the following emulators. The
following description explains the case when MB2147-01 has been selected.
MB2141
MB2147-01
MB2147-05
MB2198
The emulator debugger for the MB2147-01 is software that controls an emulator from a host computer via a
communications line (RS-232C, LAN or USB) to evaluate programs.
The following series can be debugged:
F2MC-16L
F2MC-16LX
Before using the emulator, the emulator must be initialized. For details, refer to "Appendix B Monitoring
Program Download" and "Appendix C LAN Interface Setup" of "SOFTUNE Workbench Operation Manual".
137
CHAPTER 2 DEPENDENCE FUNCTIONS
2.3.1
Setting Operating Environment
This section explains the operating environment setup.
■ Setting Operating Environment
For the emulator debugger for the MB2147-01, it is necessary to set the following operating environment.
Predefined default settings for all these setup items are enabled at startup. Therefore, setup is not required
when using the default settings. Adjusted settings can be used as new default settings from the next time.
- Monitoring program automatic loading
- MCU operation mode
- Debug area
- Memory mapping
- Debug function
- Event mode
138
CHAPTER 2 DEPENDENCE FUNCTIONS
2.3.1.1
Monitoring Program Automatic Loading
The MB2147-01 emulator can automatically update the monitoring program at emulator
startup.
■ Setting Monitoring Program Automatic Loading
When the MB2147-01 emulator is specified, data in the emulator can be checked at the beginning of
debugging to load an appropriate monitoring program and configuration binary data automatically into the
emulator.
The monitoring program and configuration binary data to be compared for update are in Lib\907 under the
directory where Workbench is installed.
Enable/disable the monitoring program automatic loading function by choosing [Environment] - [Debug
Environment Setup] - [Setup Wizard] menu.
139
CHAPTER 2 DEPENDENCE FUNCTIONS
2.3.1.2
MCU Operation Mode
There are two MCU operation modes as follows:
• Debugging Mode
• Native Mode
■ Setting MCU Operation Mode
Set the MCU operation mode.
There are two operation modes: the debugging mode, and the native mode.
Choose either one using the SET RUNMODE command.
At emulator start-up, the MCU is in the debugging mode.
The data access to internal bus may not be detected by emulator in native mode. Therefore, when the MCU
operation mode is changed, all the following are initialized:
- Data breakpoints
- Data monitoring break
- Event condition settings
- Sequencer settings
- Trace measurement settings and trace buffer
■ Debugging Mode
All the operations of evaluation chips can be analyzed, but their operating speed is slower than that of massproduced chips.
■ Native Mode
Evaluation chips have the same timing as mass-produced chips to control the operating speed. Note that the
restrictions the shown in Table 2.3-1 are imposed on the debug functions.
Table 2.3-1 Restrictions on Debug Functions in Native Mode
Applicable series
Common to all series
140
Restrictions on debug functions
- When a data read access occurs on the MCU internal bus, the internal bus
access information is not sampled and stored in the trace buffer.
- Even when a data break or event (data access condition) is set for data on the
MCU internal bus, it may not become a break factor or sequencer-triggering
factor.
- The coverage function may fail to detect an access to data on the MCU
internal bus.
CHAPTER 2 DEPENDENCE FUNCTIONS
2.3.1.3
Debug Area
Set the intensive debugging area out of the whole memory space. The area functions are
enhanced.
■ Setting Debug Area
There are two debug areas: DEBUG3, and DEBUG4. A continuous 1 MB area (16 banks) is set for each area.
Set the debug area using the SET DEBUG command.
Setting the debug area enhances the coverage measurement function.
- Enhancement of Coverage Measurement Function
Setting the debug area enables the coverage measurement function. In coverage measurement, the
measurement range can be specified only within the area specified as the debug area. In 00 to 0F bank and
0F0 to 0FF bank, a breakpoint can be set without specifying the debug area. (DEBUG1, DEBUG2)
141
CHAPTER 2 DEPENDENCE FUNCTIONS
2.3.1.4
Memory Area Types
A unit in which memory is allocated is called an area. There are five different area types.
■ Memory Area Types
A unit to allocate memory is allocated is called an area. There are five different area types as follows:
- User Memory Area
Memory space in the user system is called the user memory area and this memory is called the user
memory. Up to four user memory areas can be set with no limit on the size of each area. Define a region
on a 256-byte boundary.
Access attributes can be set for each area; for example, CODE, READ, etc., can be set for ROM area, and
READ, WRITE, etc. can be set for RAM area. If the MCU attempts access in violation of these attributes,
the MCU operation is suspended and an error is displayed (guarded access break).
Memory manipulation commands can be executed in relation to emulation memory areas while MCU
execution is in progress.
To set the user memory area, use the SET MAP command.
- Emulation Memory Area
Memory space substituted for emulator memory is called the emulation memory area, and this memory is
called emulation memory.
It is possible to set up to four areas of 1 MB maximum (including an internal ROM area described later)
as emulation memory area. Define a region on a 256-byte boundary. An area larger than 1 MB can be
specified at one time but is divided internally into two or more 1 MB areas for management purposes.
Memory manipulation commands can be executed in relation to emulation memory areas while MCU
execution is in progress.
Emulation memory areas can be set using the SET MAP command.
Further, the access attributes can be set as with user memory areas.
Note:
Even if the MCU internal resources are set as emulation memory area, access is made to the internal
resources. Re-executing this setup may damage data.
- Internal ROM Area
The area where the emulator internal memory is substituted for internal ROM is called the internal ROM
area, and this memory is called the internal ROM memory.
The internal ROM area with a size up to 1 MB can be specified two areas.
An area larger than 1 MB can be specified at one time but is divided internally into two or more 1 MB
areas for management purposes.
Memory manipulation commands can be executed in relation to emulation memory areas while MCU
execution is in progress.
The internal ROM area is capable to set by the "Setup Map" dialog opening by "Debugger Memory Map"
from "Setup".
142
CHAPTER 2 DEPENDENCE FUNCTIONS
Note:
The internal memory area, it is set a suitable area automatically by the selected MCU.
- Internal ROM Image Area
Some types of MCUs have data in a specific area of internal ROM appearing to 00 bank. This specific
area is called the internal ROM image area.
The internal ROM image area is capable to set by the "Setup Map" dialog opening by "Debugger Memory
Map" from "Setup". This area attribute is automatically set to READ/CODE. The same data as in the
internal ROM area appears in the internal ROM image area.
Note that the debug information is only enabled for either one (one specified when linked). To debug only
the internal ROM image area, change the creation type of the load module file.
Note:
The internal memory area, it is set a suitable area automatically by the selected MCU.
- Undefined Area
A memory area that does not belong to any of the areas described above is part of the user memory area.
This area is specifically called the undefined area.
The undefined area can be set to either NOGUARD area, which can be accessed freely, or GUARD area,
which cannot be accessed. Select either setup for the whole undefined area. If the area attribute is set to
GUARD, a guarded access error occurs if access to this area is attempted.
143
CHAPTER 2 DEPENDENCE FUNCTIONS
2.3.1.5
Memory Mapping
Memory space can be allocated to the user memory and the emulation memory, etc., and
the attributes of these areas can be specified.
However, the MCU internal resources are not dependent on this mapping setup and
access is always made to the internal resources.
■ Access Attributes for Memory Areas
The access attributes shown in Table 2.3-2 can be specified for memory areas.
A guarded access break occurs if access is attempted in violation of these attributes while executing a
program.
When access to the user memory area and the emulation memory area is made using program commands,
such access is allowed regardless of the CODE, READ, WRITE attributes. However, access to memory with
the GUARD attribute in the undefined area, causes an error.
Table 2.3-2 Types of Access Attributes
Area
User Memory
Emulation Memory
Undefined
Attribute
Description
CODE
Instruction Execution Enabled
READ
Data Read Enabled
WRITE
Data Write Enabled
GUARD
Access Disabled
NOGUARD
No check of access attribute
When access is made to an area without the WRITE attribute by executing a program, a guarded access break
occurs after the data has been rewritten if the access target is the user memory. However, if the access target
is the emulation memory, the break occurs before rewriting. In other words, write-protection (memory data
cannot be overwritten by writing) can be set for the emulation memory area by not specifying the WRITE
attribute for the area.
This write-protection is only enabled for access made by executing a program, and is not applicable to access
by commands.
144
CHAPTER 2 DEPENDENCE FUNCTIONS
■ Creating and Viewing Memory Map
Use the following commands for memory mapping.
SET MAP:
Set memory map.
SHOW MAP:
Display memory map.
CANCEL MAP:
Change memory map setting to undefined.
[Example]
>SHOW MAP
address
attribute
000000 .. FFFFFF
noguard
type
The rest of setting area numbers
user = 8
emulation = 5
>SET MAP/USER H'0..H'1FF
>SET MAP/READ/CODE/EMULATION H'FF0000..H'FFFFFF
>SET MAP/USER H'8000..H'8FFF
>SET MAP/MIRROR/COPY H'8000..H'8FFF
>SET MAP/GUARD
>SHOW MAP
address
attribute
type
000000 .. 0001FF
read write
user
000200 .. 007FFF
guard
008000 .. 008FFF
read write
009000 .. FEFFFF
guard
FF0000 .. FFFFFF
read write code
user
emulation
mirror address area
008000 .. 008FFF
copy
The rest of setting area numbers
user = 6
emulation = 3
>
■ Internal ROM Area Setting
The [Setup Map] dialog box is displayed using [Environment] - [Memory Map] menu. You can set the
internal ROM area using the [Internal ROM Area] tab after the [Map Adding] dialog box is displayed by
clicking on the [Setting] button. You can set two areas. Both require empty Emulation area to be set. You can
set the region size by (Empty space of the emulation area) x (one area size).
Specify the internal ROM area from the ending address H'FFFFFF (fixed) for area 1. Also, it is possible to
delete the internal ROM area.
145
CHAPTER 2 DEPENDENCE FUNCTIONS
2.3.1.6
Debug Function
The debug function has the following two types. Only the function of the selected mode
can be used. The selectable debug mode depends on the emulator or its connection
form.
• RAM Checker mode
• Trace Enhancement mode
■ Setting of Debug Function
Set the debug function. The debug function has the RAM Checker and the Trace Enhancement mode. The
selectable mode depends on the emulator or its connection form. These modes can be set by using [Setup] [Debug Environment] - [Select Debug Function] menu or the SET MODE command on the command
window.
At the emulator activated, this is set to the RAM Checker mode.
When the debug function is changed, all the followings are initialized:
• Performance measurement data
• Trace buffer
■ RAM Checker mode
Enables the RAM Checker function. The history of accessing the monitoring addresses can be recorded into
the log file.
■ Trace Enhancement mode
Enable the trace enhancement.
The following functions become available.
1. Trace acquisition in the multi trace mode
2. Trace acquisition control by trace trigger (resumption/pausing/termination)
3. Trace control by data monitoring condition
4. Trace control by sequencer
146
CHAPTER 2 DEPENDENCE FUNCTIONS
2.3.1.7
Event Mode
There are three event modes as listed below.
• Normal mode
• Multi trace mode
• Performance mode
■ Event Mode
Event mode is used to determine which function the event triggers are used for. To set the mode, use [Event]
tab on [Setup] - [Debug Environment] - [Debug Environment] menu or the SET MODE command on the
command window. The default is normal mode.
There are three event modes as listed below.
• Normal mode
Event triggers are used for the single trace.
• Multi trace mode
Event triggers are used for the multi trace (trace function which samples data before and after the event
trigger occurred).
• Performance mode
Event triggers are used for the performance measurement. It enables to measure time duration between
two event trigger occurrence and count of event trigger occurrence.
Note:
The multi trace mode can be specified only when the debug function on MB2147-01 is set to Trace
Enhancement mode. For more details, see Section "2.3.1.6 Debug Function".
147
CHAPTER 2 DEPENDENCE FUNCTIONS
2.3.2
Notes on Commands for Executing User Program
When using commands to execute a user program, there are several points to note.
■ Notes on GO Command
For the GO command, two breakpoints that are valid only while executing commands can be set. However,
care is required in setting these breakpoints.
- Invalid Breakpoints
- No break occurs when a breakpoint is set at the instruction immediately after the instructions in Table
2.3-3.
Table 2.3-3 Instructions which make breakpoint settings invalid
F2MC-16L/16LX
PCB
NCC
SPB
MOV
OR
ILM,#imm8
CCR,#imm8
DTB
ADB
CNR
ANDCCR,#imm8
POPW PS
- No break occurs when breakpoint set at address other than starting address of instruction.
- No break occurs when following two conditions met at one time.
- Instruction for which breakpoint set starts from odd-address,
- Preceding instruction longer than 2 bytes length, and breakpoint already set at last 1-byte address of
preceding instruction (This "already-set" breakpoint is an invalid breakpoint that won't break, because
it has been set at an address other than the starting address of an instruction).
- Abnormal Breakpoint
Setting a breakpoint at the instruction immediately after string instructions listed in Table 2.3-4, may
cause a break in the middle of the string instruction without executing the instruction to the end.
Table 2.3-4 String instructions
F2MC-16L/16LX
148
MOVS
SECQ
WBTS
MOVSWI
SECQWI
MOVSD
SECQD
FILS
FILSW
MOVSW
SECQW
MOVSI
SECQI
WBTC
MOVSWD
SECQWD
FILSI
FILSWI
CHAPTER 2 DEPENDENCE FUNCTIONS
■ Notes on Step Execution
- Exceptional Step Execution
When executing the instructions in "Table 2.3-3" and "Table 2.3-4", such instructions and the next
instruction are executed as a single instruction.
- Step Execution that won't Break
Note that no break occurs after step operation when two or more instructions in "Table 2.3-3" and "Table
2.3-4" are continuous.
Furthermore, note that no break occurs after step operation when the following two conditions are met at
one time.
- When step instruction longer than 2 bytes and last code ends at even address
- When breakpoint already set at last address (This "already-set" breakpoint is not break, because it has
been set at an address other than the starting address of an instruction.)
■ Controlling Watchdog Timer
It is possible to select "No reset generated by watchdog timer counter overflow".
Use the ENABLE WATCHDOG, DISABLE WATCHDOG commands to control the watchdog timer.
- ENABLE WATCHDOG
:
Reset generated by watchdog timer counter overflow
- DISABLE WATCHDOG
:
No reset generated by watchdog timer counter overflow
The start-up default in this program is "Reset generated by watchdog timer counter overflow".
[Example]
>DISABLE WATCHDOG
>GO
149
CHAPTER 2 DEPENDENCE FUNCTIONS
2.3.3
Commands Available during Execution of User Program
This section explains the commands available during the execution of a user program.
■ Commands Available during Execution of User Program
This emulator debugger allows you to use certain commands during the execution of a user program.
For more details, see "■ Debugger" in "SOFTUNE Workbench Command Reference Manual".
The double circle indicates that it is available during the execution of a user program.
Table 2.3-5 shows the commands available during the execution of a user program.
Table 2.3-5 Commands Available during Execution of User Program (1 / 2)
Function
MCU reset
Restrictions
1. Enabled only when trace execution
ended *1
Displaying trace data
2. Enabled only when the debug function is
in "Trace Enhancement" mode.*2
(only MULTITRACE)
1. Enabled only when trace execution
ended *1
Clear trace data
2. Enabled only when the debug function is
in "Trace Enhancement" mode.*2
(only MULTITRACE)
1. Enabled only when trace execution
ended *1
Search trace data
2. Enabled only when the debug function is
in "Trace Enhancement" mode.*2
(only MULTITRACE)
Set trace acquisition data
Enabled only when trace execution ended *1
Set trace trigger
Set filtering area
150
1. Enabled only when trace execution
ended *1
2. Enabled only when the debug function is
in "Trace Enhancement" mode.*2
1. Enabled only when trace execution
ended *1
2. Enabled only when the debug function is
in "Trace Enhancement" mode.*2
Major Commands
1.3 RESET
4.2 SHOW MULTITRACE,
4.31 SHOW TRACE(type 1)
4.3 CLEAR MULTITRACE,
4.34 CLEAR TRACE
4.6 SEARCH MULTITRACE,
4.37 SEARCH TRACE
4.35 ENABLE TRACE,
4.36 DISABLE TRACE
4.42 SET TRACETRIGGER,
4.43 SHOW TRACETRIGGER,
4.44 CANCEL TRACETRIGGER
4.38 SET DATATRACEAREA,
4.40 SHOW DATATRACEAREA,
4.41 CANCEL DATATRACEAREA
CHAPTER 2 DEPENDENCE FUNCTIONS
Table 2.3-5 Commands Available during Execution of User Program (2 / 2)
Function
Restrictions
1. Enabled only when trace execution
ended *1
Set trace delay
2. Enabled only when the debug function is
in "Trace Enhancement" mode.*2
Displaying execution cycle
measurement value (Timer)
-
Major Commands
4.45 SET DELAY,
4.46 SHOW DELAY
4.27 SHOW TIMER
Memory operation (Read/Write)
Emulation memory only operable *3
Read only enabled in real-time monitoring
area
5.1 EXAMINE,
5.2 ENTER,
5.3 SET MEMORY,
5.4 SHOW MEMORY,
5.5 SEARCH MEMORY,
5.8 COMPARE,
5.9 FILL,
5.10 MOVE,
5.11 DUMP
Line assembly, Disassembly
Emulation memory only enabled *3
Real-time monitoring area, Disassembly
only enabled
6.1 ASSEMBLE
6.2 DISASSEMBLE
Oprable only when "Breakpoint Settings
during Execution" is enabled in the
execution tab of the debug environment
dialog.
3.1 SET BREAK,
3.6 CANCEL BREAK,
3.7 ENABLE BREAK,
3.8 DISABLE BREAK,
3.9 SET DATABREAK,
3.12 CANCEL DATABREAK,
3.13 ENABLE DATABREAK,
3.14 DISABLE DATABREAK
Breakpoint Settings
*1: For detail, refer to Section "2.3.6 Real-time Trace".
*2: For detail, refer to Section "2.3.1.6 Debug Function".
*3: For detail, refer to Section "2.2.1.4 Memory Mapping".
*4: For detail, refer to Section "2.3.4 Break".
Notes:
• The conditions which allow you to use the commands in Table 2.3-5 are limited to the following
cases when a user program is executed.
- [Debug] - [Run] - [Go] menu
- [Go] button on the debug toolbar
The commands in Table 2.3-5 cannot be used when the GO command is entered in the command
window.
• An error message appears if you enter a command that cannot be used during the execution of a
user program.
"E4404S Command error (MCU is busy)."
151
CHAPTER 2 DEPENDENCE FUNCTIONS
2.3.4
Break
In this emulator debugger, nine types of break functions can be used. When the program
execution is aborted by each break function, the address and the break factor to do the
break are displayed.
■ Break Functions
In this emulator debugger, nine types of break functions are supported.
• Code break
• Data break
• Monitoring data break
• Sequential break
• Guarded access break
• Trace-buffer-full break
• Performance-buffer-full break
• External trigger break
• Forced break
152
CHAPTER 2 DEPENDENCE FUNCTIONS
2.3.4.1
Code Break
It is a function to abort the program by observing the specified address. The break is
done before an instruction the specified address is executed.
■ Code Break
It is a function to abort the program by observing the specified address. The break is done before an
instruction the specified address is executed. It is possible to set it in this 65535 debuggers.
When a break occurs due to a code break, the following message is displayed on the Status Bar.
Break at [Address] by breakpoint
■ Setting Method
The code break is controlled by the following method.
• Command
- SET BREAK
Refer to "3.1 SET BREAK (type 1)" in "SOFTUNE Workbench Command Reference Manual".
• Dialog
- Breakpoints set dialog [Code] tab
Refer to "4.6.4 Breakpoint" in "SOFTUNE Workbench Operation Manual".
• Window
- Source window/Disassembly window
■ Notes on Data Break
There are several points to note in using code break. First, some points affecting code break are explained.
● Invalid Breakpoints
• No break occurs when a breakpoint is set at the instruction immediately after the following instructions.
F2MC-16/16L/16LX/16H: • PCB • DTB • NCC • ADB • SPB • CNR
• MOV ILM,#imm8
• AND CCR,#imm8
• OR CCR,#imm8
• POPW PS
F2MC-16F:
• PCB • DTB • NCC • ADB • SPB • CNR
• No break occurs when breakpoint set at address other than starting address of instruction.
• No break occurs when following two conditions met at one time.
- Instruction for which breakpoint set starts from odd-address
- Preceding instruction longer than 2 bytes length, and breakpoint already set at last 1-byte address of
preceding instruction (This "already-set" breakpoint is an invalid breakpoint that won't break, because
it has been set at an address other than the starting address of an instruction.)
153
CHAPTER 2 DEPENDENCE FUNCTIONS
● Abnormal Breakpoint
• Setting a breakpoint at the instruction immediately after string instructions listed below, may cause a
break in the middle of the string instruction without executing the instruction to the end.
F2MC-16/16L/16LX/16H: • MOVS
• MOVSI
• MOVSD
• FILS
• MOVSW
• MOVSWI
• MOVSWD
• FILSI
F2MC-16F:
• MOVMW
Above plus
• MOVM
• SECQ
• SECQI
• SECQD
• FILSW
• SECQW
• SECQWI
• SECQWD
• FILSWI
• WBTS
• WBTC
Here are some additional points about the effects on other commands.
● Dangerous Breakpoints
• Never set a breakpoint at an address other than the instruction starting address. If a breakpoint is the last 1
byte of an instruction longer than 2 bytes length, and if such an address is even, the following abnormal
operation will result:
- If instruction executed by STEP command, instruction execution not aborted.
- If breakpoint specified with GO command, set at instruction immediately after such instruction, the
breakpoint does not break.
Note:
When the debugging area is set again, all breakpoints in the area are cleared.
154
CHAPTER 2 DEPENDENCE FUNCTIONS
2.3.4.2
Data Break
The data break is a function to abort the program execution when the data access (read
or write) is done to the address specified while executing the program.
■ Data Break
The data break is a function to abort the program execution when MCU accesses data as for a specified
address. It is possible to set it in this two debuggers.
When a break occurs due to a data break, the following message is displayed on the Status Bar.
Break at [Address] by databreak at Access address
■ Setting Method
The data break is controlled by the following method.
• Command
- SET DATABREAK
Refer to "3.9 SET DATABREAK (type 1)" in "SOFTUNE Workbench Command Reference Manual".
• Dialog
- Breakpoints set dialog [Data] tab
Refer to "4.6.4 Breakpoint" in "SOFTUNE Workbench Operation Manual".
Note:
When the debugging area is set again, all breakpoints in the area are cleared.
155
CHAPTER 2 DEPENDENCE FUNCTIONS
2.3.4.3
Monitoring Data Break
It is a special break function to abort execution while it is corresponding to specified
data when the program reaches a specified address.
■ Monitoring Data Break
It is a special break function to abort execution while it is corresponding to specified data when the program
reaches a specified address.
If the break condition of the data watch break is shown in figure, it becomes as shown in the figure below.
Flow of program
Specified
address
Specified
address
Monitoring Data
Break does not occur
when data is not matching.
Data matching
Break occurs when
data is matching.
■ Setting Number
The maximum constant and break conditions of monitoring data break vary as follows:
• Monitoring Data Break
Break conditions are set by address and data. Up to four points can be set. However, the break conditions
vary due to combination use with the "Sequencer" or the "Trace trigger".
■ Setting Method
The data monitoring break can be set depending on the following command.
• Command
- SET BREAK/DATAWATCH
• Dialog
- Breakpoints set dialog [code] tab
"Hardware/Monitoring data"
156
CHAPTER 2 DEPENDENCE FUNCTIONS
2.3.4.4
Sequential Break
A sequential break is a function to abort a executing program, when the sequential
condition is met by event sequential control.
■ Sequential Break
It is a function to discontinue the program execution when the sequential condition consists by the sequential
control of the event. Use a sequential break when the event mode is set to normal mode using the SET
MODE command.
When a break occurs due to a sequential break, the following message is displayed on the Status Bar.
Break at [Address] by sequential break
For details of the sequential break function, refer to Section "2.3.5 Control by Sequencer".
■ Setting Method
The sequential break is controlled by the following method.
1. Set event mode (SET MODE)
2. Set events (SET EVENT)
3. Set sequencer (SET SEQUENCE)
157
CHAPTER 2 DEPENDENCE FUNCTIONS
2.3.4.5
Guarded Access Break
The guarded access break is an abortion of the program execution that happens when
the violation to the set access attribute, doing the access, and guarded (An undefined
area cannot be accessed) area are accessed.
■ Guarded Access Break
A guarded access break aborts a executing program when access is made in violation of the access attribute
set by using the [Setup] - [Memory Map] menu, and access is attempted to a guarded area (access-disabled
area in undefined area).
There are three types of the following in Guarded access break.
Code guarded
When the instruction execution is done to the area without the code attribute, the break is done.
Read guarded
When the area without the read attribute is read, the break is done.
Write guarded
When the area without the write attribute is write, the break is done.
If a guarded access occurs while executing a program, the following message is displayed on the Status Bar
and the program is aborted.
Break at [Address] by guarded access {code/read/write} at Access address
Note:
Code Guarded is affected by pre-fetching.
The F2MC-16L/16LX/16/16H family pre-fetch up to 4 bytes. So, when setting the program area
mapping, set a little larger area (5 bytes max.) than the program area actually used.
Similarly, the F2MC-16F family pre-fetch up to 8 bytes. So, when setting the program area mapping,
set a little larger area (9 bytes max.) than the program area actually used.
158
CHAPTER 2 DEPENDENCE FUNCTIONS
2.3.4.6
Trace-Buffer-Full Break
It is a function to abort the program execution when the trace buffer becomes full.
■ Trace-Buffer-Full Break
It is a function to abort the program execution when the trace buffer becomes full.
When a break occurs due to a trace-buffer-full break, the following message is displayed on the Status Bar.
Break at [Address] by trace buffer full
■ Setting Method
The trace-buffer-full break is controlled by the following method.
• Command
- SET TRACE/BREAK
Refer to "4.30 SET TRACE (type 2)" in "SOFTUNE Workbench Command Reference Manual".
• Dialog
- Trace Set Dialog
Refer to "4.4.8 Trace" in "SOFTUNE Workbench Operation Manual".
159
CHAPTER 2 DEPENDENCE FUNCTIONS
2.3.4.7
Performance-Buffer-Full Break
It is a function to abort the program execution when the buffer for the performance
measurement data storage becomes full.
■ Performance-Buffer-Full Break
It is a function to abort the program execution when the buffer for the performance measurement data storage
becomes full.
When a break occurs due to a performance-buffer-full break, the following message is displayed on the
Status Bar.
Break at [Address] by performance buffer full
■ Setting Method
The performance-buffer-full break is controlled by the following method.
• Command
- SET PERFORMANCE/BREAK
Refer to "4.7 SET PERFORMANCE (type 1)" in "SOFTUNE Workbench Command Reference
Manual".
• Dialog
- Performance set dialog
Refer to "4.4.13 Performance" in "SOFTUNE Workbench Operation Manual".
160
CHAPTER 2 DEPENDENCE FUNCTIONS
2.3.4.8
External Trigger Break
It is a function to abort the execution of the program when an external signal is input
from TRIG pin that the emulator has.
■ External Trigger Break
It is a function to abort the execution of the program when an external signal is input from TRIG pin that the
emulator has.
When a break occurs due to an external trigger break, the following message is displayed on the Status Bar.
Break at [Address] by external trigger break
■ Setting Method
The external trigger break is controlled by the following method.
• Command
- SET TRIGGER
Refer to "3.42 SET TRIGGER" in "SOFTUNE Workbench Command Reference Manual".
• Dialog
- Debugging environment set dialog [emulation] tab
Refer to "4.7.2.3 Debug Environment" in "SOFTUNE Workbench Operation Manual".
161
CHAPTER 2 DEPENDENCE FUNCTIONS
2.3.4.9
Forced Break
It is a function to abort the execution of the program compulsorily.
■ Forced Break
It is a function to abort the execution of the program compulsorily.
When a break occurs due to a forced break, the following message is displayed on the Status Bar.
Break at [Address] by command abort request
Note:
A forced break is not allowed while the MCU is in the low-power consumption mode or hold state.
When a forced break is requested by the [Debug] - [Abort] menu while executing a program, the menu
is disregarded if the MCU is in the low-power consumption mode or hold state. If a break must occur,
then reset the cause at user system side, or reset the cause by using the [Debug] - [Reset MCU]
menu, after inputting the [Debug] - [Abort] menu.
When the MCU enters the low-power consumption mode or hold state while executing, the status is
displayed on the Status Bar.
162
CHAPTER 2 DEPENDENCE FUNCTIONS
2.3.5
Control by Sequencer
This emulator has a sequencer to control events. By using this sequencer, sampling of
breaks or traces can be controlled while monitoring program flow (sequence). A break
caused by this function is called a sequential break.
■ Control by Sequencer
As shown in Table 2.3-6, controls can be made at 3 different levels.
One event can be set for one level.
The sequencer always moves from Level 1 through Level 2 to Level 3. One event can be specified as a
sequencer restart condition.
When the debug function on MB2147-01 is set to Trace Enhancement mode, it is possible to control a trace
by a sequencer.
1. Complete the trace acquisition.
2. Transit to the next block (Only in multi trace mode)
Table 2.3-6 Sequencer Specifications
Function
Specifications
Level count
3 levels+ restart condition
Conditions settable for each level
1 event conditions (1 to 16777215 times pass count can be
specified for each condition.)
Restart conditions
1 event conditions (1 to 16777215 times pass count can be
specified.)
Operation when conditions established
Branching to another level or terminating sequencer
163
CHAPTER 2 DEPENDENCE FUNCTIONS
■ Setting Events
The emulator can monitor the MCU bus operation, and generate a trigger for a sequencer at a specified
condition. This function is called an event.
In the event, code (/CODE) and data access (/READ/WRITE) can be specified.
Up to eight events can be set. However, since hardware is shared with trace triggers, the actual numbers is
calculated as follows.
Current maximum constant of events
= 8 - (current number of trace trigger settings + current number of data monitoring break settings)
Table 2.3-7 shows the conditions that can be set for events.
Table 2.3-7 Conditions for Event and Trace Trigger
Condition
Description
Address
Memory location (address bit masking disabled)
Data
16-bit data (data bit masking enabled)
Access size
Byte, word
Status
Select from code, data read or data write
Note:
In instruction execution (/CODE), an event trigger is generated only when an instruction is executed.
This cannot be specified concurrently with other status (/READ or /WRITE).
Use the following commands to set an event.
SET EVENT :
Sets an event
SHOW EVENT :
Displays the status of event setting
CANCEL EVENT : Deletes an event
[Example]
>SET EVENT/CODE
func1
>SET EVENT/WRITE data[2],!d=h'10
>SET EVENT/READ/WRITE 102
164
CHAPTER 2 DEPENDENCE FUNCTIONS
2.3.5.1
Setting Sequencer
The sequencer operates in the following order:
1) The sequencer starts after the program execution.
2) Depending on the setting at each level (1 & 2), branching to the next level is performed
when the condition is met.
3) The sequencer is restarted when the restart condition is met.
4) The sequencer is terminated and a break occurs when the level 3 condition is met.
■ Setting Sequencer
The sequencer operates in the following order: The event can be set at each level and as a restart condition.
1. The sequencer starts after the program execution.
2. Depending on the setting at each level (1 & 2), branching to the next level is performed when the
condition is met.
3. The sequencer is restarted when the restart condition is met.
4. The sequencer is terminated and a break occurs when the level 3 condition is met.
Use the following commands to set the sequencer.
SET SEQUENCE: Setting an event for the sequencer
[Example]
>SET SEQUENCE 1, 3, 2, r=4
Set event 1, 3, 2 to level 1, 2, 3 respectively, and event 4 for the restart condition.
165
CHAPTER 2 DEPENDENCE FUNCTIONS
Figure 2.3-1 Operation of Sequencer
Program execution
start
Level1
NO
Event1
occurs
YES
YES
Event4
occurs
NO
Level2
Event3
occurs
YES
YES
NO
Event4
occurs
NO
Level3
Event2
occurs
YES
NO
Break
■ Setting Sequencer
The sequencer can be set by the dialog or the command.
● Setting by dialog
Select [Debug] - [Sequence] menu.
For details, refer to "4.6.6 Sequence" in "SOFTUNE Workbench Operation Manual".
● Setting by Command
1. The event is set according to the SET EVENT command.
2. The event set by the SET SEQUENCE command is set as a sequence.
For details, refer to "3.22 SET EVENT (type 2)" or "3.28 SET SEQUENCE (type2)" in "SOFTUNE
Workbench Command Reference Manual".
166
CHAPTER 2 DEPENDENCE FUNCTIONS
2.3.6
Real-time Trace
While execution a program, the address, data and status information, and the data
sampled by an external probe can be sampled in machine cycle units and stored in the
trace buffer. This function is called real-time trace.
In-depth analysis of a program execution history can be performed using the data
recorded by real-time trace.
■ Trace Buffer
The data recorded by sampling in machine cycle units, is called a frame.
The trace buffer can store 64K frames (65536). Since the trace buffer has a ring structure, when it becomes
full, it automatically returns to the start to overwrite existing data.
■ Trace Data
Data sampled by the trace function is called trace data.
The following data is sampled:
• Address
• Data
• Status Information
- Access status: Read/Write/Internal access, etc.
- Device status: Instruction execution, Reset, Hold, etc.
- Queue status: Count of remaining bytes of instruction queue, etc.
- Data valid cycle information: Data valid/invalid
(Since the data signal is shared with other signals, it does not always output data. Therefore, the trace
samples information indicating whether or not the data is valid.)
• Execution time based on the previous trace frame (in 25-ns units)
■ Data Not Traced
The following data does not leave access data in the trace buffer.
- Portion of access data while in native mode.
When operating in the native mode, the F2MC-16L/16LX family of chips sometime performs
simultaneous multiple bus operations internally. However, in this emulator, monitoring of the internal
ROM bus takes precedence. Therefore, other bus data being accessed simultaneously may not be sampled
(in the debugging mode, all operations are sampled).
■ Frame number
A number is assigned to each frame of sampled trace data. This number is called a frame number.
The frame number is used to specify the display start position of the trace buffer. The value 0 is assigned to
trace data at the triggering position for sequencer termination. Negative values are assigned to trace data that
have been sampled before arrival at the triggering position (See Figure 2.3-2).
If there is no triggering position for sequencer termination, the value 0 is assigned to the last-sampled trace
data.
167
CHAPTER 2 DEPENDENCE FUNCTIONS
Figure 2.3-2 Frame Numbering at Tracing
.
.
.
.
-3
-2
-1
0 (Trigger point)
■ Trace Filter
To make effective use of the limited trace buffer capacity, in addition to the code fetch function, a trace filter
function is incorporated to provide a means of acquiring information about data accesses to a specific region.
The data trace filter function allows the following values to be specified for two regions:
- Address
- Address mask
- Access attribute (read/write)
Another function can be used so that sampling of redundant frames occupying two or more trace frames, such
as SLEEP and READY, can be reduced to sampling of one frame.
■ Trace Trigger Setup
When preselected conditions are met during MCU bus operation monitoring, a trigger for starting a trace can
be generated. This function is called a trace trigger.
For the use of the trace trigger function, specify the code (/CODE) and data access (/READ/WRITE).
Up to 8 trace triggers can be preset each for code attribute and data access attribute. However, actually, the
maximum number of trace triggers is determined as indicated below because the common hardware is used
with events.
Current trace trigger maximum constant
= 8 - (current data monitoring break count setting + current event count setting)
For the trace trigger setup conditions that can be defined, see Table 2.3-6.
For trace trigger setup, use the following commands:
- SET TRACETRIGGER :
Sets trace trigger
- CANCEL TRACETRIGGER :
Deletes trace trigger
- SHOW TRACE/STATUS :
Displays trace setup status
Figure 2.3-3 shows a trace sampling operation.
168
CHAPTER 2 DEPENDENCE FUNCTIONS
Figure 2.3-3 Trace Sampling Operation (Trace Trigger)
Start
Resume
Suspend
Resume
Suspend
Resume
Suspend
Program flow
Trace buffer
■ Setting Data Monitoring Trace Trigger
When the debug function on MB2147-01 is set to Trace Enhancement mode, it is possible to set a trace
trigger by a data monitoring condition.
For the data monitoring condition, see the data monitoring break in Section "2.3.4 Break".
Current maximum constant of data monitoring trace triggers
= 8 - (number of data monitoring break settings + number of trace trigger settings +
current number of event settings)
Use the following commands to set the data monitoring trace trigger.
SET TRACETRIGGER/DATAWATCH :
Sets a data monitoring trace trigger
CANCEL TRACETRIGGER/DATAWATCH :
Deletes a data monitoring trace trigger
SHOW TRACETRIGGER/DATAWATCH :
Displays a data monitoring trace trigger
■ Trace Control during Executing User Program
In MB2147-01, the trace control is enabled while the user program is executed. However, it is necessary to
end the trace execution.
The parameter that can be controlled is as follows;
• Set trace trigger
• Set filtering area
• Display trace data
• Clear trace data
• Search trace data
• Set trace delay*
• Display measurement result of time*
• Forced termination/resumption of trace execution*
*: Only when the debugging is in trace enhancement mode.
Notes:
• The trace execution means the trace data acquisition is "Tracing" or "Pause".
• The following method exists to terminate the trace execution.
1. Forced termination of trace execution
- Trace window - Shortcut menu [Forced termination]
- Trace toolbar [Forced termination] button
2. Trace trigger (Termination)
- SET TRACETRIGGER command
- Trace trigger setting dialog
169
CHAPTER 2 DEPENDENCE FUNCTIONS
2.3.6.1
Setting Single Trace
To perform a single trace, follow steps 1 through 4 below. When a program is executed
after completion of the following steps, trace data is sampled.
1) Set an event mode to single trace mode.
2) Enable the trace function.
3) Perform the event and sequencer setup.
4) Perform trace buffer full break setup.
■ Setting Trace
To perform a single trace, complete the following setup steps. When a program is executed after completion
of the steps, trace data is sampled.
1) Set an event mode to single trace mode.
Use SET MODE command for this setting.
2) Enable the trace functions.
Enable the trace function using the ENABLE TRACE command.
To disable the trace function, use the DISABLE TRACE command.
Note that the trace function is enabled by default when the program is launched.
3) Perform the event and sequencer setup.
Use of a trace trigger makes it possible to control trace sampling and make effective use of the limited
trace buffer capacity. If there is no such necessity, setup need not be performed.
With a trace trigger, it is possible to specify the start and stop of trace sampling to be performed at a
trigger hit.
To use a trace trigger, input the SET TRACE/TRIGGER command and then perform trace trigger setup
using the SET TRACETRIGGER command.
4) Perform trace buffer full break setup.
A break can be invoked when the trace buffer becomes full.
To perform setup, use the SET TRACE command. This break feature is disabled when the program starts.
To view the setting, use SHOW TRACE/STATUS.
Table 2.3-8 lists trace-related commands in the single trace.
Table 2.3-8 Trace-related Commands Available in Single Trace
Available command
170
Function
SET TRACETRIGGER
CANCEL TRACETRIGGER
Sets trace trigger
Deletes trace trigger
SET TRACE
SHOW TRACE
SEARCH TRACE
ENABLE TRACE
DISABLE TRACE
CLEAR TRACE
Sets trace buffer full break
Displays trace data
Searches for trace data
Enables trace function
Disables trace function
Clears trace function
CHAPTER 2 DEPENDENCE FUNCTIONS
2.3.6.2
Multi Trace
Only when an event trigger occurred, the multi trace samples data before and after the
event trigger.
■ Multi Trace
To use the multi trace function, the SET MODE command is set to the following mode.
Debug function: "Trace Enhancement" mode
Event mode: "Multi trace" mode
The multi trace samples data where an event trigger (trace end trigger) occurs before and after the event
trigger.
It can be used for tracing required only when a certain variable access occurs, instead of continuous tracing.
The trace data sampled at one event trigger is called a block. The trace buffer for multi trace in MB2147-01
can hold 64K frames. When dividing into blocks, select the size of one block from 128/256/512/1024 frame.
64 to 512 blocks can be sampled according to the block size.
There are the following two event triggers of the multi trace.
• Trace end trigger:
Change to the next block in the point that becomes a hit.
• Multi trace end trigger:
Terminate the trace acquisition in the point that becomes a hit.
Figure 2.3-4 Multi Trace Sampling
Start
execution
Event 1
Event 2
Event 3
↓
↓
↓
↓
Program flow
Trace buffer
Block
■ Multi Trace Frame Number
Data of 128 to 1024 frames can be sampled according to the block size at each time an event occurs (trace
end trigger). This data unit is called a block, and each sampled block is numbered starting from 0. This is
called the block number.
A block is a collection of sampled data before and after the event trigger occurs. At the event trigger is 0,
trace data sampled before reaching the event trigger point is numbered negatively, and trace data sampled
after the event trigger point is numbered positively. These frame numbers are called local numbers (See
Figure 2.3-5).
In addition to this local number, there is another set of frame numbers starting 1 with the oldest data in the
trace buffer. This is called the global number. Since the trace buffer can hold 64K frames, frames are
numbered 1 to 65536 (See Figure 2.3-5).
To specify which frame data is displayed, use the global number or block and local numbers.
171
CHAPTER 2 DEPENDENCE FUNCTIONS
Figure 2.3-5 Frame Number in Multi Trace
Block number
Trace buffer
Frame number
Global number
1
2
512
Local number
1
2
:
:
64
:
:
127
128
129
130
:
:
192
:
:
255
256
- 63
- 62
:
:
0
:
:
+ 62
+ 63
- 63
- 62
:
:
0
:
:
+62
+63
65409
65410
:
:
65472
:
:
65535
65536
- 63
- 62
:
:
0
:
:
+62
+63
Event trigger
Event trigger
Event trigger
■ Trace Delay
The trace data which is acquired after one event occurrence is called a trace delay. There are two types of
trace delay depending on the event hit.
When the trace end trigger (event) hit occurs, the delay can be set within the scope of the block size (128 to
1024 frames). A block is sampled data in combination with the trace data before the event hit and the trace
delay.
When the multi trace end trigger (event) hit occurs, the delay is acquired as many as the number of
occurrence of the subsequent trace end trigger hit.
Example: If you want to get the trace delay for three blocks, the event hit needs to occur four times.
1
2
3
4
Get four times of the hit to the trace end trigger
Multitrace end trigger
Trace buffer = 64 blocks
172
CHAPTER 2 DEPENDENCE FUNCTIONS
Note:
The multi trace function in MB2147-01 is exclusive with the RAM Checker function. For more details,
refer to Section "2.3.1.6 Debug Function".
173
CHAPTER 2 DEPENDENCE FUNCTIONS
2.3.6.3
Setting Methods of Multi Trace
Before executing the multi trace, the following settings must be made. After these
settings, trace data is sampled when a program is executed.
1. Set the debug function to "Trace Enhancement" mode.
2. Set event mode to multi trace mode.
3. Enable trace function.
4. Set event and sequencer.
5. Set trace-buffer-full break.
■ Setting Methods of Multi Trace
Before executing the multi trace, the following settings must be made. After these settings, trace data is
sampled when a program is executed.
1) Set the debug function to Trace Enhancement mode.
Use SET MODE command for this setting.
2) Set event mode to multi trace mode.
Use the SET MODE command for this setting.
3) Enable trace function.
Use the ENABLE MULTITRACE command for this setting. To disable the function, use the DISABLE
MULTITRACE command.
4) Set an event (trace trigger).
Set an event for sampling the multi trace. Use the SET TRACETRIGGER command for this setting.
5) Set trace-buffer-full break.
To break when the trace buffer becomes full, set the trace-buffer-full break. Use the SET MULTITRACE
command for this setting.
6) Set a block size.
Use SET MULTITRACE command to set this.
7) Set a trace delay.
Use SET DELAY command to set this.
174
CHAPTER 2 DEPENDENCE FUNCTIONS
Table 2.3-9 shows the list of trace-related commands that can be used in multi trace mode.
Table 2.3-9 Trace-related Commands That Can Be Used in Multi Trace Mode
Mode
Multi trace
mode
Usable Command
Function
SET TRACETRIGGER
SHOW TRACETRIGGER
CANCEL TRACETRIGGER
ENABLE TRACETRIGGER
DISABLE TRACETRIGGER
Sets events
Displays event setup status
Deletes event
Enables event
Disables event
SET MULTITRACE
SHOW MULTITRACE
SEARCH MULTITRACE
ENABLE MULTITRACE
DISABLE MULTITRACE
CLEAR MULTITRACE
Sets trace-buffer-full break
Displays trace data
Searches trace data
Enables trace function
Disables trace function
Clears trace data
SET DELAY
SHOW DELAY
Sets trace delay
Displays trace delay
175
CHAPTER 2 DEPENDENCE FUNCTIONS
2.3.6.4
Displaying Trace Data Storage Status
It is possible to displays how much trace data is stored in the trace buffer. This status
data can be read by specifying /STATUS to the SHOW TRACE command.
■ Displaying Trace Data Storage Status
It is possible to displays how much trace data is stored in the trace buffer. This status data can be read by
specifying /STATUS to the SHOW TRACE.
[Example]
>SHOW TRACE/STATUS
en/dis
= enable
buffer full = nobreak
sampling
= end
code
= enable
verbose
= disable
frame no.
= -00120 to
>
176
;
;
;
;
;
00000 ;
Trace function enabled
Buffer full break function disabled
Trace sampling terminates
Code execution enabled
Verbose trace disabled
Frame -120 to 0 store data
CHAPTER 2 DEPENDENCE FUNCTIONS
2.3.6.5
Specify Displaying Trace Data Storage Status
The data display start position in the trace buffer can be specified by inputting a step
number or frame number using the SHOW TRACE command. The data display range can
also be specified.
■ Specifying Displaying Trace Data Start
Specify the data display start position in the trace buffer by inputting a step number or frame number using
the SHOW TRACE command. The data display range can also be specified.
[Example]
- In Single Trace Mode
>SHOW TRACE/CYCLE -6
; Start displaying from frame -6
>SHOW TRACE/CYCLE -6..0
; Display from frame -6 to frame 0
>SHOW TRACE -6
; Start displaying from frame -6
>SHOW TRACE -6..0
; Displays from frame -6 to frame 0
177
CHAPTER 2 DEPENDENCE FUNCTIONS
2.3.6.6
Display Format of Trace Data
The trace data display format can be selected by running the SHOW TRACE command
with a command modifier specified. If setup is completed with the SET SOURCE
command so as to select a source line addition mode, a source line is attached to the
displayed trace data.
There are three formats to display trace data:
• Display in instruction execution order (Specify /INSTRUCTION.)
• Display all machine cycles
(Specify /CYCLE.)
• Display in source line units
(Specify /SOURCE.)
■ Display in Instruction Execution Order (Specify /INSTRUCTION.)
Trace sampling is performed at each machine cycle, but the sampling results are difficult to display because
they are influenced by pre-fetch, etc. This is why the emulator has a function to allow it to analyze trace data
as much as possible. The resultant data is displayed after processes such as eliminating pre-fetch effects,
analyzing execution instructions, and sorting in instruction execution order are performed automatically.
However, this function can be specified only in the single trace while in the debugging mode.
In this mode, data can be displayed in the following format.
178
CHAPTER 2 DEPENDENCE FUNCTIONS
Address
Hexadecimal
Disassemble Description
Time Stamp
Indecates instruction
executed
Displays difference of executed
time between this frame and
next frame (decimal).
The unit is ns.
Step Number
Decimal, signed
Data
Hexadecimal
>SHOW TRACE -194
frame no. address mnemonic
time stamp
-00 675 : FF0 2C1 PUSHW A
375
-00 672 : 0 18257 ex ternal write access.
5F
375
-00 669 : 018258 external write access.
5E
375
-00 666 : FF 02C2 CALL
\ sort_val
625
-00 661 : 018 255 external write access.
C5
625
-00 658 : 018256 external write access.
02
625
\ sort_val :
-00 655 : FF00D2 LINK
#0E
500
-00 651 : 018253 external read access.
81
625
-00 648 : 018254 external read access.
81
625
-00 64 5 : 000186 in ternal write access. 0000
625
-00 643 :
** RESET **
** STANDBY ** :
>
** RESET ** :
Data Access
internal read access :
Read access to
internal memory
internal write access :
Write access to
internal memory
external read access :
Read access to
external memory
external write access :
Write access to
external memory
** THOLD **
** UHOLD **
** WAIT **
Device Status
Hardware standby
Reset
: Tool hold
** SLEEP **
: User hold
: Ready pin input
: Sleep
** STOP **
: Stop
■ Displaying All Machine Cycles (Specify /CYCLE)
Detailed information at all sampled machine cycles can be displayed.
In this mode, no source is displayed irrespective of the setup defined by the SET SOURCE command.
[Example]
>SHOW TRACE/CYCLE -672
frame no. address
data
-00672
: 018257 ----00671
: 018257 5F
-00670
: 018257 5F
-00669
: 018257 ----00668
: 018257 82
-00667
: FF02C6 5F
-00666
: ------ ----00665
: FF02C6 ----00664
: FF02C6 5F06
-00663
: FF00D2 ----00662
: FF00D2 0E08
-00661
: 018255 ----
a-status
EWA
----EWA
------ICF
--ICF
--EWA
d-status
------EXECUTE
EXECUTE
------EXECUTE
EXECUTE
EXECUTE
------EXECUTE
------EXECUTE
-------
Qst
------------4by
--FLH
-------
dfg event
&
@
@
&
@
@
C
&
D
@
&
@
&
time stamp
125
125
125
125
125
125
125
125
125
125
125
125
179
CHAPTER 2 DEPENDENCE FUNCTIONS
How to read trace data
frame no.
address
data
a-status
d-status
Qst
dfg
event
time stamp
(1)
(2)
(3)
(4)
(5)
(6)
(7)
(8)
(9)
(1):frame number (Decimal number)
(2):executed instruction address, and data access address (Hexadecimal number)
(3):data (Hexadecimal number)
(4):access information (a-status)
IWA
:
write access to internal memory
EWA
:
write access to external memory
IRA
:
read access to internal memory
ERA
:
read access to external memory
ICF
:
code fetch to internal memory
ECF
:
code fetch to external memory
---
:
valid "d-status" information
(5):device status (d-status)
STANDBY
:
hardware standby
THOLD
:
tool hold
UHOLD
:
user hold
WAIT
:
waiting with ready pin
SLEEP
:
sleep
STOP
:
stop
EXECUTE
:
execute instruction
RESET
:
reset
-------
:
invalid d-status information
(6):instruction queue status
FLH
:
flush queue
-by
:
number of remainder code of queue is - byte (-: 1 to 8)
(7):information valid flag
&
:
address is valid
@
:
data is valid
(8):event information
C
:
code event
D
:
data event
(9):time stamp display (ns unit)
displays difference of executed time between this frame and next frame (decimal)
Note:
Information about event hits is excluded from the displayed information. For code execution, in
particular, the effect of a prefetch is eliminated in consideration of the count of data in the instruction
queue. Therefore, the information about hits is displayed for frames after a prefetch frame at an
address for which an event is set.
180
CHAPTER 2 DEPENDENCE FUNCTIONS
■ Display in Source Line Units (Specify /SOURCE.)
Only the source line can be displayed. This mode is enabled only in the debugging mode.
[Example]
>SHOW TRACE/SOURCE -1010..-86
step no. source
-01007
: sample.c$68
value[i] =
&target[I];
-00905
: sample.c$68
value[i] =
&target[I];
-00803
: sample.c$68
value[i] =
&target[I];
-00698
: sample.c$70
-00655
: sample.c$9
-00594
: sample.c$13
-00185
: sample.c$14
-00149
: sample.c$15
p = tblp[i - 1];
-00088
: sample.c$16
while ((j = 2 * i)
sort_val(value, 16L);
{
for (k = max / 2; k
>= 1; k--){
i = k;
<= max){
Note:
The following operation may be subjected to trace sampling immediately after the MCU operation is
stopped (tool hold). Remember that the operation is unique to evaluation chips and not performed by
mass-produced products.
Access to address 0x000100 and addresses between 0x0FFFFDC and 0x0FFFFFF
181
CHAPTER 2 DEPENDENCE FUNCTIONS
2.3.6.7
Reading Trace Data On-the-fly
Trace data can be read while executing a program. However, this is not possible during
sampling. Disable the trace function or terminate tracing before attempting to read trace
data.
■ Reading Trace Data On-the-fly
To disable the trace function, use the DISABLE TRACE command. Confirm whether or not the trace
function is currently enabled by executing the SHOW TRACE command with /STATUS specified, or by
using the built-in variable, %TRCSTAT.
Tracing terminates when the delay count ends after the sequencer has terminated. If Not Break is specified
here, tracing terminates without a break operation. It is possible to confirm whether or not tracing has
terminated by executing the SHOW TRACE command with /STATUS specified, or by using the built-in
variable, %TRCSAMP.
To read trace data, use the SHOW TRACE command; to search trace data, use the SEARCH TRACE
command. Use the SET DELAY command to set the delay count and break operation after the delay count.
[Example]
>GO
>SHOW TRACE/STATUS
en/dis
= enable
buffer ful
= nobreak
sampling
= on
code
: enable
verbose
: disable
<- Trace sampling continues.
>SHOW TRACE/STATUS
en/dis
= enable
buffer full = nobreak
sampling
= end
<- Trace sampling ends.
code
: enable
verbose
: disable
frame no.
= -00805 to
00000
>SHOW TRACE -52
step no.
address
mnemonic
time stamp
sort_val:
-00655
: FF00D2
LINK
-00651
: 018253
external
read access.
81
500
-00648
: 013254
external
read access.
81
625
-00645
: 000186
internal
write access.
0000
625
.
#0E
.
625
.
If the CLEAR TRACE command is executed with the trace ending state, trace data sampling can be reexecuted by re-executing the sequencer from the beginning.
182
CHAPTER 2 DEPENDENCE FUNCTIONS
2.3.6.8
Saving Trace Data
This section explains how to save trace data.
■ Saving Trace Data
Trace data can be saved in a specified file.
The following two methods are available to save trace data: using GUI (window or dialog) and using only the
command. The same result is obtained from both methods.
● Using GUI for Saving Trace Data
1. Display the trace window.
- Select [View] - [Trace] menu.
2. Specify the name of the file in which to save trace data.
- Right-click on the trace window, and select [Save] from the shortcut menu. The [Save as] dialog
appears.
Specify the file name and where to save trace data. For details, refer to Section "4.4.8 Trace" in
"SOFTUNE Workbench Operation Manual".
● Using Command for Saving Trace Data
1. Save trace data.
- Execute the SHOW TRACE/FILE command.
For details, refer to Section "4.33 SHOW TRACE (type 3)" in "SOFTUNE Workbench Command
Reference Manual".
When additionally saving trace data in an existing file, execute the SHOW TRACE/FILE/APPEND
command.
183
CHAPTER 2 DEPENDENCE FUNCTIONS
2.3.7
Measuring Performance
It is possible to measure the time and pass count between two events. Repetitive
measurement can be performed while executing a program in real-time, and when done,
the data can be totaled and displayed.
Using this function enables the performance of a program to be measured. To measure
performance, set the event mode to the performance mode using the SET MODE
command.
■ Performance Measurement Function
The performance measurement allows the time between two event occurrences to be measured and the
number of event occurrences to be counted. Up to 65535 event occurrences can be measured.
● Measuring Time
Measures time interval between two events.
Events can be set at 8 points (1 to 8). However, in the performance measurement mode, the intervals, starting
event number and ending event number are combined as follows. Four intervals have the following fixed
event number combination:
Interval
Starting Event Number
Ending Event Number
1
1
2
2
3
4
3
5
6
4
7
8
● Measuring Count
The specified events become performance measurement points automatically, and occurrences of that event
are counted.
184
CHAPTER 2 DEPENDENCE FUNCTIONS
2.3.7.1
Performance Measurement Procedures
Performance can be measured by the following procedure:
• Setting event mode.
• Setting minimum measurement unit for timer.
• Specify performance-buffer-full break.
• Setting events.
• Execute program.
• Display measurement result.
• Clear measurement result.
■ Setting Event Mode
Set the event mode to the performance mode using the SET MODE command. This enables the performance
measurement function.
[Example]
>SET MODE/PERFORMANCE
>
■ Setting Minimum Measurement Unit for Timer
It is 1ns as the minimum measurement unit for the timer used to measure performance. And a resolution of
performance measurement data is 25ns.
■ Specify Performance-Buffer-Full Break
When the buffer for storing performance measurement data becomes full, a executing program can be
broken. This function is called the performance-buffer-full break. The performance buffer becomes full when
an event occurs 65535 times.
If the performance-buffer-full break is not specified, the performance measurement ends, but the program
does not break.
[Example]
>SET PERFORMANCE/NOBREAK
<- Specifying Not Break
>
■ Setting Events
Set events using the SET EVENT command.
The starting/ending point of time measurement and points to measure pass count are specified by events.
Events at 8 points (1 to 8) can be set. However, in the performance measurement, the intervals, starting event
number and ending event number are fixed in the following combination.
● Measuring Time
Four intervals have the following fixed event number combination.
185
CHAPTER 2 DEPENDENCE FUNCTIONS
Interval
Starting Event Number
Ending Event Number
1
1
2
2
3
4
3
5
6
4
7
8
● Measuring Count
The specified events become performance measurement points automatically.
■ Executing Program
Start measuring when executing a program by using the GO or CALL command. If a break occurs during
interval time measurement, the data for this specific interval is discarded.
■ Displaying Performance Measurement Data
Display performance measurement data by using the SHOW PERFORMANCE command.
■ Clearing Performance Measurement Data
Clear performance measurement data by using the CLEAR PERFORMANCE command.
[Example]
>CLEAR PERFORMANCE
>
186
CHAPTER 2 DEPENDENCE FUNCTIONS
2.3.7.2
Display Performance Measurement Data
Display the measured time and measuring count by using the SHOW PERFORMANCE
command.
■ Displaying Measured Time
To display the time measured, specify the starting event number or the ending event number.
Event number
Count of measuring within given time interval
>SHOW PERFORMANCE/TIME 1,9000,18999,1000
Minimum
execution time
Maximum
execution time
time (s)
|
count
event
= 1 -> 2
min time
= 11637.0
max time
= 17745.0
0.0 -
8999.0
|
avr time
= 14538.0
9000.0 -
9999.0
|
0
10000.0 -
10999.0
|
0
11000.0 -
11999.0
|
2
12000.0 -
12999.0
|
19
13000.0 -
13999.0
|
52
14000.0 -
14999.0
|
283
15000.0 -
15999.0
|
92
16000.0 -
16999.0
|
3
17000.0 -
17999.0
|
1
18000.0 -
18999.0
|
0
|
0
Average
execution time
Total measuring count
-----------------------------+---------
19000.0 -
0
-----------------------------+--------total
>SHOW PERFORMANCE/TIME
event
= 1 -> 2
min time = 11637.0
max time = 17745.0
avr time = 14538.0
Lower time limit for display
Upper time limit for display
|
452
1,13000,16999,500
time (µs)
|
count
-----------------------------+--------0.0 12999.0
|
21
13000.0 13499.0
|
13
13500.0 13999.0
|
39
14000.0 14499.0
|
121
14500.0 14999.0
|
162
15000.0 15499.0
|
76
15500.0 15999.0
|
16
16000.0 16499.0
|
2
16500.0 16999.0
|
1
17000.0 17499.0
|
1
-----------------------------+--------total
|
452
187
CHAPTER 2 DEPENDENCE FUNCTIONS
2.3.8
Measuring Coverage
This emulator has the C0 coverage measurement function. Use this function to find what
percentage of an entire program has been executed.
■ Coverage Measurement Function
When testing a program, the program is executed with various test data input and the results are checked for
correctness. When the test is finished, every part of the entire program should have been executed. If any part
has not been executed, there is a possibility that the test is insufficient.
This emulator coverage function is used to find what percentage of the whole program has been executed. In
addition, details such as which addresses were not accessed can be confirmed.
This enables the measurement coverage range to be set.
To execute the C0 coverage, set a range within the code area. In addition, setting a range in the data area,
permits confirming the access status of variables such as finding unused variables, etc.
Execution of coverage measurement is limited to the address space specified as the debug area.
Therefore, set the debug area in advance.
This is operable by enabling the coverage function on the chip tabs: [Environment] - [Setup Debugging
Environment] - [Debug Environment] menu.
■ Coverage Measurement Procedures
The procedure for coverage measurement is as follows:
1. Set range for coverage measurement:
SET COVERAGE
2. Measuring coverage:
GO, STEP, CALL
3. Displaying measurement result:
SHOW COVERAGE
■ Coverage Measurement Operation
The following operation can be made in coverage measurement:
- Load/Save of coverage data:
LOAD/COVERAGE, SAVE/COVERAGE
- Abortion and resume of coverage measurement: ENABLE COVERAGE, DISABLE COVERAGE
- Clearing coverage data:
CLEAR COVERAGE
- Canceling coverage measurement range:
CANCEL COVERAGE
Note:
When the coverage measurement function is used, the monitoring function in RAM area of the 0 bank
cannot be used. For more details, refer to Section "2.3.9 Real-time Monitoring".
188
CHAPTER 2 DEPENDENCE FUNCTIONS
2.3.8.1
Coverage Measurement Procedures
The procedure for coverage measurement is as follows:
• Set range for coverage measurement : SET COVERAGE
• Measure coverage
: GO, STEP, CALL
• Display measurement result
: SHOW COVERAGE
■ Setting Range for Coverage Measurement
Use the SET COVERAGE command to set the measurement range. The measurement range can be set only
within the area defined as the debug area. Up to 32 ranges can be specified.
By specifying /AUTOMATIC for the command qualifier, the code area for the loaded module is set
automatically. However, the library code area is not set when the C compiler library is linked.
[Example]
>SET COVERAGE FF0000 .. FFFFFF
■ Measuring Coverage
When preparing for coverage measurement, execute the program.
Measurement starts when the program is executed by using the GO, STEP, or CALL command.
■ Displaying Coverage Measurement Result
To display the following coverage measurement result, use the SHOW COVERAGE command.
• Display coverage rate of total measurement area
• Displaying coverage rate of load module
• Summary of 16 addresses as one block
• Details indicating access status of each address
• Displaying coverage measurement result per source line
• Displaying coverage measurement result per machine instruction
● Display Coverage Rate of Total Measurement Area (Specify /TOTAL for command qualifier)
>SHOW COVERAGE/TOTAL
total coverage : 82.3%
● Displaying coverage rate of load module (Specify /MODULE for the command qualifier)
>SHOW COVERAGE/MODULE
sample.abs . . . . . . . . . . . . . . . . . . . . . . . . (84.03%)
+ - startup.asm . . . . . . . . . . . . . . . . . . . . (90.43%)
+ - sample.c . . . . . . . . . . . . . . . . . . . . . . . (95.17%)
+ - samp.c . . . . . . . . . . . . . . . . . . . . . . . (100.00%)
Displays the load modules and the coverage rate of each module.
189
CHAPTER 2 DEPENDENCE FUNCTIONS
● Summary (Specify /GENERAL for command qualifier)
>SHOW COVERAGE/GENERAL
(HEX)0X0
+1X0
+2X0
+---------------+---------------+-----address 0123456789ABCDEF0123456789ABCDEF0123456
FF0000 **3*F*.......
-----... ABCDEF
C0(%)
32.0
Display the access status of every 16 addresses
.
: No access
1 to F : Display the number accessed in 16 addresses by the hexadecimal number.
: Access all of the 16 addresses.
*
● Details (Specify /DETAIL for command qualifier.)
Display one line of a
coverage rate
>SHOW COVERAGE/DETAIL FF0000
address +0
FF0000
FF0010
FF0020
.
FF0030
FF0040
FF0050
FF0060
.
FF0070
.
FF0080
.
+1
.
.
.
.
.
+2
.
.
.
.
+3
.
.
.
.
+4
.
.
.
+5
.
.
.
+6
.
.
.
+7
.
.
.
.
+8
.
.
.
.
+9
.
.
.
.
+A
.
.
.
.
+B
.
.
.
.
Display the access status of every 1 address
.
-
190
: No access
: Access
+C
.
.
.
.
+D
.
.
.
.
+E
.
.
.
.
+F
.
.
.
.
C0(%)
100.0
100.0
18.6
100.0
93.7
100.0
0.0
0.0
0.0
CHAPTER 2 DEPENDENCE FUNCTIONS
● Displays per source line (Specify /SOURCE for the command qualifier)
>SHOW COVERAGE/SOURCE main
*
70: {
71:
int i;
72:
struct table *value[16];
73:
*
74:
for (i=0; i<16; i++)
*
75:
value[i] = &target[i];
76:
*
77:
sort_val(value, 16L);
.
78: }
Displays access status of each source line.
.:
No Access
*:
Accessed
Blank: Line which the code had not been generated or is outside
the scope of the coverage measurement
● Displays per machine instruction (Specify /INSTRUCTION for the command qualifier)
>SHOW COVERAGE/INSTRUCTION F9028F
sample.c$70 {
* F9028F
\main:
* F9028F 0822
LINK
#22
* F90291 4F01
PUSHW RW0
sample.c$74
for (i=0; i<16; i++)
. F90293 D0
MOVN
A,#0
. F90294 CBFE
MOVW @RW3-02,A
. F90296 BBFE
MOVW
A,@RW3-02
. F90298 3B1000
CMPW
A,#0010
. F9029B FB18
BGE
F902B5
sample.c$75
value[i] = &target[i];
. F9029D BBFE
MOVW
A,@RW3-02
. F9029F 0C
LSLW
A
. F902A0 98
MOVW
RW0,A
. F902A1 71F3DE
MOVEA A,@RW3-22
. F902A4 7700
ADDW
RW0,A
. F902A6 4214
MOV
A,#14
. F902A8 7833FE
MULUW A,@RW3-02
. F902AB 38A001
ADDW
A,#01A0
Displays access status of each source line.
.:
No Access
*:
Accessed
Blank: Instruction outside the scope of the coverage measurement
191
CHAPTER 2 DEPENDENCE FUNCTIONS
2.3.9
Real-time Monitoring
The real-time monitoring function is used to display the memory contents during
program execution.
■ Real-time Monitoring
The emulator can use the real-time monitoring function when the evaluation chip has the external trace bus
interface.
A real-time monitoring window is provided to display two 256-byte regions for real-time monitoring
purposes. The real-time monitoring window has a function for reading data from the actual memory and
displaying it before program execution (copy function), and a function for displaying updated data in red.
■ When referring to RAM area of the 0 bank
To use the real-time monitoring function in the RAM area of the 0 bank, the coverage function must be
disabled by the following methods.
• Command
DISABLE COVERAGE
Refer to "4.23 DISABLE COVERAGE" in "SOFTUNE Workbench Command Reference Manual".
• Dialog
[Chip] tab on the Setup debug environment dialog.
Refer to "4.7.2.3 Debug Environment" in "SOFTUNE Workbench Operation Manual".
192
CHAPTER 2 DEPENDENCE FUNCTIONS
2.3.10
Execution Time Measurement
This function measures the program execution time.
■ Measurement Items
Measures time between the start and stop of program execution.
In this emulator debugger, the measurement is performed by the emulation timer or cycle counter. The
following shows the features.
• Emulation timer
Resolution : 25 ns
Significant bits: 56 bits
Maximum measurement time : 72,057,594,037,927,935 25 ns
• Cycle counter
Significant bits: 56 bits
Maximum measurement cycle count : 72,057,594,037,927,935 cycles
In either case, the measurement is performed whenever a program is executed, and the measurement result
displays the following two values:
• Number of cycles spent on the previous program execution
• Total number of cycles executed since the previous clearing
■ Displaying Measurement Results
Either of the following methods can be used to display the measurement results.
• Display by dialog
The results appear in the time measurement dialog, which can be displayed by selecting [Debug] - [Time
Measurement] menu.
For details, refer to Section "4.6.8 Time Measurement" in "SOFTUNE Workbench Operation Manual".
• Display by command
Enter the SHOW TIMER command in the command window.
For details, refer to Section "4.27 SHOW TIMER" in "SOFTUNE Workbench Command Reference Manual".
■ Clearing Measurement Results
Either of the following methods can be used to clear the measurement results.
• Clearing by dialog
Click the [Clear] button in the time measurement dialog, which can be displayed by selecting [Debug] [Time Measurement] menu.
For details, refer to Section "4.6.8 Time Measurement" in "SOFTUNE Workbench Operation Manual".
193
CHAPTER 2 DEPENDENCE FUNCTIONS
• Clearing by command
Enter the CLEAR TIMER command in the command window.
For details, refer to Section "4.28 CLEAR TIMER" in "SOFTUNE Workbench Command Reference Manual".
Note:
The measured execution time is added about ten extra cycles per execution. If the execution cycle is
measured, execute many instructions continuously in order to minimize the effect of error.
194
CHAPTER 2 DEPENDENCE FUNCTIONS
2.3.11
Power-on Debugging
This section explains power-on debugging by the emulator (MB2147-01).
■ Power-on Debugging
Power-ON debugging refers to the operation to debug the operating sequence that begins when the power to
the target is switched on.
For products with a dedicated power-on debugging pin, the emulator (MB2147-01) can debug the sequence
performed immediately after power-on. The following functions are available:
Code break
Data monitoring break
Data break
Sequencer and event
Trace trigger
Trace measurement
Coverage measurement
The power-on debugging procedure is described below:
- Set the DIP switch on the adapter board mounted in the upper part of the emulator.
- Turn on the target board and emulator main unit.
- Launch Workbench to start debugging.
For debugging, set hardware breaks, etc.
- To start a power-on debugging, run [Execute] - [Power-ON Debug] menu.
Input the lower limit value of the monitoring voltage from the [User Power Monitor Voltage] dialog
box to display PON in the input status bar.
- Run the program.
- Turn the target board off while running and then back on.
- Conduct debugging.
- To terminate the power-on debugging, run [Execute] - [Power-ON Debug] menu.
195
CHAPTER 2 DEPENDENCE FUNCTIONS
2.3.12
RAM Checker
This section describes the functions of the RAM Checker.
■ Overview
The RAM checker obtains history logs of accessing the monitoring addresses on SOFTUNE Workbench and
graphically displays log files using the accessory tool, "RAM Checker Viewer".
SOFTUNE Workbench has the following functions
- Sets monitoring addresses at 16 points
- Logs data access history of monitoring addresses at intervals of 1 ms
- Monitors monitoring addresses at intervals of 100 ms
■ RAM Check Window
The debugging window "RAM Checker" has been added to SOFTUNE Workbench to log/monitor
monitoring addresses.
For operations of Ram checker Window, refer to Section "3.21 RAM Checker Window" of "SOFTUNE
Workbench Operation Manual".
■ Use Conditions
The RAM Checker operates under the following conditions.
- Emulator: MB2147-01
- Communication device: USB
The RAM Checker cannot be used for the MB2141/MB2147-05 emulator, or the RS/LAN communication
device. In those environments, the main menu [View] - [RAM Checker] is not disabled.
Note:
The RAM Checker is enabled only when the debug function on MB2147-01 is set to "RAM Checker"
mode. For more details, see Section "2.3.1.6 Debug Function".
196
CHAPTER 2 DEPENDENCE FUNCTIONS
■ Specifications List
Monitoring Point Count
16 points
Size
Bytes/word (16 bits)
Event Functions
Max. 8 Points
Sampling Time
1 ms (Fixed)
Update Intervals
100 ms (Fixed)
Log File Formats
SOFTUNE format or CSV format
• SOFTUNE format
- To display in the RAM Checker viewer (recommended)
- Default extension is ".SRL".
• CSV format
- To display in other applications than the RAM Checker viewer
- Default extension is ".CSV".
Note:
The CSV format requires size of data approximately 4 times that of the SOFTUNE format.
■ To Use the RAM Checker
User sets the monitoring points, Log File, logging status by GUI or Command to use the RAM Checker.
• GUI
- Set the debug function to "RAM Checker" mode by using [Debug] - [Select Debug Function].
- By short cut menu [Setup...] on the Ram checker Window, user sets the monitoring points.
- By short cut menu [File...] on the Ram checker Window, user sets the Log File.
- By checking the short cut menu: [Logging start] on the Ram checker Window, a logging status of the
Ram Checker becomes to enable.
• COMMAND
- Set the debug function to "RAM Checker" mode by using SET MODE/CONFIG command.
- By command: SET RAMCHECK, user sets the monitoring points.
- By command: SET RAMCHECK, user sets the Log File.
- By command: ENABLE RAMCHECK, a logging status of the Ram Checker becomes to enable.
After these commands are set, user program execute and Log File is created by stopped user program. If it is
restarted, a Log File is overwritten.
Note:
If a setting of Overwrite control is enabled on Setup file dialog, a Log File is saved with different name
every other execution.
197
CHAPTER 2 DEPENDENCE FUNCTIONS
For details about settings of the RAM Checker viewer, refer to Section "3.21 RAM Checker Window" of
"SOFTUNE Workbench Operation Manual". and "4.47 SET RAMCHECK" to "4.51 DISABLE
RAMCHECK" of "SOFTUNE Workbench Command Reference Manual".
Note:
Execution state for MCU such as stop mode or sleep mode cannot be displayed at status bar during
logging.
■ About Log File
Following restrictions are made for the size of log file to be created depending on file system where log file is
stored.
FAT:
Up to 2GB
FAT32:
Up to 4GB
NTFS:
No limit.
Others:
No limit
If the file system is FAT, FAT32, file name will be changed and continue logging when the size of file is
exceeded limitation.
Note:
If a file is already existed, log file will be overwritten
Example of an operation
If the size of file is exceeded it's limitation, log file will be created as
filename.srl --> filename#1.srl
If the size gets exceeded the limitation again, log will be shown and changes as follows.
filename#1.srl --> filename#2.srl
•
•
filename#N-1.srl --> filename#N.srl
Notes:
• Log files should only be saved to built-in HDD only. If network, external HDD or external disk (CD,
DVD, MO etc) are used as destination for saving files, files will not be saved.
• More than 500MB memory is required for disk to save log file of RAM checker. If the capacity of
disk become less than 500MB, logging will be halted.
198
CHAPTER 2 DEPENDENCE FUNCTIONS
■ RAM Checker Viewer
The RAM Checker Viewer is a tool for graphically displaying changes in data values with the passage of
time. There are the following three types of data display formats:
- Bit display (Logic Analyzer image)
- Data value display (bent line graph)
- Bit/data value display (simultaneous display bit and data values)
It displays halting CPU, trigger points and the Data Lost as other information.
To halt the operation of CPU, stop mode for low power consumption and power off condition at power-on
debug function will be saved to log.
Trigger point uses event-hit in SOFTUNE Workbench. It is necessary to set event in SOFTUNE Workbench
to use trigger point. When the event-hit is appeared, its information is recorded in a log.
The Data Lost is appeared in the following two causes.
- The Data Lost caused by hardware
The emulator obtains data access history of RAM at intervals of 1 ms, but if two or more data access
the same address within 1 ms, the emulator obtains only the data of the last access.
Data loss caused by hardware indicates that several data accessed the same address.
- The Data Lost caused by software
SOFTUNE Workbench obtains data from the emulator at intervals of 100 ms. However, other
application may disable the SOFTUNE Workbench for obtaining data at intervals of 100 ms.
In such cases, the RAM Checker Viewer does not display a portion of the data, but displays the invalid
time band graphically.
Note:
If logging is halted by break or stopping an execution, software lost could be appeared for 1ms to
15ms. at the end of log. This happens because log after stopping an execution will be obtained until
logging is stopped, thus this is not an actual data lost.
For details of RAM Checker viewer, refer to RAM Checker Viewer Manual (FswbRView.pdf) and Help.
199
CHAPTER 2 DEPENDENCE FUNCTIONS
2.3.13
Checking Debugger Information
This section explains how to check information about the MB2147-01 emulator debugger.
■ Debugger Information
This emulator debugger enables you to check the following information at startup.
• SOFTUNE Workbench file information
• Hardware information
If any errors have been discovered during SOFTUNE Workbench operations, check this information and
contact our sales department or support department.
■ How to Check
Use one of the following methods to check debugger information.
• Command
- SHOW SYSTEM
Refer to Section "1.19 SHOW SYSTEM" in "SOFTUNE Workbench Command Reference Manual".
• Dialog
- Version information dialog
Select [Help] - [Version Information] menu.
For details, refer to Section "4.9.3 Version Information" in "SOFTUNE Workbench Operation
Manual".
■ Displayed Contents
F2MC-16 Family SOFTUNE Workbench VxxLxx
ALL RIGHTS RESERVED,
COPYRIGHT(C) FUJITSU SEMICONDUCTOR LIMITED 1997
LICENCED MATERIAL PROGRAM PROPERTY OF FUJITSU SEMICONDUCTOR LIMITED
=======================================================
Cpu information file path: CPU information file path
Cpu information file version: CPU information file version
=======================================================
Add in DLLs
------------------------------------------------------SiCmn
Product name: SOFTUNE Workbench
File Path: SiC907.dll path
Version: SiC907.dll version
- - - - - - - - - - - - - - - - - - - - - - - - - - - SiiEd
File Path: SiiEd3.ocx path
Version: SiiEd3.ocx version
------------------------------------------------------SiM907
Product name: SOFTUNE Workbench
File Path: SiM907.dll path
Version: SiM907.dll version
- - - - - - - - - - - - - - - - - - - - - - - - - - - Language Tools
- F2MC-16 Family SOFTUNE C Compiler version
File Path: fcc907s.exe path
- F2MC-16 Family SOFTUNE Assembler version
File Path: fasm907s.exe path
200
CHAPTER 2 DEPENDENCE FUNCTIONS
- F2MC-16 Family SOFTUNE Linker version
File Path: flnk907s.exe path
- F2MC-16 Family SOFTUNE Librarian version
File Path: flib907s.exe path
- SOFTUNE FJ-OMF to S-FORMAT Converter version
File Path: f2ms.exe path
- SOFTUNE FJ-OMF to INTEL-HEX Converter version
File Path: f2is.exe path
- SOFTUNE FJ-OMF to INTEL-EXT-HEX Converter version
File Path: f2es.exe path
- SOFTUNE FJ-OMF to HEX Converter version
File Path: f2hs.exe path
------------------------------------------------------SiOsM
Product name: Softune Workbench
File Path: SiOsM907.dll path
Version: SiOsM907.dll version
------------------------------------------------------F2MC-16 Family Debugger DLL
Product name: SOFTUNE Workbench
File Path: SiD907.dll path
Version: SiD907.dll version
- - - - - - - - - - - - - - - - - - - - - - - - - - - Debugger type
: Current debugger type
MCU type
: Currently selected target MCU
VCpu dll name
: Path and name of the currently used VCpu dll
VCpu dll version
: Version of the currently used virtual debugger DLL
DSU type
: Currently used DSU type
Common version
: Version of monitor (common)
Monitor version
: Version of monitor (dependent)
Configuration board ID
: Configuration board ID
Configuration board version : Configuration board version
MCU frequency
: Operating frequency
Communication device
: Device type
Baud rate
: Baud rate (at RS connection)
Host name
: LAN host name (at LAN connection)
REALOS version
: REALOS version
------------------------------------------------------SiIODef
Product name: Softune Workbench
File Path: SiIODef.dll path
Version: SiIODef.dll version
=======================================================
Current path: Path of the currently used project
Language: Currently used language
Help file path: Help file path
201
CHAPTER 2 DEPENDENCE FUNCTIONS
2.4
Emulator Debugger (MB2147-05)
This section explains the functions of the emulator debugger (MB2147-05).
■ Emulator
When choosing the emulator debugger from the setup wizard, select one of the following emulators. The
following description explains the case when the emulator debugger (MB2147-05) has been selected.
MB2141
MB2147-01
MB2147-05
MB2198
The emulator debugger (MB2147-05) is software that controls an emulator from a host computer via a
communications line (RS-232C or USB) to evaluate programs.
The following series can be debugged:
F2MC-16L
F2MC-16LX
Before using the emulator, it must be initialized. For details, refer to "Appendix B Downloading Monitor
Program" of "SOFTUNE Workbench Operation Manual".
202
CHAPTER 2 DEPENDENCE FUNCTIONS
2.4.1
Setting Operating Environment
This section explains the operating environment setup.
■ Setting Operating Environment
For the emulator debugger (MB2147-05), it is necessary to set the following operating environment.
Predefined default settings for all these setup items are enabled at startup. Therefore, setup is not required
when using the default settings. Adjusted settings can be used as new default settings from the next time.
- Monitoring program automatic loading
- MCU operation mode
- Debug area
- Memory mapping
203
CHAPTER 2 DEPENDENCE FUNCTIONS
2.4.1.1
Monitoring Program Automatic Loading
The emulator (MB2147-05) can automatically update the monitoring program at emulator
startup.
■ Monitoring Program Automatic Loading
When the emulator (MB2147-05) is specified, data in the emulator can be checked at the beginning of
debugging to load an appropriate monitoring program and configuration binary data automatically into the
emulator.
The monitoring program and configuration binary data to be compared for update are in Lib\907 under the
directory where Workbench is installed.
Enable/disable the monitoring program automatic loading function by choosing [Environment] - [Debugging
Environment Setup] - [Setup Wizard] menu.
204
CHAPTER 2 DEPENDENCE FUNCTIONS
2.4.1.2
MCU Operation Mode
There are two MCU operation modes as follows:
• Debugging Mode
• Native Mode
■ Setting MCU Operation Mode
Set the MCU operation mode.
There are two operation modes: the debugging mode, and the native mode. Choose either one using the SET
RUNMODE command.
At emulator start-up, the MCU is in the debugging mode.
The data access to internal bus may not be detected by emulator in native mode. Therefore, when the MCU
operation mode is changed, all the following are initialized:
- Data breakpoints
- Trace measurement settings and trace buffer
■ Debugging Mode
All the operations of evaluation chips can be analyzed, but their operating speed is slower than that of massproduced chips.
■ Native Mode
Evaluation chips have the same timing as mass-produced chips to control the operating speed. Note that the
restrictions the shown in Table 2.4-1 are imposed on the debug functions.
Table 2.4-1 Restrictions on Debug Functions in Native Mode
Applicable series
Common to all series
Restrictions on debug functions
- When a data read access occurs on the MCU internal bus, the internal
bus access information is not sampled and stored in the trace buffer.
- Even when a data break or event (data access condition) is set for
data on the MCU internal bus, it may not become a break factor or
sequencer-triggering factor.
- The coverage function may fail to detect an access to data on the
MCU internal bus.
205
CHAPTER 2 DEPENDENCE FUNCTIONS
2.4.1.3
Debug Area
Set the intensive debugging area out of the whole memory space. The area functions are
enhanced.
■ Setting Debug Area
There are two debug areas: DEBUG3, and DEBUG4. A continuous 1 MB area (16 banks) is set for each area.
Set the debug area using the SET DEBUG command.
Setting the debug area enhances the breakpoint function.
- Enhancement of Breakpoints
Up to six breakpoints (not including temporary breakpoints set using GO command) can be set when the
debug area has not yet been set.
When setting the debug area as the CODE attribute, up to 65535 breakpoints can be set if they are within
the area. At this time, up to six breakpoints can be set for an area other than the debug area, but the total
count of breakpoints must not exceed 65535. In 00 to 0F bank and 0F0 to 0FF bank, a breakpoint can be
set without specifying the debug area. (DEBUG1, DEBUG2)
206
CHAPTER 2 DEPENDENCE FUNCTIONS
2.4.1.4
Memory Area Types
A unit in which memory is allocated is called an area. There are five different area types.
■ Memory Area Types
A unit to allocate memory is allocated is called an area. There are five different area types as follows:
- User Memory Area
Memory space in the user system is called the user memory area and this memory is called the user
memory. Up to four user memory areas can be set with no limit on the size of each area. Define a region
on a 256-byte boundary.
Access attributes can be set for each area; for example, CODE, READ, etc., can be set for ROM area, and
READ, WRITE, etc. can be set for RAM area. If the MCU attempts access in violation of these attributes,
the MCU operation is suspended and an error is displayed (guarded access break).
To set the user memory area, use the SET MAP command.
- Emulation Memory Area
Memory space substituted for emulator memory is called the emulation memory area, and this memory is
called emulation memory.
It is possible to set up to four areas of 256-KB maximum (including an internal ROM area described later)
as emulation memory area. Define a region on a 256-byte boundary. An area larger than 256-KB can be
specified at one time but is divided internally into two or more 256-KB areas for management purposes.
Memory manipulation commands can be executed in relation to emulation memory areas while MCU
execution is in progress.
Emulation memory areas can be set using the SET MAP command.
Further, the access attributes can be set as with user memory areas.
Note:
Even if the MCU internal resources are set as emulation memory area, access is made to the internal
resources.
- Internal ROM Area
The area where the emulator internal memory is substituted for internal ROM is called the internal ROM
area, and this memory is called the internal ROM memory.
Only one internal ROM area with a size up to 256-KB can be specified.
The internal ROM area with a size up to 1 MB can be specified 2 areas.
Memory manipulation commands can be executed in relation to emulation memory areas while MCU
execution is in progress.
The internal ROM area is capable to set by the "Setup Map" dialog opening by "Debugger Memory Map...
" from "Setup".
207
CHAPTER 2 DEPENDENCE FUNCTIONS
Note:
The internal memory area, it is set a suitable area automatically by the selected MCU.
- Internal ROM Image Area
Some types of MCUs have data in a specific area of internal ROM appearing to 00 bank. This specific
area is called the internal ROM image area.
The internal ROM image area is capable to set by the "Setup Map" dialog opening by "Debugger Memory
Map... " from "Setup". This area attribute is automatically set to READ/CODE. The same data as in the
internal ROM area appears in the internal ROM image area.
Note that the debug information is only enabled for either one (one specified when linked). To debug only
the internal ROM image area, change the creation type of the load module file.
Note:
The internal memory area, it is set a suitable area automatically by the selected MCU.
- Undefined Area
A memory area that does not belong to any of the areas described above is part of the user memory area.
This area is specifically called the undefined area.
The undefined area can be set to either NOGUARD area, which can be accessed freely, or GUARD area,
which cannot be accessed. Select either setup for the whole undefined area. If the area attribute is set to
GUARD, a guarded access error occurs if access to this area is attempted.
208
CHAPTER 2 DEPENDENCE FUNCTIONS
2.4.1.5
Memory Mapping
Memory space can be allocated to the user memory and the emulation memory, etc., and
the attributes of these areas can be specified.
However, the MCU internal resources are not dependent on this mapping setup and
access is always made to the internal resources.
■ Access Attributes for Memory Areas
The access attributes shown in Table 2.4-2 can be specified for memory areas.
A guarded memory access break occurs if access is attempted in violation of these attributes while executing
a program.
When access to the user memory area and the emulation memory area is made using program commands,
such access is allowed regardless of the CODE, READ, WRITE attributes. However, access to memory with
the GUARD attribute in the undefined area, causes an error.
Table 2.4-2 Types of Access Attributes
Area
User Memory
Emulation Memory
Attribute
Description
CODE
Instruction Execution Enabled
READ
Data Read Enabled
WRITE
Data Write Enabled
GUARD
Access Disabled
NOGUARD
No check of access attribute
Undefined
When access is made to an area without the WRITE attribute by executing a program, a guarded access break
occurs after the data has been rewritten if the access target is the user memory. However, if the access target
is the emulation memory, the break occurs before rewriting. In other words, write-protection (memory data
cannot be overwritten by writing) can be set for the emulation memory area by not specifying the WRITE
attribute for the area.
This write-protection is only enabled for access made by executing a program, and is not applicable to access
by commands.
209
CHAPTER 2 DEPENDENCE FUNCTIONS
■ Creating and Viewing Memory Map
Use the following commands for memory mapping.
SET MAP:
Set memory map.
SHOW MAP:
Display memory map.
CANCEL MAP:
Change memory map setting to undefined.
[Example]
>SHOW MAP
address
attribute
000000 .. FFFFFF
noguard
type
The rest of setting area numbers
user = 8
emulation = 5
>SET MAP/USER H'0..H'1FF
>SET MAP/READ/CODE/EMULATION H'FF0000..H'FFFFFF
>SET MAP/USER H'8000..H'8FFF
>SET MAP/MIRROR/COPY H'8000..H'8FFF
>SET MAP/GUARD
>SHOW MAP
address
attribute
type
000000 .. 0001FF
read write
user
000200 .. 007FFF
guard
008000 .. 008FFF
read write
009000 .. FEFFFF
guard
FF0000 .. FFFFFF
read write cod e
user
emulation
mirror address area
008000 .. 008FFF
copy
The rest of setting area numbers
user = 6
emulation = 3
>
■ Internal ROM Area Setting
The [Setup Map] dialog box is displayed using [Environment] - [Debugger Memory Map] menu. You can set
the internal ROM area using the [Internal ROM Area] after the [Map Adding] dialog box is displayed by
clicking on the [Setting] button. You can set two areas. Both require empty Emulation area to be set. You can
set the region size by (Empty space of the emulation area) x (one area size).
Specify the internal ROM area from the ending address H'FFFFFF (fixed) for area 1. Also, it is possible to
delete the internal ROM area.
210
CHAPTER 2 DEPENDENCE FUNCTIONS
2.4.2
Notes on Commands for Executing Program
When using commands to execute a program, there are several points to note.
■ Notes on GO Command
For the GO command, two breakpoints that are valid only while executing commands can be set. However,
care is required in setting these breakpoints.
- Invalid Breakpoints
- No break occurs when a breakpoint is set at the instruction immediately after the following instructions.
F2MC-16L/16LX
PCB
NCC
SPB
MOV ILM,#imm8
ORCCR,#imm8
DTB
ADB
CNR
ANDCCR,#imm8
POPW PS
- No break occurs when breakpoint set at address other than starting address of instruction.
- No break occurs when following two conditions met at one time.
- Instruction for which breakpoint set starts from odd-address,
- Preceding instruction longer than 2 bytes length, and breakpoint already set at last 1-byte address of
preceding instruction (This "already-set" breakpoint is an invalid breakpoint that won't break, because
it has been set at an address other than the starting address of an instruction).
- Abnormal Breakpoint
Setting a breakpoint at the instruction immediately after string instructions listed below, may cause a
break in the middle of the string instruction without executing the instruction to the end.
F2MC-16L/16LX
MOVS
SECQ
WBTS
MOVSWI
SECQWI
MOVSD
SECQD
FILS
FILSW
MOVSW
SECQW
MOVSI
SECQI
WBTC
MOVSWD
SECQWD
FILSI
FILSWI
211
CHAPTER 2 DEPENDENCE FUNCTIONS
■ Notes on STEP Command
● Exceptional Step Execution
When executing the instructions listed in the notes on the GO command as invalid breakpoints and abnormal
breakpoints, such instructions and the next instruction are executed as a single instruction. Furthermore, if
such instructions are continuous, then all these continuous instructions and the next instruction are executed
as a single instruction.
● Step Execution that won't Break
Note that no break occurs after step operation when the following two conditions are met at one time.
• When step instruction longer than 2 bytes length and last code ends at even address
• When breakpoint already set at last address (This "already-set" breakpoint is an invalid breakpoint that
won't break, because it has been set at an address other than the starting address of an instruction.)
■ Controlling Watchdog Timer
It is possible to select "No reset generated by watchdog timer counter overflow" while executing a program
using the GO, STEP, CALL commands.
Use the ENABLE WATCHDOG, DISABLE WATCHDOG commands to control the watchdog timer.
- ENABLE WATCHDOG
:
Reset generated by watchdog timer counter overflow
- DISABLE WATCHDOG
:
No reset generated by watchdog timer counter overflow
The start-up default in this program is "Reset generated by watchdog timer counter overflow".
[Example]
>DISABLE WATCHDOG
>GO
212
CHAPTER 2 DEPENDENCE FUNCTIONS
2.4.3
Commands Available during Execution of User Program
This section explains the commands available during the execution of a user program.
■ Commands Available during Execution of User Program
This emulator debugger allows you to use certain commands during the execution of a user program.
For more details, see "■ Debugger" in "SOFTUNE Workbench Command Reference Manual".
The double circle indicates that it is available during the execution of a user program.
Table 2.4-3 shows the commands available during the execution of a user program.
Table 2.4-3 Commands Available during Execution of User Program
Function
Restrictions
MCU reset
-
Major Commands
1.3 RESET
Memory operation (Read/Write)
Emulation memory only operable
5.1 EXAMINE,
5.2 ENTER,
5.3 SET MEMORY,
5.4 SHOW MEMORY,
5.5 SEARCH MEMORY,
5.8 COMPARE,
5.9 FILL,
5.10 MOVE,
5.11 DUMP
Line assembly, Disassembly
Emulation memory only enabled
6.1 ASSEMBLE,
6.2 DISASSEMBLE
Notes:
• The conditions which allow you to use the commands in Table 2.4-3 are limited to the following
cases when a user program is executed.
- [Debug] - [Run] - [Go] menu
- [Go] button on the debug toolbar
The commands in Table 2.4-3 cannot be used when the GO command is entered in the command
window.
• An error message appears if you enter a command that cannot be used during the execution of a
user program.
"E4404S Command error (MCU is busy)."
213
CHAPTER 2 DEPENDENCE FUNCTIONS
2.4.4
Break
In this emulator debugger, five kinds of break functions can be used. When the program
execution is aborted by each break function, the address and the break factor to do the
break are displayed.
■ Break Functions
In this emulator debugger, five kinds of break functions are supported.
• Code break
• Data break
• Guarded access break
• Trace-buffer-full break
• Forced break
214
CHAPTER 2 DEPENDENCE FUNCTIONS
2.4.4.1
Code Break
It is a function to abort the program execution by observing the specified address. The
break is done before an instruction the specified address is executed.
■ Code Break
It is a function to abort the program execution by observing the specified address. The break is done before
an instruction the specified address is executed. It is possible to set it in this 65535 debuggers. However, it is
necessary to set the debugging area as a code break area.
When a break occurs due to a code break, the following message is displayed on the Status Bar.
Break at [Address] by breakpoint
■ Setting Method
The code break is controlled by the following method.
• Command
- SET BREAK
Refer to "3.1 SET BREAK (type 1)" in "SOFTUNE Workbench Command Reference Manual".
• Dialog
- Breakpoints set dialog [Code] tab
Refer to "4.6.4 Breakpoint" in "SOFTUNE Workbench Operation Manual".
• Window
- Source window/Disassembly window
■ Notes on Code Break
There are several points to note in using code break. First, some points affecting code break are explained.
● Invalid Breakpoints
• No break occurs when a breakpoint is set at the instruction immediately after the following instructions.
F2MC-16/16L/16LX/16H: • PCB • DTB • NCC • ADB • SPB • CNR
• MOV ILM,#imm8
• AND CCR,#imm8
• OR CCR,#imm8
• POPW PS
F2MC-16F:
• PCB • DTB • NCC • ADB • SPB • CNR
• No break occurs when breakpoint set at address other than starting address of instruction.
• No break occurs when following two conditions met at one time.
- Instruction for which breakpoint set starts from odd-address
- Preceding instruction longer than 2 bytes length, and breakpoint already set at last 1-byte address of
preceding instruction (This "already-set" breakpoint is an invalid breakpoint that won't break, because
it has been set at an address other than the starting address of an instruction.)
215
CHAPTER 2 DEPENDENCE FUNCTIONS
● Abnormal Breakpoint
• Setting a breakpoint at the instruction immediately after string instructions listed below, may cause a
break in the middle of the string instruction without executing the instruction to the end.
F2MC-16/16L/16LX/16H: • MOVS
• MOVSI
• MOVSD
• FILS
• MOVSW
• MOVSWI
• MOVSWD
• FILSI
F2MC-16F:
• MOVMW
Above plus
• MOVM
• SECQ
• SECQI
• SECQD
• FILSW
• SECQW
• SECQWI
• SECQWD
• FILSWI
• WBTS
• WBTC
Here are some additional points about the effects on other commands.
● Dangerous Breakpoints
• Never set a breakpoint at an address other than the instruction starting address. If a breakpoint is the last 1
byte of an instruction longer than 2 bytes length, and if such an address is even, the following abnormal
operation will result:
- If instruction executed by STEP command, instruction execution not aborted.
- If breakpoint specified with GO command, set at instruction immediately after such instruction, the
breakpoint does not break.
Note:
When the debugging area is set again, all breakpoints in the area are cleared.
216
CHAPTER 2 DEPENDENCE FUNCTIONS
2.4.4.2
Data Break
The data break is a function to abort the program execution when the data access (read
or write) is done to the address specified while executing the program.
■ Data Break
The data break is a function to abort the program execution when MCU accesses data as for a specified
address.
When a break occurs due to a data break, the following message is displayed on the Status Bar.
Break at [Address] by databreak at Access address
■ Setting Method
The data break is controlled by the following method.
• Command
- SET DATABREAK
Refer to "3.9 SET DATABREAK (type 1)" in "SOFTUNE Workbench Command Reference Manual".
• Dialog
- Breakpoints set dialog [Data] tab
Refer to "4.6.4 Breakpoint" in "SOFTUNE Workbench Operation Manual".
Note:
When the debugging area is set again, all breakpoints in the area are cleared.
217
CHAPTER 2 DEPENDENCE FUNCTIONS
2.4.4.3
Guarded Access Break
The guarded access break is an abortion of the program execution that happens when
the violation to the set access attribute, doing the access, and guarded (An undefined
area cannot be accessed) area are accessed.
■ Guarded Access Break
A guarded access break aborts a executing program when access is made in violation of the access attribute
set by using the [Setup] - [Memory Map] menu, and access is attempted to a guarded area (access-disabled
area in undefined area).
There are three types of the following in Guarded access break.
Code guarded
When the instruction execution is done to the area without the code attribute, the break is done.
Read guarded
When the area without the read attribute is read, the break is done.
Write guarded
When the area without the write attribute is write, the break is done.
If a guarded access occurs while executing a program, the following message is displayed on the Status Bar
and the program is aborted.
Break at [Address] by guarded access {code/read/write} at Access address
Note:
Code Guarded is affected by pre-fetching.
The F2MC-16L/16LX/16/16H family pre-fetch up to 4 bytes. So, when setting the program area
mapping, set a little larger area (5 bytes max.) than the program area actually used.
Similarly, the F2MC-16F family pre-fetch up to 8 bytes. So, when setting the program area mapping,
set a little larger area (9 bytes max.) than the program area actually used.
218
CHAPTER 2 DEPENDENCE FUNCTIONS
2.4.4.4
Trace-Buffer-Full Break
It is a function to abort the program execution when the trace buffer becomes full.
■ Trace-Buffer-Full Break
It is a function to abort the program execution when the trace buffer becomes full.
When a break occurs due to a trace-buffer-full break, the following message is displayed on the Status Bar.
Break at [Address] by trace buffer full
■ Setting Method
The trace-buffer-full break is controlled by the following method.
• Command
- SET TRACE/BREAK
Refer to "4.30 SET TRACE (type 2)" in "SOFTUNE Workbench Command Reference Manual".
• Dialog
- Trace Set Dialog
Refer to "4.4.8 Trace" in "SOFTUNE Workbench Operation Manual".
219
CHAPTER 2 DEPENDENCE FUNCTIONS
2.4.4.5
Forced Break
It is a function to abort the execution of the program compulsorily.
■ Forced Break
It is a function to abort the execution of the program compulsorily.
When a break occurs due to a forced break, the following message is displayed on the Status Bar.
Break at [Address] by command abort request
Note:
A forced break is not allowed while the MCU is in the low-power consumption mode or hold state.
When a forced break is requested by the [Debug] - [Abort] menu while executing a program, the menu
is disregarded if the MCU is in the low-power consumption mode or hold state. If a break must occur,
then reset the cause at user system side, or reset the cause by using the [Debug] - [Reset MCU]
menu, after inputting the [Debug] - [Abort] menu.
When the MCU enters the low-power consumption mode or hold state while executing, the status is
displayed on the Status Bar.
220
CHAPTER 2 DEPENDENCE FUNCTIONS
2.4.5
Real-time Trace
While execution a program, the address, data and status information, and the data
sampled by an external probe can be sampled in machine cycle units and stored in the
trace buffer. This function is called real-time trace.
In-depth analysis of a program execution history can be performed using the data
recorded by real-time trace.
■ Trace Buffer
The data recorded by sampling in machine cycle units, is called a frame.
The trace buffer can store 64K frames (65536). Since the trace buffer has a ring structure, when it becomes
full, it automatically returns to the start to overwrite existing data.
■ Trace Data
Data sampled by the trace function is called trace data.
The following data is sampled:
• Address
• Data
• Status Information
- Access status: Read/Write/Internal access, etc.
- Device status: Instruction execution, Reset, Hold, etc.
- Queue status: Count of remaining bytes of instruction queue, etc.
- Data valid cycle information: Data valid/invalid
(Since the data signal is shared with other signals, it does not always output data. Therefore, the trace
samples information indicating whether or not the data is valid.)
■ Data Not Traced
The following data does not leave access data in the trace buffer.
- Portion of access data while in native mode.
When operating in the native mode, the F2MC-16L/16LX family of chips sometime performs
simultaneous multiple bus operations internally. However, in this emulator, monitoring of the internal
ROM bus takes precedence. Therefore, other bus data being accessed simultaneously may not be sampled
(in the debugging mode, all operations are sampled).
■ Frame Number
A number is assigned to each frame of sampled trace data. This number is called a frame number.
The frame number is used to specify the display start position of the trace buffer. The value 0 is assigned to
trace data at the triggering position for sequencer termination. Negative values are assigned to trace data that
have been sampled before arrival at the triggering position (See Figure 2.4-1).
If there is no triggering position for sequencer termination, the value 0 is assigned to the last-sampled trace
data.
221
CHAPTER 2 DEPENDENCE FUNCTIONS
Figure 2.4-1 Frame Number at Tracing
.
.
.
-3
-2
-1
0 (Trigger point)
■ Trace Filter
To make effective use of the limited trace buffer capacity, in addition to the code fetch function, a trace filter
function is incorporated to provide a means of acquiring information about data accesses to a specific region.
The data trace filter function allows the following values to be specified for two regions:
- Address
- Address mask
- Access attribute (read/write)
Another function can be used so that sampling of redundant frames occupying two or more trace frames, such
as SLEEP and READY, can be reduced to sampling of one frame.
222
CHAPTER 2 DEPENDENCE FUNCTIONS
2.4.5.1
Setting Trace
To perform a trace, follow steps (1), (2) below. When a program is executed after
completion of the following steps, trace data is sampled.
(1) Enable the trace function.
(2) Perform trace-buffer-full break setup.
■ Setting Trace
To perform a trace, complete the following setup steps. When a program is executed after completion of the
steps, trace data is sampled.
1) Enable the trace function.
Enable the trace function using the ENABLE TRACE command.
To disable the trace function, use the DISABLE TRACE command.
The trace function is enabled by default when the program is launched.
2) Perform trace-buffer-full break setup.
A break can be invoked when the trace buffer becomes full.
To perform setup, use the SET TRACE command. This break feature is disabled when the program starts.
To confirm the setting, use SHOW TRACE/STATUS.
Table 2.4-4 shows the commands related to a trace.
Table 2.4-4 Trace-related Commands
Available command
SET TRACE
SHOW TRACE
SEARCH TRACE
ENABLE TRACE
DISABLE TRACE
CLEAR TRACE
Function
Sets trace-buffer-full break
Displays trace data
Searches for trace data
Enables trace function
Disables trace function
Clears trace function
223
CHAPTER 2 DEPENDENCE FUNCTIONS
2.4.5.2
Displaying Trace Data Storage Status
It is possible to displays how much trace data is stored in the trace buffer. This status
data can be read by specifying /STATUS to the SHOW TRACE command.
■ Displaying Trace Data Storage Status
It is possible to displays how much trace data is stored in the trace buffer. This status data can be read by
specifying /STATUS to the SHOW TRACE.
[Example]
>SHOW TRACE/STATUS
en/dis
= enable
buffer full = nobreak
sampling
= end
frame no. = -00120 to
step no. = -00091 to
>
224
00050
00022
;
;
;
;
;
Trace function enabled
Buffer full break function disabled
Trace sampling terminates
Frame -120 to 50 store data
Step -91 to 22 store data
CHAPTER 2 DEPENDENCE FUNCTIONS
2.4.5.3
Specifying Displaying Trace Data Start
The data display start position in the trace buffer can be specified by inputting a step
number or frame number using the SHOW TRACE command. The data display range can
also be specified.
■ Specifying Displaying Trace Data Start
Specify the data display start position in the trace buffer by inputting a step number or frame number using
the SHOW TRACE command. The data display range can also be specified.
[Example]
- In Single Trace Mode
>SHOW TRACE/CYCLE -6
; Start displaying from frame -6
>SHOW TRACE/CYCLE -6..10
; Display from frame -6 to frame 10
>SHOW TRACE -6
; Start displaying from step -6
>SHOW TRACE -6..10
; Displays from step -6 to step 10
225
CHAPTER 2 DEPENDENCE FUNCTIONS
2.4.5.4
Display Format of Trace Data
The trace data display format can be selected by running the SHOW TRACE command
with a command modifier specified. If setup is completed with the SET SOURCE
command so as to select a source line addition mode, a source line is attached to the
displayed trace data.
There are three formats to display trace data:
• Display in instruction execution order
(Specify /INSTRUCTION.)
• Display all machine cycles
(Specify /CYCLE.)
• Display in source line units
(Specify /SOURCE.)
■ Display in Instruction Execution Order (Specify /INSTRUCTION.)
Trace sampling is performed at each machine cycle, but the sampling results are difficult to display because
they are influenced by pre-fetch, etc. This is why the emulator has a function to allow it to analyze trace data
as much as possible. The resultant data is displayed after processes such as eliminating pre-fetch effects,
analyzing execution instructions, and sorting in instruction execution order are performed automatically.
However, this function can be specified only in the single trace while in the debugging mode.
In this mode, data can be displayed in the following format.
226
CHAPTER 2 DEPENDENCE FUNCTIONS
Address
Hexadecimal
number
Step Number
Decimal number,
signed
Disassemble Description
Indecates instruction
executed
Data
Hexadecimal
number
>SHOW TRACE/INSTRUCTION -194
step no.
address
mnemonic
\sub4:
-00194
: FF0106
LINK
# 00
-00193
: 000186
internal read access.
10F2
-00192
: 1010E6
external write access.
10F2
-00191
: 000186
internal write access.
10E6
-00190
: FF0108
ADDSP
#F8
-00189
: FF010A
MOVL
A,001A
-00188
: 10001A
external read access.
0000
-00187
: 10001C
external read access.
4000
-00186
: FF010E
MOVL
@SP+04,A
-00185
: 1010E2
external write access.
0000
Device Status
-00184
: FF0111
MOVL
A,0016
5
-00183
:
** RESET **
** STANDBY ** : Hardware standby
: Reset
>
** RESET **
: Tool hold
** THOLD **
Data Access
internal read access :
Read access to
internal memory
internal write access :
Write access to
internal memory
external read access :
Read access to
external memory
external write access :
Write access to
external memory
** UHOLD **
** WAIT **
** SLEEP **
: User hold
: Ready pin input
: Sleep
** STOP **
: Stop
■ Displaying All Machine Cycles
Detailed information at all sampled machine cycles can be displayed.
In this mode, no source is displayed irrespective of the setup defined by the SET SOURCE command.
[Example]
>SHOW TRACE/CYCLE -587
frame no. address
data
-00587
: FF0106 0106
-00586
: FF0106 0008
-00585
: FF0106 0106
-00584
: 1010E8 10E8
-00583
: 1010E8 0102
-00582
: 1010E8 0102
-00581
: 000186 0186
-00580
: 000186 10F2
-00579
: 1010E6 10E6
-00578
: 1010E6 10F2
-00577
: 1010E6 10F2
-00576
: 000186 0186
a-status
--ECF
----EWA
----IRA
--EWA
-----
d-status
------EXECUTE
EXECUTE
------EXECUTE
EXECUTE
------EXECUTE
------EXECUTE
EXECUTE
-------
Qst
FLH
----------2by
-----------
dfg
@
@
@
@
227
CHAPTER 2 DEPENDENCE FUNCTIONS
How to read trace data
frame no.
address
data
a-status
d-status
Qst
dfg
(1)
(2)
(3)
(4)
(5)
(6)
(7)
(1):frame number (Decimal, signed)
(2):executed instruction address, and data access address (Hexadecimal number)
(3):data (Hexadecimal number)
(4):access information (a-status)
WA:write access to internal memory
EWA:write access to external memory
IRA:read access to internal memory
ERA:read access to external memory
ICF:code fetch to internal memory
ECF:code fetch to external memory
---:valid "d-status" information
(5):device information (d-status)
STANDBY:hardware standby
THOLD :tool hold
UHOLD :user hold
WAIT :waiting by ready pin
SLEEP :sleep
STOP :stop
EXECUTE:execute instruction
RESET :reset
-------:invalid d-status information
(6):instruction queue status
FLH:flush queue
-by:number of remainder code of queue is -byte(-:1 to 8)
(7):valid flag
&:this frame address is valid
@:this frame data is valid
228
CHAPTER 2 DEPENDENCE FUNCTIONS
■ Display in Source Line Units (Specify /SOURCE.)
Only the source line can be displayed. This mode is enabled only in the debugging mode.
[Example]
>SHOW TRACE/SOURCE -194
step no.
source
-00194
: gtg1.c$251
-00190
: gtg1.c$255
-00168
: gtg1.c$259
-00164
: gtg1.c$264
p = (char *)
&df;
-00161
: gtg1.c$264
p = (char *)
&df;
-00157
: gtg1.c$265
*(p++) = 0x00;
-00145
: gtg1.c$266
*(p++) = 0x00;
-00133
: gtg1.c$267
*(p++) = 0x80;
-00121
: gtg1.c$268
*p
-00116
: gtg1.c$270
p = (char *)
-00111
: gtg1.c$271
*(p++) = 0xff;
-00099
: gtg1.c$272
*(p++) = 0xff;
{
sub5(nf, nd);
{
= 0x7f;
ⅆ
Note:
The following operation may be subjected to trace sampling immediately after the MCU operation is
stopped (tool hold). Remember that the operation is unique to evaluation chips and not performed by
mass-produced products.
Access to address 0x000100 and addresses between 0x0FFFFDC and 0x0FFFFFF
229
CHAPTER 2 DEPENDENCE FUNCTIONS
2.4.5.5
Reading Trace Data On-the-fly
Trace data can be read while executing a program. However, this is not possible during
sampling. Disable the trace function or terminate tracing before attempting to read trace
data.
■ Reading Trace Data On-the-fly
To disable the trace function, use the DISABLE TRACE command. Confirm whether or not the trace
function is currently enabled by executing the SHOW TRACE command with /STATUS specified, or by
using the built-in variable, %TRCSTAT.
Tracing terminates when the sequencer has terminated. If Not Break is specified here, tracing terminates
without a break operation. It is possible to confirm whether or not tracing has terminated by executing the
SHOW TRACE command with /STATUS specified, or by using the built-in variable, %TRCSAMP.
To read trace data, use the SHOW TRACE command; to search trace data, use the SEARCH TRACE
command.
[Example]
>GO
>>SHOW TRACE/STATUS
en/dis
= enable
buffer full
= nobreak
sampling
= on
<- Trace sampling continues.
>>SHOW TRACE/STATUS
en/dis
= enable
buffer full
= nobreak
sampling
= end
<- Trace sampling ends.
frame no.
= -00805 to
00000
step no.
= -00262 to
00000
>>SHOW TRACE -52
step no.
address
mnemonic
level
\sub5:
-00052
: FF0125
LINK
#02
1
-00051
: 000186
internal
read access.
10E6
1
-00050
: 1010D6
external
write access.
10E6
1
-00049
: 000186
internal
write access.
10D6
1
If the CLEAR TRACE command is executed with the trace ending state, trace data sampling can be reexecuted by re-executing the sequencer from the beginning.
230
CHAPTER 2 DEPENDENCE FUNCTIONS
2.4.5.6
Saving Trace Data
This section explains how to save trace data.
■ Saving Trace Data
Trace data can be saved in a specified file.
The following two methods are available to save trace data: using GUI (window or dialog) and using only the
command. The same result is obtained from both methods.
● Using GUI for Saving Trace Data
1. Display the trace window.
- Select [View] - [Trace] menu.
2. Specify the name of the file in which to save trace data.
- Right-click on the trace window, and select [Save] from the shortcut menu. The [Save as] dialog
appears.
Specify the file name and where to save trace data. For details, refer to Section "4.4.8 Trace" in
"SOFTUNE Workbench Operation Manual".
● Using Command for Saving Trace Data
1. Save trace data.
- Execute the SHOW TRACE/FILE command.
For details, refer to Section "4.33 SHOW TRACE (type 3)" in "SOFTUNE Workbench Command
Reference Manual".
When additionally saving trace data in an existing file, execute the SHOW TRACE/FILE/APPEND
command.
231
CHAPTER 2 DEPENDENCE FUNCTIONS
2.4.6
Measuring Execution Cycle Count
This function measures the program execution cycle count.
■ Measurement Items
Measures cycle count between the start and stop of program execution.
In this emulator debugger, the measurement is performed by the cycle counter. The following shows the
features of the cycle counter.
Significant bits : 56 bits
Maximum measurement cycle count : 72,057,594,037,927,935 cycles
The measurement is performed whenever a program is executed, and the measurement result displays the
following two values:
• Number of cycles spent on the previous program execution
• Total number of cycles executed since the previous clearing
■ Displaying Measurement Results
Either of the following methods can be used to display the measurement results.
• Display by dialog
The results appear in the time measurement dialog, which can be displayed by selecting [Debug] - [Time
Measurement] menu.
For details, refer to Section "4.6.8 Time Measurement" in "SOFTUNE Workbench Operation Manual".
• Display by command
Enter the SHOW TIMER command in the command window.
For details, refer to Section "4.27 SHOW TIMER" in "SOFTUNE Workbench Command Reference Manual".
■ Clearing Measurement Results
Either of the following methods can be used to clear the measurement results.
• Clearing by dialog
Click the [Clear] button in the time measurement dialog, which can be displayed by selecting [Debug] [Time Measurement] menu.
For details, refer to Section "4.6.8 Time Measurement" in "SOFTUNE Workbench Operation Manual".
• Clearing by command
Enter the CLEAR TIMER command in the command window.
For details, refer to Section "4.28 CLEAR TIMER" in "SOFTUNE Workbench Command Reference Manual".
Note:
The measured number of execution cycles is added about ten extra cycles per execution. If the
execution cycle is measured, execute many instructions continuously in order to minimize the effect of
error.
232
CHAPTER 2 DEPENDENCE FUNCTIONS
2.5
Emulator Debugger (MB2198)
This section explains the functions of the emulator debugger (MB2198).
■ Emulator Debugger
When choosing the emulator debugger from the setup wizard, select one of the following emulators. The
following description explains the case when MB2198 has been selected.
• MB2141
• MB2147-01
• MB2147-05
• MB2198
The emulator debugger (MB2198) is software that controls an emulator from a host computer via a
communications line (RS-232C, LAN, or USB) to evaluate programs.
The following series can be debugged:
F2MC-16FX
Before using the emulator, the emulator must be initialized.
For further details, refer to "Appendix B Download Monitor Program", and "Appendix C Setting up LAN
Interface" of "SOFTUNE Workbench Operation Manual".
233
CHAPTER 2 DEPENDENCE FUNCTIONS
2.5.1
Setting Operating Environment
This section explains the operating environment setup.
■ Setting Operating Environment
For the emulator debugger (MB2198), it is necessary to set the following operating environment.
Predefined default settings for all these setup items are enabled at startup. Therefore, setup is not required
when using the default settings. Adjusted settings can be used as new default settings from the next time.
• Monitor program automatic load
• Boot ROM file automatic execution
• MCU operation mode
• Operation frequency control
234
CHAPTER 2 DEPENDENCE FUNCTIONS
2.5.1.1
Monitoring Program Automatic Loading
The emulator (MB2198) can automatically update the monitoring program at emulator
startup.
■ Monitoring Program Automatic Loading
When the emulator (MB2198) is specified, data in the emulator can be checked at the starting of debugging
to load an appropriate monitoring program and configuration binary data automatically into the emulator.
The monitoring program and configuration binary data to be compared for update are in Lib\907 under the
directory where Workbench is installed.
Enable/disable the monitoring program automatic loading function by choosing [Environment] - [Debug
Environment] - [Setup Wizard] menu.
235
CHAPTER 2 DEPENDENCE FUNCTIONS
2.5.1.2
Boot ROM File Automatic Execution
The emulator (MB2198) automatically loads and executes the Boot ROM file during
startup of the debug.
■ Boot ROM File Automatic Execution
When the emulator (MB2198) is specified, at the starting of debugging the Boot ROM file is automatically
loaded and then executed. The Boot ROM file is in Lib\907\BootROM under the directory where Workbench
is installed.
The directory containing the Boot ROM file can be displayed using the [Project] - [Setup Project] menu, and
can be modified in the setup project dialog. In addition, it is also possible to automatically execute the Boot
ROM file during the debugger startup or reset of MCU. For details, see the "SOFTUNE Workbench
Operation Manual".
Notes:
• As the Boot ROM file contains information necessary for launching the emulator debugger, it must
be executed during startup of the debugger or upon reset. If the execution is not performed, the
debugger may not operate properly.
• The PC value when MCU reset has been performed in the emulator debugger varies depending on
whether it is MB2198 or not as follows:
236
MB2198
: Starting address of the Boot ROM file
Other than MB2198
: Entry point in the target file (reset vector)
CHAPTER 2 DEPENDENCE FUNCTIONS
2.5.1.3
MCU Operation Mode
There are two MCU operation modes as follows:
• Full Trace Mode
• Real-Time Mode
■ Setting MCU Operation Mode
There are two operation modes: the full trace mode, and the real-time mode. These modes are set using the
[Setup] - [Debug environment] - [Debug environment] menu or the SET RUNMODE command of the
instruction window.
● Full Trace Mode
In full trace mode, execution of all the instructions can be traced with no trace data missed. However, when
branching has been performed for three times or more within 11 cycles, getting the trace data will be given a
higher priority, as waits are inserted for MCU, it may not run in real time.
● Real time Mode
In real time mode, execution can be performed in the real time of a program. However, when branching has
been performed for three times or more within 11 cycles, some of the trace data may be missed.
In addition, an error may occur during measurement of the cycle count.
237
CHAPTER 2 DEPENDENCE FUNCTIONS
2.5.1.4
Operation Frequency Control
This section describes the operation frequency setup.
■ Operation frequency
Set the operation frequency of MCU. Set the operation frequency using a value between 1 and 266MHz,
inclusive. This setting optimizes the communication speed between MCU and emulator.
This function can be set using the [Setup] - [Debugging Environment] - [Debugging Environment] [Frequency] menu or the SET FREQUENCY command.
Notes:
• This setting sets the maximum frequency and will not change the actual operation frequency.
• When a value smaller than the operation frequency is actually used, the emulator may malfunction.
238
CHAPTER 2 DEPENDENCE FUNCTIONS
2.5.2
Notes on Commands for Executing Program
When using commands to execute a program, there are several points to note.
■ Notes on GO Command
For the GO command, two breakpoints that are valid only while executing commands can be set. However,
care is required in setting these breakpoints.
● Invalid Breakpoints
• No break occurs when a breakpoint is set at the instruction immediately after the following instructions.
F2MC-16FX
PCB
DTB
NCC
ADB
SPB
CNR
MOV ILM,#imm8
AND CCR,#imm8
OR CCR,#imm8
POPW PS
• No break occurs when breakpoint set at address other than starting address of instruction.
■ Notes on STEP Command
● Exceptional Step Execution
When executing the instructions listed in the notes on the GO command as invalid breakpoints, such
instructions and the next instruction are executed as a single instruction. Furthermore, if such instructions are
continuous, then all these continuous instructions and the next instruction are executed as a single instruction.
● Step Execution that won't Break
Note that no break occurs after step operation when the following two conditions are met at one time.
• When step instruction longer than 2 bytes length and last code ends at even address
• When breakpoint already set at last address
(This "already-set" breakpoint is an invalid breakpoint that won't break, because it has been set at an
address other than the starting address of an instruction.)
■ Controlling Watchdog Timer
It is possible to select "The watchdog timer is stopped in the break. " while executing a program using the
GO, STEP, CALL commands.
Use the ENABLE WATCHDOG, DISABLE WATCHDOG commands to control the watchdog timer.
• ENABLE WATCHDOG
---
Enables the watchdog time during break.
• DISABLE WATCHDOG
---
The watchdog timer is stopped in the break.
The start-up default in this program is "Enables the watchdog time during break".
[Example]
>DISABLE WATCHDOG
>GO
239
CHAPTER 2 DEPENDENCE FUNCTIONS
2.5.3
Commands Available during Execution of User Program
This section explains the commands available during the execution of a user program.
■ Commands Available during Execution of User Program
This emulator debugger allows you to use certain commands during the execution of a user program.
For more details, see "■ Debugger" in "SOFTUNE Workbench Command Reference Manual".
The double circle indicates that it is available during the execution of a user program.
Table 2.5-1 shows the commands available during the execution of a user program.
Besides, when the real-time monitor function is used, the specified memory area will be displayed in the realtime memory window, and data can be read (updated) even during MCU execution.
Table 2.5-1 Commands Available during Execution of User Program
Function
Restrictions
Major Commands
MCU reset
-
1.3 RESET
Displaying MCU execution status
-
2.12 SHOW STATUS
Displaying execution cycle measurement
value (cycle)
-
4.27 SHOW TIMER
Memory operation (Read/Write)
-
5.1 EXAMINE,
5.2 ENTER,
5.3 SET MEMORY,
5.4 SHOW MEMORY,
5.5 SEARCH MEMORY,
5.8 COMPARE,
5.9 FILL,
5.10 MOVE,
5.11DUMP
Line assembly, Disassembly
-
6.1 ASSEMBLE,
6.2 DISASSEMBLE
Set breakpoints
Operable while the "Breakpoint Settings
during Execution" is enabled in the
execution tab of the debug environment
dialog*
3.1 SET BREAK (type 1),
3.2 SET BREAK (type 2),
3.3 SET BREAK (type 3),
3.6 CANCEL BREAK,
3.7 ENABLE BREAK,
3.8 DISABLE BREAK,
3.9 SET DATABREAK (type 1),
3.10 SET DATABREAK (type 2),
3.12 CANCEL DATABREAK,
3.13 ENABLE DATABREAK,
3.14 DISABLE DATABREAK
*: For further details, refer to Section "2.5.4 Break".
240
CHAPTER 2 DEPENDENCE FUNCTIONS
Notes:
• The conditions which allow you to use the commands in Table 2.5-1 are limited to the following
cases when a user program is executed.
- [Debug] - [Run] - [Go] menu
- [Go] button on the debug toolbar
The commands in Table 2.5-1 cannot be used when the GO command is entered in the command
window.
• An error message appears if you enter a command that cannot be used during the execution of a
user program.
"E4404S Command error (MCU is busy)."
• In Table 2.5-1, the commands of the memory operation and line assembly/disassembly are read/
write when the CPU is temporarily stopped while the programs are being executed.
241
CHAPTER 2 DEPENDENCE FUNCTIONS
2.5.4
Break
In this emulator debugger, seven kinds of break functions can be used. When the
program execution is aborted by each break function, the address and the break factor to
do the break are displayed.
■ Break Functions
In this emulator debugger, seven kinds of break functions are supported.
• Code break
• Data break
• Guarded access break
• Trace-buffer-full break
• Performance-buffer-full break
• External trigger break
• Forced break
242
CHAPTER 2 DEPENDENCE FUNCTIONS
2.5.4.1
Code Break
This function aborts a program by monitoring the specified address using hardware or
software. Break occurs prior to execution of the instruction of the specified address.
■ Code Break
This function aborts a program by monitoring the specified address using hardware or software. Break occurs
prior to execution of the instruction of the specified address.
The maximum setting number is as follows:
Hardware
: 4 points
Software
: 2048 points
When a break occurs due to a code break, the following message is displayed on the Status Bar.
• Hardware
Break at [Address] by hardware breakpoint
• Software
Break at [Address] by breakpoint
■ Setting Method
The code break is controlled by the following method.
• Command
- SET BREAK/HARD (Hardware)
- SET BREAK/SOFT (Software)
Refer to "3.1 SET BREAK (type 1)" in "SOFTUNE Workbench Command Reference Manual".
• Dialog
- Breakpoints set dialog [Code] tab
Refer to "4.6.4 Breakpoint" in "SOFTUNE Workbench Operation Manual".
• Window
- Source window/Disassembly window
243
CHAPTER 2 DEPENDENCE FUNCTIONS
Notes:
• Hardware
There are the following considerations for the hardware break.
- Due to combination use with the sequencer or the trace trigger, the maximum setting number
varies.
- Do not set the hardware break to the instruction located in the delay slot. If such a setting is
performed, branching will not be performed in spite of re-execution after break.
- Make sure that the breakpoint must include the starting address of an instruction. Break may not
occur.
- When execution is performed starting from the address where the hardware break was set, if the
preceding execution has been stopped due to reasons other than instruction break, break will
occur without execution of the instruction. In such a case, when re-execution is performed, the
instruction will be executed.
• Software
There are the following considerations for the software break.
- Setting cannot be performed in areas, such as ROM, where write cannot be correctly performed.
In such cases, a verify error will occur when a program starts to be executed (when continuous
execution or step execution is started).
- Be sure to set the breakpoint in the starting address of an instruction. If the breakpoint is set in
the middle of an instruction, the program may run away.
244
CHAPTER 2 DEPENDENCE FUNCTIONS
2.5.4.2
Data Break
It is a function to abort the program execution when the data access (read and write) is
done to a specified address.
■ Data Break
It is a function to abort the program execution when the data access (read and write) is done to a specified
address.
When a break occurs due to a data break, the following message is displayed on the Status Bar.
Break at [Address] by databreak at Access address
■ Setting Method
The data break is controlled by the following method.
• Command
- SET DATABREAK
Refer to "3.9 SET DATABREAK (type 1)" in "SOFTUNE Workbench Command Reference Manual".
• Dialog
- Breakpoint Set Dialog [Data] tab
Refer to "4.6.4 Breakpoint" in "SOFTUNE Workbench Operation Manual".
Notes:
• Due to combination use with the sequencer or trace trigger, the maximum setting number varies.
• Word access from an odd address is performed using the byte access for twice (in terms of bus
access). Note that this is the reason why even when word access from an odd address is specified,
there will not be any hits.
245
CHAPTER 2 DEPENDENCE FUNCTIONS
2.5.4.3
Guarded Access Break
This function aborts the program execution when access has been performed using the
specified attribute for the specified area.
■ Guarded Access Break
For the specified area, when the specified access attribute is found during execution of a user program,
guarded access break will occur.
Guarded access can be specified with the following 3 types of attributes:
Code guarded
Break will occur when an instruction is executed for the specified area
Read guarded
Break will occur when read is performed for the specified area
Write guarded
Break will occur when write is performed for the specified area
If a guarded access occurs while executing a program, the following message is displayed on the Status Bar
and the program is aborted.
Break at [Address] by guarded access {code/read/write} at Access address
■ Setting Method
The guarded access break is controlled by the following method.
• Command
- SET GUARDMAP
Refer to "1.48 SET GUARDMAP" in "SOFTUNE Workbench Command Reference Manual".
• Dialog
- Map set dialog
Refer to "4.7.3 Memory Map" in "SOFTUNE Workbench Operation Manual".
246
CHAPTER 2 DEPENDENCE FUNCTIONS
2.5.4.4
Sequential Break
A sequential break is a function to abort an executing program as event sequential
control, when the sequential conditions are established.
■ Sequential Break
It is a function to abort the program execution by the sequential control of the event, when the sequential
conditions are established. For details of the sequential control, refer to Section "2.5.5 Control by
Sequencer".
When a break occurs due to a sequential break, the following message is displayed.
Break at [Address] by sequential break (level = Level No.)
■ Types of Sequential Break
This debugger has the following two types of the sequential breaks.
● 8 level sequence
8 level sequence is set in the sequence window displayed in [View]-[Sequence] menu. This sequence has the
following features.
• Up to 8 levels can be set.
• Multiple level of the shift ahead can be set to one (shift ahead) event.
• The break or trace control (acquisition start/acquisition end) can be set when the sequencer is ended
(END). The break is selected at this time.
• The trace control (acquisition start/acquisition end) can be set at each event hit of the sequencer.
• The current sequence level shift state at break can be displayed.
● 3 level sequence
3 level sequence is set in the 3 level sequence setting dialog displayed in [Debug]-[3 level sequence] menu.
For details, refer to section "4.6.6 Sequence" in "SOFTUNE Workbench Operation Manual".
• Up to 3 levels can be set.
• One level of the shift ahead can be set to one (shift ahead) event.
• The break or trace control (acquisition start/acquisition end) can be set when the sequencer is ended
(END). The break is selected at this time.
• When 3 level sequence is displayed in the sequence window, the current sequence level shift state at break
can be displayed.
Note:
The last level number of the sequencer is always 7. Therefore, if the level number of the message
displayed in the status bar at the sequential break is either 8 or 3 level, 7 is displayed in the last level
number of the sequencer.
247
CHAPTER 2 DEPENDENCE FUNCTIONS
2.5.4.5
Trace-Buffer-Full Break
It is a function to abort the program execution when the trace buffer becomes full.
■ Trace-Buffer-Full Break
It is a function to abort the program execution when the trace buffer becomes full.
When a break occurs due to a trace-buffer-full break, the following message is displayed on the Status Bar.
Break at [Address] by trace buffer full
■ Setting Method
The trace-buffer-full break is controlled by the following method.
• Command
- SET TRACE/BREAK
Refer to "4.30 SET TRACE (type 2)" in "SOFTUNE Workbench Command Reference Manual".
• Dialog
- Trace Set Dialog
Refer to "4.4.8 Trace" in "SOFTUNE Workbench Operation Manual".
248
CHAPTER 2 DEPENDENCE FUNCTIONS
2.5.4.6
Performance-Buffer-Full Break
It is a function to abort the program execution when the buffer for the performance
measurement data storage becomes full.
■ Performance-Buffer-Full Break
It is a function to abort the program execution when the buffer for the performance measurement data storage
becomes full.
When a break occurs due to a performance-buffer-full break, the following message is displayed on the
Status Bar.
Break at [Address] by performance buffer full
■ Setting Method
The performance-buffer-full break is controlled by the following method.
• Command
- SET PERFORMANCE/BREAK
Refer to "4.8 SET PERFORMANCE (type 2)" in "SOFTUNE Workbench Command Reference
Manual".
• Dialog
- Performance set dialog
Refer to "4.4.13 Performance" in "SOFTUNE Workbench Operation Manual".
249
CHAPTER 2 DEPENDENCE FUNCTIONS
2.5.4.7
External Trigger Break
It is a function to abort the execution of the program when an external signal is input
from TRIG pin that the emulator has.
■ External Trigger Break
It is a function to abort the execution of the program when an external signal is input from TRIG pin that the
emulator has.
When a break occurs due to an external trigger break, the following message is displayed on the Status Bar.
Break at [Address] by external trigger break
■ Setting Method
The external trigger break is controlled by the following method.
• Command
- SET TRIGGER
Refer to "3.42 SET TRIGGER" in "SOFTUNE Workbench Command Reference Manual".
• Dialog
- Debugging environment set dialog [emulation]tab
Refer to "4.7.2.3 Debug Environment" in "SOFTUNE Workbench Operation Manual".
250
CHAPTER 2 DEPENDENCE FUNCTIONS
2.5.4.8
Forced Break
It is a function to abort the execution of the program compulsorily.
■ Forced Break
It is a function to abort the execution of the program compulsorily.
When a break occurs due to a forced break, the following message is displayed on the Status Bar.
Break at [Address] by command abort request
Note:
A forced break is not allowed while the MCU is in the low-power consumption mode or hold state.
When a forced break is requested by the [Debug] - [Abort] menu while executing a program, the menu
is disregarded if the MCU is in the low-power consumption mode or hold state. If a break must occur,
then reset the cause at user system side, or reset the cause by using the [Debug] - [Reset MCU]menu,
after inputting the [Debug] - [Abort] menu.
When the MCU enters the low-power consumption mode or hold state while executing, the status is
displayed on the Status Bar.
251
CHAPTER 2 DEPENDENCE FUNCTIONS
2.5.5
Control by Sequencer
This emulator has a sequencer to control events. By using this sequencer, sampling of
breaks or traces can be controlled while monitoring program flow (sequence). A break
caused by this function is called a sequential break.
■ Control by Sequencer
As shown in Table 2.5-2, controls can be made at 8 different levels.
One event can be set for one level.
The sequencer can perform shift from any level to any level, and the restart conditions can also be specified.
Table 2.5-2 Sequencer Specifications
Function
Specifications
Level count
8 level
Conditions settable for
each level
1 event conditions (1 to 65535 times pass count can be specified for
each condition.)
Restart conditions
1 event conditions (1 to 65535 times pass count can be specified.)
Operations after shift
Break, trace control (start/end)
■ Setting Events
The emulator can monitor the MCU bus operation, and generate a trigger for a sequencer at a specified
condition. This function is called an event.
In the event, code (/CODE) and data access (/READ/WRITE) can be specified.
Up to eight events can be set. However, since hardware is shared with trace triggers, the actual numbers is
calculated as follows.
Current maximum constant of events =
8 - (current number of break settings + current number of trace trigger settings)
Table 2.5-3 shows the conditions that can be set for events.
Table 2.5-3 Conditions for Event and Trace Trigger
Condition
252
Description
Address
Memory location (address bit masking disabled)
Data
16-bit data (data bit masking enabled)
Access size
Byte, word
Access attribute
Code/Data read/Data write
Bus master
CPU, DMA
CHAPTER 2 DEPENDENCE FUNCTIONS
The sequence event is setting by the following command.
• SET SEQUENCE :
Sets sequence event
• SHOW SEQUENCE :
Displays sequence event status
• CANCEL SEQUENCE :
Deletes event
Notes:
• In instruction execution (/CODE), an event trigger is generated only when an instruction is executed.
This cannot be specified concurrently with other status (/READ or /WRITE).
• In the case of data event, word access from an odd address (in terms of bus access) is performed
using a byte access for twice . Note that this is the reason why even when word access from an
odd address is specified there is nothing found.
253
CHAPTER 2 DEPENDENCE FUNCTIONS
2.5.5.1
Operating of sequencer
The sequencer works in the following order.
1) The sequencer starts when the program execution begins.
2) It diverges to the level the shift ahead when the condition consists by setting each level.
3) When the restart condition consists, the sequencer is begun again.
4) When the condition that the level becomes END the shift ahead consists, the sequencer
ends and the break is done.
■ Operating of Sequencer
The sequencer works in the following order. The event can be set as each level and a restart condition.
1) The sequencer starts when the program execution begins.
2) It diverges to the level the shift ahead when the condition consists by setting each level.
3) When the restart condition consists, the sequencer is begun again.
4) When the condition that the level becomes END the shift ahead consists, the sequencer ends and the break
is done.
Note:
When the level the shift ahead has been END, re-execution of the user program will restart the
sequencer.
254
CHAPTER 2 DEPENDENCE FUNCTIONS
Figure 2.5-1 Operation of Sequencer
START
LEVEL1
EVENT 8
EVENT 1
EVENT 4
LEVEL2
LEVEL3
EVENT 2
LEVEL4
LEVEL5
EVENT 5
LEVEL6
END
EVENT 7
EVENT 3
EVENT 6
255
CHAPTER 2 DEPENDENCE FUNCTIONS
2.5.6
Real-time Trace
While execution a program, the address, data and status information, and the data
sampled by an external probe can be sampled in machine cycle units and stored in the
trace buffer. This function is called real-time trace.
In-depth analysis of a program execution history can be performed using the data
recorded by real-time trace.
■ Trace Buffer
The data recorded by sampling in machine cycle units, is called a frame.
The trace buffer can store 64K frames (65536). When the enhancing trace board is used, it becomes capacity
for 256M (268,435,456) frame.
Since the trace buffer has a ring structure, when it becomes full, it automatically returns to the start to
overwrite existing data.
■ Trace Data
Data sampled by the trace function is called trace data.
The following data is sampled:
• Branching instruction frame
Branching source address, branching target address, disassemble
• Data frame
Access address, Access data, Access size, Access attribute (read/write), and Bus master (CPU/DMA)
• Special frame
Program stop, Trace start/end, Reset, Loop count, Extended time stamp frame, Data lost
• Difference of execution time with frame immediately before (unit of CPU clock)
■ Frame Number
A number is assigned to each frame of sampled trace data. This number is called a frame number.
The frame number is used to specify the display start position of the trace buffer. The value 0 is assigned to
trace data at the triggering position for sequencer termination. Negative values are assigned to trace data that
have been sampled before arrival at the triggering position (See Figure 2.5-2).
If there is no triggering position for sequencer termination, the value 0 is assigned to the last-sampled trace
data.
256
CHAPTER 2 DEPENDENCE FUNCTIONS
Figure 2.5-2 Frame Number at Tracing
.
.
.
.
-3
-2
-1
0 (Trigger point)
■ Trace Filter
To make effective use of the limited trace buffer capacity, in addition to the code fetch function, a trace filter
function is incorporated to provide a means of acquiring information about data accesses to a specific region.
The following value can be specified in the data trace filter function.
• Access attribute (read/write)
• Data trace start address/end address
Moreover, the function to compress into one frame when the same frame is repeated is provided, too.
■ Trace Trigger Setup
When preselected conditions are met during MCU bus operation monitoring, a trigger for starting a trace can
be generated. This function is called a trace trigger.
For the use of the trace trigger function, specify the code (/CODE) and data access (/READ/WRITE).
Up to 4 trace triggers can be preset each for code attribute and data access attribute. However, actually, the
maximum number of trace triggers is determined as indicated below because the common hardware is used
with events.
Current trace trigger maximum constant = 4 - (current break count setting + current event count setting)
For the trace trigger setup conditions that can be defined, see Table 2.5-2.
For trace trigger setup, use the following commands:
• SET TRACETRIGGER :
Sets trace trigger
• CANCEL TRACETRIGGER :
Deletes trace trigger
• SHOW TRACETRIGGER :
Displays trace trigger setting status
• SHOW TRACE/STATUS :
Displays Trace setup status
Figure 2.5-3 shows a trace sampling operation.
Figure 2.5-3 Trace Sampling Operation (Trace Trigger)
Start Suspend Resume Suspend
Resume Suspend Resume
Program flow
Trace buffler
257
CHAPTER 2 DEPENDENCE FUNCTIONS
2.5.6.1
Setting Trace
To perform a trace, follow steps (1) to (3) below. When a program is executed after
completion of the following steps, trace data is sampled.
(1) Enable the trace function.
(2) The event and the sequencer are set.
(3) Perform trace buffer full break setup.
■ Setting Trace
To perform a trace, complete the following setup steps. When a program is executed after completion of the
steps, trace data is sampled.
1) Enable the trace function.
Enable the trace function using the ENABLE TRACE command.
To disable the trace function, use the DISABLE TRACE command.
The trace function is enabled by default when the program is launched.
2) Set up the event and the sequencer.
Use of the trace trigger allows control of the trace sampling, making full use of the limited-size trace
buffer. Such setups should be performed on a necessary base.
The trace trigger can specify the start/stop of trace sampling with the trigger hit as the reason.
When the trace trigger is used, setup is performed by inputting the SET TRACE/TRIGGER command.
3) Perform trace buffer full break setup.
A break can be invoked when the trace buffer becomes full.
To perform setup, use the SET TRACE command. This break feature is disabled when the program starts.
To confirm the setting, use SHOW TRACE/STATUS.
Table 2.5-4 shows trace related commands in single trace.
Table 2.5-4 Trace Related Commands in Single Trace
Available command
258
Function
SET TRACETRIGGER
Sets up the trace trigger
CANCEL TRACETRIGGER
Deletes the trace trigger
SHOW TRACETRIGGER
Displays the trace trigger
SET TRACE
Sets trace buffer full break
SHOW TRACE
Displays trace data
SEARCH TRACE
Searches for trace data
ENABLE TRACE
Enables trace function
DISABLE TRACE
Disables trace function
CLEAR TRACE
Clears trace function
CHAPTER 2 DEPENDENCE FUNCTIONS
Note:
In the case of the data trace trigger, word access from an odd address (in terms of bus access) is
performed using a byte access for twice. Note that this is the reason why there will not be any hits
even when word access is specified from an odd address.
259
CHAPTER 2 DEPENDENCE FUNCTIONS
2.5.6.2
Displaying Trace Data Storage Status
It is possible to displays how much trace data is stored in the trace buffer. This status
data can be read by specifying /STATUS to the SHOW TRACE command.
■ Displaying Trace Data Storage Status
It is possible to displays how much trace data is stored in the trace buffer. This status data can be read by
specifying /STATUS to the SHOW TRACE.
[Example]
>SHOW TRACE/STATUS
en/dis
= enable
buffer full = nobreak
code
= enable
loop compress = enable
; Trace function enabled
; Buffer full break function disabled
; Code execution enabled
; loop compress function enabled
frame no. = -00120 to 00000 ; Frame -120 to 0 store data
>
260
CHAPTER 2 DEPENDENCE FUNCTIONS
2.5.6.3
Specifying Displaying Trace Data Start
The data display start position in the trace buffer can be specified by inputting a step
number or frame number using the SHOW TRACE command. The data display range can
also be specified.
■ Specifying Displaying Trace Data Start
Specify the data display start position in the trace buffer by inputting a step number or frame number using
the SHOW TRACE command. The data display range can also be specified.
[Example]
>SHOW TRACE/RAWDATA -6
; Start displaying from frame -6
>SHOW TRACE/RAWDATA -6..0
; Display from frame -6 to frame 0
>SHOW TRACE -6
; Start displaying from step -6
>SHOW TRACE -6..0
; Displays from step -6 to step 0
261
CHAPTER 2 DEPENDENCE FUNCTIONS
2.5.6.4
Display Format of Trace Data
The trace data display format can be selected by running the SHOW TRACE command
with a command modifier specified. If setup is completed with the SET SOURCE
command so as to select a source line addition mode, a source line is attached to the
displayed trace data.
There are three formats to display trace data:
• Display without analyzing trace data (Specify /RAWDATA.)
• Display in instruction execution order (Specify /INSTRUCTION.)
• Display in source line units (Specify /SOURCE.)
■ Display without Analyzing Trace Data (Specify /RAWDATA.)
The frame output by the emulator is not analyzed and it displays it as it is.
The display of the source is done and corked in this mode regardless of the setting by the SET SOURCE
command.
Disassemble Description
Indicates instruction executed.
Frame Number
Decimal,
signed
Data
Time Stamp
Displays difference of executed time
between this frame and next frame
(decimal).
The unit is cycle.
Hexadecimal
Interrupt
>SHOW TRACE /RAWDATA -2400
frame no. address data(mnemonic)
time stamp
Branching by hardware
- 02400 : DF02B3 BRA
DF0296 - > DF0296
1
interrupt
0010 at 004A32
- 02399 : write
- 02398 : read
0010 at 004A32
8
- 02397 : DF029B BGE
DF02B5 - > DF02B5 [INT]
3
- 02396 : DF02BC == << Trace ON code hit >> ==
10
Jump address
- 02395 : write
0000 at 0001A0
0
Hexadecimal Branch
- 02394 : write
0000 at 004A32
2
destination address
- 02393 : read /DMA 0000 at 004A32
2
of branch instruction
- 02392 : read
0000 at 0001A2
6
- 02391 : DF02C4 BRA
DF02CA - > DF02CA
1
- 02390 : write
0001 at 0001A2
1
- 02389 : ==== << Break at DF02CA >> =====
- 02388
:
DF02CA
MOV
A,#10
Data access
read : Read access to internal memory
write : Write access to internal memory
/DMA: DMA access
(No indication means CPU access.)
Special frame is as follows.
Break at "address":
262
Displays address which program execution is stopped.
Trace ON code(data) hit:
Indicates that trace acquisition is started.
Trace OFF code(data) hit:
Indicates that trace acquisition is stopped.
CHAPTER 2 DEPENDENCE FUNCTIONS
Reset:
Indicates that reset is detected.
Loop Count "Number of times": Displays number of times which loop count occurs.
Extended time stamp frame:
Displays here when the value of time stamp is 8191 or more.
Data Lost Error:
Indicates that data is lost.
■ Display in Instruction Execution Order (Specify /INSTRUCTION.)
It is a form that is pulled out the divergence frame from the RAW data display, and supplemented between
frames with the reverse-assembly display. Special frames other than the program lockup frame are displayed.
The display in this mode is as follows.
Disassemble Description
Display that supplements
between branch frames.
Time stamp
Displays difference of executed time
between this frame and next frame
(decimal).
The unit is cycle.
Frame Number
Decimal,
signed
Special frame is as follows.
Trace ON code(data) hit:
Indicates that trace acquisition is started.
Trace OFF code(data) hit:
Indicates that trace acquisition is stopped.
Reset:
Indicates that reset is detected.
Loop Count "Number of times": Displays number of times which loop count occurs.
Extended time stamp frame:
Displays here when the value of time stamp is 8191 or more.
Data Lost Error:
Indicates that data is lost.
263
CHAPTER 2 DEPENDENCE FUNCTIONS
■ Display in Source Line Units (Specify /SOURCE.)
Only the source line can be displayed.
[Example]
>SHOW TRACE/SOURCE -1010..-86
264
step no.
source
-01007
: sample.c$68
value [i] = &target[I];
-00905
: sample.c$68
value [i] = &target[I];
-00803
: sample.c$68
-00698
: sample.c$70
-00655
: sample.c$9 {
-00594
: sample.c$13
-00185
: sample.c$14
i = k;
-00149
: sample.c$15
p = tblp[i - 1];
-00088
: sample.c$16
while ((j = 2 * i) <= max){
value [i] = &target[I];
sort_val(value, 16L);
for (k = max / 2; k >= 1; k--){
CHAPTER 2 DEPENDENCE FUNCTIONS
2.5.6.5
Saving Trace Data
This section explains how to save trace data.
■ Saving Trace Data
Trace data can be saved in a specified file.
The following two methods are available to save trace data: using GUI (window or dialog) and using only the
command. The same result is obtained from both methods.
● Using GUI for Saving Trace Data
1. Display the trace window.
- Select [View] - [Trace] menu.
2. Specify the name of the file in which to save trace data.
- Right-click on the trace window, and select [Save] from the shortcut menu. The [Save as] dialog
appears.
Specify the file name and where to save trace data. For details, refer to Section "4.4.8 Trace" in
"SOFTUNE Workbench Operation Manual".
● Using Command for Saving Trace Data
1. Save trace data.
- Execute the SHOW TRACE/FILE command.
For details, refer to Section "4.33 SHOW TRACE (type 3)" in "SOFTUNE Workbench Command
Reference Manual".
When additionally saving trace data in an existing file, execute the SHOW TRACE/FILE/APPEND
command.
265
CHAPTER 2 DEPENDENCE FUNCTIONS
2.5.7
Measuring Performance
It is possible to measure the time and pass count between two events. Repetitive
measurement can be performed while executing a program in real-time, and when done,
the data can be totaled and displayed.
Using this function enables the performance of a program to be measured.
■ Performance Measurement Function
The performance measurement allows the time between two event occurrences to be measured and the
number of event occurrences to be counted. Up to 65535 event occurrences can be measured.
● Measuring Time
Measures time interval between two events. Two sections can be set.
● Measuring Count
The specified events become performance measurement points automatically, and occurrences of that event
are counted.
266
CHAPTER 2 DEPENDENCE FUNCTIONS
2.5.7.1
Performance Measurement Procedures
Performance can be measured by the following procedure:
1. Setting minimum measurement unit for timer.
2. Specify performance-buffer-full break.
3. Setting events.
4. Executing program.
5. Displaying performance measurement data.
6. Clearing performance measurement data.
■ Setting Minimum Measurement Unit for Timer
It is 1ns as the minimum measurement unit for the timer used to measure performance. Moreover, the
resolution of the measurement data depends on the clock of CPU.
■ Specifying Performance-Buffer-Full Break
When the buffer for storing performance measurement data becomes full, a executing program can be
broken. This function is called the performance-buffer-full break. The performance buffer becomes full when
an event occurs 65535 times.
If the performance-buffer-full break is not specified, the performance measurement ends, but the program
does not break.
[Example]
>SET PERFORMANCE/NOBREAK
<--
Specifying Not Break
>
■ Setting Events
The event is set by event setting (performance section setting) dialog or SET PERFORMANCE command.
Two sections can be set.
● Measuring Count
The specified events become performance measurement points automatically.
■ Executing Program
Start measuring when executing a program by using the GO or CALL command. If a break occurs during
interval time measurement, the data for this specific interval is discarded.
■ Displaying Performance Measurement Data
Display performance measurement data by using the SHOW PERFORMANCE command.
■ Clearing Performance Measurement Data
Clear performance measurement data by using the CLEAR PERFORMANCE command.
[Example]
>CLEAR PERFORMANCE
>
267
CHAPTER 2 DEPENDENCE FUNCTIONS
2.5.7.2
Display Performance Measurement Data
Display the measured time and measuring count by using the SHOW PERFORMANCE
command.
■ Displaying Measured Time
To display the time measured, specify the starting event number or the ending event number.
Count of measuring within
given time interval
Event number
1,9000,18999,1000
µ
Minimum execution time
Maximum execution time
Average execution time
Total measuring count
µ
Lower time limit for display
Upper time limit for display
268
CHAPTER 2 DEPENDENCE FUNCTIONS
2.5.8
Execution Time Measurement
This function measures the program execution time.
■ Measurement Items
Measures time between the start and stop of program execution.
In this emulator debugger, the measurement is performed by the emulation timer or cycle counter. The
following shows the features.
• Emulation timer
Resolution : 25 ns
Significant bits: 64 bits
Maximum measurement time : 18,446,744,073,709,551,615 x 25 ns
• Cycle counter
Significant bits: 64 bits
Maximum measurement cycle count : 18,446,744,073,709,551,615 cycles
In either case, the measurement is performed whenever a program is executed, and the measurement result
displays the following two values:
• Number of cycles spent on the previous program execution
• Total number of cycles executed since the previous clearing
■ Displaying Measurement Results
Either of the following methods can be used to display the measurement results.
• Display by dialog
The results appear in the time measurement dialog, which can be displayed by selecting [Debug] - [Time
Measurement] menu.
For details, refer to Section "4.6.8 Time Measurement" in "SOFTUNE Workbench Operation Manual".
• Display by command
Enter the SHOW TIMER command in the command window.
For details, refer to Section "4.27 SHOW TIMER" in "SOFTUNE Workbench Command Reference Manual".
■ Clearing Measurement Results
Either of the following methods can be used to clear the measurement results.
• Clearing by dialog
Click the [Clear] button in the time measurement dialog, which can be displayed by selecting [Debug] [Time Measurement] menu.
For details, refer to Section "4.6.8 Time Measurement" in "SOFTUNE Workbench Operation Manual".
• Clearing by command
Enter the CLEAR TIMER command in the command window.
For details, refer to Section "4.28 CLEAR TIMER" in "SOFTUNE Workbench Command Reference Manual".
269
CHAPTER 2 DEPENDENCE FUNCTIONS
Note:
The measured execution time is added about ten extra cycles per execution. If the execution cycle is
measured, execute many instructions continuously in order to minimize the effect of error.
270
CHAPTER 2 DEPENDENCE FUNCTIONS
2.5.9
Power-On Debugging
This section explains power-on debugging by the emulators for the MB2198.
■ Power-on Debugging
Power-ON debugging refers to the operation to debug the operating sequence that begins when the power to
the target is switched on.
For products with a dedicated power-on debugging pin, the MB2198 emulator can debug the sequence
performed immediately after power-on. The following functions are available:
• Code break
• Data break
• Sequencer
• Trace trigger
• Trace measurement
• Coverage measurement
The power-on debugging procedure is described below:
• Set the DIP switch on the adapter board mounted in the upper part of the emulator.
• Turn on the target board and emulator main unit.
• Launch Workbench to start debugging.
For debugging, set hardware breaks, etc.
• To start a power-on debugging, run [Execute] - [Power-ON Debug] menu.
Input the lower limit value of the monitoring voltage from the [User Power Monitor Voltage] dialog box
to display PON in the input status bar.]
• Run the program.
• Turn the target board off while running and then back on.
• Conduct debugging.
• To terminate the power-on debugging, run [Execute] - [Power-ON Debug] menu.
271
CHAPTER 2 DEPENDENCE FUNCTIONS
2.6
Emulator Debugger (MB2100-01)
This section explains the functions of the emulator debuggers (MB2100-01).
■ Features of Emulator Debugger (MB2100-01)
The emulator debugger for MB2100-01 has the following features:
● Real-time control
The following operations can be controlled during the execution of the user program:
• Manipulation of memory content (reading/writing, search, comparison, filling, transfer)
• Setting/cancellation of events
• Setting/cancellation of trace mode
● FLASH support
Similar to the RAM area, data can be downloaded to FLASH memory as well as read/written from the
memory window.
● Multifunctional events
Events can be used in the following six functions:
• Code break (hardware)
• Code break (hardware/count)
• Data break
• Data watch break
• Sequence
• Performance trigger
For details of the number of items which can be set, refer to the Hardware Manual for the product type you
are using.
● Inhibiting transition to standby mode
This function inhibits the transition to the standby mode before it is attempted when starting the debugger.
Note:
• Notes on using emulator debugger (MB2100-01)
To perform read access or write access to the general-purpose register (GPR) area [0x000180 to
0x00037F] while a user program is running, access with register operation without using memory
operation.
Read access with memory operation occurs in the following cases.
- Monitoring with the main window or the watch window
- Memory reference by SHOW MEMORY command, EXAMINE command, etc.
- Write access with memory operation occurs in the following cases
- Writing on the main window or the watch window
- Writing by SET MEMORY command, ENTER command, etc.
272
CHAPTER 2 DEPENDENCE FUNCTIONS
2.6.1
Starting debugging
This section describes the method of starting debugging.
■ Starting Debugging
When starting debugging, select the [Debug] - [Start debug] menu. When debugging is started by a new
project, the setup wizard for performing initial setting is activated. For details, refer to "4.7.2.5 Setup
Wizard" in "SOFTUNE Workbench Operation Manual".
■ Verification Items When Starting Debugging
When starting debugging, perform checking for initial settings. When an item of initial setting is not correct,
debugging cannot be started.
- Operating environments of the target
Verify whether the operating environment of the target has a problem.
For details, refer to "2.6.1.1 Operating Environments of the Target".
- Security
Verify whether the security function has been enabled.
For details, refer to "2.6.1.2 Security".
273
CHAPTER 2 DEPENDENCE FUNCTIONS
2.6.1.1
Operating Environments of the Target
This section describes the setting of the target operating environments.
■ Operating Environments of the Target
In this emulator debugger, it is necessary to set the following items according to the operating environments
of the target.
• Standard clock for communication
• Set up length of DEBUG I/F cable
These settings influence the communication speed of the debugger.
● Standard clock for communication
Sets the value for the reference frequency of communication speed used for normal communication.
For details, refer to the Hardware Manual and Data Sheet for the product type you are using.
● Set up length of DEBUG I/F cable
Specified the length of the cable that suits the length of DEBUG I/F cable.
The allowance maximum transfer rate from emulator (MB2100-01) to the direction of MCU changes
according to this length of the cable.
■ How to set
The setup wizard sets the operating environments of the target.
For details, refer to "4.7.2.5 Setup Wizard" in "SOFTUNE Workbench Operation Manual".
Figure 2.6-1 Setup Wizard (Communication Setting)
274
CHAPTER 2 DEPENDENCE FUNCTIONS
Notes:
• When the operating environment set by the setup wizard is different from the actual operating
environment, the debugger cannot be activated.
• For details on the DEBUG I/F (interface), refer to "EMBEDDED EMULATOR MB2100-01-E
OPERATION MANUAL".
275
CHAPTER 2 DEPENDENCE FUNCTIONS
2.6.1.2
Security
This section describes the security.
■ Security
When beginning to debug it when the security function of target MCU is effective, it is necessary to enter the
password in this emulator debugger.
For the security function, refer to the hardware manual of product to be used.
■ How to enter
When a dialog shown below is displayed, enter a preset password. The password is needs to be entered each
time the debugger is activated.
For details on the password, refer to the description of Password for "OCD (On Chip Debugger)" start
permission in the hardware manual for the product used.
Figure 2.6-2 Debugger Connection Password
Notes:
• When authentification of the password has failed, the debugger cannot be activated. Turn on again
the power supply of the target to activate the debugger again.
• When the user system is in the bus sleep state, press the OK button after the bus sleep state is
canceled.
276
CHAPTER 2 DEPENDENCE FUNCTIONS
2.6.2
Ending debugging
This section describes the method of ending debugging.
■ Ending debugging
When ending debugging, select the [Debug] - [End debug] menu.
Turn off the power supply of the target after selecting the [End debug] menu.
■ When the debugger has aborted
When the debugger has aborted for some reason, problems as described below can occur.
● The code of a software break remains on the flash memory
When a software break is set in a flash memory area, the contents of the flash memory are rewritten with the
code of the software break. When debugging has ended normally, the re-written data is reverted. If it has
ended abnormally, software break code may remain without data being reverted.
When starting the debugger, it checks whether this software break exists. If it does, the following message
appears.
"The software break set in A on B might remain."
A: A project name displayed when the debugger aborted
B: The date when the debugger aborted
When the message is displayed, download again the program to the flash memory.
Note:
A warning message related to a software break is displayed even when a project other than the project
name displayed in the message is used.
After a software breakpoint was deleted, a warning message may be displayed even if the debugger
was ended abnormally while using another debug function.
277
CHAPTER 2 DEPENDENCE FUNCTIONS
2.6.3
Efficiently Executing Debugging
This section describes setting for efficient debugging.
■ Setting Operating Environment
In order to enable the user to even more comfortably execute debugging, the emulator debugger provides the
following items required to be set correspondingly to, for example, the operating environment and the usage.
• Standard clock frequency for high-speed communication
• Debug function
Therefore, if the default value is used as it is, there is no need to change this setting. In addition, a set value
once specified is set as a default for the subsequent operation.
278
CHAPTER 2 DEPENDENCE FUNCTIONS
2.6.3.1
Increasing Communication Speed during Debugging
This section describes setting for increasing the communication speed during
debugging.
■ Standard Clock Frequency for High-speed Communication
This emulator debugger enables high speed communication mode when setting the reference clock frequency
for high speed communication to the optimum value. In high speed communication mode, the
communication speed between the target and adapter is high, and the debugger operation will be faster.
The standard clock frequency for high-speed communication is different in optimal value depending on the
MCU. For details, refer to the hardware manual and the datasheet of products to be used.
■ How to set
The method of setting the standard clock frequency for high-speed communication is described below.
● Dialog
- Debugging environment set dialog [Frequency] tab
For details, refer to "4.7.2.3 Debug Environment" in "SOFTUNE Workbench Operation Manual".
● Command
- SET FREQUENCY
For details, refer to "1.45 SET FREQUENCY" in "SOFTUNE Workbench Command Reference
Manual".
Note:
If the frequency is changed during high-speed communication mode, the MCU must be reset. The
frequency is changed after a reset is updated.
279
CHAPTER 2 DEPENDENCE FUNCTIONS
2.6.3.2
Switching Debug Function
This section describes the method of switching the debug function correspondingly to
the usage.
■ Debug Functions
Some of the debugging features are exclusive features which cannot be set simultaneously. Those features
require to switch modes depending on usage.
The mode has two types described below.
• Execution time mode
This mode selects the method of measuring the user-program execution time.
- Time measurement mode (default)
This mode measures the time from the start of execution to the break occurrence.
- Performance mode
This mode measures the time between specified two events (points).
• Pass count mode
This mode selects the using method for the pass count function.
- Sequential mode
This mode uses the sequential function.
The pass count break cannot be used.
- Pass count break mode (default)
This mode uses the pass count break.
The sequential function cannot be used.
■ Switching methods
The followings show the settings for execution time mode and pass count mode.
● Dialog
- Debugging environment set dialog [Event] tab
For details, refer to "4.7.2.3 Debug Environment" in "SOFTUNE Workbench Operation Manual".
● Command
- SET MODE
For details, refer to "1.9 SET MODE (type 2)" in "SOFTUNE Workbench Command Reference
Manual".
280
CHAPTER 2 DEPENDENCE FUNCTIONS
2.6.4
Executing Program
This section describes the method of executing a user program.
■ Executing a program
A user program is executed in a procedure described below.
1. Open a project (workspace).
Select the [File] - [Open workspace file] menu.
2. Start debugging.
For details, refer to "2.6.1 Starting debugging".
3. Load an execution-desired target program.
When loading a project target file, select the [Debug] - [Load target file] menu.
4. Execute program.
Select the [Debug] - [Run] - [GO] menu.
For other executions, such as step execution, refer to "4.6.1 Run" in "SOFTUNE Workbench Operation
Manual".
■ Control during program execution
This emulator debugger is capable of controlling the following during the execution of a user program.
• Debug function setting/release
• Monitoring
• Power-on debug
281
CHAPTER 2 DEPENDENCE FUNCTIONS
2.6.4.1
Setting/Release of Debug Functions
The debug function can be set or released while executing the user program.
■ Commands Available during Execution of User Program
A specific debug feature can be set/released while executing the user program in this emulator debugger.
Either the dialog or the command can be set/released.
Table 2.6-1 shows the commands available during execution of user program. For more details, see
"● Debugger" in "SOFTUNE Workbench Command Reference Manual".
Table 2.6-1 Commands Available during Execution of User Program
Function
Major Command name*1
Reset MCU
1.3 RESET
Memory operation (read/write)
5.1 EXAMINE
5.2 ENTER
5.3 SET MEMORY
5.4 SHOW MEMORY
5.5 SEARCH MEMORY
5.8 COMPARE
5.9 FILL
5.10 MOVE
5.11 DUMP
Line assemble/disassemble
6.1 ASSEMBLE
6.2 DISASSEMBLE
Set/delete breakpoint
3.1 SET BREAK (type1)
3.3 SET BREAK (type3)
3.6 CANCEL BREAK
3.7 ENABLE BREAK
3.8 DISABLE BREAK
3.10 SET DATABREAK (type3)
3.12 CANCEL DATABREAK
3.13 ENABLE DATABREAK
3.14 DISABLE DATABREAK
Set/delete sequencer
3.22 SET EVENT(type3)
3.24 CANCEL EVENT
3.25 ENABLE EVENT
3.26 DISABLE EVENT
3.27 SET SEQUENCE (type1)
3.34 CANCEL SEQUENCE(type 1)
3.36 ENABLE SEQUENCE(type 1)
3.38 DISABLE SEQUENCE(type 1)
Trace operation
4.15 CLEAR TRACE
4.17 ENABLE TRACE (type2)
4.19 DISABLE TRACE (type2)
4.20 SEARCH TRACE
*1 : Refer to "SOFTUNE Workbench Command Reference Manual".
282
CHAPTER 2 DEPENDENCE FUNCTIONS
Note:
An error message appears if you enter a command that cannot be used during the execution of a user
program.
"E4404S Command error (MCU is busy)."
283
CHAPTER 2 DEPENDENCE FUNCTIONS
2.6.4.2
Monitoring
This section describes the monitoring function.
■ Monitoring
The monitoring function is capable of real-time referencing a variation in the value of a specific address
during user program execution.
The function is capable of a variation in the value of a specified watch variable, in addition to the value of a
specific address.
■ How to use
The use procedure of the monitoring function is described below.
● When performing monitoring of the memory window
1. Display the memory window.
• Select the [View] - [Memory] menu.
Specify a target address for monitoring
2. Enable the monitoring function through any one of methods described below.
• Select the shortcut menu [Monitoring] of the memory window.
• Select the [Setup] - [Debug environment] - [Debug environment] menu to display the [Monitoring] tab.
3. Execute the program.
According to the above, a portion with variation during the program execution is displayed in red.
● When performing monitoring of the watch window
1. Display the watch window.
• Select the [View] - [Watch] menu.
Register a target watch variable for monitoring
For details, refer to "4.4.7 Watch" in "SOFTUNE Workbench Operation Manual".
2. Enable the monitoring function through any one of methods described below.
• Select the shortcut menu [Monitoring] in the memory window.
• Select the [Setup] - [Debug environment] - [Debug environment] menu to display the [Monitoring] tab.
3. Execute the program.
According to the above, a portion with variation during the program execution is displayed in red.
284
CHAPTER 2 DEPENDENCE FUNCTIONS
2.6.4.3
Power-on Debug
This section describes power-on debug function.
■ Power-on Debug
Power-on debug is a function to debug the sequence immediately after turning on of the power supply of the
target system.
■ How to use
The use procedure of power-on debug is as follows:
● When power-on debug
1. Start debug.
Select [Debug] - [Start debug] menu.
2. Power-on debug mode is made effective.
Select [Debug] - [Run] - [Power on Debug] menu.
It shifts to power-on debug mode.
3. Execute the user program.
Continuous execution of the user program that doesn't do anything such as infinity looping is recommended.
Display the confirmation dialog whether the program execution is interrupted.
4. Do either the following:
• Chip reset is issued from the outside.
• The power supply of the target is turned on again.
After the power supply returns, the program starts running from the reset vector.
● When release power-on debug mode
Before executing the user program
Select [Debug] - [Run] - [Power on Debug] menu.
After executing the user program
Press the cancel button by the interruption dialog displayed in power-on debug mode.
285
CHAPTER 2 DEPENDENCE FUNCTIONS
Notes:
• Other debug features cannot be used while debugging power-on at all.
• When security is enabled, power on debug is not available.
• Selecting the power-on debug menu, the following functions cleared.
- Performance measurement
- Execution cycle measurement
• Turning on the power supply of the target again, the following functions cleared.
- Performance measurement
- Trace data
- Data match status of Data watch break
- Hit count of Sequence
- Hit count of Passcount break
286
CHAPTER 2 DEPENDENCE FUNCTIONS
2.6.4.4
Notes on Commands for Executing Program
When using commands to execute a program, there are several points to note.
■ Notes on GO Command
For the GO command, two breakpoints that are valid only while executing commands can be set. However,
care is required in setting these breakpoints.
● Invalid Breakpoints
- No break occurs when the breakpoint is set at three instructions or less executed continuously from the
user interrupt.
- No break occurs when breakpoint set at address other than starting address of instruction.
- No break occurs when a breakpoint is set at three instructions or less immediately after the following
instructions.
PCB
NCC
SPB
MOV ILM,#imm8
OR CCR,#imm8
INT addr16
INT9
JCTX @A
Undefined instruction
F2MC-16FX
DTB
ADB
CNR
AND CCR,#imm8
POPW PS
INTP addr24
INT #vct
RETI
■ Notes on STEP Command
● Exceptional Step Execution
When executing the instructions listed in "■ Notes on GO Command" as invalid breakpoints, such an
instruction and next three instructions are executed as a single instruction.
Furthermore, when above-mentioned instructions are included in the next continuous instructions, all of them
and the next continuous three instructions or less are executed as a single instruction.
[Example] When instructions as invalid breakpoints is consecutive
POPW PS
(1)
NOP
(2)
RETI
(3)
MOVN A,#-0
(4)
MOVW RW0,A
(5)
NOP
(6)
NOP
(7)
287
CHAPTER 2 DEPENDENCE FUNCTIONS
Because "POPW PS" (1) is an instruction as invalid breakpoint shown in "Notes on GO Command", no break
occurs at three instructions following "POPW PS".
And because instruction (3) is the instruction shown in above-mentioned note among three instructions (2),
(3) and (4) following "POPW PS", three instructions (4), (5) and (6) following instruction (3) are executed
continuously.
Consequently, the program counter (PC) advances to NOP instruction (7) when the step operation is executed
from the point of "POPW PS" instruction (1).
Note:
• Issuing a chip reset during the execution of the user program, the following functions cleared.
- Execution cycle measurement
- Performance measurement
- Data match status of Data watch break
288
CHAPTER 2 DEPENDENCE FUNCTIONS
2.6.5
To Access the Flash Memory
This section describes the access method to the flash memory.
■ Access to Flash Memory
In this emulator debugger, the direct operation of the content of the flash memory can be done as well as
RAM area.
■ What is flash memory synchronization?
When writing data to the flash memory area, the data will not be written to the flash memory on the target
immediately, and the data will be saved in the buffer on SOFTUNE Workbench once.
The saved data must be matched to the contents of the flash memory on the target before the user system
starts operations.
The matching operation is referred to as "flash memory synchronization" (or, "synchronization of flash
memory").
There are two types of flash memory synchronization:
• Flash memory synchronization [Flash -> Debugger]
Clears the buffer on SOFTUNE Workbench, and updates the contents of the flash memory.
• Flash memory synchronization [Debbuger -> Flash]
Updates the stored data on the flash memory.
■ Methods of flash memory synchronization
Flash memory synchronization can be performed in following method.
● Flash memory synchronization [Flash -> Debugger]
• Select the [Environment] - [Flash area control] menu.
Clears the buffer on SOFTUNE Workbench when selecting this item.
For details, refer to "4.7.4 Flash area control" in "SOFTUNE Workbench Operation Manual".
● Flash memory synchronization [Debbuger -> Flash]
• Select the [Environment] - [Flash area control] menu.
Updates the flash memory with the contents of the buffer on SOFTUNE Workbench when selecting this
item.
For details, refer to "4.7.4 Flash area control" in "SOFTUNE Workbench Operation Manual".
• If the target flash memory area is updated, the automatic synchronization starts when one of the following
operations is performed.
- When a user program has been executed
- When a reset has been issued
- When debugging has been ended
- When the use of software break is set to prohibition
- When the target file is automatically loaded at start of debugging
289
CHAPTER 2 DEPENDENCE FUNCTIONS
Note:
To speed up flash memory synchronization processing, set the communication speed of the debugger
to the high-speed mode. For details, refer to "2.6.3.1 Increasing Communication Speed during
Debugging".
■ Examples of flash memory synchronization
● In the case of [Debugger -> Flash]
An image in the case where the flash memory synchronization [Debugger -> Flash] has been performed is
shown below.
Variations in the values of the debugger and flash memory
in the case of the flash memory synchronization [Debugger -> Flash]
Debugger
Flash memory
FF
FF
FF
FF
Memory writing,
loading, etc. by the user
FF
FF
FF
FF
Execution and reset, etc.
Occurrence of flash memory synchronization [Debugger -> Flash]
12
34
56
78
290
CHAPTER 2 DEPENDENCE FUNCTIONS
● In the case of [Flash -> Debugger]
An image in the case where the flash memory synchronization [Flash -> Debugger] has been performed is
shown below.
Variations in the values of the debugger and flash memory
in the case of the flash memory synchronization [Flash -> Debugger]
Debugger
Flash memory
FF
FF
FF
FF
Execution of a user program
that writes to the flash memory
12
34
56
78
Synchronization [Flash -> Debugger]
Occurrence of flash memory synchronization
[Flash -> Debugger]
291
CHAPTER 2 DEPENDENCE FUNCTIONS
2.6.6
To Interrupt the Program Execution [Break]
This section describes the method of interrupting the execution of the user program.
■ Break Functions
The function to interrupt the execution of the user program is called a break function.
This Emulator debugger provides the following seven types of break functions;
• Code break (hardware)
• Code break (hardware/count)
• Code break (software)
• Data break
• Forced break
• Data watch break
• Sequencer
When by each break function aborts program execution, the address where a break occurred and the break
factor are displayed.
292
CHAPTER 2 DEPENDENCE FUNCTIONS
2.6.6.1
Code Break (Hardware)
This function suspends program execution by monitoring a specified address by
hardware. A break occurs before an instruction at the specified address is executed.
■ Code Break (Hardware)
This function suspends program execution by monitoring a specified address by hardware. A break occurs
before an instruction at the specified address is executed.
Code Break (Hardware) has the hardware/count for which a path count can be set.
The maximum number of points that can be set is as follows:
Hardware:
8*
Hardware/count:
2
* Some products may not be able to set 8 items . For details of the number of items which can be set, refer
to the Hardware Manual for the product type you are using.
When the code break (hardware) occurs, the following message appears in the status bar.
• Hardware:
Break at [Address] by code event break
• Hardware/count
Break at [Address] by sequential or pass count break
■ How to set
Control the code break in the following methods:
• Command
- SET BREAK/HARD
Refer to "3.1 SET BREAK(type 1)" in "SOFTUNE Workbench Command Reference Manual".
• Dialog
- "Code" tab in the breakpoint setting dialog
Refer to "4.6.4 Breakpoint" in "SOFTUNE Workbench Operation Manual".
• Window
- Source window/disassemble window
Refer to "3.7 Source Window" or "3.9 Disassemble Window" in "SOFTUNE Workbench Operation
Manual".
■ Special Operation when breakpoint is set
If the specified condition is satisfied in the debugger, note that the following phenomenon occurs.
• No progressing of program counter (PC)
If the hardware break is set to the string instruction, the pass count may be added several times by one
instruction execution.
Furthermore, if program is executed from the string instruction which the hardware break is set, a break
occurs without progressing PC.
• When the breakpoint is hit, the stopping address becomes after two instructions or less from the address
that is sure to stop originally.
During continuous user program execution, the address where the program stops becomes after two
293
CHAPTER 2 DEPENDENCE FUNCTIONS
instructions or less from the address that is sure to stop originally when either of the following conditions
was satisfied.
- When the break operation is generated while the instruction where the user interrupt is generated and
the next one instruction or less are executed
- When the break operation is generated while either of the following instructions and the next one
instruction or less are executed
- INT addr16
- INTP addr24
- POPW PS
- AND CCR #imm8
- OR CCR #imm8
- MOV ILM #imm8
- Prefix codes (PCB, DTB, ADB, SPB, CMR, NCC)
- INT9
- INT #vct
- JCTX @A
- RETI
- Undefined instructions (exceptions)
Notes:
• When setting a breakpoint, always specify the starting address of the instruction. A break may not
occur if an address other than the starting address is specified.
• A code break shares points with the following functions. The maximum number varies depending
on how those functions are used.
- Data break
- Data watch break
- Sequence
• When hardware or hardware/count break is set at the top of the reset handler, the break does not
occur.
• When the pass count mode is the passing count break mode, the hardware/count break cannot be
used. For details, refer to "2.6.3.2 Switching Debug Function".
294
CHAPTER 2 DEPENDENCE FUNCTIONS
2.6.6.2
Code Break (Software)
This function suspends program execution by monitoring a specified address by
software. A break occurs before executing an instruction at the specified address.
■ Code Break (Software)
This function suspends program execution by monitoring a specified address by software.
Setting area
: RAM area or flash memory area
The break conditions
: Before executing an instruction the specified address
The maximum number of points: 4096 points
When the code break (software) occurs, the following message appears in the status bar.
Break at [Address] by breakpoint
■ Operation Requirements
Please set the use of the software break to permission when you use the code break (software) by the
following method. It is not possible to set it to not only the flash memory area but also RAM area when
prohibiting it.
• Dialog
- Setup wizard
For details, refer to "4.7.2.5 Setup Wizard" in "SOFTUNE Workbench Operation Manual".
- Debug environment setting dialog "Break" tab
For details, refer to "4.7.2.3 Debug Environment" in "SOFTUNE Workbench Operation Manual".
■ How to set
Control the code break in the following methods:
• Command
- SET BREAK/SOFT
Refer to "3.1 SET BREAK(type1)" in "SOFTUNE Workbench Command Reference Manual".
• Dialog
- "Code" tab in breakpoint setting dialog
Refer to "4.6.4 Breakpoint" in "SOFTUNE Workbench Operation Manual".
• Window
- Source window/disassemble window
Refer to "3.7 Source Window" or "3.9 Disassemble Window" in "SOFTUNE Workbench Operation
Manual".
Notes:
• When setting a code break (software) in a flash memory area, the contents of the flash memory at
the specified address is temporarily rewritten. For details, refer to "2.6.5 To Access the Flash
Memory".
• When the debugger has aborted in the state where the code break (software) is set, the contents of
the flash memory can be abnormal. For details, refer to "2.6.2 Ending debugging".
295
CHAPTER 2 DEPENDENCE FUNCTIONS
2.6.6.3
Data Break
This function suspends program execution when data access (read/write) is made to a
specified address.
■ Data Break
This function suspends program execution when data access (read/write) is made to a specified address. Up
to 8 points can be set.
When the data break occurs, the following message appears in the status bar.
Break at [Address] by data event break
■ How to set
Control the data break in the following methods:
• Command
- SET DATABREAK
Refer to "3.9 SET DATABREAK (type 3)" in "SOFTUNE Workbench Command Reference Manual".
• Dialog
- "Data" tab in the breakpoint setting dialog
Refer to "4.6.4 Breakpoint" in "SOFTUNE Workbench Operation Manual".
Notes:
• A data break shares points with the following functions. The maximum number varies depending on
how those functions are used.
- Code break
- Data watch break
- Sequence
• The data break may stop after a few instructions following the instruction with detection access are
executed.
• A data access in the string instruction is optimized in the chip. Therefore, the data break may not be
detected in the specified condition.
• The data break may stop the program execution after a few instructions following the instruction
with detection access are executed.
296
CHAPTER 2 DEPENDENCE FUNCTIONS
2.6.6.4
Forced Break
This function forcibly suspends program execution.
■ Forced Break
This function forcibly suspends program execution.
When the forced break occurs, the following message appears in the status bar.
Break at [Address] by command abort request
■ How to Generate
A forced break is generated in the following methods:
• Menu
[Debug] - [Abort] menu
Refer to "4.6.2 Abort" in "SOFTUNE Workbench Operation Manual".
• Command
- ABORT
Refer to "2.4 ABORT" in "SOFTUNE Workbench Command Reference Manual".
■ When a User Program does not Stop
In any one of the following, even when the forced break is caused to occur, the user program may not stop.
Solutions are described below.
• The communication speed of the debugger is low.
[Phenomenon] When the communication speeds of the debugger is low, it can take time to receive a
program stop request.
[Solution] Await for some time until receipt of the stop request is completed.
• The interrupt level is low.
[Phenomenon] When the interrupt level of the program stop request is low, the interrupt is masked by the
CPU interrupt level (ILM).
[Solution 1] Alter the interrupt level of the stop request, and issue a stop request again.
[Solution 2] Issue a program forced-stop request.
• The debugger is in power-on debugging.
[Phenomenon] It is considered that the debugger is in power-on debugging.
[Solution] Cancel the power-on debug mode.
• The MCU is in a hang-up state.
[Phenomenon] It is considered that the MCU is in a hang-up state.
[Solution] Issue a reset.
Note:
If the forced break is performed in CPU pause state a break occurs after that state is released.
For more details, see "Appendix C. Debugger Suspension Messages" in "SOFTUNE Workbench
Command Reference Manual".
297
CHAPTER 2 DEPENDENCE FUNCTIONS
2.6.6.5
Data Watch Break
This special break function suspends program execution when the program reaches a
specified instruction address while the value in the specified data address matches with
specified data.
■ Data Watch Break
This special break function suspends program execution when the program reaches a specified instruction
address while the value in the specified data address matches with specified data. Up to 2 points can be set.
The following message is displayed in the status bar, when a data watch break occurs.
Break at address by breakpoint (data watch)
The break conditions for the data watch break are illustrated in the Figure 2.6-3.
Figure 2.6-3 Break Conditions for Data Watch Break
Data watch
Program flow
Specified
instruction
address
When data does not match,
no break occurs.
Specified
instruction
address
Data match
When data matches,
a break occurs.
■ How to set
Control the data watch break in the following methods:
● Data watch break
• Command
- SET BREAK/DATAWATCH
Refer to "3.3 SET BREAK(type3)" in "SOFTUNE Workbench Command Reference Manual".
• Dialog
- "Code" tab in the breakpoint setting dialog
"Hardware/data watch"
Refer to "4.6.4 Breakpoint" in "SOFTUNE Workbench Operation Manual".
298
CHAPTER 2 DEPENDENCE FUNCTIONS
Notes:
• A data watch break shares points with the following functions. The maximum number varies
depending on how those functions are used.
- Code break
- Data break
- Sequence
• The data watch break may stop if it hits a specified address after a few instructions following the
instruction with data detection access are executed. Consequently, it may not stop if it hits the
specified address during the execution of an instruction.
• If the instruction address of the data watch break is set to the string instruction, the program
execution may not stop as expected.
299
CHAPTER 2 DEPENDENCE FUNCTIONS
2.6.6.6
Sequencer
A sequencer is a function to abort the program execution to the specified event condition
when program passes the event following a certain flow (sequence).
■ Control by Sequencer
Table 2.6-2 shows the specifications of the sequencer function for this emulator debugger.
2 events are set and the level is passed through level 1 to level 2 in this order. This becomes sequencer
termination condition. This sequencer is called a 2-level sequencer.
Furthermore, pass information up to that point is reset and an event for restart which monitors the passage of
level 1 againg can be set.
■ Operation of Sequencer
When events are set to each level as shown in example, the sequencer operates as shown in Figure 2.6-4.
[Example]
Level 1 : Event 1
Level 2 : Event 2
Restart : Event 3
Figure 2.6-4 Operation of Sequencer
Program execution start
Level 1
NO
Event 1 occurs
YES
YES
Event 3 occurs
NO
Level 2
Event 2 occurs
YES
Break
300
NO
CHAPTER 2 DEPENDENCE FUNCTIONS
■ Specifications of Sequencer
Table 2.6-2 shows the specifications of the sequencer for this emulator debugger.
Table 2.6-2 Specifications of Sequencer
Function
Specification
No. of levels
2 levels
Restart function
Available (one)
Conditions of each
event
(Code/data)
Address
Pass count: 1 to 1048575
Attribute: Read/write
Data size: Byte, Word, Long
(Attribute and data size can be specified only for data events.)
Operation when
conditions are met
Level 1: Moves to level 2
Level 2: Terminates the sequencer
Restart: Starts the sequencer
■ How to set
Control the sequencer in the following methods:
● Sequencer
• Dialog
- Sequence]setting dialog
For details, refer to "4.6.6 Sequence" in "SOFTUNE Workbench Operation Manual".
• Command
1. The event is set according to the SET EVENT command.
2. The event set by the SET SEQUENCE command is set as a sequence.
For details, refer to "3.22 SET EVENT(type 3)" or "3.28 SET SEQUENCE (type2)" in "SOFTUNE
Workbench Command Reference Manual".
301
CHAPTER 2 DEPENDENCE FUNCTIONS
Notes:
• When the pass count mode is a passing count break mode, this function cannot be used.
For details, refer to "2.6.3.2 Switching Debug Function".
• Depending on the output timing of external trace data, the actual order of code execution may
change places with the order of data hit information. For this reason, if a code event and a data
event occur close to each other, normal transition may not occur.
• A sequencer shares points with the following functions. The maximum number varies depending on
how those functions are used.
- Code break
- Data break
- Data watch break
• If a data event is set to the sequencer, the data event may stop after a few instructions following the
instruction with detection access are executed.
• If an event of the sequencer is set to the string instruction, the sequencer may not operate as
expected by the following reason.
- In code event
The pass count may be added several times by one instruction execution.
- In data event
A data access in the string instruction is optimized in the chip.
302
CHAPTER 2 DEPENDENCE FUNCTIONS
2.6.7
Measuring the User Program Execution Time
This section explains the function to measure the user program execution time.
■ Measured Items
The following shows the measurement methods for time required for the user program execution on the
emulator debugger (MB2100-01).
● Measuring Time
Measures the time from start of user program execution to end.
For details, refer to "2.6.7.1 Measuring the User Program Execution Cycle Count [Time Measurement]".
● Measuring Performance
Measures the time between 2 events where the user program passes.
For details, refer to "2.6.7.2
Measurement]".
Measuring Event-to-Event Execution Cycle Count [Performance
■ Measurement Unit
The measurement unit of this debugger is the execution cycle only.
In addition, when setting the execution cycle conversion frequency, the measured execution cycles can be
converted to real-time.
The converted value is not a measured value; however, it provides an indication of real-time.
The following shows the settings of the measurement unit.
● Dialog
- Measurement Unit Dialog
For details, refer to "4.4.13.4 Performance (Emulator Debugger [MB2100-01])" or "4.6.8.1
Measurement unit during the execution time measurement" of "SOFTUNE Workbench Operation
Manual".
● Command
- SET TIMERSCALE
For details, refer to "1.64 SET TIMERSCALE (type2)" of "SOFTUNE Workbench Command
Reference Manual".
Note:
Measurement unit setting is common to both time measurement and performance measurement.
303
CHAPTER 2 DEPENDENCE FUNCTIONS
2.6.7.1
Measuring the User Program Execution Cycle Count
[Time Measurement]
This section explains the function of measuring the number of user program execution
cycles.
■ Measurement Items
This function measures the number of user program execution cycles.
The measurement result displays the following two values:
- The number of execution cycles for the previous user program execution
The maximum number of cycles that can be measured is 72,057,594,037,927,935(=256-1).
- The total number of execution cycles after the previous clear operation
The maximum number of cycles that can be measured is 18,446,744,073,709,551,615(=264-1).
■ Displaying Measurement Results
Either of the following methods can be used to display the measurement results.
• Dialog
- Time measurement dialog
For details, refer to Section "4.6.8 Time Measurement" in "SOFTUNE Workbench Operation Manual".
• Command
- SHOW TIMER
For details, refer to Section "4.27 SHOW TIMER" in "SOFTUNE Workbench Command Reference Manual".
■ Clearing Measurement Results
Either of the following methods can be used to clear the measurement results.
• Dialog
- Time measurement dialog
For details, refer to Section "4.6.8 Time Measurement" in "SOFTUNE Workbench Operation Manual".
• Command
- CLEAR TIMER
For details, refer to Section "4.28 CLEAR TIMER" in "SOFTUNE Workbench Command Reference Manual".
■ Error Information
Click the [Comment] button in the time measurement dialog to display error information about the
measurement results.
Notes:
• The number of cycles measured normally includes an error of about 10 cycles. However, it may be
even more, depending on the bus state.
• If a chip reset is issued during debugging, the measurement cycle count is cleared.
304
CHAPTER 2 DEPENDENCE FUNCTIONS
2.6.7.2
Measuring Event-to-Event Execution Cycle Count
[Performance Measurement]
This section explains how to measure the execution cycle count between two events.
■ Performance Measurement
This emulator debugger measures the execution cycle count between two events, which the system has
passed while a user program is running. This is referred to as "performance measurement".
The features for the performance measurement are as follows.
• Measuring the cycle count required to carry out the event-to-event execution
• Measuring up to 65535 times, using an event-to-event measurement as one cycle
• The allowable number of intervals is only one if one interval is required between two events.
• Accumulating the measurement result and obtaining the average value based on the measuring count
The following shows the performance measurement image.
Figure 2.6-5 Performance Measurement Image
Measuring up to 65535 times
Start execution
Stop execution
1
Start
2
65535
Stop
It measuring
Not possible to measuring
■ Measurement Items
The measurement items are as follows.
Measuring count : Accumulates the number of times the system passes from event to event.
Average
: The average value of the number of cycles required to carry out the event-to-event
execution (total number of cycles divided by the measurement count).
■ Remeasuring
Remeasuring performance refers to a function that clears the measuring count during execution of a user
program and remeasures from the beginning.
To carry out remeasuring, select [Restart] in the shortcut menu of the performance window.
305
CHAPTER 2 DEPENDENCE FUNCTIONS
■ Measuring Procedure
Use the following steps to measure the performance.
1. Specify the performance measuring interval.
2. Execute the measurement.
3. Display the measurement result.
There are two methods for each procedure; the measurement with GUI (window or dialog box) and the
measurement with commands.
These methods give the same measurement results.
● GUI
1. Display the performance window.
- Select [View] - [Performance] menu.
For details, refer to Section "3.18 Performance Window" in "SOFTUNE Workbench Operation
Manual".
2. Specify the performance measuring interval.
- Right-click on the performance window, and select [Event] from the shortcut menu. The event dialog
appears.
For details, refer to Section "4.4.14 Performance" in "SOFTUNE Workbench Operation Manual".
3. Execute user programs.
4. Display the measurement result.
- Right-click on the performance window, and select [Refresh] from the shortcut menu. The performance
measurement result appears.
● Command
1. Specify performance events.
- SET EVENT
For details, refer to Section "3.22 SET EVENT(type 3)" in "SOFTUNE Workbench Command
Reference Manual".
2. Specify the performance measuring interval.
- SET PERFORMANCE
For details, refer to Section "4.9 SET PERFORMANCE (type 3)" in "SOFTUNE Workbench
Command Reference Manual".
3. Execute user programs.
4. Display the measurement result.
- SHOW PERFORMANCE
For details, refer to Section "4.11 SHOW PERFORMANCE(type 1)" in "SOFTUNE Workbench
Command Reference Manual".
306
CHAPTER 2 DEPENDENCE FUNCTIONS
■ Ending the Measurement
The performance measurement is ended in one of the following cases.
• The measuring count has reached 65535.
• A user program has stopped during measurement.
Notes:
• This function is not available when the execution time mode is set to the time measuring mode. For
details, refer to Section "2.6.3.2 Switching Debug Function".
• If two triggers (start and end) set as the measurement interval occur at the same time, the
measurement will result in an error.
• An error of approximately 10 cycles is always detected each time a user program is re-executed
because its execution has been stopped due to a breakpoint during performance measurement.
The error may exceed 10 cycles depending on the bus state.
• If the performance measurement interval (event) is re-specified during execution of a user program,
the previous measurement results are cleared.
• If [Refresh] is selected in the shortcut menu during performance measuring, only the measuring
count appears.
• Whether the performance measurement is currently being continued can be checked using the
built-in variable "%GET_PERFORMANCESTATE".
Refer to "14.25 %GET_PERFORMANCESTATE" of "SOFTUNE Workbench Command
Reference Manual" for details.
• If the starting event and ending event of the performance measurement is set to the string
instruction, the event is not detected correctly and the performance measurement may not operate
as expected.
307
CHAPTER 2 DEPENDENCE FUNCTIONS
2.6.8
Viewing Program Execution History [Trace]
This section describes the trace function.
■ What is Trace
The function that records the program execution history is called "trace".
Trace data contains address information before and after branch, which is available for the analysis of the
program execution history.
■ Trace Functions
This emulator debugger has the following trace functions.
• Forced start:
Forcibly starts acquiring trace data without stopping the execution of a user program
while forced stop is executed and trace data acquisition is stopped.
• Forced stop:
Forcibly ends acquiring trace data without stopping the execution of a user program
during acquisition of trace data.
■ Acquiring Trace Data
The followings show the timing of the start/end of trace data acquisition.
● The acquisition is started when:
- a user program has been executed; or
- the [Start] menu has been selected when a user program has been executed.
● The acquisition is ended when:
- a user program has been stopped; or
- the [Abort] menu has been selected during trace data acquisition.
■ Clearing Trace Data
The following shows the timing for clearing trace data.
● Clear
• When a user program is executed
• When the [Forced start] menu is selected while a user program is executed
• When the chip reset is input while a user program is executed
• When the [Clear] menu is selected
■ Trace Buffer
A place to store recorded data is called a "trace buffer".
Each unit of data stored in the trace buffer is called a "frame".
The trace buffer can contain up to 42 frames.
The trace buffer has a ring-like structure. If the trace buffer becomes full, it is automatically overwritten from
the beginning.
308
CHAPTER 2 DEPENDENCE FUNCTIONS
2.6.8.1
Displaying Trace Data
This section explains how to display trace data.
■ Display Formats of Trace Data
The following three formats can be used to display trace data.
RAW data:
Displays trace data without analyzing it.
Instruction:
Displays trace data in the order in which instructions are executed.
Source:
Displays trace data on a source line basis.
■ Trace Data Display Position
Sampled trace data is numbered by frame. This number is called a "frame number".
Specifies the trace data display position by the frame number.
The last sampled trace data is assigned to frame number 0 and the previous frames become the negative
numbers.
■ How to Display Trace Data
Trace data is displayed in the trace window or command window.
The following two display methods are available, both of which enable you to obtain the same result.
● Using trace window
1. Display the trace window.
- Select [View] - [Trace] menu.
2. Select the display mode of the trace window.
- Right-click on the trace window, and select [RAW data], [Instruction], or [Source] from the shortcut
menu.
For details, refer to Section "3.14 Trace Window" in "SOFTUNE Workbench Operation Manual".
3. Update trace data (If the trace window is already displayed).
- Right-click on the trace window, and select [Refresh] from the shortcut menu. Trace data is updated in
the trance window.
For details, refer to Section "3.14 Trace Window" in "SOFTUNE Workbench Operation Manual".
309
CHAPTER 2 DEPENDENCE FUNCTIONS
● Using command window
1. Display trace data for each display mode.
RAW data: SHOW TRACE
Instruction: SHOW TRACE
Source: SHOW TRACE
For details, refer to Section "4.32 SHOW TRACE (type 2)" in "SOFTUNE Workbench Command
Reference Manual".
Note:
• Instruction display
Instructions are displayed based on the code read from the memory during the trace data display.
Therefore, the instructions are not displayed correctly if the memory contents at the trace data
acquisition are different from those at the trace data display.
310
CHAPTER 2 DEPENDENCE FUNCTIONS
2.6.8.2
Trace Data Display Examples (RAW Data)
This section describes trace data that is displayed in the RAW data mode.
■ RAW Data Display
This format displays frames that are output from the emulator without analyzing them.
Figure 2.6-6 shows a RAW data display example.
Figure 2.6-6 Example of the RAW Data Display
Disassemble Description
Frame Number
Indicates instruction executed.
Decimal, signed
Jump address
Hexadecimal Branch
destination address
of branch instruction
>SHOW TRACE /RAWDATA -10
frame no. address mnemonic
- 00010 : FF00E1 RETI -> FF010E
- 00009 : FF011F BRA
FF010E -> FF010E
- 00008 : FF010E MOVW A,0190 -> FF00CE [INT]
Interrupt
- 00007 : FF00E1 RETI -> FF010E
Branching by hardware
- 00006 : FF011F BRA
FF010E -> FF010E
interrupt
- 00005 : FF010E MOVW A,0190 -> FF00CE [INT]
- 00004 : FF00E1 RETI -> FF010E
- 00003 : FF011F BRA
FF010E -> FF010E
- 00002 : FF010E MOVW A,0190 -> FF00CE [INT]
- 00001 : FF00E1 RETI -> FF010E
00000 : ==== << Break at FF0113 >> =====
Special frame
Break at "address" :
program execution is stopped.
frame no.
Displays frame numbers in decimal notation.
address
Displays a branch address.
Branch destination address = 110C6:"-> 000110C6"
Branch source address = 110A8:"000110A8 ->"
mnemonic
Displays the instructions that are executed.
311
CHAPTER 2 DEPENDENCE FUNCTIONS
2.6.8.3
Trace Data Display Example (Instruction)
This section describes trace data that is displayed in the instruction mode.
■ Instruction Display
This mode displays the branch addresses of the RAW data display in disassembly format. Figure 2.6-7 shows
an instruction display example.
Figure 2.6-7 Example of the Instruction Display
Disassemble Description
Frame Number
Decimal, signed
Display that supplements
between branch frames.
Jump address
>SHOW TRACE /RAWDATA -2400
frame no.
address mnemonic
sample.c$39
}
- 00003 :
FF011F BRA
FF010E -> FF010E
sample.c$36
while (flag2)
{
- 00002 :
FF010E MOVW
A,0190 -> FF00CE
sample.c$14
{
ExtInt:
:
FF00CE LINK
#00
:
FF00D0 PUSHW RW0
sample.c$15
*((char __io*)0x59) =0;
:
FF00D2 MOV
A,#59
:
FF00D4 MOVW
RW0,A
:
FF00D5 MOVN
A,#0
:
FF00D6 MOV
@RW0,A
Hexadecimal Branch
destination address
of branch instruction
[INT]
Interrupt
Branching by hardware
interrupt
frame no.
Displays the frame number in decimal form.
address
Displays the branch addresses.
mnemonic
Displays disassembly of the instructions that are executed between branch addresses.
Note:
For branch addresses (b-addr), an instruction between the branch addresses is extracted to get the
frames to complement each other by disassembly. When they are complemented, the frame number
field is blank.
312
CHAPTER 2 DEPENDENCE FUNCTIONS
2.6.8.4
Trace Data Display Example (Source)
This section describes trace data that is displayed in the source line mode.
■ Source Display
This mode displays only source lines. Figure 2.6-8 shows a source display example.
Figure 2.6-8 Example of the Trace Data Display (Source)
>SHOW TRACE/SOURCE -10..-5
frame no.
source
:
sample.c$61
-00007 :
sample.c$62
:
sample.c$66
-00006 :
sample.c$67
}
:
sample.c$53
while
:
sample.c$54
:
sample.c$55
:
sample.c$56
:
sample.c$57
if (p->val >= tblp[j - 1]->val)
break;
tblp [i - 1] = p;
(max > 1) {
p = tblp [max - 1];
tblp [max - 1] = tblp[0];
max--;
i = 1;
frame no.
Displays frame numbers as decimal number.
source
Displays the source line to be executed.
313
CHAPTER 2 DEPENDENCE FUNCTIONS
2.6.8.5
Saving Trace Data
This section explains how to save trace data.
■ Saving Trace Data
Trace data can be saved in a specified file.
The following two methods are available to save trace data: using GUI (window or dialog) and using only the
command. The same result is obtained from both methods.
● Using GUI for Saving Trace Data
1. Display the trace window.
- Select [View] - [Trace] menu.
2. Specify the name of the file in which to save trace data.
- Right-click on the trace window, and select [Save] from the shortcut menu. The [Save as] dialog
appears.
Specify the file name and where to save trace data. For details, refer to Section "4.4.8 Trace" in
"SOFTUNE Workbench Operation Manual".
● Using Command for Saving Trace Data
1. Save trace data.
- Execute the SHOW TRACE/FILE command.
For details, refer to Section "4.33 SHOW TRACE (type 3)" in "SOFTUNE Workbench Command
Reference Manual".
When additionally saving trace data in an existing file, execute the SHOW TRACE/FILE/APPEND
command.
314
CHAPTER 2 DEPENDENCE FUNCTIONS
2.6.8.6
Searching for Trace Data
This section explains how to search for trace data.
■ Searching for Trace Data
The specified address or frame number in trace data can be displayed.
The following two methods are available to search for trace data: using GUI (window or dialog) and using
only the command. The same result is obtained from both methods.
● Using GUI for Searching for Trace Data
1. Display the trace window.
- Select [View] - [Trace] menu.
2. Specify the address or frame number to search for trace data.
- Right-click on the trace window, and select [Find] from the shortcut menu. The trace data search dialog
appears.
Specify the address or frame number to be displayed. For details, refer to Section "4.4.8 Trace" in
"SOFTUNE Workbench Operation Manual".
● Using Command for Searching for Trace Data
1. Search for trace data.
- Execute the SEARCH TRACE command.
For details, refer to Section "4.37 SEARCH TRACE" in "SOFTUNE Workbench Command Reference
Manual".
Note:
Trace data can search only branching source address.
315
CHAPTER 2 DEPENDENCE FUNCTIONS
2.6.9
How to Display the Output Message from User Program to
the Debugger
This section explains the semihosting feature.
■ What is Semihosting Feature
The semihosting feature is a function to display a message output by the user program on the debugger
window.
As shown in Figure 2.6-9, when receiving an output request to the message buffer register (MBR), the
debugger displays the output content on the window by receiving the content.
In this case, data from the user program to the debugger is output via DEBUG I/F from MBR according to
the arrow in Figure 2.6-9.
For details of on-chip debugger (OCD) and MBR, refer to the hardware manual.
Figure 2.6-9 Data Flow in Semihosting Feature
User Target
SOFTUNE
Workbench
User Programme
Terminal
Window
OCD
MBR
USB
MB2100-01
DEBUG I/F
■ What is Terminal Window
Terminal window is the window displaying data when receiving an output request from user program to
MBR. Refer to section "3.22 Terminal Window" of "SOFTUNE Workbench Operation Manual" for details of
terminal window.
The data output to the terminal window is interpreted and output as ASCII characters. However, the
supported control characters are'\n', '\r' and '\t'. The other control characters and the characters after 0x80 are
output as '.'.
The terminal window will appear when the data to be displayed is acquired.
316
CHAPTER 2 DEPENDENCE FUNCTIONS
■ Using Method of Semihosting Feature
Use the following procedure to display the content of the output request to MBR on the terminal window.
1. Control MBR in the user program.
As shown in Figure 2.6-9, it is necessary to control MBR in the user program.
Sample project including the control method of MBR is attached in SOFTUNE Workbench V30L36 or
later. Control MBR based on this. For details, refer to "APPENDIX I Sample Project for Semihosting
Feature" in "SOFTUNE Workben ch Operation Manual".
2. Display the content of the output request to MBR on the terminal window.
The terminal window opens automatically when receiving the output request from MBR.
For details, refer to "3.22 Terminal Window" of "SOFTUNE Workbench Operation Manual".
317
CHAPTER 2 DEPENDENCE FUNCTIONS
2.6.10
Checking Debugger Information
This section explains how to check information about the emulator debugger (MB210001).
■ Debugger Information
This emulator debugger enables you to check the following information at startup.
• SOFTUNE Workbench file information
• Hardware information
If any errors have been discovered during SOFTUNE Workbench operations, check this information and
contact our sales department or support department.
■ How to Check
Use one of the following methods to check debugger information.
• Command
- SHOW SYSTEM
Refer to Section "1.19 SHOW SYSTEM" in "SOFTUNE Workbench Command Reference Manual".
• Dialog
- Version information dialog
Select [Help] - [Version Information] menu.
For details, refer to Section "4.9.3 Version Information" in "SOFTUNE Workbench Operation
Manual".
■ Displayed Contents
The version information dialog shows the contents shown below.
F2MC-16 Family SOFTUNE Workbench VxxLxx
ALL RIGHTS RESERVED,
COPYRIGHT(C) FUJITSU SEMICONDUCTOR LIMITED 1997
LICENCED MATERIAL PROGRAM PROPERTY OF FUJITSU SEMICONDUCTOR LIMITED
=======================================================
Cpu information file path: CPU information file path
Cpu information file version: CPU information file version
=======================================================
Add in DLLs
------------------------------------------------------SiCmn
Product name: SOFTUNE Workbench
File Path: SiC907.dll path
Version: SiC907.dll version
- - - - - - - - - - - - - - - - - - - - - - - - - - - SiiEd
File Path: SiiEd3.ocx path
Version: SiiEd3.ocx version
------------------------------------------------------SiM907
Product name: SOFTUNE Workbench
File Path: SiM907.dll path
Version: SiM907.dll version
- - - - - - - - - - - - - - - - - - - - - - - - - - - Language Tools
- F2MC-16 Family SOFTUNE C Compiler version
File Path: fcc907s.exe path
- F2MC-16 Family SOFTUNE Assembler version
File Path: fasm907s.exe path
- F2MC-16 Family SOFTUNE Linker version
File Path: flnk907s.exe path
- F2MC-16 Family SOFTUNE Librarian version
File Path: flib907s.exe path
- SOFTUNE FJ-OMF to S-FORMAT Converter version
File Path: f2ms.exe path
318
CHAPTER 2 DEPENDENCE FUNCTIONS
- SOFTUNE FJ-OMF to INTEL-HEX Converter version
File Path: f2is.exe path
- SOFTUNE FJ-OMF to INTEL-EXT-HEX Converter version
File Path: f2es.exe path
- SOFTUNE FJ-OMF to HEX Converter version
File Path: f2hs.exe path
------------------------------------------------------SiOsM
Product name: Softune Workbench
File Path: SiOsM907.dll path
Version: SiOsM907.dll version
------------------------------------------------------F2MC-16 Family Debugger DLL
Product name: SOFTUNE Workbench
File Path: SiD907.dll path
Version: SiD907.dll version
- - - - - - - - - - - - - - - - - - - - - - - - - - - Debugger type
: Current debugger type
MCU type
: Currently selected target MCU
VCpu dll name
: Path and name of the currently used VCpu dll
VCpu dll version
: Version of the currently used virtual debugger DLL
SiDRVo dll version
: Version of the currently used MB2100-01 driver DLL
DSU type
: Currently used DSU type
Adapter version
: Adapter version
FPGA version
: FPGA version
Maker ID
: ID that indicates the device manufacturer
CPU family ID
: ID that indicates the CPU family installed in the device
DSU type ID
: ID that indicates the OCD-DSU installation type.
DSU version ID
: ID that indicates version information of the DSU installed in the device
Device ID
: ID that indicates device information
Device version ID
: ID that indicates device version
OSC clock
: Oscillator frequency
PLL clock
: Reference clock frequency for high-speed communication
Clock mode
: Clock mode [Main/ Sub/ PLL]
Communication mode
: Communication mode
Communication device : Device type
REALOS version
: REALOS version
------------------------------------------------------SiIODef
Product name: Softune Workbench
File Path: SiIODef.dll path
Version: SiIODef.dll version
=======================================================
Current path: Path of the currently used project
Language: Currently used language
Help file path: Help file path
============================================================================
319
CHAPTER 2 DEPENDENCE FUNCTIONS
2.7
Monitor Debugger
This section describes the functions of the monitor debugger.
■ Monitor Debugger
The monitor debugger performs debugging by putting the target monitor program for debugging into the
target system and by communicating with the host.
Before using this debugger, the target monitor program must be ported to the target hardware.
320
CHAPTER 2 DEPENDENCE FUNCTIONS
2.7.1
Resources Used by Monitor Program
The monitor program of the monitor debugger uses the I/O resources listed below. The
target hardware must have these resources available for the monitor program.
■ Required Resources
The following resources are required to build the monitor program into the target hardware.
Table 2.7-1 Resources Used by Monitor Debugger
1
UART
Necessary
For communication with host computer
4800/9600/19200/38400 bps
2
Monitor ROM
Necessary
Need about 10 KB (For details, refer to link map.)
3
Work RAM
Necessary
Need about 2 KB (For details, refer to link map.)
4
External-interrupt switch
Option
Uses for forced abortion of program. When the
switch is not built-in, the program can stop at the
breakpoint only.
5
Timer
Option
Uses for SET TIMER/SHOW TIMER . Needs 32 bits
in 1 s units.
321
CHAPTER 2 DEPENDENCE FUNCTIONS
2.7.2
Break
In the monitor debugger, two types of break functions can be used. When the program
execution is aborted by each break function, the address and the break factor to do the
break are displayed.
■ Break Functions
In this monitor debugger, the following two types of break functions are supported.
• Software break
• Forced break
322
CHAPTER 2 DEPENDENCE FUNCTIONS
2.7.2.1
Software Break
It is a function to bury the instruction for the break under the memory, and to do the
break by the instruction execution. The break is done before an instruction the specified
address is executed.
■ Software Break
It is a function to bury the instruction for the break under the memory, and to do the break by the instruction
execution. The break is done before an instruction the specified address is executed.
The number that can be set is 16 points.
When a break occurs due to a software break, the following message is displayed on the status bar:
Break at Address by breakpoint
■ Setting Method
The software break is controlled by the following method.
• Command
- SET BREAK/SOFT
Refer to "3.1 SET BREAK (type 1)" in "SOFTUNE Workbench Command Reference Manual".
• Dialog
- Breakpoint Set Dialog [Code] tab
Refer to "4.6.4 Breakpoint" in "SOFTUNE Workbench Operation Manual".
• Window
- Source window/Disassembly window
Note:
There are a couple of points to note when using software breaks.
• Software breaks cannot be set in an area that cannot be written, such as ROM. If attempted, a
verify error occurs at starting the program (when continuous execution, step execution, etc.,
started).
• Always set a software break at the instruction starting address. If a software break is set in the
middle of an instruction, it may cause a program null-function.
323
CHAPTER 2 DEPENDENCE FUNCTIONS
2.7.2.2
Forced Break
It is a function to abort the execution of the program compulsorily.
■ Forced Break
It is a function to abort the execution of the program compulsorily.
When a break occurs due to a forced break, the following message is displayed on the Status Bar.
Break at Address by command abort request
324
INDEX
INDEX
The index follows on the next page.
This is listed in alphabetic order.
325
INDEX
Index
Symbols
A
/CYCLE
Displaying All Machine Cycles
(Specify /CYCLE.) .............................. 116
/INSTRUCTION
Display in Instruction Execution Order (Specify /
INSTRUCTION.)........ 115, 178, 226, 263
/RAWDATA
Display without Analyzing Trace Data (Specify /
RAWDATA.) ..................................... 262
/SOURCE
Display in Source Line Units (Specify /SOURCE.)
.................................. 118, 181, 229, 264
About Log File
About Log File ................................................ 198
Access
Access Attributes for Memory Areas
........................................... 71, 144, 209
Access to Flash Memory................................... 289
Guarded Access Break ......... 48, 84, 158, 218, 246
Memory Area Access Attributes.......................... 37
Active Project
Active Project...................................................... 2
Active Project Configuration................................. 4
Analyzing
Analyzing Include Dependencies........................... 9
Attributes
Access Attributes for Memory Areas ... 71, 144, 209
Memory Area Access Attributes.......................... 37
Numerics
0 Bank
When referring to RAM area of the 0 bank ......... 192
B
Boot ROM
Boot ROM File Automatic Execution .......... 35, 236
Break
Break by Sequencer ........................................... 99
Break Functions
............. 43, 79, 152, 214, 242, 292, 322
Code Break ............................... 80, 153, 215, 243
Code Break (Software) ..................................... 295
Data Break ................................ 82, 155, 217, 245
External Trigger Break ............................. 161, 250
Flow of Code Break ........................................... 44
Flow of Data Break ............................................ 46
Forced Break ............... 49, 87, 162, 220, 251, 324
Guarded Access Break ......... 48, 84, 158, 218, 246
Monitoring Data Break ..................................... 156
Notes on Code Break............................ 44, 80, 215
Notes on Data Break ........................................ 153
Performance-Buffer-Full Break ........... 86, 160, 249
Sequential Break........................................ 83, 157
Software Break ................................................ 323
Specify Performance-Buffer-Full Break
................................................. 123, 185
Specifying Performance-Buffer-Full Break ........ 267
Trace-Buffer-Full Break ....... 47, 85, 159, 219, 248
Build
Build Function..................................................... 6
Customize Build Function .................................... 7
326
INDEX
C
D
C Language
Notes on C Language Symbols............................ 30
Specifying C Language Variables ........................ 29
Check
RAM Check Window ....................................... 196
Clearing
Clearing Performance Measurement Data
.......................................... 124, 186, 267
Code
Code Break ............................... 80, 153, 215, 243
Flow of Code Break ........................................... 44
Notes on Code Break............................ 44, 80, 215
Code Break
Code Break ..................................................... 293
Code Break (Software) ..................................... 295
Command
Commands Available during Execution of User
Program ....................... 76, 150, 213, 240
Commands for External Probe Data ................... 134
Event-related Commands in Multi Trace Mode
............................................................ 93
Event-related Commands in Normal Mode ........... 91
Event-related Commands in Performance Mode
............................................................ 95
Notes on GO Command
............................ 74, 148, 211, 239, 287
Notes on STEP Command
.................................... 75, 212, 239, 287
Commands Available
Commands Available during Execution of User
Program ............................................. 282
Configuration
Active Project Configuration................................. 4
Project Configuration ........................................... 3
Control
Control by Sequencer ......................... 96, 163, 252
Controlling Watchdog Timer
.................................... 75, 149, 212, 239
Coverage
Coverage Measurement Function......... 57, 126, 188
Coverage Measurement Operation ....... 57, 126, 188
Coverage Measurement Procedures
............................................ 57, 126, 188
Displaying Coverage Measurement Result
............................................ 58, 127, 189
Measuring Coverage .......................... 58, 127, 189
Setting Range for Coverage Measurement
............................................ 58, 127, 189
Creating
Creating and Viewing Memory Map
............................................ 71, 145, 210
Customize
Customize Build Function..................................... 7
Data
Clearing Performance Measurement Data
..........................................124, 186, 267
Commands for External Probe Data....................134
Data Not Traced ...............................105, 167, 221
Display without Analyzing Trace Data (Specify /
RAWDATA.)......................................262
Displaying and Setting External Probe Data
..........................................................134
Displaying Performance Measurement Data
..........................................124, 186, 267
Displaying Trace Data Storage Status
..................................113, 176, 224, 260
Reading Trace Data On-the-fly ..................182, 230
Reading Trace Data On-the-fly in Single Trace
..........................................................119
Reading Trace Data On-the-fly in the Multi Trace
..........................................................120
Saving Trace Data ..............56, 121, 183, 231, 265
Setting Data Monitoring Trace Trigger ...............169
Specifying Displaying Trace Data Start
..................................114, 177, 225, 261
Trace Data ...............................105, 167, 221, 256
Data Break
Data Break .........................82, 155, 217, 245, 296
Flow of Data Break.............................................46
Monitoring Data Break......................................156
Notes on Data Break .........................................153
Data Watch Break
Data Watch Break.............................................298
Debug
Setting Debug Area.............................67, 141, 206
Setting of Debug Function .................................146
Debug Functions
Debug Functions ..............................................280
Debugger
Debugger Information .................61, 135, 200, 318
Emulator Debugger...............................22, 63, 233
Monitor Debugger ......................................22, 320
Operating Condition of High-speed Simulator
Debugger ..............................................32
Simulator Debugger ......................................22, 32
Type of Debugger...............................................22
When the debugger has aborted..........................277
Debugging
Ending debugging.............................................277
Starting Debugging ...........................................273
Verification Items When Starting Debugging ......273
Debugging Mode
Debugging Mode ......................................140, 205
Delay
Trace Delay .....................................................172
Disassembly
Disassembly.......................................................25
327
INDEX
Display
Display in Instruction Execution Order (Specify /
INSTRUCTION.)........ 115, 178, 226, 263
Display in Source Line Units (Specify /SOURCE.)
.................................. 118, 181, 229, 264
Display without Analyzing Trace Data (Specify /
RAWDATA.) ..................................... 262
Displaying All Machine Cycles ................. 179, 227
Displaying All Machine Cycles (Specify /CYCLE.)
.......................................................... 116
Displaying and Setting External Probe Data
.......................................................... 134
Displaying Coverage Measurement Result
............................................ 58, 127, 189
Displaying Measured Time ............... 125, 187, 268
Displaying Performance Measurement Data
.......................................... 124, 186, 267
Displaying Trace Data Storage Status
.................................. 113, 176, 224, 260
E
Editor
External Editor................................................... 14
Standard Editor .................................................. 13
Emulator
Emulator ................................................. 137, 202
Emulator Debugger .............................. 22, 63, 233
Emulator Debugger
Features of Emulator Debugger (MB2100-01)
.......................................................... 272
Error
Error Information ............................................. 304
Error Jump Function........................................... 11
Event Mode
Event Mode ..................................................... 147
Event Modes...................................................... 89
Setting Event Mode .................................. 123, 185
Event-related Commands
Event-related Commands in Multi Trace Mode
............................................................ 93
Event-related Commands in Normal Mode ........... 91
Event-related Commands in Performance Mode
............................................................ 95
Example
Example of Optional Settings .............................. 15
Examples of Macro Expansion ............................ 19
Executing
Executing Program ........................... 124, 186, 267
Trace Control during Executing User Program
.......................................................... 169
Execution
Boot ROM File Automatic Execution........... 35, 236
Display in Instruction Execution Order (Specify /
INSTRUCTION.)........ 115, 178, 226, 263
Notes on STEP Execution ................................. 149
328
Execution of User Program
Commands Available during Execution of User
Program ............................................. 282
External Editor
External Editor .................................................. 14
External Probe
External Probe Sampling Timing....................... 133
External Tools
External Tools ................................................... 16
External Trigger Break
External Trigger Break ............................. 161, 250
F
File
About Log File ................................................ 198
Boot ROM File Automatic Execution .......... 35, 236
Flash Memory
Access to Flash Memory................................... 289
Examples of flash memory synchronization
......................................................... 290
Methods of flash memory synchronization ......... 289
What is flash memory synchronization? ............. 289
Flow
Flow of Code Break ........................................... 44
Flow of Data Break ............................................ 46
Sample Flow of Time Measurement by Sequencer
......................................................... 103
Forced Break
Forced Break ....... 49, 87, 162, 220, 251, 297, 324
Format
Display Format of Trace Data ............................. 54
Project Format ..................................................... 3
Frame
Frame Number................................................... 52
Frame Number
Frame Number................................. 167, 221, 256
Frame Number and Step Number in Single Trace
......................................................... 107
Multi Trace Frame Number............................... 110
Function
Break Functions........... 43, 79, 152, 214, 242, 322
Build Function..................................................... 6
Coverage Measurement Function ........ 57, 126, 188
Customize Build Function .................................... 7
Error Jump Function .......................................... 11
Function of Setting Tool Options......................... 10
Function of Single Trace................................... 106
Functions for Memory Operations ....................... 23
Make Function..................................................... 6
Multi Trace Function........................................ 110
Performance Measurement Function
......................................... 122, 184, 266
Project Management Function ............................... 3
Setting of Debug Function ................................ 146
INDEX
STUB Function.................................................. 42
Workspace Management Function ......................... 2
G
GO
Notes on GO Command
............................ 74, 148, 211, 239, 287
Guarded Access Break
Guarded Access Break.......... 48, 84, 158, 218, 246
H
High-speed Communication
Standard Clock Frequency for High-speed
Communication .................................. 279
How to enter
How to enter.................................................... 276
How to Generate
How to Generate .............................................. 297
I
I/O Port
I/O Port Simulation (Input Port) .......................... 38
I/O Port Simulation (Output Port) ........................ 38
Instruction
Display in Instruction Execution Order (Specify /
INSTRUCTION.) ....... 115, 178, 226, 263
Instruction Display........................................... 312
Instruction Simulation ........................................ 36
Interrupt
Interrupt Simulation ........................................... 39
L
Line Assembly
Line Assembly................................................... 25
Line Number
Line Number Information ................................... 27
List
Macro List..................................................... 7, 17
Specifications List............................................ 197
Low-Power Consumption Mode
Low-Power Consumption Mode Simulation
............................................................ 41
M
Machine Cycles
Displaying All Machine Cycles ......................... 179
Macro
Examples of Macro Expansion ............................ 19
Macro List..................................................... 7, 17
Macros.............................................................. 17
Make Function
Make Function..................................................... 6
MB2100-01
Features of Emulator Debugger (MB2100-01)
..........................................................272
MCU
MCU Operation Speed ........................................66
Setting MCU Operation Mode
....................................65, 140, 205, 237
Measured Items
Measured Items ................................................303
Measurement
Clearing Performance Measurement Data
..........................................124, 186, 267
Coverage Measurement Function .........57, 126, 188
Coverage Measurement Operation........57, 126, 188
Coverage Measurement Procedures
............................................57, 126, 188
Displaying Coverage Measurement Result
............................................58, 127, 189
Displaying Performance Measurement Data
..........................................124, 186, 267
Ending the Measurement ...................................307
Performance Measurement Function
..........................................122, 184, 266
Sample Flow of Time Measurement by Sequencer
..........................................................103
Setting Minimum Measurement Unit for Timer
..........................................123, 185, 267
Setting Range for Coverage Measurement
............................................58, 127, 189
Setting Timer Minimum Measurement Unit ..........73
Time Measurement by Sequencer.......................102
Measurement Items
Measurement Items...........................................304
Measurement Results
Clearing Measurement Results
....................51, 131, 193, 232, 269, 304
Displaying Measurement Results
....................50, 131, 193, 232, 269, 304
Measurement Unit
Measurement Unit ............................................303
Measuring
Measuring Coverage ...........................58, 127, 189
Measuring Item
Measurement Items.............50, 131, 193, 232, 269
Memory
Access Attributes for Memory Areas
............................................71, 144, 209
Creating and Viewing Memory Map
............................................71, 145, 210
Functions for Memory Operations ........................23
Memory Area Access Attributes ..........................37
Memory Area Types ...........................68, 142, 207
Memory Simulation ............................................37
Read/Write Memory while On-the-fly ..................77
Simulation Memory Space...................................37
329
INDEX
Method
Setting Method................................ 42, 44, 46, 47,
80, 82, 83, 85, 86, 153, 155, 156, 157,
159, 160, 161, 215, 217, 219, 243, 245,
246, 248, 249, 250, 323
Setting Methods of Multi Trace ......................... 174
Minimum Measurement Unit
Setting the Minimum Measurement Unit ............ 131
Mode
Debugging Mode...................................... 140, 205
Event Mode ..................................................... 147
Event Modes...................................................... 89
Event-related Commands in Multi Trace Mode
............................................................ 93
Event-related Commands in Normal Mode ........... 91
Event-related Commands in Performance Mode
............................................................ 95
Low-Power Consumption Mode Simulation.......... 41
Native Mode ............................................ 140, 205
Operation in Multi Trace Mode ........................... 92
Operation in Normal Mode.................................. 90
Operation in Performance Mode .......................... 94
RAM Checker Mode ........................................ 146
Setting Event Mode .................................. 123, 185
Setting MCU Operation Mode
.................................... 65, 140, 205, 237
Trace Enhancement Mode................................. 146
Monitor
Monitor Debugger ...................................... 22, 320
Monitoring Data Break ..................................... 156
Monitoring Program Automatic Loading
.................................................. 204, 235
Monitoring
Monitoring ...................................................... 284
Moving
Moving Scope.................................................... 28
Multi Trace
Event-related Commands in Multi Trace Mode
............................................................ 93
Multi Trace...................................................... 171
Multi Trace Frame Number ....................... 110, 171
Multi Trace Function ........................................ 110
Operation in Multi Trace Mode ........................... 92
Setting Methods of Multi Trace ......................... 174
Setting Multi Trace........................................... 112
N
Native Mode
Native Mode ............................................ 140, 205
Normal Mode
Event-related Commands in Normal Mode ........... 91
Operation in Normal Mode.................................. 90
Notes
Notes on C Language Symbols ............................ 30
330
Notes on Code Break............................ 44, 80, 215
Notes on Data Break ........................................ 153
Notes on GO Command...... 74, 148, 211, 239, 287
Notes on STEP Command
................................... 75, 212, 239, 287
Notes on STEP Execution................................. 149
Number
Frame Number................................. 167, 221, 256
Frame Number and Step Number in Single Trace
......................................................... 107
Line Number Information ................................... 27
Multi Trace Frame Number....................... 110, 171
Setting Number................................................ 156
O
On-the-fly
Read/Write Memory while On-the-fly.................. 77
Reading Trace Data On-the-fly.................. 182, 230
Reading Trace Data On-the-fly in Single Trace
......................................................... 119
Reading Trace Data On-the-fly in the Multi Trace
......................................................... 120
Operating
Operating Condition of High-speed Simulator
Debugger ............................................. 32
Operating Environment ...................................... 21
Operating of Sequencer .................................... 254
Setting Operating Environment
............................. 34, 64, 138, 203, 234
Operating Environment
Setting Operating Environment ......................... 278
Operating Environments
Operating Environments of the Target ............... 274
Operation
Coverage Measurement Operation
........................................... 57, 126, 188
Functions for Memory Operations ....................... 23
MCU Operation Speed ....................................... 66
Operation frequency......................................... 238
Operation in Multi Trace Mode ........................... 92
Operation in Normal Mode ................................. 90
Operation in Performance Mode.......................... 94
Register Operations............................................ 24
Setting MCU Operation Mode
................................... 65, 140, 205, 237
Operation Requirements
Operation Requirements ................................... 295
Options
Function of Setting Tool Options......................... 10
Setting Options ........................................ 7, 14, 16
Tool Options ..................................................... 10
Output Port
I/O Port Simulation (Output Port) ........................ 38
INDEX
P
Performance
Clearing Performance Measurement Data
.......................................... 124, 186, 267
Displaying Performance Measurement Data
.......................................... 124, 186, 267
Event-related Commands in Performance Mode
............................................................ 95
Measurement Result......................................... 305
Measuring Procedure........................................ 306
Operation in Performance Mode .......................... 94
Performance Function ...................................... 305
Performance Measurement Function
.......................................... 122, 184, 266
Remeasuring.................................................... 305
Performance-Buffer-Full
Performance-Buffer-Full Break ........... 86, 160, 249
Specify Performance-Buffer-Full Break
.................................................. 123, 185
Specifying Performance-Buffer-Full Break......... 267
Port
I/O Port Simulation (Input Port) .......................... 38
I/O Port Simulation (Output Port) ........................ 38
Power-on
Power-on Debugging................................ 195, 271
Power-on Debug
Power-on Debug .............................................. 285
Precautions
Precautions........................................................ 14
Probe
Commands for External Probe Data ................... 134
Displaying and Setting External Probe Data
.......................................................... 134
External Probe Sampling Timing ....................... 133
Sampling by External Probe .............................. 133
Procedure
Coverage Measurement Procedures ..................... 57
Specifying Symbol and Search Procedure............. 28
Program
Control during program execution ..................... 281
Executing a program ........................................ 281
Executing Program........................... 124, 186, 267
Monitoring Program Automatic Loading
.................................................. 204, 235
Program stopping conditions ............................. 297
Setting Monitoring Program Automatic Loading
.......................................................... 139
Trace Control during Executing User Program
.......................................................... 169
Project
Active Project...................................................... 2
Active Project Configuration................................. 4
Project ................................................................ 2
Project Configuration ............................................3
Project Dependence ..............................................5
Project Format......................................................3
Project Management Function................................3
Restrictions on Storage of Two or More Projects
..............................................................2
R
RAM Area
When referring to RAM area of the 0 bank..........192
RAM Check
RAM Check Window........................................196
RAM Checker
RAM Checker Mode.........................................146
RAM Checker Viewer.......................................199
To Use the RAM Checker .................................197
Range
Setting Range for Coverage Measurement
............................................58, 127, 189
Simulation Range ...............................................33
RAW Data
RAW Data Display ...........................................311
Read/Write
Read/Write Memory while On-the-fly ..................77
Reading
Reading Trace Data On-the-fly ..................182, 230
Reading Trace Data On-the-fly in Single Trace
..........................................................119
Reading Trace Data On-the-fly in the Multi Trace
..........................................................120
Real-time Monitoring
Real-time Monitoring........................................192
Reference
Reference Section ...........12, 13, 15, 16, 21, 24, 25
Register
Register Operations ............................................24
Required Resources
Required Resources ..........................................321
Reset
Reset Simulation ................................................40
Restrictions
Restrictions on Storage of Two or More Projects
..............................................................2
Result
Displaying Coverage Measurement Result
............................................58, 127, 189
ROM
Boot ROM File Automatic Execution ...........35, 236
Internal ROM Area Setting ..................72, 145, 210
ROM Area
Internal ROM Area Setting ................................210
331
INDEX
S
Sample
Sample Flow of Time Measurement by Sequencer
.......................................................... 103
Sampling
Sampling by External Probe .............................. 133
Saving
Saving Trace Data .............. 56, 121, 183, 231, 265
Scope
Scope ................................................................ 28
Search
Specifying Symbol and Search Procedure ............. 28
Section
Reference Section........... 12, 13, 15, 16, 21, 24, 25
Security
Security........................................................... 276
Semihosting
What is Semihosting Feature ............................. 316
Sequencer
Break by Sequencer............................................ 99
Control by Sequencer ................. 96, 163, 252, 300
Operating of Sequencer..................................... 254
Operation of Sequencer..................................... 300
Sample Flow of Time Measurement by Sequencer
.......................................................... 103
Setting Sequencer............................... 97, 165, 166
Specifications of Sequencer............................... 301
Time Measurement by Sequencer ...................... 102
Trace Sampling Control by Sequencer................ 100
Sequential Break
Sequential Break ................................ 83, 157, 247
Setting
Displaying and Setting External Probe Data........ 134
Example of Optional Settings .............................. 15
Function of Setting Tool Options ......................... 10
Internal ROM Area Setting.................. 72, 145, 210
Setting Data Monitoring Trace Trigger ............... 169
Setting Debug Area ............................ 67, 141, 206
Setting Event Mode .................................. 123, 185
Setting Events ............ 88, 124, 164, 185, 252, 267
Setting MCU Operation Mode
.................................... 65, 140, 205, 237
Setting Method................................ 42, 44, 46, 47,
80, 82, 83, 85, 86, 153, 155, 156, 157,
159, 160, 161, 215, 217, 219, 243, 245,
246, 248, 249, 250, 323
Setting Methods of Multi Trace ......................... 174
Setting Minimum Measurement Unit for Timer
.......................................... 123, 185, 267
Setting Monitoring Program Automatic Loading
.......................................................... 139
Setting Multi Trace........................................... 112
Setting Number ................................................ 156
Setting of Debug Function................................. 146
332
Setting Operating Environment
............................. 34, 64, 138, 203, 234
Setting Options ........................................ 7, 14, 16
Setting Range for Coverage Measurement
........................................... 58, 127, 189
Setting Sequencer .............................. 97, 165, 166
Setting Single Trace ......................................... 108
Setting Symbol Information ................................ 26
Setting Timer Minimum Measurement Unit ......... 73
Setting Trace ................................... 170, 223, 258
Setup
Trace Trigger Setup ................................. 168, 257
Simulation
I/O Port Simulation (Input Port) .......................... 38
I/O Port Simulation (Output Port) ........................ 38
Instruction Simulation ........................................ 36
Interrupt Simulation ........................................... 39
Low-Power Consumption Mode Simulation ......... 41
Memory Simulation ........................................... 37
Reset Simulation................................................ 40
Simulation Memory Space .................................. 37
Simulation Range............................................... 33
Simulator
Operating Condition of High-speed Simulator
Debugger ............................................. 32
Simulator Debugger ..................................... 22, 32
Software
Code Break (Software) ..................................... 295
Software Break ................................................ 323
Source
Display in Source Line Units (Specify /SOURCE.)
................................. 118, 181, 229, 264
Source Display ................................................ 313
Specifications
Specifications List............................................ 197
Specify
Specify Performance-Buffer-Full Break
................................................. 123, 185
Specifying
Specifying C Language Variables........................ 29
Specifying Displaying Trace Data Start
................................. 114, 177, 225, 261
Specifying Performance-Buffer-Full Break ........ 267
Specifying Symbol and Search Procedure ............ 28
Standard Clock Frequency
Standard Clock Frequency for High-speed
Communication .................................. 279
Standard Editor
Standard Editor.................................................. 13
Status
Displaying Trace Data Storage Status
................................. 113, 176, 224, 260
STEP
Notes on STEP Command
................................... 75, 212, 239, 287
INDEX
Notes on STEP Execution................................. 149
Step
Frame Number and Step Number in Single Trace
.......................................................... 107
STUB
STUB Function.................................................. 42
Subproject
Subproject ........................................................... 2
Switching methods
Switching methods........................................... 280
Symbol
Notes on C Language Symbols............................ 30
Setting Symbol Information ................................ 26
Specifying Symbol and Search Procedure............. 28
Types of Symbols .............................................. 26
Syntax
Syntax............................................................... 11
T
Target
Operating Environments of the Target................ 274
Terminal Window
What is Terminal Window ................................ 316
Time Measurement by Sequencer
Time Measurement by Sequencer ...................... 102
Timer
Controlling Watchdog Timer
.................................... 75, 149, 212, 239
Setting Minimum Measurement Unit for Timer
.......................................... 123, 185, 267
Setting Timer Minimum Measurement Unit.......... 73
Timing
External Probe Sampling Timing ....................... 133
To Use the RAM Checker
To Use the RAM Checker................................. 197
Tool
External Tools ................................................... 16
Function of Setting Tool Options......................... 10
Tool Options ..................................................... 10
Trace
Clearing Trace Data ........................................... 54
Display Format of Trace Data ............................. 54
Display without Analyzing Trace Data (Specify /
RAWDATA.) ..................................... 262
Displaying Trace Data ........................................ 54
Displaying Trace Data Storage Status
.................................. 113, 176, 224, 260
Frame Number and Step Number in Single Trace
.......................................................... 107
Function of Single Trace................................... 106
Multi Trace ..................................................... 171
Multi Trace Frame Number....................... 110, 171
Multi Trace Function........................................ 110
Reading Trace Data On-the-fly ..................182, 230
Reading Trace Data On-the-fly in Single Trace
..........................................................119
Reading Trace Data On-the-fly in the Multi Trace
..........................................................120
Saving Trace Data ..............56, 121, 183, 231, 265
Searching Trace Data ..........................................55
Setting Data Monitoring Trace Trigger ...............169
Setting Methods of Multi Trace..........................174
Setting Multi Trace ...........................................112
Setting Single Trace..........................................108
Setting Trace ..............................53, 170, 223, 258
Specifying Displaying Trace Data Start
..................................114, 177, 225, 261
Trace .................................................................52
Trace Buffer.............................105, 167, 221, 256
Trace Control during Executing User Program
..........................................................169
Trace Data .........................52, 105, 167, 221, 256
Trace Delay .....................................................172
Trace Enhancement Mode .................................146
Trace Filter ......................................168, 222, 257
Trace Functions ................................................308
Trace Sampling Control by Sequencer ................100
Trace Trigger Setup ..................................168, 257
What is Trace ...................................................308
Trace Buffer
Trace Buffer.....................................................308
Trace Data
Acquiring Trace Data........................................308
Clearing Trace Data ..........................................308
Display Formats of Trace Data...........................309
How to Display Trace Data................................309
Saving Trace Data ............................................314
Searching for Trace Data ...................................315
Trace Data Display Position ..............................309
Trace-Buffer-Full
Trace-Buffer-Full Break ........47, 85, 159, 219, 248
Trigger
External Trigger Break..............................161, 250
Setting Data Monitoring Trace Trigger ...............169
Trace Trigger Setup ..................................168, 257
Type
Memory Area Types ...........................68, 142, 207
Type of Debugger...............................................22
Types of Symbols ...............................................26
Types of Sequential Break
Types of Sequential Break .................................247
U
User Program
Commands Available during Execution of User
Program........................76, 150, 213, 240
333
INDEX
V
W
Variables
Specifying C Language Variables ........................ 29
Watchdog Timer
Controlling Watchdog Timer
................................... 75, 149, 212, 239
Workspace
Workspace .......................................................... 2
Workspace Management Function ......................... 2
334
Colophon
CM41-00313-7E
FUJITSU SEMICONDUCTOR • SOFTWARE SUPPORT MANUAL
F2MC-16 FAMILY
SOFTUNETM Workbench
USER’S MANUAL
October 2012 the 7th edition
Published
FUJITSU SEMICONDUCTOR LIMITED
Edited
Sales Promotion Dept.