1
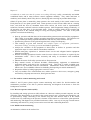
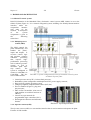
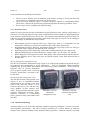
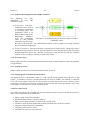
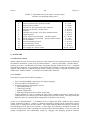
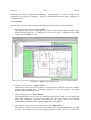
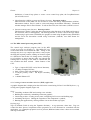
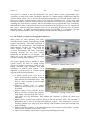
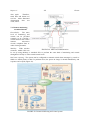
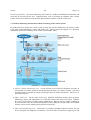
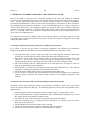
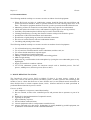
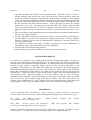
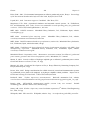
GEOTHERMAL TRAINING PROGRAMME
Orkustofnun, Grensásvegur 9,
IS-108 Reykjavík, Iceland
Reports 2008
Number 21
IMPROVED OPERATIONS AND RELIABILITY BY UPGRADING
OLKARIA I CONTROL SYSTEM AND INSTALLING REMOTE
MONITORING AND CONTROL SYSTEM FOR OLKARIA I AND II
GEOTHERMAL POWER PLANTS IN KENYA
Teresa W. Karani
Kenya Electricity Generating Company, Ltd. – KenGen
Olkaria Geothermal Project
P.O. Box 785, 20117, Naivasha
KENYA
[email protected]
ABSTRACT
Operational and maintenance aspects of geothermal power plants largely depend on
the type and architecture of control systems installed. Design concepts and
technical features are important aspects to consider in order for a geothermal power
plant to operate with minimum failures and interruptions. A control system
integrates all of the plant´s individual systems and enables them to cohesively
operate as a single system. The main objectives of carrying out a control system
upgrade and installing remote monitoring and control is to improve plant reliability
and availability, ensure safe operations of the plant, lower the costs of generation,
improve plant efficiency, reduce environmental effects and conserve energy. High
reliability is the most important feature. Considerable reduction in the life-cycle
costs of a geothermal project can be achieved through the careful development and
implementation of long-time strategies for the design and commissioning of remote
monitoring and control systems and for the upgrades of older control systems. The
advantages that can be gained by implementing such systems have lead to an
improvement in automation and emphasis on monitoring and control away from
the plant´s central control room. The Olkaria I and Olkaria II power plants in
Kenya can indeed be propelled to achieve state-of-the-art automation and the
highest level of plant control.
1. INTRODUCTION
Olkaria I and Olkaria II geothermal power plants are located in the Kenyan rift valley about 120 km
northwest of the capital, Nairobi. The plants belong to Kenya Electricity Generating Company –
KenGen, a limited liability company owned by the government of Kenya (70%) and public
shareholders (30%). KenGen supplies 80% of the electricity used in Kenya. It utilizes various sources
to generate electricity including hydro, geothermal, thermal and wind. It has a total installed capacity
of about 1000 MW, of which 115 MW is geothermal. KenGen sells the power in bulk to Kenya
Power and Lighting Company, KPLC, a limited liability company responsible for the transmission,
distribution and retail sales of electricity throughout Kenya. KenGen is now operating in a liberalized
market and is in direct competition with four Independent Power Producers who between them
produce 20% of the country’s electric power. KenGen has a workforce of 1,600 staff distributed in 20
331
Karani
332
Report 21
different sites in Kenya where its power plants are located. With its wealth of experience, established
corporate base and a clear vision, the company intends to maintain leadership in the liberalized electric
energy sub-sector in Kenya and in the East Africa region.
Olkaria I power plant has an installed capacity of 45 MW. The plant was commissioned in three
phases and has three units, each generating 15 MW of electricity. The first unit was commissioned in
June 1981, the second in November 1982 and the third in March 1985. The plant was designed for
nominal 25 years but with proper maintenance it will last much longer. Olkaria II power plant has an
installed capacity of 70 MW. The plant was commissioned in October and November 2003 and has
two units, each generating 35 MW of electricity. Currently, construction of a third unit of 35 MW
electricity is underway.
2. THE CONTROL SYSTEMS AT OLKARIA I AND II POWER PLANTS
Plant control and monitoring at Olkaria II is fully
automated and computerized (Figure 1) through
the distributed control system (DCS) provided by
Mitsubishi Heavy Industries (MHI). MHI´s plant
distributed control system is known as Digital
Intelligent Automation System (DIASYS)
Netmation. This control system provides high
reliability, economy, advanced automation and
easy maintenance. DIASYS Netmation is based
on the latest in communications and information
technology
and
provides
a
centralized
management scheme to help ensure efficient plant
operations.
Features of the DIASYS Netmation;
FIGURE 1: The control room of Olkaria II
power plant (Mwangi, 2006)
• High reliability;
• Advanced control functionality;
• Human engineering-based superior
operability;
• Easy maintenance.
Olkaria I, being an older plant, does not have
computerized controls but operates on an analog
control system (Figure 2). It uses the Proportional
Integral Derivative (PID) controllers that have the
following characteristics:
•
•
•
•
FIGURE 2: The control room of
Continuous process control;
Olkaria I power plant
Analog inputs/outputs;
Set point (SP);
Proportional (P), Integral (I), and / or Derivative (D) constants.
2.1 Plant operators
At Olkaria I power plant, the plant operators work throughout the installation as well as in the central
control room. They monitor the process by checking the meters, recorders, instruments and
Report 21
333
Karani
switchboards to make sure that all systems are working efficiently, safely, economically and within
established limits, and in many instances control equipment manually. They watch and listen to
machinery and routinely check safety devices, identifying and correcting any trouble that develops.
Olkaria II power plant is manned by plant operators who work mainly in the central control room.
Each plant has its own plant operator staff. Plant operators work in 8-hour shifts and on a rotating
basis, each shift has four (4) attendants drawn from various job levels such as superintendent,
technician, foreman, craftsman, artisan or turbine operator. Shift assignments change periodically, so
all operators can share duty on less desirable shifts. Work on rotating shifts can be stressful and
fatiguing, because of the constant change in living and sleeping patterns. The tasks of the plant
operator can include the following:
• Start up, operation and shut down of the steam turbine-generator units and auxiliary equipments.
This is done in accordance with the operating instructions and procedures. The engineers are
always called upon during unplanned shutdowns and also they assist with the start up.
• Synchronize generators to the grid and regulate load, voltage and frequency.
• Take readings in given time intervals and compile reports on equipment performance,
instrument readings, switching operations and loads on generators.
• Analyze the condition of the equipment to detect flaws or defects in operation and take
appropriate steps to correct defects or hazardous conditions.
• Perform emergency operations to maintain electric service and safeguard station equipment
(human intervention).
• Perform switching operations from the control room to allow for isolation, as required by the
maintenance teams. This is done accurately and safely in accordance with established
procedures.
• Monitor the status of all safety systems such as fire protection.
• Keep manual records of unusual incidents, malfunctioning equipment or maintenance
performed during each shift in the occurrences book. This book is readily available upon
request to any staff that needs the information. (Maintenance teams use the Management
Maintenance System (MMS) software in scheduling and reporting on routine maintenance).
• Respond to alarms by taking appropriate corrective action.
• Carry out turbine valve stem-freedom tests, turbine protective device tests, emergency pump
and auxiliary oil pump auto-start tests, diesel generator tests.
2.2 The need for remote monitoring and control
Olkaria I and II power plants require remote monitoring and control for decision-makers and
maintenance personnel to be able to perform monitoring and diagnosis from home or from the
headquarters in Nairobi.
2.2.1 Browser operator station (OPS)
By installing and setting up browser OPS software on a browser resident personal computer, one can
obtain the same functionality as provided in the central control room. Operation and monitoring can
be performed by simply connecting to the internet using the same browser OPS as in the central
control room. By connecting to the operator´s intranet via the internet or a leased line, plant operation
and monitoring, and diagnosis are possible from home or office. One way of carrying out such remote
monitoring and control is by using a secure microwave link and a dedicated phone line.
2.2.2 Mobile on-site monitoring
An alternative solution can be realized via:
Karani
i.
ii.
334
Report 21
Wireless local area network (LAN) making it possible for OPS functionality to be realized onsite using a tabletop personal computer (PC). This offers plant monitoring and control
throughout the entire power plant. Since all functions are available using just a web browser, a
business PC or similar computer can be used effectively without modification (Figure 3).
Global system for mobile communications (GSM) based solutions whereby the critical alarms
are registered and delivered in real time via e-mail to the mobile.
Lack of these functions
makes it difficult for the
maintenance personnel to
know immediately if a
problem occurs in the plant
and to take quick, proper
action. During the night,
week-end or on holidays,
plant
operators
report
emergency plant breakdown
and major anomalies in plant
status to the engineer on
standby duty, through mobile
or landline telephones. The
engineers, who live at least
15km away from the power
plants, respond to calls by
travelling to the plant. From
the central control room they
check the series of events,
trends and alarm trace that
preceded the anomaly. This
method prolongs the outage
FIGURE 3: Remote monitoring and mobile on-site monitoring
period, and makes it difficult
(MHI, 2002)
to improve system-wide
performance or decrease maintenance costs. Remote monitoring from home is necessary so that the
engineers can issue appropriate instructions to the operators from home without having to waste time
travelling to the plant.
Plant operators keep the engineers and decision makers informed of plant performance by sending
daily generation data reports using the computer. Most recipients of this data are at the head office,
about 120 km from the power plants. They depend on these reports for information on the plants´
performance. Lack of remote monitoring prevents them from collecting real time feedback
information on the operations of their equipment and implementing proactive planning and
maintenance strategies.
2.3 Future plans for rehabilitation/redevelopment of Olkaria 1 power plant
KenGen is currently undertaking an optimization study that entails a cost benefit analysis for the
rehabilitation/redevelopment of Olkaria 1 power plant. The study will determine the current condition
of the Olkaria I power generation plant, recommend the best method for utilizing the geothermal
resources available at this location, worthwhile overhauls capable of increasing operating efficiency,
and prolonging the useful life of the plant and steam gathering and reinjection systems. It will also
determine where and how best to access and utilize the available steam reserves through the
installation of a new Olkaria IV power plant and, if justified, the implementation of the improvements
of Olkaria I. In the latter case, upgrading of the control system is inevitable.
Report 21
335
Karani
3. HARDWARE ARCHITECTURE
3.1 Olkaria II control system
DIASYS Netmation is the Mitsubishi Heavy Industries' control system (MHI, 2006a) in use at the
Olkaria II plant (Figure 4). It is a network integrated system, including user friendly human-machine
interface, where the
components
interface
each other via the
network. A description
of
the
system
components is given in
the
following
subsections.
3.1.1 Multiple process
station (MPS)
The MPS controls the
plant automatically, and
handles
the
plant´s
inputs and outputs. It
executes control logic
and performs complex
arithmetic
processing
that
requires
highperformance processing
such as turbine governor
control, as well as
automatic plant start/
stop control.
The
system is configured to
connect to a ModBus via
ControlNet. The features of MPS include:
•
•
•
•
•
•
•
•
3.1.2
FIGURE 4: System configuration for Diasys Netmation control system
at Olkaria II power plant
Central processor unit (CPU), Celeron/Intel processor;
Redundant system configuration with duplicated CPU, power supply, network;
Plug-in silicon (pSOS) operating system;
Compact peripheral component interconnect (PCI) bus;
Flex I/O modules (Figure 5), plug-andplay structure;
Max. 64 flex I/O modules, (four rows of
eight modules on each front and rear of
cabinet);
Control net, open network for
programmable logic controllers (PLC);
Self-diagnostic functions and indication
features.
FIGURE 5: Input/output modules
Operator station (OPS)
The Operator station (OPS) is a user-machine interface that is used to monitor and operate the plant.
Features of OPS include:
Karani
336
Report 21
• Background screen has optional settings that can be customized such as an alarm format, a
display format, push button arrangement.
• Security level can register all operations. It can be used by different users, each with a certain
security level. All operations are stored as history in the ACS and can be displayed.
• Display information such as numerical value, symbol and list can be linked to each other as
follows:
o From alarm message to alarm logic;
o From symbol such as lamp and numerical value to logic, etc.
• By drag-and-drop action a tag number, trend signal, etc. can be registered from a numerical
value. It is therefore, not necessary to search for a tag number/name from the list and keyboard.
• Tagging is available for items independently. For example, valves whose operation is
prohibited by some users maintain the tagged status until all the users cancel the stop-tagging.
3.1.3 Engineering and maintenance station (EMS)
The Engineering and maintenance station is used to maintain the whole DCS by using DIASYSIDOL++ software. It provides the ability to perform a variety of operations, ranging from modification
and creation of control logic, design of graphic displays, trends and control loop plates, all the way up
to and including configuring an entire system. Features of the EMS include:
•
•
•
Drag & drop interface (VISIO based tool);
Windows PC based system;
Fully integrated tool for design, monitoring and tuning the control diagram.
3.1.4 Accessory station (ACS)
The ACS is a system equipped with a powerful relational database for storing and managing large
amounts of plant data. Removable media such as magneto-optical drives for data storage can be easily
connected. It also acts as a web server for interfacing with other web servers and external devices.
Functions of ACS include:
•
•
•
•
•
Storage: makes a collection of reports, event/alarm trace and middle-term/long-term data.
Trip log collection: collects and saves the processed data before and after a trip.
Maintenance log: displays the elapsed operation time and the total number of starts and stops
of specified auxiliary plant equipment.
Operator action log: records important operator actions such as control loop plate operations,
manual settings, parameter adjustments, and login to the OPS as an event.
Printer management: manages the printer used by all functions of ACS and performs backup.
3.1.5 Automatic voltage regulator (AVR)
The excitation system at Olkaria II plant is self-excitation (DC rotating generator and brushless
exciter). The Digital automatic voltage regulator (D-AVR) system is located in the excitation control
panel which is interfaced with the DCS MPS through the digital input/output cards. The D-AVR has a
dual redundant configuration [AVR (A) and AVR (B)] as in Figure 6. The Var/Power factor control
is integrated into the D-AVR system. The D-AVR system provides the following standard functions
that are essential for generator control:
• Sequential control: Normal starting and stopping of excitation system
• Automatic voltage regulator (AVR): Adjusts the generator terminal voltage constant so that it
agrees with the reference.
• Under excitation limiter (UEL): Prevents the AVR from reducing generator excitation to so
low a value that the generator would fall out of synchronism.
Report 21
337
Karani
FIGURE 6: Automatic voltage regulator (AVR)
• V/F limiter:
•
•
•
•
•
•
•
•
Prevents the generator from over-flux condition by monitoring the ratio
voltage/frequency.
Over excitation limiter (OEL): Prevents the AVR from increasing generator excitation to a
value so high and for a time so long that the generator rotor thermal capability would be
exceeded.
Over excitation protector (OEP): Protects the generator from field over current beyond OEL
limiting.
Power system stabilizer (PSS): Improves the damping of electric-mechanical resonance mode
between the generator and tie-line. It provides supplemental control signal to AVR by detecting
instantaneous deviation of generator output power (Delta P) or frequency (Delta f).
Automatic follow-up of voltage reference (AFU): Makes voltage reference of the standby
channel following that of the working channel.
Manual excitation controller (MEC): Maintains the field current constant so that it agrees with
the current reference. It is standard that the MEC is exclusively used for commissioning tests.
Reactive current compensator (RCC): Reduces the reactive current among generators
paralleled on the same bus by supplying a compensation signal corresponding to the reactive
current of each generator to the reference.
84V: The generator voltage detecting function for voltage build-up sequence.
60AVR: The voltage difference detecting function between two VTs for sensing VT circuit
failure.
Karani
338
Report 21
• Transient response recording (post mortem review): Records the transient response signals for
tests, or data before and after an accident.
3.1.6 Turbine governor
The turbine governor at the Olkaria II plant is a Digital-electro-hydraulic (DEH) type. The controls
are centralized in the DEH cubicle that is integrated to the DCS MPS through the ControlNet. The
DEH cubicle (Figure 7) contains the CPU, Ethernet interface card, ControlNet interface card, system
input/output card and analog/digital input/output modules. Examples of modules are: over speed
protection module, turbine electric over speed trip (EOST) module and turbine interlock logic module.
DEH system inputs/outputs include:
•
•
•
•
•
•
•
•
Synchronization circuit breaker “52G ON” digital input;
“Auto stop oil pressure low” input;
Turbine interlock output (main stop valves (MSV) all close, governor valves (GV) all close);
“Overspeed protection controller (OPC) solenoid value” output;
1~12000 rpm speed input;
Rectified speed pulse output;
4~20 mA analog input / 1~5 V analog output;
Generator “MW” output.
FIGURE 7: The Digital-electro-hydraulic (DEH) system at Olkaria II power plant
Report 21
339
Karani
Control functions of the DEH system include:
•
•
•
Turbine control: Remote reset or shutdown of the turbine, opening or closing the main stop
valves (MSV) by commands to the electro-hydraulic valves.
Speed control (by frequency signal): Converts a frequency signal to a corresponding turbine
speed value, compares the speed to target speed and regulates the opening of turbine valves.
Power output control: Regulates the turbine loading.
3.1.7 Protective relays
Olkaria II power plant has modern, multifunction, digital protection relays offering a high degree of
protection. The relaying and protection system is integrated into the DCS MPS via digital input/output
cards, and time synchronized from a GPS system. The generator and transformer protection relays are
housed in the generator-transformer protection panel while other types of relays are in the switchgear
room. Advantages of multifunction relays include:
i.
ii.
iii.
iv.
v.
vi.
With multiple protective functions built into a single relay, there is a considerable cost and
maintenance advantage, a reduction in installation space and wiring requirements.
Programmable protective functions, programmed alarm and trip pick-up points can easily be
configured using a laptop PC through a RS-232C serial port.
Wide range of protection, monitoring, control and recording functions in one compact unit.
Metering and displaying of measured currents, voltages, watts, vars, PF, Hertz, VA and Wh.
Better diagnostics with sequence of events, fault display, time-synchronization and fault reports.
Greater reliability due to faster relay trips and alarm response, better fault detection and no
thermal drift.
SR 745 Transformer management relay
The SR 745 Transformer management relay (Figure 8) is a high-speed, multiprocessor based relay for
the protection and management of power transformers. It has an embedded 10BaseT Ethernet
capability that provides faster data transfer, thus improving system performance. It has protection
functions such as percent differential
(87T), negative sequence time overcurrent
(51/46T), ground time overcurrent (51GT) and more.
SR 489 Generator management relay
The SR 489 Generator management relay
(Figure 9) has an embedded Ethernet
communication port located on the back
panel of the relay that allows it to be
connected directly to the Ethernet bus,
using Modbus TCP/IP protocol (GE,
2001). It has protection functions such as
generator differential protection (87G),
generator volts/hertz or overexcitation
(24G), generator stator ground fault (64G)
and more.
FIGURE 8: SR 745
transformer
management relay
FIGURE 9: SR 489
generator management
relay
3.1.8 Vibration monitoring
Vibration analysis is one of the most important condition monitoring techniques. It involves real time
data acquisition and analysis. The aim of vibration monitoring is to detect defects by analysing
changes in the vibration condition of the equipment during operation. Vibration analysis is normally
Karani
340
Report 21
applied by using transducers to measure acceleration, velocity or displacement. The choice largely
depends on the frequencies being analysed as follows (Asok et al., 2002):
• 0 up to 200 Hz (measures displacement using proximity probe)
• 2 Hz to 2 kHz (measures velocity using velocity transducer)
• 0 up to and beyond 20 kHz (measures acceleration using accelerometer)
Turbine/generator vibration monitoring
The
signals
from
turbine / generator
sensors
(probes,
accelerometers, velocity
transducers)
(Figure
10)
are
forwarded
to
the
turbine
supervisory
panel,
which
is
integrated to the DCS
MPS
via
digital
input/output
cards.
The vibration information is trended over
time and analyzed to
FIGURE 10: Vibration monitoring for the turbine-generator system
detect anomalies.
(Rockwell, 2006)
Some of the parameters monitored are:
i.
ii.
iii.
iv.
v.
vi.
Speed measures the shaft rotation in revolutions per minute. It is a critical measurement during
start-up for accurately matching the synchronous frequency before synchronizing the generator
to the power grid.
Acceleration measures how fast speed is increasing or decreasing. It is monitored during
turbine roll-up so that a steady increase in machine speed is achieved.
Eccentricity measures the amount of sag or bow in a rotor.
Differential expansion (DE) is the difference between the thermal growth of the rotor compared
to the thermal growth of the case, most critical during a turbine "cold" start-up.
Overspeed measures the machine´s acceleration beyond its maximum permissible rotational
speed.
Temperature measures how hot a bearing is operating.
Cooling tower fans vibration monitoring
Vibration monitoring is also carried out on pumps, motors, fans and compressors. For example, the
1900/55 fan monitor (Figure 11) is used to measure casing vibration velocity on the cooling tower fan
gear boxes. It uses the 190501 Velomitor transducer that is suitable for low-frequency applications.
The transducer gives a response of 1.5 to 1000 Hz ±3 dB, corresponding to fan speeds of 90 rpm or
greater. The monitor has a communication card allowing it to send real-time information to the DCS
MPS.
3.1.9 Motor control centres (MCC)
The motor starters at the Olkaria II power plant are of the conventional type, with thermal overload
relays. They are housed within the motor control centres (Figure 12). The controls for the starters are
connected to the DCS MPS through the digital input/output cards. For example, to start motor (A) the
CPU will cause a relay driver on a digital-output card to latch a relay closed. This relay will close a
motor starter that causes motor (A) to start.
Report 21
341
Karani
FIGURE 11: 1900/55 fan monitor and 190501 Velomitor transducers
The SIMOCODE pro is the new motor
management system for low-voltage
motors. The system is the intelligent link
between the automation system and the
motor feeder.
SIMOCODE pro
implements all motor protection and
control
functions,
and
provides
operational, diagnostic and statistical data.
3.1.10 Communication buses
• Ethernet: The unit network is a
closed 100 Mbs, industry standard
Ethernet bus that unites the system
components.
FIGURE 12: Motor control centres (MCC)
• ControlNet: The network protocol
at Olkaria II power plant
for DCS that interfaces the I/O cards
(by Allen Bradley) to the CPU. I/O card expansion is provided by adding I/O cards to
ControlNet. Similarly, function modules such as turbine interlock cards are also connected to
ControlNet.
• Modbus is used to connect the DCS to the steamfield controls (Figure 13). The MVI94-MCM
communication module is used to interface Modbus master and slave devices with the I/O
system (Rotork, 2000). The module is fitted to the actuator on the Rotork valves in the
steamfield. The module performs the tasks of RS485 interface, actuator data collection and the
issuing of actuator commands.
Karani
342
Report 21
FIGURE 13: DCS interface to steamfield control
3.2 Olkaria I control system
The Olkaria I control system is analog, built by Mitsubishi
Heavy Industries (MHI). The C640 controller (Figure 14)
with process indication (deviation indication) receives as an
input the converted value 1-5 V DC of a process variable,
changed into a standard signal of 4-20 mA by the transmitter.
The deviation between this signal and the set point is
subjected to proportional, reset and rate operations to give an
output of 1-5 V DC or 4-20 mA DC.
The PID controller calculation (algorithm) involves three
separate parameters: the proportional, the integral and
derivative values (Figure 15). The Proportional value
determines the reaction to the current error, the Integral
determines the reaction based on the sum of recent errors and
the Derivative determines the reaction to the rate at which the
error has been changing. The weighed sum of these three
actions is used to adjust the process via a control element
such as the position of a control valve (Liptak, 1995).
FIGURE 14: Type C640
controller at Olkaria I power plant
Report 21
343
Karani
3.2.1 Proportional integral derivative (PID) controllers
The
following
are
some
illustrations of how PID
controllers operate:
a) Temperature controllers:
Temperature for a fluid in
a vessel/pipe is expressed
as an analog signal. The
temperature sensor is an
RTD or thermocouple, the
temperature
transducer
scales the temperature
FIGURE 15: Proportional-integral-derivative (PID) controller
value to some defined
(Wikipedia, 2008)
form/units and then feeds
that value to the controller. The controller then controls a valve or pump on a cooling or heating
line to maintain the temperature.
b) Pressure controllers: Pressure in the pipe is expressed as an analog signal. The pressure sensor
measures the pressure (bars, Pascals, psi), the transducer scales the pressure to some form/units
and then feeds that value to the controller. Based on the value and the set point, the controller
controls a valve or pump to maintain pressure (HTS, 2005).
3.2.2 Protective relays
Olkaria I plant has ninety electro-mechanical protection relays for three machines; each relay performs
a single function.
3.2.3 Turbine governor
Olkaria I plant operates on an electro-mechanical turbine governor.
3.2.4 Analog signals for instruments and control
The signal levels are conventional (Table 1), so the control system upgrade should be easy in that
respect. A transducer converts a measurement from one form to another, for example, a condenser
level with a scale range 0-1000 mm is converted into a current signal of 4-20 mA, vibration with a
scale range 0-0.4 mm is converted into a voltage signal of 2.5-40 mV, turbine speed with a scale range
0-3000 rpm is converted into a current signal of 0-5 mA.
3.2.5 The control room
The control room houses the switchboard, generator/turbine board, excitation unit and governor unit.
Some of the components on the boards are:
•
•
•
•
•
•
•
Meters (Amps/Volts/Vars/kilowatts);
Synchronization switches, start/stop switches;
Indicators for speed, vibration, pressure, load, vacuum, level;
Vibrations, steam pressure/temperature, turbine speed and valve position recorders;
Integrator, turbine supervisory instrument;
Computing and protective relays;
Controllers for pressure, level, and flow.
Karani
344
Report 21
TABLE 1: Instruments/devices in Olkaria I control system
and their corresponding analog values
Item no.
1
2
3
4
5
6
7
8
9
10
11
12
13
14
15
Instrument/device name
Vibration recorder
Turbine speed and valve position recorder
Steam pressure recorder
Indicators for speed, generator load, vibration
Indicators for pressure, vacuum, level
Integrator
Controllers for pressure, level, flow (manual station)
Computing relay
Turbine supervisory instrument – vibration control
Turbine supervisory instrument – speed, position control
Flow transmitters
Pressure transmitters (local)
Level transmitters (local)
Electro-pneumatic converter
Power supply for control system
Range of values
2.5 - 40 mV
0 - 5 mA
4 - 20mA
0 - 5 mA
4 - 20 mA
4 - 20 mA
4 - 20 mA
4 - 20 mA
2.5 - 40 mV
0 - 5 mA
4 - 20 mA
4 - 20 mA
4 - 20 mA
4 - 20 mA
AC/DC 110 V
4. SOFTWARE
4.1 Olkaria II software
Olkaria I plant does not operate on any software as the controls are not computerized, but at Olkaria II,
the DIASYS Netmation system uses the DIASYS-IDOL++ software from MHI. DIASYS-IDOL++
software provides a conventional control logic description language based on IEC 61131 - compliant
function block diagrams. It has elements for performing data execution, control and monitoring of the
operator station and IEC-compliant function blocks, making it possible to configure an entire system
(MHI, 2002). DIASYS-IDOL++ is installed on a Windows NT-based PC.
4.1.1 Features
The DIASYS system has the following features:
• Uses conventional MHI's control logic description language;
• Is based on Microsoft Windows PC;
• Function elements for maintenance of DCS:
o OPS display build up;
o Control logic design;
o System configuration;
o Drawing management (Excel, Word, AutoCAD).
• Unified database is used to configure the DCS (object database) designed to manage all the
components used for control logic or those displayed on operator stations. This setup eliminates
duplicate efforts by centralizing the management of all data in one location.
At the core of DIASYS-IDOL++ is a database used to configure the DCS, called the object relation
control architecture (ORCA). ORCA is a database designed to manage all the components used for
control logic or displayed on operator stations. This setup eliminates duplicate efforts by centralizing
the management of all data in one location. Control logic and efficiency calculation formulas can
easily be created using VISIO, a drawing tool renowned for its user friendliness. Users can create and
modify configurations and relationships simply by dragging and dropping prepared elements,
Report 21
345
Karani
eliminating the need for programming knowledge. DIASYS-IDOL++ is used to manage all the
information in the ORCA core database. In ORCA, each information item is always managed as a
component (object).
4.1.2 Functions
The functions are prepared for each design task and then all share data in the Object Database.
• Logic data creation function: Logic window
This function allows one to create logic data (Figure 16) that is processed by the MPS. Logic
window manages logic data. To change logic or create new logic, a VISIO-based tool called
LogicCreator (FLIPPER) is used.
FIGURE 16: Sample logic creation screen
• Graphic creation function: Graphic window
This function allows one to create graphics (system diagrams) displayed on the OPS. Graphic
window manages graphic data. To change a graphic or create a new graphic, a tool called
GraphicCreator (MARLIN) is used.
• System building function: System window
This function allows one to specify the overall definitions of the system. One can specify the
components connected to the unit network (MPS, OPS, and ACS), manage the information
about each component (regarding communications and others), and set the module
configuration in the MPS (such as signal assignment for I/O modules).
• User-machine interface between the OPS and the ACS: HMI window
This function is used to set the functions and windows to be used and displayed on each OPS
and ACS. This window is also used to manage control loop plates. However, to change the
Karani
346
Report 21
definitions of control loop plates or create a new control loop plate, the LoopPlateCreator
(SCALLOP) is used.
• ObjectDatabase (ORCA) creation and change function: Document window
Other functions of the EMS can also be used to create and change ObjectDatabase (ORCA).
Indocument window, Excel is used to create and change the database efficiently. Document
window manages files in Excel format. To edit an Excel file, the ListCreator (CORAL) is used.
• Document management function: Drawing window
This function is used to collect the data created using other functions of the EMS, and change it
into electronic files for management. The drawing window is used to convert the logic sheets
created using LogicCreator (FLIPPER), the graphics created using GraphicCreator (MARLIN)
and the Excel list documents created using ListCreator (CORAL) into PDF format for
management.
4.2 The MPS central processing unit (CPU)
The control logic software program rests in the MPS
central processing unit (Figure 17). The MPS CPU acts
on the instructions received from the OPS. Acting on the
message may be a very complex procedure, it may require
checking the required position, sending an electrical signal
to a field device that orders it to change states, checking a
set of switches to ensure that the order was obeyed and
sending back a message to the OPS to confirm that the
new condition has been reached. Main features of the
CPU:
•
•
•
•
Type: Compact PCI CPU card (Celeron/ Pentium);
133 Mbps Compact PCI Bus;
Intel / Celeron CPU with 300 MHz clock;
32 kbytes primary cache / 128 kbytes secondary
cache;
• 1 channel Ethernet I/F.
FIGURE 17: CPCPU01 Compact
PCI CPU card
4.3 Creating a human-machine interface (HMI) application
A graphic diagram that is displayed on the OPS can be created using InTouch 10.0 HMI Software, e.g.
cooling tower graphic diagram (Figure 18).
Steps:
1. Launching ArchestrA IDE and creating a new window;
2. Building the window by embedding ArchestrA graphics;
3. Connecting to data: Creating access name, configuring an I/O server and defining tags;
4. Animating the objects: Linking the Tagnames to the components´ symbols;
5. Running the application by clicking runtime icon on the toolbar (top right).
Defining tags:
Tags are defined (Table 2) using the Tagname dictionary. A tag represents a data item. Tags are
created for those process components whose properties are to be monitored or controlled with the
application, e.g. a pump has properties such as pressure, RPM and status whose values are associated
with tags in the HMI.
Report 21
347
Karani
FIGURE 18: Cooling tower graphic diagram
Tag types:
When a tag is defined, it is assigned to a specific type according to the intended purpose of the tag or
the type of data that is associated with it. Application’s tags can be assigned to four different types
based upon the process data associated with the tag, that is, integer, real, discrete or message data, e.g.
the PumpState tag returns a Boolean on/off value to indicate if the pump is running or stopped. The
tagname dictionary includes data types for memory, I/O and indirect tags.
• Discrete tags are associated with process component properties whose values are represented by
two possible Boolean states;
• Integer tags can be assigned 32-bit signed-integer numbers;
• Real tags can be assigned floating decimal point numbers;
• Message tags can be assigned text strings up to a maximum of 131 single-byte characters.
System tags are identified by a dollar sign ($) as the first character of a tag’s name. The values
associated with a system tag can be read-only, write-only or read/write.
TABLE 2: Definition of some tag names used in a cooling tower graphic diagram
Tag name
Mot_Amp1A
Fan1A_on
Valv_psn1A
CT_Level
Press_wat
Pump1A_on
Access Alarm
Comment
name
group
I/O integer
SLC500 $system Current reading for fan motor no. 1A
Memory discrete SLC500 $system Indication of a running fan
Indirect analog
$system Valve opening position
Memory real
$system Water level in the cooling tower basin
I/O real
$system Pressure of water from cooling tower
to condenser
I/O discrete
$system Indication of running pump
Tag type
Karani
348
Report 21
An indirect tag is a tag that can act on behalf of another tag (pointer). Using indirect tags, applications
can be created with window objects that show values from multiple tags. Using indirect tags reduces
the application development time. Instead of creating a separate set of tags and window objects for
each process component, applications can be created with window objects that show values from
multiple tag sources.
5. INSTRUMENTATION
The connections between the MPS and instruments are via electrical conductors, but using fibreoptics
cable is also becoming popular. Copper wire is normally used; it is shielded to prevent
electromagnetic interference or noise from corrupting the signal and armoured to give some physical
protection. If unarmoured, the cable is fed through rigid pipes (conduits) or laid in protective channels
(cable tray). The cable is then encapsulated in a jacket of fluid-proof, flexible plastic to protect it from
moisture, corrosive atmospheres and toxic and flammable fluids.
5.1 Instrument control using analog signals
This is a control using
continuous
values,
effective via analog
input/output cards. For
example, to open a
valve to a 60% position,
an analog signal is
usually developed to
represent the valve
position (Figure 19).
When the valve opens
fully, the transmitter
output will be +5 volts
FIGURE 19: Valve position represented as an analog signal
and when the valve is
fully closed, the output will be 0 volts. Very often a signal range of 4-20 mA is used, +5V then
corresponds to 20 mA, and 0 V corresponds to 4 mA. For a 60% valve position the transmitter output
is +3 V, which is then converted to 13.6 mA. Instead of going directly to a register, the 13.6 mA
signal is sent to an analog-to-digital converter that is inside the analog input card (Figure 20) that
changes it into a series of binary digits and stores these bits in a register.
FIGURE 20: Analog input module FXAIM01 block diagram
Report 21
349
Karani
FIGURE 21: FXDIM02 digital input module block diagram
5.2 Instrument control using digital signals
This type of control uses discrete values ´´0´´ or ´´1´´, effective via digital input/output cards. The
instrument (sensors) receives information from the process and converts it to a form that is usable by
the control system, which then feeds a digital input card (Figure 21). Pneumatic-powered or electricpowered actuators supply force and motion to instruments such as valves.
5.3 Modern instruments that support control systems
The following are examples of some modern instruments used in the Olkaria II control system:
a) DVC6000 series Fieldvue valve positioner: This is a digital valve controller (Figure 22)
communicating, microprocessor-based current-to-pneumatic instrument. In addition to the
traditional function of converting a current signal to a valve-position pressure signal, the
controllers use HART-communications protocol. Using this protocol, diverse (various) valve
information can be integrated into a control system.
b) 144LD Intelligent buoyancy transmitter: This transmitter (Figure 23) performs measurements
for liquid level, interface or density of liquids. The measurement is based on the Archimedes
buoyancy principle. Easy remote configuration and supervision can be done with a PC or
universal hand terminal. The device can also be operated conventionally using the local keys.
c) Model 3095 MV™ Multivariable™ mass flow transmitter: This is a transmitter (Figure 24) that
provides cost-effective mass flow measurements for steam, gas or liquids. This compact device
accurately measures differential pressure (DP), static pressure and process temperature to
dynamically calculate fully compensated mass flow. It simultaneously measures all process
variables necessary for calculating either pressure and temperature compensated gas flow, or
Karani
350
FIGURE 22: DVC6000 FIGURE 23: 144LD
series Fieldvue valve
Intelligent buoyancy
positioner
transmitter
Report 21
FIGURE 24: Model 3095
MVTM MultivariableTM
mass flow transmitter
temperature compensated liquid flow and provides a 4-20 mA signal proportional to mass flow
for control or metering purposes.
6. CONTROL SYSTEM UPGRADE
As a power plant ages, maintenance tends to increase and breakdowns become more frequent. This is
also true for instrument and control systems. One of the most cost-effective solutions for improving
the reliability, availability and operation of older electric power generation plants is to upgrade and
modernize a plant´s instruments and controls. Control modernization programs are designed to
improve the operation, life and maintenance of the plant.
It is a myth that software does not age. Software ages quickly if it is not upgraded. The functions can
only be guaranteed if the software is administered and updated regularly. If software is not regularly
upgraded there is a risk that service for the control system is no longer available. The engineering
tools, manufacturer support and the service staff available will no longer be willing or able to service
the control system using the old software. This could lead to prolonged unavailability of the plant in
case of control system failure. It may therefore often turn out that the constant (often meaning annual
or semi-annual) updating of the control system software is most economical. This is called keeping
the system “evergreen” and is sometimes a requirement in a control system supplier maintenance
contract. The reason is that the service work can be performed more efficiently if only the most recent
software versions have to be dealt with.
6.1 The life-cycle of a control system
The life-cycle of the control system is often shorter than that of the plant itself. For a geothermal
power plant with a lifetime longer than say 30 years, it may be expected that the control system will be
renovated at least once during the life of the plant. If frequent modifications are being made to the
control system, due to evolvement of the geothermal project, then the need for renovation of the
control system will be more frequent. Several factors influence the need for control system renewal,
one of them being the costs involved. The life-cycle cost of the control system is dependent on the
initial purchase price of the plant control system.
Report 21
351
Karani
One aspect to consider is that the automation level (plant control system, programmable logic
controllers) is much more stable (automation functions are seldom changed significantly) than the
operator station (OPS). This is because the information technology (IT) that the operator station is
based on is subject to much shorter product cycles than the automation level. Every effort must
therefore be made to make the frequent operator level upgrades as economical as possible, especially
regarding the work intensive interface with the automation level (programmable logic controllers).
Standardisation of the communication between the automation and operator level is very important in
this respect. Effective migration strategies and tools for upgrading the operator level are another
important aspect. A highly developed migration strategy for upgrades is a competitive edge that
control system manufacturers with a strong market position often have (Magnússon, 2003).
6.2 The need for a control system upgrade at Olkaria I
Older plants are often operating with many
individual analog systems, each requiring custom
support and training. Often data acquisition is
limited to a few measurements. The insufficient
alarm function increases the time needed for
failure diagnosis and repair. The need for
excessive maintenance and many components
becoming obsolete are the main factors
influencing the decision for an upgrade. The
failure rate of the old control system hardware
increases, affecting plant reliability.
The system upgrade involves building a digital
system (Figure 25) from an analog system
(Figure 26), making it possible to realize the full
benefit (meaning high reliability and high
operability) of modern plant control. It is
important to plan and invest in a control system
upgrade for the following benefits:
FIGURE 25: Digital control room
• A digital control system saves hours of
time in troubleshooting, resulting in shorter
fault detection and elimination times. This
leads to a more economic system and high
plant reliability.
• Improved response time to changes
initiated by the operator or by occurrences
in the field.
• Digital control system presents process
FIGURE 26: Analog control room
data in real-time, providing the operators
with instant visual operating data, easy-toread alarms and trip information, thus enabling the operators to operate the plant more
efficiently.
• Digital control systems being computer based provide the operators with a full spectrum of
information that is used for trending and diagnostic analysis. This information is used for
detecting problems at an early stage, thus reducing costly shutdown of the plant and improving
plant availability.
• Improved operator interface to the plant through the use of operator station (OPS), accessory
station (ACS), and large visual screens (LVS).
• Improved accessibility of plant data to engineering and management staff.
Karani
352
Report 21
• Historical storage and retrieval systems of plant data, logs and reports.
• Easy maintenance of the control logic, graphic displays through the use of engineering
maintenance station (EMS).
• A digital control system pays back its cost many times over.
6.3 Planning for geothermal power plant control system upgrade
All upgrades of control systems should start with strategic planning, to ensure that the life-cycle cost
of the plant is kept to a minimum and operational goals are met. Strategic planning starts with a
thorough evaluation of the existing control system together with a review of operational experience,
and then follows a study of the available options and their benefits versus drawbacks. Several benefits
result from developing and implementing an overall strategy for the design and implementation of a
new control system:
• Savings are realized by selecting a standard digital platform. This usually means deciding on a
control system from one or a few manufacturers. This reduces training and spare parts costs.
• Standardised human-system interface (HSI). The HSI is the key to operators’ situational
awareness and proper response to plant malfunctions. The use of many different types and
often badly conceived HSI is one of the main sources of human factor deficiencies and operator
mistakes in power plant operation.
In some instances, power plant modernizations are begun on an individual equipment or system basis,
replacing the most problematic parts without consideration of an integrated, long-term view of the
resulting plant control system architecture. Whether the modernization covers the whole plant at once
or is implemented in several phases, strategic planning is needed as one of the initial steps in the
modernization project. The lack of strategic planning can result in:
• Older control system components being unable to communicate with current/future systems.
• Control system components may become prematurely obsolete due to lack of support or
incompatibility with future control system additions.
6.3.1 Problems associated with control-system upgrades
When implementing a digital control system, consideration must be given to the potential for software
common-mode failures. Redundant, software based components are especially vulnerable to
common-mode failures during software upgrades that can introduce the same failure to both parts of a
redundant system. When planning an upgrade, due consideration must be given to this.
6.3.2 Human-system interface modernisation plan and design
Planning for the impact of a control system upgrade on the human-system interface is crucial. Power
plant and control system modifications and upgrades are often piecemeal efforts implemented over a
long time and without a firm plan for a resulting well integrated and harmonized HSI. Each
modification is designed on its own, often using different vendor equipment resulting in inconsistent
human-system interface characteristics. History has shown that incoherent HSI modifications have
been a significant source of human factor related hazards in power plants. In addition, maintaining
many types of HSI can become costly.
When upgrading a control system and designing a new HSI, one of the first steps should be to check if
the old, existing graphical HSI can be used as a basis for tools and base picture elements in the new
HSI. Then the basic picture elements needed to create the process displays should be defined in detail.
The dynamic behaviour of the picture elements and dialogues also need to be defined. The design of
displays is often an iterative process between the HSI specialists and the customer. It should be
Report 21
353
Karani
emphasized that the customer should be involved in the design of picture elements and other display
conventions. This is to ensure that the design conforms to the existing plant HSI conventions and thus
limits the amount of operator re-training required.
6.3.3 Naming conventions for systems, equipment and signals
When planning for major upgrades of a power plant, the opportunity is sometimes used to make a
change in the naming system. To ensure that the naming conventions are applied consistently, it is
preferable that only one person or a group of persons should assign names for new signals and objects.
It is important to make sure that the naming system is completely defined and well understood by
those assigning new names, before starting to use the new names.
6.3.4 Participation by plant staff
The participation of plant staff in upgrade work has several advantages. They bring to the project
extensive knowledge of the existing plant and its operation. Direct participation in the upgrade project
is perhaps the best form of training and education for operations and maintenance personnel. Part of
the project´s success usually is the involvement of the staff from the beginning. The problem is that
often the staff has to perform all the normal duties in addition to the project work. This leads to
conflicts with other tasks and potential for delays or undesired technical solutions. The staff should
therefore be relieved of most or all of their normal duties and preferably be assigned to the upgrade
project on a full-time basis.
7. REMOTE MONITORING AND CONTROL
In recent years, remote monitoring and control in geothermal projects are being used to an increasing
degree worldwide. Closed circuit TV (CCTV) is becoming popular for remote monitoring of the
surroundings of a geothermal plant. A careful consideration of all factors affecting plant availability is
needed when planning for remote control. Remote control and monitoring of geothermal plants are
quite often easy and relatively safe compared to other power plants such as fossil fuel thermal power
plants. Remote monitoring and control is intended to achieve increased efficiency of operation and
maintenance while maintaining reliability and safety.
7.1 The need for remote monitoring and control at Olkaria geothermal power plants
The Olkaria power plants are located in Hells Gate National Park and it is, therefore, not possible for
the staff to reside near the power plant. The remote monitoring system would make it possible to
monitor and operate the plant process from a remote site. In a case of abnormal plant conditions
during the night, week-ends or on holidays, the maintenance personnel immediately go to the power
station for troubleshooting upon receiving information on the abnormality from the operators. There
is need for remote monitoring and control from remote locations (Figure 27), which are more
conveniently located, perhaps several tens of kilometres away from the geothermal plant site (the head
office in Nairobi and the housing facility at Naivasha). The decision to monitor and control the plants
remotely does have a significant effect on the plants´ control systems. In some cases, remote
monitoring can facilitate the diagnosis of a failure and thus reduce the time needed for repair.
7.2 Communication interface specification for a remote monitoring system
With remote monitoring we can achieve standard OPS functions with an ordinary PC (laptop) just by
connecting to the plant control network. Remote monitoring can be used not only as a monitoring tool
Karani
354
Report 21
FIGURE 27: Layout of remote monitoring using microwave link
communication
but also an operation tool. It is easy to
realize remote maintenance from home or
head office, since connecting to the plant
network can be through the microwave
communication link (Figure 28). Scope
of supply includes:
1) Remote monitoring server PC at the
power plant;
2) Individual monitoring PCs (laptops)
at home or head office;
3) Microwave link.
FIGURE 28: Method of connection
for remote monitoring
7.3 Low-traffic communication technology and remote monitoring and control
A remote monitoring and operation system allows operations and monitoring at a place far from the
plant and a field mobile system enables operations in the field outside the control room. Such systems
can be created using a protocol for low traffic (Figure 29) to enable communications between the
system components. The traditional control systems periodically send all the process data collected by
the controller to user-machine interface devices such as OPSs. Therefore, the larger the plant, the
larger the traffic becomes. The low-traffic communication technology queries the controller for the
data to be displayed on the OPS, and compresses and sends or receives only the required data.
With the low-traffic communication technology, the traffic required for normal operations and
monitoring can be 32 kbps or less per OPS. Therefore, a remote monitoring and operation system can
be created using existing low-load infrastructures such as telephone lines and microwaves. You do not
need to lay new optical fibres to create a remote monitoring and operation system. Data is not missed
even if an unstable communications network might experience momentary lapses of data since the
MPS CPU logs and stores data. When communications are restored, the OPS calls the MPS CPU for
Report 21
355
Karani
data again.
Therefore,
trend data and alarms are
not lost. Other functional
degeneration
does
not
occur, either.
7.4 Remote monitoring
a standard feature
Extensibility:
The same
level of monitoring and
control can be provided
remotely as in a facility´s
central control room via the
internet,
microwave
circuits, telephone lines or
other existing channels.
Mobility:
With wireless
FIGURE 29: MHI card communication
networks, mobile OPS can
be set up using tabletop or notebook PCs to perform the same kind of monitoring and control
throughout a facility as in the central control room.
Real-time reporting: The system can be configured to transmit critical alarm messages by e-mail or
SMS to a mobile phone so that if a problem arises, the person in charge is alerted immediately, and
response can be rapid (Figure 30).
FIGURE 30: Remote monitoring and control system
Karani
356
Report 21
Excellent operability: All remote monitoring and control are standard with DIASYS Netmation, and
need only be activated by the user. Requested data, even if travelling on telephone lines, reaches
remote screens at virtually the same speed as data transferred within a central control room.
7.5 Remote monitoring and the hierarchical structuring of the control system
In geothermal power plants, the control system is often split into five different levels (internet, office
LAN, plant control/monitoring, control and field levels). The level division (Figure 31) is primarily
intended to increase the reliability of the control system (MHI, 2004).
FIGURE 31: Control system hierarchy
1) Internet (remote monitoring) level: On the Internet level, DIASYS Netmation provides an
environment for remote operation and monitoring from home or a distant location. Operation
and monitoring are possible by simply connecting a browser OPS to the Internet. This access is
password protected.
2) Office LAN level: On the office LAN level, DIASYS Netmation enables plant operation,
monitoring, control, and adjustments via a LAN that connects the entire power plant. Ordinary
PCs can be used as browser OPSs without modification. What is more, by simply installing an
in-house wireless LAN or personal handy-phone system (PHS) line, mobile OPSs are available
and they can be used to monitor plant operation in the field.
3) Plant control/monitoring level: Connected over a duplex 100 Mbps Ethernet network, the unit
level is designed with emphasis on reliability. This level offers an interface to upper layers and
Report 21
357
Karani
provides the ability to operate and monitor all units. The accessory station (ACS) can store a
large quantity of data, provides an interface with upper levels, and controls printers and other
peripheral devices. The operator station (OPS) is placed in the central control room and
efficiently provides the operator with a variety of displays and methods of operation. The
engineering maintenance system (EMS) is used to configure the entire system and create logic
operations for controlling the system.
4) Control level: On the control level, devices are connected using the ControlNet. This level
enables high-speed input/output processing and provides the ability to seamlessly configure
control systems. Moreover, since it supports duplex systems and optical fibres, wide-area plant
monitoring and control systems can be configured. The MPS and compact processor station
(CPS) can be connected to DCS and PLCs of other manufacturers via Ethernet or ControlNet
(which is the input/output network). The MPS can also be used to perform arithmetic
calculations and control the system, as well as collect short-term (hourly) data.
5) Field level: This level provides ports to external networks such as a fieldbus (ModBus in the
case of Olkaria II) by connecting linking devices to the ControlNet network. Remote, batch
maintenance of terminal field devices can also be performed.
7.6 Control system redundancy
Manual control is often difficult or cannot be applied for operation in case the main control system
fails. A standby or redundancy control system of key system components (Figure 32) is therefore
FIGURE 32: System configuration of a multiple process station
Karani
358
Report 21
important for reliable and uninterrupted operation of the plant. In geothermal power plants, control
equipment for the steam and heat exchanger subsystem cannot be controlled manually as they are too
fast. A redundant, automatic control system is therefore necessary.
The standby component starts automatically when the running component fails. The control system
for Olkaria II plant is configured such that the power supply (Figure 33), MPS CPU, Ethernet interface
module, system I/O module and ControlNet interface module take into account redundancy.
FIGURE 33: Control system power supply system (MHI, 2006b)
Report 21
359
Karani
8. HYDROGEN SULPHIDE CORROSION AND CONTROL SYSTEMS
Most of the Olkaria I plant process is controlled through control relays and manual or automatic
switches and electromechanical protective relays whose moving contacts are made of either copper or
silver. All the unprotected copper and silver and their respective alloys are already contaminated.
Operational and maintenance costs have been relatively high due to direct effects of H2S corrosion on
the geothermal turbine/generator auxiliaries. The non-condensable gases are usually composed of
99.5% carbon dioxide gas, 0.4% Hydrogen sulphide gas and 0.1% other gases (methane, hydrogen,
nitrogen, and carbon monoxide). The H2S corrosion has caused contacts’ burning and destruction of
415 V, 3.3 kV and 11 kV circuit breakers, malfunctions of control circuits, equipment protection
devices and air conditioning units.
It is important to note that the highest H2S level recorded at Olkaria is 4.40 ppm, which was at the
power plant. The occupational exposure limit (O.E.L) of H2S in work places is 10 ppm for an average
8-hour day (Kubo, 2003).
8.1 Design considerations during construction of Olkaria I power plant
In an effort to prevent H2S gas effects on electrical equipments, the following was considered,
designed and constructed at Olkaria I power plant (Mitsubishi Electric Corporation, 1981):
• The protection relays, auxiliary logic relays and most of the magnetic contactors and control
switches are located inside the central control room and in the switchgear rooms.
• The central control room and switchgear rooms are positively pressurized with clean, H2S
filtered air. Air from the outside is passed through activated-charcoal air-filters to two air
conditioning plants before entering the central control room and the switchgear rooms.
• The central control room has a duplicated door at its main entrance to segregate its clean air
from the contaminated outside atmosphere.
• The generators are totally enclosed and pressurized with clean H2S filtered air. The make-up
cooling air is usually passed through activated-charcoal air-filters.
• All the electrical control panels’ doors are fitted with airtight rubber seals.
• All the electrical, electronic and instrumentation devices installed outside the air-conditioned
rooms are fully enclosed in boxes that have rubber sealed covers and tightly fitted plastic cable
conduits.
8.2 Reasons for corrosion on the electrical switchgears and control systems
Despite the efforts taken during the design and construction of Olkaria I power plant, most of the
devices are already affected by H2S gas. The following have been noted as the most probable causes
(Mutua, 2002):
• All the electrical contacts and cabling are made of either copper or copper alloy or silver.
• The air-conditioning units’ frequent breakdowns allow contaminated atmospheric air to enter
the central control room and the switchgear rooms.
• The rubber air-seals on the control panels usually become brittle and broken.
• The non-condensable gases are injected into the atmosphere via chimneys only two meters
above the power house roof.
• The tin-plating for the electrical copper wires is too thin.
• The use of activated charcoal in the air-conditioning units is inefficient.
• Outdoor electrical/electronic cabinets are without cleaned air supply.
Karani
360
Report 21
8.3 Problems expected as a result of H2S corrosion on electrical control circuits
1) Loss of control signal: Due to higher resistance of the sulphide coating, the current flow
through relay or switch contacts is usually less than the predetermined value, hence a wrong
signal is sent to the control device. This is common on transformer tap-changer positions
remote indication, steam flow and steam pressure value indications and level transmitters.
2) Under-voltage: Voltage drop due to higher contact resistance across H2S contaminated contact
causing magnetic contactor chattering, burning/welding on the pressure switches, protective
relays, normally-closed control switches and limit switches. The indication lamps dim or may
not give light at all; solenoid valves may not operate.
8.4 Cases of H2S gas effects at Olkaria I
Table 3 gives a history of some of the recorded operational and maintenance problems as a result of
hydrogen sulphide gas contaminating electrical equipment and control systems.
TABLE 3: Summary of some of the observed operational and maintenance problems
caused by H2S gas at Olkaria I (KenGen, 1992-2001)
Date
Feb. 1992
July 1992
Observed problem
Unit 1 160 kW circulating
water pump ‘A’ motor could
not start.
Unit 2 generator circuit
breaker fails to open.
March 1993 Unit 1 and Unit 2 generator
circuit breakers overheating.
Dec. 1993
Aug. 1994
May 1996
Feb. 2000
Wire for generator overcurrent protection relay’s
‘flag’ circuit broken.
Unit 1 fire fighting system not
responding to tests.
Unit 1 generator circuit
breaker found with low SF6
gas press.; 3.4 kg/cm2 instead
of 6 kg/cm2.
Unit 2 cooling tower fan ‘C’
94 kW motor could not start.
Cause of problem
Local panel ‘Stop’ switch
contact resistance about
100 Ω.
Contacts for the generator low
forward power protection
relay had welded together.
Some of the circuit breakers’
primary junctions were burnt.
The bare stranded 1 mm2
tinned copper wire found
brittle and worn out.
‘Reset’ switch contact
resistance to about 100 Ω.
Blue phase primary junction
was found burnt and gas
leaking at the bushing.
Remedy
Switch contacts cleaned
of the black/deep-blue
sulphide coating.
Contacts forced to open
then cleaned/smoothed
with a fine file.
Cleaned and replaced the
primary junctions. Contacts were smeared with
petroleum jelly.
The wires replaced with
new ones.
Switch contacts cleaned
The circuit breaker was
replaced with a new one.
Old breaker repaired
later.
Switch contacts cleaned.
A ‘local/remote’ changeover
switch contacts resistance over
50 Ω.
March 2000 Unit 1 instrument air
Thermal overload protection The supply termination
compressors ‘A’ and ‘C’
device malfunctioning due to lugs were replaced and
tripping too frequently on
overheating supply
tightly crimped.
unjustifiable overload.
terminations.
April 2000 A bare 95 mm2 multi-stranded The copper strands were
An insulated 120 mm2
copper earthing broken near severely corroded and broken. was laid across the
seal-pit area.
broken conductor.
Nov. 2001 Unit 3 cooling tower fan ‘B’ The 250 A fuses and fuse
The fuses and the fuse
motor could not start.
carriers burnt.
carriers replaced.
Report 21
361
Karani
8.5 Recommendations
The following methods can help to overcome corrosion on indoor electrical equipment:
• Where H2S levels are high, air conditioning systems should be fitted with special filters and
special precautions should be taken to prevent unfiltered air from entering clean areas at all
times. All sensitive equipment shall be located in a positive pressurised and H2S filtered room.
• Monitoring of doors in cleaned air rooms (alarm if door stays open for several minutes).
• Check and replace the sensitive relays with numerical (digital) types (no moving contacts).
• Gold alloys and platinum plated contacts may be used in electrical relays.
• Cleaning and smearing (covering) the electrical contacts with special conductive grease.
• Specification of H2S rated instruments and connections.
• Specification of gold-plating on printed circuit board connections.
• Provision of control cubicles with anti-condensation heaters.
• Varnishing and painting indoor items.
The following methods can help to overcome corrosion on outdoor electrical equipment:
•
•
•
•
•
•
•
Use of tinned and epoxy painted bulk copper.
Use of corrosion resistant materials such as aluminium, stainless steel, etc.
Use of heat shrink material on exposed copper.
Epoxy encapsulation of small components.
Making a careful selection of paint systems and sealing gaskets.
Mild steel galvanising.
Reduce the H2S concentrations in the atmosphere by ejecting the non-condensable gases at very
high heights.
• Supply of cleaned air to outdoor cabinets.
• Use of H2S abatement systems for emissions control such as Stretford process, LO-CAT
process, AMIS process, Selectox process (Rivera, 2007).
9. DCS IN RELATION TO SCADA
The Distributed control system (DCS) at Olkaria II plant is, in many aspects, similar to the
Supervisory control and data acquisition (SCADA) system. SCADA system is the technology that
enables a user to collect data from one or more facilities and /or send limited control instructions to
those facilities from a central computer (Stuart, 1999). SCADA and DCS are both specialized to
perform different functions in process control.
Features of DCS:
i. More emphasis is on process-control functionality;
ii. Process oriented, it looks at the controlled process and presents data to operators as part of its
job;
iii. Primarily for the implementation of sequential control;
iv. Typically in one plant;
v. High availability of power;
vi. Fast and robust communications;
vii. Control equipment reside in a temperature-controlled room;
viii. Always connected to its data source. Redundancy is usually handled by parallel equipment, not
by diffusion of information around a distributed database.
Karani
362
Report 21
Features of SCADA:
i. More emphasis is on system database and data-gathering system;
ii. Data-gathering oriented, it is mainly there to collect the data – though it may also do some
process control;
iii. Primarily for integrating a large number of remote locations and concentrating the logic
processing at a central master station;
iv. Usually distributed across a wide area / region;
v. Power may be intermittent or off;
vi. Communications can be slow and drop out regularly;
vii. Equipment may be installed in a hostile environment;
viii. Gets data and performs control over a potentially slow, unreliable communications medium.
Redundancy is usually handled in a distributed manner.
There is, in several industries, considerable confusion over the differences between SCADA systems
and DCS Systems. Generally speaking, a SCADA system coordinates, but does not control processes
in real time. As communication infrastructures with higher capacity become available, enabling
reliable, high speed communications over wide areas, the differences between SCADA and DCS will
fade. By looking at a customer's system requirements specifications, a careful analysis of the data
collection and data quality requirements will indicate if a SCADA-type or DCS-type system is
appropriate.
10. CONCLUSIONS
From the research study, it can be concluded that it is worthwhile for KenGen to invest in a digital
control system for Olkaria I, and a remote monitoring and control system for Olkaria I and II for the
following main reasons:
High reliability:
• Duplicated redundant processors, network and power supply units help ensure reliability. This
means that, in the event of failure, switchover can be made to the standby unit of the duplex
system without adversely affecting control.
• Each MPS CPU is provided with a complete set of self-diagnostic functions. Even in the
unlikely event of a system failure, the MPS CPU´s self-diagnostic functions and indication
features make it easy to locate the failure and restore the system.
• The low-traffic communication technology used to monitor and control plants is based on the
internet technology. It is highly reliable and creates only a low traffic load, enabling control
and monitoring by telephone lines with no need for a new infrastructure such as optical fibres.
• The advanced alarm functions have several ways to quickly inform operators of abnormalities,
and to help investigate their sources. The system comes with an alarm summary, two-line
message, alarm-group display and event trace. It also provides alarm setting and event printing
functions.
• Remote monitoring and control reduces the time needed for failure diagnosis and repair.
• The digital control system´s proven ability to run 24 hours a day, 365 days a year. If a memory
leak that might cause a system freeze occurs, an appropriate circuit detects and reports it as an
alarm to reset the PC before the freeze occurs and releases the memory.
High operability:
• Excellent controllability is achieved through the powerful Intel Celeron/Pentium processor and
high-speed process I/O scheme. The high-speed MPS CPU is able to perform almost any type
of arithmetic computation, including efficiency/performance calculations and more.
Report 21
363
Karani
• The OPS uses Microsoft Windows as the operating system. Windows is prone to freeze (a
window suddenly stops and does not recover until the power is turned off and on again) and
may not be suitable for operating and monitoring a plant in terms of reliability. But the digital
control system has the operability of Windows and at the same time high reliability that is based
on a design concept that totally differs from conventional control systems. The MPS CPU has
the data collection and alarm detection features. Even if the OPS goes down, the required
functionality is never lost. The operating system of the MPS CPU is pSOS. When the OPS
needs data, it asks the MPS CPU or the ACS. Therefore, even if the OPS freezes and is reset,
functional degeneration such as missed alarm detection or missed trend data does not occur at
all.
• The user friendliness and widespread proficiency in MS Windows based user-machine interface
helps to achieve high operability.
• The logic and graphics creation tools are based on VISIO, a CAD tool which is renowned for its
user friendliness, so systems can be designed by dragging and dropping. The logic diagrams
created in VISIO are directly saved as formal drawings, allowing for consistency between the
actual logic and drawings.
• The engineering software tools make it possible to perform easy system maintenance of
anything from control logic modification to system configuration.
• Advanced data collection and storage features.
• Many interfaces are available to enable the connection with external systems.
ACKNOWLEDGEMENTS
I would like to say ‘thank you’ to my employer, Kenya Electricity Generating Company - KenGen, for
granting me the opportunity to attend this training. I am also grateful to Dr. Ingvar B. Fridleifsson,
director of the UNU Geothermal Training Programme, for offering me the chance to participate in this
training, and Mr. Lúdvík S. Georgsson, deputy director, for his successful organization of the
programme. Many thanks go to Mr. Jóhann Thór Magnússon, my supervisor, for his good guidance,
sharing his knowledge and experience and supervision of this work. Sincere thanks to Ms. Thórhildur
Ísberg, Mrs. Dorthe Holm and Mr. Markús A.G. Wilde for their useful help and care all through the
training period. I thank my parents, for their constant prayers, support and encouragement during the
entire training period. My special thanks go to my son Michael, who at a very tender age,
demonstrated great endurance and patience during my long absence from home, and to my unborn
baby, who gave me great company during all my days in Iceland. This work is dedicated to my
children, with unconditional love. May God bless them; grant them the desires of their hearts and
great happiness in life. Finally, I thank the Almighty God, who made all these things possible.
REFERENCES
Asok, B., Shyamal, K.D., and Barnali, P., 2002: Real-time condition monitoring system using
vibration analysis for turbine bearing. Speech and Signal Processing Group, Calcutta, report, 4 pp.
GE, 2001:
GE industrial systems.
www.geindustrial.com/cwc/Dispatcher?R
General
HTS, 2005:
Process control and monitoring.
www.htservices.com/Applications/Process/index.htm.
Electric
Company,
Ltd.,
website:
High Tech Services, Ltd., website:
KenGen, 1992-2001: Monthly, annual and periodic maintenance reports for the Olkaria I power
station machines. The Kenya Electricity Generating Company Ltd., unpublished reports.
Karani
364
Report 21
Kubo, B.M., 2003: Environmental management at Olkaria geothermal project, Kenya. Proceedings
of the International Geothermal Conference IGC-2003, Reykjavík, S12 72-80.
Liptak, B.G., 1995. Instrument engineers´ handbook. CRC Press, LLC.
Magnússon, J.Th., 2003: Operational simulators and automatic control systems. In: Fridleifsson,
I.B., and Gunnarsson, M.V. (eds.), Lectures on sustainable use and operating policy for geothermal
resources. UNU-GTP, Iceland, publication 1, 185-194.
MHI, 2002: DIASYS netmation. Mitsubishi Heavy Industries, Ltd., Yokohama, Japan, website,
www.dolphin.gr.jp/
MHI, 2004: Automated plant start/stop system.
www.diasysnetmation.com/solutions(E)/index.htm
Mitsubishi Heavy Industries, Ltd., website,
MHI, 2006a: DIASYS netmation hardware specifications (version 9.0). Mitsubishi Heavy Industries,
Ltd., Yokohama, Japan, technical manual, 186 pp.
MHI, 2006b: Trailblazing the future through the fusion of information technology with MHI´s plant
manufacturing experience.
Mitsubishi Heavy Industries, Ltd., Yokohama, Japan, website,
www.diasys-netmation.com/english/
Mitsubishi Electric Corporation, 1981. Maintenance instructions manual for Olkaria I geothermal
power station, generator and electrical equipments (vol.5). Mitsubishi, E.C., manual.
Mutua, P., 2002: Corrosive effects of hydrogen sulphide gas on Olkaria I geothermal power station.
Geothermal Resources Council, Trans., 26, 8 pp.
Mwangi, M., 2006: Geothermal development in Kenya. Kenya Electricity Generating Company Ltd.,
Kenya, internal report, 39 pp.
Rivera, M.A., 2007: Design considerations for reliable electrical, control and instrumentation systems
in geothermal power plants with emphasis on hydrogen sulphide related problems. Report 20 in:
Geothermal training in Iceland 2007. UNU-GTP, Iceland, 461-490.
Rockwell, 2006: Turbine supervisory instrumentation. Rockwell Automation Ltd., website,
www.literature.rockwellautomation.com/idc/groups/literature/documents/sg/gmsi10-sg002_-en-p.pdf.
Rotork, 2000: MVI94-MCM communication module (version 1.00), user manual.
Technology, Inc., Rotork Controls Ltd., manual, 42 pp.
ProSoft
Stuart, A.B., 1999: SCADA: Supervisory control and data acquisition (2nd edition). Iliad Engineering
Inc., USA, 215 pp.
Wikipedia, 2008: PID controller. Wikipedia, website: http: //en.wikipedia.org/wiki/PID_controller.