1
VIEWME-UM004D-EN-E_Ttlpg.qxd
7/18/05
2:55 PM
Page 1
User’s Guide
Volume 1
Publication VIEWME-UM004D-EN-E - July 2005
Supersedes Publication VIEWME-UM004C-EN-E
Contacting
Rockwell Software
Copyright Notice
Technical Support Telephone—440-646-5800
Technical Support Fax—440-646-5801
World Wide Web—www.rockwellsoftware.com
Copyright © 2005 Rockwell Software Inc. All rights reserved. Printed in USA.
Portions copyrighted by the Allen-Bradley Company, LLC, a Rockwell Automation® company.
This manual and any accompanying Rockwell Software® products are copyrighted by Rockwell
Software Inc. Any reproduction and/or distribution without prior written consent from Rockwell
Software Inc. is strictly prohibited. Please refer to the license agreement for details.
VBA and DCOM, Copyright 1996, 1997 Microsoft Corporation. All rights reserved.
This software is based in part on the work of the Independent JPEG Group.
Trademark Notice
Rockwell Automation, Rockwell Software, Allen-Bradley, ControlLogix, FactoryTalk, PLC-5,
RSLinx, RSTools, RSView, and VersaView are registered trademarks, and the Rockwell
Software logo, RSAssetSecurity, RSLinx Enterprise, RSLogix, RSView Machine Edition,
RSView ME Station, RSView Studio, RSView Supervisory Edition, A.I. Series, Advanced
Interface (A.I.) Series, FactoryTalk Automation Platform, FactoryTalk Diagnostics, FactoryTalk
Directory, PanelBuilder, PanelView Plus, SLC, and WINtelligent are trademarks of Rockwell
Automation, Inc.
Adobe and Reader are registered trademarks of Adobe Systems Incorporated. TrueType is a
trademark of Apple Computer, Inc. AutoCAD is a registered trademark of Autodesk, Inc.
Ethernet is a registered trademark of Digital Equipment Corporation, Intel Corporation, and
Xerox Corporation. Modicon is a registered trademark of Groupe Schneider. Zip is a trademark
of Iomega Corporation. KEPServerEnterprise is a trademark of Kepware Technologies.
ActiveX, Microsoft, OpenType, Visual Basic, Windows, and Windows NT are registered
trademarks of Microsoft Corporation in the United States and/or other countries. OPC is a
registered trademark of the OPC Foundation.
All other trademarks and registered trademarks are the property of their respective holders and are
hereby acknowledged.
Warranty
This Rockwell Software product is warranted in accord with the product license. The product’s
performance will be affected by system configuration, the application being performed, operator
control, and other related factors.
This product’s implementation may vary among users.
This manual is as up-to-date as possible at the time of printing; however, the accompanying
software may have changed since that time. Rockwell Software reserves the right to change any
information contained in this manual or the software at any time without prior notice.
The instructions in this manual do not claim to cover all the details or variations in the equipment,
procedure, or process described, nor to provide directions for meeting every possible contingency
during installation, operation, or maintenance.
Doc ID ViewME-UM004D-EN-E
July 2005
Contents
Preface
About the documentation . . . . . . . . . . . . . . . . . . . . . . . . . . . . . . . . . . . . . . . . . . . .
Finding the information you need . . . . . . . . . . . . . . . . . . . . . . . . . . . . . . . . . . . . .
Try the User's Guide and Help first . . . . . . . . . . . . . . . . . . . . . . . . . . . . . . . .
Information on the Internet . . . . . . . . . . . . . . . . . . . . . . . . . . . . . . . . . . . . . . .
Contacting Rockwell Software Technical Support. . . . . . . . . . . . . . . . . . . . .
P-1
P-2
P-2
P-2
P-3
1 • Getting Started
The parts of RSView Machine Edition . . . . . . . . . . . . . . . . . . . . . . . . . . . . . . . . . . 1-1
Additional software. . . . . . . . . . . . . . . . . . . . . . . . . . . . . . . . . . . . . . . . . . . . . . 1-1
FactoryTalk Administration Console . . . . . . . . . . . . . . . . . . . . . . . . . . . . . . . . 1-1
The RSView Machine Edition tools. . . . . . . . . . . . . . . . . . . . . . . . . . . . . . . . . . . . . 1-2
RSView Studio tools. . . . . . . . . . . . . . . . . . . . . . . . . . . . . . . . . . . . . . . . . . . . . 1-2
FactoryTalk tools . . . . . . . . . . . . . . . . . . . . . . . . . . . . . . . . . . . . . . . . . . . . . . . 1-3
2 • Exploring RSView Studio
Starting and exiting RSView Studio . . . . . . . . . . . . . . . . . . . . . . . . . . . . . . . . . . . . 2-1
Starting RSView Studio . . . . . . . . . . . . . . . . . . . . . . . . . . . . . . . . . . . . . . . . . . 2-1
Exiting RSView Studio. . . . . . . . . . . . . . . . . . . . . . . . . . . . . . . . . . . . . . . . . . . 2-1
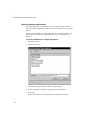
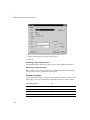
Opening sample applications . . . . . . . . . . . . . . . . . . . . . . . . . . . . . . . . . . . . . . . . . . 2-2
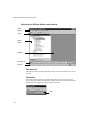
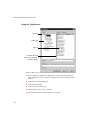
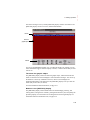
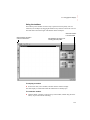
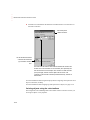
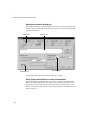
Exploring the RSView Studio main window . . . . . . . . . . . . . . . . . . . . . . . . . . . . . . 2-4
The menu bar . . . . . . . . . . . . . . . . . . . . . . . . . . . . . . . . . . . . . . . . . . . . . . . . . . 2-4
The toolbar . . . . . . . . . . . . . . . . . . . . . . . . . . . . . . . . . . . . . . . . . . . . . . . . . . . . 2-4
The Explorer window . . . . . . . . . . . . . . . . . . . . . . . . . . . . . . . . . . . . . . . . . . . . 2-5
The workspace . . . . . . . . . . . . . . . . . . . . . . . . . . . . . . . . . . . . . . . . . . . . . . . . . 2-5
The Diagnostics List . . . . . . . . . . . . . . . . . . . . . . . . . . . . . . . . . . . . . . . . . . . . . 2-5
The status bar . . . . . . . . . . . . . . . . . . . . . . . . . . . . . . . . . . . . . . . . . . . . . . . . . . 2-6
Workbook tabs . . . . . . . . . . . . . . . . . . . . . . . . . . . . . . . . . . . . . . . . . . . . . . . . . 2-7
Showing and hiding items in the main window . . . . . . . . . . . . . . . . . . . . . . . . 2-7
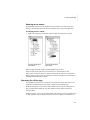
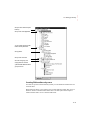
Using the Explorer window . . . . . . . . . . . . . . . . . . . . . . . . . . . . . . . . . . . . . . . . . . . 2-8
Viewing the Explorer window . . . . . . . . . . . . . . . . . . . . . . . . . . . . . . . . . . . . 2-10
Moving the Explorer window . . . . . . . . . . . . . . . . . . . . . . . . . . . . . . . . . . . . . 2-10
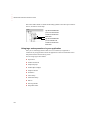
Working with editors . . . . . . . . . . . . . . . . . . . . . . . . . . . . . . . . . . . . . . . . . . . . . . . 2-10
Locating editors . . . . . . . . . . . . . . . . . . . . . . . . . . . . . . . . . . . . . . . . . . . . . . . 2-11
Viewing an editor's components . . . . . . . . . . . . . . . . . . . . . . . . . . . . . . . . . . . 2-11
Opening editors. . . . . . . . . . . . . . . . . . . . . . . . . . . . . . . . . . . . . . . . . . . . . . . . 2-11
i
• • • • •
RSVIEW MACHINE EDITION USER’S GUIDE
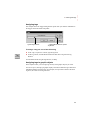
Closing editors . . . . . . . . . . . . . . . . . . . . . . . . . . . . . . . . . . . . . . . . . . . . . . . . 2-12
Entering information in spreadsheets . . . . . . . . . . . . . . . . . . . . . . . . . . . . . . . . . . . 2-12
Working with components . . . . . . . . . . . . . . . . . . . . . . . . . . . . . . . . . . . . . . . . . . . 2-13
Creating components . . . . . . . . . . . . . . . . . . . . . . . . . . . . . . . . . . . . . . . . . . . 2-14
Opening components . . . . . . . . . . . . . . . . . . . . . . . . . . . . . . . . . . . . . . . . . . . 2-14
Saving components . . . . . . . . . . . . . . . . . . . . . . . . . . . . . . . . . . . . . . . . . . . . . 2-14
Closing components . . . . . . . . . . . . . . . . . . . . . . . . . . . . . . . . . . . . . . . . . . . . 2-14
Adding components into an application . . . . . . . . . . . . . . . . . . . . . . . . . . . . . 2-15
Deleting components . . . . . . . . . . . . . . . . . . . . . . . . . . . . . . . . . . . . . . . . . . . 2-16
Removing components . . . . . . . . . . . . . . . . . . . . . . . . . . . . . . . . . . . . . . . . . . 2-16
Renaming components . . . . . . . . . . . . . . . . . . . . . . . . . . . . . . . . . . . . . . . . . . 2-16
Duplicating components . . . . . . . . . . . . . . . . . . . . . . . . . . . . . . . . . . . . . . . . . 2-17
Printing . . . . . . . . . . . . . . . . . . . . . . . . . . . . . . . . . . . . . . . . . . . . . . . . . . . . . . . . . . 2-17
Selecting a printer . . . . . . . . . . . . . . . . . . . . . . . . . . . . . . . . . . . . . . . . . . . . . . 2-17
Printing at runtime . . . . . . . . . . . . . . . . . . . . . . . . . . . . . . . . . . . . . . . . . . . . . 2-18
3 • Planning applications
Understanding the process . . . . . . . . . . . . . . . . . . . . . . . . . . . . . . . . . . . . . . . . . . . . 3-1
Collecting data . . . . . . . . . . . . . . . . . . . . . . . . . . . . . . . . . . . . . . . . . . . . . . . . . . . . . 3-2
Designing an HMI tag database . . . . . . . . . . . . . . . . . . . . . . . . . . . . . . . . . . . . . . . . 3-2
Collecting information . . . . . . . . . . . . . . . . . . . . . . . . . . . . . . . . . . . . . . . . . . . 3-2
Organizing tags . . . . . . . . . . . . . . . . . . . . . . . . . . . . . . . . . . . . . . . . . . . . . . . . . 3-2
Planning graphic displays. . . . . . . . . . . . . . . . . . . . . . . . . . . . . . . . . . . . . . . . . . . . . 3-3
Developing a hierarchy of displays . . . . . . . . . . . . . . . . . . . . . . . . . . . . . . . . . 3-3
Creating a template to ensure consistency . . . . . . . . . . . . . . . . . . . . . . . . . . . . 3-3
Designing displays . . . . . . . . . . . . . . . . . . . . . . . . . . . . . . . . . . . . . . . . . . . . . . 3-4
Usability . . . . . . . . . . . . . . . . . . . . . . . . . . . . . . . . . . . . . . . . . . . . . . . . . . . . . . 3-4
Planning languages. . . . . . . . . . . . . . . . . . . . . . . . . . . . . . . . . . . . . . . . . . . . . . . . . . 3-4
Planning alarms . . . . . . . . . . . . . . . . . . . . . . . . . . . . . . . . . . . . . . . . . . . . . . . . . . . . 3-5
Providing information for the operator . . . . . . . . . . . . . . . . . . . . . . . . . . . . . . . . . . 3-5
Local and information messages. . . . . . . . . . . . . . . . . . . . . . . . . . . . . . . . . . . . 3-5
Diagnostics messages . . . . . . . . . . . . . . . . . . . . . . . . . . . . . . . . . . . . . . . . . . . . 3-6
Planning trends . . . . . . . . . . . . . . . . . . . . . . . . . . . . . . . . . . . . . . . . . . . . . . . . . . . . . 3-6
Planning recipes . . . . . . . . . . . . . . . . . . . . . . . . . . . . . . . . . . . . . . . . . . . . . . . . . . . . 3-6
Designing a secure system . . . . . . . . . . . . . . . . . . . . . . . . . . . . . . . . . . . . . . . . . . . . 3-7
4 • Working with applications
What is an application? . . . . . . . . . . . . . . . . . . . . . . . . . . . . . . . . . . . . . . . . . . . . . . 4-1
Application versus project . . . . . . . . . . . . . . . . . . . . . . . . . . . . . . . . . . . . . . . . 4-1
HMI project file . . . . . . . . . . . . . . . . . . . . . . . . . . . . . . . . . . . . . . . . . . . . . . . . 4-1
Runtime application file . . . . . . . . . . . . . . . . . . . . . . . . . . . . . . . . . . . . . . . . . . 4-2
ii
Component files . . . . . . . . . . . . . . . . . . . . . . . . . . . . . . . . . . . . . . . . . . . . . . . . 4-2
External folders. . . . . . . . . . . . . . . . . . . . . . . . . . . . . . . . . . . . . . . . . . . . . . . . . 4-2
Default log file locations for PanelView Plus or VersaView CE applications. 4-3
Naming files . . . . . . . . . . . . . . . . . . . . . . . . . . . . . . . . . . . . . . . . . . . . . . . . . . . 4-3
Creating, importing, opening, and closing applications . . . . . . . . . . . . . . . . . . . . . . 4-4
Creating applications . . . . . . . . . . . . . . . . . . . . . . . . . . . . . . . . . . . . . . . . . . . . 4-4
Importing applications . . . . . . . . . . . . . . . . . . . . . . . . . . . . . . . . . . . . . . . . . . . 4-5
Opening applications . . . . . . . . . . . . . . . . . . . . . . . . . . . . . . . . . . . . . . . . . . . . 4-6
Opening multiple applications . . . . . . . . . . . . . . . . . . . . . . . . . . . . . . . . . . . . . 4-9
Opening and editing applications from earlier versions of RSView . . . . . . . . 4-9
Closing applications . . . . . . . . . . . . . . . . . . . . . . . . . . . . . . . . . . . . . . . . . . . . . 4-9
Renaming, copying, deleting, backing up, and restoring applications. . . . . . . . . . 4-10
About project settings. . . . . . . . . . . . . . . . . . . . . . . . . . . . . . . . . . . . . . . . . . . . . . . 4-10
Project window size and runtime screen resolution . . . . . . . . . . . . . . . . . . . . 4-10
Title bar. . . . . . . . . . . . . . . . . . . . . . . . . . . . . . . . . . . . . . . . . . . . . . . . . . . . . . 4-14
Specifying project settings . . . . . . . . . . . . . . . . . . . . . . . . . . . . . . . . . . . . . . . . . . . 4-16
Viewing application properties . . . . . . . . . . . . . . . . . . . . . . . . . . . . . . . . . . . . . . . 4-17
Viewing HMI server properties . . . . . . . . . . . . . . . . . . . . . . . . . . . . . . . . . . . . . . . 4-17
5 • Setting up communications
About OPC communications . . . . . . . . . . . . . . . . . . . . . . . . . . . . . . . . . . . . . . . . . . 5-1
Summary of steps . . . . . . . . . . . . . . . . . . . . . . . . . . . . . . . . . . . . . . . . . . . . . . . . . . . 5-1
About data servers . . . . . . . . . . . . . . . . . . . . . . . . . . . . . . . . . . . . . . . . . . . . . . . . . . 5-2
Creating data servers . . . . . . . . . . . . . . . . . . . . . . . . . . . . . . . . . . . . . . . . . . . . . . . . 5-3
Setting up RSLinx Enterprise data servers . . . . . . . . . . . . . . . . . . . . . . . . . . . . 5-3
Setting up an OPC data server . . . . . . . . . . . . . . . . . . . . . . . . . . . . . . . . . . . . . 5-4
Updating data server caches . . . . . . . . . . . . . . . . . . . . . . . . . . . . . . . . . . . . . . . 5-5
6 • Working with tags
Types of tags . . . . . . . . . . . . . . . . . . . . . . . . . . . . . . . . . . . . . . . . . . . . . . . . . . . . . . 6-1
Data server tags. . . . . . . . . . . . . . . . . . . . . . . . . . . . . . . . . . . . . . . . . . . . . . . . . 6-1
HMI tags . . . . . . . . . . . . . . . . . . . . . . . . . . . . . . . . . . . . . . . . . . . . . . . . . . . . . . 6-2
The data source . . . . . . . . . . . . . . . . . . . . . . . . . . . . . . . . . . . . . . . . . . . . . . . . . 6-2
Basic steps for using tags . . . . . . . . . . . . . . . . . . . . . . . . . . . . . . . . . . . . . . . . . 6-2
When to use data server tags . . . . . . . . . . . . . . . . . . . . . . . . . . . . . . . . . . . . . . . . . . 6-3
Eliminating duplication. . . . . . . . . . . . . . . . . . . . . . . . . . . . . . . . . . . . . . . . . . . 6-3
Using complex data . . . . . . . . . . . . . . . . . . . . . . . . . . . . . . . . . . . . . . . . . . . . . 6-3
Steps for using data server tags . . . . . . . . . . . . . . . . . . . . . . . . . . . . . . . . . . . . . . . . 6-3
When to use HMI tags . . . . . . . . . . . . . . . . . . . . . . . . . . . . . . . . . . . . . . . . . . . . . . . 6-4
Scaling, offsetting, or providing a range for data . . . . . . . . . . . . . . . . . . . . . . . 6-4
Storing values in RSView memory . . . . . . . . . . . . . . . . . . . . . . . . . . . . . . . . . 6-4
iii
• • • • •
Contents
• • • • •
RSVIEW MACHINE EDITION USER’S GUIDE
Steps for using HMI tags . . . . . . . . . . . . . . . . . . . . . . . . . . . . . . . . . . . . . . . . . . . . . 6-5
Browsing for tags . . . . . . . . . . . . . . . . . . . . . . . . . . . . . . . . . . . . . . . . . . . . . . . . . . . 6-5
Using the Tag Browser
. . . . . . . . . . . . . . . . . . . . . . . . . . . . . . . . . . . . . . . . . . . . 6-6
Showing server names . . . . . . . . . . . . . . . . . . . . . . . . . . . . . . . . . . . . . . . . . . . 6-7
Browsing for off-line tags . . . . . . . . . . . . . . . . . . . . . . . . . . . . . . . . . . . . . . . . . . . . 6-7
Using tags and expressions in your application . . . . . . . . . . . . . . . . . . . . . . . . . . . . 6-8
Assigning tags. . . . . . . . . . . . . . . . . . . . . . . . . . . . . . . . . . . . . . . . . . . . . . . . . . 6-9
Assigning tags to graphic objects . . . . . . . . . . . . . . . . . . . . . . . . . . . . . . . . . . . 6-9
Using expressions to manipulate tag values . . . . . . . . . . . . . . . . . . . . . . . . . . 6-11
Substituting tag names used in graphic objects . . . . . . . . . . . . . . . . . . . . . . . 6-11
Logging tag values . . . . . . . . . . . . . . . . . . . . . . . . . . . . . . . . . . . . . . . . . . . . . . . . . 6-12
Using macros to assign values to tags . . . . . . . . . . . . . . . . . . . . . . . . . . . . . . . . . . 6-12
7 • Using HMI tags
HMI tag types . . . . . . . . . . . . . . . . . . . . . . . . . . . . . . . . . . . . . . . . . . . . . . . . . . . . . . 7-1
Analog tags that use floating-point values . . . . . . . . . . . . . . . . . . . . . . . . . . . . 7-2
How values are rounded . . . . . . . . . . . . . . . . . . . . . . . . . . . . . . . . . . . . . . . . . . 7-2
Using the Tags editor . . . . . . . . . . . . . . . . . . . . . . . . . . . . . . . . . . . . . . . . . . . . . . . . 7-3
Updating the contents of the Tags editor . . . . . . . . . . . . . . . . . . . . . . . . . . . . . 7-4
Searching for HMI tags. . . . . . . . . . . . . . . . . . . . . . . . . . . . . . . . . . . . . . . . . . . 7-4
Data sources . . . . . . . . . . . . . . . . . . . . . . . . . . . . . . . . . . . . . . . . . . . . . . . . . . . . . . . 7-5
The data source . . . . . . . . . . . . . . . . . . . . . . . . . . . . . . . . . . . . . . . . . . . . . . . . . 7-5
Device . . . . . . . . . . . . . . . . . . . . . . . . . . . . . . . . . . . . . . . . . . . . . . . . . . . . . . . . 7-5
Memory. . . . . . . . . . . . . . . . . . . . . . . . . . . . . . . . . . . . . . . . . . . . . . . . . . . . . . . 7-5
Addressing syntax for device tags . . . . . . . . . . . . . . . . . . . . . . . . . . . . . . . . . . . . . . 7-5
Organizing HMI tags . . . . . . . . . . . . . . . . . . . . . . . . . . . . . . . . . . . . . . . . . . . . . . . . 7-7
Naming tags . . . . . . . . . . . . . . . . . . . . . . . . . . . . . . . . . . . . . . . . . . . . . . . . . . . 7-7
Using folders to group tags. . . . . . . . . . . . . . . . . . . . . . . . . . . . . . . . . . . . . . . . 7-7
Viewing tag statistics . . . . . . . . . . . . . . . . . . . . . . . . . . . . . . . . . . . . . . . . . . . . . . . . 7-8
Other methods for creating HMI tags. . . . . . . . . . . . . . . . . . . . . . . . . . . . . . . . . . . . 7-8
Creating tags as needed in other RSView editors. . . . . . . . . . . . . . . . . . . . . . . 7-8
Creating tags as needed in the Data Log Models editor . . . . . . . . . . . . . . . . . . 7-9
Importing tags from a PLC database . . . . . . . . . . . . . . . . . . . . . . . . . . . . . . . . . . . . 7-9
Using the Tag Import and Export Wizard . . . . . . . . . . . . . . . . . . . . . . . . . . . . . . . 7-11
8 • Setting up global connections
About global connections . . . . . . . . . . . . . . . . . . . . . . . . . . . . . . . . . . . . . . . . . . . . . 8-1
Setting up global connections. . . . . . . . . . . . . . . . . . . . . . . . . . . . . . . . . . . . . . . . . . 8-2
Changing displays . . . . . . . . . . . . . . . . . . . . . . . . . . . . . . . . . . . . . . . . . . . . . . . . . . 8-2
Printing displays . . . . . . . . . . . . . . . . . . . . . . . . . . . . . . . . . . . . . . . . . . . . . . . . . . . . 8-2
Updating the date and time. . . . . . . . . . . . . . . . . . . . . . . . . . . . . . . . . . . . . . . . . . . . 8-3
iv
Setting up backlight intensity remotely . . . . . . . . . . . . . . . . . . . . . . . . . . . . . . . . . . 8-4
Running macros . . . . . . . . . . . . . . . . . . . . . . . . . . . . . . . . . . . . . . . . . . . . . . . . . . . . 8-5
Controlling display changes remotely . . . . . . . . . . . . . . . . . . . . . . . . . . . . . . . . . . . 8-5
Remote display changes and security . . . . . . . . . . . . . . . . . . . . . . . . . . . . . . . . 8-6
Setting up remote display changes . . . . . . . . . . . . . . . . . . . . . . . . . . . . . . . . . . . . . . 8-6
9 • Setting up alarms
About alarms . . . . . . . . . . . . . . . . . . . . . . . . . . . . . . . . . . . . . . . . . . . . . . . . . . . . . . 9-1
Multiple language alarm messages . . . . . . . . . . . . . . . . . . . . . . . . . . . . . . . . . . 9-1
Other multiple language alarm features . . . . . . . . . . . . . . . . . . . . . . . . . . . . . . 9-2
Summary of steps . . . . . . . . . . . . . . . . . . . . . . . . . . . . . . . . . . . . . . . . . . . . . . . . . . . 9-2
Setting up alarms . . . . . . . . . . . . . . . . . . . . . . . . . . . . . . . . . . . . . . . . . . . . . . . 9-3
Preparing to set up alarms . . . . . . . . . . . . . . . . . . . . . . . . . . . . . . . . . . . . . . . . . . . . 9-3
The data source . . . . . . . . . . . . . . . . . . . . . . . . . . . . . . . . . . . . . . . . . . . . . . . . . 9-3
Tags and expressions . . . . . . . . . . . . . . . . . . . . . . . . . . . . . . . . . . . . . . . . . . . . 9-3
Identifying alarm conditions. . . . . . . . . . . . . . . . . . . . . . . . . . . . . . . . . . . . . . . 9-4
Importing and exporting alarm setup files . . . . . . . . . . . . . . . . . . . . . . . . . . . . 9-4
How alarms work . . . . . . . . . . . . . . . . . . . . . . . . . . . . . . . . . . . . . . . . . . . . . . . . . . . 9-4
Alarm triggers and trigger values . . . . . . . . . . . . . . . . . . . . . . . . . . . . . . . . . . . 9-4
Alarm notification methods . . . . . . . . . . . . . . . . . . . . . . . . . . . . . . . . . . . . . . . 9-5
Displaying alarm information. . . . . . . . . . . . . . . . . . . . . . . . . . . . . . . . . . . . . . 9-5
Interacting with alarms . . . . . . . . . . . . . . . . . . . . . . . . . . . . . . . . . . . . . . . . . . . 9-6
The alarm log file . . . . . . . . . . . . . . . . . . . . . . . . . . . . . . . . . . . . . . . . . . . . . . . 9-9
Alarm trigger data types . . . . . . . . . . . . . . . . . . . . . . . . . . . . . . . . . . . . . . . . . . . . . 9-10
The Value trigger type . . . . . . . . . . . . . . . . . . . . . . . . . . . . . . . . . . . . . . . . . . 9-10
The Bit trigger type. . . . . . . . . . . . . . . . . . . . . . . . . . . . . . . . . . . . . . . . . . . . . 9-11
The Least Significant Bit (LSBit) trigger type . . . . . . . . . . . . . . . . . . . . . . . . 9-12
Tips for using array tags . . . . . . . . . . . . . . . . . . . . . . . . . . . . . . . . . . . . . . . . . . . . . 9-14
Equivalent data types . . . . . . . . . . . . . . . . . . . . . . . . . . . . . . . . . . . . . . . . . . . 9-15
RSLinx Enterprise tag syntax . . . . . . . . . . . . . . . . . . . . . . . . . . . . . . . . . . . . . 9-15
KEPServerEnterprise tag syntax. . . . . . . . . . . . . . . . . . . . . . . . . . . . . . . . . . . 9-16
Creating alarm messages in multiple languages. . . . . . . . . . . . . . . . . . . . . . . . . . . 9-16
Optional alarm connections . . . . . . . . . . . . . . . . . . . . . . . . . . . . . . . . . . . . . . . . . . 9-17
Connections that work with a specific alarm trigger . . . . . . . . . . . . . . . . . . . . . . . 9-17
How the Handshake connection works. . . . . . . . . . . . . . . . . . . . . . . . . . . . . . 9-18
How the Ack connection works . . . . . . . . . . . . . . . . . . . . . . . . . . . . . . . . . . . 9-18
How the Remote Ack connection works . . . . . . . . . . . . . . . . . . . . . . . . . . . . 9-19
How the Remote Ack Handshake connection works . . . . . . . . . . . . . . . . . . . 9-20
Ensuring alarm messages are read by the data source before sending new
messages . . . . . . . . . . . . . . . . . . . . . . . . . . . . . . . . . . . . . . . . . . . . . . . . . . . . . . . 9-20
v
• • • • •
Contents
• • • • •
RSVIEW MACHINE EDITION USER’S GUIDE
Methods of alarm message handshaking . . . . . . . . . . . . . . . . . . . . . . . . . . . . 9-20
Holding the message for a specific period of time . . . . . . . . . . . . . . . . . . . . . 9-21
Holding the message until the data source acknowledges that it has read
the message . . . . . . . . . . . . . . . . . . . . . . . . . . . . . . . . . . . . . . . . . . . . . . . . . 9-21
How messages are queued . . . . . . . . . . . . . . . . . . . . . . . . . . . . . . . . . . . . . . . 9-22
How the Message connection works . . . . . . . . . . . . . . . . . . . . . . . . . . . . . . . 9-22
How the Message Notification connection works . . . . . . . . . . . . . . . . . . . . . 9-22
How the Message Handshake connection works . . . . . . . . . . . . . . . . . . . . . . 9-22
Connections that apply to all alarms . . . . . . . . . . . . . . . . . . . . . . . . . . . . . . . . . . . 9-23
How the Silence connection works. . . . . . . . . . . . . . . . . . . . . . . . . . . . . . . . . 9-23
How the Remote Silence connection works . . . . . . . . . . . . . . . . . . . . . . . . . . 9-23
How the Remote Ack All connection works . . . . . . . . . . . . . . . . . . . . . . . . . 9-24
How the Status Reset connection works. . . . . . . . . . . . . . . . . . . . . . . . . . . . . 9-24
How the Remote Status Reset connection works . . . . . . . . . . . . . . . . . . . . . . 9-24
How the Close Display connection works . . . . . . . . . . . . . . . . . . . . . . . . . . . 9-24
How the Remote Close Display connection works . . . . . . . . . . . . . . . . . . . . 9-24
The [ALARM] display . . . . . . . . . . . . . . . . . . . . . . . . . . . . . . . . . . . . . . . . . . . . . . 9-25
The [ALARM BANNER] display . . . . . . . . . . . . . . . . . . . . . . . . . . . . . . . . . . . . . 9-26
The [ALARM MULTI-LINE] display . . . . . . . . . . . . . . . . . . . . . . . . . . . . . . . . . . 9-26
The [STATUS] display . . . . . . . . . . . . . . . . . . . . . . . . . . . . . . . . . . . . . . . . . . . . . 9-27
The [HISTORY] display . . . . . . . . . . . . . . . . . . . . . . . . . . . . . . . . . . . . . . . . . . . . 9-28
Using displays from the library in your application. . . . . . . . . . . . . . . . . . . . . . . . 9-30
Creating your own alarm display . . . . . . . . . . . . . . . . . . . . . . . . . . . . . . . . . . . . . . 9-30
Opening and closing the alarm display . . . . . . . . . . . . . . . . . . . . . . . . . . . . . . . . . 9-31
Opening the display . . . . . . . . . . . . . . . . . . . . . . . . . . . . . . . . . . . . . . . . . . . . 9-31
Closing the display . . . . . . . . . . . . . . . . . . . . . . . . . . . . . . . . . . . . . . . . . . . . . 9-31
How the alarm list graphic object works . . . . . . . . . . . . . . . . . . . . . . . . . . . . . . . . 9-31
What is displayed . . . . . . . . . . . . . . . . . . . . . . . . . . . . . . . . . . . . . . . . . . . . . . 9-32
How the list scrolls . . . . . . . . . . . . . . . . . . . . . . . . . . . . . . . . . . . . . . . . . . . . . 9-33
How the alarm banner graphic object works . . . . . . . . . . . . . . . . . . . . . . . . . . . . . 9-33
What is displayed . . . . . . . . . . . . . . . . . . . . . . . . . . . . . . . . . . . . . . . . . . . . . . 9-33
How the alarm status list graphic object works . . . . . . . . . . . . . . . . . . . . . . . . . . . 9-34
What is displayed . . . . . . . . . . . . . . . . . . . . . . . . . . . . . . . . . . . . . . . . . . . . . . 9-34
What happens when the display is opened . . . . . . . . . . . . . . . . . . . . . . . . . . . 9-35
Using buttons with the alarm history and alarm objects . . . . . . . . . . . . . . . . . . . . 9-35
Alarm buttons . . . . . . . . . . . . . . . . . . . . . . . . . . . . . . . . . . . . . . . . . . . . . . . . . 9-35
Linking buttons to objects. . . . . . . . . . . . . . . . . . . . . . . . . . . . . . . . . . . . . . . . 9-37
Key buttons . . . . . . . . . . . . . . . . . . . . . . . . . . . . . . . . . . . . . . . . . . . . . . . . . . . 9-37
Using alarm buttons to acknowledge, silence, clear, and delete alarms . . . . . . . . 9-37
Acknowledging the selected alarm . . . . . . . . . . . . . . . . . . . . . . . . . . . . . . . . . 9-38
Acknowledging all alarms . . . . . . . . . . . . . . . . . . . . . . . . . . . . . . . . . . . . . . . 9-38
Silencing alarms . . . . . . . . . . . . . . . . . . . . . . . . . . . . . . . . . . . . . . . . . . . . . . . 9-39
vi
Clearing and deleting messages . . . . . . . . . . . . . . . . . . . . . . . . . . . . . . . . . . . 9-39
Using alarm buttons to sort alarms and reset alarm status . . . . . . . . . . . . . . . . . . . 9-39
Sorting alarms . . . . . . . . . . . . . . . . . . . . . . . . . . . . . . . . . . . . . . . . . . . . . . . . . 9-39
Resetting alarm status . . . . . . . . . . . . . . . . . . . . . . . . . . . . . . . . . . . . . . . . . . . 9-39
Retaining alarm status. . . . . . . . . . . . . . . . . . . . . . . . . . . . . . . . . . . . . . . . . . . 9-40
Changing the alarm status displayed in the alarm status list . . . . . . . . . . . . . 9-40
10 • Setting up FactoryTalk Diagnostics
About FactoryTalk Diagnostics . . . . . . . . . . . . . . . . . . . . . . . . . . . . . . . . . . . . . . . 10-1
Browsing diagnostics messages . . . . . . . . . . . . . . . . . . . . . . . . . . . . . . . . . . . 10-1
How to set up FactoryTalk Diagnostics . . . . . . . . . . . . . . . . . . . . . . . . . . . . . 10-1
Destinations . . . . . . . . . . . . . . . . . . . . . . . . . . . . . . . . . . . . . . . . . . . . . . . . . . 10-2
Message routing . . . . . . . . . . . . . . . . . . . . . . . . . . . . . . . . . . . . . . . . . . . . . . . 10-3
Categories . . . . . . . . . . . . . . . . . . . . . . . . . . . . . . . . . . . . . . . . . . . . . . . . . . . . 10-3
Message severities . . . . . . . . . . . . . . . . . . . . . . . . . . . . . . . . . . . . . . . . . . . . . 10-4
Audiences . . . . . . . . . . . . . . . . . . . . . . . . . . . . . . . . . . . . . . . . . . . . . . . . . . . . 10-4
Displaying diagnostics messages during application development . . . . . . . . . . . . 10-5
Viewing FactoryTalk Diagnostics log files . . . . . . . . . . . . . . . . . . . . . . . . . . . . . . 10-5
Using the Diagnostics Setup tool . . . . . . . . . . . . . . . . . . . . . . . . . . . . . . . . . . . . . . 10-6
Logging to an ODBC database . . . . . . . . . . . . . . . . . . . . . . . . . . . . . . . . . . . . 10-7
Routing messages . . . . . . . . . . . . . . . . . . . . . . . . . . . . . . . . . . . . . . . . . . . . . . 10-8
Receiving messages from a PanelView Plus or VersaView CE terminal . . . 10-8
Displaying and printing diagnostics messages at runtime . . . . . . . . . . . . . . . . . . . 10-8
Using the Diagnostics List Setup editor . . . . . . . . . . . . . . . . . . . . . . . . . . . . . 10-8
Setting up how messages are displayed and printed at runtime . . . . . . . . . . 10-10
The [DIAGNOSTICS] display . . . . . . . . . . . . . . . . . . . . . . . . . . . . . . . . . . . . . . . 10-10
Creating your own diagnostics display . . . . . . . . . . . . . . . . . . . . . . . . . . . . . . . . 10-11
Opening and closing the diagnostics display . . . . . . . . . . . . . . . . . . . . . . . . . . . . 10-11
Opening the display . . . . . . . . . . . . . . . . . . . . . . . . . . . . . . . . . . . . . . . . . . . 10-11
Closing the display . . . . . . . . . . . . . . . . . . . . . . . . . . . . . . . . . . . . . . . . . . . . 10-11
How the diagnostics list graphic object works . . . . . . . . . . . . . . . . . . . . . . . . . . . 10-11
What is displayed . . . . . . . . . . . . . . . . . . . . . . . . . . . . . . . . . . . . . . . . . . . . . 10-12
Using buttons with the diagnostics list . . . . . . . . . . . . . . . . . . . . . . . . . . . . . 10-12
11 • Setting up data logging
Summary of steps . . . . . . . . . . . . . . . . . . . . . . . . . . . . . . . . . . . . . . . . . . . . . . . . . . 11-1
Data log files . . . . . . . . . . . . . . . . . . . . . . . . . . . . . . . . . . . . . . . . . . . . . . . . . . . . . 11-1
Data Log Models . . . . . . . . . . . . . . . . . . . . . . . . . . . . . . . . . . . . . . . . . . . . . . . . . . 11-2
Creating Data Log Models . . . . . . . . . . . . . . . . . . . . . . . . . . . . . . . . . . . . . . . 11-3
Data storage locations. . . . . . . . . . . . . . . . . . . . . . . . . . . . . . . . . . . . . . . . . . . 11-3
Data logging methods . . . . . . . . . . . . . . . . . . . . . . . . . . . . . . . . . . . . . . . . . . . 11-4
vii
• • • • •
Contents
• • • • •
RSVIEW MACHINE EDITION USER’S GUIDE
Tags in the data log model . . . . . . . . . . . . . . . . . . . . . . . . . . . . . . . . . . . . . . . 11-5
Changing the data log model used at runtime . . . . . . . . . . . . . . . . . . . . . . . . . . . . 11-5
Displaying data logs using the trend graphic object. . . . . . . . . . . . . . . . . . . . . . . . 11-5
Problems with data logging . . . . . . . . . . . . . . . . . . . . . . . . . . . . . . . . . . . . . . . . . . 11-6
12 • Using information messages
About information messages . . . . . . . . . . . . . . . . . . . . . . . . . . . . . . . . . . . . . . . . . 12-1
Information messages versus local messages . . . . . . . . . . . . . . . . . . . . . . . . . 12-1
Summary of steps . . . . . . . . . . . . . . . . . . . . . . . . . . . . . . . . . . . . . . . . . . . . . . . . . . 12-1
Using the Information Messages editor . . . . . . . . . . . . . . . . . . . . . . . . . . . . . . . . . 12-2
Setting up how information messages are displayed . . . . . . . . . . . . . . . . . . . . . . . 12-3
Preparing to set up information messages . . . . . . . . . . . . . . . . . . . . . . . . . . . . . . . 12-3
The data source . . . . . . . . . . . . . . . . . . . . . . . . . . . . . . . . . . . . . . . . . . . . . . . . 12-3
Identifying the tags and values to monitor . . . . . . . . . . . . . . . . . . . . . . . . . . . 12-3
How information messages work . . . . . . . . . . . . . . . . . . . . . . . . . . . . . . . . . . . . . . 12-4
Information messages and trigger values . . . . . . . . . . . . . . . . . . . . . . . . . . . . 12-5
Creating information messages in multiple languages. . . . . . . . . . . . . . . . . . . . . . 12-5
The [INFORMATION] display . . . . . . . . . . . . . . . . . . . . . . . . . . . . . . . . . . . . . . . 12-6
Creating your own information message display . . . . . . . . . . . . . . . . . . . . . . . . . . 12-7
Opening and closing the information message display . . . . . . . . . . . . . . . . . . . . . 12-7
Opening the display . . . . . . . . . . . . . . . . . . . . . . . . . . . . . . . . . . . . . . . . . . . . 12-7
Closing the display . . . . . . . . . . . . . . . . . . . . . . . . . . . . . . . . . . . . . . . . . . . . . 12-8
How the information message display graphic object works. . . . . . . . . . . . . . . . . 12-8
What is displayed . . . . . . . . . . . . . . . . . . . . . . . . . . . . . . . . . . . . . . . . . . . . . . 12-8
Changing the message file used at runtime . . . . . . . . . . . . . . . . . . . . . . . . . . . . . . 12-8
13 • Setting up security
Using security with your application . . . . . . . . . . . . . . . . . . . . . . . . . . . . . . . . . . . 13-1
If you don’t want to use RSAssetSecurity . . . . . . . . . . . . . . . . . . . . . . . . . . . . . . . 13-2
If you don’t use RSView user accounts . . . . . . . . . . . . . . . . . . . . . . . . . . . . . 13-2
If you use RSView user accounts . . . . . . . . . . . . . . . . . . . . . . . . . . . . . . . . . . 13-3
Working with the User Accounts editor. . . . . . . . . . . . . . . . . . . . . . . . . . . . . . . . . 13-3
The DEFAULT user . . . . . . . . . . . . . . . . . . . . . . . . . . . . . . . . . . . . . . . . . . . . 13-3
Setting up users for 4.0 applications. . . . . . . . . . . . . . . . . . . . . . . . . . . . . . . . 13-4
Setting up users for 3.x applications. . . . . . . . . . . . . . . . . . . . . . . . . . . . . . . . 13-6
Changing RSView 3.x user passwords . . . . . . . . . . . . . . . . . . . . . . . . . . . . . . 13-7
Adding 3.x users or groups from a Windows domain . . . . . . . . . . . . . . . . . . 13-7
Removing 3.x users or groups . . . . . . . . . . . . . . . . . . . . . . . . . . . . . . . . . . . . 13-8
How user accounts and security codes work . . . . . . . . . . . . . . . . . . . . . . . . . . . . . 13-9
Assigning security to graphic displays . . . . . . . . . . . . . . . . . . . . . . . . . . . . . . . . . . 13-9
Providing a way for users to log in and log out . . . . . . . . . . . . . . . . . . . . . . . . . . 13-13
viii
Logging in. . . . . . . . . . . . . . . . . . . . . . . . . . . . . . . . . . . . . . . . . . . . . . . . . . . 13-14
Logging out. . . . . . . . . . . . . . . . . . . . . . . . . . . . . . . . . . . . . . . . . . . . . . . . . . 13-14
Logging out automatically . . . . . . . . . . . . . . . . . . . . . . . . . . . . . . . . . . . . . . 13-14
Preventing unauthorized users from stopping the application . . . . . . . . . . . . . . . 13-15
To prevent unauthorized users from stopping the application . . . . . . . . . . . 13-15
Additional step for Windows 2000 and Windows XP applications . . . . . . . 13-15
Additional step for VersaView® CE applications . . . . . . . . . . . . . . . . . . . . 13-15
Setting up RSAssetSecurity for your application. . . . . . . . . . . . . . . . . . . . . . . . . 13-16
Creating RSAssetSecurity users . . . . . . . . . . . . . . . . . . . . . . . . . . . . . . . . . . 13-17
Creating RSAssetSecurity user groups . . . . . . . . . . . . . . . . . . . . . . . . . . . . . 13-19
Setting up security access to the FactoryTalk Directory . . . . . . . . . . . . . . . 13-19
Setting up security access to the application . . . . . . . . . . . . . . . . . . . . . . . . 13-20
Setting up security access to System policies, groups, and users . . . . . . . . . 13-20
Setting up security access to networks and devices . . . . . . . . . . . . . . . . . . . 13-20
Specifying which users can back up and restore FactoryTalk Directory
and RSView applications . . . . . . . . . . . . . . . . . . . . . . . . . . . . . . . . . . . . . 13-21
Specifying activities to track for audit purposes. . . . . . . . . . . . . . . . . . . . . . 13-21
Specifying policies for passwords, accounts, and FactoryTalk sign-on . . . . 13-21
Summary of steps . . . . . . . . . . . . . . . . . . . . . . . . . . . . . . . . . . . . . . . . . . . . . . . . . 13-22
Summary of security features in a sample startup display . . . . . . . . . . . . . . . . . . 13-22
14 • Using graphic displays
About graphic displays and graphic objects. . . . . . . . . . . . . . . . . . . . . . . . . . . . . . 14-1
Before you begin . . . . . . . . . . . . . . . . . . . . . . . . . . . . . . . . . . . . . . . . . . . . . . . . . . 14-2
Using the Graphics editor. . . . . . . . . . . . . . . . . . . . . . . . . . . . . . . . . . . . . . . . . . . . 14-2
Creating and opening graphic displays. . . . . . . . . . . . . . . . . . . . . . . . . . . . . . 14-3
Importing and exporting graphic displays . . . . . . . . . . . . . . . . . . . . . . . . . . . 14-4
Tools and tips for working in the Graphics editor . . . . . . . . . . . . . . . . . . . . . . . . . 14-5
Using context menus. . . . . . . . . . . . . . . . . . . . . . . . . . . . . . . . . . . . . . . . . . . . 14-5
Using the toolbars . . . . . . . . . . . . . . . . . . . . . . . . . . . . . . . . . . . . . . . . . . . . . . 14-7
Showing displays in grayscale . . . . . . . . . . . . . . . . . . . . . . . . . . . . . . . . . . . . 14-8
Using the grid . . . . . . . . . . . . . . . . . . . . . . . . . . . . . . . . . . . . . . . . . . . . . . . . . 14-8
Zooming in and out. . . . . . . . . . . . . . . . . . . . . . . . . . . . . . . . . . . . . . . . . . . . . 14-9
Correcting mistakes . . . . . . . . . . . . . . . . . . . . . . . . . . . . . . . . . . . . . . . . . . . 14-10
Testing your displays as you work . . . . . . . . . . . . . . . . . . . . . . . . . . . . . . . . 14-10
Setting up graphic displays. . . . . . . . . . . . . . . . . . . . . . . . . . . . . . . . . . . . . . . . . . 14-11
Specifying display settings . . . . . . . . . . . . . . . . . . . . . . . . . . . . . . . . . . . . . . 14-11
About display types . . . . . . . . . . . . . . . . . . . . . . . . . . . . . . . . . . . . . . . . . . . 14-12
Resizing displays . . . . . . . . . . . . . . . . . . . . . . . . . . . . . . . . . . . . . . . . . . . . . 14-13
Creating a background for your display . . . . . . . . . . . . . . . . . . . . . . . . . . . . . . . . 14-13
Using global object displays. . . . . . . . . . . . . . . . . . . . . . . . . . . . . . . . . . . . . . . . . 14-14
ix
• • • • •
Contents
• • • • •
RSVIEW MACHINE EDITION USER’S GUIDE
Creating global object displays. . . . . . . . . . . . . . . . . . . . . . . . . . . . . . . . . . . 14-14
Using graphic libraries . . . . . . . . . . . . . . . . . . . . . . . . . . . . . . . . . . . . . . . . . . . . . 14-15
Creating graphic libraries . . . . . . . . . . . . . . . . . . . . . . . . . . . . . . . . . . . . . . . 14-16
Using libraries as displays in your application . . . . . . . . . . . . . . . . . . . . . . . 14-17
Using libraries to store displays with multiple languages . . . . . . . . . . . . . . 14-17
Location of library components . . . . . . . . . . . . . . . . . . . . . . . . . . . . . . . . . . 14-19
Importing images into your application . . . . . . . . . . . . . . . . . . . . . . . . . . . . . . . . 14-20
Bitmap images that come with RSView Studio . . . . . . . . . . . . . . . . . . . . . . 14-21
Importing bitmap and JPEG images . . . . . . . . . . . . . . . . . . . . . . . . . . . . . . . 14-21
Using the Image Browser to import images . . . . . . . . . . . . . . . . . . . . . . . . . 14-23
Tips for using images . . . . . . . . . . . . . . . . . . . . . . . . . . . . . . . . . . . . . . . . . . 14-24
Using parameter files . . . . . . . . . . . . . . . . . . . . . . . . . . . . . . . . . . . . . . . . . . . . . . 14-25
About tag placeholders . . . . . . . . . . . . . . . . . . . . . . . . . . . . . . . . . . . . . . . . . 14-25
Summary of steps . . . . . . . . . . . . . . . . . . . . . . . . . . . . . . . . . . . . . . . . . . . . . . . . . 14-26
Using the Parameters editor . . . . . . . . . . . . . . . . . . . . . . . . . . . . . . . . . . . . . 14-26
Assigning parameter files to graphic displays . . . . . . . . . . . . . . . . . . . . . . . 14-27
Using local messages . . . . . . . . . . . . . . . . . . . . . . . . . . . . . . . . . . . . . . . . . . . . . . 14-29
Local messages versus information messages . . . . . . . . . . . . . . . . . . . . . . . 14-29
Summary of steps . . . . . . . . . . . . . . . . . . . . . . . . . . . . . . . . . . . . . . . . . . . . . 14-29
Using the Local Messages editor . . . . . . . . . . . . . . . . . . . . . . . . . . . . . . . . . 14-30
Preparing to set up local messages . . . . . . . . . . . . . . . . . . . . . . . . . . . . . . . . 14-30
How local messages work. . . . . . . . . . . . . . . . . . . . . . . . . . . . . . . . . . . . . . . 14-31
Local messages and trigger values . . . . . . . . . . . . . . . . . . . . . . . . . . . . . . . . 14-32
Creating local messages in multiple languages . . . . . . . . . . . . . . . . . . . . . . 14-33
How the local message display graphic object works . . . . . . . . . . . . . . . . . 14-33
Printing displays . . . . . . . . . . . . . . . . . . . . . . . . . . . . . . . . . . . . . . . . . . . . . . . . . . 14-34
Printing displays at runtime . . . . . . . . . . . . . . . . . . . . . . . . . . . . . . . . . . . . . 14-34
15 • Using graphic objects
Types of graphic objects. . . . . . . . . . . . . . . . . . . . . . . . . . . . . . . . . . . . . . . . . . . . . 15-1
About connections . . . . . . . . . . . . . . . . . . . . . . . . . . . . . . . . . . . . . . . . . . . . . 15-2
Illustrating your displays . . . . . . . . . . . . . . . . . . . . . . . . . . . . . . . . . . . . . . . . . . . . 15-3
Controlling the application . . . . . . . . . . . . . . . . . . . . . . . . . . . . . . . . . . . . . . . . . . . 15-3
Starting and controlling processes . . . . . . . . . . . . . . . . . . . . . . . . . . . . . . . . . . . . . 15-5
Displaying processes and values graphically . . . . . . . . . . . . . . . . . . . . . . . . . . . . . 15-6
Working with lists, trends, alarm banners, and numeric input objects . . . . . . . . . 15-8
Entering and displaying numeric and string values . . . . . . . . . . . . . . . . . . . . . . . 15-10
Displaying alarms and messages . . . . . . . . . . . . . . . . . . . . . . . . . . . . . . . . . . . . . 15-10
Selecting tools for creating graphic objects . . . . . . . . . . . . . . . . . . . . . . . . . . . . . 15-11
Before you begin creating objects . . . . . . . . . . . . . . . . . . . . . . . . . . . . . . . . . . . . 15-13
Creating graphic objects . . . . . . . . . . . . . . . . . . . . . . . . . . . . . . . . . . . . . . . . . . . . 15-13
x
Creating drawing objects . . . . . . . . . . . . . . . . . . . . . . . . . . . . . . . . . . . . . . . . . . . 15-13
Creating text . . . . . . . . . . . . . . . . . . . . . . . . . . . . . . . . . . . . . . . . . . . . . . . . . 15-14
Creating images . . . . . . . . . . . . . . . . . . . . . . . . . . . . . . . . . . . . . . . . . . . . . . 15-15
Creating panels . . . . . . . . . . . . . . . . . . . . . . . . . . . . . . . . . . . . . . . . . . . . . . . 15-17
Creating arcs and wedges . . . . . . . . . . . . . . . . . . . . . . . . . . . . . . . . . . . . . . . 15-17
Creating ellipses and circles . . . . . . . . . . . . . . . . . . . . . . . . . . . . . . . . . . . . . 15-18
Creating freehand shapes . . . . . . . . . . . . . . . . . . . . . . . . . . . . . . . . . . . . . . . 15-18
Creating lines . . . . . . . . . . . . . . . . . . . . . . . . . . . . . . . . . . . . . . . . . . . . . . . . 15-19
Creating polygons and polylines. . . . . . . . . . . . . . . . . . . . . . . . . . . . . . . . . . 15-19
Creating rectangles and squares . . . . . . . . . . . . . . . . . . . . . . . . . . . . . . . . . . 15-20
Creating rounded rectangles and squares . . . . . . . . . . . . . . . . . . . . . . . . . . . 15-21
Using .wmf and .dxf files . . . . . . . . . . . . . . . . . . . . . . . . . . . . . . . . . . . . . . . 15-21
Using ActiveX objects . . . . . . . . . . . . . . . . . . . . . . . . . . . . . . . . . . . . . . . . . 15-22
Creating reference objects . . . . . . . . . . . . . . . . . . . . . . . . . . . . . . . . . . . . . . . . . . 15-24
Tools and tips for working with objects . . . . . . . . . . . . . . . . . . . . . . . . . . . . . . . . 15-25
Selecting and deselecting objects . . . . . . . . . . . . . . . . . . . . . . . . . . . . . . . . . 15-25
Using the Object Explorer . . . . . . . . . . . . . . . . . . . . . . . . . . . . . . . . . . . . . . 15-26
Highlighting objects in the Object Explorer . . . . . . . . . . . . . . . . . . . . . . . . . 15-27
Using the Properties dialog box . . . . . . . . . . . . . . . . . . . . . . . . . . . . . . . . . . 15-28
Using the Property Panel . . . . . . . . . . . . . . . . . . . . . . . . . . . . . . . . . . . . . . . 15-31
Setting up properties . . . . . . . . . . . . . . . . . . . . . . . . . . . . . . . . . . . . . . . . . . . 15-32
Assigning tags and expressions to an object’s connections . . . . . . . . . . . . . 15-33
Coloring objects using the color toolbars . . . . . . . . . . . . . . . . . . . . . . . . . . . 15-34
Naming objects . . . . . . . . . . . . . . . . . . . . . . . . . . . . . . . . . . . . . . . . . . . . . . . 15-36
Testing how objects look in different states . . . . . . . . . . . . . . . . . . . . . . . . . 15-37
Assigning tags and expressions to graphic objects . . . . . . . . . . . . . . . . . . . . . . . 15-38
Assigning tags. . . . . . . . . . . . . . . . . . . . . . . . . . . . . . . . . . . . . . . . . . . . . . . . 15-38
Using expressions to manipulate tag values . . . . . . . . . . . . . . . . . . . . . . . . . 15-40
Replacing tags using tag substitution . . . . . . . . . . . . . . . . . . . . . . . . . . . . . . 15-40
Using tag placeholders . . . . . . . . . . . . . . . . . . . . . . . . . . . . . . . . . . . . . . . . . 15-41
Performing basic operations on objects . . . . . . . . . . . . . . . . . . . . . . . . . . . . . . . . 15-42
Moving objects . . . . . . . . . . . . . . . . . . . . . . . . . . . . . . . . . . . . . . . . . . . . . . . 15-43
Copying objects . . . . . . . . . . . . . . . . . . . . . . . . . . . . . . . . . . . . . . . . . . . . . . 15-44
Duplicating objects . . . . . . . . . . . . . . . . . . . . . . . . . . . . . . . . . . . . . . . . . . . . 15-45
Resizing objects . . . . . . . . . . . . . . . . . . . . . . . . . . . . . . . . . . . . . . . . . . . . . . 15-46
Reshaping drawing objects . . . . . . . . . . . . . . . . . . . . . . . . . . . . . . . . . . . . . . 15-47
Deleting objects . . . . . . . . . . . . . . . . . . . . . . . . . . . . . . . . . . . . . . . . . . . . . . 15-48
Working with groups of objects . . . . . . . . . . . . . . . . . . . . . . . . . . . . . . . . . . . . . . 15-49
Grouping and ungrouping objects. . . . . . . . . . . . . . . . . . . . . . . . . . . . . . . . . 15-49
Editing groups of objects . . . . . . . . . . . . . . . . . . . . . . . . . . . . . . . . . . . . . . . 15-50
Editing objects within a group . . . . . . . . . . . . . . . . . . . . . . . . . . . . . . . . . . . 15-50
Arranging objects . . . . . . . . . . . . . . . . . . . . . . . . . . . . . . . . . . . . . . . . . . . . . . . . . 15-51
xi
• • • • •
Contents
• • • • •
RSVIEW MACHINE EDITION USER’S GUIDE
Layering objects . . . . . . . . . . . . . . . . . . . . . . . . . . . . . . . . . . . . . . . . . . . . . . 15-51
Aligning objects . . . . . . . . . . . . . . . . . . . . . . . . . . . . . . . . . . . . . . . . . . . . . . 15-52
Spacing objects . . . . . . . . . . . . . . . . . . . . . . . . . . . . . . . . . . . . . . . . . . . . . . . 15-55
Flipping drawing objects . . . . . . . . . . . . . . . . . . . . . . . . . . . . . . . . . . . . . . . 15-56
Rotating drawing objects . . . . . . . . . . . . . . . . . . . . . . . . . . . . . . . . . . . . . . . 15-57
Locking objects into position . . . . . . . . . . . . . . . . . . . . . . . . . . . . . . . . . . . . 15-58
16 • Setting up graphic objects
Setting up objects’ spatial properties, names, and visibility . . . . . . . . . . . . . . . . . 16-1
Tips for setting up objects with states . . . . . . . . . . . . . . . . . . . . . . . . . . . . . . . . . . 16-2
Copying and pasting properties from one state to another . . . . . . . . . . . . . . . 16-3
Adding and removing states . . . . . . . . . . . . . . . . . . . . . . . . . . . . . . . . . . . . . . 16-3
Setting up reference objects’ link properties . . . . . . . . . . . . . . . . . . . . . . . . . . . . . 16-3
Deleting the base object . . . . . . . . . . . . . . . . . . . . . . . . . . . . . . . . . . . . . . . . . 16-5
Setting up how objects are used at runtime . . . . . . . . . . . . . . . . . . . . . . . . . . . . . . 16-5
Positioning objects for touch screens . . . . . . . . . . . . . . . . . . . . . . . . . . . . . . . . . . . 16-5
Using touch margins . . . . . . . . . . . . . . . . . . . . . . . . . . . . . . . . . . . . . . . . . . . . 16-6
Assigning function keys to buttons . . . . . . . . . . . . . . . . . . . . . . . . . . . . . . . . . . . . 16-7
Function key equivalents . . . . . . . . . . . . . . . . . . . . . . . . . . . . . . . . . . . . . . . . 16-7
Using the keyboard to navigate to and select objects. . . . . . . . . . . . . . . . . . . . . . . 16-9
What input focus looks like . . . . . . . . . . . . . . . . . . . . . . . . . . . . . . . . . . . . . . 16-9
Using the keys on the keyboard or keypad . . . . . . . . . . . . . . . . . . . . . . . . . . 16-10
Removing objects from and adding objects to the tab sequence . . . . . . . . . 16-10
Linking buttons to objects . . . . . . . . . . . . . . . . . . . . . . . . . . . . . . . . . . . . . . . . . . 16-10
Repeating a button’s action by holding down the button . . . . . . . . . . . . . . . . . . . 16-13
Ensuring values are read by the data source before sending new values . . . . . . . 16-14
Methods of Enter key handshaking . . . . . . . . . . . . . . . . . . . . . . . . . . . . . . . 16-14
Holding the value for a specific period of time . . . . . . . . . . . . . . . . . . . . . . 16-15
Holding the value until the data source acknowledges that it has read
the value . . . . . . . . . . . . . . . . . . . . . . . . . . . . . . . . . . . . . . . . . . . . . . . . . . 16-15
Time, date, and number formats for graphic objects . . . . . . . . . . . . . . . . . . . . . . 16-17
Setting up buttons . . . . . . . . . . . . . . . . . . . . . . . . . . . . . . . . . . . . . . . . . . . . . . . . . 16-17
Buttons described later in the chapter. . . . . . . . . . . . . . . . . . . . . . . . . . . . . . 16-19
How to use push buttons . . . . . . . . . . . . . . . . . . . . . . . . . . . . . . . . . . . . . . . . . . . 16-20
Setting up momentary push buttons . . . . . . . . . . . . . . . . . . . . . . . . . . . . . . . . . . . 16-21
Setting up maintained push buttons . . . . . . . . . . . . . . . . . . . . . . . . . . . . . . . . . . . 16-22
Setting up latched push buttons . . . . . . . . . . . . . . . . . . . . . . . . . . . . . . . . . . . . . . 16-24
Setting up multistate push buttons . . . . . . . . . . . . . . . . . . . . . . . . . . . . . . . . . . . . 16-25
Setting up interlocked push buttons . . . . . . . . . . . . . . . . . . . . . . . . . . . . . . . . . . . 16-27
Setting up ramp buttons . . . . . . . . . . . . . . . . . . . . . . . . . . . . . . . . . . . . . . . . . . . . 16-28
Setting up numeric displays . . . . . . . . . . . . . . . . . . . . . . . . . . . . . . . . . . . . . . . . . 16-29
xii
How values are displayed . . . . . . . . . . . . . . . . . . . . . . . . . . . . . . . . . . . . . . . 16-30
Problems with displaying values . . . . . . . . . . . . . . . . . . . . . . . . . . . . . . . . . 16-30
Setting up numeric input enable buttons . . . . . . . . . . . . . . . . . . . . . . . . . . . . . . . 16-31
Setting up numeric input cursor points. . . . . . . . . . . . . . . . . . . . . . . . . . . . . . . . . 16-33
Setting up string displays . . . . . . . . . . . . . . . . . . . . . . . . . . . . . . . . . . . . . . . . . . . 16-34
How values are displayed . . . . . . . . . . . . . . . . . . . . . . . . . . . . . . . . . . . . . . . 16-34
Setting up string input enable buttons . . . . . . . . . . . . . . . . . . . . . . . . . . . . . . . . . 16-35
Setting up goto display buttons . . . . . . . . . . . . . . . . . . . . . . . . . . . . . . . . . . . . . . 16-36
Setting up close display buttons . . . . . . . . . . . . . . . . . . . . . . . . . . . . . . . . . . . . . . 16-37
Setting up display list selectors . . . . . . . . . . . . . . . . . . . . . . . . . . . . . . . . . . . . . . 16-38
How to use indicators . . . . . . . . . . . . . . . . . . . . . . . . . . . . . . . . . . . . . . . . . . . . . . 16-39
Setting up multistate indicators . . . . . . . . . . . . . . . . . . . . . . . . . . . . . . . . . . . . . . 16-40
Setting up symbols . . . . . . . . . . . . . . . . . . . . . . . . . . . . . . . . . . . . . . . . . . . . . . . . 16-41
Setting up list indicators . . . . . . . . . . . . . . . . . . . . . . . . . . . . . . . . . . . . . . . . . . . . 16-43
How to use bar graphs, gauges, and scales. . . . . . . . . . . . . . . . . . . . . . . . . . . . . . 16-44
Bar graphs make it easy to compare values . . . . . . . . . . . . . . . . . . . . . . . . . 16-44
Thresholds change a bar graph’s fill color . . . . . . . . . . . . . . . . . . . . . . . . . . 16-44
Use bar graphs with scales to show limits . . . . . . . . . . . . . . . . . . . . . . . . . . 16-45
Gauges make it easy to see limits . . . . . . . . . . . . . . . . . . . . . . . . . . . . . . . . . 16-45
Thresholds change a gauge’s fill color . . . . . . . . . . . . . . . . . . . . . . . . . . . . . 16-45
Setting up bar graphs . . . . . . . . . . . . . . . . . . . . . . . . . . . . . . . . . . . . . . . . . . . . . . 16-46
Setting up gauges . . . . . . . . . . . . . . . . . . . . . . . . . . . . . . . . . . . . . . . . . . . . . . . . . 16-47
Setting up scales . . . . . . . . . . . . . . . . . . . . . . . . . . . . . . . . . . . . . . . . . . . . . . . . . . 16-48
Setting up control list selectors . . . . . . . . . . . . . . . . . . . . . . . . . . . . . . . . . . . . . . 16-48
Using buttons with the control list selector . . . . . . . . . . . . . . . . . . . . . . . . . 16-49
How Enter key handshaking works . . . . . . . . . . . . . . . . . . . . . . . . . . . . . . . 16-49
Setting up piloted control list selectors . . . . . . . . . . . . . . . . . . . . . . . . . . . . . . . . 16-51
Choosing between piloted control list selectors and control list selectors . . 16-51
How piloted control list selectors work at runtime. . . . . . . . . . . . . . . . . . . . 16-51
Setting up local message displays . . . . . . . . . . . . . . . . . . . . . . . . . . . . . . . . . . . . 16-54
Setting up macro buttons . . . . . . . . . . . . . . . . . . . . . . . . . . . . . . . . . . . . . . . . . . . 16-55
Setting up time and date displays . . . . . . . . . . . . . . . . . . . . . . . . . . . . . . . . . . . . . 16-56
Setting up print alarm history buttons . . . . . . . . . . . . . . . . . . . . . . . . . . . . . . . . . 16-57
Setting up print alarm status buttons . . . . . . . . . . . . . . . . . . . . . . . . . . . . . . . . . . 16-57
Setting up alarm lists . . . . . . . . . . . . . . . . . . . . . . . . . . . . . . . . . . . . . . . . . . . . . . 16-58
Setting up alarm banners . . . . . . . . . . . . . . . . . . . . . . . . . . . . . . . . . . . . . . . . . . . 16-60
Setting up alarm status lists . . . . . . . . . . . . . . . . . . . . . . . . . . . . . . . . . . . . . . . . . 16-61
Setting up diagnostics lists . . . . . . . . . . . . . . . . . . . . . . . . . . . . . . . . . . . . . . . . . . 16-62
Setting up information message displays . . . . . . . . . . . . . . . . . . . . . . . . . . . . . . . 16-64
xiii
• • • • •
Contents
• • • • •
RSVIEW MACHINE EDITION USER’S GUIDE
17 • Animating graphic objects
Types of animation . . . . . . . . . . . . . . . . . . . . . . . . . . . . . . . . . . . . . . . . . . . . . . . . . 17-1
Which objects can have which types of animation? . . . . . . . . . . . . . . . . . . . . 17-2
Using the Animation dialog box . . . . . . . . . . . . . . . . . . . . . . . . . . . . . . . . . . . . . . 17-2
About the Animation dialog box . . . . . . . . . . . . . . . . . . . . . . . . . . . . . . . . . . 17-4
Using Object Smart Path to visually set animation . . . . . . . . . . . . . . . . . . . . 17-4
Testing animation . . . . . . . . . . . . . . . . . . . . . . . . . . . . . . . . . . . . . . . . . . . . . . . . . . 17-5
Using tag names and tag placeholders . . . . . . . . . . . . . . . . . . . . . . . . . . . . . . . . . . 17-5
Tag names . . . . . . . . . . . . . . . . . . . . . . . . . . . . . . . . . . . . . . . . . . . . . . . . . . . . 17-5
Tag placeholders . . . . . . . . . . . . . . . . . . . . . . . . . . . . . . . . . . . . . . . . . . . . . . . 17-5
Using expressions. . . . . . . . . . . . . . . . . . . . . . . . . . . . . . . . . . . . . . . . . . . . . . . . . . 17-6
Setting minimum and maximum values . . . . . . . . . . . . . . . . . . . . . . . . . . . . . . . . . 17-6
Defining a range of motion . . . . . . . . . . . . . . . . . . . . . . . . . . . . . . . . . . . . . . . . . . 17-6
Animation that does not use a range of motion . . . . . . . . . . . . . . . . . . . . . . . 17-7
Using Object Smart Path. . . . . . . . . . . . . . . . . . . . . . . . . . . . . . . . . . . . . . . . . 17-7
Setting up the different types of animation . . . . . . . . . . . . . . . . . . . . . . . . . . . . . . 17-8
Setting up visibility animation . . . . . . . . . . . . . . . . . . . . . . . . . . . . . . . . . . . . 17-8
Setting up color animation . . . . . . . . . . . . . . . . . . . . . . . . . . . . . . . . . . . . . . . 17-9
Setting up fill animation . . . . . . . . . . . . . . . . . . . . . . . . . . . . . . . . . . . . . . . . 17-12
Setting up horizontal position animation . . . . . . . . . . . . . . . . . . . . . . . . . . . 17-12
Setting up vertical position animation . . . . . . . . . . . . . . . . . . . . . . . . . . . . . 17-12
Setting up width animation . . . . . . . . . . . . . . . . . . . . . . . . . . . . . . . . . . . . . . 17-13
Setting up height animation . . . . . . . . . . . . . . . . . . . . . . . . . . . . . . . . . . . . . 17-13
Setting up rotation animation . . . . . . . . . . . . . . . . . . . . . . . . . . . . . . . . . . . . 17-13
Setting up horizontal slider animation . . . . . . . . . . . . . . . . . . . . . . . . . . . . . 17-13
Setting up vertical slider animation . . . . . . . . . . . . . . . . . . . . . . . . . . . . . . . 17-14
Applying animation to groups . . . . . . . . . . . . . . . . . . . . . . . . . . . . . . . . . . . . . . . 17-14
Checking the animation on objects . . . . . . . . . . . . . . . . . . . . . . . . . . . . . . . . . . . 17-15
Copying or duplicating objects with animation . . . . . . . . . . . . . . . . . . . . . . . . . . 17-16
Copying animation without copying objects . . . . . . . . . . . . . . . . . . . . . . . . . . . . 17-16
Setting up animation for global objects . . . . . . . . . . . . . . . . . . . . . . . . . . . . . . . . 17-17
18 • Setting up trends
About trends . . . . . . . . . . . . . . . . . . . . . . . . . . . . . . . . . . . . . . . . . . . . . . . . . . . . . . 18-1
Current versus historical data . . . . . . . . . . . . . . . . . . . . . . . . . . . . . . . . . . . . . 18-2
Time, date, and number formats . . . . . . . . . . . . . . . . . . . . . . . . . . . . . . . . . . . 18-3
Summary of steps . . . . . . . . . . . . . . . . . . . . . . . . . . . . . . . . . . . . . . . . . . . . . . . . . . 18-3
Creating trend objects. . . . . . . . . . . . . . . . . . . . . . . . . . . . . . . . . . . . . . . . . . . . . . . 18-3
Setting up trends . . . . . . . . . . . . . . . . . . . . . . . . . . . . . . . . . . . . . . . . . . . . . . . . . . . 18-4
The parts of a trend. . . . . . . . . . . . . . . . . . . . . . . . . . . . . . . . . . . . . . . . . . . . . . . . . 18-5
Trend border . . . . . . . . . . . . . . . . . . . . . . . . . . . . . . . . . . . . . . . . . . . . . . . . . . 18-5
xiv
Trend window . . . . . . . . . . . . . . . . . . . . . . . . . . . . . . . . . . . . . . . . . . . . . . . . . 18-5
Chart . . . . . . . . . . . . . . . . . . . . . . . . . . . . . . . . . . . . . . . . . . . . . . . . . . . . . . . . 18-6
Y-axis . . . . . . . . . . . . . . . . . . . . . . . . . . . . . . . . . . . . . . . . . . . . . . . . . . . . . . . 18-6
Vertical axis labels . . . . . . . . . . . . . . . . . . . . . . . . . . . . . . . . . . . . . . . . . . . . . 18-6
X-axis . . . . . . . . . . . . . . . . . . . . . . . . . . . . . . . . . . . . . . . . . . . . . . . . . . . . . . . 18-6
Horizontal axis labels . . . . . . . . . . . . . . . . . . . . . . . . . . . . . . . . . . . . . . . . . . . 18-6
Pens. . . . . . . . . . . . . . . . . . . . . . . . . . . . . . . . . . . . . . . . . . . . . . . . . . . . . . . . . 18-6
Pen icons . . . . . . . . . . . . . . . . . . . . . . . . . . . . . . . . . . . . . . . . . . . . . . . . . . . . . 18-7
Pen markers. . . . . . . . . . . . . . . . . . . . . . . . . . . . . . . . . . . . . . . . . . . . . . . . . . . 18-7
Chart types . . . . . . . . . . . . . . . . . . . . . . . . . . . . . . . . . . . . . . . . . . . . . . . . . . . . . . . 18-7
Standard vs. XY Plots. . . . . . . . . . . . . . . . . . . . . . . . . . . . . . . . . . . . . . . . . . . 18-7
Isolated graphing. . . . . . . . . . . . . . . . . . . . . . . . . . . . . . . . . . . . . . . . . . . . . . . 18-8
Plotting a value across the full width of the chart. . . . . . . . . . . . . . . . . . . . . . 18-8
Choosing trend colors, fonts, lines, and markers . . . . . . . . . . . . . . . . . . . . . . . . . . 18-9
The trend border color . . . . . . . . . . . . . . . . . . . . . . . . . . . . . . . . . . . . . . . . . . 18-9
The trend window color . . . . . . . . . . . . . . . . . . . . . . . . . . . . . . . . . . . . . . . . . 18-9
Testing the trend . . . . . . . . . . . . . . . . . . . . . . . . . . . . . . . . . . . . . . . . . . . . . . . . . . 18-10
Using the Trends graphic library . . . . . . . . . . . . . . . . . . . . . . . . . . . . . . . . . . . . . 18-10
Using buttons to control the trend at runtime. . . . . . . . . . . . . . . . . . . . . . . . . . . . 18-11
Printing trend data . . . . . . . . . . . . . . . . . . . . . . . . . . . . . . . . . . . . . . . . . . . . . . . . 18-12
Improving clarity of the trend printout . . . . . . . . . . . . . . . . . . . . . . . . . . . . . 18-12
Runtime errors for the trend . . . . . . . . . . . . . . . . . . . . . . . . . . . . . . . . . . . . . . . . . 18-13
19 • Setting up RecipePlus
About recipes . . . . . . . . . . . . . . . . . . . . . . . . . . . . . . . . . . . . . . . . . . . . . . . . . . . . . 19-1
Summary of steps . . . . . . . . . . . . . . . . . . . . . . . . . . . . . . . . . . . . . . . . . . . . . . . . . . 19-2
How the recipe system works. . . . . . . . . . . . . . . . . . . . . . . . . . . . . . . . . . . . . . . . . 19-2
RecipePlus selector . . . . . . . . . . . . . . . . . . . . . . . . . . . . . . . . . . . . . . . . . . . . . 19-2
RecipePlus table . . . . . . . . . . . . . . . . . . . . . . . . . . . . . . . . . . . . . . . . . . . . . . . 19-2
RecipePlus button . . . . . . . . . . . . . . . . . . . . . . . . . . . . . . . . . . . . . . . . . . . . . . 19-3
Number format . . . . . . . . . . . . . . . . . . . . . . . . . . . . . . . . . . . . . . . . . . . . . . . . 19-4
Numeric limits . . . . . . . . . . . . . . . . . . . . . . . . . . . . . . . . . . . . . . . . . . . . . . . . 19-4
Specifying the runtime file location . . . . . . . . . . . . . . . . . . . . . . . . . . . . . . . . . . . . 19-5
Storing files outside the HMI project . . . . . . . . . . . . . . . . . . . . . . . . . . . . . . . 19-5
Storing recipe files with the HMI project . . . . . . . . . . . . . . . . . . . . . . . . . . . . 19-5
Setting up recipe files . . . . . . . . . . . . . . . . . . . . . . . . . . . . . . . . . . . . . . . . . . . . . . . 19-6
Comparing recipes . . . . . . . . . . . . . . . . . . . . . . . . . . . . . . . . . . . . . . . . . . . . . . . . . 19-7
Time and date formats . . . . . . . . . . . . . . . . . . . . . . . . . . . . . . . . . . . . . . . . . . 19-9
Creating RecipePlus objects . . . . . . . . . . . . . . . . . . . . . . . . . . . . . . . . . . . . . . . . . . 19-9
Testing RecipePlus objects. . . . . . . . . . . . . . . . . . . . . . . . . . . . . . . . . . . . . . . . . . 19-10
Using the RecipePlus_Components graphic library. . . . . . . . . . . . . . . . . . . . . . . 19-10
xv
• • • • •
Contents
• • • • •
RSVIEW MACHINE EDITION USER’S GUIDE
Using buttons with recipe objects . . . . . . . . . . . . . . . . . . . . . . . . . . . . . . . . . . . . 19-11
Viewing data values that are saved at runtime . . . . . . . . . . . . . . . . . . . . . . . . . . . 19-13
20 • Using expressions
About expressions . . . . . . . . . . . . . . . . . . . . . . . . . . . . . . . . . . . . . . . . . . . . . . . . . 20-1
Expressions that result in floating-point values . . . . . . . . . . . . . . . . . . . . . . . 20-1
Expression components . . . . . . . . . . . . . . . . . . . . . . . . . . . . . . . . . . . . . . . . . 20-1
Using the Expression editor . . . . . . . . . . . . . . . . . . . . . . . . . . . . . . . . . . . . . . . . . . 20-2
Using the Expression editor versus typing expressions directly. . . . . . . . . . . 20-2
About the Expression editor . . . . . . . . . . . . . . . . . . . . . . . . . . . . . . . . . . . . . . 20-3
Where you can use expressions . . . . . . . . . . . . . . . . . . . . . . . . . . . . . . . . . . . . . . . 20-4
Formatting expressions. . . . . . . . . . . . . . . . . . . . . . . . . . . . . . . . . . . . . . . . . . . . . . 20-4
Using tag names and tag placeholders . . . . . . . . . . . . . . . . . . . . . . . . . . . . . . . . . . 20-5
Using tag placeholders instead of tag names . . . . . . . . . . . . . . . . . . . . . . . . . 20-5
Constants . . . . . . . . . . . . . . . . . . . . . . . . . . . . . . . . . . . . . . . . . . . . . . . . . . . . . . . . 20-6
Arithmetic operators. . . . . . . . . . . . . . . . . . . . . . . . . . . . . . . . . . . . . . . . . . . . . . . . 20-6
String operands . . . . . . . . . . . . . . . . . . . . . . . . . . . . . . . . . . . . . . . . . . . . . . . . 20-7
Relational operators . . . . . . . . . . . . . . . . . . . . . . . . . . . . . . . . . . . . . . . . . . . . . . . . 20-7
How string operands are evaluated. . . . . . . . . . . . . . . . . . . . . . . . . . . . . . . . . 20-7
Logical operators . . . . . . . . . . . . . . . . . . . . . . . . . . . . . . . . . . . . . . . . . . . . . . . . . . 20-7
Bitwise operators . . . . . . . . . . . . . . . . . . . . . . . . . . . . . . . . . . . . . . . . . . . . . . . . . . 20-8
Using the left shift operator . . . . . . . . . . . . . . . . . . . . . . . . . . . . . . . . . . . . . . 20-9
Evaluation order of operators . . . . . . . . . . . . . . . . . . . . . . . . . . . . . . . . . . . . . . . . 20-10
Mathematical functions . . . . . . . . . . . . . . . . . . . . . . . . . . . . . . . . . . . . . . . . . . . . 20-13
Security functions. . . . . . . . . . . . . . . . . . . . . . . . . . . . . . . . . . . . . . . . . . . . . . . . . 20-14
Language function . . . . . . . . . . . . . . . . . . . . . . . . . . . . . . . . . . . . . . . . . . . . . . . . 20-14
If-then-else . . . . . . . . . . . . . . . . . . . . . . . . . . . . . . . . . . . . . . . . . . . . . . . . . . . . . . 20-15
Nested if-then-else . . . . . . . . . . . . . . . . . . . . . . . . . . . . . . . . . . . . . . . . . . . . 20-16
Using write expressions . . . . . . . . . . . . . . . . . . . . . . . . . . . . . . . . . . . . . . . . . . . . 20-17
21 • Using embedded variables
About embedded variables . . . . . . . . . . . . . . . . . . . . . . . . . . . . . . . . . . . . . . . . . . . 21-1
Where you can create embedded variables . . . . . . . . . . . . . . . . . . . . . . . . . . . . . . 21-1
Creating embedded variables . . . . . . . . . . . . . . . . . . . . . . . . . . . . . . . . . . . . . . . . . 21-2
Embedded variable syntax . . . . . . . . . . . . . . . . . . . . . . . . . . . . . . . . . . . . . . . . . . . 21-3
Numeric embedded variable syntax . . . . . . . . . . . . . . . . . . . . . . . . . . . . . . . . 21-3
String embedded variable syntax . . . . . . . . . . . . . . . . . . . . . . . . . . . . . . . . . . 21-3
Time and date embedded variable syntax. . . . . . . . . . . . . . . . . . . . . . . . . . . . 21-4
How embedded variables are updated at runtime . . . . . . . . . . . . . . . . . . . . . . . . . 21-5
How embedded variables are displayed at runtime . . . . . . . . . . . . . . . . . . . . . . . . 21-5
Numeric embedded variables . . . . . . . . . . . . . . . . . . . . . . . . . . . . . . . . . . . . . 21-5
xvi
String embedded variables . . . . . . . . . . . . . . . . . . . . . . . . . . . . . . . . . . . . . . . 21-6
Time and date embedded variables. . . . . . . . . . . . . . . . . . . . . . . . . . . . . . . . . 21-6
22 • Using macros
Using macros to assign values to tags . . . . . . . . . . . . . . . . . . . . . . . . . . . . . . . . . . 22-1
Using the Macros editor . . . . . . . . . . . . . . . . . . . . . . . . . . . . . . . . . . . . . . . . . . . . . 22-2
When to use macros . . . . . . . . . . . . . . . . . . . . . . . . . . . . . . . . . . . . . . . . . . . . . . . . 22-2
Running macros when tags or expressions change value. . . . . . . . . . . . . . . . . . . . 22-3
Where to assign macros . . . . . . . . . . . . . . . . . . . . . . . . . . . . . . . . . . . . . . . . . . . . . 22-3
23 • Setting up language switching
About language switching . . . . . . . . . . . . . . . . . . . . . . . . . . . . . . . . . . . . . . . . . . . 23-1
Summary of steps . . . . . . . . . . . . . . . . . . . . . . . . . . . . . . . . . . . . . . . . . . . . . . . . . . 23-1
Setting up Windows for language switching . . . . . . . . . . . . . . . . . . . . . . . . . . . . . 23-2
Installing Windows languages . . . . . . . . . . . . . . . . . . . . . . . . . . . . . . . . . . . . 23-2
Setting up Windows fonts. . . . . . . . . . . . . . . . . . . . . . . . . . . . . . . . . . . . . . . . 23-2
Windows locale settings . . . . . . . . . . . . . . . . . . . . . . . . . . . . . . . . . . . . . . . . . 23-3
Adding languages to the application . . . . . . . . . . . . . . . . . . . . . . . . . . . . . . . . . . . 23-3
Removing languages. . . . . . . . . . . . . . . . . . . . . . . . . . . . . . . . . . . . . . . . . . . . 23-4
Exporting application text strings for translation . . . . . . . . . . . . . . . . . . . . . . . . . . 23-4
Exported text file locations . . . . . . . . . . . . . . . . . . . . . . . . . . . . . . . . . . . . . . . 23-5
File name format. . . . . . . . . . . . . . . . . . . . . . . . . . . . . . . . . . . . . . . . . . . . . . . 23-5
Troubleshooting export problems. . . . . . . . . . . . . . . . . . . . . . . . . . . . . . . . . . 23-6
Translating application text . . . . . . . . . . . . . . . . . . . . . . . . . . . . . . . . . . . . . . . . . . 23-6
File name and format . . . . . . . . . . . . . . . . . . . . . . . . . . . . . . . . . . . . . . . . . . . 23-6
Opening the text file in Microsoft Excel . . . . . . . . . . . . . . . . . . . . . . . . . . . . 23-7
Saving the text file in Microsoft Excel . . . . . . . . . . . . . . . . . . . . . . . . . . . . . . 23-7
Differences in file format for files saved in Excel . . . . . . . . . . . . . . . . . . . . . 23-8
Saving the Unicode text file in Notepad. . . . . . . . . . . . . . . . . . . . . . . . . . . . . 23-8
File schema . . . . . . . . . . . . . . . . . . . . . . . . . . . . . . . . . . . . . . . . . . . . . . . . . . . 23-8
Working with pairs of double quotes . . . . . . . . . . . . . . . . . . . . . . . . . . . . . . . 23-9
Working with backslashes and new-line characters . . . . . . . . . . . . . . . . . . . . 23-9
Importing text . . . . . . . . . . . . . . . . . . . . . . . . . . . . . . . . . . . . . . . . . . . . . . . . . . . . 23-10
Troubleshooting importing. . . . . . . . . . . . . . . . . . . . . . . . . . . . . . . . . . . . . . . . . . 23-11
Common errors and their causes. . . . . . . . . . . . . . . . . . . . . . . . . . . . . . . . . . 23-11
Setting up multiple language support for graphic libraries . . . . . . . . . . . . . . . . . 23-12
Using graphic libraries that support multiple languages . . . . . . . . . . . . . . . 23-13
24 • Setting up display navigation
About display navigation . . . . . . . . . . . . . . . . . . . . . . . . . . . . . . . . . . . . . . . . . . . . 24-1
xvii
• • • • •
Contents
• • • • •
RSVIEW MACHINE EDITION USER’S GUIDE
Developing a hierarchy of displays . . . . . . . . . . . . . . . . . . . . . . . . . . . . . . . . . . . . 24-1
Testing display navigation . . . . . . . . . . . . . . . . . . . . . . . . . . . . . . . . . . . . . . . . . . . 24-3
Using graphic objects to navigate . . . . . . . . . . . . . . . . . . . . . . . . . . . . . . . . . . . . . 24-3
Switching languages . . . . . . . . . . . . . . . . . . . . . . . . . . . . . . . . . . . . . . . . . . . . 24-3
Display type . . . . . . . . . . . . . . . . . . . . . . . . . . . . . . . . . . . . . . . . . . . . . . . . . . 24-4
Goto display buttons . . . . . . . . . . . . . . . . . . . . . . . . . . . . . . . . . . . . . . . . . . . . 24-4
Goto configure mode buttons . . . . . . . . . . . . . . . . . . . . . . . . . . . . . . . . . . . . . 24-4
Return to display buttons . . . . . . . . . . . . . . . . . . . . . . . . . . . . . . . . . . . . . . . . 24-5
Close display buttons . . . . . . . . . . . . . . . . . . . . . . . . . . . . . . . . . . . . . . . . . . . 24-6
Display list selectors . . . . . . . . . . . . . . . . . . . . . . . . . . . . . . . . . . . . . . . . . . . . 24-6
Shutdown buttons . . . . . . . . . . . . . . . . . . . . . . . . . . . . . . . . . . . . . . . . . . . . . . 24-7
Controlling display changes remotely . . . . . . . . . . . . . . . . . . . . . . . . . . . . . . . . . . 24-7
25 • Specifying startup settings, testing applications, and creating
runtime applications
Specifying startup settings . . . . . . . . . . . . . . . . . . . . . . . . . . . . . . . . . . . . . . . . . . . 25-1
Testing your application . . . . . . . . . . . . . . . . . . . . . . . . . . . . . . . . . . . . . . . . . . . . . 25-2
Creating runtime application files . . . . . . . . . . . . . . . . . . . . . . . . . . . . . . . . . . . . . 25-2
Creating .mer files for previous versions . . . . . . . . . . . . . . . . . . . . . . . . . . . . 25-2
26 • Running applications in Windows 2000 or Windows XP
Summary of steps . . . . . . . . . . . . . . . . . . . . . . . . . . . . . . . . . . . . . . . . . . . . . . . . . . 26-1
Moving applications to the runtime computer . . . . . . . . . . . . . . . . . . . . . . . . . . . . 26-3
Starting RSView ME Station . . . . . . . . . . . . . . . . . . . . . . . . . . . . . . . . . . . . . . . . . 26-3
Loading and running applications . . . . . . . . . . . . . . . . . . . . . . . . . . . . . . . . . . . . . 26-4
Shutting down applications . . . . . . . . . . . . . . . . . . . . . . . . . . . . . . . . . . . . . . . . . . 26-5
What happens when the application shuts down . . . . . . . . . . . . . . . . . . . . . . 26-6
Changing application settings . . . . . . . . . . . . . . . . . . . . . . . . . . . . . . . . . . . . . . . . 26-6
Editing device shortcuts . . . . . . . . . . . . . . . . . . . . . . . . . . . . . . . . . . . . . . . . . 26-6
Looking up contact information for technical support . . . . . . . . . . . . . . . . . . . . . . 26-7
Setting up FactoryTalk Diagnostics on the runtime computer. . . . . . . . . . . . . . . . 26-7
Setting up serial ports for use with KEPServerEnterprise . . . . . . . . . . . . . . . . . . . 26-8
Setting up RSLinx Enterprise communication drivers. . . . . . . . . . . . . . . . . . . . . . 26-9
Specifying the printers to use at runtime . . . . . . . . . . . . . . . . . . . . . . . . . . . . . . . 26-10
Specifying startup options for RSView ME Station . . . . . . . . . . . . . . . . . . . . . . 26-11
Deleting log files on the runtime computer . . . . . . . . . . . . . . . . . . . . . . . . . . . . . 26-15
Running a newer version of the application . . . . . . . . . . . . . . . . . . . . . . . . . 26-15
Deleting log files manually. . . . . . . . . . . . . . . . . . . . . . . . . . . . . . . . . . . . . . 26-15
Turning off the FactoryTalk Directory Server warning . . . . . . . . . . . . . . . . . . . . 26-15
Specifying time, date, and number formats . . . . . . . . . . . . . . . . . . . . . . . . . . . . . 26-16
Using the DeskLock tool . . . . . . . . . . . . . . . . . . . . . . . . . . . . . . . . . . . . . . . . . . . 26-16
xviii
27 • Transferring applications to a PanelView Plus or VersaView
CE terminal
Summary of steps . . . . . . . . . . . . . . . . . . . . . . . . . . . . . . . . . . . . . . . . . . . . . . . . . . 27-1
Starting RSView ME Station . . . . . . . . . . . . . . . . . . . . . . . . . . . . . . . . . . . . . . . . . 27-3
Specifying the driver to use for the transfer . . . . . . . . . . . . . . . . . . . . . . . . . . . . . . 27-3
Setting up a driver for the transfer on the development computer . . . . . . . . . . . . . 27-5
Downloading applications and Windows TrueType fonts . . . . . . . . . . . . . . . . . . . 27-5
About the download . . . . . . . . . . . . . . . . . . . . . . . . . . . . . . . . . . . . . . . . . . . . 27-5
Serial downloads. . . . . . . . . . . . . . . . . . . . . . . . . . . . . . . . . . . . . . . . . . . . . . . 27-5
Uploading applications from the PanelView Plus or VersaView CE terminal . . . 27-6
About the upload. . . . . . . . . . . . . . . . . . . . . . . . . . . . . . . . . . . . . . . . . . . . . . . 27-7
Serial uploads . . . . . . . . . . . . . . . . . . . . . . . . . . . . . . . . . . . . . . . . . . . . . . . . . 27-7
Comparing applications . . . . . . . . . . . . . . . . . . . . . . . . . . . . . . . . . . . . . . . . . . . . . 27-7
28 • Using your application
Logging in to a Windows domain . . . . . . . . . . . . . . . . . . . . . . . . . . . . . . . . . . . . . 28-1
Logging in to the application . . . . . . . . . . . . . . . . . . . . . . . . . . . . . . . . . . . . . . . . . 28-2
4.0 applications . . . . . . . . . . . . . . . . . . . . . . . . . . . . . . . . . . . . . . . . . . . . . . . . 28-2
3.x applications . . . . . . . . . . . . . . . . . . . . . . . . . . . . . . . . . . . . . . . . . . . . . . . . 28-2
What happens when a user logs in . . . . . . . . . . . . . . . . . . . . . . . . . . . . . . . . . 28-3
Problems with logging in . . . . . . . . . . . . . . . . . . . . . . . . . . . . . . . . . . . . . . . . 28-4
Changing passwords. . . . . . . . . . . . . . . . . . . . . . . . . . . . . . . . . . . . . . . . . . . . . . . . 28-4
Logging out . . . . . . . . . . . . . . . . . . . . . . . . . . . . . . . . . . . . . . . . . . . . . . . . . . . . . . 28-6
Entering numeric values . . . . . . . . . . . . . . . . . . . . . . . . . . . . . . . . . . . . . . . . . . . . . 28-6
Activating the cursor point . . . . . . . . . . . . . . . . . . . . . . . . . . . . . . . . . . . . . . . 28-6
Ramping numeric values . . . . . . . . . . . . . . . . . . . . . . . . . . . . . . . . . . . . . . . . 28-7
Using the numeric pop-up keypad . . . . . . . . . . . . . . . . . . . . . . . . . . . . . . . . . 28-7
Using the numeric pop-up scratchpad . . . . . . . . . . . . . . . . . . . . . . . . . . . . . . 28-7
Using buttons and keys with the numeric pop-up windows . . . . . . . . . . . . . . 28-8
How values are ramped. . . . . . . . . . . . . . . . . . . . . . . . . . . . . . . . . . . . . . . . . . 28-9
How values are calculated . . . . . . . . . . . . . . . . . . . . . . . . . . . . . . . . . . . . . . . 28-9
Problems with the numeric pop-up windows . . . . . . . . . . . . . . . . . . . . . . . . 28-10
Entering string values . . . . . . . . . . . . . . . . . . . . . . . . . . . . . . . . . . . . . . . . . . . . . . 28-10
Using the string pop-up keyboard. . . . . . . . . . . . . . . . . . . . . . . . . . . . . . . . . 28-11
Using the string pop-up character input . . . . . . . . . . . . . . . . . . . . . . . . . . . . 28-11
Using the string pop-up scratchpad . . . . . . . . . . . . . . . . . . . . . . . . . . . . . . . 28-13
Using buttons and keys with the string pop-up windows . . . . . . . . . . . . . . . 28-13
What is written to the Value connection. . . . . . . . . . . . . . . . . . . . . . . . . . . . 28-14
Problems with the string pop-up windows . . . . . . . . . . . . . . . . . . . . . . . . . . 28-15
Changing tag values . . . . . . . . . . . . . . . . . . . . . . . . . . . . . . . . . . . . . . . . . . . . . . . 28-15
Viewing tag data. . . . . . . . . . . . . . . . . . . . . . . . . . . . . . . . . . . . . . . . . . . . . . . . . . 28-17
xix
• • • • •
Contents
• • • • •
RSVIEW MACHINE EDITION USER’S GUIDE
Viewing alarms and messages . . . . . . . . . . . . . . . . . . . . . . . . . . . . . . . . . . . . . . . 28-19
Viewing information about runtime communication errors. . . . . . . . . . . . . . . . . 28-20
Changing languages . . . . . . . . . . . . . . . . . . . . . . . . . . . . . . . . . . . . . . . . . . . . . . 28-20
APPENDICES
A • Converting PanelBuilder 1400e applications
Terminology . . . . . . . . . . . . . . . . . . . . . . . . . . . . . . . . . . . . . . . . . . . . . . . . . . . . . . A-1
Summary of steps . . . . . . . . . . . . . . . . . . . . . . . . . . . . . . . . . . . . . . . . . . . . . . . . . . A-2
Converting PanelBuilder 1400e application files. . . . . . . . . . . . . . . . . . . . . . . . . . A-3
Equivalent graphic objects . . . . . . . . . . . . . . . . . . . . . . . . . . . . . . . . . . . . . . . . . . . A-5
Unsupported graphic objects . . . . . . . . . . . . . . . . . . . . . . . . . . . . . . . . . . . . . . . . . A-7
Unsupported settings and controls . . . . . . . . . . . . . . . . . . . . . . . . . . . . . . . . . . . . . A-7
Controls for transferring runtime application files . . . . . . . . . . . . . . . . . . . . . A-8
Settings and controls for alarms . . . . . . . . . . . . . . . . . . . . . . . . . . . . . . . . . . . A-8
Invalid characters in screen names . . . . . . . . . . . . . . . . . . . . . . . . . . . . . . . . . A-8
Screen security settings. . . . . . . . . . . . . . . . . . . . . . . . . . . . . . . . . . . . . . . . . . A-8
Block tags . . . . . . . . . . . . . . . . . . . . . . . . . . . . . . . . . . . . . . . . . . . . . . . . . . . . A-9
Converting non-RIO communications . . . . . . . . . . . . . . . . . . . . . . . . . . . . . . . . . . A-9
Unsupported communication protocols . . . . . . . . . . . . . . . . . . . . . . . . . . . . . A-9
Unsupported tag data types. . . . . . . . . . . . . . . . . . . . . . . . . . . . . . . . . . . . . . . A-9
Unsupported initial values . . . . . . . . . . . . . . . . . . . . . . . . . . . . . . . . . . . . . . A-10
Converting RIO communications. . . . . . . . . . . . . . . . . . . . . . . . . . . . . . . . . . . . . A-10
Unsupported PanelBuilder 1400e RIO tags . . . . . . . . . . . . . . . . . . . . . . . . . A-11
Unsupported graphic object features . . . . . . . . . . . . . . . . . . . . . . . . . . . . . . . . . . A-12
Converting expressions . . . . . . . . . . . . . . . . . . . . . . . . . . . . . . . . . . . . . . . . . . . . A-13
Equivalent expression syntax . . . . . . . . . . . . . . . . . . . . . . . . . . . . . . . . . . . . A-14
Unsupported expression syntax . . . . . . . . . . . . . . . . . . . . . . . . . . . . . . . . . . A-15
Order of precedence . . . . . . . . . . . . . . . . . . . . . . . . . . . . . . . . . . . . . . . . . . . A-15
B • Converting PanelBuilder and PanelBuilder32 applications
Terminology . . . . . . . . . . . . . . . . . . . . . . . . . . . . . . . . . . . . . . . . . . . . . . . . . . . . . .
Summary of steps . . . . . . . . . . . . . . . . . . . . . . . . . . . . . . . . . . . . . . . . . . . . . . . . . .
Converting PanelBuilder application files . . . . . . . . . . . . . . . . . . . . . . . . . . . . . . .
Equivalent graphic objects . . . . . . . . . . . . . . . . . . . . . . . . . . . . . . . . . . . . . . . . . . .
Unsupported graphic objects . . . . . . . . . . . . . . . . . . . . . . . . . . . . . . . . . . . . . . . . .
Unsupported settings and controls . . . . . . . . . . . . . . . . . . . . . . . . . . . . . . . . . . . . .
Settings and controls for alarms . . . . . . . . . . . . . . . . . . . . . . . . . . . . . . . . . . .
Invalid characters in screen names and tag names . . . . . . . . . . . . . . . . . . . . .
Time and date . . . . . . . . . . . . . . . . . . . . . . . . . . . . . . . . . . . . . . . . . . . . . . . . .
xx
B-1
B-2
B-2
B-5
B-6
B-6
B-6
B-7
B-7
External fonts . . . . . . . . . . . . . . . . . . . . . . . . . . . . . . . . . . . . . . . . . . . . . . . . . B-7
Screen security settings. . . . . . . . . . . . . . . . . . . . . . . . . . . . . . . . . . . . . . . . . . B-7
Power-up options . . . . . . . . . . . . . . . . . . . . . . . . . . . . . . . . . . . . . . . . . . . . . . B-7
Converting non-RIO communications . . . . . . . . . . . . . . . . . . . . . . . . . . . . . . . . . . B-7
Unsupported communication protocols . . . . . . . . . . . . . . . . . . . . . . . . . . . . . B-8
Bit array tags. . . . . . . . . . . . . . . . . . . . . . . . . . . . . . . . . . . . . . . . . . . . . . . . . . B-8
Converting RIO communications. . . . . . . . . . . . . . . . . . . . . . . . . . . . . . . . . . . . . . B-8
Unsupported PanelBuilder RIO tags. . . . . . . . . . . . . . . . . . . . . . . . . . . . . . . . B-9
Unsupported graphic object features . . . . . . . . . . . . . . . . . . . . . . . . . . . . . . . . . . B-10
C • System tags
Alarms . . . . . . . . . . . . . . . . . . . . . . . . . . . . . . . . . . . . . . . . . . . . . . . . . . . . . . . . . .
Graphics . . . . . . . . . . . . . . . . . . . . . . . . . . . . . . . . . . . . . . . . . . . . . . . . . . . . . . . . .
Time . . . . . . . . . . . . . . . . . . . . . . . . . . . . . . . . . . . . . . . . . . . . . . . . . . . . . . . . . . . .
User . . . . . . . . . . . . . . . . . . . . . . . . . . . . . . . . . . . . . . . . . . . . . . . . . . . . . . . . . . . .
C-1
C-1
C-2
C-2
D • ODBC database schema
FactoryTalk Diagnostics log table . . . . . . . . . . . . . . . . . . . . . . . . . . . . . . . . . . . . . D-1
E • Importing and exporting XML files
About XML . . . . . . . . . . . . . . . . . . . . . . . . . . . . . . . . . . . . . . . . . . . . . . . . . . . . . .
Creating XML files by exporting . . . . . . . . . . . . . . . . . . . . . . . . . . . . . . . . . . . . . .
Editing XML files . . . . . . . . . . . . . . . . . . . . . . . . . . . . . . . . . . . . . . . . . . . . . . . . .
Saving XML files in Notepad. . . . . . . . . . . . . . . . . . . . . . . . . . . . . . . . . . . . .
Testing XML files. . . . . . . . . . . . . . . . . . . . . . . . . . . . . . . . . . . . . . . . . . . . . .
Importing XML files . . . . . . . . . . . . . . . . . . . . . . . . . . . . . . . . . . . . . . . . . . . . . . .
Error log file . . . . . . . . . . . . . . . . . . . . . . . . . . . . . . . . . . . . . . . . . . . . . . . . . .
Importing alarm XML files. . . . . . . . . . . . . . . . . . . . . . . . . . . . . . . . . . . . . . .
Importing graphics XML files . . . . . . . . . . . . . . . . . . . . . . . . . . . . . . . . . . . .
Alarm setup XML file structure . . . . . . . . . . . . . . . . . . . . . . . . . . . . . . . . . . . . . . .
Graphics XML file structure . . . . . . . . . . . . . . . . . . . . . . . . . . . . . . . . . . . . . . . . .
E-1
E-1
E-2
E-2
E-3
E-3
E-3
E-3
E-4
E-4
E-5
F • RFC1766 names
Mapping languages to RFC1766 names. . . . . . . . . . . . . . . . . . . . . . . . . . . . . . . . . F-1
G • Features supported in different versions of RSView
Which versions are supported . . . . . . . . . . . . . . . . . . . . . . . . . . . . . . . . . . . . . . . . G-1
Creating runtime application files for previous versions . . . . . . . . . . . . . . . . . . . . G-1
Features that are not supported in version 3.2 or earlier . . . . . . . . . . . . . . . . . . . . G-2
xxi
• • • • •
Contents
• • • • •
RSVIEW MACHINE EDITION USER’S GUIDE
Features that are not supported in version 3.1 or earlier . . . . . . . . . . . . . . . . . . . . G-3
Features that are not supported in version 3.0 . . . . . . . . . . . . . . . . . . . . . . . . . . . . G-4
Index
xxii
Preface
RSView® Machine Edition™ is a member of the RSView Enterprise Series family of
products. It is an integrated package for developing and running automation applications.
Designed for use with Microsoft® Windows® 2000 and Windows XP, PanelView Plus™
terminals, and VersaView<Superscript>® CE terminals running Microsoft Windows CE
4.1, RSView Machine Edition gives you all the tools you need to create effective
machine-level monitoring and control applications.
About the documentation
The RSView Machine Edition documentation set includes:
Release Notes: Information to read before you begin installing or working with the
software.
The Release Notes are available on the RSView Machine Edition CD, as well as from
the Help menu in RSView Studio™.
RSView Machine Edition Installation Guide: A guide to installing and activating the
various components of RSView Machine Edition.
The Installation Guide is available on the RSView Machine Edition CD, as well as
from the Help menu in RSView Studio.
RSView Machine Edition User’s Guide, Volume 1 and RSView Machine Edition User’s
Guide, Volume 2: Comprehensive information about RSView Machine Edition,
procedures for creating and running an automation application, and reference
information.
For ease of printing, the User’s Guide is divided into two parts, available from the
Help menu in RSView Studio. For detailed information about the contents of each
guide, see the Bookmarks tab in the online guides.
Help: Online procedures and reference information.
Help is available from the Help menu in RSView Studio.
The RSView Machine Edition CD also includes these manuals:
PanelView Plus Terminals User Manual
VersaView CE Terminals User Manual
P-1
• • • • •
RSVIEW MACHINE EDITION USER’S GUIDE
Finding the information you need
You have many options for finding information about how to use RSView, or how to solve
problems with RSView.
Try the User's Guide and Help first
The User’s Guide and Help provide comprehensive information about typical uses of
RSView. Chances are, your question is answered in the documentation.
To find the answer, use the table of contents and the index in the User’s Guide and Help.
You can also perform a full-text search on both the Help and the User’s Guide. For
information about using Help, see Chapter 6, “Getting the information you need,” in the
RSView Machine Edition Installation Guide.
For information about performing searches on the User’s Guide, see Adobe® Reader®
Help.
Information on the Internet
If you can’t find the answer to your question or problem in the User’s Guide or Help, you
can find information on the World Wide Web.
You can connect to the Rockwell Software® and Rockwell Automation® web sites from
within RSView Studio. To do so, you must have a web browser installed on your
computer, and you must have an active Internet connection.
To connect to web sites from RSView Studio
1. On the Help menu, select Rockwell Software on the Web, and then click the name of
the web page you want to view.
For information about the Rockwell Automation Knowledgebase and the Rockwell
Software Discussion Forums, see the next sections.
The Rockwell Automation Knowledgebase
The Knowledgebase web page contains a comprehensive, searchable database of support
information for all Rockwell Automation and Rockwell Software products.
Rockwell Software Discussion Forums
The Rockwell Software Discussion Forums are web pages for users of Rockwell Software
products. The forums offer discussion groups for exchanging tips and questions with other
RSView users.
P-2
Contacting Rockwell Software Technical Support
If you can’t find the answer to your question using any of the resources suggested above,
contact Rockwell Software Technical Support at:
Telephone:440-646-5800
Fax:440-646-5801
World Wide Web:http://www.rockwellsoftware.com
Support staff are available Monday to Friday from 8 AM to 5 PM local time (North
America only), except on statutory holidays.
When you call
When you call, be at your computer and be ready to give:
the product serial number.
You’ll find this number on the Activation disk label and in the About RSView Studio
dialog box available from the Help menu in RSView.
the product version number.
the type of hardware you are using.
the exact wording of any messages that appeared on your screen.
a description of what happened and what you were doing when the problem occurred.
a description of how you tried to solve the problem.
You may also be required to provide information about the RSView add-ons and updates
that are installed on your computer.
To view the list of installed add-ons and updates
1. In RSView Studio, click Help, and then click About RSView Studio.
2. To view the list of installed add-ons, click Add-Ons.
3. To view the list of installed updates, click Updates.
P-3
• • • • •
• PREFACE
1
Getting Started
RSView® Machine Edition™ is software for developing and running human-machine
interface applications. RSView Machine Edition is designed for monitoring and
controlling automated processes and machines.
For information about installing RSView Machine Edition, see the RSView Machine
Edition Installation Guide.
The parts of RSView Machine Edition
RSView Machine Edition includes two products:
RSView Studio™ is configuration software for developing machine-level applications.
This software runs on the Windows® 2000 and Windows XP operating systems.
RSView ME Station™ is a stand-alone runtime environment for machine-level
applications. Use RSView ME Station to run the applications you develop in RSView
Studio.
You can run machine-level applications on PanelView Plus™ terminals and VersaView®
CE terminals with the Windows CE 4.1 operating system, and on computers that use the
Windows 2000 or Windows XP operating system.
Additional software
The RSView Machine Edition CD also includes three additional software products:
RSLinx® Enterprise™ is a new communication server built around FactoryTalk®
technology to assist in developing and running your RSView ME applications. It is an
OPC® 2.05 compliant server and will run on multiple platforms, ranging from PanelView
Plus dedicated terminals to desktop computers.
RSLinx® Classic is software that provides communications to a wide range of
communication drivers. RSLinx Classic is an OPC-compliant data server. RSLinx Classic
is available for Windows 2000 and Windows XP platforms only.
Adobe® Reader® 6.0 is software for reading the online RSView Machine Edition
User’s Guide. If desired, you can also use the software to print the User’s Guide.
FactoryTalk Administration Console
The FactoryTalk Automation Platform includes software called the FactoryTalk
Administration Console. This software allows you to set up RSAssetSecurity™.
RSAssetSecurity is a method for setting up security for users and computers for multiple
Rockwell Software products in one place.
1-1
• • • • •
RSVIEW MACHINE EDITION USER’S GUIDE
RSAssetSecurity is intended to improve the security of your automation system by
limiting access to those with a legitimate need. RSAssetSecurity authenticates user
identities and authorizes user requests to access a FactoryTalk-enabled system. These
security services are fully integrated into the FactoryTalk Directory and are included as
part of the FactoryTalk Automation Platform that installs with many products.
You can also set up RSAssetSecurity in RSView® Studio™. For more information, see
Chapter 13.
To open the FactoryTalk Administration Console
1. On the Windows Start menu, select Programs, Rockwell Software, and then click
FactoryTalk Administration Console.
For information about using the FactoryTalk Administration Console, see FactoryTalk
Help.
The RSView Machine Edition tools
RSView Studio tools
These tools are installed with RSView Studio:
Application Manager is software for renaming, copying, deleting, backing up, and
restoring applications.
DeskLock is software that prevents Windows 2000 and Windows XP users from
exiting the RSView application at runtime. You cannot use DeskLock if you are
running your application on a PanelView Plus or VersaView CE terminal.
ME Firmware Upgrade Wizard is software for installing new firmware releases on
an ME terminal.
ME Transfer Utility is software for moving a runtime machine-level application
(.mer file) from the development computer to PanelView Plus or VersaView CE
terminals.
Tag Import and Export Wizard is software for importing or exporting the RSView
tag database.
Diagnostics Viewer allows you to view FactoryTalk Diagnostics messages using
the Windows Event Viewer.
To start the tools
1. On the Windows Start menu, select Programs, Rockwell Software, RSView
Enterprise, Tools, and then click the tool to start.
1-2
To start the Diagnostics Viewer
1. On the Windows Start menu, select Programs, Rockwell Software, FactoryTalk Tools,
and then click Diagnostics Viewer.
These tools are also available from the Tools menu in RSView Studio.
FactoryTalk tools
FactoryTalk tools are installed when you install FactoryTalk Automation Platform. They
are available from the Windows Start menu.
To start FactoryTalk tools
1. On the Windows Start menu, select Programs, Rockwell Software, FactoryTalk Tools,
and then click the tool to start.
1-3
• • • • •
1 • Getting Started
2
Exploring RSView Studio
This chapter describes:
starting and exiting RSView® Studio™.
opening sample applications.
exploring the RSView Studio main window.
using the Explorer window.
working with editors.
entering information in spreadsheets.
working with components.
printing information in editors and components.
Starting and exiting RSView Studio
RSView Studio is configuration software for developing machine-level applications. This
software runs on the Microsoft® Windows® 2000 and Windows XP operating systems.
Starting RSView Studio
To start RSView Studio
1. On the Windows Start menu, select Programs, and then click RSView Studio.
RSView comes with several sample applications. We suggest you open the Malthouse
sample application now to use while you try out the instructions in the remainder of this
chapter. See the instructions on page 2-2.
Exiting RSView Studio
To exit RSViewStudio
1. On the File menu, click Exit.
If there are any unsaved changes in open editors, RSView Studio asks you whether to
save the changes before exiting the program.
2-1
• • • • •
RSVIEW MACHINE EDITION USER’S GUIDE
Opening sample applications
The sample applications are designed for two screen resolutions: 640 x 480 and
800 x 600. Select the application that matches the screen resolution of your runtime
monitor.
When you first install RSView, sample applications are accessible to all users. For
information about setting up users and granting them access to applications, see
Chapter 13.
To open the Malthouse sample application
1. Start RSView Studio.
2. Click the Existing tab.
3. Click Malthouse Clgx 640x480 or Malthouse Clgx 800x600.
4. Specify a language for the graphic display strings in the application.
5. Click Open.
RSView Studio displays the sample application in the Explorer window.
2-2
Problems opening applications
If you have trouble opening an application in RSView Studio, the problem could be a
Microsoft Windows security setting. You must have read and write access to the folder
that contains the HMI projects. For example, if you belong to the Windows user group
called Power Users, and the group does not have write access to the HMI projects folder,
you won’t be able to open applications in RSView.
The default location for the HMI projects folder is:
C:\Documents and Settings\All Users\Documents\RSView Enterprise\ME
(Windows 2000)
or
C:\Documents and Settings\All Users\Shared Documents\RSView Enterprise\ME
(Windows XP)
For more information about security, see Chapter 13.
To set up write access for Power Users
1. Right-click the HMI projects folder, and then click Properties.
2. In the Security tab of the Properties dialog box, select Power Users from the list of
groups and user names.
3. In the Permissions box below the list, select Full Control, and then select Allow.
2-3
• • • • •
2 • Exploring RSView Studio
• • • • •
RSVIEW MACHINE EDITION USER’S GUIDE
Exploring the RSView Studio main window
Title bar
Menu bar
Toolbar
Explorer
window
Workspace
Diagnostics List
Status bar
The menu bar
The menu bar contains the menu items for the active window. Each editor has its own set
of menus.
The toolbar
The toolbar contains buttons for commonly used menu items so you can have quick
access to the items without opening the menu. When you point to a button on the toolbar,
the button name is displayed in a tooltip and in the status bar.
Tooltip
2-4
All editors use the Standard toolbar. The Graphic Displays, Graphic Libraries, User
Accounts, and Tags editors have additional toolbars.
The Explorer window
The Explorer window has two tabs: the Application tab, and the Communications tab.
The Application tab contains the editors for creating and editing your application. It also
contains the System folder for setting up RSAssetSecurity™.
The Communications tab contains the communications tree for the development
computer. For more information about using the communications tree, see Help for
RSLinx Enterprise.
For more information about the Explorer window, see page 2-8. For information about
setting up security, see Chapter 13.
The workspace
The workspace is the blank area of the RSView Studio window. You can drag icons from
the Explorer window to the workspace to open editors and components. For more
information, see page 2-8.
The Diagnostics List
The Diagnostics List shows messages about system activities. You can specify the types
of messages to display in the Diagnostics List, move the list, resize it, and clear the
messages in it.
For information about testing graphic displays, see page 14-10.
Moving the Diagnostics List
You can detach (undock) the Diagnostics List from the main window, and then move the
list anywhere on the screen.
To undock the Diagnostics List, drag the grab bars at the bottom left of the Diagnostics
List. If you can’t see the grab bars, drag the top edge of the Diagnostics List to make it a
bit larger.
To detach the
Diagnostics List, drag
the grab bars.
To prevent the Diagnostics List from docking automatically while you move it across the
screen, hold down the Ctrl key on the keyboard while you move the Diagnostics List.
2-5
• • • • •
2 • Exploring RSView Studio
• • • • •
RSVIEW MACHINE EDITION USER’S GUIDE
When the Diagnostics List is undocked, you can make it any size you want, for example
to view more than one message at a time. To resize the bar, drag an edge or corner until
the bar is the size you want.
To re-attach the Diagnostics List, double-click its title bar.
To clear the selected message in the Diagnostics List, click Clear. To clear all the
messages in the Diagnostics List, click Clear All.
Messages in the Diagnostics List
The types of messages that appear in the Diagnostics List depend on how you set up
FactoryTalk Diagnostics™ on the development system. For information about specifying
the types of messages to display, see page 10-3.
The status bar
The status bar displays information about the active window or about the selected tool or
menu item. The information that is displayed depends on where the mouse pointer is. For
example, when you select a graphic object in the Graphics editor, the status bar displays
information about the selected object.
2-6
Workbook tabs
If you select Workbook Mode on the View menu, the workspace displays tabs at the
bottom for each open editor or component. Workbook Mode allows you to bring forward
an open item more quickly than by using the Window menu.
Workbook tabs
Showing and hiding items in the main window
You can display or hide all the items in the main window (except the menu bar) by
clicking the items on the View menu.
2-7
• • • • •
2 • Exploring RSView Studio
• • • • •
RSVIEW MACHINE EDITION USER’S GUIDE
The status bar, Explorer
window, Diagnostics List,
and Standard toolbar are
visible. Workbook Mode is
turned off.
To hide or display the Explorer window
1. On the View menu, click Explorer Window, or click the Explorer Window tool on the
toolbar.
Using the Explorer window
The Explorer window is the main tool for working with RSView Studio. It lists the editors
you use to develop your application, as well as the components, such as graphic displays,
you’ve created.
The Explorer window also allows you to set up security for your application. You can use
the window to set up users and user groups, and to assign security access to FactoryTalk®
Directory™ to the application, and to networks and devices. For information about setting
up security, see Chapter 13.
An application consists of one or more data servers and an HMI project (also known as an
HMI server). The data servers provide communications for the project. The project
consists of graphic displays, alarm information, user information, and other settings.
2-8
This manual generally uses the term application to refer to both application-level and
project-level procedures.
The top icon is FactoryTalk Local Directory
This application contains three servers
1. OPC® data server
2. The application’s HMI server contains
editors for setting up your application
and the components you create.
Click the - symbol to close a folder
Click the + symbol to see the list of
components for an editor.
Components are listed below the
editor’s icon when you open the folder.
3. RSLinx Enterprise data server
This folder contains RSAssetSecurity™
policies and users
2-9
• • • • •
2 • Exploring RSView Studio
• • • • •
RSVIEW MACHINE EDITION USER’S GUIDE
When you create a data server it is added to the Explorer window tree. For example, see
the KepServer data server in the previous illustration.
You can resize the Explorer window by dragging its edges.
Viewing the Explorer window
You can view the Explorer window in a number of ways:
As a docked window. When docked, the explorer is always on top of other windows
that it overlaps. You can dock the explorer to any edge of the main window.
As a floating window. When floating, the explorer is always on top of other windows
that it overlaps, but you can move it to different locations in the middle of the main
window.
As a “child” window. When the explorer is in child mode, you can minimize the
explorer or position other windows in front of it. This mode is particularly useful
when you are working in multiple editors or working with the Help open.
To put the explorer in child mode, right-click the Explorer window title bar, and then click
MDI Child.
Moving the Explorer window
You can move the Explorer window in a number of ways:
Click the title bar and drag.
Right-click the title bar, then select a new docking location, floating, or child mode.
Working with editors
When developing an application, you will use many different editors, but they have many
similar features and often require similar information. Knowing how to use these features
saves time.
For information on working with particular editors, see the chapters later in this guide.
2-10
Locating editors
The editors are grouped in folders in the Explorer window (see the illustration on
page 2-10). Each editor is displayed with an icon to the left of the editor name.
To open a folder in the Explorer window
1. Click the + symbol to the left of the folder icon, or double-click the folder name.
Viewing an editor's components
With some editors you enter information in a single window or a tabbed dialog box. Other
editors allow you to create multiple components, such as graphic displays or message
files. Each component is stored in a separate file, with its own name.
You can create components in these editors:
Graphics (components include graphic displays, global object displays, and graphic
libraries, each in their own folder)
Parameters
Local Messages
Information Messages
Data Log Models
Macros
RecipePlus
The Explorer window lists the components you create under the icon for the editor you
used to create the component.
You can use the Images editor to copy bitmap images into your application (but not to
create new images). Each image you copy is listed as a component under the editor.
To view a list of components for an editor
1. Click the + symbol to the left of the editor icon, or double-click the editor name.
Opening editors
To open an editor
1. Right-click the editor, and then click Open or New.
If there are no components in the editor, you can double-click the editor to open it.
2-11
• • • • •
2 • Exploring RSView Studio
• • • • •
RSVIEW MACHINE EDITION USER’S GUIDE
Closing editors
To close an editor
1. Click the close button on the editor’s title bar, or on the File menu click Close.
Some editors have an OK, Cancel, or Close button that you can click to close the
editor.
Entering information in spreadsheets
Some editors contain spreadsheets for entering information. You can enter information in
the white columns. Gray columns display information; you cannot enter information in
them.
This column is for display
purposes only.
These editors contain spreadsheets:
2-12
Tags*
User Accounts**
Global Connections
Local Messages
Alarm Setup
Information Setup
Information Messages
Macros
RecipePlus Editor
Enter information in this
column.
* You cannot make changes in the spreadsheet section of the Tags editor. In this editor,
you must use the Form section of the editor to create and edit tags.
** The User Accounts editor has two tabs. You can use the spreadsheet in the RSView 3.x
Accounts tab, but not in the RSView 4.0 Accounts tab.
In the Graphics editor, many of the Properties dialog boxes for setting up graphic objects
contain spreadsheets for assigning tags or expressions to the objects.
To enter information in a cell in a spreadsheet
1. Click the cell, and then type the information. If the cell already contains text, the new
information is added after the current text.
In the Property Panel, double-click the cell and then type the information. If the cell
already contains text, double-clicking highlights the text and typing replaces the
highlighted text.
To move to the next cell in the row
1. Press Tab or Enter.
The method to use depends on which editor you’re working in.
To move to the first cell in the next row
1. Press Enter or Down Arrow.
The method to use depends on which editor you’re working in.
To delete a cell’s contents
1. Click the cell, and then press Delete or Backspace. Pressing Backspace removes the
characters one by one.
The method to use depends on which editor you’re working in.
To delete rows
1. Select one or more rows, right-click the selection, and then click Delete Rows.
Working with components
This section describes how to perform basic operations that are common to all
components.
For information on working with components in particular editors, see the chapters later
in this guide.
2-13
• • • • •
2 • Exploring RSView Studio
• • • • •
RSVIEW MACHINE EDITION USER’S GUIDE
Creating components
To create a new component, do one of the following
Drag the component icon into the workspace.
Right-click the editor, and then click New.
On the File menu, select New, and then click the type of component to create.
Opening components
To open a component, do one of the following
Double-click the component.
Right-click the component, and then click Open.
Drag the component from the Explorer window to the workspace.
Saving components
The Save tool is available when the active component contains unsaved changes.
To save a component
1. On the File menu, click Save, or click the Save tool.
Save tool
2. If this is the first time you’re saving the component, type a name in the Component
name box, and then click OK.
Closing components
To close a component
Close button on
the title bar
Close button in
component
2-14
1. On the File menu, click Close, or click the Close button on the component’s title bar.
Some components have a Close button that you can click to close the component.
Before the component closes you are prompted to save unsaved changes, if there are
any.
Adding components into an application
You can use the same components in more than one application by adding components
into an application.
For example, if you want to use the same graphic display in Application A and
Application B, create the display in Application A, then add the graphic display
component from Application A to Application B.
When you add the component into Application B, changes you make to the component in
Application B are not reflected in the component in Application A.
To add a component from Application A into Application B
1. In Application B, right-click the type of editor that was used to create the desired
component.
For example, to add a graphic display component, right-click the Displays icon in the
Graphics folder.
2. Click Add Component Into Application.
3. In the dialog box, navigate to the component to add (in Application A’s folder), and
then click the component’s file name.
Click and Shift-click to select a group of components, or Ctrl-click to select multiple
individual components.
For information about application folders and files, see Chapter 4, <italics>Working
with applications.
4. Click Open. The components are listed under the editor in the Explorer window in
Application B.
2-15
• • • • •
2 • Exploring RSView Studio
• • • • •
RSVIEW MACHINE EDITION USER’S GUIDE
If you later modify the component in Application A, you can add the component into
Application B again using the same steps as described above.
Using Add Component Into Application with graphic displays,
graphic libraries, and global object displays
The Add Component Into Application menu command is also useful for:
adding graphic displays to your application’s Libraries folder.
using libraries as graphic displays in your application.
moving libraries into the Displays folder so you can export their strings for translation.
creating global object displays.
For information about graphic libraries, see page 14-15. For information about global
object displays, see page 14-14.
Deleting components
Deleting a component deletes it from the Explorer window and from the hard disk.
To delete a component
1. Right-click the component, and then click Delete.
Removing components
You can remove a component from the Explorer window but leave it on the hard disk, in
case you want to use the component in another application.
To remove a component
1. Right-click the component, and then click Remove.
Renaming components
To rename a component
1. Right-click the component, and then click Rename.
2. In the To box, type the new name.
2-16
3. Click OK.
Duplicating components
The Duplicate option is useful for creating multiple similar components. For example, you
could create a graphic display to use as a template, then duplicate the display each time
you want to use the template.
To duplicate a component
1. Right-click the component, and then click Duplicate.
2. In the Component name box, type a name for the duplicate component.
3. Click OK.
Printing
Each editor and component has a Print item on its File menu.
To print an editor or component’s contents
1. Open the editor or component.
2. On the File menu, click Print.
3. Click OK.
Selecting a printer
You must install a printer before you can select it. For information about installing a
printer, see your Windows documentation.
The Print Setup menu item in RSView Studio applies to your development computer only.
To print at runtime, set up a printer on the computer you’ll be using to run your application. For
more information about printing at runtime, see page 2-18.
To select a printer
1. On the File menu in any editor or component, click Print Setup.
2-17
• • • • •
2 • Exploring RSView Studio
• • • • •
RSVIEW MACHINE EDITION USER’S GUIDE
2. If you don’t want to use the default printer, specify another printer.
3. Choose the appropriate paper and orientation options.
4. Click OK.
Selecting printer setup options
For detailed information about printer options, refer to your Windows documentation.
Selecting a network printer
RSView Studio can print to a network printer. For detailed information about setting up
network printers, refer to your Windows documentation.
Printing at runtime
You can print graphic displays at runtime using the display print button or using a remote
display print. You can also send diagnostics and alarm messages to a printer at runtime.
2-18
For information about
See
Display print buttons
page 14-34
Printing graphic displays
page 14-34
Printing displays remotely
page 8-2
Printing alarm messages
page 9-9
For information about
See
Printing diagnostics messages
page 10-8
Specifying the printers to use at runtime for
Windows 2000 or Windows XP applications
page 26-10
The type of printer to use with a PanelView
Plus™ or VersaView CE terminal
page 27-1
2-19
• • • • •
2 • Exploring RSView Studio
3
Planning applications
A well-designed application requires planning. To help you plan, this chapter describes:
understanding the machines and processes you’re automating.
collecting data.
designing an HMI tag database.
planning graphic displays and navigating between them.
planning languages.
planning alarms.
providing information for the operator.
planning trends.
planning recipes.
designing a secure system.
RSView® comes with several sample applications that can give you guidance when
planning your application. For instructions on opening the sample applications, see
page 2-2.
Understanding the process
Gather information from a variety of sources so you have a complete and detailed
understanding of the machines and processes you’re automating.
To gather information:
Talk to machine operators and other experts who are going to use the system. Find out
what information they need to optimize machine operations and processes.
Talk to management and management information systems staff to find out what
information they need to support planning decisions.
Break up each section of the process into its constituent parts.
Determine what type of communications you’ll be using—which network types, data
servers, and devices.
Determine which process variables you need to have access to and identify their
locations in the programmable controllers.
For information about setting up communications, see Chapter 5.
3-1
• • • • •
RSVIEW MACHINE EDITION USER’S GUIDE
Collecting data
When planning data collection, design your system so only essential data is collected.
Limiting data collection is important because collection activities require substantial
processing power and generate a lot of traffic on the network.
Keep data collection requirements in mind when designing the layout of the
programmable controller data tables and the HMI tag database. Ideally, tag addresses
reference contiguous blocks of programmable controller data tables to reduce highway
traffic and optimize system response. If you’re going to use data from an OPC® server,
read the server documentation to find out how to optimize traffic.
Designing an HMI tag database
Take the time to plan your HMI tag database. A good design helps reduce the time
required for maintenance and can improve programmable controller-to-RSView response
time.
For information about creating HMI tags, see Chapter 7.
If you are going to use direct referencing for all your tags, you don’t need to create HMI
tags in RSView. For information about creating direct references to data server tags, see
Chapter 6.
Collecting information
Before you begin creating the tag database, collect:
flowcharts of your processes (or process and instrument diagrams).
a list of programmable controller data table or register addresses your application will
have access to.
machinery systems documentation.
alarm requirements (for more information, see page 3-5).
Organizing tags
Before creating tags:
Develop naming conventions for tags, choosing names that are familiar and logical to
everyone. This makes troubleshooting easier.
Group related tags.
Group tags in the way that makes the most sense for your application. For example,
group all similar devices or group related areas of the plant floor.
3-2
When creating tags, place related tags into folders. For greater organization, nest
folders.
Planning graphic displays
When planning displays, determine the best way for users to navigate through your
displays and develop a template to establish a common look and feel for your displays.
Also consider factors about the runtime terminal that affect how the application is
displayed and used, such as:
screen size.
whether the operator will be using a keyboard, touch screen, mouse, or combination of
navigation and data entry methods.
For information about creating graphic displays, see Chapter 14.
Developing a hierarchy of displays
A hierarchy of displays is a series of graphic displays that provide progressively more
detail as users move through them. Design your display hierarchy to meet the needs of the
various users, including managers, supervisors, and operators.
Well-organized graphic displays present information clearly and consistently and guide
users through the system. Before designing individual graphic displays, plan an overall
display hierarchy and plan how users will navigate through the hierarchy.
For information about navigation methods and developing a hierarchy of displays, see
Chapter 8.
Creating a template to ensure consistency
It is possible to keep a consistent appearance among all the displays in an application by
presenting the same pieces of information in the same place on each graphic display. To
ensure uniformity, develop a display with common elements that acts as a template. Each
time you develop a new display, start with a duplicate of the template.
For example, the template could contain:
your company logo.
a title.
the date and time.
navigational buttons.
Use global object displays to create template objects. You can copy the objects into your
graphic displays, and update all the objects at once by updating the original object in the
3-3
• • • • •
3 • Planning applications
• • • • •
RSVIEW MACHINE EDITION USER’S GUIDE
global object display. For information about creating global object displays, see
page 14-14.
Designing displays
When designing displays, applying good visual design principles helps users and
increases their efficiency. Remember these important design principles:
Consistency
Be consistent with your use of symbols and color.
Be consistent with button labels and button placement.
When you design several displays, place the same kinds of buttons in the same
positions. For example, if you have a Start button in a certain position in one display,
don’t put a Stop button in the same position in the next display.
Clarity
Use symbols that are easily recognizable. For example, use the conventional ISA
symbols for tanks and valves.
Don’t overload the screen with information.
Use standard, clear terminology, and avoid abbreviations or acronyms that the user
might not understand.
Use colors with recognizable meanings. For example, in North America the colors red
and green usually mean stop and start. Keep color meanings consistent by assigning
red only to Stop buttons, and green only to Start buttons.
Some people are color blind to red and green so don’t rely on color alone to establish
meaning.
Use high contrast color combinations, such as yellow on blue.
Usability
If you’re designing for a touch screen, don’t place important buttons where they’ll be
blocked by an On Top display. The user can’t press a covered button. Also, ensure the
button is large enough for users to touch easily.
Ensure there is always a clear way to move between displays.
Keep the intended user in mind and design displays so they are easy to understand and
use. Ask the users to test the displays.
Planning languages
Before setting up languages, plan:
3-4
what languages you need to use.
what Windows fonts support these languages.
how different languages will affect design elements in your graphic displays, such as
object size and message length.
whether operators need to switch languages at runtime, and if so, under what
conditions. This will help you determine where to locate language switch buttons in
your application.
how to show operators which button to press to switch to their languages. For
example, by using a text label in French, or a French flag, to alert a French operator.
For information about setting up language switching, see Chapter 23.
Planning alarms
Before setting up alarms, plan:
what conditions will trigger alarms.
how operators will be notified of alarms.
what information you want alarm messages to contain.
how operators will respond to alarms.
For information about setting up alarms, see Chapter 9.
Providing information for the operator
In addition to notifying the operator of alarm conditions, you can provide information and
instructions about plant processes, and inform the operator about system activities.
Before setting up information notification, plan:
what system activity the operator needs to be informed about.
what conditions will trigger information messages.
what information you want the messages to contain.
Local and information messages
Use local messages to give the operator information in a specific graphic display while the
display is open. Use information messages to give the operator information no matter
which display is open.
For information about setting up local messages, see page 14-29. For information about
setting up information messages, see Chapter 12.
3-5
• • • • •
3 • Planning applications
• • • • •
RSVIEW MACHINE EDITION USER’S GUIDE
Diagnostics messages
Set up diagnostics messages to notify the operator of system activity such as tag reads and
writes, running macros, communication problems, or problems opening displays.
For information about setting up diagnostics messages, see Chapter 10.
Planning trends
When planning trends, consider how they will be used. For example, will the trend be
used to:
analyze process trends?
monitor production efficiency?
archive process variables to ensure compliance with government regulations?
Based on such considerations, you can determine:
which tags need to be plotted on the same trend.
which tags need to be logged by using a data log model.
For information about setting up data logging, see Chapter 11. For information about
creating trend graphic objects, see Chapter 18.
Planning recipes
When planning recipes, consider how they will be used. For example, will recipes be used
to:
compare tag values to pre-set data values?
upload tag values to existing or new data sets?
download values from data sets to tags?
archive tag values to ensure compliance with government regulations?
Based on such considerations, you can determine:
which tag sets and data sets to pair together in a recipe file.
which RecipePlus button actions to use with the RecipePlus selector and RecipePlus
table.
For information about using recipes and creating RecipePlus graphic objects, see
Chapter 19.
3-6
Designing a secure system
When deciding on your security requirements, consider whether to:
restrict access to every graphic display to prevent accidental changes.
restrict access to certain graphic displays.
have everyone log on.
use passwords, and if so, whether to have a minimum length, and whether to require
that the passwords are changed periodically.
allow only authorized users to shut down the application.
use the DeskLock tool to prevent users from switching to another application at
runtime (Windows® 2000 and Windows XP runtime applications only).
Based on these considerations, you can set up security for individual users or groups of
users. For example, you might want to set up groups of users such as a manager group and
an operator group.
For more information about setting up security, see Chapter 13.
3-7
• • • • •
3 • Planning applications
4
Working with applications
This chapter describes:
application files.
creating, importing, opening, and closing applications.
renaming, copying, deleting, backing up, and restoring applications.
specifying project settings.
viewing application properties.
viewing HMI server properties.
What is an application?
An application is the software application you create in RSView® Studio™ to monitor and
control your plant processes. An application consists of one or more data servers and an
HMI project (also known as an HMI server). The data servers provide communications
for the project. The project or HMI server consists of graphic displays, alarm information,
user information, and other settings.
For information about viewing the application properties, see page 4-17. For information
about viewing the HMI server properties, see page 4-17.
Application versus project
This manual generally uses the term application to refer to both application-level and
project-level procedures. An exception is the section on using the Project Settings editor,
which begins on page 4-10. In that section, the term project is used.
When you create an application, RSView creates folders and files in various locations on
the development computer. Some of the folders are empty until you start setting up your
application. When you finish developing the application, RSView uses the information in
the various folders and files to create the runtime application.
HMI project file
The HMI project file has the extension .med. The HMI project file is located in this
directory:
C:\Documents and Settings\All Users\Documents\RSView Enterprise\ME\HMI
projects (Windows® 2000)
or
4-1
• • • • •
RSVIEW MACHINE EDITION USER’S GUIDE
C:\Documents and Settings\All Users\Shared Documents
\RSView Enterprise\ME\HMI projects (Windows XP)
Runtime application file
The runtime application consists of a file with the extension .mer. For information about
creating the runtime application, see Chapter 25.
Component files
Component files are located in folders in the HMI project folder, as described in the
following table. For example, graphic display component files (with the extension .gfx)
are stored in the Gfx folder. You might need to navigate to the location of these files, for
example if you are adding a component from one application into another application.
This folder
Contains
File extensions
Application name
HMI project file and the folders described below .med
DLG
Data log models (component files)
.mdf
Gfx
Graphic display component files
.gfx
Global Objects
Global object display component files
.ggfx
Images
Image files
.bmp or .jpg
Information
Information message component files
.ifm
Local
Local message component files
.loc
Macros
Macro component files
.mcr
PAR
Parameter component files
.par
RecipePlus
RecipePlus component files
.rpp
External folders
The following table lists some RSView folders that are external to the HMI project folder,
and the types of files they contain.
The folders are located in this directory:
C:\Documents and Settings\All Users\Documents\RSView Enterprise (Windows
2000)
or
4-2
C:\Documents and Settings\All Users\Shared Documents\
RSView Enterprise (Windows XP)
This folder
Contains
File extensions
Images
Image files for use on graphic objects
.bmp
ME\Libraries
Graphic library component files and image files .gfx
used in the library displays
.bmp
Data log files for applications that have run on .log, .tag
ME\Logs\Runtime
the development computer
Application Name\
Dlg\Data Log Model Name
ME\Logs\Runtime
Application Name\
M_Alarms
Alarm log file for applications that have run on .alm
the development computer
ME\Runtime
Runtime application files
ME\HMI projects
Sample application folders, including all files
and folders needed for the sample
.mer
If desired, you can specify a different directory in which to store graphic library
component files. For more information, see page 14-19.
Default log file locations for PanelView Plus or VersaView CE
applications
On the PanelView Plus™ or VersaView® CE terminal, alarm and data log folders are
located by default in this directory:
\\Storage Card\Rockwell Software\RSViewME\Logs\
Data log file locations
You can also store data log files in a different location on the runtime computer, on a
networked computer, or on a PC card. For more information, see Chapter 11.
Naming files
File names, including the path, can be up to 200 characters long (file names can contain
spaces). For example, the following path and file name contains 114 characters:
C:\Documents and Settings\All Users\Documents\RSView Enterprise\ME\HMI
projects\Malthouse Clgx 640x480\Gfx\Steeping.gfx
4-3
• • • • •
4 • Working with applications
• • • • •
RSVIEW MACHINE EDITION USER’S GUIDE
Creating, importing, opening, and closing applications
Creating applications
You can create a new application when you start RSView Studio, or once RSView Studio
is already open.
To create a new application when you start RSView Studio
1. Start RSView Studio.
2. In the New tab, in the Application name box, type a name for your application, up to
32 characters long.
3. If desired, type a description of the application. If you don’t type a description now,
you can add one later, as described on page 4-17.
4. Specify a language for the graphic display strings in the application. For information
about using different languages, see Chapter 23.
5. Click Create.
RSView Studio creates the application’s folders and files, and then displays the new
application in the Explorer window.
The application is created in the ME\HMI projects directory, in a folder with the same
name as the application name.
This is the path to the ME\HMI projects directory:
4-4
C:\Documents and Settings\All Users\Documents\RSView Enterprise\ME\HMI
projects (Windows 2000)
or
C:\Documents and Settings\All Users\Shared Documents\
RSView Enterprise\ME\HMI projects (Windows XP)
Once you create the application, specify the project settings. These settings determine the
general appearance of your runtime application, and affect how your graphic displays look. For
more information, see page 4-16.
To create a new application when RSView Studio is already open
1. On the File menu, click New Application, or click the New Application tool.
New Application
If an application is already open, RSView Studio asks you whether to close the
application that is currently open. Click Yes.
2. Follow steps 2 through 5 in the previous procedure.
Importing applications
You can import PanelBuilder™, PanelBuilder32, PanelBuilder 1400e, and RSView
Machine Edition applications into RSView Studio.
PanelBuilder and PanelBuilder32 files can be in either development format (*.pba) or
runtime terminal format (*.pva). PanelBuilder 1400e files have the file extension *.pvc.
When you import older application files, RSView creates a copy of the application for the
current version of RSView. The older version is not altered.
You can use current version application files to create previous version runtime files. For
more information, see page 4-9.
If the application you are importing contains any direct driver nodes, the import wizard
will create one RSLinx® topic for each direct driver node it finds. All topics are then
converted into device shortcuts, to run with RSLinx Enterprise. You must have both
RSLinx® Classic and RSLinx Enterprise installed to make this two-step conversion.
To create RSLinx topics after import, follow these steps in RSLinx before importing the
application.
To validate direct driver nodes in RSLinx
1. Create the appropriate RSLinx Classic drivers if not already created (for example,
AB_ETH-1).
For more information about creating RSLinx Classic drivers, see the RSLinx Classic
Help.
4-5
• • • • •
4 • Working with applications
• • • • •
RSVIEW MACHINE EDITION USER’S GUIDE
2. If it is an Ethernet® driver (AB_ETH-1), add the IP address of each direct driver node
to the Ethernet driver setup.
3. Start RSWho and select each device associated with each direct driver node (for
example, 131.200.13.128).
If these steps are not followed in this order, the topics generated by the import code
will be invalid and will need to be fixed using the Topic Editor in RSLinx.
To import an application
1. Start RSView Studio
2. In the New tab, in the Application name box, type a name for the imported
application, up to 32 characters long.
3. If desired, type a description of the application. If you don’t type a description now,
you can add one later, as described on page 4-17.
4. Specify a language for the graphic display strings in the application. For information
about using multiple languages, see Chapter 23.
5. Click Import. The Machine Edition Import Wizard opens.
For more information about importing PanelBuilder 1400e applications, see
Appendix A. For more information about importing PanelBuilder and PanelBuilder32
applications, see Appendix B.
Opening applications
You can open an application when you start RSView Studio, or once RSView Studio is
already open.
Older RSView Machine Edition application files are converted to the current version of
RSView when you open them. However, you can still use the current version of RSView
Studio to create older version runtime files. For information about the features supported
in different versions of RSView, see Appendix G.
For information about opening a sample application, see page 2-2.
To open an existing application when you start RSView Studio
1. Start RSView Studio.
4-6
2. Click the Existing tab, and then click the application to open.
3. Select a language:
If you haven’t opened the application in RSView 4.0 before, specify a language
for the application.
If the application uses multiple languages, specify the language to open.
The selected language determines the language of the graphic display strings that are
displayed when the application opens. For information about using different
languages, see Chapter 23.
4. Click Open.
RSView Studio displays the application in the Explorer window.
To open an existing application when RSView Studio is already
open
1. On the File menu, click Open Application, or click the Open Application tool.
Open Application
4-7
• • • • •
4 • Working with applications
• • • • •
RSVIEW MACHINE EDITION USER’S GUIDE
If an application is already open, RSView Studio asks you whether to close the
application that is currently open. Click Yes.
2. Follow steps 2 through 4 in the previous procedure.
To open an application you used recently
1. On the File menu, select Recent Applications, and then click the name of the
application to open.
2. If an application is already open, RSView Studio asks you whether to close the
application that is currently open. Click Yes.
The application opens. For applications with multiple languages, the language you
used most recently opens. For information about using different languages, see
Chapter 23.
Problems opening applications
If you have trouble opening an application in RSView Studio, the problem could be a
Microsoft® Windows security setting. You must have read and write access to the folder
that contains the HMI projects. For example, if you belong to the Windows user group
called Power Users, and the group does not have write access to the HMI projects folder,
you won’t be able to open applications in RSView.
The default location for the HMI projects folder is:
C:\Documents and Settings\All Users\Documents\RSView Enterprise\ME
(Windows 2000)
or
C:\Documents and Settings\All Users\Shared Documents\RSView Enterprise\ME
(Windows XP)
For more information about security, see Chapter 13.
To set up write access for Power Users
1. Right-click the HMI projects folder, and then click Properties.
2. In the Security tab of the Properties dialog box, select Power Users from the list of
groups and user names.
3. In the Permissions box below the list, select Full Control, and then select Allow.
4-8
Opening multiple applications
To open two applications at the same time, for example to copy images and graphic
objects between applications, start two instances of RSView Studio.
To view a graphic display in different languages at the same time, open the application multiple
times, selecting a different language each time you open it.
Opening and editing applications from earlier versions of
RSView
You can open and edit applications from RSView 3.0, 3.1, and 3.2. When you are finished
editing, you can create runtime application files for RSView ME Station version 3.0, 3.1,
or 3.2. This allows you to continue running your applications on existing terminals,
without upgrading all your software.
The application is converted to RSView 4.0 when you import it, but when you create the
runtime application file you can save it back to the earlier version.
You can even use RSView 4.0 global objects, and create multiple language versions of
your older applications. When you create the runtime application file, it uses the
application’s current language. You can create as many different runtime application files,
in as many different languages, as you want. However, the language switch feature is not
available at runtime for earlier version applications. Global objects are converted to
regular objects in the runtime application file.
For information about importing applications, see page 4-5. For information about the
features supported in different versions of RSView, see Appendix G. For information
about using multiple languages, see Chapter 23. For information about using global
objects, see Chapter 14.
Closing applications
To close an application
1. On the File menu, click Close Application.
If there are any unsaved changes in open editors, RSView Studio asks you whether to
save the changes before closing the application.
To close an application and exit RSView Studio at the same time
1. Click the Close button at the right end of the RSView Studio title bar.
Close button
If there are any unsaved changes in open editors, RSView Studio asks you whether to
save the changes before closing.
4-9
• • • • •
4 • Working with applications
• • • • •
RSVIEW MACHINE EDITION USER’S GUIDE
Renaming, copying, deleting, backing up, and restoring
applications
Use the Application Manager tool to:
rename applications.
copy applications.
delete applications.
create a compressed backup copy of an application, with the file extension .apa.
restore an application from the backup file, with the file extension .apa.
restore a legacy project backup file (with the file extension .mea) from an earlier
release of RSView Studio, and convert it to Version 4.0.
To start the Application Manager tool, do one of the following
In RSView Studio, on the Tools menu, click Application Manager.
On the Windows Start menu, select Programs, Rockwell Software, RSView
Enterprise, Tools, and then click Application Manager.
For details about using the tool, see the tool’s Help.
About project settings
Project settings determine the general appearance of your runtime application, such as the
size of the project window and whether a title bar appears in the project window.
Since project settings affect how your graphic displays look, specify the settings before
creating graphic displays.
Project window size and runtime screen resolution
This section describes the difference between project window size and runtime screen
resolution, and describes how these two settings can affect the behavior of your
application at runtime.
The project window size is the amount of room your application occupies on the runtime
terminal or computer screen, in pixels. The runtime screen resolution is the actual size of
4-10
the runtime terminal or computer screen, in pixels. Therefore, the project window size
must be less than or equal to the runtime screen resolution.
Project window size
(640 x 480 pixels)
Screen resolution
(1024 x 728 pixels)
Usually, an application is designed to completely fill the runtime terminal or computer
screen. If you want your application to do this, set the project window size to the
resolution of the screen in pixels. For information on setting the project window size, see
page 4-16.
Screen resolution for PanelView Plus and VersaView CE terminals
If you are going to run your application on a PanelView Plus or VersaView CE terminal,
select one of these project window sizes:
For this terminal or monitor
Select this project window size
PanelView Plus 400 or 600
320x240
PanelView Plus 700 or 1000
640x480
VersaView CE 700H or 1000H
4-11
• • • • •
4 • Working with applications
• • • • •
RSVIEW MACHINE EDITION USER’S GUIDE
For this terminal or monitor
Select this project window size
PanelView Plus 1250
800x600
VersaView CE 1250H
VersaView 1200P, 1200M, or 1200W
PanelView Plus 1500
1024x768
VersaView CE 1500H
VersaView 1500P, 1500M, or 1500W
VersaView 1700M
1280x1024
VersaView 2000M
1600x1200 (Custom size)
If you are creating an application for a PanelView Plus 400 or 600 terminal:
Resize the default message displays so that the entire message is visible.
Reposition the [ALARM] display from the default position (0, 0), as this position is
below the viewing area of the terminals.
Changing the project window size after creating graphic displays
The project window size is used for all graphic displays of the Replace type. If you change
the window size after you have already created graphic displays, you have the option of
scaling graphic displays.
If you choose to scale graphic displays, all Replace and On Top displays are resized and
the objects in them are scaled to fit the new size. You can also specify whether to scale the
font size and border size of the graphic objects, and the size of graphic images in the
Images folder.
If you choose not to scale displays when you change the project window size, Replace
displays are resized, but any objects in the displays remain the same size and in the same
position as before. On Top displays are not resized.
For more information about Replace and On Top displays, see page 14-12. For more
information about scaling displays, see Help.
4-12
How the runtime screen resolution affects the pop-up windows
RSView comes with a pop-up Login window, as well as numeric and string pop-up
windows for runtime data entry, and a Change Password window for changing user
passwords at runtime.
RSView sizes the pop-up
window to occupy the
center of the screen.
How the project window size affects the default message displays
Your application comes with preconfigured, default graphic displays for diagnostics,
alarm, and information messages. If the project window size is smaller than the default
displays, the edges of the displays are cut off at runtime.
These are the sizes of the default displays:
Graphic Display
Width in pixels
Height in pixels
[DIAGNOSTICS]
640
160
[ALARM]
640
210
[INFORMATION]
640
80
If your project window size is smaller than the default message display sizes, you can
resize the default displays, or use your own displays instead.
4-13
• • • • •
4 • Working with applications
• • • • •
RSVIEW MACHINE EDITION USER’S GUIDE
Title bar
If you select this option, a title bar is used for all Replace graphic displays. For
information about graphic display types, see page 14-12.
If desired, you can also use a Control box, Minimize button, and Close button on the title
bar. The Close button appears only if you select the Control box in the Project Settings
editor.
Title
Graphic display name
Control box
Minimize button
Close button
If you plan to set up security for your application and want to prevent unauthorized users
from stopping the application, do not use a title bar.
For information about setting up security, see Chapter 13.
Changing the Title bar or Border setting
If you change the Title bar or Border setting, you have the option of scaling graphic
displays to accommodate the new display size. For details, see Help.
4-14
Title bar for On Top displays
For On Top displays, you can specify a different name to use in the title bar. Use the
Display Settings dialog box to specify the name (for details, see Help).
The title you specify in the
Project Settings editor
applies to all replace
displays.
You can specify a different
title for each On Top display
(using the Display Settings
dialog box in the Graphics
editor).
4-15
• • • • •
4 • Working with applications
• • • • •
RSVIEW MACHINE EDITION USER’S GUIDE
Specifying project settings
To specify project settings, use the Project Settings editor. For details about selecting
options in the editor, see Help.
4-16
Viewing application properties
You can view this information about your application:
application name
application description, if any
To view application properties
1. On the Application menu, click Application Properties.
Viewing HMI server properties
You can use the Explorer window to view this information about your project or HMI
server:
application name
application description, if any
location of the project file
number of graphic displays in the application
maximum number of displays you’re licensed to use
4-17
• • • • •
4 • Working with applications
• • • • •
RSVIEW MACHINE EDITION USER’S GUIDE
To view HMI server properties
1. In the Explorer window, right-click the HMI server name, and then click Properties.
4-18
5
Setting up communications
This chapter describes:
OPC® communications.
what data servers are.
creating data servers in your application.
updating data server caches.
About OPC communications
OPC® is OLE for Process Control, used to connect RSView® to communication devices
via vendor-specific OPC servers. RSView supports the OPC Data Access (DA) 2.0
specification.
OPC servers provide a way for RSView to retrieve tag values from:
Allen-Bradley® controller devices, using RSLinx® Classic or RSLinx Enterprise™ as
an OPC server.
third-party controller devices, such as Siemens or Modicon®, using third-party OPC
servers such as KEPServerEnterprise™.
ControlNet Scheduled, DeviceNet I/O and Remote I/O are supported on PanelView Plus and
Windows CE terminals. They are not supported on Windows 2000/XP.
Summary of steps
To set up communications, follow these steps:
1. Gather information about your network, and the devices that are connected to it. You
will need this information to set up RSLinx Enterprise, RSLinx Classic, or another
OPC server.
2. If you want to use RSLinx Enterprise for communications, install it on the
development computer.
For information about installing RSLinx Enterprise, see the RSView Machine Edition
Installation Guide.
3. If you want to use RSLinx Classic as the OPC server that enables communications on
your network, set up RSLinx Classic on the development computer. RSLinx Classic is
included on the RSView Machine Edition™ CD-ROM. For details, see Getting Results
with RSLinx, or see Help for RSLinx.
5-1
• • • • •
RSVIEW MACHINE EDITION USER’S GUIDE
RSLinx Classic is available for Windows® 2000 and Windows XP platforms only.
4. If you want to use an OPC server other than RSLinx Classic for communications on
your network, set up the OPC server on the development computer. For details, see the
documentation supplied with your OPC server.
5. In RSView Studio™, create a data server that points to the OPC server you set up in
step 3 or step 4.
For details, see page 5-3.
If you are using RSLinx Enterprise for communications, you don’t need to create a
data server because it is created automatically when you create your application.
6. If you want to use HMI tags in your application, open the Tags editor, and then create
device tags that point to addresses in devices. For details about creating HMI tags, see
Chapter 7.
If you do not want to use HMI tags, but instead want to reference addresses in devices
directly, skip this step.
7. In objects in graphic displays, or anywhere else you want access to values in tags, type
the tag name using the syntax for your OPC server, or use the Tag Browser to select
tags. For details about using tags, see Chapter 6.
8. Create the runtime application file. For details, see Chapter 25.
All the necessary tag information is compiled with the runtime application file.
9. If you are using an OPC server other than RSLinx Enterprise or RSLinx Classic,
install the OPC server software on the runtime computer.
For Windows 2000 and Windows XP applications, the OPC server can be on a
different (remote) computer than the runtime computer, but the remote computer must
be on the same network as the runtime computer.
About data servers
A data server provides a route to the physical devices on your network, so you can see the
values in those devices, for example:
5-2
programmable controller values.
OPC tags, and their value or status information.
named variables in a ControlLogix® processor.
Creating data servers
An RSLinx Enterprise data server is created automatically with a new application. It is
located under the application’s HMI server in the Explorer window, just above the
FactoryTalk System folder.
You can create additional OPC data servers for your application. For example, you might
want to use an RSLinx Enterprise data server and a KEPServerEnterprise data server.
Setting up RSLinx Enterprise data servers
Use an RSLinx Enterprise data server when you want to use RSLinx Enterprise
communications.
You can use the Communication Setup editor to add drivers, add devices, set up driver and
device properties, and set up device shortcuts.
To set up communications in RSLinx Enterprise
1. In the Explorer window, open the RSLinx Enterprise data server.
2. Double-click the Communication Setup editor.
3. In a new application, the RSLinx Configuration Wizard appears. Follow the
instructions to create a new configuration or use an existing device configuration.
Once you make a choice and click Finish, the Communication Setup editor opens.
In an existing application, double-clicking Communication Setup opens the
Communication Setup editor, with its two tabs. The Local tab is for establishing the
location of the tags/addresses for editing. The tags/addresses can be online with a
controller or other data server, or an offline controller file. This will enable the Tag
Browser to find the tags/addresses.
The Target tab is for identifying the connection from the run-time computer or
terminal to the controller or other data server. If the paths are the same, use the Copy
button to copy the Local configuration to the Target tab.
For more information, see Help for RSLinx Enterprise.
5-3
• • • • •
5 • Setting up communications
• • • • •
RSVIEW MACHINE EDITION USER’S GUIDE
Setting up an OPC data server
Use an OPC data server if you want to use RSLinx Classic instead of RSLinx Enterprise,
or if you want to use a third party OPC data server.
You can set up a cache for tags on the data server. A cache allows you to view tag names
when you are not connected to the data server.
To create an OPC data server
1. In the Explorer window, right-click the application, select New Data Server, and then
click OPC Data Server.
For details about selecting options in the OPC Data Server Properties dialog box, see
Help.
For information about editing and removing data servers, see Help.
5-4
Updating data server caches
If tags are added, modified, or deleted on the data server, you must update (synchronize)
the cache manually.
For information about updating the data server cache periodically after you create it, see
Help.
5-5
• • • • •
5 • Setting up communications
6
Working with tags
This chapter provides general information about working with all kinds of tags. This
chapter describes:
types of tags.
when to use data server tags.
steps for using data server tags.
when to use HMI tags.
steps for using HMI tags.
browsing for tags and offline tags.
using the Tag Browser.
using tags and expressions in your application.
logging tag values.
using macros to assign values to tags.
For information about creating HMI tags, see Chapter 7.
Types of tags
A tag is a logical name for a variable in a device or in local memory (RAM). For example,
a tag can represent a process variable in a programmable controller.
Data server tags
RSView® conforms to the OPC® Data Access (DA) 2.0 specification for information
exchange among automation or control applications, field systems or devices, and
business or office applications.
In RSView, data servers such as RSLinx® Enterprise™, RSLinx® Classic, and
KEPServerEnterprise™ provide access to OPC-DA-compliant tags. In the RSView
documentation, the tags you use through a data server are called data server tags. For
more information about data servers, see Chapter 5.
Data server tags include tags found in ControlLogix® processors and tags from other
OPC-compliant devices. You use data server tags by providing a direct reference to the
tag’s location, wherever you want your application to use the data.
6-1
• • • • •
RSVIEW MACHINE EDITION USER’S GUIDE
HMI tags
In addition to direct referencing tags from data servers, RSView allows you to create tags
with additional properties such as minimum and maximum values, scale, and offset.
These tags can reference values at an external data source, or store values in the runtime
computer’s memory. Tags you create in RSView are called HMI tags.
The data source
The RSView documentation uses the term data source as a generic term that includes all
possible sources of tag data, for both data server tags and HMI tags. The data source can
be memory or a device such as a programmable controller or an OPC server. RSView
writes values to and reads values from the data source. The data source is set up to
exchange information (in the form of numeric or string values) between the RSView value
table and the machine that your application is controlling.
Basic steps for using tags
To use tags, follow these basic steps:
1. If the tag does not already exist, create the tag.
To use a data server tag, you can use an existing tag in the processor (for example, a
programmable controller), or you can create a new one in the processor or OPC server.
For example, in a ControlLogix processor, you could create the tag using your
RSLogix™ 5000 programming software.
To use an HMI tag, you must first create it in the Tags editor. For details, see
Chapter 7.
2. Browse for, or type, the name of the tag anywhere you want to connect an object to
data at runtime.
For example, to make a push button change a tag value when it is pressed, connect the
push button to a tag by typing the tag name in the Connections tab of the push button’s
Properties dialog box.
Browsing for tags
If you don’t know the names of tags, you can browse for them. You can browse while
online and connected to a device, or you can browse for tags from an offline file, for
example a ControlLogix program file.
To browse for tags, use the Tag Browser. For details, see page 6-5.
6-2
Using tag names that don’t exist
You can type the name of a tag that doesn’t yet exist. If you do this, ensure that you spell
every instance of the tag name consistently, and that when you do create the tag, you spell
it the same way you did when you referred to it.
When to use data server tags
For some of the things you might need to do in your application, you might not need to
create HMI tags. Use direct references to tags located in devices instead, for example, tags
located in an OPC server’s database.
Eliminating duplication
Using data server tags allows you to add, modify, or delete tags in a device without having
to duplicate the changes in the RSView HMI tag database.
Using complex data
Some devices, for example ControlLogix processors, support complex data types such as
arrays and structures. Your controller might have structures that contain hundreds of
member elements.
Referencing tag values directly eliminates the need for creating an HMI tag for each
member.
Steps for using data server tags
To use data server tags, complete three basic steps:
1. Create the tag in the OPC server or processor, or use an existing tag in the processor.
The server must understand the syntax of the device it is connected to. You need only
create a tag if you want to browse the server.
Examples of OPC servers include RSLinx Enterprise, RSLinx Classic, and
KEPServerEnterprise. For information about creating tags in OPC servers that have
their own tag database, see the documentation provided with the server.
For information about creating tags in a ControlLogix processor, see the
documentation for your device programming software.
2. Create a data server in RSView, if your application doesn’t already have one.
For more information, see Chapter 5.
3. In graphic displays, data log models, or anywhere else you want to use a tag’s value,
create a direct reference to the tag. At runtime, the tag’s value is passed to the graphic
display or data log model.
6-3
• • • • •
6 • Working with tags
• • • • •
RSVIEW MACHINE EDITION USER’S GUIDE
When to use HMI tags
Use HMI tags to manipulate tag data and to store tag values in the runtime computer’s
memory.
Scaling, offsetting, or providing a range for data
Use HMI tags if the data server you are using does not provide for:
scaling or offsetting a value.
setting minimum or maximum limits on a value (that is, providing a range of values).
Scale and offset
The scale and offset modify the “raw data” that comes from and goes to the programmable
controller before the data is saved in the computer’s memory (called the value table). The
scale and offset also modify the value specified in RSView before it is written to the
programmable controller.
The scale is a multiplication factor—the value from the programmable controller is
multiplied by the scale.
The offset is a fixed value—after the value from the programmable controller is
multiplied by the scale, the offset amount is added.
Minimum and maximum
HMI tags allow you to set a minimum and maximum value that can be written to the
programmable controller or server.
These values do not affect what is read from the programmable controller or server.
For example, if you specify a minimum of 0 and a maximum of 100, RSView would be
able to read a value of 200 from a programmable controller and store it in the value table,
but would not be able to write this value to the programmable controller.
For more information about minimum and maximum, and scale and offset, see Help.
Storing values in RSView memory
A memory tag can be used to store values without the need for an attached or accessible
device.
For example, you might need to store a value in memory:
6-4
to store the result of a calculation.
temporarily, for example, a counter or index.
to maintain information about the system’s current state, for example which graphic
display was last displayed.
For information about creating HMI memory tags, see Chapter 7.
Steps for using HMI tags
To use HMI tags, complete two basic steps:
1. In the Tags editor in RSView, create a tag and map the tag name to an OPC tag or
device address.
For more information, see Chapter 7.
2. In graphic displays, alarm triggers, or anywhere else you want to use a tag’s value,
assign the tag. At runtime, the tag’s value is passed to the graphic display or alarm
system.
Browsing for tags
You don’t have to remember the path and name of a tag to use it in your application.
Whenever you need to use a tag, you can open the Tag Browser and select the tag to use.
To open the Tag Browser
In most editors, click the Browse button in the Tags column.
In the Expression editor, position the cursor where you want to insert a tag name, and
then click Tags.
In the Parameters editor, double-click where you want to insert a tag name.
6-5
• • • • •
6 • Working with tags
• • • • •
RSVIEW MACHINE EDITION USER’S GUIDE
Using the Tag Browser
Root folder
Folders pane
Tags pane
For a better view of the
folders or tags, drag this bar
to the left or the right.
In the Tag Browser, you can:
select a single tag or multiple tags. The ability to select multiple tags depends on
which Tag Browser you have opened. In the figure above, only a single tag could be
selected.
select data server tags and HMI tags.
create and edit HMI tags.
create new folders for HMI tags.
import tags from a PLC or SLC™ database.
For more information about using the Tag Browser, see Help.
6-6
Showing server names
By default, the folder pane in the Tag Browser shows folders, but not the servers they
belong to. You can show the names of servers that have been set up in the application.
To display server names
1. Right-click a blank area of the folders pane and then click Show Server Names.
The folders list with server
names hidden.
The folders list with server
names shown.
In the example on the left, folders are listed alphabetically by name.
In the example on the right, there are two data servers, named KepServer and
RSLinxServer. Folders of data server tags are listed under the data server to which they
belong. Below the data servers, the application is listed as an HMI server, with folders of
HMI tags under the application name.
Browsing for off-line tags
For each RSLinx Enterprise device shortcut, or each RSLinx Classic OPC topic in your
application, an Offline and an Online folder is displayed in the Tag Browser.
In RSLinx Enterprise, you can use the Offline folder to browse tags in an RSLogix.acd
file. For details about making the .acd file available to browse offline, see RSLinx
Enterprise Help.
In RSLinx Classic, you can use the Offline folder to browse tags in a PLC program stored
on disk. If the OPC topic in RSLinx Classic has access to symbols, you can browse for
6-7
• • • • •
6 • Working with tags
• • • • •
RSVIEW MACHINE EDITION USER’S GUIDE
them in the Offline folder. For details about adding symbols to the OPC topic in RSLinx
Classic, see RSLinx Classic Help.
Tags that are available when
you are not connected to the
controller are located in the
Offline folder.
Tags that are available when
you are connected to the
controller are located in the
Online folder.
Using tags and expressions in your application
Once you’ve created tags (either in data servers or in RSView), assign them to
connections in your application to allow the application to interact with the data source
and perform actions based on the tag values.
You can assign tags in these editors:
6-8
Expressions
Global Connections
Graphic Displays
Global Object Displays
Graphic Libraries
Parameters
Alarm Setup
Information Setup
Macros
Data Log Models
RecipePlus Editor
Assigning tags
This example shows the Trigger dialog box that opens when you click the Add button in
the Triggers tab of the Alarm Setup editor:
Type the tag name here...
...or click the Browse button to open the
Tag Browser.
To assign a tag, do one of the following
In the “Tag or expression” column, type the tag name.
In the Tag column, click the Browse button and then select a tag from the Tag
Browser.
For information about using the Tag Browser, see Help.
Assigning tags to graphic objects
In the Graphics editor, you can assign tags to many of the graphic objects you create.
You can use up to 1,000 tags per graphic display. This limit includes the tags contained in
embedded variables and expressions. For example, if an expression references the same
tag twice, this counts as two tag references.
6-9
• • • • •
6 • Working with tags
• • • • •
RSVIEW MACHINE EDITION USER’S GUIDE
Use one of these methods to assign tags to a graphic object:
Double-click the object to open the object’s Properties dialog box, and then click the
Connections tab.
Type the tag name here...
Select the object, and then assign tags in the Connections tab of the Property Panel.
Type the tag name here...
6-10
...or click the Browse button to open the
Tag Browser.
...or click the
Browse button to
open the Tag
Browser.
Using expressions to manipulate tag values
Many of the connections to which you can assign a tag also permit the use of expressions
to perform logical or mathematical calculations on tag values. If you assign an expression,
RSView monitors the expression value rather than the original tag value. For example,
your machine might send values to the data source in the form of temperature in degrees
Celsius. You could use an expression to convert the value to degrees Fahrenheit, and then
monitor the expression result rather than the original tag value.
If you can assign an expression, a Browse button is present in the Exprn column in the
editor or Connections tab.
Type the expression here...
...or click the Browse button to open the
Expression editor.
To assign an expression, do one of the following
In the Exprn column, click the Browse button, and then create an expression in the
Expression editor. Use this method if you want to check the expression syntax.
In the “Tag or expression” column, type the expression. The expression syntax is not
checked if you use this method.
For more information about expressions, see Chapter 20.
Substituting tag names used in graphic objects
You can use tag substitution to replace tag names and expressions assigned to the
connections for graphic objects. For example, if you assign a tag to multiple objects in a
graphic display, and then decide to use a different name for the tag, you can create a new
tag and then use tag substitution to search for all tag references with the old name, and
replace them with the new tag name.
You can also use tag substitution to replace the tags contained in embedded variables.
For more information about tag substitution, see page 15-40.
6-11
• • • • •
6 • Working with tags
• • • • •
RSVIEW MACHINE EDITION USER’S GUIDE
Logging tag values
Analog and digital tag values can be logged, including both HMI and data server tags. To
set up data logging, use the Data Log Models editor. For more information, see
Chapter 11.
Using macros to assign values to tags
A macro is a list of tag assignments stored in a text file. Whenever you run the macro, the
specified values are written to the tags. For more information about macros, see
Chapter 22.
You can also use recipes to assign values to multiple tags with a button press. For
information about using recipes to assign values to tags, see Chapter 19.
6-12
7
Using HMI tags
This chapter describes:
HMI tag types.
using the Tags editor.
data sources.
addressing syntax for device tags.
organizing HMI tags.
viewing tag statistics.
other methods for creating HMI tags.
importing HMI tags.
HMI tag types
HMI tags are tags you create in RSView®. For information about when to use HMI tags
versus when to use data server tags, see Chapter 6.
You can create and use these types of HMI tags in RSView:
This tag type
Stores this type of data
Analog
Range of values.
Use analog tags to represent variable states such as temperature or the
position of rotary controls.
Digital
0 or 1.
Use digital tags to represent devices that can only be on or off, such as
switches, contacts, and relays.
String
ASCII string, series of characters, or whole words (maximum of 82
characters).
Use string tags to represent devices that use text, such as a bar code scanner
that uses an alphanumeric product code.
7-1
• • • • •
RSVIEW MACHINE EDITION USER’S GUIDE
This tag type
Stores this type of data
System
Information generated while the system is running, such as the name of the
logged-in user, system time and date, and so on.
RSView creates system tags when you create an application. The system
tags are stored in the folder called “system” in the HMI tag database. You
cannot edit system tags. You can use system tags anywhere you would use
any other type of tag. For a list of system tags, see Appendix C.
Analog tags that use floating-point values
You can assign analog tags to most of the connections in RSView, including both HMI
and data server tags. If the analog tag uses a floating-point data type but an integer value is
required, the floating-point value is rounded.
For information about the data types available for analog tags, see Help.
How values are rounded
When a floating-point value must be rounded to an integer, this is how the value is
rounded:
If the number after the decimal is 4 or less, the value is rounded down. For example,
8.495 is rounded to 8.
If the number after the decimal is 6 or more, the value is rounded up. For example, 8.6
is rounded to 9.
If the number after the decimal is 5, the value is rounded using a “banker’s algorithm,”
to average out the rounding over time:
7-2
If the number before the decimal is 0, the value is rounded down. For example,
10.5 is rounded to 10.
If the number before the decimal is an odd number, the value is rounded up. For
example, 11.5 is rounded to 12.
If the number before the decimal is an even number, the value is rounded down.
For example, 12.5 is rounded to 12.
Floating point values are rounded to a maximum of six digits. Therefore, using a
floating-point data type and adding to it a value that exceeds the six significant
digits will result in a rounding error. For example, adding any number to 999,999
will result in a rounding error.
This rounding method is also used for numeric input enable buttons that use the implicit
decimal position, if an integer tag is assigned to the button’s Value connection. For more
information about the numeric input enable button, see page 16-31.
Using the Tags editor
The Tags editor has these parts: form area, query box, folder hierarchy, and spreadsheet
area.
Form area
Query box
Folder
hierarchy
The information you enter in the form area is displayed in the spreadsheet area. The folder
hierarchy displays all the folders that you and RSView create.
The Tags editor has special items on the View menu to control the appearance of the
editor, and extra tools on the toolbar.
Use the Tags editor to:
create folders
duplicate, nest, and delete folders
7-3
• • • • •
7 • Using HMI tags
• • • • •
RSVIEW MACHINE EDITION USER’S GUIDE
create and view tags
edit, duplicate, and delete tags
For details about using the Tags editor, see Help.
Updating the contents of the Tags editor
You can create tags in the Tags editor, but you can also create them as you work in other
editors, and you can import them from an existing tag database. To see the result of
changes to the database you make in other editors while the Tags editor is open, update the
contents.
To update the contents of the editor
1. On the View menu, click Refresh, or click the Refresh tool.
Refresh tool
When you click Refresh, the undo buffer is cleared and recent changes can’t be
automatically reversed.
Refresh is not available if you haven’t accepted the current tag.
For information about creating tags in other editors, see page 7-8.
Searching for HMI tags
Use the Tags editor’s query box to select the tags you want to display in the spreadsheet.
This allows you to edit tags in different folders without browsing the folder hierarchy. You
can:
select a single tag by typing the tag name.
select multiple tags by typing wildcard characters.
These are the wildcard characters:
This character
Does this
?
Matches any single character.
*
Matches any number of characters, including the backslash (\) character.
Use this wildcard character by itself to display all the tags in the HMI tag
database.
For example, to search for all the tags that contain the string “pump” in their name, type
*pump* in the Search For box. When you press Enter, a list of tags containing the string
“pump” appears in the spreadsheet.
7-4
When you do searches, remember that the backslash in a folder name counts as a character
in the tag name.
Data sources
When creating an HMI tag, you must specify a data source. The data source determines
whether the tag receives its values externally or internally.
The data source
The RSView documentation uses the term data source as a generic term that includes all
possible sources of tag data, for both data server tags and HMI tags. The data source can
be memory or a device such as a programmable controller or an OPC® server. RSView
writes values to and reads values from the data source. The data source is set up to
exchange information (in the form of numeric or string values) between the RSView value
table and the machine that your application is controlling.
Device
A tag with device as its data source receives its data from a source external to RSView.
The data can come from a programmable controller or other device via RSLinx
Enterprise, or from another OPC server. You can use up to 5,000 device tags.
For analog tags with Device as the data source, the data type determines the format used
when reading and writing tag data to the data server.
Memory
A tag with memory as its data source receives its data from (and stores values in) the
RSView internal value table. Tags with memory as the data source do not count toward
the total tag limit.
For analog tags with Memory as the data source, select the data type that matches the
format of the data you will store in the tag. Choosing Default is the same as choosing
Floating Point.
Addressing syntax for device tags
For device tags, you must provide the address and path to the OPC server that is
connected to the data source. For example, the OPC server could be connected to a device
such as a programmable controller.
The syntax for OPC tag addresses is:
[AccessPath]Address
or
::[AccessPath]Address
7-5
• • • • •
7 • Using HMI tags
• • • • •
RSVIEW MACHINE EDITION USER’S GUIDE
where :: indicates that the address resides in a data server in the application. (The two
colons are necessary when the address contains a colon, for example, N7:0.)
The square brackets are part of the syntax. They do not indicate optional parameters.
The access path is one of the following:
For communications with an RSLinx Enterprise data server, the access path is the
name of the device shortcut in RSLinx Enterprise.
For communications with an RSLinx® Classic OPC server, the access path is the
name of an OPC topic in RSLinx Classic.
For communications with other OPC servers, the access path might be optional. For
information about the syntax for the access path, see your OPC server documentation.
Example: ControlLogix addressing
We recommend that you use the Tag Browser to select OPC items. When you use the Tag
Browser the correct syntax and data types are selected automatically.
However, if you want to define tags before setting up communications, you can type the
address manually, as shown in this example. If you type the address manually, be sure to
select the data type for the tag that matches the data type used by the ControlLogix®
processor. If you use the Default data type, values are treated as floating-point values.
This example shows you how to specify the OPC topic, item name, and bit level of an
item that uses the integer data type in a ControlLogix processor.
OPC topic and item addressing
ControlLogix uses this addressing syntax:
[Device shortcut]item name for RSLinx Enterprise.
[OPC topic name]item name for RSLinx Classic.
In this example, the RSLinx Enterprise device shortcut name for the ControlLogix
processor is CLGX. To connect to an OPC item called Motor, type this address:
[CLGX]Motor
Bit level addressing
You can gain access to the bit level of an item that uses the integer data type by appending
.# to the end of the tag address, where # is the number of the bit you want access to.
7-6
For example, to gain access to the first bit of the integer item Motor, type this address:
[CLGX]Motor.0
Organizing HMI tags
Organizing tags makes finding and using tags faster and simpler. To organize your tags,
try these tips:
Establish naming conventions.
Naming conventions enable you to use wildcard characters most effectively when
searching for and displaying tags during development.
Use folders to group related tags.
Naming tags
Tag names can be up to 255 characters long including folder name. If you create a folder,
the folder name becomes part of the tag name. The backslash (\) after a folder name
counts as a character.
The tag name can contain these characters:
A to Z
0 to 9
underscore (_) and dash (-)
Tag names cannot contain spaces. The tag name can be mixed case. Tag names preserve
upper and lower case for readability but are not case sensitive. For example, the tag name
MixerValve1 is the same as mixervalve1.
When a tag name starts with a number or contains a dash, enclose the name in curly
brackets { } when you use it in an expression, for example, {N33-0}. For more
information about using tags in expressions, see Chapter 20.
Using folders to group tags
To organize tags, create a folder to store tags that are related to one another. To separate
the folder name from the rest of the tag name, use a backslash (\). For example, tags in the
folder called Pump would start with Pump\.
For greater organization, you can nest folders. For example, you can organize the HMI tag
database first by area, then by machines in the area, and finally by devices in each
machine. The result might be Area1\Machine1\Pump.
7-7
• • • • •
7 • Using HMI tags
• • • • •
RSVIEW MACHINE EDITION USER’S GUIDE
To create similar groups of tags quickly, create one folder with its tags and then duplicate
the folder.
Viewing tag statistics
The Tag Statistics dialog box provides a summary of how many tags your application
uses, as well as other tag information such as the date the HMI tag database was last
modified. To view tag statistics, the Tags editor must be open and have focus.
To view tag statistics
1. On the View menu, click Tag Statistics.
Other methods for creating HMI tags
In addition to creating tags in the Tags editor, you can:
create tags as needed in other editors (using the Tag Browser).
import tags from a PLC or SLC™ database. For details see page 7-9.
Creating tags as needed in other RSView editors
You can create tags as needed in any editor or dialog box that uses tags. You can add a tag
to the database by doing one of the following:
Browse button in the
Tag column
7-8
Click the Browse button in the Tag column to open the Tag Browser and create the
tag. For information about using the Tag Browser, see page 6-5.
Type a new tag name in the “Tag or expression” column. Keep track of the tag name,
and add the tag in the Tags editor when convenient.
Creating tags as needed in the Data Log Models editor
In the Data Log Models editor, in the Tags in Model tab, you can add a tag to the database
by doing one of the following:
Browse button in the
Data Log Models editor
Click the Browse button beside the “Tags to add” box to open the Tag Browser and
create the tag. For information about using the Tag Browser, see page 6-5.
Type a new tag name in the “Tags to add” box, and then click Add. You are warned
that the tag does not exist. Click Yes to add the tag to the list of tags in the datalog
model. Keep track of the tag name, and add the tag in the Tags editor when
convenient.
For more information about the Data Log Models editor, see
Chapter 11.
Importing tags from a PLC database
Use the Import PLC Tags dialog box to selectively import tags from a PLC or other
database into your application’s HMI tag database. Tags imported in this way are copied
into the database—they are not shared with the source database. This means changes to
tags in your application do not affect the database from which they have been imported,
and vice versa.
7-9
• • • • •
7 • Using HMI tags
• • • • •
RSVIEW MACHINE EDITION USER’S GUIDE
You can import tags from any of these databases:
legacy PLC databases, created using WINtelligent™ LOGIC 5 or A.I.™ 5, with file
extension .dsc
RSLogix™ 5 or RSLogix 500, saved as an external database, with file extension .ctd
(before importing, explicitly export to the .ctd format to be sure of including the latest
changes)
RSLogix 5 internal database, with file extension .rsp
RSLogix 500 internal database, with file extension .rss
For PLC and SLC addresses, the Import PLC Tags dialog box shows only addresses that
are used in the symbol or address list of the PLC programming software.
To open the Import PLC Tags dialog box, do one of the following
DB Browser tool in
the Tags editor
In the Tag Browser, right-click the right pane, and then click Import PLC Tags. For
information about using the Tag Browser, see page 6-5.
In the Tags editor, on the Edit menu click Other Databases, or click the DB Browser
tool.
For more information about using the Import PLC Tags dialog box, see Help.
7-10
Using the Tag Import and Export Wizard
You can also import PLC or SLC databases into RSView using the Tag Import and Export
Wizard.
You can use the wizard to:
export your application’s tags to a .csv file.
import tags from another RSView application’s tag .csv file.
merge tags from another RSView application (that is, import them directly from the
application, without first creating a tag .csv file).
import tags from legacy PLC databases, created using WINtelligent LOGIC 5 or
A.I. 5, with file extension .dsc.
import tags from RSLogix 5 or RSLogix 500, saved as an external database, with file
extension .ctd (before importing, explicitly export to the .ctd format to be sure of
including the latest changes).
To start the wizard, do one of the following
In RSView Studio™, on the Tools menu, click Tag Import and Export Wizard.
On the Windows® Start menu, select Programs, Rockwell Software, RSView
Enterprise, Tools, and then click Tag Import and Export Wizard.
For details about using the wizard, see the wizard’s Help.
7-11
• • • • •
7 • Using HMI tags
8
Setting up global connections
This chapter describes:
what global connections are.
changing displays.
printing displays.
updating the date and time.
setting up the backlight intensity remotely.
running macros.
controlling display changes remotely.
setting up remote display changes.
About global connections
Global connections are connections that apply to your entire runtime application. Global
connections allow the data source to control or interact with your application at runtime.
You can use global connections to:
notify the data source of the current display number.
notify the data source when a display is printed.
update the date and time at the data source using the runtime terminal’s date and time.
change the display on the runtime terminal remotely (from the data source).
print the current display from the data source.
update the date and time on the runtime terminal using the data source date and time.
set the intensity of the backlight on a PanelView Plus™ terminal.
run up to five macros from the data source, when a tag or expression result changes.
The use of each global connection is optional.
8-1
• • • • •
RSVIEW MACHINE EDITION USER’S GUIDE
Setting up global connections
Use the Global Connections editor to set up global connections.
For detailed information about the options in the Global Connections editor, see Help.
Changing displays
Use these global connections to monitor and control display changes:
Display Number—notifies the data source of the number of the display that’s
currently open.
Remote Display Number—allows the data source to change the display on the runtime
computer.
For detailed information about using the data source to control display changes, see
page 8-5.
Printing displays
Use these global connections to monitor and control display printing:
8-2
Display Print Active—notifies the data source that a display print is in progress.
Remote Display Print—allows the data source to trigger a display print.
The operator can also print the current display by pressing the display print button. For
information about setting up this button, see Help.
When the data source or the operator prints a display, everything on the screen is printed,
including the current display, pop-up windows, and any visible background applications.
If you plan to print graphic displays remotely, turn off the screen saver. If the screen saver is on
when a remote display print is triggered, only the screen saver image is printed.
For information abut turning off the screen saver, see your Windows® documentation.
Updating the date and time
Use the date and time connections to update the date and time. You can assign any or all of
the date and time connections, or leave them unassigned.
Normally you would assign only one set of date and time connections, either to update the
date and time at the data source from the terminal, or to update the terminal’s internal
clock from the data source.
The values of assigned date and time connections are updated in the order in which the
connections are listed in the Global Connections editor.
Updating the date and time at the data source from the terminal
To update the date or time at the data source from the terminal’s internal clock, assign a
tag to one or more of these connections:
This connection
Contains this range of values
Year
00-99
Day of Week
1-7, with 1 being Sunday
Month
1-12
Day of Month
1-31
Hour
0-23
Minute
0-59
Second
0-59
Specify how frequently to update the values of the assigned connections at the data source
(from the terminal’s internal clock) by typing a time in the “Date and time output interval”
box.
8-3
• • • • •
8 • Setting up global connections
• • • • •
RSVIEW MACHINE EDITION USER’S GUIDE
Updating the date and time at the terminal from the data source
This option is especially useful if you have several terminals connected to the same data
source. Instead of the operator resetting the date and time manually on each terminal, the
data source can reset all internal clocks at once.
To update the date or time in the terminal’s internal clock from the data source, assign a
tag or an expression to the Remote Date and Time connection. Also assign a tag or an
expression to one or more of these connections:
This connection
Contains this range of values
Remote Year
00-99 or 0000-9999
Remote Month
1-12
Remote Day of Month
1-31
Remote Hour
0-23
Remote Minute
0-59
Remote Second
0-59
When the Remote Date and Time connection value changes from 0 to a non-zero value,
the terminal resets its internal time and date to the time and date read from the individual
remote date and time connections.
The date and time are updated at the rate specified in the “Maximum update rate” box.
Setting up backlight intensity remotely
Use the Remote Backlight Intensity connection to set the backlight intensity of a runtime
terminal remotely from a data source.
To update the backlight intensity of the runtime terminal from the data source, assign a tag
or an expression to this read-only connection.
This connection
Contains this range of values
Remote Backlight Intensity
0-100
At runtime, the application reads the value at the data source and sets the backlight to the
percentage of its maximum intensity corresponding to the value. For instance, if the value
of the connection is 25, the backlight will be set to 25% of its maximum intensity. This
value will override the terminal’s own backlight intensity setting.
8-4
If the value of the connection is greater than 100, the backlight will be set to its maximum
intensity. If the value is less than 0, the backlight is set to its minimum value, that is, it will
be turned off.
Running macros
Use these global connections to run macros:
This connection
Runs this macro
Remote Macro1
Macro1
Remote Macro2
Macro2
Remote Macro3
Macro3
Remote Macro4
Macro4
Remote Macro5
Macro5
Create the macros in the Macros editor. Make sure you name them exactly as shown in the
table above (with no space in the name).
When the tag or expression assigned to one of these connections changes to a new nonzero value, RSView® runs the associated macro.
For information about creating macros, see Chapter 22.
Controlling display changes remotely
To control display changes remotely, you can set up the data source to open graphic
displays.
The data source can control display changes for Replace displays only. You can set up the
data source to control all Replace display changes, or to open displays under set
conditions, allowing the operator to change displays the rest of the time.
To use remote display changes, assign a unique display number to each Replace display,
and assign a tag or expression to the Remote Display Number connection. When the data
source sends a display’s number to the connection, the specified display opens. When the
connection’s value is 0, the operator has control of display changes (using display
navigation objects).
For information about assigning numbers to displays, see Help.
8-5
• • • • •
8 • Setting up global connections
• • • • •
RSVIEW MACHINE EDITION USER’S GUIDE
Remote display changes and security
If you set up the data source to open graphic displays remotely, remote display changes
occur whether or not the logged-in user has security access to a given display.
However, you can set up the Remote Display Number connection to prevent access to the
application unless an authorized user is logged in. To do this, assign an expression to the
connection to monitor the ID of the logged-in user, as described in the following example.
For more information about setting up security for your application, see Chapter 13.
Example: Using the Remote Display Number connection to
prevent unauthorized users from using the application
This example shows how to set up the data source to open a Log In display when a user
logs out. The Log In display remains open until an authorized user logs in. Then control of
display changes reverts to the operator.
1. Create a graphic display called Log In, containing a login button. In the Display
Settings dialog box, assign the number 3 to the display.
2. In the Global Connections editor, assign this expression to the Remote Display
Number connection:
if CurrentUserName( ) == “DEFAULT” then 3 else 0
If an authorized user is logged in, the value of the expression is 0, and the operator has
control of display changes. When the user logs out, the DEFAULT user is logged in, and
the Log In display remains open until another authorized user logs in.
This method is useful if you want to allow users to log out from multiple locations
(graphic displays) in the application. However, if you use the Remote Display Number
connection for this purpose, you cannot use it to control other display changes remotely.
If you only permit users to log out from a startup Log In display, you can achieve the same
result as in this example, but without using the Remote Display Number connection. For
more information about creating a startup display, see page 13-22.
Setting up remote display changes
This section outlines the steps for setting up remote display changes. For more
information about the Global Connections editor, see Help.
8-6
To set up remote display changes
1. In the Graphics editor, in the Display Settings dialog box, assign a unique display
number to each Replace display.
By default, every Replace display is assigned the number 1. Therefore, to use remote
display changes you must assign a unique display number to every Replace display,
even if you don’t plan to open a particular Replace display remotely.
Another option is to avoid using the display number 1 for remote display changes.
Then you only need to assign display numbers to the displays you want to change
remotely.
For more information about graphic displays, see Chapter 14.
2. In the Global Connections editor, assign a tag or an expression to the Remote Display
Number connection.
3. If you assign a tag to the Remote Display Number connection, set up the data source
to send a display’s number to the connection when you want the display to open.
If you assign an expression to the Remote Display Number connection, RSView
monitors the values of the tags used in the expression, and uses the expression result to
determine which display to open.
8-7
• • • • •
8 • Setting up global connections
9
Setting up alarms
This chapter describes:
steps for setting up alarms.
preparing to set up alarms.
how alarms work.
alarm trigger data types.
tips for using array tags.
optional alarm connections.
creating alarm messages in multiple languages.
the [ALARM], [ALARM BANNER], [ALARM MULTI-LINE], [STATUS], and
[HISTORY] displays.
using displays from the library in your application.
creating your own alarm display.
opening and closing the alarm display.
how the alarm list, alarm banner, and alarm status list graphic objects work.
using buttons to acknowledge, silence, clear, and delete alarms.
using buttons to sort alarms and reset alarm status.
About alarms
An alarm occurs when something goes wrong or is about to go wrong. Alarms can signal
that a device or process has ceased operating within acceptable, predefined limits, and can
indicate breakdown, wear, or process malfunctions. Alarms are also used to indicate the
approach of a dangerous condition.
Alarms are an important part of most plant control applications because an operator must
know the instant something goes wrong. It is often equally important to have a record of
the alarm and whether the alarm was acknowledged.
Multiple language alarm messages
A key component of any alarm system is the messages that appear when alarms occur.
RSView supports alarm messages in multiple languages. For information about setting up
alarm messages in multiple languages, see page 9-16.
9-1
• • • • •
RSVIEW MACHINE EDITION USER’S GUIDE
Other multiple language alarm features
RSView supports using multiple languages for all captions on alarm objects. In addition,
these alarm features can be translated into multiple languages:
title of the alarm history report
title of the alarm status report
Alarm objects and reports use the time formats for the current application language. For
more information about using multiple languages, see Chapter 23.
Summary of steps
Follow these steps to set up alarms:
1. In the Alarm Setup editor, set up alarm triggers (the tags or expressions to monitor),
define the alarm messages and their trigger values, and specify the graphic display to
open when alarms occur (if any).
Also use this editor to specify trigger types, “Acknowledge all” values, the maximum
alarm log file size, the hold time, and optional connections.
2. In the Startup editor, ensure that the Alarms box is checked (it is checked by default).
See Help.
3. If desired, in the Graphics editor modify the default [ALARM] display, or create your
own graphic display to use for alarms. For example, if you won’t be using audible
alarm signals, edit the default display to remove the silence alarms button.
For information about graphic displays, see Chapter 14.
4. Test alarms on the runtime system.
9-2
Setting up alarms
Use the Alarm Setup editor to set up alarms.
Define alarm triggers.
Create alarm messages.
Specify the graphic
display to use to display
alarm messages at
runtime.
For detailed information about the options in the Alarm Setup editor, see Help.
Preparing to set up alarms
As your application is running, information is continually sent to the data source about the
state of the various processes. For example, your application might be monitoring whether
a valve is open or closed, or the temperature in a boiler. Values representing the status of
these processes are sent to the data source.
The first step in setting up alarms is determining which processes to monitor for alarm
conditions.
The data source
The RSView® documentation uses the term data source as a generic term that includes all
possible sources of tag data, for both data server tags and HMI tags. The data source can
be memory or a device such as a programmable controller or an OPC® server. RSView
writes values to and reads values from the data source. The data source is set up to
exchange information (in the form of numeric or string values) between RSView and the
machine that your application is controlling.
Tags and expressions
Before setting up alarms, you must set up data server or HMI tags corresponding to the
addresses at the data source that will store the values you want to monitor for alarm
9-3
• • • • •
9 • Setting up alarms
• • • • •
RSVIEW MACHINE EDITION USER’S GUIDE
conditions. You can monitor analog and digital tags for alarm conditions, including both
HMI and data server tags. You cannot monitor string tags.
For information about setting up data server tags, see your OPC data server
documentation. For information about creating HMI tags, see Chapter 7.
You can also use expressions to perform logical or mathematical calculations on tag
values, and then monitor the expression value rather than the original tag value. For
example, you could use an expression to monitor whether a tag value has increased or
decreased beyond a threshold value: If Tag1 > 90 then 1 else 2.
For information about creating expressions, see Chapter 20.
Identifying alarm conditions
Once you have identified the processes you want to monitor for alarms, and the tags or
expressions that will store the values representing the status of the processes, you must
determine the acceptable range of values for each tag or expression. Then you can set up
alarms to notify the operator when a value is outside the normal operating range.
Importing and exporting alarm setup files
The Alarm Import Export Wizard in RSView Studio™ allows you to export alarm
information to an XML file, and to import an alarm setup XML file.
For example, you can export an application’s alarm setup information, import the setup to
another RSView application, and then modify it in the new application to suit your
requirements. Or, you can modify the file before importing it into the new application.
You can use the Alarm Import Export Wizard to import alarm setup information that has
been created using an external programming tool or editor, or you can import an RSView
XML file.
For more information about importing and exporting alarm setup files, see Appendix E.
How alarms work
This section provides an overview of the key components of your application’s alarm
system, and describes how the different parts work together.
Alarm triggers and trigger values
You specify the tags and expressions (also known as connections) to monitor for alarm
conditions by creating an alarm trigger for each connection.
Each alarm trigger can generate one or more alarm messages, associated with different
trigger connection values. For each alarm trigger, you specify the trigger values that will
generate alarm messages, and create the messages to display for the trigger values.
9-4
The trigger value can be a non-zero integer value or a bit position, depending on which
trigger data type you assign. For more information about trigger data types, see page 9-10.
Alarm notification methods
You can use any combination of these methods to notify the operator that an alarm
condition has occurred:
Open an alarm graphic display containing an appropriate alarm message.
Set off an audible signal (if the application is running in Windows® 2000 or Windows
XP).
Send a message to a printer.
Send a message to the data source.
To use these methods, select the Display, Audio, Print, and Message to Tag options when
you create your messages.
Be sure to select the Print option if you need to keep a permanent record of alarms. You can also
print the contents of the alarm log file periodically, as described on page 9-9. (The alarm log file is
also referred to as the alarm history.)
Displaying alarm information
RSView comes with these alarm displays:
[ALARM], in the Displays folder, contains an alarm banner graphic object that is set
up to display the newest active alarm in the alarm log file.
[ALARM BANNER], a display in the Libraries folder, contains an alarm banner
graphic object that is set up to display the newest active alarm in the alarm log file.
[ALARM MULTI-LINE], a display in the Libraries folder, contains an alarm list
graphic object that is set up to display all the alarms in the alarm log file: active,
inactive, acknowledged, and unacknowledged.
[STATUS], a display in the Libraries folder, contains an alarm status list graphic
object that is set up to display active alarms. It contains a goto display button for
opening the [HISTORY] display. This display is available in two sizes.
[HISTORY], a display in the Libraries folder, contains an alarm list graphic object and
a goto display button for opening the [STATUS] display. The alarm list is set up to
display all the alarms in the alarm log file: active, inactive, acknowledged, and
unacknowledged. This display is available in two sizes.
By default, the [ALARM] graphic display opens automatically at runtime when an alarm
is generated.
9-5
• • • • •
9 • Setting up alarms
• • • • •
RSVIEW MACHINE EDITION USER’S GUIDE
You can accept the default, edit the [ALARM] display, use one of the other alarm
displays, or create your own display. If you elect not to automatically open a graphic
display for alarm notification, an alternative is to provide the operator with a way to open
an alarm display when desired.
For more information about
See
The [ALARM] display
page 9-25
The [ALARM BANNER] display
page 9-26
The [ALARM MULTI-LINE] display
page 9-26
The [STATUS] display
page 9-27
The [HISTORY] display
page 9-28
Creating your own alarm display
page 9-30
The alarm list graphic object
page 9-31
The alarm banner graphic object
page 9-33
The alarm status list graphic object
page 9-34
Interacting with alarms
Depending on which alarm objects you set up, the operator can:
acknowledge one or all alarms, or the alarms for a specific alarm trigger.
clear and delete alarms.
silence alarms (if the application is running in Windows 2000 or Windows XP).
sort alarms.
reset the status of all alarms.
print alarms.
For information about the alarm button graphic objects the operator can use to work with
alarms, see page 9-35.
Using the data source to interact with alarms
You can also set up remote acknowledgement, silencing, and resetting of alarms, to allow
the data source to perform these functions. And you can set up the data source to
determine which types of alarms to display (active, inactive, acknowledged, and
unacknowledged), and to close the alarm display. These topics are discussed later in the
chapter.
9-6
Methods for acknowledging alarms
A single alarm is acknowledged when:
the operator selects an alarm in the alarm list and presses the acknowledge alarm
button, an enter button object, or the Enter key on an external keyboard or keypad.
the alarm banner has focus and the operator presses the acknowledge alarm button.
A single alarm for a particular trigger is acknowledged when:
the trigger’s Remote Ack connection value changes to the alarm’s trigger value (or bit
position, for bit triggers).
All alarms for a particular trigger are acknowledged when:
the trigger’s Remote Ack connection value changes to the “Acknowledge all” value.
The “Acknowledge all” value is specified in the “Use ack all value” box in the Alarm
Setup editor.
the operator presses an acknowledge all alarms button that is set up to acknowledge
the alarms for a specific alarm trigger.
All alarms in the alarm log file are acknowledged when:
the operator presses an acknowledge all alarms button that is set up to acknowledge all
alarms.
the Remote Ack All connection’s value changes to a new non-zero value.
For more information about acknowledging alarms, see page 9-37.
The operator can send button presses to objects that do not have focus. For information about
linking buttons to objects, see page 16-10.
Methods for clearing and deleting alarms
Alarms are deleted from the alarm log file and cleared from all alarm lists and alarm
banners when the operator presses the clear alarm history button. You can set up the
button to clear alarms for all alarms, or for a specific alarm trigger.
The alarm in the alarm banner is cleared when the operator presses the clear alarm banner
button. It is not deleted from the alarm log file.
For more information about clearing and deleting alarms, see page 9-39.
Methods for silencing alarms
The audio alarm indicator is available for applications running in Windows 2000 or
Windows XP only.
9-7
• • • • •
9 • Setting up alarms
• • • • •
RSVIEW MACHINE EDITION USER’S GUIDE
All alarms are silenced when:
the operator presses the silence alarms button.
an alarm whose Audio property is turned on is acknowledged.
the Remote Silence connection’s value changes to a new non-zero value.
the operator presses the clear alarm history button.
Method for sorting alarms
When the operator presses the sort alarms button, the sort order toggles from time to
trigger value or from trigger value to time. The sort order applies to all alarms in all alarm
lists and in the alarm log file.
Methods for resetting alarms
Resetting alarms affects how alarms are displayed in the alarm status list. When alarms
are reset:
the accumulated time an alarm has been in alarm is reset to 0. If the alarm is still
active, the time begins accumulating again.
the number of times the alarm has been triggered is reset to 0. If the alarm is still
active, the number changes to 1.
the date and time are sent to the system tag AlarmResetDateAndTimeString.
The alarms for a specific alarm trigger are reset when:
the operator presses a clear alarm history button that has been set up to clear and reset
alarms for a specific alarm trigger.
All alarms are reset when:
the operator presses a reset alarm status button.
the operator presses a clear alarm history button, if the button has been set up to clear
and reset all alarms.
the Remote Status Reset connection’s value changes to a new non-zero value.
For more information about resetting alarms, see page 9-39.
9-8
Methods for printing alarm information
In addition to automatically printing each alarm message as it occurs, you can keep a
printed record of alarms:
using the print alarm history button. When the operator presses the button, a report is
printed of the contents of the alarm log file. The report can include the time alarms
occurred and were acknowledged.
You can set up this button to print the alarm history for a selected alarm trigger, or for
all alarms.
using the print alarm status button. When the operator presses the button, a report is
printed of the status of alarms. The report can include active alarms, past alarms, or all
alarms that have been set up in the Alarm Setup editor. The report can include how
many times each alarm was triggered, and the accumulated time in alarm.
You can set up this button to print the alarm status for a selected alarm trigger, or for
all alarms.
For information about specifying which printer to use at runtime for Windows 2000 or
Windows XP applications, see page 26-10. For information about the type of printer to
use with a PanelView Plus™ or VersaView® CE terminal, see page 27-1.
The alarm log file
As soon as the application starts running, RSView begins monitoring trigger connections
for alarm conditions. When an alarm occurs, RSView adds the associated message to the
alarm log file. When the file is full, the oldest messages are deleted to make room for new
messages. Specify the maximum number of messages to store in the Alarm Setup editor.
For each message, the log file records the time the alarm was triggered and the time the
alarm was acknowledged (if it was acknowledged).
The log file is saved every 30 seconds, if there are new alarms. The log file is also saved
when the application is shut down.
The alarm log file is also referred to as the alarm history. For example, the operator
presses the clear alarm history button to remove all alarms from the log file.
The alarm log file is retained when you restart an application after a shutdown or power
loss. You can delete the log file from the runtime computer at application startup.
For information about deleting the log file, see page 26-15.
If you download a newer version of an application to the runtime computer, the alarm log
file for the older version is deleted automatically.
9-9
• • • • •
9 • Setting up alarms
• • • • •
RSVIEW MACHINE EDITION USER’S GUIDE
Alarm trigger data types
When you create alarm triggers, you must specify the type of data the trigger’s tag or
expression uses. The type of data affects how alarms are triggered.
The Value trigger type
To trigger alarms based on integer or floating-point values, use the Value trigger type.
When the value of the trigger connection equals the trigger value of a message, an alarm is
generated.
If you use an analog tag (either an HMI tag or a data server tag) or an expression, you can
use any non-zero integer or floating-point value to trigger an alarm. Floating-point values
are rounded to the nearest integer. For information about how values are rounded, see
page 7-2.
Trigger values cannot be 0. Digital tags have two possible values, 0 and 1. Therefore, if
you use a digital tag (either an HMI tag or a data server tag) you can only use the value 1
to trigger a message. If you want to use a digital tag to trigger two different messages,
create an expression that adds 1 to the digital tag’s value. That way, you can use the trigger
values 1 and 2.
Example: Integer trigger values
This example shows how to set up alarms using integer trigger values to monitor the level
of acid in a 100-gallon tank. Alarms are generated when the tank is 75% full and 90% full.
1. Create an alarm trigger for the tag Acid_tank_level. This tag points to an address in a
programmable controller that is linked to a sensor in the tank. The tag’s minimum
value is 0 and its maximum value is 100.
Use this expression for the alarm trigger:
if ((Acid_tank_level > 74) AND (Acid_tank_level < 90))
then 1
else if (Acid_tank_level > 89)
then 2
else 0
2. Use the Value trigger type for the alarm trigger.
9-10
3. Specify these trigger values and alarm messages for the alarm trigger:
Trigger Value
Message
1
2
Warning! The acid tank has exceeded safe fill levels.
Danger! The level in the acid tank is too high.
At runtime, when the value of Acid_tank_level is 75 or greater, RSView generates the
first alarm message. The second message is generated when the tag value is 90 or greater.
Using the expression in step 1 allows a range of values to trigger each alarm. This is
useful in case the tag is not being read at the exact moment it reaches a threshold level.
The Bit trigger type
Use the Bit trigger type to generate multiple simultaneous alarm messages. You can assign
an array tag (consisting of up to 1,024 bits) to the trigger connection. Each bit in the array
whose value changes from 0 to 1 triggers an alarm (if a message is set up for the bit
position).
Example: Trigger values using bit positions
This example shows how to use bit positions to generate multiple simultaneous alarms.
The array tag uses 32 bits, from N7:0/00 to N7:1/15.
This diagram shows the bit addresses and bit positions for the array tag:
The tag is currently generating alarms at bit positions 2, 6, 12, 21, 22, 26, and 30.
To set up alarms for this array tag:
1. Create an alarm trigger for the array tag. Use the Bit trigger type.
9-11
• • • • •
9 • Setting up alarms
• • • • •
RSVIEW MACHINE EDITION USER’S GUIDE
You must use a direct reference for the array tag. The tag uses the Integer data type (16
bits per element). Append L2 to the tag’s starting address to indicate that the trigger
will monitor 2 tag elements (32 bits), as follows:
{::[PLC5]N7:0,L2}
PLC5 is the RSLinx Enterprise device shortcut name. The two colons at the beginning
are necessary when the tag reference contains a colon.
2. Specify trigger values and alarm messages for the alarm trigger. Each trigger value
corresponds to a bit position (not a bit address).
Bit in the array (bit
address)
Bit position
Trigger value
Message
00
01
02
03
..
31
1
2
3
4
..
32
1
2
3
4
..
32
Line 1: Conveyor has stopped.
Line 1: Power failure.
Line 2: Conveyor has stopped.
Line 2: Power failure.
..
Oven door open.
The Least Significant Bit (LSBit) trigger type
Use the Least Significant Bit trigger type to generate alarm messages based on a priority
sequence that is determined by bit position. You can assign an array tag (consisting of up
to 1,024 bits) to the trigger connection. When multiple bits in the array change from 0
to 1, only the alarm with the lowest bit position is generated.
Example: Trigger values using least significant bits
This example shows how to use the Least Significant Bit trigger type to prioritize which
alarm is generated when multiple alarm conditions occur.
In this example, a programmable controller monitors a motor’s power, manual stop, and
overload status. The diagram indicates the location of sensors that are linked to an array
tag in the programmable controller.
9-12
If power to the motor is lost, the manual stop and overload switch also lose power,
generating alarms for all three motor parts. The only alarm the operator needs to see is the
alarm for the motor, since the cause of the alarm is power loss to the motor, not a problem
with the other two motor parts.
If someone stops the motor manually, power to the overload switch is lost. Alarms are
generated for the manual stop and the overload switch, but the only alarm the operator
needs to see is the alarm for the manual stop.
1. Create an alarm trigger for the tag Motor_starter. The tag uses 16 bits, and points to
the programmable controller address N7:61, although only the first three bit positions
are used in this example. Use the LSBit (Least Significant Bit) trigger type.
Because you are using only the first three bits in a single tag element, there is no need
to specify a length for the array tag in this example. You can use a simple tag type.
However, if you were also monitoring bits in N7:62, you would need to add L2 to the
address, as follows:
{::[PLC5]N7:61,L2}
9-13
• • • • •
9 • Setting up alarms
• • • • •
RSVIEW MACHINE EDITION USER’S GUIDE
2. Specify these trigger values and alarm messages for the alarm trigger:
Bit in the array (bit
address)
Bit position
Trigger value
Message
00
01
02
1
2
3
1
2
3
The motor has lost power.
The motor has stopped.
The overload switch has lost power.
At runtime, if power to the motor is lost, the programmable controller changes all three bit
values from 0 to 1, but RSView generates the first alarm message only (since bit 00 is the
lowest—that is, least significant—bit in alarm). If the operator acknowledges the first
alarm and power is not yet restored, the second alarm is generated, and so on.
Tips for using array tags
You can use these tag data types for array tags:
Data type
Number of bits
Byte
8
Integer
16
Word
16
Long Integer
32
Double Word
32
The right column shows the number of bits for each data type. This is useful for helping to
determine how many data elements to address to achieve the required number of bits. To
create an array tag, specify how many elements to use, beginning with the first element at
the tag’s address.
For example, if you want to monitor 128 bit positions for an alarm trigger, and you are
using the Long Integer data type, you would append the modifier [4] to the tag name
(because 4 x 32 = 128). For detailed information about tag syntax, see page 9-15.
You cannot use HMI tags for array tags. You must use data server tags for array tags.
9-14
Equivalent data types
Different processors and OPC servers use different terminology for tag data types. This
section provides information about equivalent data types that you can use for array tags,
with the associated number of bits for each.
PLC and SLC tags
When creating array tags, you can use PLC and SLC tags with this data type:
Data type
Number of bits
Short Integer
16
Data server tags with the Short Integer data type are displayed in the Tag Browser with the
Item Canonical Data Type of Integer.
To view a tag’s Item Canonical Data Type
1. In the Tag Browser, right-click the tag, and then click Properties.
ControlLogix tags
When creating array tags, you can use ControlLogix® tags with these data types:
Data type
Number of bits
SINT
8
INT
16
DINT
32
Data server tags with the data types described in the previous table are displayed in the
Tag Browser with the Item Canonical Data Types of Character, Short Integer, and Long
Integer, respectively.
RSLinx Enterprise tag syntax
To create an RSLinx Enterprise array tag, use this syntax to specify the length of the array:
{tagname,Larraylength}
For example, {::[PLC5]N7:0,L5}
The tag N7:0 uses the Short Integer data type (16 bits), so the array tag consists of 80 bits
(16 x 5).
9-15
• • • • •
9 • Setting up alarms
• • • • •
RSVIEW MACHINE EDITION USER’S GUIDE
When the tag name contains a colon (:), put two colons before the RSLinx Enterprise
device shortcut name.
KEPServerEnterprise tag syntax
To create a KEPServerEnterprise array tag, use this syntax to specify the length of the
array:
tagname [arraylength]
For example, Chan1.Dev1.Tag1 [3]
The tag Tag1 uses the Long Integer data type (32 bits), so the array tag consists of 96 bits
(32 x 3).
Alternatively, you can define the tag length in KEPServerEnterprise when you create the
tag, and then just select the tag name in RSView Studio. For more information, see
KEPServerEnterprise Help.
Creating alarm messages in multiple languages
RSView supports alarm messages in multiple languages. Use the CurrentLanguage( )
expression function to specify offsets for each trigger’s messages in the Alarm Setup
editor. In the editor, divide the messages for each trigger into sections for each language.
For information about the CurrentLanguage( ) function, see page 20-14. Also see the
following example.
You can export the text strings in your alarm messages for translation. Then paste the
translated strings into the Alarm Setup editor. RSView does not support direct importing
of the translated message text. For information about exporting text for translation, see
Chapter 23.
Example: Setting up alarm messages in multiple languages
This example shows how to generate English, French, or German alarm messages at
runtime, depending on which language the application is using. The alarm trigger uses the
Value trigger type.
1. Create an alarm trigger with this expression:
If CurrentLanguage( )=”en-US” then Alarm_messages
Else If CurrentLanguage( )=”fr-FR” then Alarm_messages + 10
Else Alarm_messages + 20
2. In the Messages tab, select the trigger and then create English messages for trigger
values 1 to 10.
3. Create French messages for trigger values 11 to 20.
9-16
4. Create German messages for trigger values 21 to 30.
Optional alarm connections
When an operator acknowledges an alarm, the acknowledge time is recorded in the alarm
log file and the alarm is silenced. This might be all you require of your alarm system.
However, you can use the optional alarm connections in the Alarm Setup editor to set up
more sophisticated interactions with the data source when alarms are triggered,
acknowledged, silenced, and reset. For example, you can set up the data source to
acknowledge, silence, and reset alarms. You can also use optional alarm connections to
close the alarm display or to allow the data source to close the alarm display.
There are two sets of optional alarm connections:
connections that work with a specific alarm trigger. You can assign a different set of
connections to each alarm trigger.
connections that apply to all alarms
You can also assign connections to alarm lists, to allow the data source to determine which
types of alarms to display in the lists. For more information, see page 9-31.
Connections that work with a specific alarm trigger
You can assign a different set of these connections to each alarm trigger, or to only one or
some alarm triggers:
Handshake—Assign a tag to this connection to notify the data source when the
trigger’s value changes.
Ack—Assign a tag to this connection to notify the data source when the operator
acknowledges an alarm (or all alarms).
Remote Ack—Assign a tag or an expression to this connection to allow the data
source to acknowledge alarms.
Remote Ack Handshake—Assign a tag to this connection to notify the data source
when a remote acknowledgement occurs.
Message—Assign a tag to this connection to send alarm messages to the connection.
Make sure the tag supports the type of data sent in the alarm message. For example, if
the message is a string of text, assign a string tag to the Message connection.
9-17
• • • • •
9 • Setting up alarms
• • • • •
RSVIEW MACHINE EDITION USER’S GUIDE
Message Notification—Assign a tag to this connection to notify RSView that an alarm
message has been sent to the connection and RSView must wait before sending a new
message.
Message Handshake—Assign a tag to this connection if you want the data source to
notify RSView when it has read the message.
Assign tags or expressions to these connections when you create your alarm triggers. For
more detailed information about how these connections work, see the next sections.
How the Handshake connection works
The Handshake connection is useful for triggers that use the Value data type. Program the
data source to queue alarm notifications when multiple alarms are generated for the same
trigger. Use the Handshake connection to notify the data source that RSView has detected
the alarm notification. Then the data source can send the next alarm to RSView.
When the application starts, the Handshake connection has a value of 1. When the trigger
connection’s value changes, the Handshake connection’s value toggles from 1 to 0. The
next time the trigger value changes, the Handshake connection’s value toggles from 0
to 1.
A change in the trigger connection’s value does not necessarily indicate an alarm—the
value might still be within acceptable limits.
How the Ack connection works
When the application starts, this connection has a value of 0.
How the value changes
9-18
When the operator acknowledges an alarm by pressing the acknowledge alarm button,
RSView sends the alarm’s trigger value (or bit position, for bit triggers) to this
connection, and holds the value as long as the operator presses the button, or for the
duration of the hold time, whichever is longer. Then the connection’s value is reset
to 0.
When the operator acknowledges all alarms, or the alarms for this trigger only, by
pressing the acknowledge all alarms button, RSView sends the trigger’s
“Acknowledge all” value to this connection, and holds the value as long as the
operator presses the button, or for the duration of the hold time, whichever is longer.
Then the connection’s value is reset to 0.
When the Remote Ack connection changes to a new non-zero value that matches the
trigger value of an unacknowledged alarm, RSView sends the trigger’s value (or bit
position, for bit triggers) to this connection, and holds the value for the duration of the
hold time. Then the connection’s value is reset to 0.
To avoid confusion about whether a specific trigger’s alarm individual alarm has been
acknowledged or all alarms for the trigger have been acknowledged, make sure the
“Acknowledge all” value is not the same as one of the trigger values.
How the Remote Ack connection works
The Remote Ack connection allows for the remote acknowledgement of alarms. The data
source writes the alarm’s trigger value (or bit position, for bit triggers) to this connection,
and the unacknowledged alarm with this trigger value is acknowledged.
If you assign this connection and specify an “Acknowledge all” value for the trigger,
when the data source sends the “Acknowledge all” value to this connection, all
unacknowledged alarms for the trigger are acknowledged.
Make sure that the “Acknowledge all” value is not the same as one of the trigger values.
Set up the data source to send the correct value to the Remote Ack connection when you
want a remote acknowledgement to take place.
Remote acknowledgement does not take place if the hold time is in effect for the Ack
connection.
Example: Using the Remote Ack connection
This example shows how to use the Remote Ack connection to acknowledge an alarm.
In this example, the same application is run at two different locations on the plant floor,
and both terminals are connected to the same programmable controller. All the tags in the
example refer to addresses in the programmable controller.
1. Create an alarm trigger for a tag called Alarm. Use the Value trigger type.
2. Assign a tag called Ack to the Ack connection.
3. Assign a tag called Remote_ack to the Remote Ack connection.
4. Create an alarm message for the alarm trigger, with the trigger value 1.
9-19
• • • • •
9 • Setting up alarms
• • • • •
RSVIEW MACHINE EDITION USER’S GUIDE
5. Set up the data source to write the value at the Ack connection to the Remote Ack
connection whenever the value of the Ack connection changes from 0 to a non-zero
value.
At runtime, when an alarm with the trigger value 1 is generated, the alarm message
appears at both locations simultaneously. If the operator acknowledges the alarm at
Location 1, RSView writes the value 1 to the Ack connection.
Since the Ack connection is write-only (not read), the acknowledgement doesn’t appear at
Location 2. However, the programmable controller writes the value from the Ack
connection (1) to the Remote Ack connection, and the alarm at Location 2 is
acknowledged.
How the Remote Ack Handshake connection works
This connection is used to notify the data source that the remote acknowledgement has
been detected by RSView.
When the application starts, the Remote Ack Handshake connection has a value of 1.
When the Remote Ack connection value changes, the Remote Ack Handshake
connection’s value toggles from 1 to 0. The next time the Remote Ack value changes, the
Remote Ack Handshake value toggles from 0 to 1.
The Remote Ack Handshake value toggles whether or not the new Remote Ack value
matches a trigger value.
Ensuring alarm messages are read by the data source before
sending new messages
This section explains how the Message, Message Notification, and Message Handshake
connections work.
To ensure an alarm message is read by the data source before RSView sends a new
message, use message handshaking. While message handshaking is in effect for an alarm
message, RSView cannot send a new message to the alarm trigger’s Message connection.
Methods of alarm message handshaking
Alarm handshaking works by setting the alarm trigger’s Message Notification connection
to 1. As long as the Message Notification connection is set to 1, new messages cannot be
sent to the Messages connection. How the Message Notification connection is reset to 0
depends on how you set up alarm message handshaking.
9-20
There are two ways you can use alarm message handshaking:
to hold the message at the data source for a specific period of time.
to hold the message at the data source until the data source notifies RSView that the
message has been read.
Choose the method that best suits your application needs and communication system.
Holding the message for a specific period of time
To set up an alarm trigger’s alarm message handshaking so that the message at the
Message connection is held for a specific period of time, assign a tag to the Message
Notification connection and specify a hold time in the Advanced tab of the Alarm Setup
editor.
How handshaking works
This method of alarm message handshaking works as follows:
1. When an alarm occurs, the alarm message is sent to the Message connection.
2. The Message Notification connection is set to 1.
As long as the Message Notification connection is set to 1, RSView cannot send new
messages to the data source.
3. The “hold time” timer begins timing.
4. When the hold time has expired, the Message Notification connection is reset to 0 and
RSView can send a new message to the Message connection.
Holding the message until the data source acknowledges that
it has read the message
To set up an alarm trigger’s alarm message handshaking so that the message at the
Message connection is held until the data source notifies RSView that it has read the
message, use two connections: the Message Notification connection and the Message
Handshake connection.
Set up the data source to send a new non-zero value to the Message Handshake
connection when it has read the message at the Message connection.
How handshaking works
If you use the Message Handshake connection, handshaking works like this:
1. When an alarm occurs, the alarm message is sent to the Message connection.
2. The Message Notification connection is set to 1.
9-21
• • • • •
9 • Setting up alarms
• • • • •
RSVIEW MACHINE EDITION USER’S GUIDE
As long as the Message Notification connection is set to 1, RSView cannot send new
messages to the data source.
3. When the data source has read the message, it sends a new non-zero value to the
Message Handshake connection.
4. The Message Notification connection is reset to 0 and RSView can send a new
message to the Message connection.
How messages are queued
RSView can queue up to 128 messages while it waits for the Message Notification
connection to be reset to 0. Queued messages are sent to the data source on a first in, first
out basis.
If the alarm message queue fills before the Message Notification connection is reset to 0,
an error message is sent to FactoryTalk® Diagnostics™.
How the Message connection works
This connection is used to send the message associated with a trigger value to the data
source.
The message is sent only if the alarm message’s Message to Tag option is selected.
If you are going to generate text alarm messages in multiple languages, make sure the tag
assigned to this connection can accommodate the string length of the messages in each
language. For information about using multiple languages, see Chapter 23.
How the Message Notification connection works
This connection is used to notify RSView that an alarm message has been sent to the data
source and RSView must wait to send another message.
When the application starts, the Message Notification connection is set to 0. When a
message is written to the Message connection, the Message Notification connection value
changes to 1. When the hold time expires, or the Message Handshake connection changes
to a new non-zero value, the Message Notification connection value changes from 1 to 0.
Messages for an alarm trigger are queued if the Message Notification connection is set
to 1.
How the Message Handshake connection works
Use the Message Handshake connection to reset the Message Notification connection
when the data source has read the alarm message.
Set up the data source to send a new non-zero value to the Message Handshake
connection when it has read the message at the Message connection.
9-22
Connections that apply to all alarms
These connections apply to all alarms:
Silence—Assign a tag to this connection to notify the data source that all alarms have
been silenced (Windows 2000 and Windows XP applications only).
Remote Silence—Assign a tag or an expression to this connection to allow the data
source to silence all alarms (Windows 2000 and Windows XP applications only).
Remote Ack All—Assign a tag to this connection to allow the data source to
acknowledge all alarms at once.
Status Reset—Assign a tag to this connection to notify the data source that the alarm
status has been reset.
Remote Status Reset—Assign a tag or expression to this connection to allow the data
source to reset the alarm status.
Close Display—Assign a tag to this connection to notify the data source that the alarm
display has closed.
Remote Close Display—Assign a tag or expression to this connection to allow the
data source to close the alarm display.
Assign tags or expressions to these connections in the Advanced tab of the Alarm Setup
editor. For more detailed information about how these connections work, see the next
sections.
How the Silence connection works
When the application starts, this connection has a value of 0. When alarms are silenced,
this connection is set to 1 for the hold time and the internal beeper is turned off. At the end
of the hold time, the connection is reset to 0.
If the silence event is triggered by a button press, this connection is set to 1 for the hold
time or for the duration of the button press, whichever is longer. At the end of this time,
the connection is reset to 0.
If subsequent alarms (that have been set up to sound the internal beeper) are generated, the
alarms sound the beeper regardless of the Silence connection value or hold time status.
While the hold time is in effect, new alarms cannot be silenced.
How the Remote Silence connection works
When this connection changes to a new non-zero value, all alarms are silenced. Alarms
can be silenced using other methods regardless of this connection’s value.
9-23
• • • • •
9 • Setting up alarms
• • • • •
RSVIEW MACHINE EDITION USER’S GUIDE
Set up the data source to send a new non-zero value to the Remote Silence connection
each time you want a remote silencing of alarms to take place.
How the Remote Ack All connection works
When this connection changes to a new non-zero value, all unacknowledged alarms are
acknowledged.
Set up the data source to send a new non-zero value to the Remote Ack All connection
each time you want a remote acknowledgement of all alarms to take place.
How the Status Reset connection works
When the application starts, this connection has a value of 0. If a reset alarm status or
clear alarm history button is pressed, this connection is set to 1 for the hold time or for the
duration of the button press, whichever is longer. At the end of this time, the connection is
reset to 0.
The Status Reset connection is also set to 1 if the Remote Status Reset connection changes
to a new non-zero value, and remains set for the hold time.
While the hold time is in effect, the alarm status cannot be reset again. The status of
alarms keeps updating during the hold time.
How the Remote Status Reset connection works
When this connection changes to a new non-zero value, the status of all alarms is reset, as
described on page 9-8. Alarms can be reset using other methods regardless of this
connection’s value.
Set up the data source to send a new non-zero value to the Remote Status Reset
connection each time you want a remote resetting of alarm status to take place.
How the Close Display connection works
When the application starts, this connection has a value of 0. If the alarm display
(assigned in the Alarm Setup editor) closes, this connection is set to 1 for the hold time. At
the end of the hold time, the connection is reset to 0.
If subsequent alarms are generated, the alarm display opens again regardless of the Close
Display connection value or hold time status.
How the Remote Close Display connection works
When this connection changes to a new non-zero value, the alarm display closes. The
alarm display can be closed using other methods regardless of this connection’s value.
Set up the data source to send a new non-zero value to the Remote Close Display
connection each time you want a remote closing of the alarm display to take place.
9-24
The [ALARM] display
When you create an application, it comes with a graphic display called [ALARM]. The
[ALARM] display is the default display for showing alarm messages at runtime. It
contains an alarm banner graphic object that is set up to display a single active alarm.
Alarm banner
graphic object
Buttons
You can use the [ALARM] display as is, or modify the display. For example, you can
change the color of the objects, or add and remove buttons.
Another option is to create your own graphic display to use when an alarm occurs, as
described on page 9-30. Or, you can use one of the alarm displays in the graphic library.
These displays are described in the next four sections.
A copy of the [ALARM] display is included in the graphic library, with the name
[ALARM BANNER].
The alarm banner graphic object
The [ALARM] display contains an alarm banner graphic object, which lists the most
recent alarm message. You can set up the alarm banner to queue new alarms until the
displayed alarm has been acknowledged, or to show new alarms as they occur. The alarm
banner in the [ALARM] display is set up to display new alarms as they occur and to
display active alarms only (but you can edit it, if desired).
For more information about the alarm banner, see page 9-33.
Buttons in the [ALARM] display
The [ALARM] display contains alarm buttons for acknowledging, silencing, and clearing
alarms, as well as a button for closing the display. For information about how the buttons
work, see page 9-35.
9-25
• • • • •
9 • Setting up alarms
• • • • •
RSVIEW MACHINE EDITION USER’S GUIDE
The [ALARM BANNER] display
The Libraries folder contains a graphic display called [ALARM BANNER]. The
[ALARM BANNER] display allows the operator to see a single alarm at a time.
Alarm banner
graphic object
Buttons
The alarm banner graphic object
The [ALARM BANNER] display contains an alarm banner graphic object, which lists the
most recent alarm message. You can set up the alarm banner to queue new alarms until the
displayed alarm has been acknowledged, or to show new alarms as they occur. The alarm
banner in the [ALARM BANNER] display is set up to display new alarms as they occur
and to display active alarms only (but you can edit it, if desired).
For more information about the alarm banner, see page 9-33.
Buttons in the [ALARM BANNER] display
The [ALARM BANNER] display contains alarm buttons for acknowledging, clearing,
and silencing alarms, as well as a button for closing the display. For information about
how the buttons work, see page 9-35.
The [ALARM MULTI-LINE] display
The Libraries folder contains a graphic display called [ALARM MULTI-LINE]. The
[ALARM MULTI-LINE] display allows the operator to see multiple alarms at once.
Header
Alarm list
graphic object
Buttons
9-26
You can use the [ALARM MULTI-LINE] display as is, or modify the display. For
example, you can select which alarm triggers’ alarms to display in the list.
The alarm list graphic object
The [ALARM MULTI-LINE] display contains an alarm list graphic object, which lists the
time the alarms occurred and were acknowledged, as well as the alarm messages. You can
set up the alarm list to show any combination of active, inactive, acknowledged, and
unacknowledged alarms. The alarm list in the [ALARM MULTI-LINE] display is set up
to show all alarms (but you can edit it, if desired).
For more information about the alarm list, see page 9-31.
Buttons in the [ALARM MULTI-LINE] display
The [ALARM MULTI-LINE] display contains alarm buttons for acknowledging and
silencing alarms, as well as buttons for scrolling the list and closing the display. For
information about how the buttons work, see page 9-35.
The [STATUS] display
The Libraries folder contains a graphic display called [STATUS]. The [STATUS] display
allows the operator to see the status of all the alarms that have been set up in the Alarm
Setup editor. The [STATUS] display comes in two sizes, 640x480 and 800x600.
Header
Alarm status list
graphic object
Buttons
9-27
• • • • •
9 • Setting up alarms
• • • • •
RSVIEW MACHINE EDITION USER’S GUIDE
You can use the [STATUS] display as is, or modify the display. For example, you can
select which alarm triggers’ alarms to display in the list, or remove buttons that you don’t
want to use.
The alarm status list graphic object
The [STATUS] display contains an alarm status list graphic object, which lists the alarm
messages. You can set up the alarm status list to show the status of all alarms that have
been set up, active alarms only, or all alarms that have occurred since the alarm status was
last reset. The alarm status list in the [STATUS] display is set up to show the status of
active alarms (but you can edit it, if desired).
For more information about the alarm status list, see page 9-34.
Buttons in the [STATUS] display
The [STATUS] display contains alarm buttons for resetting and silencing alarms,
changing the display mode, printing the status of alarms, and opening the [HISTORY]
display, as well as buttons for scrolling the list and closing the display. For information
about how the buttons work, see page 9-35.
The [HISTORY] display
The Libraries folder contains a graphic display called [HISTORY]. It is similar to the
[ALARM MULTI-LINE] display, but the alarm list graphic object is larger (to display
9-28
more alarm messages at once), and the [HISTORY] display contains more buttons. The
[HISTORY] display comes in two sizes, 640x480 and 800x600.
Header
Alarm list
graphic object
Buttons
You can use the [HISTORY] display as is, or modify the display. For example, you can
select which alarm triggers’ alarms to display in the list, or remove buttons that you don’t
want to use.
The alarm list graphic object
The [HISTORY] display contains an alarm list graphic object, which lists the time the
alarms occurred and were acknowledged, as well as the alarm messages. You can set up
the alarm list to show any combination of active, inactive, acknowledged, and
unacknowledged alarms. The alarm list in the [HISTORY] display is set up to show all
alarms (but you can edit it, if desired).
For more information about the alarm list, see page 9-31.
Buttons in the [HISTORY] display
The [HISTORY] display contains alarm buttons for acknowledging, silencing, and
clearing alarms, sorting the list of alarms, printing the alarm history list, and opening the
[STATUS] display, as well as buttons for scrolling the list and closing the display. For
information about how the buttons work, see page 9-35.
9-29
• • • • •
9 • Setting up alarms
• • • • •
RSVIEW MACHINE EDITION USER’S GUIDE
Using displays from the library in your application
The previous four sections described the [ALARM BANNER], [ALARM MULTI-LINE],
[STATUS], and [HISTORY] displays that are included in the Libraries folder. You can
copy objects from the displays to your own display, or you can copy the entire displays
into your application.
For information about copying objects from a library into your graphic display, see
page 15-44.
The graphic libraries are available on the development computer, but do not appear at
runtime. To use a display in the library as a graphic display at runtime, you must add the
library display into your application’s folder of graphic displays. For details, see
page 14-17.
Example: Using the [ALARM] and [STATUS] displays together
To use the [ALARM] display to alert the operator about alarms as they occur, and the
[STATUS] display to show how many times and for how long alarms have been active:
1. In the Alarm Setup editor, in the Advanced tab, select the [ALARM] display as the
display to open when alarms are triggered, if it is not already selected. (It is selected
by default.)
2. Add the [STATUS] display from the library.
3. Edit the [ALARM] display by adding a goto display button that opens the [STATUS]
display when pressed.
Creating your own alarm display
You can create your own graphic display for displaying and responding to alarms. For
example, you could create a display with a static text object that notifies the operator that
an alarm has occurred, and a goto display button that the operator can press to open a
display that lists the actual alarm message.
If you create your own graphic display, use an On Top display and select the Cannot Be
Replaced option.
For information about the graphic objects you can use to display alarm information, see
the information starting on page 9-31. For information about creating graphic displays and
graphic objects, see Chapter 14 and Chapter 15.
9-30
Opening and closing the alarm display
Opening the display
The alarm display you specify in the Advanced tab of the Alarm Setup editor (either the
default [ALARM] display, a display you copy from the library, or your own display) is
automatically opened whenever a trigger connection’s value matches a trigger value (if
you selected the Display option for the trigger value).
You can also create a goto display button that the operator can press to open the alarm
display. For information about setting up a goto display button and specifying the display
to open, see Help.
Closing the display
The operator can close the display by pressing a close display button.
The display closes automatically under these circumstances:
when the operator presses an acknowledge all alarms button and causes the newest
alarm in the alarm history to be acknowledged.
when the operator presses a clear alarm history button and causes the newest alarm in
the alarm history to be deleted.
when the Remote Close Display connection changes to a new non-zero value.
when the Remote Ack All connection changes to a new non-zero value.
when the newest alarm is acknowledged.
If you don’t want the display to close when the newest alarm is acknowledged, you can
turn off this option in RSView ME Station.
To change how the display closes
1. In RSView ME Station, click Terminal Settings.
2. Double-click Alarms.
3. Specify how you want the display to close.
How the alarm list graphic object works
The alarm list graphic object displays the time an alarm was triggered, and the time it was
acknowledged (if you set up the object to display acknowledged alarms).
At runtime, when a trigger connection at the data source matches a message’s trigger
value, an alarm appears in the alarm list. The alarm list can be in the [ALARM MULTI-
9-31
• • • • •
9 • Setting up alarms
• • • • •
RSVIEW MACHINE EDITION USER’S GUIDE
LINE] or [HISTORY] display, in an alarm display you have created, or can be placed on
any display in your application.
You can use multiple alarm lists, in the same display or in different displays. Each alarm
list displays information from the same alarm log file, although you can set up different
lists to display different information.
For information about setting up alarm lists, see Help.
What is displayed
9-32
If you set up the list to show the alarms for specific alarm triggers, only alarms for
those triggers are displayed.
If the list is set up to show unacknowledged alarms only, the alarms displayed in the
list are unacknowledged and the acknowledge time column, if any, is always blank.
If the list is set up to show both acknowledged and unacknowledged alarms,
acknowledged alarms can show a symbol (which you can specify) at the left end of the
row, and the acknowledge time appears in the acknowledge time column, if displayed.
If the list is set up to show both active and inactive alarms, active alarms can show a
symbol (which you can specify) at the left end of the row. If both the acknowledge
symbol and active symbol are displayed, the active symbol column is to the right of
the acknowledge symbol column.
If the message is too long to fit in the object, the last displayed character is replaced
with an asterisk. Similarly, if a column heading is too long to fit in the column, the last
displayed character is replaced with an asterisk. You can specify how many lines to
allow for each alarm message, from 1 to 10.
The number of alarm messages that fits in the display depends on the height of the
alarm list, the list’s font size, how many lines you have specified for each alarm
message, and whether the column headings are displayed.
If alarms are currently being sorted by time, alarms are listed with the newest alarms
on top.
If alarms are currently being sorted by trigger value, alarms from the first trigger in the
Alarm Setup editor are listed first, with alarms from subsequent triggers listed after.
Alarms in the list from the same trigger are grouped together and then sorted by
trigger value, from lowest to highest.
If there are multiple instances of the same alarm, these alarms are sorted by time with
the newest on top.
If you assign a tag or expression to any of the ActiveAcknowledged,
ActiveUnacknowledged, InactiveAcknowledged, or InactiveUnacknowledged
connections, when a connection’s value is a non-zero value, the related type of alarm
is displayed in the alarm list. The connection value overrides the setting for the list in
the Alarm List Properties dialog box.
How the list scrolls
When a display containing an alarm list is opened, the highlight bar or cursor is at the
top of the list: on the most recent alarm if sorted by time; or on the first alarm for the
first trigger, if sorted by trigger value.
If alarms are sorted by time, and the top alarm is selected, as new alarms occur, the old
alarms scroll down, but the highlight bar or cursor remains at the top.
If alarms are sorted by time, when the operator selects an alarm other than the top one
in the list (by using the move down button), and new alarms occur, they are added
above the visible area if the list is full. The currently selected alarm continues to be
selected and maintains its position in the displayed portion of the list.
If alarms are sorted by trigger value, as new alarms occur the currently selected alarm
continues to be selected and maintains its position in the list.
If the sort order changes, the selected alarm continues to be selected, but it might be
displayed in a different position in the list.
How the alarm banner graphic object works
The alarm banner graphic object displays a single, unacknowledged alarm.
At runtime, when a trigger connection at the data source matches a message’s trigger
value, an alarm appears in the alarm banner. The alarm banner can be in the [ALARM]
display or [ALARM BANNER] display, in an alarm display you have created, or can be
placed on any display in your application.
You can use multiple alarm banners, in the same display or in different displays. You can
set up different banners so that one displays the most recent alarm, and the other queues
alarms until the displayed alarm is acknowledged.
For information about setting up alarm banners, see Help.
What is displayed
If you set up the banner to show the alarms for specific alarm triggers, only alarms for
those triggers are displayed.
You can set up the banner to queue new alarms until the operator clears the current
alarm, or to always display the most recent alarm.
9-33
• • • • •
9 • Setting up alarms
• • • • •
RSVIEW MACHINE EDITION USER’S GUIDE
When a display containing an alarm banner is first opened, the alarm banner is blank,
unless the display is the alarm display specified in the Alarm Setup editor and it was
opened in response to an alarm.
When the displayed alarm is acknowledged, it is removed from the alarm banner. If
there are no newer alarms, the banner is blank.
If the operator presses a clear alarm banner button, the banner is blank.
If the operator presses a clear alarm history button or if all alarms are acknowledged,
the banner is blank.
If the banner is set up to show both active and inactive alarms, when an alarm is
active, an asterisk (*) appears beside the message.
How the alarm status list graphic object works
The alarm status list graphic object displays the status of alarms, including whether an
alarm has been triggered, how many times an alarm has been triggered, and for how long.
The alarm status list can be in the [STATUS] display, in an alarm display you have
created, or can be placed on any display in your application.
You can use multiple alarm status lists, in the same display or in different displays. You
can set up different lists to display different information.
For information about setting up alarm status lists, see Help.
What is displayed
9-34
If you set up the list to show the alarms for specific alarm triggers, only alarms for
those triggers are displayed.
If an alarm is active, an asterisk (*) appears in the alarm state column, if displayed.
If the message is too long to fit in the object, the last character that would fit is
replaced with an asterisk. Similarly, if a column heading is too long to fit in the
column, the last character that would fit is replaced with an asterisk. You can specify
how many lines to allow for each alarm message, from 1 to 10.
The number of alarm messages that fits in the display depends on the height of the
alarm status list, the list’s font size, how many lines you have specified for each alarm
message, and whether the column headings are displayed.
For value-triggered alarms, the accumulated time column shows how long the alarm
has been set to the trigger value.
For bit-triggered alarms, the accumulated time column shows how long the bit has
been set to 1.
For LSBit-triggered alarms, the accumulated time column shows how long the
corresponding alarm’s least significant bit has been set to 1.
What happens when the display is opened
The first time a display containing the alarm status list is opened, the first page of
alarms is displayed.
If the list is set up to display active alarms only, and alarms that were visible when the
display was closed are no longer active, the alarms are removed from the list.
If alarms have been reset since the display was last opened, the first page of alarms is
displayed.
Using buttons with the alarm history and alarm objects
Alarm buttons
You can use these alarm buttons to interact with the alarm list, alarm banner, or alarm
status list, and to clear and sort the alarm history:
Use this button
Acknowledge alarm
With this graphic
object
To do this
Alarm list
Alarm banner
Acknowledge and silence the selected
alarm.
Acknowledge all alarms
Acknowledge and silence all currently
unacknowledged alarms, or the currently
unacknowledged alarms for a specific
alarm trigger.
Alarm status mode
Alarm status list
Change the type of alarms displayed in the
alarm status list, from all alarms to active
alarms to past alarms.
Clear alarm banner
Alarm banner
Clear the alarm in the alarm banner
without removing the alarm from the
alarm log file and alarm lists.
9-35
• • • • •
9 • Setting up alarms
• • • • •
RSVIEW MACHINE EDITION USER’S GUIDE
Use this button
Clear alarm history
With this graphic
object
To do this
Remove alarms from the alarm log file and
all alarm lists. If the Ack connection is
assigned for any of the alarm triggers, the
operator is prompted to acknowledge all
alarms before clearing them.
You can set up the button to remove all
alarms, or just the alarms for a specific
alarm trigger. You can also specify
whether to reset the cleared alarms.
If you choose to reset alarms, pressing this
button resets the number of times an alarm
has been triggered to 0, and the
accumulated time in alarm to 0, for all
alarms that are being cleared. If the alarm
is still active, the number of times in alarm
changes to 1 after the alarm is reset to 0.
9-36
Print alarm history
Print a report of the alarm messages in the
alarm log file. You can include all alarms,
or just the alarms for a specific alarm
trigger. The report can include the time
alarms occurred and were acknowledged.
Print alarm status
Print a report of the status of alarms. You
can include all alarms, or just the alarms
for a specific alarm trigger. The report can
include how many times each alarm was
triggered, and the accumulated time in
alarm.
Reset alarm status
Reset the number of times an alarm has
been triggered to 0, and the accumulated
time in alarm to 0, for all alarms. If the
alarm is still active, the number changes
to 1.
Silence alarms
Silence the audio indictor for all alarms
(Windows 2000 and Windows XP
applications only).
Sort alarms
Toggle between sorting alarms in alarm
lists and the alarm log file by time and by
trigger value.
You can assign any caption you choose to the labels on the alarm buttons.
Linking buttons to objects
You can link the acknowledge alarm button to a specific alarm list or alarm banner, or set
up the button to work with whichever alarm list or alarm banner is selected in the graphic
display.
Similarly, you can link the clear alarm banner button to a specific alarm banner. This
option is useful if you have multiple alarm banners in the same graphic display. And you
can link the alarm status mode button to a specific alarm status list.
For more information about linking buttons to objects, see page 16-10.
Key buttons
You can also use these key button graphic objects to interact with the alarm list, alarm
status list, or alarm banner:
This button
Does this
Move up
Scrolls up one row in the list.
Move down
Scrolls down one row in the list.
Page up
Moves the highlight bar or cursor up one page in the list.
Page down
Moves the highlight bar or cursor down one page in the list.
Home
Moves the highlight bar or cursor to the top alarm in the list.
End
Moves the highlight bar or cursor to the bottom alarm in the list.
Enter
Acknowledges the currently selected alarm (in alarm lists and
alarm banners).
You can link key buttons to a specific alarm object, or set up the buttons to work with
whichever object is selected in the graphic display. For more information, see page 16-10.
For information about creating graphic objects, see Chapter 15. For information about
setting up key buttons, see Help.
Using alarm buttons to acknowledge, silence, clear, and delete
alarms
Acknowledging messages does not remove them from the alarm log file. You can still
display acknowledged alarms in an alarm list that is set up to show acknowledged alarms.
9-37
• • • • •
9 • Setting up alarms
• • • • •
RSVIEW MACHINE EDITION USER’S GUIDE
Acknowledging the selected alarm
When the operator presses the acknowledge alarm button, an enter button, or the Enter
key on an external keyboard or keypad:
the selected alarm in the alarm list is acknowledged and the audio indicator for the
alarm, if any, is silenced.
the displayed alarm in the alarm banner is acknowledged and the audio indicator for
the alarm, if any, is silenced.
This is what happens when the alarm is acknowledged:
If assigned, the alarm trigger’s Ack connection is set to the alarm trigger value at the
data source. The value is held as long as the operator presses the button, or for the hold
time, whichever is longer.
If the hold time is still in effect and the operator acknowledges a new instance of the
same alarm, the new acknowledgement is ignored.
If the alarm list is set up to display unacknowledged alarms only, the alarm is removed
from the list. The highlight bar or cursor moves up to the next unacknowledged alarm,
unless it is already on the top unacknowledged alarm.
If the highlight bar or cursor is on an acknowledged alarm when the operator presses
the acknowledge alarm button, the button press is ignored.
The alarm is removed from the alarm banner.
Acknowledging all alarms
When the operator presses an acknowledge all alarms button, all unacknowledged alarms
in the system (or, optionally, for a specific alarm trigger), are acknowledged.
This is what happens when the alarms are acknowledged:
For each alarm trigger to which an “Acknowledge all” value is assigned, the specified
“Acknowledge all” value is sent to the trigger’s Ack connection. The value is held as
long as the operator presses the button, or for the hold time, whichever is longer. Then
the connection’s value is reset to 0.
If the “Acknowledge all” value is not assigned for a trigger, no value is sent to the
trigger’s Ack connection.
If the hold time for any alarm is still in effect and the operator presses acknowledge all
alarms, the button press is ignored.
9-38
If the alarm list is set up to display unacknowledged alarms only, all acknowledged
alarms are removed from the list.
The alarm banner is cleared.
Silencing alarms
When the operator presses the silence alarms button, any audible signal triggered by an
alarm is silenced and the Silence connection is set to 1 for the hold time or for the duration
of the button press, whichever is longer. Then the connection’s value is reset to 0.
If the hold time for any alarm is still in effect and the operator presses silence alarms, the
button press is ignored.
The audio alarm indicator is available for applications running in Windows 2000 and
Windows XP only.
Clearing and deleting messages
From the alarm history
When the operator presses the clear alarm history button, all alarms in the system (or,
optionally, for a specific alarm trigger) are deleted from the alarm log file and from all
alarm lists. For information about the alarm log file, see page 9-9.
If the Ack connection is assigned for any of the alarm triggers being cleared, the operator
is prompted to acknowledge the unacknowledged messages before deleting them. If the
operator chooses to acknowledge the alarms, the “Acknowledge all” value (if any) is sent
to the Ack connection before deleting the messages. If the Ack connection is not assigned,
or if the operator chooses not to acknowledge alarms, all messages are deleted
immediately.
From the alarm banner
When the operator presses the clear alarm banner button, the displayed alarm is cleared
from the banner. The alarm remains in the alarm log file and in all alarm lists it appears in.
Using alarm buttons to sort alarms and reset alarm status
Sorting alarms
When the operator presses the sort alarms button, the sort order toggles from time to
trigger value or from trigger value to time. The sort order applies to all alarms in all alarm
lists and in the alarm log file.
Resetting alarm status
When the operator presses the reset alarm status button, the alarm status of each alarm is
reset as follows:
The accumulated time an alarm has been in alarm is reset to 0. If the alarm is still
active, the time begins accumulating again.
9-39
• • • • •
9 • Setting up alarms
• • • • •
RSVIEW MACHINE EDITION USER’S GUIDE
The number of times the alarm has been triggered is reset to 0. If the alarm is still
active, the number changes to 1.
If the Status Reset connection is assigned (in the Alarm Setup editor), it is set to 1 for the
hold time or for the duration of the button press, whichever is longer. If a hold time from a
previous reset alarm status button press is still in effect, the button press is ignored.
Pressing the clear alarm history button can also reset the status of alarms, if you select the
Reset alarm status option for the button. You can set the button up to clear and reset the
status of all alarms, or just the alarms for a specific alarm trigger.
Retaining alarm status
The status of alarms is retained when the application is shut down. When the application
is restarted:
if an alarm is still active, the time begins accumulating again.
if an alarm is still active, the number of times the alarm has been triggered is increased
by 1.
Changing the alarm status displayed in the alarm status list
When the operator presses the alarm status mode button, the type of alarms displayed in
the alarm status list changes as follows:
If the current type displayed is all alarms, the list changes to display active alarms
only.
If the current type displayed is active alarms, the list changes to display past alarms
only.
If the current type displayed is past alarms, the list changes to display all alarms.
The change affects the linked or selected alarm status list only, not all alarm status lists.
9-40
10 Setting up FactoryTalk Diagnostics
This chapter describes:
FactoryTalk® Diagnostics™.
displaying diagnostics messages during application development.
viewing FactoryTalk Diagnostics log files.
using the Diagnostics Setup tool.
displaying and printing diagnostics messages at runtime.
the [DIAGNOSTICS] display.
creating your own diagnostics display.
opening and closing the diagnostics display.
how the diagnostics list graphic object works.
About FactoryTalk Diagnostics
FactoryTalk Diagnostics records information about various types of system activity,
including:
macro usage.
operator comments.
system messages and errors.
errors from the communication network.
tag read and write activity.
Browsing diagnostics messages
You can view diagnostics messages about system activity during application development
and at runtime. For example, while you develop your application, use diagnostics
messages to track what the system is doing and to ensure you’ve set things up the way you
intend. At runtime, use diagnostics messages to show the operator messages about system
activity. You can also save information in a log file for future processing or analysis.
How to set up FactoryTalk Diagnostics
You must set up FactoryTalk Diagnostics on both the development computer and the
runtime computer. The settings for FactoryTalk Diagnostics apply to all Rockwell
Software® products installed on the computer.
10-1
• • • • •
RSVIEW MACHINE EDITION USER’S GUIDE
Setting up FactoryTalk Diagnostics involves:
setting up destinations, where logged information is received for storage or display.
setting up which destinations receive which categories of messages. This is called
message routing.
setting up how messages are displayed and printed at runtime.
This chapter describes how to set up FactoryTalk Diagnostics on computers running
Windows® 2000 and Windows XP. For information about setting up FactoryTalk
Diagnostics on the PanelView Plus™ or VersaView® CE terminal, see the PanelView Plus
Terminals User Manual or the VersaView CE Terminals User Manual. These manuals are
available on the RSView Machine Edition™ CD.
Destinations
FactoryTalk Diagnostics allows you to send diagnostics messages to multiple
destinations.
During application development
During application development, you can send diagnostics messages to:
the Diagnostics List at the bottom of the RSView Studio™ window.
a local log, which is viewable using the FactoryTalk Diagnostics Viewer tool.
an ODBC database.
At runtime
At runtime, you can send diagnostics messages to:
diagnostics list graphic objects, either in the default [DIAGNOSTICS] display, or in a
display you create.
a printer
a local log (Windows 2000 and Windows XP applications only), which is viewable
using the FactoryTalk Diagnostics Viewer.
a remote log (PanelView Plus or VersaView CE terminals only).
an ODBC database.
The FactoryTalk Diagnostics Viewer is available on computers running Windows 2000
and Windows XP only. However, if you send diagnostics messages from a PanelView
10-2
Plus or VersaView CE terminal to a computer running Windows 2000 or Windows XP,
you can view the messages in the FactoryTalk Diagnostics Viewer.
The destinations available on your computer might vary, depending on which Rockwell Software
products you have installed.
Message routing
You can decide which destinations receive which kinds of messages. This allows you to
make the right information available to the right person, in the right place.
For example:
You can send messages that contain information about what the system is doing to the
local log file. You can also send warnings about things that might go wrong if left
unattended to the local log file.
This allows a control systems engineer to analyze system activity and performance,
and make corrections during scheduled maintenance times.
You can send errors that require immediate action to the diagnostics list object in the
[DIAGNOSTICS] display, as well as the log file.
You can set up the [DIAGNOSTICS] display to open automatically when system
activity occurs, to allow the operator to respond to problems that might stop
production if they are not solved immediately.
Categories
FactoryTalk Diagnostics categorizes messages by severity, and by audience. For each
destination, you can specify the message severity and audience.
10-3
• • • • •
10 • Setting up FactoryTalk Diagnostics
• • • • •
RSVIEW MACHINE EDITION USER’S GUIDE
Choosing not to log messages
If messages of a particular category are not routed to any destination, the messages for that
category are not logged. For example, you might not want to log information messages, or you
might not want to send any messages to the Operator.
Message severities
RSView categorizes messages in four severities:
Errors indicate that a process or action has failed. For example, a tag’s value could not
be written, or a user typed the wrong password while logging on to the system.
Warnings
indicate that a process or action might not function correctly, or might
eventually fail if preventive action isn’t taken. For example, if an ActiveX® control
used in a graphic display is a different version than the one installed on the runtime
computer, a warning is logged to indicate the mismatch. Mismatched ActiveX
controls might not behave as expected at runtime.
Information indicates that a process or action has completed successfully. For
example, a user logged on to the system or a tag value has been written to the data
source.
Audit indicates that the system configuration has been changed. RSView records the
creation, modification, and deletion of components (such as graphic displays) as audit
messages.
Other Rockwell Software products also use audit messages. For example, if you set up
an audit log in RSMACC, RSView’s audit messages will be sent there, as well as to
FactoryTalk Diagnostics.
In the FactoryTalk Diagnostics Viewer, the message severity is shown in the Severity
column, indicated by the ! symbol.
The content of the messages is provided by the system—you don’t need to do anything to
set up message content.
Audiences
FactoryTalk Diagnostics allows messages to be categorized differently for the various
people for whom the messages are relevant. You can sort the messages in the FactoryTalk
Diagnostics Viewer, so that those relevant to a particular person are grouped together.
Who receives which messages?
You can specify which types of messages are sent to the Operator, Engineer, and
Developer audiences.
10-4
RSView automatically sends audit messages to the Engineer and Secure audiences. Audit
messages allow auditing tools, such as those required for US Government 21CFR Part 11
compliance, to track system activity.
Displaying diagnostics messages during application
development
During application development, diagnostics messages are displayed as you create,
modify, and delete components, and when you test your graphic displays. The messages
are displayed in the Diagnostics List at the bottom of the RSView Studio window. You can
also view the messages in the FactoryTalk Diagnostics Viewer, as described in the next
section.
By default, all warning and error messages are displayed in the Diagnostics List. To
change what is displayed in the Diagnostics List, use the Diagnostics Setup tool, as
described on page 10-6.
For information about testing graphic displays, see page 14-10.
To display the Diagnostics List
1. On the View menu, click Diagnostics List. A check mark beside the menu item
indicates the Diagnostics List is displayed.
For information about moving, resizing, and clearing messages in the Diagnostics List,
see page 2-5.
If you don’t want to display diagnostics messages
1. On the View menu, click Diagnostics List. The option is turned off when no check
mark appears.
Viewing FactoryTalk Diagnostics log files
Use the FactoryTalk Diagnostics Viewer tool to view the contents of FactoryTalk
Diagnostics local log files. You can open the FactoryTalk Diagnostics Viewer from within
RSView Studio, or from the Windows Start menu.
The FactoryTalk Diagnostics Viewer is available on computers running Windows 2000
and Windows XP.
You can also set up Windows 2000 or Windows XP computers to accept messages from
PanelView Plus or VersaView CE terminals, and then display the messages in the
FactoryTalk Diagnostics Viewer or in the Diagnostics List. For information about sending
messages from PanelView Plus or VersaView CE terminals to computers running
Windows 2000 or Windows XP, see page 10-8.
10-5
• • • • •
10 • Setting up FactoryTalk Diagnostics
• • • • •
RSVIEW MACHINE EDITION USER’S GUIDE
To open the FactoryTalk Diagnostics Viewer, do one of the
following
In RSView Studio, on the Tools menu, click Diagnostics Viewer.
On the Windows Start menu, select Programs, Rockwell Software, FactoryTalk Tools,
and then click Diagnostics Viewer.
For information about setting up FactoryTalk Diagnostics to send messages to the local
log, see Help for the Diagnostics Setup tool. For additional information about setting up
and using the FactoryTalk Diagnostics Viewer, see the FactoryTalk Diagnostics Viewer
Help.
Using the Diagnostics Setup tool
Use the Diagnostics Setup tool to set up:
destinations and message routing on the development computer, including logging to
the local log or to an ODBC database.
destinations and message routing on runtime computers that use Windows 2000 or
Windows XP, including logging to the local log or to an ODBC database.
the Windows CE runtime destination to receive logged messages from.
You can also use the Diagnostics Setup tool to clear the local log file.
To open the FactoryTalk Diagnostics Setup tool, do one of the
following
In RSView Studio, on the Tools menu, click Diagnostics Setup.
In the RSView ME Station™ dialog box, click Terminal Settings, and then doubleclick Diagnostics Setup.
For information about opening the RSView ME Station dialog box:
10-6
in Windows 2000 or Windows XP, see page 26-4.
on a PanelView Plus or VersaView CE terminal, see page 27-3.
On the Windows Start menu, select Programs, Rockwell Software, Utilities, and then
click Diagnostics Setup.
Specify which
destinations
receive what
categories of
messages.
For details about using the Diagnostics Setup tool, see Help for the tool.
Logging to an ODBC database
The option of logging FactoryTalk Diagnostics messages to an ODBC database is
available for computers running Windows 2000 and Windows XP only.
ODBC logging works by periodically exporting the contents of the local log file to an
ODBC-compliant database. RSView supports these ODBC-compliant databases:
Microsoft® Access
Sybase SQL Server
Oracle
Microsoft SQL Server
If you have set up FactoryTalk Diagnostics to overwrite events in the local log file, make
sure messages are logged to the ODBC-compliant database before the oldest events are
deleted.
For information about the contents of the FactoryTalk Diagnostics ODBC tables, see
Appendix D.
Setting up message buffering
FactoryTalk Diagnostics messages are stored in the computer’s local log file, and are
exported to the ODBC-compliant database at the interval you specify.
You can also specify that messages remain in the local log file for a period of time after
they have been exported to the ODBC-compliant database. This is useful in the event of a
network failure, or any other reason that causes the database to be unavailable. In this
case, the messages remain in the local log file until the buffer time expires. If the ODBC-
10-7
• • • • •
10 • Setting up FactoryTalk Diagnostics
• • • • •
RSVIEW MACHINE EDITION USER’S GUIDE
compliant database becomes available during that time, the buffered messages are then
exported to the database.
Routing messages
For each destination you set up, you can specify how messages are routed.
To route messages, specify:
the types of messages to log.
the audiences to send the messages to.
whether to accept messages from Windows CE devices.
For information about who receives which types of messages, see page 10-4.
Receiving messages from a PanelView Plus or VersaView CE
terminal
You can set up FactoryTalk Diagnostics to receive messages that are generated on the
PanelView Plus or VersaView CE terminal at runtime. The terminal must be on the same
network as the computer running FactoryTalk Diagnostics.
To receive messages:
enable the Windows 2000 or Windows XP computer to receive the messages. For
details see Help for the Diagnostics Setup tool.
set up the PanelView Plus or VersaView CE terminal to send the messages.
For information about setting up a PanelView Plus terminal to log to the Windows 2000 or
Windows XP computer, see the PanelView Plus Terminals User Manual.
For information about setting up a VersaView CE terminal to log to the Windows 2000 or
Windows XP computer, see the VersaView CE Terminals User Manual.
Displaying and printing diagnostics messages at runtime
At runtime, you can display diagnostics messages in a graphic display. You can also print
the messages.
Using the Diagnostics List Setup editor
Use the Diagnostics List Setup editor to set up when to print and display messages at
runtime in RSView ME Station.
10-8
For details about using the Diagnostics List Setup editor, see Help.
Printed messages list the date and time, the category of system activity, and the message
text. By default, messages are not printed at runtime.
By default, your application is set up to display diagnostics messages automatically at
runtime. If you want to use the default settings, you don’t need to do anything further to
set up diagnostics messages for print and display in RSView ME Station.
The messages that are printed and displayed depend on how you set up FactoryTalk
Diagnostics on the runtime computer:
For applications running on Windows 2000 or Windows XP, use the Diagnostics
Setup tool to set up diagnostics message logging. For information about using the
Diagnostics Setup tool, see Help.
For information about setting up FactoryTalk Diagnostics on the PanelView Plus or
VersaView CE terminal, see the PanelView Plus Terminals User Manual or the
VersaView CE Terminals User Manual.
For applications running on Windows 2000 or Windows XP, you can also view the
runtime messages in the FactoryTalk Diagnostics Viewer, as described on page 10-5.
10-9
• • • • •
10 • Setting up FactoryTalk Diagnostics
• • • • •
RSVIEW MACHINE EDITION USER’S GUIDE
If you don’t want to display diagnostics messages in RSView ME
Station
1. In RSView Studio, in the Diagnostics List Setup editor, clear the Display name box, or
clear the four “Open display automatically when” boxes.
Setting up how messages are displayed and printed at runtime
Follow these steps to set up how diagnostics messages are displayed at runtime:
1. In RSView Studio, in the Diagnostics List Setup editor, specify which messages to
print, the graphic display to use, when to open the graphic display, and the maximum
number of messages to store.
2. If desired, modify the default [DIAGNOSTICS] display, or create your own graphic
display to use for diagnostics messages. For example, if you don’t want the operator to
clear all messages at once, edit the default display to remove the clear all button.
For information about graphic displays, see Chapter 14.
The [DIAGNOSTICS] display
When you create an application, it comes with a graphic display called [DIAGNOSTICS].
The [DIAGNOSTICS] display is the default display for showing diagnostics messages at
runtime.
Diagnostics list graphic object.
You can use the [DIAGNOSTICS] display as is, or modify the display. For example, you
can change the color of the objects, or add and remove buttons. Or, you can create your
own graphic display to use for displaying diagnostics messages. In the Diagnostics List
Setup editor, specify the display to use.
The diagnostics list graphic object
The [DIAGNOSTICS] display contains a diagnostics list graphic object, which lists the
diagnostics messages. For more information about the diagnostics list, see page 10-11.
10-10
Buttons in the [DIAGNOSTICS] display
The [DIAGNOSTICS] display contains diagnostics list buttons for clearing the messages,
as well as buttons for scrolling the list and closing the display. For information about how
the buttons work, see page 10-12.
Creating your own diagnostics display
You can create your own graphic display for displaying diagnostics messages, containing
a diagnostics list graphic object and the buttons the operator needs for using the display.
If you create your own graphic display, use an On Top display and select the Cannot Be
Replaced option.
For more information about the diagnostics list, see page 10-11. For information about the
buttons you can use with the list, see page 10-12. For information about creating graphic
displays and graphic objects, see Chapter 14 and Chapter 15.
Opening and closing the diagnostics display
Opening the display
The diagnostics display you specify in the Diagnostics List Setup editor (either the default
[DIAGNOSTICS] display or a display you create) is automatically opened whenever a
diagnostics message of the specified severity occurs.
The display remains open until the operator closes the display.
If you decide not to open the diagnostics display automatically, you can create a goto
display button that the operator can press to open the diagnostics display. For information
about setting up a goto display button and specifying the display to open, see Help.
Closing the display
The operator can close the display by pressing a close display button.
How the diagnostics list graphic object works
At runtime, when a severity of system activity occurs that you’ve set up to log, a message
about the activity is added to the diagnostics list. The diagnostics list can be in the
[DIAGNOSTICS] display, in a diagnostics display you have created, or can be placed on
any display in your application.
You can use multiple diagnostics lists, in the same display or in different displays. Each
diagnostics list displays the same information.
For information about setting up diagnostics lists, see Help.
10-11
• • • • •
10 • Setting up FactoryTalk Diagnostics
• • • • •
RSVIEW MACHINE EDITION USER’S GUIDE
What is displayed
If the message is too long to fit in the list, the last displayed character is replaced with
an asterisk (*).
The number of diagnostics messages that is visible at one time depends on the height
of the diagnostics list and the list’s font size.
Messages are listed with the newest diagnostics message on top.
Using buttons with the diagnostics list
Diagnostics buttons
You can use these diagnostics buttons to interact with the diagnostics list:
This button
Does this
Diagnostics clear
Clears the selected message from all diagnostics lists in the
application.
Diagnostics clear all
Clears all diagnostics messages from all diagnostics lists in the
application.
You can assign any captions you choose to the labels on the diagnostics buttons.
You can link the diagnostics clear button to a specific diagnostics list. When the operator
presses the button, the selected message is deleted from the linked diagnostics list, and
also from any other diagnostics lists in the application. For information about linking
buttons to objects, see page 16-10.
Key buttons
You can also use these key button graphic objects to interact with the diagnostics list:
10-12
This button
Does this
Move up
Scrolls up one row in the list.
Move down
Scrolls down one row in the list.
Page up
Moves the highlight up one page in the list.
Page down
Moves the highlight down one page in the list.
Home
Moves the highlight to the top message in the list.
End
Moves the highlight to the bottom message in the list.
You can set up the key buttons to work only with the specified diagnostics list, or to work
with whichever object is selected in the graphic display. For information about linking
buttons to objects, see page 16-10.
For information about creating graphic objects, see Chapter 15. For information about
setting up specific buttons, see Help.
10-13
• • • • •
10 • Setting up FactoryTalk Diagnostics
11 Setting up data logging
This chapter describes:
steps for setting up data logging.
data log files.
data log models.
changing the data log model used at runtime.
displaying data logs using the trend graphic object.
problems with data logging.
Summary of steps
Follow these steps to set up data logging:
1. In the Data Log Models editor, set up a data log model that specifies how many log
values to store, the conditions that trigger data logging, where to log data, and which
tags to monitor.
2. In the Startup editor, turn on data logging by selecting the Data logging check box.
Also use this editor to specify the data log model to use at runtime. See Chapter 25.
3. In the Graphics editor, create a graphic display containing the trend graphic object,
and set up how the object looks, which tag values to display, the start time, and the
time span for the data. Also specify the name of the data log model to use.
Data log files
As soon as the application starts running, RSView® begins logging tag values to the data
log files. When the maximum number of data points have been logged, the oldest data is
deleted to make room for the new data. RSView supplies data from the log files to the
trend object for the requested tags and time span.
The data log files are retained when you restart an application after a shutdown or power
loss. You can delete the log files from the runtime computer at application startup.
Use data logging to keep a permanent record of tag data. You can record tag data as tag
values change, or on a periodic basis (for example, every minute).
For information about deleting the log files, see page 26-15.
File names
RSView creates two data log files:
11-1
• • • • •
RSVIEW MACHINE EDITION USER’S GUIDE
Data Log Model Name.log
Data Log Model Name.tag
You’ll need this information if you log to a custom path and want to delete the log files
manually.
Data Log Models
A data log model defines which tags to log data for, as well as how and where the data is
logged.
You can set up multiple data log models, but you can run only one data log model at a
time. For information about running a different data log model, see page 11-5.
11-2
Creating Data Log Models
Use the Data Log Models editor to create one or more data log models. Each data log
model is a file stored in the editor’s folder—you can open and work on multiple models at
the same time.
Set up general aspects
of the model.
Specify where to log
the data.
Specify how logging
occurs.
Specify which tags to
log data for.
For detailed information about the options in the Data Log Models editor, see Help.
Each data log model has a unique name, and an optional description.
You can log a maximum of 300,000 points. When the maximum number of data points
have been logged, the oldest data is deleted to make room for the new data.
Data storage locations
You can store data log files in any one of these locations:
on the runtime computer
11-3
• • • • •
11 • Setting up data logging
• • • • •
RSVIEW MACHINE EDITION USER’S GUIDE
on another computer on the network
on a compact Flash Card (for PanelView Plus™ or VersaView® CE terminals only)
Logging to a network location
To log data to a network location, the network drive must be shared, and the runtime
computer must be logged in to the same domain as the computer on the network. To do
this, the user must have access rights for the domain.
The PanelView Plus or VersaView CE terminal cannot be part of a domain. However, you
can verify that the user who is logged into the PanelView Plus or VersaView CE terminal
is on a user list that is part of a domain.
For more information about logging in to a Windows® domain or authenticating users, see
page 28-1.
Data logging methods
There are two methods for triggering data logging. You can set up logging so tag values
are logged:
periodically (periodic logging)
only when a tag value changes (on-change logging)
Logging periodically
Periodic logging is used to take a snapshot of all tag values at a particular point in time.
Tag values are logged even if there has been no change.
You cannot change the periodic log rate at runtime.
Logging on change
On-change logging is used to log only tags whose values have changed.
For HMI tags, before logging occurs, the change must equal a specified percentage of
change in the tag value. The percentage is based on HMI tags’ minimum and maximum
values as set up in the Tags editor. Only the tags that change by the specified percentage
are logged. If you specify a percentage of 0, all changes are logged.
If a tag does not have a minimum or maximum attribute (for example a data server tag in
ControlLogix®), when you specify on-change logging, all changes are logged for that tag.
You don’t need to specify a percentage.
Using a heartbeat rate
You can also specify a heartbeat rate, to log values at specified times even if no tag value
changes have occurred. The heartbeat ensures that the data in the log file is current. The
11-4
heartbeat is also a good way to ensure that data logging is working and acquiring valid
data.
The heartbeat cannot be less than the maximum update rate, which is the rate at which
data servers send tag values to RSView.
If you specify a heartbeat of 0, the heartbeat is not used.
Tags in the data log model
The data log model can contain up to 100 analog or digital tags, including both HMI and
data server tags.
You cannot use string tags, array tags, tag placeholders, parameters, or expressions in your
data log model.
Deleting tags from the model
If you delete a tag from the data log model, previously logged data for the tag is not
accessible unless you add the tag back to the model.
Changing the data log model used at runtime
Your application can run only one data log model at a time. Follow this procedure to
switch data log models.
To run a different data log model
1. Shut down the application.
2. Start RSView Studio™ and open the application.
3. In the Startup editor, specify the new data log model.
4. Create the runtime application. See Chapter 25.
5. Transfer the runtime application to the runtime platform.
For information about transferring applications to:
a computer running the Windows 2000 or Windows XP operating system, see
Chapter 26.
a PanelView Plus or VersaView CE terminal, see Chapter 27.
6. Run the new application.
Displaying data logs using the trend graphic object
You can use the trend graphic object to display the data that you’ve logged. At runtime,
when the operator opens a graphic display containing a trend, the trend displays values
11-5
• • • • •
11 • Setting up data logging
• • • • •
RSVIEW MACHINE EDITION USER’S GUIDE
from the data log file for the data log model that is running. The data log model specifies
which data to collect in the data log file.
In addition to displaying historical values from the data log file, trends can display current
values for the tags in the model. Trends can also display current values for tags or
expressions that are not in a data log model. For more information about trends, see
Chapter 18.
Problems with data logging
Problems with data logging occur under these circumstances:
11-6
When your application starts at runtime, if any of the tags specified in the current data
log model do not exist, an error message is sent to FactoryTalk® Diagnostics™.
If the data log file is corrupted or invalid, the file is deleted and recreated, and an error
message is sent to FactoryTalk Diagnostics.
If logging to a folder on a networked computer, and the runtime computer is not
logged in to the Windows domain of the network computer, the log folder cannot be
created. An error message is sent to FactoryTalk Diagnostics.
If logging to an invalid path, the log folder cannot be created. An error message is sent
to FactoryTalk Diagnostics. One of the reasons that the path might be invalid is that
the top-level folder of the path is not shared.
When the application starts, RSView checks whether there is disk space to store the
data log model’s data. If there is not enough space, an error message is sent to
FactoryTalk Diagnostics and data logging does not start.
12 Using information messages
This chapter describes:
steps for setting up information messages.
using the Information Messages and Information Setup editors.
preparing to set up information messages.
how information messages work.
creating information messages in multiple languages.
the [INFORMATION] display.
creating your own information message display.
opening and closing the information message display.
how the information message display graphic object works.
changing the information message file used at runtime.
About information messages
Use information messages to give the operator messages about the process, prompts or
instructions, and information about current states.
Information messages versus local messages
Use information messages to give the operator information no matter which display is
open. To give the operator information in a specific graphic display while the display is
open, use local messages.
For details about local messages, see page 14-29.
Summary of steps
Follow these steps to set up information messages:
1. In the Information Messages editor, set up the messages and their trigger values.
2. In the Information Setup editor, specify the graphic display to open when information
messages occur, and the file of messages to display.
Also use this editor to assign a tag or expression to the Value connection. If you want
the operator to acknowledge messages, assign the Ack connection and specify the
acknowledge hold time.
12-1
• • • • •
RSVIEW MACHINE EDITION USER’S GUIDE
3. In the Startup editor, ensure that the Information messages box is checked (it is
checked by default). See Chapter 25.
4. If desired, in the Graphics editor modify the default [INFORMATION] display, or
create your own graphic display to use for information messages. For example, if you
don’t want the operator to acknowledge messages, edit the default display to remove
the information acknowledge button.
For information about graphic displays, see Chapter 14.
Using the Information Messages editor
Use the Information Messages editor to create one or more files of information messages.
Each file is stored in the editor’s folder. You can open and work on multiple message files
at the same time.
You can define up to 10,000 messages in each message file.
For detailed information about the options in the Information Messages editor, see Help.
12-2
Setting up how information messages are displayed
Use the Information Setup editor to set up how information messages are displayed.
For detailed information about the options in the Information Setup editor, see Help.
Preparing to set up information messages
As your application is running, information is continually sent to the data source about the
state of various processes. For example, your application might be monitoring whether a
valve is open or closed, or the temperature in a boiler. Values representing the status of
these processes are sent to the data source.
The data source
The RSView® documentation uses the term data source as a generic term that includes all
possible sources of tag data, for both data server tags and HMI tags. The data source can
be memory or a device such as a programmable controller or an OPC® server. RSView
writes values to and reads values from the data source. The data source is set up to
exchange information (in the form of numeric or string values) between RSView and the
machine that your application is controlling.
Identifying the tags and values to monitor
To set up information messages, determine which tags associated with machine processes
to monitor, and identify the values for those tags that will trigger information messages.
For information about creating tags, see Chapter 7.
12-3
• • • • •
12 • Using information messages
• • • • •
RSVIEW MACHINE EDITION USER’S GUIDE
How information messages work
These are the key parts of the information message system:
Information message file—a text file containing a list of messages, with a numeric
trigger value for each message
Information message display—a graphic display that opens at runtime and displays
information messages
Value connection—a tag or expression. When the value of this connection matches a
message’s trigger value, the information message display opens with the associated
message displayed.
The following example shows how the key parts of the information message system work
together.
Example: Setting up the data source to display information
messages
This example shows how to set up the data source to notify the operator that a conveyor
belt has stopped. In this example, the status of two conveyor belts is being monitored. You
can use both HMI and data server tags.
1. Create a digital tag called Conveyor_1_status. This tag points to an address in a
programmable controller that is linked to a sensor on the first conveyor belt. When the
belt is running, the tag’s value is 0. When the belt stops running, the value changes to
1.
2. Create a second digital tag called Conveyor_2_status. This tag points to an address in
a programmable controller that is linked to a sensor on the second conveyor belt.
When the belt is running, the tag’s value is 0. When the belt stops running, the value
changes to 1.
3. Create an analog tag called Information_messages. Set up the data source to send a
value of 1 to this tag when Conveyor_1_status has a value of 1, and to send a value of
2 to this tag when the Conveyor_2_status tag has a value of 1.
4. In the Information Messages editor, create these messages with trigger values
matching the values that will be sent to the Information_messages tag:
12-4
Trigger value
Message
1
Conveyor belt 1 has stopped.
2
Conveyor belt 2 has stopped.
Save the message file with the name “Conveyor belts.”
5. In the Information Setup editor, assign the Information_messages tag to the Value
connection, and select the Conveyor belts message file.
At runtime, when the value of Conveyor_1_status changes to 1, the first message is
displayed (in the default information message display). When the value of
Conveyor_2_status changes to 1, the second message is displayed.
Information messages and trigger values
Create messages associated with each tag value change that you want to inform the
operator about. Assign each message a trigger value, and set up the data source to send the
trigger value to the Value connection. You can use both HMI and data server tags.
The trigger value can be any non-zero integer value (positive or negative). Trigger values
do not need to be contiguous, but they must be unique for each message. For example, you
could use trigger values of 1, 2, and 3, or values of 10, 20, and 30.
Trigger values cannot be 0. Digital tags have two possible values, 0 and 1. Therefore, if
you use a digital tag you can only use the value 1 to trigger a message. If you want to use
a digital tag to trigger two different messages, create an expression that adds 1 to the
digital tag’s value. That way, you can use the trigger values 1 and 2.
If you use an analog tag or an expression, you can use any non-zero integer or floatingpoint value to trigger an alarm. Floating-point values are rounded to the nearest integer.
For information about how values are rounded, see page 7-2.
You can create multiple information message files, but you can use only one message file
at runtime. For information about using a different message file, see page 12-8.
Creating information messages in multiple languages
RSView supports information messages in multiple languages. Use the
CurrentLanguage( ) expression function to specify message offsets in the information
message file. In the file, divide your messages into sections for each language. For
information about the CurrentLanguage( ) function, see page 20-14. Also see the
following example.
You can export the text strings in your information message files for translation. Then
paste the translated strings into the original file. RSView does not support direct importing
of the translated message text. For information about exporting text for translation, see
Chapter 23.
12-5
• • • • •
12 • Using information messages
• • • • •
RSVIEW MACHINE EDITION USER’S GUIDE
Example: Setting up information messages in multiple languages
This example shows how to generate English, French, or German information messages at
runtime, depending on which language the application is using.
1. Create English messages for trigger values 1 to 10.
2. Create French messages for trigger values 11 to 20.
3. Create German messages for trigger values 21 to 30.
4. Assign this expression to the Value connection in the Information Setup editor:
If CurrentLanguage( )=”en-US” then Information_messages
Else If CurrentLanguage( )=”fr-FR” then Information_messages + 10
Else Information_messages + 20
The [INFORMATION] display
RSView comes with an information message graphic display called [INFORMATION]. It
contains an information message display graphic object and buttons for acknowledging
the displayed message and closing the display. By default, the [INFORMATION] graphic
display opens automatically at runtime when an information message is generated.
Information message display graphic object
Buttons
You can use the [INFORMATION] display as is, or modify the display. For example, you
can change the color of the objects, or add and remove buttons. Or, you can create your
own graphic display to use for displaying information messages. In the Information Setup
editor, specify the display to use.
Another option is to place the information message display object in a graphic display that
doesn’t open automatically when a message is generated.
For information about creating your own information message display, see page 12-7.
The information message display graphic object
The [INFORMATION] display contains an information message display graphic object,
which lists one information message at a time.
12-6
For information about how the information message display object works at runtime, see
page 12-8.
Buttons in the [INFORMATION] display
The [INFORMATION] display contains these buttons:
This button
Does this
Ack (information acknowledge) Acknowledges the information message
Close (close display)
Closes the information message graphic display.
You can assign any caption you choose to the labels on the buttons.
Using the information acknowledge button
When the operator presses the information acknowledge button, if the Ack connection is
assigned, the connection value is set to 1 at the data source. The value is held as long as
the operator presses the button, or for the acknowledge hold time, whichever is longer.
Then the connection is reset to 0.
Creating your own information message display
You can create your own graphic display for displaying information messages, containing
an information message display graphic object and the buttons you want to use in the
display.
If you create your own graphic display, use an On Top display and select the Cannot Be
Replaced option.
For more information about the information message display graphic object, see
page 12-8. For information about creating graphic displays and graphic objects, see
Chapter 14 and Chapter 15.
Opening and closing the information message display
Opening the display
The information message display you specify in the Information Setup editor (either the
default [INFORMATION] display or your own display) is automatically opened
whenever the Value connection’s value matches a trigger value.
You can also create a goto display button that the operator can press to open the
information message display. For information about setting up a goto display button and
specifying the display to open, see Help.
12-7
• • • • •
12 • Using information messages
• • • • •
RSVIEW MACHINE EDITION USER’S GUIDE
Closing the display
The information message display closes when the Value connection’s value changes to 0.
To automatically close the display when the operator acknowledges a message, set up the
data source to set the Value connection to 0 when the Ack connection is set to 1.
The operator can also close the display by pressing a close display button.
How the information message display graphic object works
At runtime, when the Value connection at the data source changes from 0 to a non-zero
value, the assigned information message display opens. If the value matches a message’s
trigger value, the associated information message appears in the information message
display graphic object. The object can be in the default [INFORMATION] display, in an
information message display you have created, or can be placed in any display in your
application.
For information about setting up the information message display graphic object, see
page 16-64.
What is displayed
If the Value connection is unassigned, the information message graphic display never
opens automatically. If the operator opens a graphic display containing an information
message display object, the object is blank.
The Value connection is rounded up to the nearest integer. If the value does not match
any of the trigger values in the specified message file, the display is filled with
question marks (?).
For information about how values are rounded, see page 7-2.
If the message is too long to fit in the information message display object, the last
displayed character is replaced with an asterisk (*).
When the Value connection’s value is 0, the information message graphic display is
closed.
Changing the message file used at runtime
Your application can use only one message file at a time. Follow this procedure to switch
message files.
To use a different message file
1. Shut down the application.
2. Start RSView Studio™ and open the application.
12-8
3. In the Information Setup editor, specify the new information message file.
4. Create the runtime application. See Chapter 25.
5. Transfer the runtime application to the runtime platform.
For information about transferring applications to:
a computer running the Windows® 2000 or Windows XP operating system, see
Chapter 26.
a PanelView Plus™ or VersaView® CE terminal, see Chapter 27.
6. Run the new application.
12-9
• • • • •
12 • Using information messages
13 Setting up security
This chapter describes:
using RSAssetSecurity.
steps for setting up security without RSAssetSecurity.
using the User Accounts editor.
how user accounts and security codes work.
assigning security to graphic displays.
providing a way for users to log in and log out.
preventing unauthorized users from stopping the application.
setting up RSAssetSecurity™ in RSView® Studio™, including:
adding RSAssetSecurity user groups and users, and setting up passwords.
assigning user access to the computer’s FactoryTalk® Directory™. RSView
Machine Edition uses the local FactoryTalk Directory.
setting up security access to the application, networks and devices, policies, user
groups, and users.
setting up policies for passwords and user accounts, for backing up and restoring
FactoryTalk Directory, and for tracking activities for audit purposes.
a sample startup display that uses all the RSView security features.
Using security with your application
RSAssetSecurity works together with RSView security features to provide secure access
to applications during development and at runtime. RSAssetSecurity is installed as part of
the FactoryTalk Automation Platform™, and uses FactoryTalk Directory to manage user
accounts and policies.
RSAssetSecurity applies to all applications and all Rockwell Software® products installed
on the development or runtime computer. For example, when you add an RSAssetSecurity
user, the user is then available to add to any RSView application.
You can use RSAssetSecurity features on the development computer to:
determine which users can view, edit, create, and delete applications.
determine which users can manage users and set up security.
13-1
• • • • •
RSVIEW MACHINE EDITION USER’S GUIDE
determine which users can back up and restore applications.
You can use a combination of RSAssetSecurity and RSView security features at runtime
to:
prevent unauthorized users from running the application.
prevent users from opening graphic displays.
prevent unauthorized users from stopping the application.
prevent users from seeing and using certain parts of a graphic display.
prevent users from switching to other applications or having access to the desktop on
the runtime computer. This feature uses the DeskLock tool, and is available for
Windows® 2000 and Windows XP runtime applications only. For more information
about the DeskLock tool, see Chapter 26. The DeskLock tool does not use
RSAssetSecurity.
To limit the users who have access to the application or parts of the application, you must
set up user accounts and passwords.
If you set up the data source to open graphic displays remotely (using global connections),
remote display changes occur whether or not the logged-in user has security access to a given
display.
For details about controlling display changes remotely, see page 8-5.
If you don’t want to use RSAssetSecurity
If you don’t plan to use security for your application, you can turn off or minimize the use
of RSAssetSecurity.
By accepting the default values in the FactoryTalk Directory Configuration Wizard during
installation, an administrative user named Administrator is created, All Users are granted
initial access permissions, and a Windows-linked user group named Authenticated Users
is created and added to the User Groups folder in the FactoryTalk Directory. This means
that any user who is authenticated by Windows, that is, has a password that allows access
to the design-time computer, does not need to provide a user name or password to open
RSView Studio.
Authenticated users are not supported on Windows CE. On Windows CE terminal, Windowslinked users must be added to FactoryTalk Directory before they can be logged in.
If you don’t use RSView user accounts
RSView creates a user named DEFAULT, and this user is automatically logged in when
you start applications at runtime. You don’t need to set up any other users, and users don’t
need to log in to use the applications you create.
13-2
If you use RSView user accounts
If you want to use RSView user accounts, for example, to run login and logout macros,
but you don’t want to use RSAssetSecurity, follow these steps.
1. Add users or user groups to RSAssetSecurity. For details, see page 13-17.
2. Add the RSAssetSecurity users or user groups to the RSView User Accounts editor.
For details, see page 13-4.
3. In the RSView User Accounts editor, if desired, assign login and logout macros and
security codes to users or users groups. For details, see Help for the editor.
4. In the Graphics editor, assign security codes to graphic displays that will have limited
access.
5. Provide users with a method for logging in and out.
6. If desired, prevent unauthorized users from stopping the application.
These steps are described in detail in this chapter.
Working with the User Accounts editor
Use the User Accounts editor to:
add RSAssetSecurity users and assign security codes and login and logout macros, for
each user or group of users that will have access to the application at runtime.
migrate users from earlier versions of RSView to version 4.0.
assign user passwords (version 3.x applications only).
add Windows users or groups (version 3.x applications only).
The method for adding users and assigning security codes to them depends on whether
you are setting up users for RSView 4.0 applications or for RSView 3.x applications.
There is a separate tab for each.
The User Accounts editor has special items on the View menu to control the appearance of
the editor. It also has items on the Setup menu, and extra tools on the toolbar.
The DEFAULT user
The first account in the editor is the DEFAULT user account. The DEFAULT account is
used when no one is logged in. The DEFAULT user initially has access to each security
code. Unless you want everyone to have access to all parts of the application at runtime
without logging in, turn off the DEFAULT user’s access to the security codes you plan to
use.
13-3
• • • • •
13 • Setting up security
• • • • •
RSVIEW MACHINE EDITION USER’S GUIDE
You cannot delete the DEFAULT user account.
Assign the security code for the startup display to the DEFAULT user, or else the startup display
won’t open. If the startup display uses the * security code, you can assign any code from A to P
to open the display. For more information, see page 13-9.
Setting up users for 4.0 applications
Form area
Spreadsheet
area
Use the form area to assign security codes to the DEFAULT user only. For other
users and groups, the codes are not visible. Assign security codes to them in the
Security Settings dialog box, as described next.
To add RSAssetSecurity users and groups to RSView and assign
security codes to them
1. Open the User Accounts editor and select the RSView 4.0 Accounts tab.
2. On the Setup menu, click Add Users/Groups.
13-4
3. In the Security Settings dialog box, add users and groups, and assign security codes to
them. For details, click the Help button.
4. In the User Accounts editor, assign login and logout macros to the users and groups.
For details about using the User Accounts editor, see Help.
To migrate RSView 3.x users to RSView 4.0
1. With the User Accounts editor and the RSView 4.0 Accounts tab selected, on the
Setup menu, click Migrate 3.x User Accounts.
Users from the RSView 3.x Accounts tab are added to the RSAssetSecurity Users
folder and to the RSView 4.0 Accounts tab.
Users are not migrated if they already exist in the RSView 4.0 account list.
13-5
• • • • •
13 • Setting up security
• • • • •
RSVIEW MACHINE EDITION USER’S GUIDE
2. If desired, edit the users’ security codes and login and logout macros, as described in
the previous section.
3. To edit the users’ passwords, see page 13-18.
Setting up users for 3.x applications
Form area
Spreadsheet
area
Double-click in the security code columns
to toggle between Yes and No.
To add users to RSView 3.x applications and assign security
codes to them
1. Open the User Accounts editor and click the RSView 3.x Accounts tab.
2. Add users, and then assign macros, passwords, and security codes to them.
For details about using the User Accounts editor, see Help.
13-6
Changing RSView 3.x user passwords
For RSView 3.x applications, users cannot change passwords at runtime. You can only
change passwords in the User Accounts editor. After changing passwords, recreate the
application and download the .mer file.
Adding 3.x users or groups from a Windows domain
In RSView 3.x applications, there are two possible types of user accounts:
users or groups from a Windows domain
users you create in RSView.
You cannot use both user account types in the application at the same time.
Before you can make use of Windows user accounts in RSView, you must first create the
user accounts in your Windows domain. To do this in a Windows network domain, your
network must have at least one Windows server acting as a domain controller. You cannot
use Windows Workgroups.
When you use Windows users or groups, the user password is the Windows domain
password.
To add users from a Windows domain to RSView
1. Open the User Accounts editor and click the RSView 3.x Accounts tab.
2. On the Setup menu, click Windows Security Options.
13-7
• • • • •
13 • Setting up security
• • • • •
RSVIEW MACHINE EDITION USER’S GUIDE
3. In the Windows Security Options dialog box, specify the users and groups to use. For
details, see Help.
4. In the User Accounts editor, specify login and logout macros and assign security
codes to the users. For details, see Help.
You cannot change the user or group name (Account ID) and password. To change the
password, use the Windows Control Panel.
Removing 3.x users or groups
You can also use the Windows Security Options dialog box to remove users or groups.
When you remove a user or group from the RSView User Accounts list, the user or
group’s name is deleted from the RSView User Accounts editor. The user or group is not
deleted from the Windows domain.
If you remove users from the Windows domain, they are not removed automatically from
the RSView User Accounts editor. You must remove the users from the User Accounts
editor manually, using the Windows Security Options dialog box.
13-8
How user accounts and security codes work
When you assign a security code to a graphic display, only the users and groups who are
assigned that security code have access to the display. There are 16 security codes, A
through P.
The asterisk symbol (*) is used in displays and represents any code. Users must have at
least one code assigned to open displays that use the * code.
You can assign combinations of security codes to users and groups, to allow each user or
group access to a different set of displays or graphic objects.
To use security codes to restrict user access to graphic objects, assign visibility animation
to the objects using expressions containing the security functions. For an example, see
page 13-13.
Assigning security to graphic displays
Assign security to graphic displays in the Graphics editor. You can:
assign security when you create the graphic display, or at any time after creating the
display.
assign the same security code to more than one display.
assign whichever codes you want, in any order. For example, you can choose to use
only the codes D and P and you can assign P before you assign D.
For more information about graphic displays, see Chapter 14.
To assign security to a graphic display
1. In the Graphics editor, right-click an empty area of the display, and then click Display
Settings.
13-9
• • • • •
13 • Setting up security
• • • • •
RSVIEW MACHINE EDITION USER’S GUIDE
2. In the General tab, select a security code.
To give every security code access to the display, select the asterisk (*). The * is
selected by default.
Example: Assigning security codes to prevent access to graphic
displays
This example shows how to set up users with access to different graphic displays.
1. Assign security codes to graphic displays as follows:
To this display
Assign this security code
Alarm History
A
Boiler
B
Furnace
C
Top Secret
D
2. In the User Accounts editor, assign the security code P to the DEFAULT user.
13-10
3. In the Security Settings dialog box, assign security codes to the other users:
To this user
Assign these security codes
MAINTENANCE
A, B, C
OPERATOR
A, B
ADMIN
All
If you deny permission for an action to a user, this overrides permission the user is granted as a
member of a group. If you deny permission for an action to a group, allowing the action to a
member of the group does not override the denial. The denial always takes precedence.
13-11
• • • • •
13 • Setting up security
• • • • •
RSVIEW MACHINE EDITION USER’S GUIDE
Select the user or
group to set up.
Assign security
codes.
If you don’t want the user or group to have
a code, leave both columns blank.
The users have access to these graphic displays:
13-12
MAINTENANCE has access to the first three graphic displays.
OPERATOR has access to the Alarm History and Boiler displays, but not to the
Furnace or Top Secret displays.
The ADMIN user has access to every graphic display.
The DEFAULT user has access only to graphic displays to which * or P has been
assigned. In this example, the DEFAULT user does not have access to any of the four
graphic displays.
In this example, you could have assigned the same security code to the Alarm History and
Boiler displays, since all users except the DEFAULT user have access to these displays.
Example: Using security codes to control the visibility of the
shutdown button
This example shows how to set up users so that only authorized users can use the
shutdown button to stop the application.
This example uses the CurrentUserHasCode security function to determine whether a user
is authorized to view and use the shutdown button.
The security code E is assigned to users who are authorized to use the button.
1. In the User Accounts editor, clear all the security codes for the DEFAULT user.
2. In the Security Settings dialog box, assign security codes to users.
To this user
Assign these security codes
OPERATOR
A, B
MAINTENANCE
A, B, C, E
ADMIN
All
3. Create a shutdown button.
4. Assign visibility animation to the button using this expression:
CurrentUserHasCode( E )
For the Expression True State, click Visible.
When the graphic display containing the shutdown button is open, the MAINTENANCE
and ADMIN user can see the button. If the OPERATOR or DEFAULT user is logged in,
the button is not visible.
Providing a way for users to log in and log out
Use login and logout buttons to provide a way for users to log in and log out. Make sure
you place these buttons in graphic displays that all users have access to.
13-13
• • • • •
13 • Setting up security
• • • • •
RSVIEW MACHINE EDITION USER’S GUIDE
Logging in
When the application starts, the DEFAULT user is logged in. If a macro is assigned to the
DEFAULT user, the macro runs.
For example, you could create a macro to set the remote display number to open a login
display when the DEFAULT user logs in. For information about controlling display
changes remotely, see page 8-5. Remote display changes are not checked for security.
To provide a way for users to log in
1. Specify the startup display in the Startup editor, in the Initial graphic box. The startup
display is the graphic display that opens when your application starts running.
The startup display must have the * code or a security code that is assigned to the
DEFAULT user, or it will not open.
For information about the Startup editor, see Chapter 25.
2. Create a login button in the startup display.
For information about creating graphic objects, see Chapter 15. For information about
setting up login buttons, see Help.
For more information about logging in, see Chapter 28.
Logging out
To best maintain your security system, users who log in are also required to log out.
When the current user logs out, if a logout macro is assigned to the user, the macro runs. If
the user belongs to a group, and a logout macro is set up for the group, the logout macro
runs.
After the current user is logged out, the DEFAULT user is logged in. If a login macro is
assigned to the DEFAULT user, the macro runs. Turn off the DEFAULT user’s access to
the security codes you plan to use.
To provide a way for users to log out
1. Create a logout button in a graphic display that all logged-in users have access to.
Logging out automatically
You can set up your runtime terminal so that the current user will be logged out
automatically after the terminal has been inactive for a specified period of time. The
automatic logout is independent of RSAssetSecurity settings or Windows security
settings. The logout will take place regardless of what you set up in RSAssetSecurity or
Windows.
13-14
To set up automatic logout
1. In the Explorer window, double-click Project Settings, and then click the Runtime tab.
2. Select Enable auto logout.
3. Specify how many minutes the terminal must be inactive before the automatic logout
occurs.
At runtime, when the inactivity period expires, the current user is logged out. Logout
macros assigned to the current user run. The DEFAULT user is logged in. The DEFAULT
user’s login macros run.
Preventing unauthorized users from stopping the application
To prevent unauthorized users from stopping the application
Do not use a title bar on the application window, because the title bar contains a Close
button. To turn off the title bar for the application window, in the Project Settings
editor, in the Runtime tab, clear the Title bar check box.
For more information about using the Project Settings editor, see Chapter 4.
Assign visibility animation to the shutdown button, so that the button is only visible
when a user who is authorized to stop the application is logged in. For an example, see
page 13-13.
Or, set up security for the graphic display in which the shutdown button is located, so
only users who are authorized to stop the application can open the display.
Additional step for Windows 2000 and Windows XP
applications
Use the DeskLock tool to prevent users from having access to the desktop, to prevent
access to operating system functions such as restarting Windows or shutting down
tasks. For more information, see page 26-16.
Additional step for VersaView® CE applications
Hide the Windows Taskbar to make it inaccessible.
To hide the Windows Taskbar
1. On the Windows Start menu select Settings, and then select Taskbar.
2. Clear the “Always on top” check box.
3. Select Auto hide.
4. When you are finished, click OK.
13-15
• • • • •
13 • Setting up security
• • • • •
RSVIEW MACHINE EDITION USER’S GUIDE
5. At the Command prompt or in the Run box, run Regflush.exe to save your changes to
persistent internal flash memory. Otherwise, the changes will be lost when you reboot.
Setting up RSAssetSecurity for your application
In the Explorer window of RSView Studio you can:
create RSAssetSecurity users and groups of users, and assign passwords to users.
set up access to the FactoryTalk Directory.
set up access to the application.
assign security access to policies, groups, and users.
set up access to network devices.
specify which users can backup and restore FactoryTalk Directory.
specify the types of activities to track for audit purposes.
specify policies for passwords and user accounts, such as how often passwords must
be changed.
Depending on what other products are installed on the computer, you can also assign
security access for those products to your users. For example, you can specify which users
are allowed to browse the network for RSLinx® Enterprise™ devices.
13-16
Set up access to the FactoryTalk
Directory.
Set up access to the application.
You can assign security to all the
folders in the System folder.
Set up policies.
Set up access to devices.
Add users and groups, and
assign passwords. The link
symbol indicates Windows-linked
groups and users.
Creating RSAssetSecurity users
You must set up users in RSAssetSecurity before you can add them to the RSView User
Accounts editor.
RSAssetSecurity allows you to reference user accounts that have already been set up in
Windows. These are called Windows-linked users. The link symbol in the Explorer
window indicates that a user is a Windows-linked user.
13-17
• • • • •
13 • Setting up security
• • • • •
RSVIEW MACHINE EDITION USER’S GUIDE
The RSAssetSecurity access you give to users determines what actions they can perform
in RSView, both on the development computer and at runtime.
To do this
Allow these Common actions
Open applications
Read and List Children
Add and edit applications or components
Write and Create Children
Delete applications or components
Delete
Assign security and create users
Create Children and Configure Security
You can assign different permissions to users at different levels of the application.
Inheriting permissions
The security you set up at the top level, the FactoryTalk Directory, is inherited by the
application and users below it, unless you select “Do not inherit permissions.” One way to
set up security is to assign the Read and List Children permissions to the All Users group
at the FactoryTalk Directory level, and then assign permissions for writing, creating
children, configuring security, and deleting to users and groups at the application level.
If you deny permission for an action to a user, this overrides permission the user is granted as a
member of a group. If you deny permission for an action to a group, allowing the action to a
member of the group does not override the denial. The denial always takes precedence.
To set up users
1. In the System folder, right-click Users, and then click New User or New WindowsLinked User.
2. Specify the user name, password, and password options. For details, see Help.
3. Right-click Users, and then click Security.
4. Specify what actions the users can perform. For details, see Help.
5. To add users to a group, right-click the group and then click Properties. For details, see
Help.
To change user passwords
1. In the Users folder, right-click the user name, and then click Properties.
2. Click Reset Password. For details, see Help.
Users can change their password at runtime using the Password button. For more
information, see page 28-4.
13-18
Creating RSAssetSecurity user groups
The use of user groups is optional but recommended. Groups allow you to set up security
access once for the entire group, rather than individually for members of the group. You
can still set up separate permissions for individual members of the group.
Setting up groups saves time. You can add all the users of an application to a single group in
RSAssetSecurity, then add the group to the RSView User Accounts editor in one step, which is
much quicker than adding the users one by one.
RSAssetSecurity allows you to use groups that have already been set up in Windows.
These are called Windows-linked groups. The link symbol in the Explorer window
indicates that a group is a Windows-linked group.
RSAssetSecurity comes with an Administrators group already set up. To start with,
members of this group have full security access to RSAssetSecurity, and therefore have
full access to your applications. The user you set up for FactoryTalk Local Directory when
you installed FactoryTalk Automation Platform is a member of the Administrators group.
To ensure that you are never locked out of FactoryTalk Directory we recommend that you assign
more than one user to the Administrators group. That way if one user is locked out, you can use
the other one to log in.
To set up user groups
1. In the System folder, right-click User Groups, and then click New User Group or New
Windows-Linked User Group.
2. Add user groups. You can add members to the groups now or later. For details, see
Help.
3. Right-click User Groups, and then click Security.
4. Specify what actions members of the group can perform. For details, see Help.
5. To add members to the group later, right-click the group and then click Properties. For
details, see Help.
Setting up security access to the FactoryTalk Directory
The RSAssetSecurity access that you set up for the FactoryTalk Directory applies to all
RSView applications and all Rockwell Software products installed on the development
computer.
By default, applications and the System folder inherit the security permissions assigned to
the FactoryTalk Directory. This means that you only need to assign permissions to user
groups or users once. If desired, you can override the permissions that you set up at this
level by assigning different permissions to applications and to the items in the System
folder.
13-19
• • • • •
13 • Setting up security
• • • • •
RSVIEW MACHINE EDITION USER’S GUIDE
You can assign permissions for actions related to RSView applications and tags here or at
the application level. If you assign them here, they are inherited by all applications.
To set security permissions for the FactoryTalk Directory
1. At the top of the tree in the Explorer window, right-click Local, and then click
Security.
2. Specify which users and groups have access to FactoryTalk Directory, and assign
permissions to users and groups for the actions listed in the dialog box. For details, see
Help.
Setting up security access to the application
Assign RSAssetSecurity at the application level to specify which users or groups can open
the application and add, edit, and delete components. You can also specify which users or
groups can write to tags and set up, view, and respond to alarms.
To set security permissions for the application
1. Right-click the application name, and then click Security.
2. Specify which users and groups have access to the application, and assign permissions
to users and groups for the actions listed in the dialog box. For details, see Help.
Setting up security access to System policies, groups, and
users
You can assign security access to the System folder and to all the folders in the System
folder, including policies, groups, and users. You do this by specifying which groups and
users have access to the folder, and what actions they can perform.
To set up security access to policies, groups, and users
1. Right-click the System folder, or a folder in the System folder, and then click Security.
2. Specify which groups and users have access to the folder, and what actions they can
perform. For details, see Help.
Setting up security access to networks and devices
You can assign security access to networks and devices in general, to the development
computer, and to specific devices. Set up security for networks and devices if you are
using RSLinx® Classic devices.
To set up security access to networks and devices
1. In the System folder, right-click Networks and Devices, the development computer
workstation, or a specific device, and then click Security.
13-20
2. Specify which groups and users have access to the item, and what actions they can
perform. For details, see Help.
Specifying which users can back up and restore FactoryTalk
Directory and RSView applications
You can allow users or groups of users to back up and restore the contents of the local
FactoryTalk Directory, including applications, users, groups, and all security settings.
Users must have permission to back up and restore FactoryTalk Directory to use the
Application Manager tool to back up and restore applications. For information about
using the Application Manager, see page 4-10.
To specify which users can back up and restore FactoryTalk
Directory and RSView applications
1. In the System Policies folder, double-click User Rights Assignment.
2. Set permissions for users. For details, see Help.
Specifying activities to track for audit purposes
You can keep an audit trail of activities such as changing the setup of the FactoryTalk
Directory and whether security access is denied or granted to users.
To specify which activities to track for audit purposes
1. In the System Policies folder, double-click Audit Policy.
2. Set up audit policies. For details, see Help.
Specifying policies for passwords, accounts, and FactoryTalk
sign-on
You can use the FactoryTalk Directory Security Policy to specify how to manage
passwords and user accounts, including how long passwords must be, how often they
must be changed (if ever), and whether to keep a record of deleted user accounts.
Remember that any changes that you make to system security policies will be included as part of
the run-time application. It is therefore very strongly recommended that you do not alter the
default settings in the Security Policy Properties dialog unless absolutely necessary, and unless
the implications of the changes are fully understood.
Single sign-on
You can also use the Security Policy to turn off FactoryTalk single sign-on. If you turn this
feature off, users must log into FactoryTalk each time is RSView Studio restarted. When
the feature is on, if you shut down RSView Studio and restart it without restarting your
computer, you remain logged in to FactoryTalk and are not prompted to log in again.
13-21
• • • • •
13 • Setting up security
• • • • •
RSVIEW MACHINE EDITION USER’S GUIDE
To specify how to manage passwords, user accounts, and
FactoryTalk sign-on
1. In the System Policies folder, double-click Security Policy.
2. Set up options for accounts, passwords, and single sign-on. For details, see Help.
Summary of steps
Follow these steps to set up security:
1. In the Explorer window, in the System folder underneath the HMI server, add
RSAssetSecurity user groups and users, and set up passwords.
2. Assign user access to the computer’s FactoryTalk Directory.
3. If desired, restrict access to the application and to networks and devices. You can also
restrict security access to policies, user groups, and users.
4. Set up policies for:
backing up and restoring FactoryTalk Directory.
tracking activities for audit purposes.
passwords and user accounts.
5. In the User Accounts editor, add RSAssetSecurity users or user groups to RSView,
and assign login and logout macros and security codes to them.
6. In the Graphics editor, assign security codes to graphic displays that will have limited
access.
7. Provide users with a method for logging in and out.
8. If desired, prevent unauthorized users from stopping the application.
These steps are described in detail in this chapter.
Summary of security features in a sample startup display
This section provides an example of how to use RSAssetSecurity and RSView security
features in a startup graphic display called Log In.
To create a startup display that uses security
1. Set up RSAssetSecurity user accounts and passwords.
2. Assign Common\Read and Common\List Children security permissions to all users
that are allowed to run the application, at the FactoryTalk Directory or application
level.
13-22
3. Assign Tag\Write Value permission to all users that are allowed to write values to tags.
4. In the User Accounts editor, assign at least one security code to each user who you
want to log in, including the DEFAULT user.
5. In the Project Settings editor, clear the Title bar check box.
6. Create a graphic display called Main Menu. In the display create navigation buttons
that give the operator access to the different displays in the application. Assign a
security code to the display so that only authorized users can open it.
7. Create a graphic display called Log In containing these button objects:
This button
Does this
Login
Opens the Login dialog box.
Logout
Logs the current user out and logs in the DEFAULT user.
Password
Opens the Change Password dialog box so the user can specify
a new password.
Goto display
Opens the Main Menu graphic display.
Shutdown
Shuts down the application.
8. Set up the goto display button in the Log In display to open the Main Menu display. If
desired, attach visibility animation to the goto display button, so that only logged-in
users can see the button.
For more information, see the example on page 13-24.
9. Attach visibility animation to the shutdown button, so that only authorized users can
see (and therefore use) the button.
For more information, see the example on page 13-25.
10. Specify captions for the buttons, and add explanatory text to the graphic display. If
desired, attach visibility animation to the text as well.
11. In the Display Settings dialog box, assign the security code * to the Log In display.
12. In the Startup editor, in the Initial graphic box, select the Log In display.
Until an authorized user is logged in, further access to the application is denied. In
addition, only authorized users can stop the application.
Users who have access to the application can use the application and log out. Make sure
you provide a way for users to navigate back to the Log In display to log out.
13-23
• • • • •
13 • Setting up security
• • • • •
RSVIEW MACHINE EDITION USER’S GUIDE
When a user logs out, the DEFAULT user is automatically logged in. Do not give the DEFAULT
user access to the goto display button or shutdown button.
You can also use the Remote Display Number connection to open the startup Log In
display when a user logs out. This might be useful if users can log out from various
locations (graphic displays) within the application. For an example, see page 8-6.
For more information about
See
Using the Project Settings editor
Chapter 4
Attaching animation to graphic objects
Chapter 17
Setting up display navigation
Chapter 24
Using the Startup editor
Chapter 25
Logging in, logging out, and changing passwords Chapter 28
Stopping applications
Chapter 26
Example: Assigning visibility animation to the goto display button
This example shows how to assign visibility animation to the goto display button so that a
user must log in before seeing the button.
This example uses the security function CurrentUserName( ). The function returns the
string value of the Account ID (user name) for the user who is currently logged in.
The CurrentUserName( ) function is case sensitive. All RSView 3.x user names use
uppercase letters.
When the application starts, the DEFAULT user is logged in. The DEFAULT user is also
logged in when a user logs out.
To assign visibility animation to the goto display button
1. Right-click the goto display button, select Animation, and then click Visibility.
2. In the Animation dialog box, in the Expression box, type this:
CurrentUserName( ) <> “DEFAULT”
3. For the Expression True State, click Visible.
4. Click Apply.
13-24
Example: Assigning visibility animation to the shutdown button
This example shows how to assign visibility animation to the shutdown button so that
only the ADMIN user can stop the application.
To assign visibility animation to the shutdown button
1. Right-click the shutdown button, select Animation, and then click Visibility.
2. In the Animation dialog box, in the Expression box, type this:
CurrentUserName( ) == “ADMIN”
3. For the Expression True State, click Visible.
4. Click Apply.
Example: Assigning visibility animation to the shutdown button
This example shows how to assign visibility animation to the shutdown button so that
only users assigned code G or code H can stop the application.
To assign visibility animation to the shutdown button
1. Right-click the shutdown button, select Animation, and then click Visibility.
2. In the Animation dialog box, in the Expression box, type this:
CurrentUserHasCode(GH)
3. For the Expression True State, click Visible.
4. Click Apply.
13-25
• • • • •
13 • Setting up security
14 Using graphic displays
This chapter describes the editors in the Graphics folder and outlines how to:
use the Graphics editor.
set up graphic displays.
create a background for your displays.
use global objects.
use graphic libraries.
import graphic images.
create parameters to use the same display with different tags.
create local messages in your displays.
print graphic displays at runtime.
Before creating graphic displays, specify project settings. Project settings determine important
aspects of your graphic display such as size and position. For more information, see page 4-10.
About graphic displays and graphic objects
A graphic display represents the operator’s view of plant activity. The display can show
system or process data and provide operators with a way to write values to an external
data source. The data source can be memory or a device such as a programmable
controller or an OPC® server.
Operators can print the display at runtime to create a visual record of tag values, object
states, or current messages.
The elements that make up a graphic display are called graphic objects. You can create
objects in the Graphics editor, or copy them from a global object display, from a graphic
library, or from another application.
For information about creating and copying graphic objects, see Chapter 15.
You can use up to 1,000 tags per graphic display. This limit includes the tags contained in
embedded variables.
14-1
• • • • •
RSVIEW MACHINE EDITION USER’S GUIDE
Before you begin
Before you begin, plan your displays. Think about what information the operator needs to
see, and the best way to provide the information. For example:
Does the operator need to know the exact speed of a conveyor belt, or just whether the
belt is moving, jammed, or stopped?
Do different users need to have access to different types of information?
Do you need to limit access to certain types of information?
Also consider the runtime environment and how the operator will use the application:
Does the runtime computer have a touch screen, mouse, keyboard, or some
combination of these?
How will the operator navigate through the displays of the application?
Will the application be available in multiple languages?
Review the chapters on planning, security, and navigation before you begin creating
displays. Browse through the sample applications for design ideas. Map out a display
hierarchy. Then create a graphic display to use as a template.
The time you spend planning your displays will make your application easy to use and
will save you time in the long run.
For information about
See
Planning your displays and creating a template
Chapter 3
Setting up application security to control access to displays
Chapter 13
Setting up display navigation and creating a display hierarchy
Chapter 24
Setting up how objects are used at runtime
Chapter 16
Using the Graphics editor
The Graphics editor opens when you create or open a graphic display, global object
display, or graphic library. Each display is stored in the Displays folder. You can open and
work on multiple graphic displays at the same time.
14-2
Creating and opening graphic displays
To create a graphic display
1. In the Graphics folder, do one of the following:
New Display tool
right-click Displays and then click New.
click the New Display tool.
drag and drop the Displays icon into the workspace.
2. On the Edit menu, click Display Settings to open the Display Settings dialog box and
specify settings for the display.
For more information, see page 14-11.
3. Create the objects you want to put in the display.
For information about creating graphic objects, see Chapter 15.
4. On the File menu click Save, or click the Save tool.
Save tool
5. In the Component name box, type a name for the display, and then click OK.
The display is added to the list in the Displays folder.
The display is created as a Replace display by default, but you can change it to an On
Top display in the Display Settings dialog box. For more information about display
types, see page 14-12.
To open a graphic display
In the Graphics folder, open the Displays folder and then double-click the display
name, or right-click the display name and then click Open.
You can also drag and drop the display from the Explorer window to an empty area in
the RSView® Studio™ workspace.
14-3
• • • • •
14 • Using graphic displays
• • • • •
RSVIEW MACHINE EDITION USER’S GUIDE
This example shows a graphic display from the Malthouse sample application, with
the Explorer window closed.
Standard toolbar
Graphics toolbar
Objects toolbar
Display area
Object explorer
Diagnostics List
Status bar
Property Panel
The Graphics editor has special items on the View and Edit menus, and extra toolbars.
For details about using the Graphics editor, see Help.
Importing and exporting graphic displays
Each graphic display’s information is contained in a file called Displayname.gfx.
The Graphics Import Export Wizard in RSView Studio allows you to export this
information to an XML file, or to import a graphic display XML file.
You can export the display information, import the graphic display XML file to another
RSView application, and then modify it to suit your requirements. Or, you can modify the
file before importing it.
You can use the Graphics Import Export Wizard to import graphic display information
that has been created using an external programming tool or editor, or you can import an
RSView XML file.
14-4
For more information about importing and exporting graphic display files, see
Appendix E.
Tools and tips for working in the Graphics editor
This section describes features of the Graphics editor that help you create your displays. It
describes how to:
use context menus and toolbars to perform actions quickly.
view displays in grayscale to emulate the appearance of a PanelView Plus™ terminal.
set up a grid that you can use to position and size objects precisely.
zoom in when you need to look at details closely.
correct mistakes.
test your displays as you work.
Using context menus
No matter where you are in the Graphics editor, you can open a menu by clicking the right
mouse button. This is often quicker than moving the mouse up to the menus at the top of
the screen.
The items on the menu depend on the cursor’s location. For example, when you rightclick an object, the menu contains the most common actions you can perform on that
object.
14-5
• • • • •
14 • Using graphic displays
• • • • •
RSVIEW MACHINE EDITION USER’S GUIDE
When you rightclick an object...
...a menu opens. It
contains menu items
for working with the
selected object.
14-6
Using the toolbars
The toolbars provide another convenient way to perform an action quickly. You can
customize your workspace by dragging the toolbars to any location on the screen. You can
also dock them to the inside edges of the RSView Studio workspace.
Click the Close button
to close the toolbar.
Click the grab bars and drag to
undock a docked toolbar.
Click the title bar and drag to move
a floating (undocked) toolbar.
To display a toolbar
On the View menu, select Toolbars, and then click the toolbar to display.
The menu displays a check mark beside the toolbars that are already open.
To undock a toolbar
Click the double “grab bars” at the left or top of the toolbar, and then drag. Press the
Ctrl key to prevent accidental redocking.
14-7
• • • • •
14 • Using graphic displays
• • • • •
RSVIEW MACHINE EDITION USER’S GUIDE
To move an undocked toolbar
Click the toolbar’s title bar, and then drag. Press the Ctrl key to prevent accidental
redocking.
To dock a toolbar
Click the toolbar’s title bar, and then drag to any edge of the workspace.
To close a toolbar
On the View menu, select Toolbars, and then click the name of the toolbar to close, or
click the toolbar’s Close button.
Showing displays in grayscale
You can set displays to appear in grayscale, especially for developing applications that
will run on the PanelView Plus grayscale terminals. When Show Displays in Grayscale is
checked (on the View menu), all open displays will change from full color to grayscale.
When Show Displays in Grayscale is cleared, all open displays will appear in color.
Show Displays in Grayscale does not work in Test Application mode.
Third party ActiveX® objects will not appear in grayscale if Show Displays in Grayscale
is checked.
Using the grid
To size and position objects precisely, use the grid. You can change the grid settings at any
time during the drawing process.
The grid can be active or passive. When the grid is active, all the objects you draw or
position are pulled to the closest grid point. This makes it easy to align and size objects.
When the grid is passive, it is visible but does not affect the position of your objects.
Make the grid passive to position an element between the grid lines. Make the grid active,
and the next object you draw or place is automatically aligned with the grid. Making the
grid active does not affect the placement of existing objects.
The grid is visible during application development only. It is not visible at runtime.
14-8
To set up the grid
1. On the View menu, click Grid Settings, or right-click an empty area of the display and
then click Grid Settings.
Check this box to make
the grid visible.
Check this box to make
the grid active.
Select a color for the
grid points.
Set the spacing of the grid
points in pixels.
2. Specify the color and spacing of the grid points.
3. To turn on the grid, click Show Grid.
When the Grid Settings dialog box is not open you can turn the grid on by clicking
Show Grid on the View menu.
4. To make the grid active, click Snap To Grid.
When the Grid Settings dialog box is not open you can make the grid active by
clicking Snap On on the View menu.
5. Click OK.
To make the grid passive
In the Grid Settings dialog box, clear the Snap To Grid check box, or on the View
menu click Snap On to toggle the option off.
There is no check mark beside the menu item when it is turned off.
To turn off the grid
In the Grid Setting dialog box, clear the Show Grid check box, or on the View menu,
click Show Grid to toggle the option off.
Zooming in and out
To magnify or reduce your view of a graphic display, use Zoom In and Zoom Out. Zoom
In magnifies objects; Zoom Out reduces magnification.
14-9
• • • • •
14 • Using graphic displays
• • • • •
RSVIEW MACHINE EDITION USER’S GUIDE
To zoom in on objects
1. Select the objects you want to zoom in on.
Zoom In tool
2. On the View menu, click Zoom In, or click the Zoom In tool.
To zoom out
Zoom Out tool
On the View menu, click Zoom Out, or click the Zoom Out tool.
Correcting mistakes
If you change your mind about something you did, you can undo the action. If you change
your mind again, you can redo the action.
You can undo and redo all the operations you performed since you last saved the display,
one operation at a time.
The operations you perform between opening and closing a dialog box are treated as a
single operation. Operations you perform in the Property Panel are treated as separate
operations.
To undo an operation
Undo tool
To redo an operation
Redo tool
On the Edit menu, click Undo, or click the Undo tool.
On the Edit menu, click Redo, or click the Redo tool.
Testing your displays as you work
To test the objects in your displays as you work, use the Test Display tool to switch to test
mode. When you are finished testing, switch back to edit mode to continue editing.
Test mode is not the same as running the display. It does not change the appearance or position
of the display as set up in the Display Settings dialog box. Alarm and information messages are
not displayed, although if communications are set up, tag values are read and written. Display
navigation, data logging, parameters, and macros do not work in this mode. If you want to test
these features, test the application as described on page 25-2.
Using the Diagnostics List when in test mode
The Diagnostics List shows messages about system activities when you test your graphic
displays. You can specify the types of messages to display in the Diagnostics List, move
the list, resize it, and clear the messages in it.
For information about using the Diagnostics List, see page 2-5. For information about
specifying the types of messages to show in the Diagnostics List, see page 10-5.
14-10
To use test mode
Test Display tool
On the View menu, click Test Display, or click the Test Display tool.
To return to edit mode
On the View menu, click Edit Display, or click the Edit Display tool.
Edit Display tool
Setting up graphic displays
To set up a graphic display, specify its type, background color, and runtime behavior in the
Display Settings dialog box. You can specify and edit the display settings at any time
while you work on your display.
Specifying display settings
To specify display settings
On the Edit menu, click Display Settings, or right-click an empty area of the display
and then click Display Settings.
Set up how the display looks.
Set up how the display works
at runtime.
For details about the options in the Display Settings dialog box, see Help.
14-11
• • • • •
14 • Using graphic displays
• • • • •
RSVIEW MACHINE EDITION USER’S GUIDE
About display types
Replace displays
Replace is the default display type. Replace displays are full-sized displays. They use the
project window size specified in the Project Settings editor.
For more information about the project window size, see page 4-10.
At runtime, you can have only one Replace display open at a time. When the operator
opens a Replace display, this is what happens:
The Replace display that was open closes.
On Top displays that do not use the Cannot Be Replaced option are closed.
The new Replace display opens.
On Top displays that use the Cannot Be Replaced option remain open, on top of the
new Replace display.
If the operator attempts to open a Replace display that is already open (for example, using
a goto display button to which the same display is assigned), the display does not close
and RSView sends an error message to FactoryTalk® Diagnostics™.
On Top displays
Use the On Top option to create “pop-up” displays that open on top of the current Replace
display. Usually, On Top displays are smaller than Replace displays, so the operator
doesn’t lose track of display navigation.
You can open multiple On Top displays. If more than one On Top display is open, the
display that has focus, or had the most recent focus, appears on top.
When an On Top display closes, the display that had the most recent focus appears on top.
Use the Cannot Be Replaced option if you want the On Top display to remain open when
a new Replace display is opened.
On Top displays do not have a Close button in the title bar. Be sure to create a close button
graphic object in On Top displays so the operator can close them.
The operator cannot move an On Top display by dragging its title bar. The runtime
position of the display is fixed (according to the position settings defined for the display).
You can specify unique titles for On Top displays. The title text can switch languages at
runtime.
14-12
Resizing displays
The project window size is used for all Replace displays. If you change the project
window size after you have designed any graphic displays, you have the option of scaling
graphic displays.
If you choose to scale graphic displays, all Replace and On Top displays are resized and
the objects in them are scaled to fit the new size. You can also specify whether to scale the
font size and border size of the graphic objects, and the size of graphic images in the
Images folder.
If you choose not to scale displays when you change the project window size, Replace
displays are resized, but any objects in the displays remain the same size and in the same
position as before. On Top displays are not resized.
For information about specifying the project window size, see page 4-10.
Changing the display area while working
You can change the display area of a display while you’re working on it by dragging the
border of the display area. For example, you might want to make the display area smaller
so you can see parts of two displays in order to drag and drop objects between them.
Changing the display area in this manner does not change the display size for Replace
displays. For On Top displays that are sized with the “Use Current Size” option, dragging
the border does resize the display.
Another way to arrange multiple displays while working on them is to use the options on
the Windows menu. For example, Tile Horizontal arranges all the open displays with as
much of the top part of each display showing as possible.
Creating a background for your display
You can create a background for your graphic display by converting graphic objects to
wallpaper. When objects are converted to wallpaper, they are locked into position and
become an unchanging background for the other objects in the display.
Converting objects that do not need to be animated or updated with tag values can
significantly improve the runtime performance of a graphic display.
Objects that have been converted to wallpaper cannot be selected or edited until you
unlock the wallpaper. Also, animations attached to the wallpaper objects are not in effect.
However, animations are restored when you unlock the wallpaper.
Similarly, any tags or expressions assigned to an object become inactive when the object
is converted to wallpaper. Connections are restored if you unlock the wallpaper.
To manage a number of objects easily, group the objects, and then convert the group to
wallpaper.
14-13
• • • • •
14 • Using graphic displays
• • • • •
RSVIEW MACHINE EDITION USER’S GUIDE
To convert objects to wallpaper
1. Select the objects to convert.
For information about selecting objects, see page 15-25.
2. On the Edit menu, select Wallpaper, and then click Convert to Wallpaper.
For a single object, you can right-click it and then click Convert to Wallpaper.
To unlock the wallpaper
1. On the Edit menu, select Wallpaper, and then click Unlock All Wallpaper.
All objects in the graphic display are converted back to their original state.
Using global object displays
RSView global objects allow you to link the appearance and behavior of a graphic object
to multiple copies of that object. When the original object is updated, the changes are
automatically applied to all the copies of the object.
Global objects are created in global object displays, in the Global Objects folder of the
Explorer window. The objects you create in a global object display are called base objects.
You can copy or drag base objects into standard graphic displays. The copied object is
called a reference object. You can copy a global object into any number of graphic
displays, and multiple times into the same graphic display. For more information about
creating reference objects, see page 15-24.
Global object displays have the file extension .ggfx. They are stored in this default
location.
\Documents and Settings\All Users\Documents\RSView Enterprise\ME\HMI
projects\Application Name\Global Objects (Windows® 2000)
or
\Documents and Settings\All Users\Shared Documents\RSView Enterprise\ME\HMI
projects\Application Name\Global Objects (Windows XP)
where Application Name is the name of your application.
Creating global object displays
You can create a global object display in the Global Objects folder, or create a graphic
display in the Displays folder and then add the display to the Global Objects folder. You
can also add library displays to the Global Objects folder.
14-14
To create a global object display
1. In the Graphics folder, right-click Global Objects, and then click New.
2. Create the objects you want to put in the display. These are called base objects.
You can not use ActiveX objects as base objects. You cannot convert objects to
wallpaper in the global object display.
For information about creating graphic objects, see Chapter 15.
3. On the File menu click Save, or click the Save tool.
Save tool
4. In the Component name box, type a name for the display, and then click OK.
The display is added to the list in the Global Objects folder.
To add a display or library to the Global Objects folder
1. In the Explorer window, in the Graphics folder, right-click the Global Objects icon.
2. Click Add Component Into Application.
3. Browse to and select the display or library to add, and then click Open.
The display is copied into the Global Objects folder, and given the file
extension .ggfx.
Any ActiveX objects are deleted. All other objects are converted to base objects.
If you delete, remove, or rename a global object display, you break the links between the base
objects in the display and their reference objects. For more information about breaking links, see
Help.
Using graphic libraries
RSView Studio comes with a set of libraries, contained in the Libraries folder. As with a
public library, the graphics libraries can provide you with source materials and reference
information.
Each graphic library consists of a graphic display, with the file extension .gfx. The library
displays contain graphic objects that you might find useful in your own application. Many
of the objects are preconfigured with animation. For example, see the Conveyor parts
library.
You can:
look at the objects and displays to get ideas for your own application.
drag and drop (or copy and paste) objects from the libraries into your own displays.
14-15
• • • • •
14 • Using graphic displays
• • • • •
RSVIEW MACHINE EDITION USER’S GUIDE
For information about copying objects from a library into your graphic display, see
page 15-44.
use the objects as they are or change them to suit your needs.
create your own libraries of objects.
create libraries of displays that are translated into multiple languages.
use libraries as displays in your application.
To open a graphic library
1. In the Explorer window, open the Graphics folder, and then open the Libraries folder.
2. Double-click the library name, or right-click it and then click Open.
Creating graphic libraries
You can create a graphic library in the Libraries folder, or create a graphic display in the
Displays folder and then add the display to the Libraries folder.
To create a graphic library
1. In the Graphics folder, right-click Libraries and then click New.
2. Create the objects you want to put in the library.
For information about creating graphic objects, see Chapter 15.
3. On the File menu click Save, or click the Save tool.
Save tool
4. In the Component name box, type a name for the library, and then click OK.
The library is added to the list in the Libraries folder.
You can also create a graphic display and then use Add Component Into Application to
add the display to the Libraries folder.
To add a graphic display to the library
1. Create the graphic display.
2. In the Explorer window, in the Graphics folder, right-click the Libraries icon.
3. Click Add Component Into Application.
4. In the dialog box, navigate to the Gfx folder, and then click the .gfx file for the display
to use.
The Gfx folder is located in:
14-16
\Documents and Settings\All Users\Documents\RSView Enterprise\ME\HMI
projects\Application Name (Windows 2000)
or
\Documents and Settings\All Users\Shared Documents\RSView Enterprise\ME\HMI
projects\Application Name (Windows XP)
where Application Name is the name of your application.
5. Click Open. The display is copied into the Libraries folder.
Using libraries as displays in your application
The graphic libraries are available on the development computer, but do not appear at
runtime. To use a library as a graphic display at runtime, you must add the library into
your application’s folder of graphic displays.
If the library doesn’t contain strings for languages supported by the current application,
the undefined strings are displayed with question marks (?).
To use a library as a display in your application
1. In the Explorer window, in the Graphics folder, right-click the Displays icon.
2. Click Add Component Into Application.
3. In the dialog box, navigate to the Libraries folder, and then click the .gfx file for the
library to use.
The Libraries folder is located in:
\Documents and Settings\All Users\Documents\RSView Enterprise\ME (Windows
2000)
or
\Documents and Settings\All Users\Shared Documents\RSView Enterprise\ME
(Windows XP)
4. Click Open. The library is copied into the Displays folder.
Using libraries to store displays with multiple languages
The maximum number of languages an application can use is 20. Since the libraries are
stored outside of the HMI project folder and are available to all applications, they do not
have this limit. However, since they are not stored in the HMI project folder, you cannot
export the strings in library displays for translation. Instead, export a graphic display for
translation, import the translated strings, then add the display into the library.
14-17
• • • • •
14 • Using graphic displays
• • • • •
RSVIEW MACHINE EDITION USER’S GUIDE
When you use a library display in your application, make sure you add to your application
the languages that you plan to use from the library.
To save a library display with multiple languages
1. Create a graphic display.
2. Export the text for your application, which will include the text used in the graphic
display.
3. Translate the text strings into each desired language, saving the file with a new name
for each language.
4. Import the files for all the new languages.
5. Add the graphic display to the Libraries folder.
The library is created with the option Support Multiple Languages selected (in the
Display Settings dialog box).
For detailed information about importing and exporting to use multiple languages, see
Chapter 23.
14-18
To save a library display with more than 20 languages
1. Create a display in one application, with up to 20 languages, and add it to the library,
as described in the previous section.
2. Add the display into a new application, with up to 20 different languages in the new
application.
3. Export the text for your application, which will include the text used in the graphic
display.
4. Translate the text strings into each desired language, saving the file with a new name
for each language.
5. Import the files for the new languages.
6. Add the graphic display (with the same name as the display in step 1) to the Libraries
folder.
The new languages are added to the library. Make sure the display contains the same
objects as the original display. Otherwise the new display will overwrite the previous
display, and all the original language strings will be undefined.
What is displayed
When you open a library that supports multiple languages, the strings are displayed using
the current application language, if available. If the library does not contain the current
language, the strings are displayed as single question marks. Similarly, if the library
contains the language but not all the strings are defined for the language, undefined strings
are displayed as single question marks.
For more information about using multiple languages with graphic libraries, see
Chapter 23.
Location of library components
The Libraries folder is located in:
\Documents and Settings\All Users\Documents\RSView Enterprise\ME (Windows
2000)
or
\Documents and Settings\All Users\Shared Documents\RSView Enterprise\ME
(Windows XP)
If desired, you can specify a different directory in which to store library components. If
you specify a different directory, RSView saves graphic libraries that you add or create in
the new directory. Similarly, when you open a library component RSView looks for the
component in the specified directory.
14-19
• • • • •
14 • Using graphic displays
• • • • •
RSVIEW MACHINE EDITION USER’S GUIDE
If you specify a different directory but want to use the libraries that come with RSView,
use My Computer or Windows Explorer to copy the library component files into the
directory you’ve specified, or else change the path back to the default path when you want
to open an RSView library component.
To specify a new path for graphic libraries
1. On the Tools menu, click Options.
For details about using the Options dialog box, see Help.
Importing images into your application
You can use these types of external graphic files in your graphic displays:
.bmp—bitmap images
.jpg—JPEG images
.dxf—AutoCAD® files
.wmf—Windows metafiles
You import and place .dxf and .wmf files in your displays in one step. Once imported,
they are converted to drawing objects. For more information about using these types of
files in your displays, see page 15-21.
14-20
Bitmap images that come with RSView Studio
RSView Studio comes with sets of bitmaps that are useful for illustrating graphic objects
and displays:
arrows
DIN symbols
ISA symbols
keyboard button symbols such as Enter and Page Up
parts such as buttons, conveyors, pipes, tanks, and valves
The symbols and most of the arrows are monochrome (that is, use only two colors, one for
the foreground and one for the background).
You can set up the foreground and background colors for the monochrome images that
you use for your objects.
For color images, including JPEG images, you can specify whether to use a transparent or
solid background. If you select the transparent background style, the black portions of the
image become transparent.
For detailed information about setting up objects, see Help.
Location of bitmap files
The bitmap files that come with RSView Studio are stored in this directory:
\Documents and Settings\All Users\Documents\RSView Enterprise\Images (Windows
2000)
or
\Documents and Settings\All Users\Shared Documents\RSView Enterprise\Images
(Windows XP)
The images are in folders called Arrows, DIN, ISA, ListKey, and Parts.
Importing bitmap and JPEG images
To use bitmap and JPEG images, you can:
import the images first, and then place them in your displays as needed. This method
is useful for images that you use to illustrate your displays.
For information about placing images in your display once you’ve imported them, see
page 15-16.
14-21
• • • • •
14 • Using graphic displays
• • • • •
RSVIEW MACHINE EDITION USER’S GUIDE
use the Image Browser to import images as needed while setting up your graphic
objects. This method is useful for images that you use as labels on your graphic
objects.
For information about using the Image Browser, see page 14-23.
copy and paste images from the graphic libraries.
For information about copying and pasting objects, see page 15-44.
copy and paste images from one application to another.
For information about opening two applications at once, see page 4-9.
If you will be using images that have more than 256 colors, before importing the images
set up your video adapter to display more than 256 colors. This will ensure that the colors
of imported images appear the same as in the original. For more tips about using images,
see page 14-24.
To import bitmap and JPEG images
1. In the Graphics folder, right-click Images and then click Add Component Into
Application.
To view the images, click
this button, and then click
Thumbnails.
2. In the Files of type box, select the type of image to add.
3. Navigate to the directory where the .bmp or .jpg file is stored, and then click the file
name.
Shift-click or Ctrl-click to select additional files.
14-22
4. Click Open to add the selected files to the list in the Images folder.
To view an image that you’ve already imported
1. In the Images folder, double-click the image name, or right-click it and then click
Open.
Using the Image Browser to import images
Use the Image Browser to import images as needed while you set up graphic objects.
In the Image Browser you can:
import images into the application.
select the image to use on a graphic object.
delete images from the application.
To open the Image Browser, use one of these methods
In an object’s Properties dialog box, click the Browse button next to the Image box.
Depending on the type of object, the Image box could be located on the General tab,
Label tab, or States tab.
Browse button
For information about opening the Properties dialog box, see page 15-30.
With one or more objects selected, in the Property Panel click the Image property, and
then click the Browse button.
For information about opening the Property Panel, see page 15-31.
14-23
• • • • •
14 • Using graphic displays
• • • • •
RSVIEW MACHINE EDITION USER’S GUIDE
Click an
image to
select it.
For details about using the Image Browser to import, select, and delete images, see Help.
You can also remove an image by clicking it in the Images folder and then right-clicking
Remove or Delete. For more information, see page 2-16.
Tips for using images
Using bitmaps versus JPEG images
When deciding whether to use a bitmap image or a JPEG image, consider these points:
RSView supports 256 color (grayscale) and 16 million color JPEG images only. For
all other color types, use bitmaps.
For large color images (16 million color, 320 x 240 pixels or larger), JPEG images
load faster than bitmaps. In all other cases, bitmaps load faster than JPEGs.
Color JPEG images have a much smaller file size than the equivalent bitmap image,
and therefore require less disk space at runtime.
Guidelines for using images
Images consume Windows resources, so when using graphic images use the lowest color
depth possible.
14-24
The more colors you use, the more memory is consumed, and the longer the image takes
to load and display.
This bitmap type
Consumes this many bits per pixel
Monochrome
1
16 color
4
256 color
8 (1 byte)
64 K color
16 (2 bytes)
16 million color
24 (3 bytes)
For example, a 24-bit bitmap image that measures 800x600 pixels consumes 1440 KB of
memory. If the bitmap color depth is decreased to 256 colors, the image might have minor
color loss, but the new image uses only 480 KB of memory.
Use images with a similar pixel size to the size of the RSView object on which the image
will be placed. RSView resizes the image to fit the object, but if you use an image that is
much larger than the object, the display will be slow to open at runtime, due to the time
required to resize the image.
Using parameter files
To use the same graphic display with different sets of tags, use parameter files and tag
placeholders. Using tag placeholders can be quicker than duplicating a display and setting
up the objects in it to use a different set of tags, especially when the display uses a lot of
tags. Using parameter files also reduces the size of the runtime application file.
The parameter file specifies which tags to substitute for the placeholders in the display, by
assigning one tag to each unique placeholder in the display. Create a parameter file for
each set of tags that you want to use with the same graphic display.
At runtime, the tag values that are displayed depend on which parameter file is used when
the display opens. When you open the display, the tags specified in the parameter file
replace the tag placeholders.
Parameters can replace any portion of a tag address. For example, you can use parameters
to replace folder names.
About tag placeholders
A tag placeholder consists of the # symbol and a number between 1 and 500, for example,
#1. You can use a placeholder anywhere that you would normally assign a tag.
14-25
• • • • •
14 • Using graphic displays
• • • • •
RSVIEW MACHINE EDITION USER’S GUIDE
For more information about using tag placeholders, see page 15-41.
Summary of steps
Follow these steps to use parameter files and tag placeholders:
1. In the Parameters editor, create parameter files for each set of tags that the display will
use. In the parameter files, specify which tags to substitute for which placeholders.
2. In the Graphics editor, create graphic objects and assign tag placeholders to the
objects.
For information about creating graphic objects and assigning tag placeholders, see
Chapter 15.
3. In the Graphics editor, create goto display buttons or display list selectors for opening
the display containing tag placeholders. Specify the appropriate parameter files in the
Goto Display Button Properties dialog box or Display List Selector Properties dialog
box.
For information about setting up goto display buttons, see page 16-36. For
information about setting up display list selectors, see page 16-38.
4. If the startup display uses tag placeholders, in the Startup editor specify the parameter
file to use with the startup display.
For information about the Startup editor, see Chapter 25.
Using the Parameters editor
Use the Parameters editor to create one or more files of tag placeholder replacements.
Each file is stored in the editor’s folder. You can open and work on multiple parameter
files at the same time.
14-26
For details about using the Parameters editor, see Help. To open the Help, press F1 on
your keyboard.
Assigning parameter files to graphic displays
You can use parameter files with:
the graphic display that opens when the application is first run. Specify the graphic
display to open, and the parameter file to use with it, in the Startup editor.
graphic displays that are opened using goto display buttons. Specify the graphic
display to open, and the parameter file to use with it, when you set up the button.
graphic displays that are opened using display list selectors. Specify the graphic
displays to open, and the parameter files to use with them, when you set up the display
list selector.
Example: Using a parameter file to replace tag placeholders
This example shows how to use a graphic display called Canning Overview with two sets
of tags, one for canning corn, and one for canning peas.
The Canning Overview display is opened from a graphic display called Main Menu.
1. Create these sets of tags. You can use both HMI and data server tags.
Tag type
Tag name
Tag name
String
Corn_Name
Pea_Name
Analog
Corn_Temp
Pea_Temp
Analog
Corn_Weight
Pea_Weight
Analog
Corn_Level
Pea_Level
2. Create two parameter files, called Corn and Peas, containing these parameters:
Corn
Peas
#1=Corn_Name
#1=Pea_Name
#2=Corn_Temp
#2=Pea_Temp
#3=Corn_Weight
#3=Pea_Weight
#4=Corn_Level
#4=Pea_Level
14-27
• • • • •
14 • Using graphic displays
• • • • •
RSVIEW MACHINE EDITION USER’S GUIDE
3. In the Canning Overview display, assign tag placeholders to the Value connections for
these graphic objects:
This graphic object
Uses this tag placeholder
String display
#1
Numeric display 1
#2
Numeric display 2
#3
Bar graph
#4
4. Use descriptive text to illustrate the objects in the display.
5. In the Main Menu display, create a display list selector for opening the Canning
display, with two states.
6. Assign the Corn parameter file to one state, and the Peas parameter file to the other.
7. Call the captions for the states Corn and Peas, respectively.
At runtime, when the operator selects the Peas state on the display list selector in the Main
Menu, and presses the Enter key, the Canning Overview display opens and shows the
values of the Pea_ tags. When the operator selects the Corn state, the values of the Corn_
tags are displayed.
14-28
The Canning Overview display looks like this when the operator selects the Peas state:
Using local messages
Use local messages to give the operator ongoing information about the status of devices
and processes. For example, you might use local messages to describe the status of a
device whose condition cannot be shown graphically with complete accuracy.
The messages you create in the Local Messages editor are displayed in local message
display objects in graphic displays. You can use multiple local message display objects in
your application, and link each object to a different file of messages. Or, you can use the
same file of messages for multiple local message display objects.
Local messages versus information messages
Use local messages to give the operator information in a specific graphic display while the
display is open. To give the operator information no matter which display is open, use
information messages.
For details about information messages, see Chapter 12.
Summary of steps
Follow these steps to set up local messages:
1. In the Local Messages editor, set up the messages and their trigger values.
14-29
• • • • •
14 • Using graphic displays
• • • • •
RSVIEW MACHINE EDITION USER’S GUIDE
2. In the Graphics editor, create local message display objects in the graphic displays in
which you want the messages to appear at runtime. For each local message display,
assign a tag or expression to the Value connection and specify the file of messages to
display.
For information about creating graphic objects, see Chapter 15. For information about
setting up local message display objects, see page 16-54.
Using the Local Messages editor
Use the Local Messages editor to create one or more files of local messages. Each file is
stored in the editor’s folder. You can open and work on multiple message files at the same
time.
You can define up to 10,000 messages in each message file.
For details about using the Local Messages editor, see Help.
Preparing to set up local messages
As your application is running, information is continually sent to the data source about the
state of various processes. For example, your application might be monitoring whether a
valve is open or closed, or the temperature in a boiler. Values representing the status of
these processes are sent to the data source.
The data source
The RSView documentation uses the term data source as a generic term that includes all
possible sources of tag data, for both data server tags and HMI tags. The data source can
be memory or a device such as a programmable controller or OPC server. RSView writes
values to and reads values from the data source. The data source is set up to exchange
information (in the form of numeric or string values) between RSView and the machine
that your application is controlling.
Identifying the tags and values to monitor
To set up local messages, determine which tags associated with machine processes to
monitor, and identify the values for those tags that will trigger local messages.
14-30
For information about creating HMI tags, see Chapter 7.
How local messages work
These are the key parts of the local message system:
Local message files—text files containing lists of messages, with a numeric trigger
value for each message
Local message display object—a graphic object that displays local messages when the
Value connection assigned to the object matches a message’s trigger value
Value connection—a tag or expression. When the value of this connection matches a
message’s trigger value, the local message display object displays the associated
message.
The local message display object always appears in the graphic display it’s placed in,
whether or not there is a message to display. However, the operator does not see the
message unless the object is located in the display the operator is currently viewing.
The following example shows how the key parts of the local message system work
together.
Example: Displaying local messages
This example shows how to notify the operator of the status of a hoist.
1. Create a tag called Hoist_Status. This tag points to an address in a programmable
controller that is linked to sensors on the hoist. The tag has five possible values:
The tag has this value
When the hoist has this status
1
At bottom
2
Raising
3
Stopped between the top and bottom
4
Lowering
5
At top
14-31
• • • • •
14 • Using graphic displays
• • • • •
RSVIEW MACHINE EDITION USER’S GUIDE
2. In the Local Messages editor, create these messages with trigger values matching the
values that will be sent to the Hoist_Status tag:
Trigger value
Message
1
The hoist is ready to rise
2
The hoist is raising the pallet.
3
The hoist has stopped.
4
The hoist is lowering the pallet.
5
The hoist is finished rising.
Save the message file with the name “Hoist status.”
3. In the Graphics editor, create a local message display object. In the object’s Properties
dialog box, assign the Hoist_Status tag to the Value connection, and select the Hoist
status message file.
At runtime, when the operator views the graphic display containing the local message
display object, the status of the hoist is displayed.
Local messages and trigger values
Create messages associated with each tag value that you want to inform the operator
about. Assign each message a trigger value, and set up the data source to send the trigger
value to the Value connection. You can use both HMI and data server tags
The trigger value can be any non-zero integer value (positive or negative). Trigger values
do not need to be contiguous, but they must be unique for each message. For example, you
could use trigger values of 1, 2, and 3, or values of 10, 20, and 30.
If you use an analog tag or an expression, you can use any non-zero integer or floating
point value to trigger an alarm. Floating point values are rounded to the nearest integer.
For information about how values are rounded, see page 7-2.
Trigger values cannot be 0. Digital tags have two possible values, 0 and 1. Therefore, if
you use a digital tag you can only use the value 1 to trigger a message. If you want to use
a digital tag to trigger two different messages, create an expression that adds 1 to the
digital tag’s value. That way, you can use the trigger values 1 and 2.
When the Value connection’s value is 0, the local message display object is cleared.
14-32
Creating local messages in multiple languages
RSView supports local messages in multiple languages. Use the CurrentLanguage( )
expression function to specify message offsets in the local message file. In the file, divide
your messages into sections for each language. For information about the
CurrentLanguage( ) function, see page 20-14. Also see the following example.
You can export the text strings in your local message files for translation. Then paste the
translated strings into the original file. RSView does not support direct importing of the
translated message text. For information about exporting text for translation, see
Chapter 23.
Example: Setting up local messages in multiple languages
This example shows how to generate English, French, or German local messages at
runtime, depending on which language the application is using.
1. Create a local message file, with English messages for trigger values 1 to 10.
2. Create French messages for trigger values 11 to 20.
3. Create German messages for trigger values 21 to 30.
4. Assign the local message file to a local message display graphic object.
5. Assign this expression to the Value connection for the local message display graphic
object:
If CurrentLanguage( )=”en-US” then Local_messages
Else If CurrentLanguage( )=”fr-FR” then Local_messages + 10
Else Local_messages + 20
How the local message display graphic object works
When you open a graphic display at runtime, RSView reads the value of the Value
connection and updates the local message display object based on the value.
What is displayed
If the Value connection is unassigned, the display is filled with question marks (?).
The Value connection is rounded to the nearest integer. If the value does not match any
of the trigger values in the specified message file, the display is filled with question
marks.
For information about how values are rounded, see page 7-2.
14-33
• • • • •
14 • Using graphic displays
• • • • •
RSVIEW MACHINE EDITION USER’S GUIDE
If the message is too long to fit in the object, the last displayed character is replaced
with an asterisk (*).
When the Value connection’s value is 0, the display is cleared.
Printing displays
You can print your graphic displays on the development computer. This might be useful if
you want other people to review the displays before implementing the application, or if
you want to keep a visual record of the displays.
You can also print graphic displays at runtime, to provide a printed record of process
values such as trend data.
For information about printing on the development computer, see page 2-17.
Printing displays at runtime
When you print a display at runtime, everything on the screen is printed, including the
current display, pop-up windows, and any visible background applications.
For information about specifying which printer to use at runtime for Windows 2000 or
Windows XP applications, see page 26-10.
For information about specifying printer options for applications that will run on a
PanelView Plus terminal, see the PanelView Plus Terminals User Manual.
For information about specifying printer options for applications that will run on a
VersaView® CE terminal, see the VersaView CE Terminals User Manual.
To print graphic displays at runtime, use one or both of these
methods
Create display print buttons in the graphic displays you want to print. At runtime, the
operator presses the buttons to print the displays.
For information about creating graphic objects, see Chapter 15.
Assign a tag or expression to the Remote Display Print connection (in the Global
Connections editor). When the value of the tag or expression changes from 0 to a nonzero value, the current displays are automatically printed.
Program the data source to trigger the change as often as you want the data printed.
For more information about setting up remote display printing, see page 8-2.
14-34
15 Using graphic objects
This chapter describes the types of graphic objects and outlines how to:
create graphic objects, including drawing and ActiveX® objects.
create reference objects
select and deselect objects and use the Object Explorer.
use the Properties dialog box and Property Panel to set up objects.
color and name objects.
test how objects look in different states.
assign tags and expressions to objects.
replace tags using tag substitution.
use tag placeholders.
move, copy, duplicate, resize, reshape, and delete objects.
group and ungroup objects, and edit group objects.
arrange objects and lock objects into position.
For information about setting up graphic objects once you’ve created them, see
Chapter 16.
For examples of how to set up objects, see the sample applications that come with
RSView® Studio™. The Help also provides examples of how to use objects.
Types of graphic objects
The elements that make up a graphic display are called graphic objects. Use objects to
control your process, machines, and application.
RSView comes with a complete range of configurable objects such as push buttons, list
selectors, bar graphs, and trends. Some objects interact with the data source, allowing the
operator to change or view tag values. For example, the operator can push a button to set a
tag value to 1, causing a programmable controller to start a conveyor belt. Other objects
are used to control your application. For example, there are button objects that you can
use to change displays and scroll through lists.
RSView also comes with drawing objects that you can use to illustrate your graphic
displays. The drawing objects include text, bitmap images, and geometric and freehand
shapes.
15-1
• • • • •
RSVIEW MACHINE EDITION USER’S GUIDE
RSView also supports the use of ActiveX objects—third-party software components that
you can use to control processes and display information. The ActiveX objects available
depend on which third-party applications are installed on your development computer. For
example, products such as Microsoft® Visual Basic®, Rockwell Software® RSTools®, and
Microsoft Office provide ActiveX objects that are configurable in RSView Studio.
Using the tables
The tables beginning on the next page will help you choose which objects to use to control
your application, machines, and process. The tables group the objects according to
function, provide an overview of what each object does, and list cross-references to more
detailed information about using the objects.
About connections
Many of the objects use connections to interact with the data source. A connection is the
link between the object and the data source. Depending on an object’s function, the object
may have more than one connection. For example, a momentary push button has a Value
connection and an Indicator connection. The Value connection is used to set a value at the
data source, and the Indicator connection is used to display the data source value in your
graphic display.
By assigning tags or expressions to an object’s connections, you control the flow of data
between the application and the data source, which in turn controls your process or
machines. Assign tags or expressions to an object’s connections in the Connections tab of
the object’s Properties dialog box (see page 15-28) or in the Connections tab of the
Property Panel (see page 15-31).
15-2
Illustrating your displays
Use this graphic object
To do this
Text
Create text for labels or instructions in the display. See page 15-14.
Image
Place images in your display. For more information, see page 15-15.
Panel
Draw rectangles that have borders. See page 15-17.
Arc
Draw an arc (a segment of an ellipse or circle’s perimeter). See page 15-17.
Ellipse
Draw ellipses and circles. See page 15-18.
Freehand
Draw freehand shapes as you would with a pen on paper. See page 15-18.
Line
Draw straight diagonal, horizontal, and vertical lines. See page 15-19.
Polygon
Draw a series of connected straight lines forming a closed shape. See page 15-19.
Polyline
Draw a series of connected straight lines. See page 15-19.
Rectangle
Draw rectangles and squares. See page 15-20.
Rounded rectangle
Draw rectangles and squares with rounded corners. See page 15-21.
Wedge
Draw a filled segment of an ellipse or circle. See page 15-17.
Controlling the application
Use this graphic object
To do this
Goto display button
Open a graphic display. For details, see page 24-4.
Return to display button
Close a display and return to the previous display. For details, see page 24-5.
Close display button
Close a display. Can also send a value to a tag. For details, see page 24-6.
Display list selector
Select a display to open from a list of displays. For details, see page 24-6.
Display print button
Print the current display. For details, see page 14-34.
Language switch button
Switch the application language. For details, see .
Login button
Open the Login dialog box and then log in. For details, see page 13-13.
Logout button
Log out of the application. For details, see page 13-14.
Password button
Change the current user’s password. For details, see page 28-4.
Shutdown button
Stop the application and shut down RSView ME Station™. For details, see page 24-7.
Goto configure mode button Stop the application and open the RSView ME Station dialog box. For details, see page 24-4.
15-3
• • • • •
15 • Using graphic objects
• • • • •
RSVIEW MACHINE EDITION USER’S GUIDE
Use this graphic object
To do this
Print alarm history button
Print a report of alarm messages in the alarm log file. You can print a report for all alarms, or
for a specified alarm trigger. For details, see page 16-57.
Print alarm status button
Print a report of the status of alarms, including how many times each alarm was triggered and
the time in alarm. You can print a report for all alarms, or for a specified alarm trigger. For
details, see page 16-57.
15-4
Starting and controlling processes
Use this graphic object
To do this
Momentary push button
Start a process or action by sending one value to the tag when pressed, and another value when
released. For details, see page 16-21.
Maintained push button
Toggle between two values by sending one value to the tag when pressed, and a second value
the next time the button is pressed and released. This button is useful for changing a setting
within a machine or process, but not for starting the machine or process. For details, see
page 16-22.
Latched push button
Start a machine or process. The button remains set (latched) until the process is complete. For
example, use this button to start a bag filling machine. When the process is complete (the bag
is full), the button is reset (unlatched) by the Handshake connection. For details, see
page 16-24.
Multistate push button
Cycle through a series of values. Each time the operator presses the button, the value for the
next state is sent to the tag. When the button is in its last state, pressing it changes the button to
its first state and writes out the first state value.
This button is useful when you want the operator to see and select multiple options in
sequence, using a single button. The button displays the current state of an operation by
showing a different color, caption, or image to reflect the different states. For details, see
page 16-25.
Interlocked push button
Use a group of buttons to send values to the same tag. When the operator presses one button in
the group, the button’s value is sent to the tag, and the button remains highlighted as long as
the tag value is the same as the button’s value. Pressing another button in the group releases
the first button, and sends a new value to the tag. For details, see page 16-27.
You can also use a single interlocked push button to send a value to a tag.
Ramp button
Increase or decrease the value of a tag by a specified integer or floating-point value. For
example, use two ramp buttons together to create a raise/lower control. For details, see
page 16-28.
Control list selector
Select from a list of states for a process or operation. The list is highlighted to show the current
state, and the operator can scroll through the list to select a different state. The value assigned
to the selected state is written to the tag. For details, see page 16-48.
Piloted control list selector
Select from a list of states for a process or operation. The list is highlighted to show the current
state, and the operator or a remote device such as a programmable controller can scroll
through the list to select a different state. For details, see page 16-51.
15-5
• • • • •
15 • Using graphic objects
• • • • •
RSVIEW MACHINE EDITION USER’S GUIDE
Use this graphic object
To do this
Drawing object with
horizontal or vertical slider
animation
Set the value of a tag by dragging the slider object. The pixel position of the slider is translated
into a value that is written to the tag. If the value of the tag is changed at the data source, the
position of the slider changes to reflect this. For information about animation, see Chapter 17.
ActiveX object
Change tag values using a third-party object connected to an analog, digital, or string tag,
including both HMI and data server tags. When the object’s property value changes, the new
value is written to the associated tag. For details, see page 15-22.
Displaying processes and values graphically
Use this graphic object
To display this
Bar graph
Numeric values in bar graph format. The bar graph increases or decreases in size to show the
changing value. For details, see page 16-46.
Gauge
Numeric values in dial format. The gauge’s needle moves around the dial to show the
changing value. For details, see page 16-47.
Scale
A static indication of the range of values for a bar graph. For details, see page 16-48.
Multistate indicator
The state of a process, on a panel that changes its color, image, or caption to indicate the
current state. Each state is set up to correspond to a numeric tag value. For details, see
page 16-40.
Symbol
The state of a process, using a monochrome image that changes color to indicate the current
state. Each state corresponds to a numeric tag value.
This object is useful for showing the state of a process or operation at a glance. For details, see
page 16-41.
List indicator
The state of a process, using a list of possible states with the current state highlighted. Each
state is represented by a caption in the list, and corresponds to a numeric tag value.
This indicator is useful if you want to view the current state, but also want to see the other
possible states. For sequential processes, the list can alert the operator about what happens
next in the process. For details, see page 16-43.
Trend
Historical or current numeric tag values, plotted against time or displayed in an XY plot
(where one or more tags’ values are plotted against another tag’s values to show the
relationship between them). For details, see Chapter 18.
Time and date display
Display the current time and date. For details, see page 16-56.
15-6
Use this graphic object
To display this
ActiveX object
Data using a third-party object connected to an analog, digital, or string tag, including both
HMI and data server tags. The format of the data displayed depends on the object. For details,
see page 15-22.
Drawing object with
rotation, width, height, fill,
color, or horizontal or
vertical position animation
The value of a tag using a pictorial representation of the current value in relation to a range of
possible values. For example, use rotation animation to show the tag value as a needle’s
position on a dial.
For color animation, assign different colors to represent different values. For information
about animation, see Chapter 17.
15-7
• • • • •
15 • Using graphic objects
• • • • •
RSVIEW MACHINE EDITION USER’S GUIDE
Working with lists, trends, alarm banners, and numeric input
objects
Use this button
With this graphic object To do this
Pause button
Trend
Toggle a trend between pausing and automatic scrolling.
Next pen button
Trend
Change the vertical axis labels for a trend to the scale for the next pen.
Backspace button
Control list selector
Piloted control list
selector
Move the cursor back to the highlighted item in the list.
End button
Lists and trends
List—move to the bottom item in the list.
Trend—resume trend scrolling and move to the current (latest) data in
the trend.
Enter button
Lists
Alarm list and alarm
banner
Home button
Lists and trends
Select the item the cursor is pointing to.
Acknowledge the currently selected alarm.
List—move to the top item in the list.
Trend—pause the trend and move to the earliest data in the trend.
Move left / right buttons Trend
Pause the trend and scroll to the left or right.
Move up / down buttons Lists, trends, and numeric List—move up or down one item in the list.
input objects
Trend—scroll up or down to display higher or lower values on the
vertical scale.
Numeric input cursor point and numeric input enable button—ramp the
value up or down.
Page up / down buttons Lists
Move up or down one page in the list.
Acknowledge alarm
button
Alarm list
Alarm banner
Acknowledge and silence the selected alarm.
Alarm status mode
button
Alarm status list
Change the type of alarms displayed in the alarm status list, from all
alarms to active alarms to past alarms.
Clear alarm banner
button
Alarm banner
Clear the alarm in the alarm banner without removing the alarm from the
alarm log file and alarm lists.
Diagnostics clear button Diagnostics list
Remove the selected message from all diagnostics lists.
Information
acknowledge button
Acknowledge the current message in the display.
15-8
Information message
display
For more information about using the buttons with lists and trends, see the topics on these
pages:
For information about
See
Linking a button to a specific list, alarm banner, or trend object
Page 10
Using buttons with alarm lists, alarm banners, and alarm status lists
Page 35
Using buttons with information message displays
Page 7
Using buttons with diagnostics lists
Page 12
Using buttons with trends
Page 11
Unlike the buttons in the previous table, the following buttons do not work with specific
graphic objects. You can use them to work directly with alarms in the alarm history and
with the application’s diagnostics messages.
Use this button
To do this
Acknowledge all alarms Acknowledge and silence all currently unacknowledged alarms, or the
button
alarms for a specific alarm trigger.
Clear alarm history
button
Remove alarms from the alarm log file and all alarm lists. You can remove
all alarms, or just the alarms for a specific alarm trigger. You can also reset
the cleared alarms. This resets the number of times an alarm has been
triggered to 0, and the accumulated time in alarm to 0.
Reset alarm status
button
Reset the number of times an alarm has been triggered to 0, and the
accumulated time in alarm to 0, for all alarms.
Silence alarms button
Silence the audio indicator for all current alarms (Windows® 2000 and
Windows XP applications only).
Sort alarms button
Toggle between sorting alarms in alarm lists and the alarm log file by time
and by trigger value.
Diagnostics clear all
button
Remove all diagnostics messages from all diagnostic lists.
15-9
• • • • •
15 • Using graphic objects
• • • • •
RSVIEW MACHINE EDITION USER’S GUIDE
Entering and displaying numeric and string values
Use this graphic object
To do this
Numeric input enable button
Enter a numeric value and then write the value to a tag or an
expression, or ramp a value at the data source. For details, see
page 28-6.
Numeric input cursor point
Enter a numeric value and then write the value to a tag or an
expression, or ramp a value at the data source. For details, see
page 28-6.
String input enable button
Enter a string value and then write the value to a tag. For details,
see page 28-10.
Numeric display
Display numeric tag values. For example, display the current
temperature of an oven. For details, see page 16-29.
String display
Display string tag values. For example, set up the data source to
generate strings that report on the state of a process of operation, or
that provide the operator with instructions about what to do next.
For details, see page 16-34.
RecipePlus button
Display data set and tag values for ingredients in the RecipePlus
table. Write tag values from the selected data set to the data source.
Write tag values from the data source to the selected data set or to a
new data set. Save data set values from the table to a recipe file.
For details, see page 19-3.
RecipePlus selector
Select the recipe and unit to display, download from, or write to.
For details, see page 19-2.
RecipePlus table
Display and compare recipe data set values and tag values. Edit
data set values. For details, see page 19-2.
ActiveX object
Enter or display data using a third-party object connected to an
analog, digital, or string tag, including both HMI and data server
tags. The format of the data entered or displayed depends on the
object. For details, see page 15-22.
Displaying alarms and messages
15-10
Use this graphic object
To display this
Alarm list
Multiple alarm messages, including the time the alarms are
triggered and acknowledged. For details, see page 9-31.
Use this graphic object
To display this
Alarm banner
A single unacknowledged alarm message. For details, see
page 9-33.
Alarm status list
The status of alarms, including how many times an alarm has been
triggered and how long it has been active. For details, see
page 9-34.
Diagnostics list
Messages about system activity such as tag reads, tag writes, and
communications errors. For details, see page 10-11.
Information message display
Messages about the process, prompts or instructions, and
information about current states. For details, see page 12-6.
Local message display
Ongoing information about the status of devices or processes. For
details, see page 14-33.
Selecting tools for creating graphic objects
The Objects menu in the Graphics editor contains items for creating objects, as well as
items for selecting and rotating objects. You can also create most objects using the tools
on the Objects toolbar.
15-11
• • • • •
15 • Using graphic objects
• • • • •
RSVIEW MACHINE EDITION USER’S GUIDE
Objects toolbar
Objects menu
Before you can create an object, you must select the object’s tool, either by clicking a
menu item or by clicking the tool on the toolbar. When you position a cursor over a tool
on the toolbar, the name of the tool is displayed in a tooltip and in the status bar.
To select a tool
1. Click the tool on the toolbar or on the Objects menu. When you click a tool, the
pointer changes to show which tool is active.
Freehand tool
Text tool
To deselect a tool, do one of the following
Select tool
15-12
Double-click an empty area in the display.
Click the Select tool.
Click another tool.
For some drawing objects, double-clicking an empty area of the display creates another
instance of the object. For these objects, to finish drawing, click the Select tool. For more
information, see the instructions for creating drawing objects, beginning on page 15-13.
Before you begin creating objects
To size and position objects precisely as you create them, use the grid.
To use the grid
1. On the View menu, click Show Grid, and then click Snap On.
For information about setting up the grid, see page 14-8.
The next sections describe how to create graphic objects. For information about setting up
graphic objects once you’ve created them, see Chapter 16. For information about
attaching animation to the objects you create, see Chapter 17.
Creating graphic objects
This section applies to graphic objects in general.
ActiveX objects and some drawing objects require extra steps to create them. For details
about creating drawing objects, see the next section. For information about ActiveX
objects, see page 15-22.
To create a graphic object
1. Select the tool for the object to create.
2. Click the mouse where you want to position the object, and then drag to draw a
rectangle the general size you want the object to be.
3. Double-click the object to open its Properties dialog box.
4. In the dialog box, specify how the object looks, its behavior, and connections. For
more information about the Properties dialog box, see page 15-28.
You can also use the Property Panel to set up objects. For information about using the
Property Panel, see page 15-31.
Creating drawing objects
The following instructions for creating drawing objects describe how to create the objects
and then open the objects’ Properties dialog boxes to set up how the objects look. For
information about using the Properties dialog box, see page 15-28.
You can also use the Property Panel to set up objects. For information about using the
Property Panel, see page 15-31.
15-13
• • • • •
15 • Using graphic objects
• • • • •
RSVIEW MACHINE EDITION USER’S GUIDE
Creating text
Choosing fonts
You can select any font you have installed, but TrueType™ and OpenType® fonts are
recommended. These fonts can be resized easily, without losing text quality.
For PanelView Plus™ and VersaView® CE terminals, you must use TrueType fonts.
If you run an application on a computer that does not have the fonts you used when setting
up the application, Windows substitutes with the fonts that most closely match the fonts
you specified.
Choosing fonts for language switching
If you are going to use the application with multiple languages, we recommend using
Microsoft Sans Serif or Tahoma. These fonts allow for font linking to support the
character sets of other languages. PanelView Plus and VersaView CE terminals are
shipped with font linking turned on.
For more information about font linking, see Help. For more information about setting up
languages for your application, see Chapter 23.
Using the Size to fit option
If you use the Size to fit option, the size of the text object will likely change for different
languages. Make sure you check all displays containing translated language strings.
To create a text object
1. Select the Text tool.
Text tool
15-14
2. Click the mouse where you want to position the text, and then drag to draw a
rectangle.
The Text Properties dialog box opens.
3. Select text options.
For information about the options in the dialog box, see Help.
4. To close the dialog box, click OK.
The text is positioned where you drew the rectangle.
5. To create another text object, move to a new area in the display, and then repeat steps
2 through 4.
After you’ve set up one text object to look the way you want, copy and paste it to create
additional text objects with the same formatting. Then edit the text of the new objects.
To edit a text object
1. Double-click the text.
The Text Properties dialog box opens.
2. In the Text box, click where you want to make the change. To delete text characters,
use the Backspace and Delete keys.
Creating images
Use the image graphic object to place bitmap and JPEG images in your graphic displays.
Images support visibility animation only.
15-15
• • • • •
15 • Using graphic objects
• • • • •
RSVIEW MACHINE EDITION USER’S GUIDE
Using bitmaps and JPEG images
Before you can place a bitmap or JPEG image in a display, you must import the image
into your application. For more information, see page 14-21.
To place a bitmap or JPEG image in a display
1. Select the Image tool.
Image tool
2. Click the mouse where you want to position the image, and then drag to draw a
rectangle.
The Image Browser opens.
3. In the Select image list, click the image to place, and then click OK.
For more information about using the Image Browser, see page 14-23.
The image is placed where you drew the rectangle, but the actual size of the image is
used, rather than the size of the rectangle you drew.
4. To change the image’s attributes, double-click the image to open the Image Properties
dialog box.
5. Select image options.
For information about the options in the dialog box, see Help.
6. Click OK to close the dialog box.
15-16
Creating panels
Panels support visibility animation only.
To create a panel
1. Select the Panel tool.
Panel tool
2. Click the mouse where you want to position the panel, and then drag to draw a
rectangle the general size you want the panel to be.
3. To change how the panel looks, double-click the panel to open the Panel Properties
dialog box.
4. Select panel options.
For information about the options in the dialog box, see Help.
5. To close the dialog box, click OK.
Creating arcs and wedges
Arcs and wedges are drawn in two steps: first you create an ellipse or circle, and then you
reshape it into the segment you want.
Arc
Hollow wedge
Filled wedge
To create an arc or wedge
1. Select the Arc or Wedge tool.
Arc tool
2. Click the mouse where you want to position the object, and then drag to draw an
ellipse or circle.
To base the arc or wedge on a circle rather than an ellipse, hold down Ctrl while you
drag.
When you release the mouse button, a set of handles appears so you can decrease the
angle of the wedge or arc from 360 degrees to the desired angle.
15-17
• • • • •
15 • Using graphic objects
• • • • •
RSVIEW MACHINE EDITION USER’S GUIDE
3. Click a handle, and drag the mouse to ‘cut out’ part of the circle.
4. To finish drawing, click the object.
5. To change how the object looks, click Properties on the context menu, or double-click
the object to open its Properties dialog box.
6. Select arc or wedge options.
For information about the options in the dialog box, see Help.
7. To close the dialog box, click OK.
You can also use the Arc and Wedge tools to reshape arcs and wedges. For more
information, see page 15-47.
Creating ellipses and circles
Use the Ellipse tool to draw an ellipse or circle.
To create an ellipse or circle
1. Select the Ellipse tool.
Ellipse tool
2. Click the mouse where you want to position the object, and then drag to draw an
ellipse or circle of the desired size.
To draw a circle, hold down Ctrl while you drag.
3. To change how the object looks, double-click it to open the object’s Properties dialog
box.
4. Select circle or ellipse options.
For information about the options in the dialog box, see Help.
5. To close the dialog box, click OK.
Creating freehand shapes
Using the Freehand tool is similar to drawing with a pen on paper.
To create a freehand shape
1. Select the Freehand tool.
15-18
2. Click and drag to create the shape you want.
Freehand tool
3. To change how the object looks, double-click it to open the Freehand Properties dialog
box.
4. Select freehand options.
For information about the options in the dialog box, see Help.
5. To close the dialog box, click OK.
Creating lines
To create a line
1. Select the Line tool.
Line tool
2. Click where you want the line to start, and then drag from the beginning point to the
end point.
To draw horizontal or vertical lines, hold down Ctrl while you drag the mouse.
3. To change how the line looks, right-click the line and then click Properties on the
context menu. The Line Properties dialog box opens.
4. Select line options.
For information about the options in the dialog box, see Help.
5. To close the dialog box, click OK.
You can use the Polyline tool to convert the line into a polyline. For more information, see
page 15-47.
Creating polygons and polylines
A polyline is a series of connected line segments. A polygon is a multi-sided object (with
three or more sides). For example, use the polygon shape if you want to create triangles.
To create a polygon or polyline
1. Select the Polygon or Polyline tool.
15-19
• • • • •
15 • Using graphic objects
• • • • •
RSVIEW MACHINE EDITION USER’S GUIDE
2. Click and drag to create the first segment of the object. Release the mouse button.
Polygon tool
To draw horizontal or vertical lines, hold down Ctrl while you drag.
Polyline tool
3. Move the mouse to where you want the next segment to end, and then click.
Repeat this step until you have completed the object.
4. To finish drawing, double-click an empty area of the display, or click the Select tool.
5. To change how the object looks, double-click it to open the object’s Properties dialog
box.
6. Select polygon or polyline options.
For information about the options in the dialog box, see Help.
7. To close the dialog box, click OK.
You can use the Polygon tool to reshape lines, polygons, polylines, and rectangles. For
more information, see page 15-47.
Creating rectangles and squares
To create a rectangle or square
1. Select the Rectangle tool.
Rectangle tool
2. Click the mouse where you want to position the object, and then drag until the
rectangle or square is the size you want.
To draw a square, hold down Ctrl while you drag.
3. To change how the object looks, double-click it to open the object’s Properties dialog
box.
4. Select rectangle or square options.
For information about the options in the dialog box, see Help.
15-20
5. To close the dialog box, click OK.
You can use the Polygon tool to reshape the rectangle into a polygon. For more
information, see page 15-47.
Creating rounded rectangles and squares
Due to a Windows limitation, you cannot rotate rounded rectangles and rounded squares.
To create a rounded rectangle or square
1. Select the Rounded Rectangle tool.
Rounded rectangle
tool
2. Click the mouse where you want to position the object, and then drag until the
rectangle or square is the size you want.
To draw a square, hold down Ctrl while you drag.
3. You can change how rounded the corners are by using the handle that appears inside
the rounded rectangle. Click the handle and drag inward to increase roundedness, or
outward to decrease roundedness.
4. To finish drawing, click the object.
5. To change how the object looks, click Properties on the context menu, or double-click
the object to open its Properties dialog box.
6. Select rounded rectangle or square options.
For information about the options in the dialog box, see Help.
7. To close the dialog box, click OK.
For information about using the Rounded Rectangle tool to reshape the rounded rectangle,
see page 15-48.
Using .wmf and .dxf files
Windows metafiles (.wmf) and AutoCAD® (.dxf) files are converted to drawing objects
(such as lines, ellipses, and polygons) when you import them. You can edit the drawing
objects the same way you edit drawing objects that you create in RSView.
Depending on the complexity of the metafile or AutoCAD file, the converted image could
consist of 500 or more drawing objects. This would lead to long display load times. In this
15-21
• • • • •
15 • Using graphic objects
• • • • •
RSVIEW MACHINE EDITION USER’S GUIDE
case, it would be better to covert the .wmf or .dxf file to a bitmap, and then display the
bitmap in an image object.
To place a .wmf or .dxf file in a display
1. On the Objects menu, click Import.
2. Click the mouse where you want to position the file, and then drag to draw a rectangle.
3. In the “Files of type” box, select the type of file to import.
4. Navigate to the directory where the file is stored, and then click the file to import.
5. Click Open.
The file is converted to drawing objects and grouped, and then the grouped object is
placed in the graphic display.
Using ActiveX objects
ActiveX objects use tags or expressions to exchange information with the data source.
The properties and connections available for a particular ActiveX object depend on the
third-party vendor’s implementation.
ActiveX objects support visibility animation only.
If your application will run on a VersaView CE terminal, the ActiveX object must be available for
both the development system (Windows 2000 or Windows XP) and the VersaView CE terminal
platform. Make sure you install and register the Windows CE version of the ActiveX object on the
VersaView CE.
PanelView Plus terminals do not support ActiveX objects.
To create an ActiveX object
1. Select the ActiveX Control tool.
ActiveX Control tool
15-22
2. Click the mouse where you want to position the object, and then drag until the object
is the size you want.
3. In the dialog box that opens, select the object to add to your graphic display.
For information about the options in the dialog box, see Help.
4. Click OK.
The object is placed in the display. Depending on how the third party implemented the
object, it might be a different size than the rectangle you drew.
5. To specify the object’s properties and assign tags or expressions to its connections, do
one of the following:
Right-click the object, and then click Properties to open the object’s Properties
dialog box.
Depending on how the third party implemented the object, it might not have a
Properties dialog box. If the Properties menu item is not available, use the next
method.
Right-click the object, and then click Property Panel.
6. In the Properties dialog box or Properties tab of the Property Panel, specify the
object’s properties.
7. If desired, set up the properties in the Common tab, as described on page 16-1.
8. In the Connections tab, assign tags or expressions to the object’s connections.
9. To close the Properties dialog box, click OK. To close the Property Panel, click the
Close button.
For information about using the Properties dialog box, see page 15-28. For information
about using the Property Panel, see page 15-31.
15-23
• • • • •
15 • Using graphic objects
• • • • •
RSVIEW MACHINE EDITION USER’S GUIDE
Creating reference objects
RSView global objects allow you to link the appearance and behavior of a graphic object
to multiple copies of that object. When the original base object is updated, the changes are
automatically applied to all the copies of the object.
You can copy or drag base objects into standard graphic displays. Each copied object
becomes a reference object. You can also copy, drag, and duplicate reference objects that
you have already created to create more copies of the base object.
Base objects can be group objects. This provides powerful template capabilities. When you add
or remove objects from the group, all the reference objects are automatically updated.
If desired, you can assign unique connections, animation, and size to the reference object.
For information about creating global object displays, see page 14-14.
To create a reference object
1. Copy an object from a global object display to a standard graphic display.
2. To assign unique connections, animation, or size to the object, double-click the object
to open the Property Panel.
For information about using the Property Panel, see page 15-31. For more information
about working with reference objects, see page 16-3.
You can also create reference objects by adding a global object display to the Displays folder. All
the objects in the new display are reference objects.
To add a global object display to the Displays folder
1. In the Explorer window, in the Graphics folder, right-click the Displays icon.
2. Click Add Component Into Application.
3. Browse to and select the global object display to add, and then click Open.
The display is copied into the Displays folder, and given the file extension .gfx. All
the objects are converted to reference objects.
To edit a reference object’s base object
1. Right-click the reference object, and then click Edit Base Object.
2. The global object display containing the base object opens, with the object selected.
3. Make your changes to the base object.
15-24
All reference objects linked to the base object are updated.
To view the changes to the reference object, close the display containing the reference object,
and then reopen it. Or, toggle the object’s LinkSize property on and off.
Tools and tips for working with objects
This section describes features of the Graphics editor that help you work with the objects
you create. It describes how to:
select and deselect objects.
use the Object Explorer to view and select objects.
use an object’s Properties dialog box to set up the object’s properties and assign tags
and expressions to its connections.
use the Property Panel to set up individual and group object properties, and to assign
tags and expressions to individual objects’ connections.
color objects.
name objects.
test how objects look in different states.
Selecting and deselecting objects
To work with an object, you must first select it. You can use the Select tool or the Object
Explorer to select objects.
For information about using the Object Explorer, see page 15-26.
To select the Select tool
Select tool
On the Objects menu, click Select, or on the Objects toolbar click the Select tool.
The mouse pointer changes to a single arrow.
15-25
• • • • •
15 • Using graphic objects
• • • • •
RSVIEW MACHINE EDITION USER’S GUIDE
Selecting objects
To select
Do this
An object or group of objects
Click the object or group.
In the Object Explorer, click the object or group.
An object within a group of
objects
Double-click the group, and then click the object.
Several objects
Click the first object, and then Ctrl-click additional objects.
All objects in an area
Click and drag diagonally to draw a selection border around the
objects.
In the Object Explorer, open the group, and then click the object.
Ctrl-click objects outside the border to add them to the selection.
All objects in the drawing area On the Edit menu, click Select All, or press Ctrl+A.
or in a group you are editing
Deselecting objects
To deselect
Do this
An object
Ctrl-click the object.
Several objects
Press and hold Ctrl, and then drag a selection border around the
objects.
All selected objects
Click in the Drawing area, away from any objects.
Using the Object Explorer
Use the Object Explorer to view and select objects from a tree-list of all the objects in a
display. Groups are listed as expandable items in the tree, with a + icon.
Use the Object Explorer to select an object that is hidden behind other objects in the
display, without bringing the object to the front. Objects are listed in front-to-back order.
The object you created most recently is at the front, unless you move it back using the
Send to Back option. For more information about layering objects, see page 15-51.
You can also use the Object Explorer to highlight objects by object type, highlight objects
that have animation attached, and to highlight objects with specific tag or expression
assignments. For more information, see page 15-27.
15-26
The Object Explorer does not show wallpaper objects, nor objects within ActiveX
composite objects.
To open the Object Explorer, use one of these methods
Show/Hide Object
Explorer tool
On the Graphics toolbar, click the Object Explorer tool.
On the View menu, click Object Explorer.
Right-click an object, and then click Object Explorer.
Right-click an object to open
its context menu.
Click the + icon to view the
objects and groups within a
group.
You can keep the Object Explorer open as you work in the Graphics editor. For more
information about using the Object Explorer, see Help.
Highlighting objects in the Object Explorer
You can use the Object Explorer to highlight:
specific types of objects
objects that have animation attached
15-27
• • • • •
15 • Using graphic objects
• • • • •
RSVIEW MACHINE EDITION USER’S GUIDE
objects that have a specific tag or expression assigned to them
The objects are highlighted in red in the Object Explorer and in the graphic display. If
your graphic display uses a red background, the highlighting is not visible in the graphic
display.
To highlight objects in the Object Explorer
1. In the Object Explorer, click Highlighting on, and then click Settings.
To clear all the check boxes,
right-click the list and then
click Clear All.
To select all the check
boxes, right-click the list and
then click Select All.
For details about the options in the Highlight Settings dialog box, see Help.
Using the Properties dialog box
Every graphic object has a Properties dialog box that you can use to set up the object.
Depending on how the vendor implemented the object, third-party ActiveX objects might
have a Properties dialog box as well.
15-28
The Properties dialog box contains tabs that you can use to set up the object’s properties
and connections:
In this tab
Do this
General
Set up the object’s appearance, audio indicator, and touch margins
(for buttons), and settings that are unique to the object, such as the
button action for a push button, whether to use key navigation to
select the object, or whether to link a button to a specific object.
For information about touch margins, see page 16-6.
For information about key navigation, see page 16-10.
For information about linking buttons to objects, see page 16-10.
States
Set up the states for the object, including the value for each state
and whether to display a caption or image for the state.
For information about checking that the states are set up the way
you intended, see page 15-37.
Label
For objects that don’t have multiple states, specify whether to use a
caption or image on the object.
For information about using the Image Browser to select an image
to use in the label, see page 14-23.
Timing
Set up the object’s auto repeat (see page 16-13) or Enter key
handshaking (see page 16-14) settings.
Common
Set up the object’s spatial properties, name and visibility. For
details, see page 16-1.
Connections
Assign tags and expressions to the object’s connections.
For information about assigning tags and expressions, see
page 15-38.
The tabs that are available depend on the object:
Some objects have only General and Common tabs.
If an object can have more than one state, the object’s Properties dialog box contains a
States tab.
Some objects have unique tabs that are not listed in the table above.
The tabs that an ActiveX object has depends on the vendor’s implementation, though
if you can assign tags or expressions to the object it has a Connections tab.
15-29
• • • • •
15 • Using graphic objects
• • • • •
RSVIEW MACHINE EDITION USER’S GUIDE
To open an object’s Properties dialog box, use one of these
methods
Double-click the object.
Right-click the object, and then click Properties.
Select the object, and then on the Edit menu, click Properties.
Browse button
15-30
In the Property Panel, with the object selected, click the (Custom) property and then
click the Browse button.
In the Property Panel, with the object selected, double-click the (Custom) property.
In the Object Explorer, double-click the object.
Click a tab to
select it.
This button is available once you make changes in the dialog box. Click
it to apply your changes without closing the dialog box. When you click a
different tab, the changes in the current tab are applied automatically.
You can also use the Property Panel to set up an object’s properties, as described next.
For details about setting up a particular object, see Help.
Using the Property Panel
Use the Property Panel to modify the properties of graphic objects and assign tags and
expressions to the objects.
The Property Panel is especially useful for making changes to the properties of multiple
objects at the same time.
15-31
• • • • •
15 • Using graphic objects
• • • • •
RSVIEW MACHINE EDITION USER’S GUIDE
To open the Property Panel, use one of these methods
Show/Hide Property
Panel tool
On the Graphics toolbar, click the Property Panel tool.
On the View menu, click Property Panel.
Right-click an object, and then click Property Panel.
Right-click an empty area of the display, and then click Property Panel.
You can keep the Property Panel open as you work in the Graphics editor. You can drag
the panel’s borders to make the Property Panel larger or smaller.
Setting up properties
Use the Property Panel’s Properties tab to set up the properties of the selected object or
objects.
If only one object is
selected, this box shows
the object’s name and type.
Click to close.
Click for help on the
selected property.
If a group object is selected,
click this button to edit the
properties of the objects
within the group.
Scroll to see more
properties...
...Or drag the splitter bar to
see more properties.
For more information about using the Property Panel to set up an object’s properties, see
Help.
15-32
Assigning tags and expressions to an object’s connections
Use the Property Panel’s Connections tab to assign tags or expressions to the selected
object’s connections. If multiple objects are selected the tab is blank, because you can
assign tags or expressions to only one object at a time.
How values are updated
The arrows indicate the direction in which the data flows between the connection and the
data source:
A right arrow indicates that the connection sends values to the data source. The
connection is a write connection.
A left arrow indicates that the data source sends values to the connection. The
connection is a read connection.
15-33
• • • • •
15 • Using graphic objects
• • • • •
RSVIEW MACHINE EDITION USER’S GUIDE
A double arrow indicates that the data flows in both directions. The connection is a
read-write connection.
Click for help on the
selected connection.
This box describes the selected
connection and indicates the
type of data the connection
uses.
The arrows show the direction in which data flows between the connection and
the data source. If the connection is a read connection (arrow points left), data
flows from the data source to the object. If the connection is a write connection
(arrow points right), data flows from the object to the data source. If the
connection is a read and write connection (double-headed arrow), data flows in
both directions.
For more information about using the Property Panel to assign tags and expressions to an
object’s connections, see Help.
For more information about assigning tags and expressions to objects, see page 15-38.
Coloring objects using the color toolbars
The Foreground Color and Background Color toolbars contain a selection of colors you
can assign to objects’ color properties.
15-34
About color properties
The number of color properties an object has depends on the type of object and how you
set it up. For example, a button with states can use up to seven different colors for each
state. When you select colors using the color toolbars, some properties are assigned the
foreground color and some are assigned the background color. Other color properties,
such as Fill color, cannot be assigned using the color toolbars (instead, use the object’s
Properties dialog box or the Property Panel).
This table lists the color properties you can assign using the color toolbars:
Property
Foreground color
Background color
Back color
No
Yes
Background color
No
Yes
Border color
Yes
No
Caption color
Yes
No
Caption back color
No
Yes
Fore color
Yes
No
Foreground color
Yes
No
Image color
Yes
No
Image back color
No
Yes
Legend color
Yes
No
Needle color
Yes
No
Pattern color
Yes
No
For objects with states, the selected color is applied to the current state’s color properties
only. In the Property Panel, properties that apply to states have “St_” at the beginning of
the property name.
When to select colors using the toolbars
For all the drawing objects except image and panel, you can select colors from the color
toolbars before you draw an object (either before or after you click the object’s tool).
15-35
• • • • •
15 • Using graphic objects
• • • • •
RSVIEW MACHINE EDITION USER’S GUIDE
The other objects are always drawn using their default colors, but you can select the
objects and then click the toolbars to change their colors. The toolbars are especially
useful for quickly assigning the same colors to multiple objects.
To display a color toolbar
1. On the View menu, select Toolbars, and then click Foreground Colors or Background
Colors.
To close a color toolbar
1. On the View menu, select Toolbars, and then click Foreground Colors or Background
Colors, or click the toolbar’s Close button.
Other methods for assigning colors
You can also assign colors using an object’s Properties dialog box or the Property Panel.
Use one of these methods if you want to assign separate colors to different foreground or
background color properties, or to choose colors that don’t appear in the toolbars.
For example, if you want to use a dark blue background color for a button, with a light
blue background color for its image label, you must assign the colors separately. Using the
toolbar would assign the same color to both properties.
Also use the Properties dialog box or Property Panel to change the default colors for
properties that cannot be assigned using the color toolbars.
Naming objects
Objects (and groups of objects) are automatically given a name and number when you
create them, for example NumericInputEnable4. If desired, you can assign a more
meaningful name to the object, for example Conveyor_speed_input. Each object in a
display must have a unique name.
The object name appears in the status bar, Diagnostics List, Property Panel, and Object
Explorer in RSView Studio, and in diagnostics log messages at runtime.
To name an object in the Property Panel
1. Select the object.
2. In the Property Panel, click the Properties tab.
3. Double-click the (Name) row, and then type the name.
The name must start with a letter, and cannot contain spaces. You can use the
underscore character (_).
15-36
To name an object in its Properties dialog box
1. Double-click the object to open its Properties dialog box.
2. Click the Common tab.
3. In the Name box, type the name.
The name must start with a letter, and cannot contain spaces. You can use the underscore
character (_).
To name a group object
1. Select the group object.
2. In the Property Panel, click the Properties tab.
3. Double-click the (GroupName) row, and then type the name.
The name must start with a letter, and cannot contain spaces. You can use the underscore
character (_).
Testing how objects look in different states
To make sure the different states for an object are set up correctly, you can view them
using the States toolbar or the Property Panel.
To open the States toolbar
1. On the View menu, select Toolbars, and then click States.
To view an object’s states using the States toolbar
1. Select one or more objects.
2. In the States toolbar, select the state to view.
If you selected multiple objects, the toolbar shows the states that are common to all the
objects.
3. To view the next state, select it in the toolbar or press the Down Arrow key on your
keyboard.
You can also use these keys to select the next state to view:
To view the previous state, press the Up Arrow key.
To view the first state, press the Home key.
15-37
• • • • •
15 • Using graphic objects
• • • • •
RSVIEW MACHINE EDITION USER’S GUIDE
To see the last state, press the End key.
To view an object’s states using the Property Panel
1. Select one or more objects.
2. In the Property Panel, click the State property and then select the state to view.
3. To view the next state quickly, double-click the row, or press the Enter key on your
keyboard.
Assigning tags and expressions to graphic objects
You can assign tags and expressions to many graphic objects, including ActiveX objects
(depending, of course, on how the vendor implemented the object). This section describes
how to:
assign tags to graphic objects.
use expressions to manipulate tag values.
replace tags using tag substitution.
use tag placeholders so the same display can be used with different sets of tags.
Assigning tags
To assign tags to a graphic object, use one of these methods:
Double-click the object to open the object’s Properties dialog box, and then assign
tags in the Connections tab.
Type the tag name here...
15-38
...or click the button to open the Tag Browser.
Select the object and then assign tags in the Connections tab of the Property Panel.
Type the tag name here...
...or click the button
to open the Tag
Browser.
Select the object, and then on the Edit menu click Connections. Assign tags in the
Connections tab of the Properties dialog box.
Right-click the object, and then click Connections. Assign tags in the Connections tab
of the Properties dialog box.
For information about:
using the Tag Browser, see page 6-6.
using the Properties dialog box, see page 15-28.
using the Property Panel, see page 15-31.
15-39
• • • • •
15 • Using graphic objects
• • • • •
RSVIEW MACHINE EDITION USER’S GUIDE
Using expressions to manipulate tag values
Many of the connections to which you can assign a tag also permit the use of expressions
to perform logical or mathematical calculations on tag values. If you assign an expression,
RSView monitors the expression value rather than the original tag value. For example,
your machine might send values to the data source in the form of temperature in degrees
Celsius. You could use an expression to convert the value to degrees Fahrenheit, and then
monitor the expression result rather than the original tag value.
If you can assign an expression, a Browse button is present in the Exprn column in the
Connections tab.
Type the expression here...
...or click the button to open the Expression editor..
To specify an expression, do one of the following
In the “Tag / Expression” column, type the expression.
In the Exprn column click the Browse button and then create an expression in the
Expression editor. Use this method if you want to check the expression syntax, or to
use multiple lines for the expression.
For more information about expressions, see Chapter 20.
Replacing tags using tag substitution
You can replace tags assigned to the graphic objects in your display by using tag
substitution. You can also replace the tags used in expressions assigned to graphic objects.
For example, if you assign a tag called HoistHeight to multiple objects in the display, and
then decide to use the tag Hoist_height instead, you can use tag substitution to quickly
replace the old tag with the new tag.
You can replace:
15-40
a tag name (with or without folder names).
a folder name.
the text in an expression.
tags contained in embedded variables.
To replace tags
1. Select one or more objects.
To select all the objects in the display, on the Edit menu, click Select All.
2. On the Edit menu, click Tag Substitution.
To replace the tags for a single object, you can right-click it and then click Tag
Substitution.
For details about the options in the Tag Substitution dialog box, see Help.
Using tag placeholders
Tag placeholders provide a way to use one graphic display to represent a number of
similar operations.
For example, suppose you are creating displays for a plant that cans corn and peas. The
machinery used in both processes is identical. Instead of creating two displays and
specifying corn-related tags in one display and pea-related tags in another, you can create
one display and not specify any tag names. Where a tag name is required, type a tag
placeholder.
You can use tag placeholders wherever you would normally assign a tag to an object,
including in expressions and embedded variables. You can also use tag placeholders in the
expressions you create to animate objects.
You can also assign tag placeholders to the connections for base objects, and to
connections for reference objects with the LinkConnections property set to False.
You can use tag placeholders in:
the graphic display that opens when the application is first run.
15-41
• • • • •
15 • Using graphic objects
• • • • •
RSVIEW MACHINE EDITION USER’S GUIDE
graphic displays that are opened using a goto display button.
graphic displays that are opened using a display list selector.
Use parameter files to specify which tags to substitute for which placeholders. For
information about using parameter files, see page 14-25.
Creating tag placeholders
A tag placeholder is the cross-hatch character (#) followed by a number from 1 to 500.
The tag placeholder can replace any part of a tag name, including folder names. For
example, you could create a parameter file specifying that the tag placeholder
#1=Folder1. You could assign the folder and a tag name to a graphic object’s connection:
#1\Tag1.
You can use tag placeholders in:
the Connections tab of an object’s Properties dialog box.
the Connections tab of the Property Panel.
the Expression box in the Animation dialog box.
anywhere that you can insert an embedded variable. For information about embedded
variables, see Chapter 21.
To create a tag placeholder
1. Type the cross-hatch character followed by a number (no space in between). For
example, #1.
Performing basic operations on objects
Once you have drawn an object, you can select the object and work with it. You can:
15-42
move objects.
copy objects.
duplicate objects.
resize objects.
reshape drawing objects.
delete objects.
Moving objects
You can move objects using the mouse or the keyboard. The keys give you fine
positioning, allowing you to move objects in small increments. You can also use the grid
to position objects precisely.
Another option is to position an object using the object’s Top and Left properties in the
Property Panel. For information about using the Property Panel, see page 15-31.
You can also specify an object’s position using the Common tab in the object’s Properties
dialog box. For more information, see page page 16-1.
Once you’ve moved objects into position, you might want to align other objects with
them, or lock them into place. For information about aligning objects, see page 15-52. For
information about locking objects into position, see page 15-58.
To automatically align objects to the grid as you move them
1. On the View menu, select Snap On. A check mark appears beside the menu item when
the option is selected.
For information about setting up the grid, see page 14-8.
To move objects by dragging with the mouse
1. Select one or more objects.
2. Place the pointer on an object (not on the edge or on the handles).
3. Drag the objects to the desired position.
Select the object.
Drag the object to the
desired position.
If you selected several objects, dragging one of the objects moves all the selected
objects. The objects maintain their position relative to each other.
To move objects in small increments using the keyboard
1. Select one or more objects.
2. Place the pointer on the object, not on its edge or handle.
3. Hold down Shift while you press an arrow key.
15-43
• • • • •
15 • Using graphic objects
• • • • •
RSVIEW MACHINE EDITION USER’S GUIDE
To adjust the amount of the increment, first hold down the Shift key and press the + or
- keys on the keyboard’s numeric keypad.
4. Release the Shift key when the object is in place.
Copying objects
To copy objects, you can:
drag and drop objects in the same display.
drag and drop objects between displays, or from a graphic library to a display.
copy and paste objects.
When an object is copied, any animation attached to the object is also copied. If a group is
copied, the new copy of the group can be ungrouped to individual objects, just like the
original.
Copying objects with multiple languages
If an object has multiple language strings set up, copying the object copies all the
languages. If the object is pasted into an application with different languages, only the
strings for languages that are used by the application are pasted. If the new application has
languages that are not set up for the object, those language strings are undefined and will
be displayed with single question marks.
For more information about setting up multiple languages, see Chapter 23.
To copy objects in the same display
1. Select one or more objects.
2. Drag the object, and then press Ctrl.
When you press Ctrl, a plus sign is added to the cursor.
3. When the object is where you want it, release the mouse button and then the Ctrl key.
A new copy of the object is created.
If you selected several objects, dragging one of the objects copies all the selected
objects. The objects maintain their position relative to each other.
To drag objects between displays
1. Open both displays (or a graphic library and a display).
2. Position or resize the displays so both are visible.
For more information, see page 14-13.
15-44
3. Select one or more objects.
4. Click the selected object and drag it to the new display.
If you selected several objects, dragging one of the objects copies all the selected
objects. The objects maintain their position relative to each other.
Copying and pasting objects
You can cut, copy, or paste objects using the menu items on the Edit menu or the buttons
on the toolbar.
Once you cut or copy an object, you can paste it anywhere in the drawing area of:
the same graphic display.
a graphic display in the same or a different application.
a graphic library in the same or a different application.
To cut or copy objects
1. Select one or more objects.
Cut tool
Copy tool
2. On the Edit menu, click Cut or Copy, or click the Cut or Copy tool on the Graphics
toolbar.
To remove the original object, click Cut.
To retain the original object, click Copy.
To paste objects
1. Click in the display or library to paste to.
Paste tool
2. On the Edit menu, click Paste, or click the Paste tool on the Graphics toolbar.
Duplicating objects
When an object is duplicated, any animation attached to the object is also duplicated. If a
group is duplicated, the new copy of the group can be ungrouped to individual objects.
To duplicate objects
1. Select one or more objects.
Duplicate tool
2. On the Edit menu, click Duplicate, or click the Duplicate tool on the Graphics toolbar.
The duplicated object is placed slightly offset from the original.
15-45
• • • • •
15 • Using graphic objects
• • • • •
RSVIEW MACHINE EDITION USER’S GUIDE
Duplicate also duplicates actions. For example, if you duplicate an object, move it, and
then duplicate it again, the second Duplicate will, in one step, duplicate and move the
object. This is useful for creating a series of objects with an equal distance between them.
Select object
Duplicate object
Move object
Duplicate again
Duplicate works until you deselect the object.
Resizing objects
You can resize objects using the mouse or using the keyboard. The keys let you resize
objects in small increments. You can also use the grid to resize objects precisely.
Another option is to size an object using the object’s Height and Width properties in the
Property Panel. This method is especially useful for quickly resizing multiple objects to
the same size. For information about using the Property Panel, see page 15-31.
You can also specify an object’s size using the Common tab in the object’s Properties
dialog box. For more information, see page 16-1.
When you resize text objects, if you have selected the Size to fit option, the font size is
adjusted to fit the new object size as closely as possible.
To automatically align objects to the grid as you resize them
1. On the View menu, select Snap On. A check mark appears beside the menu item when
the option is selected.
For information about setting up the grid, see page 14-8.
To resize an object using the mouse
1. Select the object.
15-46
2. Place the pointer on one of the handles.
A double arrow appears.
3. Drag the handle until the object is the desired size or shape.
Drag a side handle to change width or height, or a corner handle to change both.
For perfect circles and squares, press Ctrl and hold the key down while you drag a
corner handle.
To maintain the object’s original proportions (width to height), press Shift and hold
the key down while you drag a corner handle.
To resize an object in small increments using the keyboard
1. Select the object.
2. Place the pointer on one of the handles.
A double arrow appears.
3. Hold down Shift and press an arrow key until the object is the desired size.
To adjust the amount of the increment, first hold down the Shift key and press the + or
- keys on the keyboard’s numeric keypad.
Reshaping drawing objects
You can reshape arcs, lines, polygons, polylines, rectangles, rounded rectangles, and
wedges.
To reshape lines, rectangles, polylines, and polygons
1. Select the object you want to reshape.
2. Click the Polygon tool, or right-click the object and then click Edit.
Polygon tool
The cursor changes to the Polygon tool, and handles appear on the object.
3. Move the cursor over any line or corner of the object.
A handle with a cross-hair appears.
15-47
• • • • •
15 • Using graphic objects
• • • • •
RSVIEW MACHINE EDITION USER’S GUIDE
4. Drag the handle until the object is the desired shape.
Dragging from a point along the line (between corners) creates a new angle between
the two corners.
5. To delete an angle, position the pointer at the tip of the angle, and then press Delete.
To reshape arcs and wedges
1. Select the object you want to reshape.
2. Click the Arc or Wedge tool, or right-click the object and then click Edit.
Arc tool
The cursor changes to the Arc or Wedge tool, and handles appear on the object.
3. Place the pointer on one of the handles.
A cross-hair appears.
Wedge tool
4. Drag the handle until the object is the desired shape.
To reshape rounded rectangles
1. Select the rounded rectangle.
2. Click the Rounded Rectangle tool, or right-click the object and then click Edit.
Rounded rectangle
tool
A handle appears inside the rounded rectangle.
3. Click the handle and drag inward to increase roundedness, or outward to decrease
roundedness.
Deleting objects
If you accidentally delete an object, use the Undo tool to restore it.
Undo tool
To delete objects
1. Select one or more objects.
2. On the Edit menu, click Delete, or press Delete on the keyboard.
To delete all the objects in the display
1. On the Edit menu, click Clear All.
15-48
Working with groups of objects
Grouping and ungrouping objects
Grouping combines several objects into a single object so you can manipulate them as a
single object. Grouping is useful for keeping objects in the same position relative to each
other. You can cut, copy, and paste groups, arrange the group as a single object relative to
other objects, and apply the same properties to all the members of the group at once.
You can attach animation to a group, and any animation attached to individual objects in
the group remains active. The group animation generally takes precedence over the
animation of individual objects within the group. For more information, see page 17-14.
Deleting a group deletes all individual objects in the group.
To group objects
1. Select all the objects you want grouped.
2. On the Arrange menu, click Group, or on the Graphics toolbar click the Group tool.
The handles around each object are replaced by a set of handles around the group.
Group tool
Drag the mouse to select the objects.
Group them.
To ungroup objects
1. Select the group of objects to ungroup.
2. On the Arrange menu, click Ungroup, or on the Graphics toolbar click the Ungroup
tool.
Ungroup tool
15-49
• • • • •
15 • Using graphic objects
• • • • •
RSVIEW MACHINE EDITION USER’S GUIDE
The handles around the group are replaced with handles around each object.
Select the group.
Ungroup it.
Ungrouping deletes any animation attached to the group, because the group no longer
exists. However, animation attached to the individual objects that were in the group
remains active.
Editing groups of objects
Edit a group the same way you would edit an individual object. You can:
use the Property Panel to apply the same properties to all the members of the group at
once. For example, change the line width of all objects in the group to 2 pixels.
For information about using the Property Panel, see page 15-31.
use the toolbars to apply the same pattern style, background style, foreground colors,
and background colors to all the members of the group.
for objects with states, use the States toolbar to cycle through the states and apply the
same properties to the states for each object in the group at once. When you select a
group containing objects with states, only the states that are common to all objects in
the group appear in the toolbar.
For more information about using the States toolbar, see page 15-37.
Editing objects within a group
You can also edit individual objects within the group without breaking the group, which is
particularly useful when you have animation attached to the group.
To edit objects within a group
1. Double-click the grouped object, or right-click it and then click Edit. A hatched border
appears around the group.
15-50
When the hatched border is around the group, you are in group edit mode. In this
mode, you can select individual objects in the group and modify them.
You can also add new objects to the group.
Double-click to edit the
group. A hatched border
appears. This border
indicates that this is a group.
Click again. Handles appear.
The handles show the
individual object selected
within the group.
2. To select an individual object (or a group) in the group, click it. You can also use the
Object Explorer to select objects within the group.
The status bar and Object Explorer indicate which object or group is selected.
3. Make your changes to the object.
You can change the selected object’s shape, size, or position, or use the object’s
Properties dialog box or the Property Panel to edit the object’s properties.
4. If desired, create new objects inside the hatched border.
5. To stop editing, click outside the group.
Arranging objects
You can arrange objects (or groups of objects) in a number of ways. You can:
layer objects by moving them in front of or behind other objects.
align objects with each other and with the grid.
space objects horizontally or vertically.
flip drawing objects horizontally or vertically.
rotate drawing objects.
lock objects into position.
Layering objects
You can layer objects (or groups of objects) on top of each other. Objects are layered in
the order they are created, with the most recently created object on top. Change the layer
order with Send to Back and Bring to Front.
Send to Back moves the selected object to the bottom layer.
Bring to Front moves the selected object to the top layer.
15-51
• • • • •
15 • Using graphic objects
• • • • •
RSVIEW MACHINE EDITION USER’S GUIDE
To bring an object to the front
1. Select the object.
To select an object that’s behind another object, place your pointer on the front object,
click once, pause, and then click again. Do not double-click and do not move the
mouse.
You can also select a concealed object easily by clicking the object in the Object
Explorer.
2. On the Arrange menu, click Bring to Front, or click the Bring to Front tool.
Bring to Front tool
Select the object from behind.
Bring the object to front.
To send an object to the back
1. Select an object.
2. On the Arrange menu, click Send to Back, or click the Send to Back tool.
Send to Back tool
Select the object.
Send the object to back.
Aligning objects
You can align objects (or groups of objects) with each other and with the grid.
To align objects
1. Select the objects you want to align.
15-52
2. On the Arrange menu, click the appropriate menu item, or click a tool on the
Alignment toolbar:
This button or menu item
Align Left
Aligns selected objects with the
Left-most selected object
Align Center
Horizontal center of all selected objects
Align Right
Right-most selected object
Align Top
Top-most selected object
Align Middle
Vertical center of all selected objects
Align Bottom
Bottom-most selected object
Align Center Points
Center of all selected objects
Align to Grid
Grid
To automatically align objects to the grid as you create or move
them
1. On the View menu, select Snap On. A check mark appears beside the menu item when
the option is selected.
For information about setting up the grid, see page 14-8.
15-53
• • • • •
15 • Using graphic objects
• • • • •
RSVIEW MACHINE EDITION USER’S GUIDE
Examples: Aligning objects left, right, and center
15-54
Select objects
Align left
Select objects
Align right
Select objects
Align center
Examples: Aligning objects top, middle, and bottom
Align top
Align middle
Align bottom
Spacing objects
With Space Vertical and Space Horizontal, objects (or groups of objects) are moved
vertically or horizontally to have the same amount of space from the center point of each
object.
To space objects
1. Select the objects you want to space.
2. On the Arrange menu, click a Space menu item, or click a tool on the Graphics
toolbar:
Space Horizontal tool
Space Vertical tool
This tool or menu item
Does this
Space Horizontal
Places the centers of the selected objects an equal distance apart
horizontally.
15-55
• • • • •
15 • Using graphic objects
• • • • •
RSVIEW MACHINE EDITION USER’S GUIDE
This tool or menu item
Does this
Space Vertical
Places the centers of the selected objects an equal distance apart
vertically.
Examples: Spacing objects vertically and horizontally
Centers are
separated by an equal
vertical distance.
Select objects
Space vertically
Centers are
separated by an equal
horizontal distance.
Select objects
Space horizontally
Flipping drawing objects
Flipping an object creates a mirror image of the object. You can flip all the drawing
objects (or groups of drawing objects) except text, images, and panels.
To flip a drawing object
1. Click the object.
Flip Vertical
Flip Horizontal
15-56
2. On the Arrange menu, click a Flip menu item, or click a tool on the Graphics toolbar:
This tool or menu item
Flips selected objects
Flip Vertical
Top to bottom (upside-down)
This tool or menu item
Flips selected objects
Flip Horizontal
Left to right
Examples: Flipping drawing objects vertically and horizontally
Select object
Flip vertical
Select object
Flip horizontal
Rotating drawing objects
You can rotate all the drawing objects (or groups of drawing objects) except images,
panels, and rounded rectangles.
You can attach rotation animation to the same drawing objects. With rotation animation,
the object rotates around an anchor point to indicate a tag’s value at runtime. For details
about rotation animation, see page 17-13.
When you rotate text, it rotates around the anchor point but the text itself remains upright.
To rotate a drawing object
1. On the Objects menu, click Rotate, or on the Objects toolbar click the Rotate tool.
Rotate tool
2. Click the object you want to rotate. A small crosshair circle appears in the middle of
the object. This is the anchor point that is used as the center of rotation.
15-57
• • • • •
15 • Using graphic objects
• • • • •
RSVIEW MACHINE EDITION USER’S GUIDE
You can place the crosshair inside an object.
You can place the crosshair outside an object.
3. To move the center of rotation, click the cross-hair and drag it to a new anchor
position. The anchor can be inside or outside the object.
4. Click an edge of the object and drag in the direction you want to rotate it.
To rotate the object in five-degree increments, press Ctrl while you drag.
5. When the object is in the desired position, release the mouse button.
Locking objects into position
You can lock graphic objects (or groups of objects) into position by converting them to
wallpaper. Once you convert objects to wallpaper, you cannot select or edit them unless
you unlock the wallpaper. Wallpaper objects cannot be animated at runtime.
If the grid is on, wallpaper objects are positioned behind the grid.
If you just want to lock the objects into place while you’re working in the display, unlock
the wallpaper when you’re finished. If you want to use the wallpaper objects as a
background for your display, leave the wallpaper locked.
For more information about creating a background for your display, see page 14-13.
15-58
16 Setting up graphic objects
This chapter describes how to set up graphic objects. It describes how to:
set up objects’ spatial properties, names, and visibility.
work with objects that have states.
set up the linked properties of reference objects.
position objects for touch screens.
assign function keys to buttons.
use the keyboard to navigate to and select objects at runtime.
link buttons to lists and trends.
repeat a button’s action by holding down the button.
ensure values are read by the data source before sending new values.
set up objects.
For objects that are not described in other chapters of the manual, this chapter provides
information about how to use the objects.
For information about creating graphic objects, see Chapter 15.
For information about creating and setting up the trend graphic object, see Chapter 18.
For information about creating and setting up the RecipePlus graphic objects, see
Chapter 19.
Setting up objects’ spatial properties, names, and visibility
Every graphic object has a Common tab in its Properties dialog box. Use the Common tab
to set up the following properties for the object:
height and width
top and left position
name
visibility
For ActiveX® and trend objects, you can also set up these properties:
focus highlight
key navigation
16-1
• • • • •
RSVIEW MACHINE EDITION USER’S GUIDE
For details about the options in the Common tab, see Help.
Tips for setting up objects with states
The graphic objects that have states have a States tab in their Properties dialog box.
16-2
For details about the options in the States tab, see Help.
Copying and pasting properties from one state to another
Often, you’ll want most of the properties to be the same from state to state, with only one
or two settings changing to distinguish the different states.
To simplify setting up states when many of the properties are the same, you can copy and
paste settings from one state to another. For details, see Help.
Adding and removing states
Some graphic objects have a configurable number of states. For these objects, you can use
the Insert State and Delete State buttons in the States tab, to add and remove states without
returning to the General tab. The “Number of States” setting on the General tab is
automatically updated.
For more information about the Insert State and Delete State buttons, see Help.
Setting up reference objects’ link properties
RSView global objects allow you to link the appearance and behavior of a graphic object
to multiple copies of that object. When the original base object is updated, the changes are
automatically applied to all the copies of the object.
16-3
• • • • •
16 • Setting up graphic objects
• • • • •
RSVIEW MACHINE EDITION USER’S GUIDE
The copies of the object are called reference objects, and they have the same properties as
the original base object. If desired, you can assign unique size, connections, and animation
to the reference object.
To assign unique properties to the reference object, use the Property Panel to edit the
following properties for the reference object:
LinkSize—select False to set up the height and width separately for the reference
object. If LinkSize is set to true, when you try to resize the reference object, it will
snap back to its linked size.
LinkConnections—select False to set up connections separately for the reference
object. Whether you use the base object’s connections, or set up separate connections,
the tags used count towards the tag limit for the display.
You can assign tag placeholders to the connections for base objects, and to
connections for reference objects with the LinkConnections property set to False.
LinkAnimation—select Do not link to set up separate animation for the reference
object. To use the animation set up for the base object but assign different expressions
to the reference object, select Link without expressions.
If you select Link with expressions, the reference object uses the animation and
expressions assigned to the base object.
Reference objects also have a property called LinkBaseObject, which specifies the name
and location of the base object to which the reference object is linked. You cannot edit the
LinkBaseObject property.
For information about creating reference objects, see page 15-24. For information about
editing a reference object’s base object, see page 15-24.
To change a reference object’s link properties
1. Double-click the object to open the Property Panel.
2. Make your changes to the link properties.
3. Specify the new size, connections, and animation for the object.
For information about resizing objects, see page 15-46. For information about
assigning connections to objects, see page 15-33. For information about assigning
animation to objects, see Chapter 17.
To specify default link properties for reference objects
1. On the Edit menu, select Global Object Defaults.
2. Specify the new default values.
16-4
3. Click OK.
The defaults are used for any new reference objects you create. You can still edit the
properties for individual objects separately.
To break the link to a base object
1. Right-click the reference object, and then click Break Link.
The reference object becomes a regular object. You can edit all of its properties.
However, you cannot restore the connection to the base object.
Deleting the base object
If you delete a base object or a global object display containing base objects, any
reference objects that are linked to the deleted base objects are broken. A broken
reference object is displayed as a red square with an X through it. You cannot edit
broken reference objects.
To repair a broken reference object
1. Recreate the base object with the same object type and name as before, on the same
display as before.
Setting up how objects are used at runtime
Just as you must provide operators with a way to navigate between displays at runtime,
you must also make sure that operators can use the objects within the displays. The next
sections in this chapter describe how to set up your objects so the operator can:
press objects using a touch screen.
use function keys to press buttons when a mouse or touch screen is not available on
the runtime computer.
use the keyboard or keypad to navigate to and select lists, trends, and ActiveX input
objects.
use buttons to work with lists and trends.
repeat a button’s action by pressing and holding it.
ensure that tag values are read by the data source before sending new values.
Positioning objects for touch screens
If the operator will be using a touch screen at runtime, keep these tips in mind when
positioning graphic objects in your displays:
16-5
• • • • •
16 • Setting up graphic objects
• • • • •
RSVIEW MACHINE EDITION USER’S GUIDE
Don’t place important buttons where they’ll be blocked by an On Top display. The
user can’t press a covered button.
Ensure buttons are large enough for users to touch easily.
Use touch margins for buttons that are positioned close together, to ensure that the
adjacent button is not pressed by mistake.
Using touch margins
Touch margins are touch-insensitive borders inside the button’s margin. If the operator
presses on the touch margin, the button press is not registered. Touch margins are useful
when buttons are positioned close to each other and you want to make sure the operator
doesn’t press the wrong button by mistake.
You can create touch margins at the top and bottom of the button, at the sides, or on all
four sides.
In the illustration below, the button’s border and touch margins are the same size, 12
pixels. A button press would be registered only when the darker square in the middle of
the button is pressed.
The margins at the top and
bottom edges are called
vertical touch margins.
The margins at the left and
right edges are called
horizontal touch margins.
The bounding box
If the object’s shape is a circle or ellipse, the touch margin applies to the object’s bounding
box, not the object’s border. The bounding box is an invisible square or rectangle that
surrounds the object. When you select the object, the selection handles show the location
of the bounding box.
The invisible
bounding box is just
inside the selection
handles.
To create touch margins, use one of these methods
16-6
In the General tab of the button’s Properties dialog box, type the number of pixels for
the touch margins in the Horizontal margin and Vertical margin boxes.
In the Properties tab of the Property Panel, type the number of pixels for the
HorizontalMargin and VerticalMargin properties.
Assigning function keys to buttons
You can assign function keys to the buttons in your displays to allow the operator to press
the buttons using the function keys on the runtime terminal (or the function keys on a
keyboard, if one is available). You can also assign a function key to the numeric input
cursor point.
You can assign up to 34 function keys to each graphic display.
Here are some tips for assigning function keys:
Where possible, use the same function keys for the same operations in all your graphic
displays. For example, if every display contains a goto display button that returns the
operator to a graphic display called Main Menu, assign the same function key to this
button in each display.
Include the name of the function key assigned to a button in a caption on the button.
For buttons with multiple states, include the function key name in the caption for each
state, or create a text object to use as a label for the button (so that you don’t have to
set up the caption for each state), and then group the text and button together.
If your application will run on a PanelView Plus™ or VersaView® CE terminal, assign
keys that are supported by the runtime terminal. Different sizes of terminals have
different function keys.
Function key equivalents
If your application will run in Windows® 2000 or Windows XP, the keyboard contains the
function keys F1 to F12 only. The remaining function keys are associated with these key
combinations:
For this function key
Use this key combination
F13
Left Shift-F1
F14
Left Shift-F2
F15
Left Shift-F3
F16
Left Shift-F4
F17
Left Shift-F5
F18
Left Shift-F6
16-7
• • • • •
16 • Setting up graphic objects
• • • • •
RSVIEW MACHINE EDITION USER’S GUIDE
For this function key
Use this key combination
F19
Left Shift-F7
F20
Left Shift-F8
K1 - K12
Right Alt-F1 to Right Alt-F12
K13
Right Shift-F1
K14
Right Shift-F2
K15
Right Shift-F3
K16
Right Shift-F4
K17
Right Shift-F5
K18
Right Shift-F6
K19
Right Shift-F7
K20
Right Shift-F8
At runtime, the operator presses the key combination to activate the object to which the
function key is assigned.
To assign function keys to buttons
1. On the Edit menu, click Key Assignments, or right-click a button and then click Key
Assignments.
For details about using the Key Assignment Properties dialog box to assign function keys
and change function key assignments, see Help.
16-8
Using the keyboard to navigate to and select objects
If a mouse or touch screen is not available on the runtime computer, the operator can use
the keys on a keyboard or keypad to select (give focus to) these objects:
lists: control list selector, piloted control list selector, display list selector, diagnostics
list, alarm list, and alarm status list
alarm banners
trends
numeric input enable buttons and string input enable buttons
numeric input cursor points
RecipePlus table and selector
third-party ActiveX input objects
What input focus looks like
The object with focus is surrounded by a highlight box, unless the Disable Highlight
When Object has Focus box is selected (in the Display Settings dialog box). You can
specify the color of the highlight in this dialog box as well. For more information, see
Help.
Focus highlight for ActiveX and trend objects
For ActiveX and trend objects, use the Common tab in the object’s Properties dialog box
to specify whether or not to display a highlight box. For more information about setting up
options on the Common tab, see page 16-1.
If the Disable Highlight When Object has Focus box is checked (in the Display Settings
dialog box), that setting overrides the setting you specify in the Common tab.
16-9
• • • • •
16 • Setting up graphic objects
• • • • •
RSVIEW MACHINE EDITION USER’S GUIDE
Using the keys on the keyboard or keypad
When a graphic display opens, the keyboard-navigable object that is closest to the top left
corner of the display is selected. The operator can use these keys to move to and select a
different object:
Use this key
To do this
Tab
Move from the upper left to the lower right.
Shift+Tab
Move from the lower right to the upper left.
Ctrl+arrow key
Move left, right, up, or down.
Removing objects from and adding objects to the tab
sequence
By default, you can use the keys to navigate to all lists, alarm banners, numeric input
cursor points, trends, and ActiveX input objects in a display. However, you can turn off
key navigation for these objects if desired.
When an object’s key navigation is turned off, the operator can still select the object using
a mouse or touch screen, if available.
By default, key navigation is turned off for the numeric input enable buttons and string
input enable buttons. You can turn on keyboard navigation if you want the operator to use
the keyboard to navigate to these objects.
To turn key navigation on or off, use one of these methods
In the Properties tab of the Property Panel, set the KeyNavigation property to False for
off or True for on.
For list objects, alarm banners, numeric input cursor points, numeric input enable
buttons, and string input enable buttons, in the General tab of the object’s Properties
dialog box, clear the Key navigation box for off. Check the box for on.
For ActiveX and trend objects, in the Common tab of the object’s Properties dialog
box, clear the Key navigation box for off. Check the box for on.
Linking buttons to objects
Some RSView® buttons can be linked to specific trend, list, recipe, and alarm banner
objects, or you can set them up to work with whichever object has focus in the display.
If you are creating small graphic displays that don’t have much room, you might prefer to
use one set of buttons to work with all the graphic objects (that accept input focus) in the
display.
16-10
By default, the buttons are set up to work with whichever object has input focus (is
selected) in the display.
This trend object has focus.
These move up and move down
buttons work with the object that
has focus.
However, if space isn’t a concern, you can create multiple copies of the buttons you want
to use and link them to specific objects. One benefit of linking a button to a specific object
is that the operator doesn’t have to select the object before pressing the button. Another
benefit is that you can position the buttons close to the specified object, making it easier
for the operator to understand which buttons work with which objects.
16-11
• • • • •
16 • Setting up graphic objects
• • • • •
RSVIEW MACHINE EDITION USER’S GUIDE
Each object has its own set of buttons.
To link a button to a specific object using the button’s Properties
dialog box
1. Double-click the button to open its Properties dialog box.
2. In the General tab, in the “Send press to” box, select Linked Object.
3. To select from a list of all the objects in the display that you can link the button to,
click the Browse button next to the Linked object box.
4. Click the name of the object to link the button to, and then click OK.
5. Click OK to close the button’s Properties dialog box.
To link a button to a specific object using the Property Panel
1. In the Properties tab, specify the SendPressTo and LinkedObject properties.
Once you have linked buttons to an object, you might want to turn off the object’s key
navigation, since this option is no longer needed. For details, see page 16-10.
16-12
Repeating a button’s action by holding down the button
To repeat a button’s action by pressing and holding it, set up auto repeat for the button. If
you set up auto repeat, when the operator presses and holds down the button, repeated
button presses are registered until the operator releases the button.
A button press occurs when the operator clicks an object with the mouse, presses it on a
touch screen, or presses the function key associated with the object. Auto repeat works
with all these methods of pressing buttons.
You can use auto repeat with these buttons:
For this button
Each button press does this
Multistate push
Sends the value for the next state to the data source. External
changes to the Value connection are not recognized when the
button is in auto repeat mode.
Ramp
Sends the new ramped value to the data source. External changes
to the Value connection are not recognized when the button is in
auto repeat mode.
Move up
Moves the highlight up an item in the list, recipe selector, or recipe
table, scrolls up in the trend, or ramps the numeric input cursor
point or numeric input enable button value.
Move down
Moves the highlight down an item in the list, recipe selector, or
recipe table, scrolls down in the trend, or ramps the numeric input
cursor point or numeric input enable button value.
Page up
Moves the highlight up a page in the list, recipe selector, or recipe
table.
Page down
Moves the highlight down a page in the list, recipe selector, or
recipe table.
Move left
Scrolls the trend to the left.
Move right
Scrolls the trend to the right.
For each button that uses auto repeat, you can specify these properties:
Auto repeat rate—the number of times per second a button press is registered when
the button goes into auto repeat mode. The default rate is 0, which means that auto
repeat is turned off.
Auto repeat delay—the length of time the button has to be pressed and held down
before auto repeat starts.
16-13
• • • • •
16 • Setting up graphic objects
• • • • •
RSVIEW MACHINE EDITION USER’S GUIDE
To set up auto repeat for a button, use one of these methods
In the Timing tab of the button’s Properties dialog box, specify the Auto repeat rate
and Auto repeat delay properties.
In the Properties tab of the Property Panel, specify the AutoRepeatRate and
AutoRepeatDelay properties.
Ensuring values are read by the data source before sending new
values
To ensure a value is read by the data source before the operator sends a new value, use
Enter key handshaking. While Enter key handshaking is in effect for an object, the
operator cannot send a new value to the object’s Value connection.
You can use Enter key handshaking with these graphic objects:
control list selector
piloted control list selector
numeric input enable button
string input enable button
numeric input cursor point
If Enter key handshaking is in effect for one of these objects, the operator can still provide
input to other objects in the graphic display.
If the graphic display is closed while Enter key handshaking is in effect, the handshaking
is cancelled.
Methods of Enter key handshaking
Enter key handshaking works by setting the object’s Enter connection to 1. As long as the
Enter connection is set to 1, new values cannot be sent to the Value connection. How the
Enter connection is reset to 0 depends on how you set up Enter key handshaking.
There are two ways you can use Enter key handshaking:
to hold the value at the data source for a specific period of time.
to hold the value at the data source until the data source notifies RSView that the value
has been read.
Choose the method that best suits your application needs and communication system.
16-14
Holding the value for a specific period of time
To set up an object’s Enter key handshaking so that the value at the Value connection is
held for a specific period of time, assign a tag to the Enter connection and specify the
Enter key hold time. You can also specify an Enter key control delay, if desired.
How handshaking works
This method of Enter key handshaking works as follows:
1. When the operator presses the Enter button, the value is sent to the Value connection
and the “Enter key control delay” timer begins timing. (The use of a delay is optional.)
2. If you specify an Enter key control delay, when the time is up, the Enter connection is
set to 1. If you don’t use the delay, the Enter connection is set to 1 as soon as the
operator presses Enter.
As long as the Enter connection is set to 1, the operator cannot send new values to the
data source.
3. When the Enter connection is set to 1, the “Enter key hold time” timer begins timing.
4. When the Enter key hold time has expired, the Enter connection is reset to 0 and the
operator can send a new value to the Value connection.
To set up Enter key handshaking to hold the value for a specific
period of time
1. In Timing tab of the object’s Properties dialog box, specify the Enter key control delay
(optional) and Enter key hold time properties.
2. In the Connections tab, assign a tag to the Enter connection. A digital tag is
recommended (either an HMI tag or a data server tag).
You can also use the Property Panel to specify the properties and assign a tag to the Enter
connection.
Holding the value until the data source acknowledges that it
has read the value
To set up an object’s Enter key handshaking so that the value at the Value connection is
held until the data source notifies RSView that it has read the value, use two connections:
the Enter connection and the Enter handshake connection.
Instead of using an Enter key hold time, specify an Enter key handshake time. You must
also specify the Handshake reset type. You can use an Enter key control delay, if desired.
16-15
• • • • •
16 • Setting up graphic objects
• • • • •
RSVIEW MACHINE EDITION USER’S GUIDE
How the Handshake reset type works
How the Enter handshake connection resets the Enter connection depends on which
Handshake reset type you select:
With this handshake reset
type
The Enter connection is set to 0 when
Non-zero Value
The Enter handshake connection has a non-zero value.
If the Enter handshake connection already has a non-zero value
when the value is sent to the Value connection (or when the Enter
key control delay has expired, if the delay is used), then the Enter
connection is not set to 1, and Enter key handshaking does not take
place.
Zero to Non-zero transition
The Enter handshake connection changes from 0 to a non-zero
value.
Set up the data source to send a non-zero value to the Enter handshake connection when it
has read the new value at the Value connection, and then to reset the Enter handshake
connection to 0.
If the Enter key handshake time expires before the Enter handshake connection resets the
Enter connection, an error message is sent to FactoryTalk® Diagnostics™.
How handshaking works
If you use the Enter handshake connection, handshaking works like this:
1. When the operator presses the Enter button, the value is sent to the Value connection
and the “Enter key control delay” timer begins timing. (The use of a delay is optional.)
2. If you specify an Enter key control delay, when the time is up, the Enter connection is
set to 1. If you don’t use the delay, the Enter connection is set to 1 as soon as the
operator presses Enter.
As long as the Enter connection is set to 1, the operator cannot send new values to the
data source.
If the Handshake reset type is Non-zero Value, the Enter handshake connection must
be 0 when the delay expires in order to set the Enter connection to 1.
3. When the Enter connection is set to 1, the “Enter key handshake time” timer begins
timing.
4. The Enter connection remains set until the Enter key handshake time expires or until
reset by the Enter handshake connection, whichever happens first.
16-16
5. The Enter connection is reset to 0 and the operator can send a new value to the Value
connection.
To set up Enter key handshaking to hold the value until the data
source has read it
1. In the Timing tab of the object’s Properties dialog box, specify these properties:
Enter key control delay (optional)
Enter key handshake time
Handshake reset type
2. In the Connections tab, assign these connections:
Enter—assign a tag. A digital tag is recommended (either an HMI tag or a data
server tag).
Enter handshake—assign a tag or expression.
3. Set up the data source to send a non-zero value to the Enter handshake connection
when it has read the new value at the Value connection, and then to reset the Enter
handshake connection to 0.
You can also use the Property Panel to specify the properties and assign tags to the
connections.
Time, date, and number formats for graphic objects
Graphic objects use the time, date, and number format of the current application language.
For example, if the application language uses a comma for the decimal symbol, floatingpoint values displayed in graphic objects uses a comma for the decimal symbol.
For information about using multiple languages, see Chapter 23.
Setting up buttons
Many of the button graphic objects are set up the same way. The instructions in this
section apply to these buttons:
Acknowledge alarm
Logout
Acknowledge all alarms
Move down
Alarm status mode
Move left
Backspace
Move right
Clear alarm banner
Move up
16-17
• • • • •
16 • Setting up graphic objects
• • • • •
RSVIEW MACHINE EDITION USER’S GUIDE
Clear alarm history
Next pen
Diagnostics clear
Page down
Diagnostics clear all
Page up
Display print
Password
End
Pause
Enter
RecipePlus
Goto configure mode
Reset alarm status
Home
Return to display
Information acknowledge
Shutdown
Language switch
Silence alarms
Login
Sort alarms
You can set up any combination of these buttons in a graphic display. For example, you
might want to put a login, logout, and shutdown button in the same graphic display.
Create and then set up each button separately.
The illustration shows the login button. Some buttons have different properties on the
General tab, but you can use these instructions to set up any of the buttons in the list.
To set up a button
1. Double-click the button.
16-18
2. In the button’s Properties dialog box, fill in the options on each tab:
In the General tab, specify what the button looks like at runtime. For some
buttons, you can specify whether to link the button to a specific object.
In the Label tab, specify what text or image to display on the button.
In the Timing tab, set up whether or not the button press repeats automatically
when the operator presses and holds the button down. You can also set up the rate
at which the button press repeats. For more information about auto repeat, see
page 16-14.
The Timing tab is available only for the move up, move down, move left, move
right, page up, and page down buttons.
In the Common tab, specify the button’s spacial properties, name, and visibility.
For details about the options in the tabs, see Help.
3. When you are finished, click OK.
Buttons described later in the chapter
Information about setting up these buttons is described later in the chapter:
Close display
Multistate push
16-19
• • • • •
16 • Setting up graphic objects
• • • • •
RSVIEW MACHINE EDITION USER’S GUIDE
Goto display
Numeric input enable
Interlocked push
Print alarm history
Latched push
Print alarm status
Macro
Ramp
Maintained push
String input enable
Momentary push
How to use push buttons
Push buttons start or stop processes or actions by changing tag values.
Never use push buttons for emergency stops. Emergency stop buttons must always be hardwired.
You can use different kinds of push buttons, depending on what kind of machinery you are
running or process you are controlling:
Momentary push buttons change a tag to one value when the button is pressed, and
another value when the button is released. The machine is on only while the button is held
down. When the button is released, the machine turns off. Momentary push buttons are
useful for jogging a motor, and they can be set up to start and stop a machine or process.
Maintained push buttons toggle between two values. This type of button is useful for
changing a setting within a machine or process, but not for starting the machine or
process. For example, use the maintained push button for changing modes, such as Auto
to Manual, or Metric to Imperial.
Latched push buttons latch in the on position, and must be unlatched by another button
or process to return to the off position. This type of button is useful for starting a machine
or process.
Multistate push buttons allow an operator to cycle through multiple options
consecutively, using a single button. The current state of a process or operation is
displayed on the button by a different color, caption, or image for each state.
Interlocked push buttons work in groups, and share the same tag. Pressing one button
cancels another. Although interlocked push buttons work as a group, you add them to the
display one at a time.
Ramp buttons increase or decrease the value of a tag by either an integer or floatingpoint value. You can use two ramp buttons together to create an increment/decrement
control, for example for the speed of a motor. Or, you can use a numeric input enable
button or numeric input cursor point.
16-20
For information about the numeric input enable button, see page 16-31. For information
about the numeric input cursor point, see page 16-33.
Setting up momentary push buttons
Use the momentary push button to start a process or action. When pressed, the button
changes a tag to one value, and when released, the button changes the tag to another value.
The momentary push button’s states can perform one of three kinds of actions:
Change the Value connection to 1 when the button is pressed, and to 0 when the button
is released. This kind of button is called normally open, because its released state is
off. Pressing the button completes the circuit.
Change the Value connection to 0 when the button is pressed, and to 1 when the button
is released. This kind of button is called normally closed, because its released state is
on. Pressing the button breaks the circuit.
Change the Value connection to a value you specify. You assign the desired values to
the button’s press and release actions. For example, 50 when pressed, and 100 when
released.
The error state
The button’s error state is displayed at runtime when:
the Value connection is unassigned.
the Indicator connection’s value does not match one of the state values you set up.
To set up a momentary push button
1. Double-click the momentary push button.
16-21
• • • • •
16 • Setting up graphic objects
• • • • •
RSVIEW MACHINE EDITION USER’S GUIDE
2. In the button’s Properties dialog box, fill in the options on each tab:
In the General tab, specify what the momentary push button looks like at runtime,
and what type of action the button performs.
In the States tab, specify what the button does when it is pressed and released. For
tips about setting up states, see page 16-2.
In the Common tab, specify the button’s spacial properties, name, and visibility.
In the Connections tab, specify the tags or expression with which the button
exchanges data. For information about assigning tags and expressions, see
page 15-38.
For details about the options in the tabs, see Help.
3. When you are finished, click OK.
Setting up maintained push buttons
Use the maintained push button to change a setting in a machine or process. Maintained
push buttons are not useful for starting or stopping a machine or process.
When pressed the first time, the maintained push button changes a tag to one value. When
pressed and released a second time, the button changes the tag to another value.
16-22
The error state
The button’s error state is displayed at runtime when:
the Value connection is unassigned.
the Indicator connection’s value does not match one of the state values you set up.
The error state is also displayed when the display containing the maintained push button
first opens, if the Value connection’s value does not match one of the state values you set
up.
To set up a maintained push button
1. Double-click the maintained push button.
2. In the button’s Properties dialog box, fill in the options on each tab:
In the General tab, specify what the button looks like at runtime, and how the
button changes state.
In the States tab, specify what the button does when it is pressed and released. For
tips about setting up states, see page 16-2.
In the Common tab, specify the button’s spacial properties, name, and visibility.
In the Connections tab, specify the tags or expression with which the button
exchanges data. For information about assigning tags and expressions, see
page 15-38.
16-23
• • • • •
16 • Setting up graphic objects
• • • • •
RSVIEW MACHINE EDITION USER’S GUIDE
For details about the options in the tabs, see Help.
3. When you are finished, click OK.
Setting up latched push buttons
The latched push button latches in the On position, and must be unlatched by another
button or process to return to the Off position. This type of button is useful for starting a
machine or process.
For example, use the latched push button when you want the Value connection to start a
process within a programmable controller and remain set until the process is completed.
You can also use a latched push button when you have a controller with a long program or
long update times.
When the operator presses a latched push button, it changes the Value connection to one
value, and remains at that value until the Handshake connection gives the signal to unlatch
the button.
The error state
The button’s error state is displayed at runtime when:
the Value connection is unassigned.
the Indicator connection’s value does not match one of the state values you set up.
The Handshake connection is unassigned.
The error state is also displayed when the display containing the latched push button first
opens, if the Value connection’s value does not match one of the state values you set up.
To set up a latched push button
1. Double-click the latched push button.
16-24
2. In the button’s Properties dialog box, fill in the options on each tab:
In the General tab, specify what the button looks like at runtime, and how to
unlatch it.
In the States tab, specify what the button does when it is latched and unlatched.
For tips about setting up states, see page 16-2.
In the Common tab, specify the button’s spacial properties, name, and visibility.
In the Connections tab, specify the tags or expression with which the button
exchanges data. For information about assigning tags and expressions, see
page 15-38.
For details about the options in the tabs, see Help.
3. When you are finished, click OK.
Setting up multistate push buttons
The multistate push button displays—and allows an operator to cycle through—multiple
options consecutively. The multistate push button displays the current state of a process or
operation by showing a different color, caption, or image to reflect different states.
Each time the operator presses the button, the tag changes to the value for the next state.
When the button is in its last state and the operator presses the button, the button returns to
its first state.
16-25
• • • • •
16 • Setting up graphic objects
• • • • •
RSVIEW MACHINE EDITION USER’S GUIDE
The error state
The button’s error state is displayed at runtime when:
the Value connection is unassigned.
the Indicator connection’s value does not match one of the state values you set up.
The error state is also displayed when the display containing the multistate push button
first opens, if the Value connection’s value does not match one of the state values you set
up.
To set up a multistate push button
1. Double-click the multistate push button.
2. In the button’s Properties dialog box, fill in the options on each tab:
16-26
In the General tab, specify what the button looks like, and how the button changes
state.
In the States tab, specify what the button does when it is pressed and released. For
tips about setting up states, see page 16-2.
In the Timing tab, set up whether or not the button press repeats automatically
when the operator presses and holds the button down. You can also set up the rate
at which the button press repeats. For more information about auto repeat, see
page 16-13.
In the Common tab, specify the button’s spacial properties, name, and visibility.
In the Connections tab, specify the tags or expression with which the button
exchanges data. For information about assigning tags and expressions, see
page 15-38.
For details about the options in the tabs, see Help.
3. When you are finished, click OK.
Setting up interlocked push buttons
Multiple interlocked push buttons work together and share the same tag. Pressing one
button cancels another. Although interlocked push buttons work as a group, you add them
to the display one at a time.
When the operator presses one of the interlocked push buttons, the tag assigned to its
Value connection changes to one value. When the operator presses a different interlocked
push button, the tag changes to another value. Assign the same tag to each button’s Value
connection.
You can also use a single interlocked push button to send a value to a tag.
To set up an interlocked push button
1. Double-click the interlocked push button.
16-27
• • • • •
16 • Setting up graphic objects
• • • • •
RSVIEW MACHINE EDITION USER’S GUIDE
2. In the button’s Properties dialog box, fill in the options on each tab:
In the General tab, specify the button’s appearance, and the value it sends to the
Value connection.
In the States tab, specify what the button looks like when it is pressed and released
at runtime. For tips about setting up states, see page 16-2.
In the Common tab, specify the button’s spacial properties, name, and visibility.
In the Connections tab, specify the tag with which the button exchanges data.
Interlocked push buttons have no Indicator connection. For information about
assigning tags, see page 15-38.
For details about the options in the tabs, see Help.
3. When you are finished, click OK.
Setting up ramp buttons
Use the ramp button to increase or decrease the value of a tag.
Ramp buttons can change a tag by either an integer or floating-point value. You can use
two ramp buttons together to create an increment/decrement control.
Each time the operator presses the button, the tag value increases or decreases, depending
on how you set up the button.
To set up a ramp button
1. Double-click the ramp button.
16-28
2. In the button’s Properties dialog box, fill in the options on each tab:
In the General tab, specify what the button looks like, and whether the button
ramps a value up or down.
In the Label tab, specify what text or image to display on the button.
In the Timing tab, set up whether or not the button press repeats automatically
when the operator presses and holds the button down. You can also set up the rate
at which the button press repeats. For more information about auto repeat, see
page 16-13.
In the Common tab, specify the button’s spacial properties, name, and visibility.
In the Connections tab, specify the tag with which the button exchanges data.
Ramp buttons have no Indicator connection. For information about assigning tags,
see page 15-38.
For details about the options in the tabs, see Help.
3. When you are finished, click OK.
Setting up numeric displays
Use the numeric display object to show the operator numeric information from the data
source. For example, you might use a numeric display to show the current temperature of
an oven.
16-29
• • • • •
16 • Setting up graphic objects
• • • • •
RSVIEW MACHINE EDITION USER’S GUIDE
How values are displayed
The numeric display shows the value of the Value connection at the data source. The value
shown depends on whether the Value connection value is a floating-point number or an
integer. Integer values are displayed as is. Floating-point values are rounded to fit the
display. The decimal places option also affects how floating point numbers are displayed.
For example, if the numeric display is set up to show 6 digits, with one decimal place,
1234.56 is rounded to 1234.6. 1234.44 is rounded to 1234.4. The decimal counts as one of
the digits.
For more information about how values are rounded, see page 7-2.
Problems with displaying values
If the Value connection is unassigned, the numeric display is filled with asterisks (*).
If the integer portion of the value, including the decimal point and minus sign,
contains more digits than specified for the display, the numeric display is filled with
asterisks.
If the numeric display is sized so that the value cannot be fully displayed, the value is
truncated and the last displayable digit is replaced with an asterisk.
If the value doesn’t fit on the first line of the display, and there is room for a second
line, the value continues onto the second line.
To set up a numeric display
1. Double-click the numeric display.
16-30
2. In the object’s Properties dialog box, fill in the options on each tab:
In the General tab, specify what the numeric display looks like at runtime.
In the Common tab, specify the object’s spacial properties, name, and visibility.
In the Connections tab, specify the tags or expression whose data is displayed. For
information about assigning tags and expressions, see page 15-38.
For details about the options in the tabs, see Help.
3. When you are finished, click OK.
Setting up numeric input enable buttons
The operator can press the numeric input enable button to open a numeric pop-up keypad
or scratchpad. The operator can enter a number in the keypad or scratchpad, and then send
the number to the data source.
For more information about using the numeric input enable button at runtime, see
page 28-6.
You can also set up the numeric input enable button to work as a ramp button. In this case,
when the button has focus, the operator can press a move up or move down button to
change a tag by either an integer or floating-point value. The operator can also press the
Up Arrow or Down Arrow on the keyboard or keypad to ramp the value.
16-31
• • • • •
16 • Setting up graphic objects
• • • • •
RSVIEW MACHINE EDITION USER’S GUIDE
To set up a numeric input enable button
1. Double-click the numeric input enable button.
2. In the button’s Properties dialog box, fill in the options on each tab:
In the General tab, specify what the button looks like at runtime, whether the
operator can navigate to the button using the keys on the keyboard or keypad, and
whether the operator can press the button to give it focus.
In the Label tab, specify what text or image to display on the button.
In the Numeric tab, set up which pop-up window opens (if any), the ramp value (if
any), minimum and maximum values to send to the data source, and decimal point
settings.
In the Timing tab, set up the timing and handshake settings for the Enter key.
These settings do not apply when you ramp a value. For information about using
Enter key handshaking, see page 16-14.
In the Common tab, specify the button’s spacial properties, name, and visibility.
In the Connections tab, specify the tags or expressions with which the button
exchanges data. For information about assigning tags and expressions, see
page 15-38.
For details about the options in the tabs, see Help.
16-32
3. When you are finished, click OK.
Setting up numeric input cursor points
The operator can activate the numeric input cursor point to open a numeric pop-up keypad
or scratchpad. The operator can enter a number in the keypad or scratchpad, and then send
the number to the data source. The cursor point displays the current value at the data
source (if you assign a tag to the Indicator connection).
For more information about using the numeric input cursor point at runtime, see
page 28-6.
You can also set up the numeric input cursor point to work as a ramp button. In this case,
when the cursor point has focus, the operator can press a move up or move down button to
change a tag by either an integer or floating-point value. The operator can also press the
Up Arrow or Down Arrow on the keyboard or keypad to ramp the value.
To set up a numeric input cursor point
1. Double-click the numeric input cursor point.
2. In the object’s Properties dialog box, fill in the options on each tab:
In the General tab, specify what the cursor point looks like at runtime, and whether
the operator can navigate to the cursor point using the keys on the keyboard or
keypad.
16-33
• • • • •
16 • Setting up graphic objects
• • • • •
RSVIEW MACHINE EDITION USER’S GUIDE
In the Numeric tab, set up which pop-up window opens (if any), the ramp value (if
any), minimum and maximum values to send to the data source, decimal point
settings, and display settings.
In the Timing tab, set up the timing and handshake settings for the Enter key.
These settings do not apply when you ramp values. For information about using
Enter key handshaking, see page 16-14.
In the Common tab, specify the object’s spacial properties, name, and visibility.
In the Connections tab, specify the tags or expression with which the numeric
input cursor point exchanges data. For information about assigning tags and
expressions, see page 15-38.
For details about the options in the tabs, see Help.
3. When you are finished, click OK.
Setting up string displays
Use the string display object to show the operator messages from the data source. For
example, you might set up the data source to generate strings that report on the state of a
process or operation, or that provide instructions about what the operator needs to do next.
At runtime the display shows the operator the string value of the Value connection at the
data source.
How values are displayed
If the Value connection is unassigned, the string display is blank.
RSView displays the number of characters (bytes) specified for the tag assigned to the
Value connection.
To set up a string display
1. Double-click the string display.
16-34
2. In the object’s Properties dialog box, fill in the options on each tab:
In the General tab, specify what the string display looks like at runtime.
In the Common tab, specify the string display’s spacial properties, name, and
visibility.
In the Connections tab, specify the tag or expression whose data is displayed. For
information about assigning tags and expressions, see page 15-38.
For details about the options in the tabs, see Help.
3. When you are finished, click OK.
Setting up string input enable buttons
The operator can press the string input enable button to open a string pop-up scratchpad or
keyboard. The operator can enter text in the scratchpad or keyboard, and then send the
string to the data source.
For more information about using the string input enable button at runtime, see page 28-6.
To set up a string input enable button
1. Double-click the string input enable button.
16-35
• • • • •
16 • Setting up graphic objects
• • • • •
RSVIEW MACHINE EDITION USER’S GUIDE
2. In the button’s Properties dialog box, fill in the options on each tab:
In the General tab, specify what the button looks like at runtime, whether the
operator can navigate to the button using the keys on the keyboard or keypad, and
whether the operator can press the button to give it focus.
In the Label tab, specify what text or image to display on the button.
In the String tab, specify the pop-up to open and the number of characters to
accept.
In the Timing tab, set up the timing and handshake settings for the Enter key. For
information about using Enter key handshaking, see page 16-14.
In the Common tab, specify the button’s spacial properties, name, and visibility.
In the Connections tab, specify the tags or expression with which the button
exchanges data. For information about assigning tags and expressions, see
page 15-38.
For details about the options in the tabs, see Help.
3. When you are finished, click OK.
Setting up goto display buttons
Use the goto display button to open a graphic display. You can create as many goto
display buttons as you need, but each button opens a single display only.
16-36
For more information about using goto display buttons, see page 24-4.
To set up a goto display button
1. Double-click the goto display button.
2. In the button’s Properties dialog box, fill in the options on each tab:
In the General tab, specify what the button looks like at runtime, the display to
open, and the parameter file to use, if any.
In the Label tab, specify what text or image to display on the button.
In the Common tab, specify the button’s spacial properties, name, and visibility.
For details about the options in the tabs, see Help.
3. When you are finished, click OK.
Setting up close display buttons
When the operator presses a close display button at runtime, the graphic display that the
button is on closes. You can set up the button to write out a value when the display closes.
For more information about using close display buttons, see page 24-6.
To set up a close display button
1. Double-click the button.
16-37
• • • • •
16 • Setting up graphic objects
• • • • •
RSVIEW MACHINE EDITION USER’S GUIDE
2. In the button’s Properties dialog box, fill in the options on each tab:
In the General tab, specify what the button looks like at runtime, and whether to
write out a value when the display closes.
In the Label tab, specify what text or image to display on the button.
In the Common tab, specify the button’s spacial properties, name, and visibility.
In the Connections tab, specify the tag with which the button exchanges data. For
information about assigning tags, see page 15-38.
For details about the options in the tabs, see Help.
3. When you are finished, click OK.
Setting up display list selectors
The display list selector is a list of graphic displays in the application. Each graphic
display is represented by a different state in the display list selector. An operator can scroll
through the list of displays, and then select the display to open by pressing an enter button
or Enter key.
For more information about using display list selectors, see page 24-6.
To set up a display list selector
1. Double-click the display list selector.
16-38
2. In the object’s Properties dialog box, fill in the options on each tab:
In the General tab, specify what the selector looks like at runtime, its number of
states, whether the operator can navigate to the selector using the keys on the
keyboard or keypad, and whether the cursor wraps from the bottom of the list back
to the top.
In the States tab, specify which graphic display to use for each of the display list
selector’s states, and how each graphic display is named in the list. For tips about
setting up states, see page 16-2.
In the Common tab, specify the display list selector’s spacial properties, name, and
visibility.
For details about the options in the tabs, see Help.
3. When you are finished, click OK.
How to use indicators
Indicators display the status of processes or operations by showing different colors,
captions, or images to reflect different states.
You can create different kinds of indicators to suit your needs:
Multistate indicators display the current state of a process or operation by showing a
different color, caption, or image to reflect different states.
16-39
• • • • •
16 • Setting up graphic objects
• • • • •
RSVIEW MACHINE EDITION USER’S GUIDE
Symbols display a symbol that changes color to indicate the state of a process or
operation. This allows the operator to see the status of a process or operation at a glance.
List indicators display a list of states for a process or operation, and highlight the current
state. Each state is represented by a caption in the list. This type of indicator is useful if
you want operators to view the current state, but also see the other possible states. For
sequential processes, the list can inform the operator about what happens next.
Setting up multistate indicators
The multistate indicator displays the current state of a process or operation by showing a
different color, caption, or image for each state.
The error state
The multistate indicator’s error state is displayed at runtime when:
the Indicator connection is unassigned.
the Indicator connection’s value does not match one of the state values you set up.
the Trigger type is set to Value and the Indicator connection value does not match one
of the state values you set up.
the Trigger type is set to LSB and the position of the least significant bit set in the
Value connection does not match one of the state values you set up.
the Trigger type is set to Value and an array tag has been assigned to the object’s Value
connection.
To set up a multistate indicator
1. Double-click the multistate indicator.
16-40
2. In the object’s Properties dialog box, fill in the options on each tab:
In the General tab, specify what the indicator looks like, and the number of states
for the indicator.
In the States tab, specify how the indicator’s appearance changes when its tag or
expression’s value changes. For tips about setting up states, see page 16-2.
In the Common tab, specify the indicator’s spacial properties, name, and visibility.
In the Connections tab, specify the tag or expression from which the indicator
receives data. For information about assigning tags and expressions, see
page 15-38.
For details about the options in the tabs, see Help.
3. When you are finished, click OK.
Setting up symbols
The symbol is an indicator that displays a single monochrome image that changes color to
match the state of a process or operation. This allows the operator to see the status of a
process or operation at a glance.
The error state
The symbol’s error state is displayed at runtime when:
16-41
• • • • •
16 • Setting up graphic objects
• • • • •
RSVIEW MACHINE EDITION USER’S GUIDE
the Indicator connection is unassigned.
the Indicator connection’s value does not match one of the state values you set up.
the Trigger type is set to Value and the Indicator connection value does not match one
of the state values you set up.
the Trigger type is set to LSB and the position of the least significant bit set in the
Value connection does not match one of the state values you set up.
the Trigger type is set to Value and an array tag has been assigned to the object’s Value
connection.
To set up a symbol
1. Double-click the symbol.
2. In the object’s Properties dialog box, fill in the options on each tab:
16-42
In the General tab, specify what the symbol looks like at runtime, and the number
of states for the symbol.
In the States tab, specify how the symbol’s appearance changes when its tag or
expression’s value changes. For tips about setting up states, see page 16-2.
In the Common tab, specify the symbol’s spacial properties, name, and visibility.
In the Connections tab, specify the tag or expression from which the symbol
receives data. For information about assigning tags and expressions, see
page 15-38.
For details about the options in the tabs, see Help.
3. When you are finished, click OK.
Setting up list indicators
The list indicator displays a list of states for a process or operation, and highlights the
current state.
Each state is represented by a caption in the list. This type of indicator is useful if you
want operators to view the current state, but also see the other possible states.
For sequential processes, the list can inform the operator about what happens next.
The list indicator has no error state. If the value of the Indicator connection does not
match any of the available states, none of the states is highlighted.
To set up a list indicator
1. Double-click the list indicator.
2. In the object’s Properties dialog box, fill in the options on each tab:
16-43
• • • • •
16 • Setting up graphic objects
• • • • •
RSVIEW MACHINE EDITION USER’S GUIDE
In the General tab, specify what the indicator looks like at runtime, and the
number of states for the indicator.
In the States tab, specify how the indicator’s appearance changes when its tag or
expression’s value changes. For tips about setting up states, see page 16-2.
In the Common tab, specify the indicator’s spacial properties, name, and visibility.
In the Connections tab, specify the tag or expression from which the indicator
receives data. For information about assigning tags and expressions, see
page 15-38.
For details about the options in the tabs, see Help.
3. When you are finished, click OK.
How to use bar graphs, gauges, and scales
Bar graphs and gauges display graphical representations of numeric values. The scale is
used with bar graphs to indicate the range of values for the bar graph.
Bar graphs make it easy to compare values
Bar graphs display numeric values in bar graph format. They are useful for allowing
comparisons between multiple values, or for representing the fill levels of tanks for which
a reading on a vertical scale is appropriate.
For example, one bar graph can show the required level of a tank, and a second bar graph
can show the actual level of the tank. The first graph can change to represent the required
level for a particular application, and the second graph changes as the actual level in the
tank rises or drops.
Bar graphs are more useful than numeric displays when it’s important for the operator to
analyze the relationships between numeric values. It’s easier for the operator to see that
one graph is at a lower level than the other, or that one’s fill is blue and the other’s is
yellow, than it is to subtract one numeric value from another.
Thresholds change a bar graph’s fill color
As it fills, a bar graph can change its fill color to help an operator recognize abnormal
conditions. The change in color happens when the tag (or expression) value crosses a
threshold you set up for the graph. For example:
16-44
If the temperature of an oven is lower than required for a recipe, the bar graph can
show the temperature in blue.
If the temperature is in the correct range for the recipe, the bar graph can show the
temperature in green.
If the temperature is higher than the recipe allows, the bar graph can show the
temperature in red.
If you want to use a different fill color on a bar graph to show abnormal conditions, make
sure enough of the new fill color is visible when the abnormal condition occurs that the
operator can see the condition.
Use bar graphs with scales to show limits
Unlike gauges, bar graphs do not have integrated scales. You can show values on a bar
graph using a scale graphic object and text.
Scales consist of major ticks, represented by long lines, and minor ticks, represented by
short lines. To indicate the values of major or minor ticks, use text objects.
Gauges make it easy to see limits
Gauges display numeric values in dial format. They are useful for displaying a value in
relation to its lower and upper limits.
For example, a temperature gauge shows the current temperature in relation to its
minimum and maximum extremes. By looking at the position of the needle on the gauge
(pointing left, up, or right), the operator can tell at a glance whether the temperature is
nearer its lower limit, nearer the middle, or nearer its upper limit.
Gauges are used instead of numeric displays when it’s important for the operator to
recognize an abnormal condition instantly, either from far away when the scale on the
gauge isn’t visible, or before the operator has had the opportunity to determine the exact
reading on the gauge. This characteristic of gauges is one of the reasons why they are used
in automobile instrumentation.
Thresholds change a gauge’s fill color
As the needle sweeps higher on a gauge, the gauge can fill the area behind the needle with
a color. The gauge can change its fill color to help an operator recognize abnormal
conditions. The change in color happens when the tag (or expression) value crosses a
threshold you set up for the gauge. For example:
If the temperature of an oven is lower than required for a recipe, the gauge can show
the temperature in blue.
If the temperature is in the correct range for the recipe, the gauge can show the
temperature in green.
16-45
• • • • •
16 • Setting up graphic objects
• • • • •
RSVIEW MACHINE EDITION USER’S GUIDE
If the temperature is higher than the recipe allows, the gauge can show the temperature
in red.
Some people are color blind to red and green, so don’t rely on color alone to establish meaning.
Setting up bar graphs
Use bar graphs to represent numeric values by filling and emptying the object as the
values rise and fall.
To set up a bar graph
1. Double-click the bar graph.
2. In the object’s Properties dialog box, fill in the options on each tab:
In the General tab, specify what the bar graph looks like at runtime.
In the Common tab, specify the bar graph’s spacial properties, name, and
visibility.
In the Connections tab, specify the tag or expression from which the bar graph
receives data. For information about assigning tags and expressions, see
page 15-38.
For details about the options in the tabs, see Help.
16-46
3. When you are finished, click OK.
Setting up gauges
The gauge graphic object represents numeric values using a needle on a dial.
At runtime, the gauge indicates the value of a tag or expression in relation to the gauge’s
minimum and maximum values.
To set up a gauge
1. Double-click the gauge.
2. In the object’s Properties dialog box, fill in the options on each tab:
In the General tab, specify what the gauge looks like at runtime.
In the Display tab, specify how the gauge displays values at runtime.
In the Common tab, specify the gauge’s spacial properties, name, and visibility.
In the Connections tab, specify the tag or expression from which the gauge
receives data. For information about assigning tags and expressions, see
page 15-38.
For details about the options in the tabs, see Help.
3. When you are finished, click OK.
16-47
• • • • •
16 • Setting up graphic objects
• • • • •
RSVIEW MACHINE EDITION USER’S GUIDE
Setting up scales
Use the scale graphic object to show the possible range of values for a bar graph.
To place value labels on the scale (to create a legend), use text objects. Create the text
objects and then position them next to the tick marks on the scale. Group all the objects
with the bar graph.
To set up a scale
1. Double-click the scale.
2. In the object’s Properties dialog box, fill in the options on each tab:
In the General tab, specify what the scale looks like at runtime.
In the Common tab, specify the scale’s spacial properties, name, and visibility.
For details about the options in the tabs, see Help.
3. When you are finished, click OK.
Setting up control list selectors
Control list selectors allow an operator to scroll through a list of states for a process and
select one of the states. A highlight in the list shows the current state.
A control list selector can show several states at the same time, but only one state can be
selected at a time. As the operator scrolls through the list, each successive state is selected
16-48
automatically. If you want the operator to confirm the selection of a particular state before
the state’s value is written to the programmable controller, create an enter button on the
same display as the control list selector, and select the “Write on enter” option.
The operator can scroll through the control list selector using:
key button graphic objects. These are graphic objects that duplicate the functions of
keyboard keys.
the arrow keys and Enter key on a terminal’s keypad.
the arrow keys and Enter key on a keyboard.
Using buttons with the control list selector
The operator presses the buttons to scroll up or down the list, or to make selections from
the list. The buttons can be set up to work with the control list selector that has input
focus, or you can link the buttons to a specific control list selector.
Use this button
To do this
Backspace
Move the cursor back to the highlighted item in the list.
End
Move to the bottom item in the list.
Enter
Select the item the cursor is pointing to.
Home
Move to the top item in the list.
Move down
Move down one item in the list.
Move up
Move up one item in the list.
Page down
Move down one page in the list.
Page up
Move up one page in the list.
How Enter key handshaking works
When the operator selects a state in the control list selector and presses an enter button or
Enter key, the highlighted state’s value is written to the programmable controller or
device.
You can use Enter key handshaking to hold the value of the tag at the programmable
controller or device for a specific period of time, to ensure the value is read before the
control list selector overwrites the value with a new value.
Enter key handshaking only works if the Write on enter check box is selected (in the
General tab).
16-49
• • • • •
16 • Setting up graphic objects
• • • • •
RSVIEW MACHINE EDITION USER’S GUIDE
For more information about using Enter key handshaking, see page 16-14.
To set up a control list selector
1. Double-click the control list selector.
2. In the object’s Properties dialog box, fill in the options on each tab:
16-50
In the General tab, specify what the selector looks like at runtime, its number of
states, whether to write out a value when the operator presses the Enter key,
whether the operator can navigate to the selector using the keys on the keyboard or
keypad, and whether the cursor wraps from the bottom of the list back to the top.
In the States tab, set up the value and caption for each state. The value defines the
control list selector’s action, by changing the Value connection to the value you
specify when the selected state is in effect. For tips about setting up states, see
page 16-2.
In the Timing tab, set up the timing and handshake settings for the Enter key. For
information about using Enter key handshaking, see page 16-14.
In the Common tab, specify the control list selector’s spacial properties, name, and
visibility.
In the Connections tab, specify the tags or expression with which the control list
selector exchanges data. For information about assigning tags and expressions, see
page 15-38.
For details about the options in the tabs, see Help.
3. When you are finished, click OK.
Setting up piloted control list selectors
Piloted control list selectors allow an operator or remote device to scroll through a list of
states for a process and select one of the states. A highlight in the list shows the current
state.
Choosing between piloted control list selectors and control
list selectors
Piloted control list selectors include the following features that control list selectors do
not:
The states can be selected either by an operator, or remotely, for example by a
programmable controller, or by both an operator and a remote device. Individual states
can be turned off, to prevent them from being selected by either the operator or the
remote device.
Control list selectors do not allow states to be turned off.
The state values of all of the items that are visible in the list can be written to the
Visible States connection when the list scrolls. The Visible States connection must be
a data-server tag that supports arrays. You cannot use an HMI tag.
Control list selectors have no Visible States connection.
The state value of the item at the top of the list can be written to the Top Position
connection when the list scrolls.
Control list selectors have no Top Position connection.
How piloted control list selectors work at runtime
A piloted control list selector can show several states at the same time, but only one state
can be selected at a time.
You can set up the piloted control list selector to be operator-controlled or remotecontrolled by assigning tags or expressions in the Connections tab.
You can also set up individual states to be operator-controlled, remote-controlled, both, or
none. If set to none, the state is turned off.
If the piloted control list selector is set up to be operator-controlled, and the operator
selects a remote-controlled state, or one that is turned off, a hollow cursor is displayed.
16-51
• • • • •
16 • Setting up graphic objects
• • • • •
RSVIEW MACHINE EDITION USER’S GUIDE
The operator can select this state.
The operator cannot select this
state.
Using buttons with the piloted control list selector
When a piloted control list selector is operator-controlled, it works with:
key button graphic objects. These are graphic objects that duplicate the functions of
keyboard keys.
the arrow keys and Enter key on a terminal’s keypad.
the arrow keys and Enter key on a keyboard.
The operator presses the buttons to scroll up or down the list, or to make selections from
the list. The buttons can be set up to work with the piloted control list selector that has
focus, or with a specific piloted control list selector. You can use the buttons listed in the
table on page 16-49.
Selecting items in the list
Each state can be selected directly by an operator, or remotely by a device such as a
programmable controller. The operator or the controller scrolls through the list to select a
different state or a different group of visible states.
When an operator or remote device selects a state, the value assigned to the selected state
is written to the piloted control list selector’s Value connection. If the state is turned off,
the state’s value is not written to the Value connection.
If the operator attempts to select a state that is remote-controlled, the state’s value is not
written to the Value connection.
Scrolling through the list
If the piloted control list selector contains more states than can be displayed in the list
simultaneously, the value of the Top Position connection (if assigned) changes whenever
the item at the top of the list changes.
If the Visible States connection is assigned, the values assigned to all visible states are
written to the Visible States connection whenever the list scrolls. To use this feature, the
assigned tag must support arrays, and the array must be the same length as the number of
16-52
visible states in the piloted control list selector. For information about using array tags, see
page 9-14.
To set up a piloted control list selector
1. Double-click the piloted control list selector.
2. In the object’s Properties dialog box, fill in the options on each tab:
In the General tab, specify what the selector looks like at runtime, its number of
states, whether to write out a value when the operator presses the Enter key,
whether the operator can navigate to the selector using the keys on the keyboard or
keypad, and whether the cursor wraps from the bottom of the list back to the top.
In the States tab, set up the value and caption for each state. Also specify whether
each state can be selected, and by whom. For tips about setting up states, see
page 16-2.
In the Timing tab, set up the timing and handshake settings for the Enter key. For
information about using Enter key handshaking, see page 16-14.
In the Common tab, specify the piloted control list selector’s spacial properties,
name, and visibility.
16-53
• • • • •
16 • Setting up graphic objects
• • • • •
RSVIEW MACHINE EDITION USER’S GUIDE
In the Connections tab, specify the tags or expression with which the piloted
control list selector exchanges data. For information about assigning tags and
expressions, see page 15-38.
For details about the options in the tabs, see Help.
3. When you are finished, click OK.
Setting up local message displays
Use local message displays to provide the operator with information about what to do
next, or with information about a process. At runtime, the local message display shows
one message at a time.
To use local messages, create a local message display object in a graphic display, and then
assign a local message file to the local message display object.
For more information about local messages, see page 14-29.
If no message exists for the trigger value that matches the value of the Value connection,
the display is filled with question marks (?).
To set up a local message display
1. Double-click the local message display.
2. In the object’s Properties dialog box, fill in the options on each tab:
16-54
In the General tab, specify what the local message display looks like at runtime
and which local message file to use.
In the Common tab, specify the local message display’s spacial properties, name,
and visibility.
In the Connections tab, specify the tag or expression with which the local message
display exchanges data. For information about assigning tags and expressions, see
page 15-38.
For details about the options in the tabs, see Help.
3. When you are finished, click OK.
Setting up macro buttons
Macro buttons run macro files that assign values to tags when the button is pressed.
For information about creating macros, see Chapter 22.
To set up a macro button
1. Double-click the button.
2. In the button’s Properties dialog box, fill in the options on each tab:
In the General tab, specify what the button looks like at runtime, and the macro to
run when the button is pressed.
16-55
• • • • •
16 • Setting up graphic objects
• • • • •
RSVIEW MACHINE EDITION USER’S GUIDE
In the Label tab, specify what text or image to display on the button.
In the Common tab, specify the button’s spacial properties, name, and visibility.
For details about the options in the tabs, see Help.
3. When you are finished, click OK.
Setting up time and date displays
A time and date display shows the current time and date in a graphic display.
To set up a time and date display
1. Double-click the time and date display.
2. In the object’s Properties dialog box, fill in the options on each tab:
In the General tab, specify what the time and date display looks like at runtime.
In the Common tab, specify the time and date display’s spacial properties, name,
and visibility.
For details about the options in the tabs, see Help.
3. When you are finished, click OK.
16-56
Setting up print alarm history buttons
The operator can press the print alarm history button to print a report of all the alarm
messages in the alarm log file. The report can include the time alarms occurred and were
acknowledged.
For information about the alarm log file, see page 9-9.
To set up a print alarm history button
1. Double-click the button.
2. In the button’s Properties dialog box, fill in the options on each tab:
In the General tab, specify what the button looks like at runtime.
In the Label tab, specify what text or image to display on the button.
In the Print tab, specify what information to print on the report.
In the Common tab, specify the button’s spacial properties, name, and visibility.
For details about the options in the tabs, see Help.
3. When you are finished, click OK.
Setting up print alarm status buttons
The operator can press the print alarm status button to print a report of the status of alarms
that have been defined for the application (in the Alarm Setup editor). The report can
16-57
• • • • •
16 • Setting up graphic objects
• • • • •
RSVIEW MACHINE EDITION USER’S GUIDE
include all alarms, active alarms only, or only alarms that have been active since the alarm
status was last reset. The report can include how many times each alarm was triggered,
and the accumulated time in alarm.
To set up a print alarm status button
1. Double-click the button.
2. In the button’s Properties dialog box, fill in the options on each tab:
In the General tab, specify what the button looks like at runtime.
In the Label tab, specify what text or image to display on the button.
In the Print tab, specify what information to print on the report.
In the Common tab, specify the button’s spacial properties, name, and visibility.
For details about the options in the tabs, see Help.
3. When you are finished, click OK.
Setting up alarm lists
The alarm list graphic object displays a list of alarms from the alarm log file. It can show
all the alarms in the alarm log file, or any combination of active, inactive, acknowledged,
and unacknowledged alarms. It can also show the alarms for specific alarm triggers.
16-58
You can assign a tag or expression to the ActiveAcknowledged, ActiveUnacknowledged,
InactiveAcknowledged, or InactiveUnacknowledged connections, to allow the data source
to control the type of alarms to display in the list. When one of the connection’s values is
a non-zero value, the related type of alarm is displayed in the alarm list. The connection
value overrides the setting for the list in the Alarm List Properties dialog box.
RSView comes with two graphic displays, [ALARM MULTI-LINE] and [HISTORY],
that contain alarm list objects. The [HISTORY] display comes in two sizes. These
displays are in the graphic library. You can copy the library displays into your application
and use the displays and objects as is, customize them, or create your own.
For more information about using alarm lists, see page 9-31. For information about the
alarm log file, see page 9-9.
To set up an alarm list
1. Double-click the alarm list.
2. In the object’s Properties dialog box, fill in the options on each tab:
In the General tab, specify what the alarm list looks like at runtime, whether the
operator can navigate to the list using a keyboard, and how scrolling works for the
list.
In the Alarm tab, specify the columns to include in the list, the number of lines per
alarm, and the triggers to filter by, if any.
16-59
• • • • •
16 • Setting up graphic objects
• • • • •
RSVIEW MACHINE EDITION USER’S GUIDE
In the Display tab, specify the types of alarms to display in the list, and the
appearance of the different alarm conditions.
In the Common tab, specify the alarm list’s spacial properties, name, and visibility.
In the Connections tab, specify the tags or expressions to use to control the type of
alarms to display in the list. The use of these connections is optional.
For details about the options in the tabs, see Help.
3. When you are finished, click OK.
Setting up alarm banners
The alarm banner graphic object displays a single unacknowledged alarm message. For
example, the banner could display a message that warns the operator that the pressure in a
boiler is too high.
The [ALARM] display and the [ALARM BANNER] graphic library both contain an
alarm banner object. You can use the displays and objects as is, customize them, or create
your own. For more information about using alarm banners, see page 9-33.
To set up an alarm banner
1. Double-click the alarm banner.
2. In the object’s Properties dialog box, fill in the options on each tab:
16-60
In the General tab, specify what the banner looks like at runtime and whether the
operator can navigate to the banner using the keys on the keyboard or keypad.
In the Alarm tab, set up whether to queue alarms, whether to display all alarms or
active alarms only, and which alarms to include in a filtered trigger list.
In the Common tab, specify the alarm banner’s spacial properties, name, and
visibility.
For details about the options in the tabs, see Help.
3. When you are finished, click OK.
Setting up alarm status lists
The alarm status list graphic object displays the status of alarms, including how many
times an alarm has been triggered and how long it has been active. For example, the list
could display an alarm that has been triggered 5 times for a total accumulated time in
alarm of 10 minutes.
The operator can view the status list in three different modes:
All alarms—displays the status of all alarms that have been defined in the Alarm
Setup editor.
Active alarms—displays the status of all the alarms that are currently active.
Past alarms—displays the status of all the alarms that have been active since the alarm
status has been reset.
The operator can press the alarm status mode button to cycle through the different modes.
If desired, you can set up the alarm status list to show alarms for specific alarm triggers
only.
RSView comes with a library graphic display called [STATUS] that contains an alarm
status list object, alarm status mode button, and other buttons for working with the list.
You can use the display and objects as is, customize them, or create your own.
For more information about using alarm status lists, see page 9-34.
To set up an alarm status list
1. Double-click the alarm status list.
16-61
• • • • •
16 • Setting up graphic objects
• • • • •
RSVIEW MACHINE EDITION USER’S GUIDE
2. In the object’s Properties dialog box, fill in the options on each tab:
In the General tab, specify what the alarm status list looks like at runtime, whether
the operator can navigate to the list using a keyboard, and how scrolling works for
the list.
In the Alarm tab, specify the columns to include in the list, the number of lines per
alarm, and the triggers to filter by, if any.
In the Common tab, specify the alarm status list’s spacial properties, name, and
visibility.
For details about the options in the tabs, see Help.
3. When you are finished, click OK.
Setting up diagnostics lists
The diagnostics list graphic object displays runtime information about system activity:
Information messages, such as messages about tag assignments, tag read and write
activity, and macro usage.
These are system-generated information messages. They are not the same messages as
the information messages you create and display in the information message display
object.
16-62
Warning messages.
Error messages, such as messages about communication errors, invalid values, and
unassigned connections.
Audit messages about tag writes and tag write failures.
RSView comes with a default graphic display called [DIAGNOSTICS] that contains a
diagnostics list object. You can use the display and object as is, customize them, or create
your own.
For more information about using diagnostics lists, see page 10-11.
To set up a diagnostics list
1. Double-click the diagnostics list.
2. In the object’s Properties dialog box, fill in the options on each tab:
In the General tab, specify what the list looks like at runtime, whether the operator
can navigate to the list using the keys on the keyboard or keypad, and whether the
cursor wraps from the bottom of the list back to the top.
In the Common tab, specify the diagnostics list’s spacial properties, name, and
visibility.
For details about the options in the tabs, see Help.
3. When you are finished, click OK.
16-63
• • • • •
16 • Setting up graphic objects
• • • • •
RSVIEW MACHINE EDITION USER’S GUIDE
Setting up information message displays
The information message display graphic object gives the operator runtime messages
about information that requires immediate attention.
RSView comes with a default graphic display called [INFORMATION] that contains an
information message display object. You can use the display and object as is, customize
them, or create your own.
For more information about using information message displays, see page 12-8.
To set up an information message display
1. Double-click the information message display.
2. In the object’s Properties dialog box, fill in the options on each tab:
In the General tab, specify what the information message display looks like at
runtime.
In the Common tab, specify the information message display’s spacial properties,
name, and visibility.
For details about the options in the tabs, see Help.
3. When you are finished, click OK.
16-64
17 Animating graphic objects
This chapter describes:
the types of animation and which objects support which types of animation.
using the Animation dialog box.
testing animation.
using tag names, tag placeholders, and expressions when attaching animation.
setting the minimum and maximum values for animation that uses a range of motion.
using Object Smart Path to define an object’s range of motion.
setting up each type of animation.
applying animation to groups.
checking what kind of animation is attached to an object.
copying and pasting animation.
setting up animation for global objects.
Types of animation
Animation associates graphic objects with tags so the appearance or position of an object
changes to reflect changes to the tag’s value. For example, an object’s color could change
from yellow to orange to red as the tag’s value increases. Or a slider could move from left
to right as a tag’s value increases.
You can use these types of animation:
color
fill
height
horizontal position
horizontal slider
rotation
vertical position
vertical slider
visibility
17-1
• • • • •
RSVIEW MACHINE EDITION USER’S GUIDE
width
The Objects 5 Screen Demo sample application contains many examples of animation. In
particular, see the graphic displays called “Animation I” and “Animation II.”
Which objects can have which types of animation?
This table summarizes which types of objects support which types of animation. For
information about the different types of graphic objects, see page 15-1.
These objects
Support these types of animation
Drawing objects, except images, panels, and
rounded rectangles
All types
Rounded rectangles
All types except rotation
All other objects
Visibility
You can also attach animation to groups of drawing objects. For more information, see
page 17-14.
You can attach as many types of animation to a drawing object (except images and panels)
as you like. For example, apply width, height, horizontal position, and vertical position
animation to an object to give it the appearance of moving into or out of the display as it
shrinks and grows.
Using the Animation dialog box
To attach animation, use the Animation dialog box.
To open the Animation dialog box, do one of the following
17-2
Select an object, and then on the View menu click Animation.
Select an object, and then on the Animation menu click an animation type. Animation
types that are not supported for the selected object are unavailable.
Right-click an object, select Animation, and then click an animation type. Animation
types that are not supported for the selected object are unavailable.
View menu
Animation menu
17-3
• • • • •
17 • Animating graphic objects
• • • • •
RSVIEW MACHINE EDITION USER’S GUIDE
About the Animation dialog box
The Animation dialog box is a floating dialog box, which means you can keep it open all
the time and move it around the screen. While it’s open you can select other objects and
open other dialog boxes.
Animation tabs
Expression range
Expression box
Animation result
For details about the parts of the Animation dialog box, see Help.
Using Object Smart Path to visually set animation
Because the Animation dialog box stays open, you can go back and forth between the
dialog box and the graphic display. This makes it easy to set the range of motion for an
object because you do not have to know how many pixels you want an object to move.
Instead, you can set the range of motion visually using the Object Smart Path feature. For
details, see page 17-7.
17-4
Testing animation
Test Display tool
To test the animation you have set up in a graphic display, use the Test Display tool to
switch to test mode. When you are finished testing, switch back to edit mode to continue
editing.
To switch between test and edit modes
Edit Display tool
1. On the View menu, click Test Display or Edit Display, or click the Test Display and
Edit Display tools.
Test mode is not the same as running the display. Test mode does not change the
appearance or position of the display as set up in the Display Settings dialog box.
Using tag names and tag placeholders
When setting up animation for objects, you are linking objects to tags, so you have to
specify a tag name or tag placeholder. Following is a brief description of how to use tag
names and placeholders.
Tag names
You can use HMI tags or data server tags that already exist, or you can use a new tag
name.
Tag placeholders
Tag placeholders allow you to create displays that can be used with different tags.
You can use tag placeholders in:
the graphic display that opens when the application is first run.
graphic displays that are opened using a goto display button.
graphic displays that are opened using a display list selector.
Use parameter files to specify which tags to substitute for which placeholders. For
information about using parameter files, see page 14-25.
The tag placeholder can replace any part of a tag name, including folder names. For
example, you could create a parameter file specifying that the tag placeholder
#1=Folder1. You could assign the folder and a tag name to a graphic object’s connection:
#1\Tag1.
To create a tag placeholder
1. In the Expression box, type the cross-hatch character followed by a number (no space
in between). For example, #1.
17-5
• • • • •
17 • Animating graphic objects
• • • • •
RSVIEW MACHINE EDITION USER’S GUIDE
Using expressions
Many types of animation can be achieved using expressions. You can use expressions
containing tag values, constants, mathematical equations, security functions, and if-thenelse logic. A tag name or tag placeholder can be included as part of an expression, or it
can stand alone as the entire expression.
For more information about expressions, see Chapter 20.
Setting minimum and maximum values
Many types of animation require a minimum and maximum range for the tag or
expression. These values determine the start and end points for a range of motion.
For example, if you specify a minimum of 0 and a maximum of 100, the object will not
react to values outside of this range. So, even if the expression has a value of 200, the
object does not change from its “At maximum” position.
When setting up animation, select one of these methods for calculating the minimum and
maximum values:
Use tag’s min and max property values—select this method to use the minimum and
maximum values of the first HMI tag in the expression. If more than one HMI tag is
used in the expression, the first HMI tag’s minimum and maximum values are used.
For analog HMI tags, the values are taken from the Minimum and Maximum boxes in
the Tags editor. For digital tags, the minimum is 0 and the maximum is 1.
Browse button
Use constant—select this method to use numeric constants. Type the minimum and
maximum values in the boxes.
Read from tags—select this method to read two tags’ values to determine the
minimum and maximum values. Type the tag names in the boxes, or click the Browse
buttons to open the Tag Browser and select the tags.
If you use this method, the tags are read when the graphic display opens. Their values
at that time are used for the minimum and maximum values. The tags are not read
again after this.
Defining a range of motion
To define a range of motion for an object, do one of the following:
Use the mouse to move the object in the display. This uses the Object Smart Path
feature to visually define the range of motion.
Type values in the At minimum and At maximum boxes.
Motion can be defined in pixels, percentages, or degrees.
17-6
Animation that does not use a range of motion
Visibility and color animation do not use a range of motion, because these types of
animation represent a change of state, not a range of values.
Using Object Smart Path
With Object Smart Path, you can easily set the range of motion for an object. The
following example shows how Object Smart Path works.
Example: Using Object Smart Path to define the range of motion
for horizontal slider animation
To define a range of motion for a slider object
1. In the Graphics editor, create a slider object using a line and a rectangle, or copy a
slider object from the Sliders graphic library.
2. Open the Animation dialog box and click the Horizontal Slider tab.
3. In the display, select the rectangle in the slider object.
4. In the Tag box of the Animation dialog box, specify a tag name.
17-7
• • • • •
17 • Animating graphic objects
• • • • •
RSVIEW MACHINE EDITION USER’S GUIDE
5. In the display, drag the rectangle to the position that will indicate the lowest number in
the range.
6. In the Animation dialog box, set this position by clicking the At minimum check box.
7. In the display, drag the rectangle to the position that will indicate the highest number
in the range.
8. In the Animation dialog box, set this position by clicking the At maximum check box.
9. To save the settings, click Apply.
When you finish setting up the animation, the rectangle returns to its original position.
Setting up the different types of animation
This section describes the different types of animation and provides tips and examples for
setting up animation.
Setting up visibility animation
With visibility animation, an object becomes visible or invisible based on a tag value or
the result of an expression.
If an object is invisible, it is inactive.
17-8
Visibility animation is available for all objects. Visibility animation overrides an object’s
Visible property.
If you use a tag’s value to control visibility animation as well as in an expression to control some
other aspect of animation, when you set up visibility, set the Expression true state to “Invisible.” If
you do not do this, the object could appear briefly in its design-time location and orientation
before animating properly.
For more information about setting up visibility animation, see Help.
Example: Using visibility animation to set up security for a graphic
display
This example shows how to use visibility animation to control what operators can see. In
a graphic display that all users have access to, only the Admin user can see the graphic
object to which this animation is attached.
This example uses the security function CurrentUserName( ). The function returns the
string value of the Account ID (user name) for the user who is currently logged in.
The CurrentUserName( ) function is case sensitive. All user names use uppercase letters,
so make sure that you use uppercase letters in your expression.
To specify which user can view an object in a display
1. Select the object to limit visibility to.
2. Open the Animation dialog box and click the Visibility tab.
3. In the Expression box, type this:
CurrentUserName( ) == “ADMIN”
4. For the Expression true state, click Visible.
5. Click Apply, and then click Close.
At runtime, the object is visible only if the Admin user is logged in.
Setting up color animation
With color animation, an object changes color based on a tag value or the result of an
expression. You can specify up to 16 color changes (A to P) for any object. Colors can be
solid or blinking. For each color change, specify the value or threshold at which the color
is to change and specify the colors to change to. At runtime, when the value reaches or
crosses the threshold, the color changes.
17-9
• • • • •
17 • Animating graphic objects
• • • • •
RSVIEW MACHINE EDITION USER’S GUIDE
Color animation is available for all drawing objects except images and panels.
For more information about setting up color animation, see Help.
Example 1: Creating a text object that blinks
This example describes how to create a text object that constantly blinks between two
colors. Since the blinking is not based on changes in tag values, the expression is simply a
constant value that matches the value for the selected threshold.
For details about creating text, see page 15-14.
1. Select the text object.
2. Open the Animation dialog box, and then click the Color tab.
3. In the Expression box, type 0.
Zero is the default value for threshold A.
4. In the list box, click threshold A. (Leave the value in the Value box as 0.)
5. For the foreground color, click Blink. (If desired, click Blink for the background color
too.)
6. For each color, click the color box, and then click the color to use.
7. Click Apply.
Example 2: Creating an object that changes color as the fill level
changes
This example describes how to create a rectangle object that changes color as the object’s
fill level increases. This example uses a tag called Hopper1\FlourLevel. The tag has a
range of 1 to 100. When the flour level reaches 80, the rectangle blinks between gray and
yellow to warn the operator that the hopper is nearly full. When the flour level reaches 95,
the rectangle blinks between gray and red.
You could use a bar graph object (without animation) to achieve a similar result.
1. Double-click the rectangle to open the Polygon Properties dialog box. Assign these
properties to the rectangle:
17-10
In the Back style box, select Solid.
For the Fore color and Back color, select gray.
2. Click OK to close the Polygon Properties dialog box.
3. With the rectangle selected, open the Animation dialog box, and then click the Fill tab.
4. Attach fill animation as follows:
In the Expression box, type Hopper1\FlourLevel (this is the tag that monitors the
fill level).
For Fill Direction, click Up.
5. Click the Color tab, and then attach color animation as follows:
In the Expression box, type Hopper1\FlourLevel (the same tag that was used in the
Fill tab).
Set up the color for the normal state
In the list box, click A. (In the Value box, leave the value as 0.)
For foreground and background colors, click Solid.
For each, click the color box, and then click gray (the same gray used for the
rectangle).
Set up the color for the first warning
In the list box, click B.
In the Value box, type 80.
For foreground and background colors, click Blink.
Yellow
Gray
For the foreground colors, select gray for the first color and yellow for the second
color. Repeat for the background colors.
Set up the color for the second warning
In the list box, click C.
In the Value box, type 95.
For the foreground and background colors, click Blink.
17-11
• • • • •
17 • Animating graphic objects
• • • • •
RSVIEW MACHINE EDITION USER’S GUIDE
Red
Gray
For the foreground colors, select gray for the first color and red for the second
color. Repeat for the background colors.
6. Click Apply.
Setting up fill animation
With fill animation, the level of fill in an object is based on a tag value (or the result of an
expression) in relation to the specified minimum and maximum values. For example, if
the value of the expression is halfway between the minimum and maximum values, the
object will be half full.
Fill animation is available for all drawing objects (including group objects) except images
and panels.
If you select the Inside Only check box, fill animation does not affect objects’ borders,
line objects, or objects with transparent backgrounds.
For more information about setting up fill animation, see Help.
Setting up horizontal position animation
With horizontal position animation, an object moves horizontally based on a tag value (or
the result of an expression) in relation to the specified minimum and maximum values.
For example, if the value of the expression is halfway between the minimum and
maximum values, the object will be halfway between its minimum and maximum pixel
offset.
Horizontal position animation is available for all drawing objects except images and
panels.
For more information about setting up horizontal position animation, see Help.
Setting up vertical position animation
With vertical position animation, an object moves vertically based on a tag value (or the
result of an expression) in relation to the specified minimum and maximum values. For
17-12
example, if the value of the expression is halfway between the minimum and maximum
values, the object will be halfway between its minimum and maximum offset.
Vertical position animation is available for all drawing objects except images and panels.
For more information about setting up vertical position animation, see Help.
Setting up width animation
With width animation, an object’s width changes based on a tag value (or the result of an
expression) in relation to the specified minimum and maximum values. For example, if
the value of the expression is halfway between the minimum and maximum values, the
object’s width will be halfway between its minimum and maximum percentage.
Width animation is available for all drawing objects except images and panels.
For more information about setting up width animation, see Help.
Setting up height animation
With height animation, an object’s height changes based on a tag value (or the result of an
expression) in relation to the specified minimum and maximum values. For example, if
the value of the expression is halfway between the minimum and maximum values, the
object’s height will be halfway between its minimum and maximum percentage.
Height animation is available for all drawing objects except images and panels.
For more information about setting up height animation, see Help.
Setting up rotation animation
With rotation animation, an object rotates around an anchor point based on a tag value (or
the result of an expression) in relation to the specified minimum and maximum values.
For example, if the value of the expression is halfway between the minimum and
maximum values, the object will rotate half the specified amount.
Rotation animation is available for all drawing objects except images, panels, and rounded
rectangles. If you apply rotation animation to text, the text rotates around the anchor point
but remains in the upright position.
For more information about setting up rotation animation, see Help.
Setting up horizontal slider animation
With horizontal slider animation, you can use a drawing object to set the value of a tag. To
do this, define a path for the object. At runtime, when the operator moves the object
horizontally (using a mouse), the pixel position of the object is translated into values that
are written to the tag. If the tag value is changed externally, the position of the slider
changes as well.
17-13
• • • • •
17 • Animating graphic objects
• • • • •
RSVIEW MACHINE EDITION USER’S GUIDE
An object can have both vertical and horizontal slider animation.
Horizontal slider animation is available for all drawing objects except images and panels.
For more information about setting up horizontal slider animation, see Help.
Tips
Here are some tips for creating slider objects:
The Sliders graphic library contains several slider objects you can drag and drop into
your graphic displays. Attach slider animation to the button portion of the slider
object.
If you create your own slider object, it’s useful to draw an object (for example, a line)
to represent the path the slider will move along.
Setting up vertical slider animation
With vertical slider animation, you can use a drawing object to set the value of a tag. To
do this, define a path for the object. At runtime, when the operator moves the object
vertically (using a mouse), the pixel position of the object is translated into values that are
written to the tag. If the tag value is changed externally, the position of the slider changes
as well.
An object can have both vertical and horizontal slider animation.
Vertical slider animation is available for all drawing objects except images and panels.
For tips about creating slider objects, see the previous section.
For more information about setting up vertical slider animation, see Help.
Applying animation to groups
You can apply animation to objects and then group those objects and apply animation to
the group. When the display is running, animation is applied as follows:
These types of animation
Are applied like this
Color
Animation attached to individual objects within the group
overrides group animation.
Fill
Animation results for both the individual objects and the group are
applied.
Horizontal slider, vertical slider Group animation overrides animation attached to individual
objects within the group.
17-14
These types of animation
Are applied like this
Height, width, horizontal
position, vertical position, and
rotation
Animation results for individual objects and the group are
combined. For example, if an individual’s horizontal position
animation result is to offset the object by 100 pixels, and the
group’s result is to offset the group by 200 pixels, the individual
object is offset by 300 pixels.
Visibility
When the group’s animation visibility is False (the group is not
visible), then no objects in the group are visible, regardless of the
animation status of the individual objects.
When the group’s animation visibility is True (the group is visible),
the visibility of an object within the group is determined by the
individual object animation.
Test your animation to ensure you achieve the intended results.
To apply animation to objects within groups, use the group edit feature. For details, see
page 15-50.
Checking the animation on objects
To see what type of animation has been set up for an object or group of objects, use the
Object Explorer, the Animation menu, or the Animation dialog box.
For information about using the Object Explorer to highlight objects that have animation
attached, see page 15-27.
To see what type of animation has been set up for objects within a group, use the group
edit feature or the Object Explorer. For information about using the group edit feature, see
page 15-50.
To view the animation on an object using the Animation menu
1. Select an object.
2. View the animation by doing one of the following:
Click the Animation menu and see which items have a check mark.
Right-click the object and then select Animation to see which items have a check
mark.
To view the animation on an object using the Animation dialog
box
1. Select an object.
2. On the View menu, click Animation.
17-15
• • • • •
17 • Animating graphic objects
• • • • •
RSVIEW MACHINE EDITION USER’S GUIDE
When the Animation dialog box opens, look at which tabs have check marks on them
to see which types of animation have been set up.
Copying or duplicating objects with animation
You can copy or duplicate objects that have animation attached to them. When you do, the
animation attached to the objects is also copied or duplicated. If you copy or duplicate a
group, the copy of the group can be ungrouped to individual objects, just like the original.
For information about copying and duplicating objects, see pages 15-44 and 15-45.
Copying animation without copying objects
If you have attached animation to an object, you can copy the animation and paste it onto
another object. If the object has more than one type of animation, all animation is copied
and pasted. Note that you can only copy animation to an object that supports the same
type of animation.
To copy and paste animation
1. Select the object that has the animation you want to copy.
2. On the Edit menu, click Copy Animation, or right-click the object and then click Copy
Animation.
17-16
3. Select the objects to copy the animation to.
4. On the Edit menu, click Paste Animation.
To paste to a single object, you can right-click the object and then click Paste
Animation.
Setting up animation for global objects
RSView global objects allow you to link the appearance and behavior of a graphic object
to multiple copies of that object. When the original base object is updated, the changes are
automatically applied to all the copies of the object. For information about creating base
objects, see page 14-14.
The copies of the object are called reference objects, and they have the same properties as
the original base object. If desired, you can assign unique animation to the reference
object. For information about creating reference objects, see page 15-24.
The LinkAnimation property determines whether the reference object uses the base
object’s animation.
To set up animation for a reference object
1. Double-click the reference object to open the Property Panel.
2. Select the LinkAnimation property setting to use:
Do not link—allows you to set up separate animation for the reference object.
Link with expressions—the reference object uses the animation and tags or
expressions assigned to the base object.
Link without expressions—allows you to use only the types of animation set up
for the base object, but assign different tags or expressions to the reference object.
3. If you selected Do not link or Link without expressions, set up animation for the
object using the methods described in this chapter.
For more information about working with reference objects, see page 16-3.
17-17
• • • • •
17 • Animating graphic objects