1
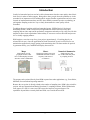
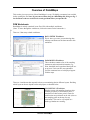
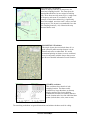
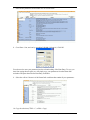
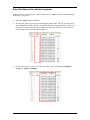
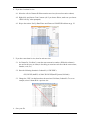
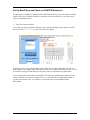
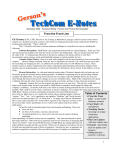
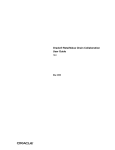
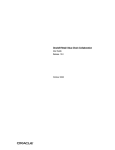
Data2Maps (D2M)
a custom Excel tool for
displaying your monitoring data
User Guide
USEPA Region 5
rev. July 27, 2009
Table of Contents
Introduction.......................................................................................................................... i
Overview of Data2Maps ..................................................................................................... 1
D2M Worksheets ........................................................................................................ 1
Entering Data .............................................................................................................. 3
Querying Data............................................................................................................. 3
Viewing Results .......................................................................................................... 4
STEP-BY-STEP: How to Use Data2Maps ......................................................................... 5
Setting Excel’s Security Level and Opening D2M..................................................... 5
Entering Data .............................................................................................................. 6
Customizing Parameter Information........................................................................... 7
Querying Data............................................................................................................. 8
Viewing Maps/Charts ................................................................................................. 9
Exporting................................................................................................................... 10
Printing...................................................................................................................... 12
STEP-BY-STEP: How to Set-Up D2M for Your Project................................................. 13
Checklist before You Start........................................................................................ 13
Enter Parameter Information..................................................................................... 14
Enter Site Names with Latitude/Longitudes ............................................................. 19
Set Up Data Filters and Charts on CHARTS Worksheet ......................................... 22
Set Up Embedded Charts in MAP OPTIONS 1 and 2.............................................. 28
Re-Define Excel Names............................................................................................ 31
Modify VBA Code.................................................................................................... 37
Define Minimum/Maximum Dates for Charts.......................................................... 40
Align Maps with Sampling Locations ...................................................................... 42
Appendix A: Troubleshooting and Tips ........................................................................... 55
Appendix B: Creating Maps for Data2Maps .................................................................... 57
Introduction
Locally-led watershed projects need to be able to demonstrate what the water quality data of their
local area is in order to attract support. Being able to show people where the problems are in the
watershed is an important tool for building public support. Smaller organizations tend to be more
focused on implementation and may not have the available personnel expertise or technology to
pull together sampling results in a way to clearly demonstrate the water quality of their
watershed.
To address this need, working with local watershed groups, USEPA Region 5 developed
Data2Maps (D2M). D2M is a custom Excel application in which users can overlay their
sampling data on static maps and do preliminary assessment and analyses. By using Excel for this
template it allows local organizations without many IT resources to assess their data and present
it in a visually engaging manner.
D2M requires a one-time set up for a given project (approximately 1-2 working days by an
advanced Excel user). Once the application has been customized, a basic-level Excel user can
maintain the application by simply pasting in the monitoring data. The data can then be queried
by parameter and by year, and D2M will display the results as:
Maps
Charts
Numerical Summaries
Maps/images provide
geographic context while
color-coded sampling locations
show how often a standard has
been exceeded
Histograms of data, along with
standard/threshold line to show
frequency and extent of
exceedances
Simple statistics and
list of individual data points
by sampling location.
The outputs can be printed directly from D2M or pasted into other applications (e.g., PowerPoint,
MSWord) for outreach and reporting materials.
Because the set-up time is directly related to the number of sampling sites, D2M is best suited for
projects with pre-determined and limited (less than 15) sampling locations. While D2M mimics
some aspects of a GIS, it is not a true GIS because the maps are not georeferenced. For
capabilities beyond those currently built into D2M, a user would still need GIS.
i
Overview of Data2Maps
This section gives an overview of how Data2Maps is set up. We highly recommend you read this
before opening the file. Note: If you want to follow along in a Data2Maps file, first go to Pg. 5
for directions on how to avoid Excel security problems when you open the file.
D2M Worksheets
Data2Maps is entirely contained in one Excel file with multiple worksheets.
(Note: To move through the worksheets, click on the names on the bottom tabs.)
There are 2 data entry related worksheets:
DATA ENTRY Worksheet
This is where you enter your monitoring data.
All maps and charts use the data entered in this
worksheet.
PARAM INFO Worksheet
This worksheet contains a list of the sampling
parameters and associated information (e.g.,
units, threshold) and is populated during the setup process. Users can also enter parameterspecific comments here to be displayed appear
with the maps
There are 4 worksheets that map and/or chart your monitoring data in different layouts. Deciding
which layout to choose depends on the end purpose, as detailed below.
MAP OPTION 1 Worksheet
Displays a map with sampling locations colorcoded by frequency of exceedances above a
standard for a chosen time period. Charts for
each location are positioned on the side (close to
the sampling point on the map for easy
association). This can be very helpful as a
hardcopy handout at a meeting.
1
Overview of Data2Maps
MAP OPTION 2 Worksheet
Charts are displayed directly on map next to the
associated sampling location. The charts show the
standard/threshold line, but are stripped of labeling
info. These charts are only meant to give a rough sense
of frequency and extent of exceedances. In this
example, it shows that conductivity is significantly
above the standard near sites 6 and 7 (near a road salt
storage area!). This layout is recommended if user has
few sampling locations (<10). Otherwise the map
becomes hard to read.
MAP OPTION 3 Worksheet
This simple layout does not include charts. It is a
good option for public meetings because it is the
cleanest and easiest to understand. We would
recommend printing out charts (see next worksheet)
to use in conjunction with this map so that you can
provide more detailed information on each location.
CHARTS worksheet
This worksheet shows details of each
sampling location. The charts on this
worksheet are larger than those on the map
displays and have the clearest labeling.
Underneath each chart are summary statistics
for the location and a list of the individual data
points (includes date, value, storm events).
The remaining worksheets are general instructions and admin worksheets used for coding.
Overview of Data2Maps
2
Entering Data
During the set-up process, the column headings in the Data Entry worksheet will be labeled with
your sampling parameters. You enter your data directly into this worksheet whenever you get a
new set of data. Every time you run a data query, all the maps and charts are refreshed with the
data entered in this spreadsheet.
* This spreadsheet was not designed to be a database for storing sampling data and only contains
information necessary for running D2M. Because it does not include fields for quality assurance
or other metadata, you should use a separate database for data management and then import into
D2M for visual display and output.
Querying Data
To query your data by parameter and year, follow the instructions in the left blue section of any
of the Maps or Chart worksheets.
When you click the Refresh Charts/Maps button in the final step, the map and charts will be
refreshed using the data query results.
Note: Running a query from any of the worksheets will refresh the maps and charts in all
the worksheets.
3
Overview of Data2Maps
Viewing Results
After you have gone through the steps above, all the D2M maps and chart worksheets will display
your query results. Here are the four components for each map layout:
2
4
4
1
3
[1] Map with sampling locations color-coded by how often the standard was exceeded during the
time period you specified.
Red
Yellow
Green
> 1 exceedance at this location
1 exceedance at this location
No exceedances at this location
[2] Choice of which map you want to use to view your sampling locations ( in the template
provided “Show Map” is the example seen above, “Show Image” is an aerial photo and “show
Municip” uses the map and delineates municipal boundaries.)
[3] Comments/caveats specific to a parameter
[4] Charts for each of the sampling locations are displayed on all of the map/chart worksheets,
except for Map Option 3. The charts include a bar to indicate the user-defined standard/threshold.
Overview of Data2Maps
4
STEP-BY-STEP: How to Use Data2Maps
This chapter will guide you step-by-step through how to open your D2M file, enter data, query by
parameter and year, change your map displays, and print/export your output. These steps only
require a basic knowledge of Excel and assume that your D2M file has already been customized
for your project.
Setting Excel’s Security Level and Opening D2M
Before opening a D2M file, you will need to set your Excel security level setting to “medium”.
D2M was developed using macros and VBA(Excel’s programming language); a high security
setting will not allow these macros to run and will prevent the system from working.
1. In Excel, go to Tools, select Macro, then select Security.
2. Make sure medium is selected, and click OK.
3. If you changed the security setting, you will need to close your Excel application and
reopen it for the security level to be applied.
4. Go to File > Open and navigate to your customized D2M file. If it has not been created
yet, you can use the D2M template “D2M_template.xls”.
5
STEP-BY-STEP: How to Use Data2Maps
Entering Data
All your data is entered in the Data Entry worksheet. If your D2M file has been customized for
your project, the column headings in this worksheet will be labeled with your sampling
parameters.
5. Select the Data Entry worksheet by clicking on the DATA ENTRY tab at the bottom of
the window.
6. The Data Entry sheet is now active.
7. If any fake data still exists from the original template, select and delete.
8. Enter your sampling data. All sampling data for a given site and date are entered in one
row. You can enter up to 400 rows of data. The fields in the worksheet are listed below,
along with allowable values.
Date
Monitoring date (month/day/year)
Site ID
Site ID (as defined in set-up process)
Site Name
Full name of site (Not required. Does not appear in maps or charts)
Event
Enter “storm” or “base”, if known.
This column will be listed with the individual data points in the Charts
worksheet.
Parameter
Enter measured value.
• Signs (<,>) allowed, but will be omitted in analysis.
• No other non-numeric values allowed (e.g., "--", “ND”)
• Leave blank if no value for that site, date, and parameter
• Changing units listed above the parameter will not change units on the
maps/charts. To change them in the maps and charts, go into the Param
Info worksheet (see next section)
Note: Site names and parameters are pre-set in maps, charts, and queries during the set up
process. If you include any new site names or parameters in this data sheet, they will not
appear in the maps, charts, or queries.
9. Save your file.
STEP-BY-STEP: How to Use Data2Maps
6
Customizing Parameter Information
The Param Info worksheet was customized during the set-up process and contains your list of
parameters along with the associated fields defined below.
Param
Parameter name. DO NOT CHANGE.
This is how the parameter will be shown in the query tool list. This is
how the parameter must be listed in the data entry worksheet for the
query tool to work.
Standard/
Threshold
User-defined standard/threshold.
• If none, “No state standard” should be entered.
• If param is “% Dissolved P” maps will use the label
“Threshold”. For all other parameters, maps will use the label
“Standard”.
• Cannot be a range
Units
Units for data and standard/threshold (must be same)
Comments
Comments for a given parameter (if any). Displayed under map when
appropriate parameter chosen.
• To enter a line break, click ALT – ENTER
• Do not format this cell, because formatting will not show up
on maps.
Non-Compliant
if >/< standard?
Enter “>” or “<” to define non-compliance with the standard threshold.
• Example: for dissolved oxygen, you would enter “<”.
• Example: for E.coli, you would enter “>”.
You can modify any of the associated fields (The parameter name itself has to be done through
the set-up process on pg. 14 under Enter Parameter Information).
10. Select the Param Info worksheet by clicking on the PARAM INFO tab at the bottom of
the window.
11. Modify the information in the appropriate cell.
12. Save your file.
7
STEP-BY-STEP: How to Use Data2Maps
Querying Data
You can query your data from any of these worksheets: Map Option 1, Map Option 2, Map
Option 3, or Charts. When you run a query from any of the map/chart worksheets, all the
map/chart worksheets are updated with the query results.
13. Make one of the Map Option worksheets or the Charts worksheet active by clicking on
the tab at the bottom of the window.
The query tool is available in the blue section on the left.
14. In Step 1, you will see a list of the parameters that were set-up for this project. Click on a
single parameter of interest
15. In Step 2, click the “Update Year List” button. This will refresh the choice of sampling
years in Step 3.
16. If the list of sampling years in Step 3 is populated, choose one year or “All” if you want
to see data over all years. If the list is empty, there is no sampling data for that parameter,
and you will have to choose another parameter.
17. In Step 4, click “Refresh Charts/Maps”. Note: Only click this button if you have a
parameter and year (or “All”) chosen. Otherwise, you will get a run-time error.
STEP-BY-STEP: How to Use Data2Maps
8
Viewing Maps/Charts
After you have gone through the steps above, all the D2M maps and chart worksheets will display
your query results. Here are the four components for each map layout:
2
4
4
1
3
[1] Map with sampling locations color-coded by how often the standard was exceeded during the
time period you specified.
Red
Yellow
Green
> 1 exceedance at this location
1 exceedance at this location
No exceedances at this location
If a location had no monitoring data, it will be displayed as a hollow square.
[2] Choice of which map you want to display your sampling locations on (assuming your D2M
file was set up with multiple maps—e.g., graphic map, aerial photo).
[3] Comments or caveats specific to a parameter are displayed under the maps (these comments
are entered in the Param Info worksheet)
[4] All the map/chart worksheets, except for Map Option 3, display charts for each of the
sampling locations. These charts include a bar to indicate the user-defined standard/threshold. All
the charts in a worksheet will have the same start and end dates (start date: earliest sampling date
over all sample locations; end date: latest sampling date over all sample locations).
9
STEP-BY-STEP: How to Use Data2Maps
Exporting
You can paste the map/charts from D2M into another application (e.g., PowerPoint, MS Word) as
a picture.
18. On the map or chart worksheet, select all the cells or click the chart or object you want to
copy . To select an area - click on the sheet and hold the mouse down, dragging it across
the area you want to capture. (see picture- what is highlighted in blue was selected.)
.
19. Hold down SHIFT and click Copy Picture on the Edit menu.
20. For best picture quality, make sure As shown on screen and Picture are selected, and
then click OK.
STEP-BY-STEP: How to Use Data2Maps
10
21. Go to the document where you are pasting into (the picture below shows Microsoft
Word) and click where you want to paste the picture.
22. Click Paste on the Edit menu. The following picture shows Map Option 1 pasted into
Microsoft Word.
(Mac users—instead of steps 19-22, you should select Copy in Excel, then in your other
Microsoft application, select Paste Special, and Paste as Picture)
To make adjustments to an image pasted in a Microsoft application, use the Picture toolbar
(Go to View > Toolbars, and select Picture).
11
STEP-BY-STEP: How to Use Data2Maps
Printing
Printing Maps: the map worksheets already have the appropriate print area set up.
23. To preview a page before printing, go to File > Print Preview.
24. To print a page, go to File > Print.
Printing Charts: Before printing charts, you may need to adjust page breaks so that they do not cut
off the charts or list of data points.
25. Go to File > Print Preview to see page breaks.
26. If the preview is acceptable, go to File > Print. Otherwise first follow the instructions
below (also found in Microsoft Excel Help) on how to adjust page breaks.
STEP-BY-STEP: How to Use Data2Maps
12
STEP-BY-STEP: How to Set-Up D2M for Your Project
This chapter walks you through how to customize D2M for your particular project by following
these eight steps.
1. Enter Parameter Information
2. Enter Site Names with Latitude/Longitudes
3. Set Up Data Filters
4. Set Up Embedded Charts in MAP OPTIONS 1 and 2
5. Re-Define Excel Names
6. Modify VBA Code
7. Define Minimum/Maximum Dates for Charts
8. Align Maps with Sampling Locations
As you can see, the set-up procedures require working with Excel data filters, names, charts,
formulas and VBA code. While we try to give as detailed instruction as possible, this section will
be much less frustrating if done by an experienced Excel user.
Make sure you have all the items in the checklist below and then start on the next page.
Checklist before You Start
The D2M Excel file “D2M_template_vXX.xls”
A list of your sampling parameters and, if available, units and relevant standard/
thresholds
A list of your site names and x,y coordinates
- Unprojected coordinates (lat/long) will be easiest to match up to maps
Map(s) that include sampling locations for reference
- Give Appendix B (“Guidelines for Creating Maps for Data2Maps”) to your GIS person.
Decide which Map Option(s) you will be using
- Setting up each Map Options is time-consuming, so you should only customize the ones
you will be using.
NOTE: If you have 10 or more sampling locations, we recommend you only use Map
Option 3. Map Options 1 and 2 include charts for each sampling location and are hard to
read with too many sites.
Have what you need? Then let’s begin.
13
STEP-BY-STEP: How to Set-Up D2M for Your Project
Enter Parameter Information
In this first section, you will replace the D2M default water chemistry and other parameters with
your own project’s parameters. Up to 30 parameters can be used in Data2Maps.
NOTE: If you are adding or changing parameters to a file you have already set up skip to page 18
and see the supplemental guidance. (Otherwise you run the risk of loosing data!)
1. Before opening the D2M file, make sure your Excel security level is set no higher than
medium to ensure that the macros can run (see Setting Excel’s Security Level and Opening
D2M on page 5).
2. Open the File called D2M_template_vXX.xls. Save as D2M_yourproject.xls
3. Select the worksheet “Param Info” by clicking on the PARAM INFO tab on the bottom of the
page.
4. The Param Info worksheet shows the following columns: PARAM,
STANDARD/THRESHOLD, COMMENTS, UNITS, and Non-compliant if >/< , standard?
STEP-BY-STEP: How to Set-Up D2M for Your Project
14
5. Enter the parameter information in the columns as defined below. You can add up to 22
parameters.
Param
Parameter name. There is no maximum character length, but try to
keep shorter for readability in the query list.
• Do not use identical parameter names, the program will only
use the first one it comes across
Standard/
Threshold
Enter a numerical value in this column if you want to track your data
against a state standard or other threshold.
• If none entered, enter “No standard”1
• If param is “% Dissolved P” maps will use the label
“Threshold”. For all other parameters, maps will use the label
“Standard”.
• Cannot be a range
Units
Units for data and standard/threshold (must be same for both)
Comments
Comments for a given parameter (if any) that you would like displayed
under the maps when a particular parameter is chosen.
• Can be entered now or later
• To enter a line break, hit ALT – ENTER
• Do not format (bold, italicize) text in this cell, because
formatting will not show up on maps.
Non-Compliant
if >/< standard?
Distinguishes if a parameter is noncompliant if it falls above or below
a threshold. Enter “>” or “<”.
6. After you have added your parameters, if there are still parameters from the original template
that you will not be using, select those rows, right click, and select Clear Contents (or
Delete).
Now that you are done entering parameter information, we need to sort the parameters
alphabetically so that the data query works correctly.
1
If you choose to enter “no standard” then please note that the dots on your map display will always appear
as green, regardless of the numeric value. Also, on chart displays the standard/threshold bar will be set on
the x axis since it is interpreting the standard as zero.
15
STEP-BY-STEP: How to Set-Up D2M for Your Project
7. Select all the parameters from column A to E as seen below.
8. Go to Data > Sort, and sort by ascending PARAM (Column A). Click OK.
You also need to enter your parameter into the column heading of the Data Entry. To save you
time from typing them in again, we will simply copy your parameters from the Param Info
worksheet and paste them into the Data Entry worksheet.
9. Select the cells in Column A of the Param Info worksheet that contain all your parameters.
10. Copy the selection (CTRL + C, or Edit > Copy).
STEP-BY-STEP: How to Set-Up D2M for Your Project
16
11. Go to the Data Entry worksheet (click on yellow DATA ENTRY tab on bottom).
You can see that in the Data Entry worksheet the parameters are lined up horizontally, while the
Param_Info worksheet listed them vertically. We will to change the orientation of the data when
we paste.
12. In the Data Entry worksheet, select the first cell marked “Flow”. It will be either cell E7 or
F7, depending on which template you are using. Right Click and select Paste Special. (Excel
will fill that cell and the cells to the right with your copied cells.)
13. Click on the Transpose checkbox, and then click OK.
14. Make the selection (your parameters) bold for ease of reading.
Your parameters are now listed as bold headings in the Data Entry worksheet. If you want, you
can also update the units in row 6 of the Data Entry worksheet (by repeating Steps 9-13 using
column C from the Param Info worksheet). That is an optional step since all units in the Map
Option and Charts worksheets refer to the Param Info worksheet.
15. Save your file.
17
STEP-BY-STEP: How to Set-Up D2M for Your Project
You have now finished customizing your parameter information for your D2M file.
Supplemental Guidance on parameters –
Adding new Parameters – If you are adding new parameters to the work sheet in
PARAM INFO add the new Parameters at the end. Re-sort the parameters as described in Steps 7
and 8 in this Chapter. Copy each new “param” and paste in the DATA ENTRY sheet – Paste it in
the first empty cell in row 7 to the right of all other parameters. (Otherwise it will copy over your
existing parameters.) Finally, you will need to also follow the steps described on Page 31 for
redefining the excel name for “param list” so that the range of colums includes the newly added
parameters
Deleting old parameter - In PARAM INFO - Delete the Parameter and do the same in
DATA ENTRY Sheet . Finally, you will need to also follow the steps described on Page 31 for
redefining the excel name for “param list” so that the range of colums accurately includes the list
of existing parameters.
STEP-BY-STEP: How to Set-Up D2M for Your Project
18
Enter Site Names with Latitude/Longitudes
In this section, we will replace the sample locations in the template with the actual monitoring
locations in your project.
1. Select the ADMIN_MAP worksheet.
2. In Column E, paste or type in your monitoring site names under “Site ID”. Site IDs can be
any combination of letters, numbers, or symbols. Blanks are allowed between words. Try to
keep your site names short for ease of display and data entry. NOTE: You do not need to
make changes in the Crit Num column right now.
3. In Columns F and G, paste or type in the associated x and y coordinates (x=longitude,
easting | y= latitude, northing).
19
STEP-BY-STEP: How to Set-Up D2M for Your Project
4. If you have less than 16 sites
4.1. Select the cells in Columns D-H that contain extra sites (do not select entire column).
4.2. Right-click, and choose Clear Contents. (Or if you choose Delete, make sure you choose
“Shift Cells Up” when prompted.)
4.3. Skip to the section “Set Up Data Filters and Charts on CHARTS Worksheet on pg. 22
5. If you have more than 16 sites, then for each new site:
5.1. In Column D (“Crit Num”), enter the next consecutive number. (While this column is
not used in the query or charts, it does help you associate each site with the correct chart,
formula, code, etc.)
5.2. Paste the following formula in Column H (“# EXCEED”):
= IF(COUNT(dataXX)=0,"9999",DCOUNT(dataXX,param,CritLimit))
5.3. Change the 2 XX’s in that formula to the associated Crit Num (Column D). To see an
example, select Column H for a previous site.
6. Save your file.
STEP-BY-STEP: How to Set-Up D2M for Your Project
20
You have finished entering the names and latitude/longitude information of your monitoring sites.
21
STEP-BY-STEP: How to Set-Up D2M for Your Project
Set Up Data Filters and Charts on CHARTS Worksheet
The data queries in D2M use customized Excel data filters that are set up in the Charts worksheet.
In this section, you will make sure there is one chart and one data filter set up for each of your
project’s sampling locations.
1. Select the Charts worksheet.
You will see the Charts worksheet which is set up with one data filter and one chart for each of
the 16 Site IDs (“1”, “2”, “3”, etc.) that came with the template.
Each time a query is run, each data filter pulls out data for a site that matches the selected year
and parameter. For example, the red box in the picture above shows the data filter for site “1” and
is currently querying for 2006 DO data. The query results are charted directly underneath.
You will modify these data filters so that the Site IDs reflect the monitoring site names of your
project. After that, if you have less than 16 sites, you will delete the extra data filters/charts. If
you have more than 16 sites, you will have to copy-and-paste to create additional data
filters/charts.
STEP-BY-STEP: How to Set-Up D2M for Your Project
22
2. Select cell C7. This cell defines the site name for your first site.
3. Look in the formula bar to see the formula for this cell.
The sampling site name in the ADMIN MAP worksheet associated with crit01 (crit_num = “01”)
was “1”, so this formula shows
=”=1”
4. If your first site(the Site ID next to crit_num 01) is not also named “1”, then retype the
formula with the site ID so that it looks like
="=site ID"
where site ID is the site you have listed on the ADMIN_MAP worksheet next to crit01, cell D3.
It must be typed identically for the Refresh Charts/Maps button to work correctly, so you may
want to copy the names from the ADMIN_MAP worksheet and paste it into the CHARTS
worksheet.
5. Repeat step 4 for each of the sites you listed in the ADMIN_MAP worksheet. For example, if
your site IDs on the ADMIN_MAP worksheet looked like this
you would enter use “BBEAR” as the sitename under crit01 on the CHARTS worksheet,
“BEAR” as the sitename under crit02, “BPINE” as the sitename under crit03, etc.
6. Save your file. If you have exactly 16 sites in your project, skip to the next section on pg 28.
23
STEP-BY-STEP: How to Set-Up D2M for Your Project
7. If you have less than 16 sites,
7.1. Select the columns containing the extra sites and hit “Delete”.
7.2. Save your file.
7.3. Skip to the next section on pg. 28.
8. If you have more than 16 sites, you will need to copy and paste in more columns.
8.1. Select and copy Columns CO-CS.
STEP-BY-STEP: How to Set-Up D2M for Your Project
24
8.2. Go to the first column after the last “Event” column (in this case, CT), click on the top
cell.
8.3. Paste in your selection.
25
STEP-BY-STEP: How to Set-Up D2M for Your Project
8.4. Select the cell with the pink “crit16” label (in this case, CT5). Change this to “critXX”
where XX is the number following the crit label from the previous location (in this case,
you would enter “crit17”).
8.5. Select the cell that is 2 cells below the pink “critXX” label (in this case, CT7). This cell
defines the site name for this site.
8.6. Look in the formula bar to see the formula for this cell.
This was originally the site name in the ADMIN_MAP worksheet associated with crit16,
(originally called “16”), so this formula shows
=”=16”
8.7. In this cell, retype the formula with your 17th sitename so that it looks like
="=sitename"
where sitename is the site you listed on the ADMIN_MAP worksheet in column E, next
to crit17. NOTE: It must be typed identical to the listing on the ADMIN_MAP worksheet
in order for the Refresh Charts/Maps button to work correctly, so you may way to copy
and paste the name into the CHARTS worksheet.
Next we will redefine the chart for this site so that it is pointing at the correct data columns in
the CHARTS worksheet.
8.8. Right-click on the chart under the data filter you just set up, and select “Source Data”.
8.9. Click on the Series tab.
STEP-BY-STEP: How to Set-Up D2M for Your Project
26
8.10. In the Values box, change both occurrences of “CR” to the column letters of your new
parameter info (in this case, you would enter “CW”).
8.11. In the “Category (X) axis labels” box of the Series tab, change both occurrences of
“CQ” to the column letters of your new date info (in this case, you would enter “CV”).
8.12. Repeat Steps 8.1-8.13 for each of your additional charts
8.13. Click OK.
8.14. Save your file.
You have now set up the data filters to look for your Site IDs and the charts are all pointing at the
correct data filter results.
27
STEP-BY-STEP: How to Set-Up D2M for Your Project
Set Up Embedded Charts in MAP OPTIONS 1 and 2
In this section, you will set up the charts in the Map Option worksheets. This entails:
1) Adding or deleting charts so that they match the number of your sites, and
2) For Map Option 1, re-labeling the charts with your site names
If you have customizing Map Option 2, skip to the next section “Re-Define Excel Names” on
page 31. You will return this after you have finished setting up the maps, so that you can align the
charts next to the sampling locations.
If you have determined that you will be using only Map Option 3 (which has no embedded
charts), skip to the next section “Re-Define Excel Names” on page 31.
Map Option 1 Worksheet
If you have exactly 16 sites, go to step 2 on pg. 29 to rename charts.
If you have more than 16 sites, go to step 7 on pg. 30 to add charts.
If you have less than 16 sites, follow the following directions to delete the extra charts from the
template (i.e., those in the template with Site ID greater than your number of charts.)
1. To delete extra charts, do the following:
1.1. Select the chart by clicking just outside the graph. Leave your mouse over the selection
for one second and a tool tip will pop up telling you what has been selected. Make sure
you have the “Chart Area” selected, not the “Plot Area”
YES: Chart Area is selected
NO: Plot Area selected, not Chart Area
STEP-BY-STEP: How to Set-Up D2M for Your Project
28
This might require a little practice getting used to what chart element you are selecting. This
aspect of Excel can be frustrating even when you get the hang of it!
1.2. With the Chart Area selected, hit your “Delete” key.
1.3. Repeat with all extra charts.
2. In this step, we will rename the charts, if your sites are differently named than the ones in the
template.
To know which site a chart is associated with, go to the Charts worksheet. A chart labeled “Site
X” on the Map Option worksheet corresponds to the site listed under “critXX” on the Charts
worksheet. For example, in the template, the chart listed as Site 1 on a Map Option worksheet
corresponds to the site listed under “crit01” on the Charts worksheet (simply “1” in this example)
3. (This step is not necessary for Map Option 2 since its embedded charts are not labeled, only
the sites are.) For each chart:
3.1. Select the Site Name by clicking on it.
3.2. Type in the site name that corresponds to it in the CHARTS worksheet. You can choose
NOT to include the word “Site”.
4. Move charts so that they are well-arranged in the black bordered print area. Note: You may
want to wait until your points are mapped in Step 8, since we recommend moving charts as
close as possible to the corresponding sampling point on the map.
29
STEP-BY-STEP: How to Set-Up D2M for Your Project
5. Save your file.
6. Skip to the next section “Re-Define Excel Names” on pg. 31.
If you have more than 16 sites, you will need to make additional charts.
7. For each new chart:
7.1. Select one of the charts on the Map Option 1 worksheet (remember to select the Chart
Area)
7.2. Right-click and choose Copy.
7.3. Click on an empty cell (for example, on the top row) so that your chart is no longer
selected.
7.4. Right-click and choose Paste. (Note: If your data is being pasted again into the original
chart instead of in a new chart, it means you did not unselect your chart in step 7.3).
7.5. Point the chart at the correct data by doing steps 8.8 - 8.11 (pg. 26) on this chart.
7.6. Rename the chart (see step 3.1 on pg. 29).
We will not worry about putting the charts in a particular order until we have added the map(s)
and sampling locations.
8. Save your file.
You have now updated your maps to include one chart for each of your monitoring sites for Map
Option 1.
Map Option 2 worksheet
Since the charts in Map Option 2 need to be positioned next to the sampling locations, we will
wait until after you insert and align the maps before we update the charts. So for now, continue
with the next section “Re-Define Excel Names” on pg. 31.
AFTER YOU HAVE FINISHED THE REST OF THE SET-UP PROCESS
The charts in Map Option 2 are layered on top of the map(s). Now that you have lined up your
sampling points with your maps, you can align your charts to match.
9. The overall sampling points chart has to be sent to the back layer in order for you to be able
to select the individual site charts.
9.1. Select the Sampling Point Chart Area*
9.2. Right-click and select “Send to back”
9.3. Start at Step 1 on pg. 28 for charts in this Map Option. The only difference is that for
simplicity sake, we named the sites by number only (instead of “Site XX”). You can
name the sites in anyway you choose.
9.4. Save your file.
STEP-BY-STEP: How to Set-Up D2M for Your Project
30
Re-Define Excel Names
In previous sections, you modified your D2M template so that the chemistry/parameters and site
names are appropriate for your project. In this section, we will update the pre-defined Excel “names”
in D2M to reflect the changes you made to the chemistry/parameters and site names.
1. If you are not currently on a Map Option worksheet, go to one by clicking on any of the Map
Option tab. (This section can be done from any of the Map Option worksheets.)
2. In the Insert menu, point to Name and then click Define.
You will see the Define Name dialog box:
3. In this step, we re-define the name “param_list” so that it points to the parameters you previously
entered in the Param Info worksheet in column A.(in Step 5 on pg 15)
3.1. Click on the name “param_list” from the Names in workbook dropdown list.
3.2. Click on the
31
button (right side of the Refers to field).
STEP-BY-STEP: How to Set-Up D2M for Your Project
3.3. Select the Param Info worksheet (by clicking on the PARAM INFO tab) and then select
the parameters you entered in column A.
3.4. Click on the
button to return to the Define Name dialog box.
3.5. Click on the Add button (Do not forget this step-- otherwise no change will be made!)
3.6. Click on the Close button to close the dialog box and return to the Map Option
worksheet.
STEP-BY-STEP: How to Set-Up D2M for Your Project
32
3.7. Check the parameter list on the top left of the Map Option worksheet. It should now
show your parameters. (You may have to scroll down the list to see all your parameters.)
If you can see your parameters, you have successfully re-defined the name “param_list”. In the
following steps, we will redefine more names.. Refer to the figures in Step 1-3 if you have
questions.
4. In this step, we re-define the name “param_lkup” which allows D2M to look up information
associated with each parameter. .
4.1. Go to the Param Info worksheet.
4.2. Open the Define Name dialog box (Insert > Name > Define).
4.3. Click on the name “param_lkup” from the Names in workbook dropdown list.
4.4. Click on the
button (right side of the Refers to field).
4.5. Select all the parameters you entered on the Param Info worksheet ALONG WITH
ASSOCIATED FIELDS (columns A-E).
4.6. Click on the
button to return to the Define Name dialog box.
4.7. Click on the Add button (Do not forget this step-- otherwise no change will be made!).
4.8. Click on the Close button to close the dialog box.
33
STEP-BY-STEP: How to Set-Up D2M for Your Project
5. Next we re-define the name “mapdata” which allows D2M to categorize each location by
frequency of exceedances.
5.1. Go to the ADMIN MAP worksheet.
5.2. Open the Define Name dialog box (Insert > Name > Define).
5.3. Click on the name “mapdata” from the Names in workbook dropdown list.
5.4. Click on the
button (right side of the Refers to field).
5.5. Select all the sites you entered on the ADMIN MAP along with the associated fields
(columns D-H) and column headings (row 2).
5.6. Click on the
button to return to the Define Name dialog box.
5.7. Click on the Add button (Do not forget this step-- otherwise no change will be made!).
5.8. Click on the Close button to close the dialog box.
5.9. Save your file.
STEP-BY-STEP: How to Set-Up D2M for Your Project
34
If you have more than 16 sites, you will now add Excel names for each new site. If you have 16
sites or less, SKIP to the next section “Modify VBA Code” on pg. 37.
6. For each additional site on the CHARTS worksheet, identify the date and parameter columns.
For example, if you added a 17th site, it would be located under “crit17” on the CHARTS
worksheet, and the date column would be CV and the parameter column would be CW.
You will need to define 4 names for each site you add. They are listed below, along with the
formula you need to paste into the “Refers to” field in the Define Name dialog box. (XX =
critXX in CHARTS worksheet)
dataXX
paste in “= CHARTS!$parameter column$29:$parameter column$433”
(for crit17, the name “data17” would refer to “=CHARTS!$CW$29:$CW$433”)
datesXX
paste in “=CHARTS!$date column$30:$date column$430”
(for crit 17, the name “dates17” would refer to “=CHARTS!$CV$29:$CV$433”)
critXX
point to CHARTS Worksheet | 3 columns and 2 rows under critXX
(see following picture)
rangeXX
35
point to CHARTS Worksheet | Data headings for critXX
(see following picture)
STEP-BY-STEP: How to Set-Up D2M for Your Project
7. Add the 4 new names for each new site using the following steps.
7.1. Open the Define Name window (Insert > Name > Define).
7.2. Type the new name in the “Names in Workbook” box.
7.3. Click on the
button under the “Refers to”.
7.4. Select the appropriate worksheet and cells.
7.5. Click on the
button to go back to the Define Name dialog box.
7.6. Click on the Add button (Don’t forget to do this step! Otherwise no change will be
made)
7.7. Repeat Steps 7.1-7.6 for each site you added beyond the first 16 that came with the
template (that is, crit17 and greater).
8. Save your file.
You have now updated and added all the Excel names necessary for running the D2M query tool.
STEP-BY-STEP: How to Set-Up D2M for Your Project
36
Modify VBA Code
The “Refresh Maps/Charts” buttons are currently set up to query for the 16 sampling locations
included in the template. If you have a different number of sampling locations, you will need to
modify the VBA code behind this button. Even if you’ve never touched Excel VBA code before,
do not be afraid! It’s actually quite simple—just follow these directions.
If you have exactly 16 sampling locations, you can skip ahead 2 sections to “Align Maps with
Sampling Locations” on pg 42.
1. Go to Tools > Macro > Visual Basic Editor.
2. On the left tree structure, double click the Modules folder, and then double click on
Module6.
3. If a blank window is on top (see following picture), then look for window titled “Module 6”
and click on it to bring it to the front.
37
STEP-BY-STEP: How to Set-Up D2M for Your Project
4. About halfway down the page, you will see a section that starts with ‘Charts: Filter data (see
following picture).
That section contains code for 16 sampling locations. We will change that code to match the
number of sampling locations in your project.
5. If you have less than 16 sampling locations,
5.1. Delete the pairs of lines starting with Range(“data”) . . . that include critXX numbers
where XX is greater than your number of sampling locations. For example, if you only
had 14 sites, you would select and delete the 4 lines highlighted below, because they
have critXX where XX is greater than 14.
5.2. Skip to step 7.
6. If you have greater than 16 sampling locations,
6.1. Copy the last 2 lines of that section.
STEP-BY-STEP: How to Set-Up D2M for Your Project
38
6.2. Put your cursor on the beginning of the next line and paste in the selection once for each
site you have beyond 16. For example, if you have 18 sites, you would paste in the
selection 2 times.
6.3. Replace the XX in the critXX and rangeXX values with the next consecutive numbers.
7. Hit Alt + Q (or go to File > Close and return . . .) to close the Visual Basic Editor and return
to your spreadsheet.
8. Save your file.
You are now done modifying the VBA code so that it refers to the correct number of monitoring
sites that you are using.
39
STEP-BY-STEP: How to Set-Up D2M for Your Project
Define Minimum/Maximum Dates for Charts
On the ADMIN_MAP worksheet, there are 2 cells that define the minimum and maximum dates
to display on every chart in your D2M file. Every time you run a query, those dates are refreshed
to reflect the earliest and latest sampling dates of the query results.
The formulas for the minimum and maximum dates are currently set up for16 sampling locations.
If you have a different number of sampling sites, you will follow the steps in this section to
reformulate those two cells to reflect your number of sampling locations.
NOTE: You can also set up your charts to show full calendar year instead of minimum/
maximum dates of query results. See instructions at Appendix A: Troubleshooting and Tips on
pg. 55.
10. If you have exactly 16 sampling locations, skip to the next section on pg. 42, “Align Maps
with Sampling Locations.”
11. Go to the Admin Map worksheet.
12. Select cell A11. In the formula bar above, you will see the calculation of the minimum
sampling date. Notice how it refers to all the “datesXX” names you set up in the “Re-Define
Excel Names” section.
13. If you have less than 16 samples:
13.1. Select cell A11.
13.2. Go into the formula bar and delete all “datesXX” where XX is greater than your
number of sampling locations. For example, if you have 4 sites, the formula would look
like
=MIN(dates01,dates02,dates03,dates04)-31
13.3. Select cell A12.
13.4. Go into the formula bar and delete all “datesXX” where XX is greater than your
number of sampling locations. For example, if you have 4 sites, the formula would look
like
=MAX(dates01,dates02,dates03,dates04)+31
13.5. Save your file.
13.6. Skip to the section “Align Maps with Sampling Locations” on pg. 42.
STEP-BY-STEP: How to Set-Up D2M for Your Project
40
14. If you have more than 16 samples:
14.1. Select cell A11.
14.2. Go into the formula bar and for each additional site you have above 16, add “datesXX”
separated by commas. For example if you have 18 sites, the formula would look like
=MIN(dates01,dates02,dates03,dates04,dates05,dates06,dates07,dates08,dates09,
dates10,dates11,dates12,dates13,dates14,dates15,dates16,dates17,dates18)-31
14.3. Select cell A12.
14.4. Go into the formula bar and for each additional site you have above 16, add “datesXX”
separated by commas. For example if you have 19 sites, the formula would look like
=MAX(dates01,dates02,dates03,dates04,dates05,dates06,dates07,dates08,dates09,
dates10,dates11,dates12,dates13,dates14,dates15,dates16,dates17,dates18)+31
14.5. Save your file.
Your charts will now correctly display the minimum/maximum dates of your query results.
41
STEP-BY-STEP: How to Set-Up D2M for Your Project
Align Maps with Sampling Locations
It’s finally time to map out your sampling locations! Here’s what you will do to make it happen:
- Enter fake data
- Look at your sampling locations
- Insert your map(s)
- Align your sampling locations with Map1
- Position your legend
- Label the sampling locations
- Position your charts
- Repeat for other layouts (i.e., Map Options), if any
Enter fake data
In order for us to see our sampling locations, we have to first enter fake data in the DATA
ENTRY worksheet for every one of your locations. We will do this by copying all the sites you
entered in the ADMIN_MAP worksheet into the DATA ENTRY worksheet and entering the fake
data.
1. Go to the ADMIN_MAP worksheet.
2. In Column E, select and copy all your site names.
3. Go to the DATA ENTRY worksheet and select cell B8 (the first cell under the Site ID
heading). NOTE: Even though you are only selecting one cell, when you paste in your
selection it will extend across the correct number of cells.
4. Paste in your selection.
STEP-BY-STEP: How to Set-Up D2M for Your Project
42
15. Make sure that all your sites have a date in column A and these dates all have the same year.
NOTE: These are sample dates to help set up the sites--they do not have to be actual sampling
dates.
16. Make sure that, for each parameter, there is at least ONE sampling value entered. Fake data is
fine—this allows us to see all sampling locations when we align the sites to the maps in Step
8.
17. Delete any extra rows of data that came with the template.
18. Save your file.
43
STEP-BY-STEP: How to Set-Up D2M for Your Project
Look at your sampling locations
We are now ready to query our fake data and look at our sampling locations to make sure they
were properly entered.
19. Go to the Map Option worksheet you plan to work with.
20. In the blue query section, choose one parameter in Step 1, and then click the
“UPDATE YEAR LIST” button.
21. Choose a sampling year in Step 3, and then click the “REFRESH
MAPS/CHARTS” button.
22. Cross your fingers.
23. The map should now be updated with your sampling locations. Confirm that you see the
correct number of sampling points and that they are in approximately the correct relationship
to each other (although they will still need to be moved and the extent resized in order to
match your maps). If the orientation is not correct, make sure your points have their
latitude/longitudes entered in the correct order in the ADMIN MAP worksheet (see Step 3 on
pg. 19).
24. Save your file.
NOTE: In all the Map Options, the sampling locations are shown using scatterplot charts with
latitude as the x-axis and longitude as the y-axis. In each Map Option you plan to use, we will
align these scatterplot charts with your underlying maps
STEP-BY-STEP: How to Set-Up D2M for Your Project
44
A quick orientation of D2M maps
You can choose up to 3 maps to display under the sampling locations. In the template, the 3 maps
are 1) a watershed map, 2) an aerial photo, and 3) a map with municipal boundaries.
map1
map2
map3
The buttons on the template use the labels “MAP” “IMAGE” and “MUNICIP” and allow you to
decide which map should be the top (visible) map layer (the other maps are hidden beneath). In
the Excel code, these maps are referred to as map1, map2 and map3, respectively.
NOTE: Decide which of your maps will be given the names map1, map2, and map3, because you
will be replacing the template maps with yours.
When a map is selected, you can see its coded name in the “name box” in the upper left hand
corner of the spreadsheet.
As mentioned before, the sampling location layer is simply an Excel scatterplot with latitude as
the x-axis and longitude as the y-axis. The sampling location layer is programmed to always be
the topmost layer and is color-coded based on frequency of exceedance. The coded name for this
layer is samp_data.
samp_data layer
selected
45
STEP-BY-STEP: How to Set-Up D2M for Your Project
Insert your map(s)
We are going to swap out the “map1” currently in the template with the map you have chosen for
“map1”
25. In the Map Option worksheet you have been working with, select map1 by typing “map1” in
the upper left Name box and hit the “Enter” key. (You have to type in the name manually;
map names do not appear in the Names drop-down list.)
Notice that the map area is highlighted
26. Hit Delete to remove current map1.
27. Go to Insert > Picture > From File, and navigate to the map you have chosen for your
“map1”. Click Insert.
28. Move your map1 until it is approximately within the same area that the original map was.
Hint: avoid resizing map images, if possible—that way you will not accidentally change the
aspect ratio and you will not have to resize your other maps to match this one. After all the
images are in place, you will adjust the sampling location layer (samp_data) instead.
29. Click on the map to make sure it’s selected, and then type in “map1” in the upper left Name
box. Hit the Enter key, and now your map is titled “map1”.
30. Save your file.
Map1 is now correctly added to this worksheet.
map1
map2
map3
If you will be using more than one map, we will now repeat the previous steps.
STEP-BY-STEP: How to Set-Up D2M for Your Project
46
31. If you have a map2,
31.1. Repeat Steps 25-29, this time substituting map2 for map1.
31.2. Match the corners of map2 with the corners of map1.
NOTE: Remember, the easiest way to select map2 is by entering “map2” in the Name box.
Assuming that map2 was created with the same extent as map1, matching the corners of the
two maps mean that, once the samp_data sampling points are aligned with map1, they will
also be aligned with map2.
32. If you have a map3
32.1. Repeat Steps 25-29, this time substituting map3 for map1.
32.2. Match the corners of map3 with the corners of map1 (or map2).
33. If you are not using all 3 maps, we recommend leaving the template maps in there as a
placeholder.
33.1. To make the unused map non-obtrusive, select it (using the Name box) and then resize
small enough so that it cannot be seen beyond the extent of your other map(s).
33.2. If you want to make the associated button look non-active, then right-click on the
button, choose Format Auto-Shape, go to the Font tab and choose a color which
matches the button color. This way the button is still there as a placeholder, but users
are less likely to click on it.
33.3. If you are ABSOLUTELY positive you will never use 3 map backgrounds, contact
Janice Huang (312-353-8228) for directions on how to remove maps and buttons
without causing an error in the coding.
34. Save your file.
Your maps are now inserted in your Map Option and are ready to be aligned with your sampling
locations.
47
STEP-BY-STEP: How to Set-Up D2M for Your Project
Align your sampling locations with Map1
This step is tricky and takes lots of patience. The good news is that once your sampling locations
are lined up with map1, you only have to match the corners of map2 (and map3) to the corners of
map1 for the sampling locations to be aligned to those maps, too (assuming your GIS person
created all your maps with the same extent).
NOTE: You will be moving and resizing the sampling locations chart (“samp_data”) to align with
the maps, NOT the other way around. If you have to resize your map, make sure you drag from
the corners, so that the aspect ratio stays constant and your map will not be distorted.
35. First we will get an idea of how much the samp_data chart needs to be moved.
35.1. Click on the “SHOW MAP” button. This will bring the samp_data chart to the top layer
with map1 visible underneath.
35.2. Compare your sampling locations on the samp_data chart with the locations on your
map to determine what direction the samp_data chart needs to be shifted and how much
it will need to be re-sized.
HINT: Focus on aligning sampling points on opposite ends of your extent. (When those look
correctly aligned, they you can confirm that the points in between are aligned, too.)
In the example below, we are focusing on site 16 and site.4. We want to move the samp_data
layer until those two sites in the samp_layer (circled in red) are on top of the two equivalent sites
in map1 (circled in green). I can see from Site 16 that samp_data needs to be moved up and to the
left. Then looking at Site 4 tells me that I will probably have to make samp_data longer and a
little bit narrower.
STEP-BY-STEP: How to Set-Up D2M for Your Project
48
36. Move and re-size the samp_data chart as needed.
36.1. Select the sampling locations chart area by entering “samp_data” in the Name box (or
by holding down Ctrl while clicking on one of the sampling locations). If the map is no
longer visible, do this step again carefully.
YES: Map still visible
(handles are hollow circles)
NO: Map no longer visible.
(handles are black squares)
36.2. Resize and move the sampling locations chart until its sampling points are aligned with
the corresponding sampling points on the map. Remember to focus on sampling points
on opposite ends of your extent. When those look correctly aligned, they you can
confirm that the points in between are aligned, too.
• To resize the chart, click on a handle and drag.
• To move the chart, click in the middle of the chart (double arrows appear) and drag.
Depending how far off your sampling points are, you may have to adjust where the
samp_data’s plot area is positioned within its chart area.
You can do this by selecting the plot area (click next to, but not on, a sampling location in
samp_data) and following the moving/resizing directions given in Step 36.2. NOTE: The map
49
STEP-BY-STEP: How to Set-Up D2M for Your Project
is not visible when the plot area is selected, so you will have to select/deselect to see the
results of your adjustments.
36.3. If you absolutely have to move or resize the map, enter “map1” in the Name box to
select it and follow same directions as in step 36.2. See Appendix A: Troubleshooting
and Tips if you need to crop your maps.
36.4. Continue doing a combination of all these steps, as needed, until sampling locations in
samp_data are aligned with sampling locations in map1. Yes, this is a time-consuming
and tedious.
36.5. Save your file.
Phew! You’re done with the hardest part!
Align other maps with Map1
If you moved or resized map1, you will have to do the same modifications to map2 and map3 so
that they will still lie directly underneath.
37. If you have a map2:
37.1. Click on “SHOW MAP” and “SHOW IMAGE” to see how much and where map2
needs to be moved.
37.2. Select map2 by entering “map2” in the Name box.
37.3. Resize/move map2 until its edges line up with those of map1.
38. If you have a map3:
38.1. Click on “SHOW MAP” and “SHOW MUNICIP” to see how much and where map3
needs to be moved.
38.2. Select map3 by entering “map3” in the Name box.
38.3. Resize/move map3 until its edges line up with those of map1.
39. Save your file.
STEP-BY-STEP: How to Set-Up D2M for Your Project
50
Position your legend
If the legend is covering sampling points or prominent features on your maps, you will need to
move it. The legend is an element of the samp_data chart.
40. Click on the legend to select it. You can move it any area to within the samp_data chart area.
You can also resize it by selecting and dragging the handlebars.
41. Save your file.
Label the sampling locations
The sampling location labels are contained in a separate layer on the worksheet. This layer is
composed of text boxes that have been grouped together. We will ungroup these labels, rename
them with your location names, and move them to the appropriate positions.
42. In order to select the labels, you have to send the samp_data chart to the back (bottom) layer.
42.1. Select the sampling locations by typing “samp_data” in the Names box. Hit Enter.
42.2. Right click, and choose “Order”, then “Send to Back”.
43. Click on any of the labels. You will see the label selected with hash marks. You will also see
hollow circle handles around the full extent of the labels, indicating that the labels are
grouped. We will now ungroup these labels so that we can make edits.
51
STEP-BY-STEP: How to Set-Up D2M for Your Project
43.1. Right click on the hash mark border around the label you are changing.
43.2. Choose Grouping > Ungroup. (If Ungroup is grayed out, then choose Regroup and then
do Grouping > Ungroup.)
43.3. Deselect by clicking on a cell outside the map.
The 16 site labels on the worksheet are now ready for editing. For up to 16 of your sampling
locations, you will rename of the current labels and move it next to the associated sampling
location. (see the map with site names created by your GIS person per “Appendix B: Creating
Maps for Data2Maps” step 8).
44. With the 16 labels (textboxes) currently on the worksheet,
44.1.
Choose a textbox, and swipe over the text in it.
44.2.
Type in one of your sampling location names. (Do not click off of it yet).
44.3.
Select the textbox by clicking on the hash marks surrounding the selected text.
44.4. If not all of the text is showing, you can resize the textbox by grabbing one of the
handles of the selected textbox and dragging it until the entire text is visible.
44.5. Select the label again (by clicking on the hash mark border) and drag it next to the
associated sampling location
44.6.
If your project has exactly 16 locations, SKIP to Step 47.1.
STEP-BY-STEP: How to Set-Up D2M for Your Project
52
45. If you have less than 16 locations:
45.1.
Select each extra label and delete.
45.2.
Select any label, right click and choose Grouping > Regroup.
46. If you have more than 16 locations, then for each additional label:
46.1.
Select one of the labels,
46.2.
Copy and then paste onto the map.
46.3.
Follow the directions in Step 44 to rename the label.
46.4.
Position the label next to the associated sampling location.
46.5.
Repeat Steps 46.1 - 46.4 until all your labels on entered and correctly positioned.
47. :Label Features (optional)
You may want to label or highlight relevant features on your map (e.g., outfalls, facilities).
47.1. To add other text labels to your map, add and modify new labels following Step 46.
48. With all your labeling finished, you will group them together so that they all appear in the top
layer (on top of your maps and samp_data layer).
48.1. Select all the labels by holding down shift and clicking on the individual labels.
48.2. Right click on one of them, and choose Grouping > Group.
49. Save your file.
Position your charts
We have put off positioning your charts until now, because it is best to place them near the actual
sampling points. If you are working with Map Option 1, we recommend you order your charts
they are as close as possible (and similar orientation) to the associated sampling locations on the
map.
50. Select each chart and position them in an order that mimics sampling location orientation on
map.
NOTE: Make sure the Chart Area is selected before moving chart. Directions in Step 1.1, pg.28.
51. Save your file.
NOTE: If you are working with Map Option 2, you will now return to the section “Set Up
Embedded Charts in MAP OPTIONS 1 and 2” on pg. 28 to set up your charts and then position
them on the map next to the appropriate sampling location.
You are done customizing Map Option 1!
53
STEP-BY-STEP: How to Set-Up D2M for Your Project
Other Map Option worksheets
If you are customizing Map Options 2 or 3, you will now do all the steps in this set-up section,
except for any differences specific to Map Options 2 or 3 noted in each section.
You are now ready to start using this application. Enter data into the DATA_ENTRY worksheet.
Choose the parameter and year on the map options sheet(s) you customized. Voila!
STEP-BY-STEP: How to Set-Up D2M for Your Project
54
Appendix A: Troubleshooting and Tips
Excel Names
Problem: I am not allowed to enter text in the Names box.
Solution: Most likely a non-cell (e.g., map, chart, button) is selected. Click on any cell,
and then try entering again.
Charts
Problem: Sampling locations are always selected even though I am trying to click on another
item.
Solution: Sampling locations is the top layer and will always be selected when its area is
clicked on. Send the sampling locations to the back by typing “samp_data” in the Names
box, right click, and choose “Send to Back”. When you want the sampling locations back
in the front, typing “samp_data” in the Names box again, right click, and choose “Bring
to Front”
Problem: I want the charts to show full calendar year(s).
Solution: You can change the charts to show the full calendar year by entering the
following formulas in the ADMIN_MAP worksheet.
In Cell A11, enter:
=IF(year<>"All",DATE(year,1,1),DATE(MIN(year_list),1,1))
In Cell A12, enter:
=IF(year<>"All",DATE(year+1,1,1),DATE(MAX(year_list)+1,1,1))
If you want the charts to show only the sampling date range again, follow steps XXX to
return to the original setting.
Maps
Problem: I want to crop my map.
Solution:
1. Select the map by typing its name into the Name box.
2. Go to Format > Picture (or hit CTRL + 1).
3. On the Picture tab, enter approximate numbers into the Crop from Left/Right/Top/Bottom
boxes.
4. Click OK.
5. Repeat with different crop measurements until the map shows only the extent you are
interested in.
NOTE: You will have to enter the exact same numbers into the Crop fields for other maps in
that layout so that maps are correctly aligned.
Problem: It’s hard to see the sampling points on top of my map.
Solution: Tone down your map by selecting it, right-clicking and choosing Format
Picture. Under Picture tab, pump up brightness (try 65%) and tone down contrast (try
35%)
55
Appendix A: Troubleshooting and Tips
Problem: Sampling points are not oriented in the correct positions.
Solution: Make sure your points have their latitude/longitudes entered in the correct order
in the ADMIN MAP worksheet. See Step 3 on pg. 19.
Problem: Instead of a single threshold value, one of my parameters has an acceptable range.
Known Issue: D2M currently cannot handle comparing values to an acceptable range.
Problem: I want to change the text on the “SHOW MAP/IMAGE/MUNICIP” buttons.
Solution: Right click on the button, and choose “Edit Text”. The cursor will show up at
the beginning of the button text, and you can type in your changes.
Appendix A: Troubleshooting and Tips
56
Appendix B: Creating Maps for Data2Maps
What you should have received from the requestor:
- Lat/longs for sampling locations along with site names
- Type of map(s) desired (watershed delineation, aerial image, etc.)
- Which D2M layout (or Map Option) requestor will be using (this will affects max width/height
of maps)
What you will be producing for requestor:
- Map(s) exported as GIFs that will be used in Excel as a backdrop for sampling locations.
Overview for GIS Analyst:
The requestor will be pasting the map(s) you produce into a D2M Excel file as a backdrop for
sampling location points (the sampling locations are displayed in the Excel file using a scatterplot
of the x-y-coordinates with background = “no fill”).
Excel Scatterplot
57
Map
Appendix B: Creating Maps for Data2Maps
Scatterplot on top of Map
If the requestor asked for more than one map, that means they will be setting up the D2M file so
that they can choose the background map by a click of a button (similar to Google maps)
Directions:
1. Create a GIS view with sampling locations layer and map layer(s) asked for by requestor.
2. Make sampling points small (maybe 4 pt) since they will need to be totally covered by
another set of markers in Excel.
3. If one of your maps is an aerial photograph, make it slightly transparent (you can try 40%
transparency as a starting point) so that the sampling points will stand out more.
4. Zoom to the extent desired by the user (most likely the extent of the sampling locations or
the extent of the pertinent watershed)
You will now export each of the layers as GIS files. Microsoft products make JPGs fuzzy
because they have built-in anti-aliasing (see http://pptfaq.com/FAQ00065.htm). In our
experience, it seems like images remain clearer when brought in as GIFs.
5. The following export instructions are specific to ArcMap. If you are using another GIS
software package, read through the instructions to see what end results you want in your
GIS.
a. Make the layer you want to export visible, along with the sampling locations
layer. All other layers should be turned off. .
NOTE: The sampling locations layers should not be labeled. We have found it’s
easier to control the display of the site labels if we add them in Excel.
b. Go to File > Export Map
c. Change Save as Type to “GIF (*.gif)”
Appendix B: Creating Maps for Data2Maps
58
d. In the General Tab (on the bottom under Options), make sure that the width and
height do not exceed the allowable size for the Map Option your requestor has
chosen (see below). If not, close the dialog, make your view smaller, and start at
Step b again.
Map Option 1:
Map Option 2 or 3:
max width 340px
max width 500px
max height 385px
max height 575px
6. Save the files as GIF files
7. If requestor is asking for more than one map , repeat Step 5 with the desired layer
Note: Do not change the extent of your view, as you want all the maps to cover the same
extent, so they can be layered on top of one another.
8. If requestor does not already have a map with sampling sites labeled, please make one for
them to use in the set-up process.
59
Appendix B: Creating Maps for Data2Maps