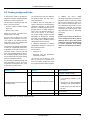
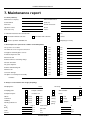
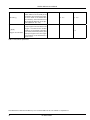
1
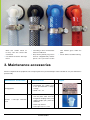
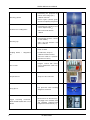
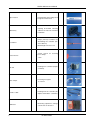
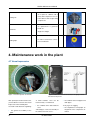
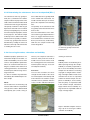
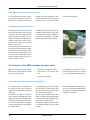
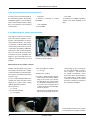
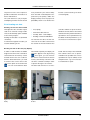
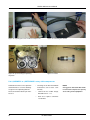
KLARO Maintenance Manual We provide clear water No mechanics in the wastewater No pumps in the wastewater No electrical parts in the wastewater KLARO Maintenance Manual Table of contents 1. Introduction 4 2. Safety instructions 4 3. Maintenance accessories 5 - 10 4. Maintenance work in the plant 10 4.1 Visual impression 10 - 11 4.2 Analysis of wastewater and sludge 11 4.2.1 Drawing samples from the plant outlet for laboratory analysis 11-12 4.2.2 Determining the substances that can be deposited (SS120) 13 4.2.3 Assessing the odour, coloration and turbidity 13 4.2.4 Measuring the water temperature 14 4.2.5 Determining the pH-value 14 4.3 Analysis in the SBR chamber (aeration tank) 14 4.3.1 Determining the volume of sludge (SV30) 14 - 15 4.3.2 Assessment of the aeration pattern 16 4.3.3 Measuring the oxygen concentration 16 - 17 4.3.4 Simplified assessment of nitrification and denitrification 18 4.4 Sludge level measurement 18 - 19 4.5 Cleaning work 19 5. Maintenance of the machines 20 5.1 Air filter 20 5.2 Controller 20 5.2.1 Reading fault messages 20 5.2.2 Power-on hours 20 - 21 5.2.3 Reading out data 21 5.2.4 Functional test 22 5.2.5 Setting optimal operational values 22 - 23 5.3 Compressor 23 5.3.1 „NITTO“ piston compressor 23 - 24 5.3.2 „BECKER“ or „RIETSCHLE“ rotary slide compressor 24 - 25 6. Troubleshooting 26 6.1 Poor purification performance 26 6.1.1 Increased SS value 26 - 27 6.1.2 Increased COD or BOD5 value 27 - 28 6.1.3 Increased NH4-N value 28 6.1.4 Increased Ntot value 29 6.1.5 Increased Ptot value 30 - 31 6.1.6 Increased / decreased pH value 31 6.2 Bulking sludge 32 6.3 Floating sludge and foam 33 6.4 Smells 34 6.4.1 Smell of gas 34 6.4.2 Smell of ammonia 34 6.4.3 Smell of rotten eggs 34 7. Maintenance report 35 - 36 8. Wastewater parameters 37 - 38 ■■ 2 ■■ KLARO GmbH KLARO Maintenance Manual Table of figures Figure 1: Visual inspection of the tank 10 Figure 2: Minimum water level reached – the pump cannot be lowered any more 10 Figure 3: Withdrawing a random sample from the sampling vessel (black) using a bucket 12 Figure 4: Different sample bottles - Filling the random sample 12 Figure 5: Filling the sample 12 Figure 6: Determining the substances that may get deposited in the Imhoff funnel 13 Figure 7: Random sample in a measuring cup for assessing the odour, coloration and turbidity 13 Figure 8: Determining the pH-value using measurement or test strips 14 Figure 9: Removal of a sample of the activated sludge for testing the proportion of sludge by volume 15 Figure 10: Filling a sample of the activated sludge in the standing cylinder 15 Figure 11: Sludge quantity at the beginning of the 30-minute standing time 15 Figure 12: Sludge volume after a standing time of 30 minutes 15 Figure 13: Oxygen measuring instrument with the associated probe 16 Figure 14: Measurement of the oxygen concentration in the sample container 16 Figure 15: Immersed probe of the oxygen measuring instrument during aeration 17 Figure 16: Display unit of the oxygen measuring instrument 17 Figure 17: Typical trend of the oxygen concentration in the KLARO SBR chamber in the course of the day 17 Figure 18: Typical trend of the oxygen concentration in the KLARO SBR chamber with additional denitrification 17 during the day Figure 19: Inserting the sludge pipette 18 Figure 20: Sludge level measurement with a sludge pipette 18 Figure 21: Sludge pipette in the storage pipe 19 Figure 22: Determining the sludge level height with a yardstick 19 Figure 23: Removing the aeration grate 20 Figure 24: Checking the filter mat 20 Figure 25: Reading out the data manually 21 Figure 26: Reading out data via cable and PC 21 Figure 27: Reading out data on SD card 21 Figure 28: Opening the cover of NITTO compressors 24 Figure 29: Checking the air filter 24 Figure 30: Open housing for replacing the piston 24 Figure 31: Pistons 24 Figure 32: Checking the air filter 25 Figure 33: Measuring the capacitance of the capacitor 25 Figure 34: Checking the slider 25 Figure 35: P-module in the concrete cabinet 30 List of tables Table 1: Maintenance accessories 5 - 10 Table 2: Evaluation of nitrification / denitrification test strips 18 Table 3: Adjustment of aeration times 23 Table 4: Elimination of increased SS values 27 Table 5: Elimination of increased COD or BOD5 values 28 Table 6: Elimination of increased ammonia nitrogen values 28 Table 7: Elimination of increased total nitrogen values 29 Table 8: Elimination of increased total phosphorus values 30 - 31 Table 9: Elimination of increased/decreased pH-values 31 Table 10: Control of bulking sludge 32 Table 11: Elimination of floating sludge and foam 33 Table 12: Wastewater parameters 37 - 38 ■■ KLARO GmbH ■■ 3 The KLARO Maintenance Manual! 1. Introduction As a result of the robust wastewater They include self-checks and self-tests Before we begin, what we particularly treatment system and with proper ope- by the operator of the system as well recommend to you is the following: ration, the KLARO wastewater treat- as maintenance work by a specialist ment plant achieves optimal cleaning agency. or clarification performance and long service life. It is necessary to check The self-checks and self-tests are and maintain the plant regularly for described precisely in the logbook proper operation. that is supplied along with every KLARO plant. The tasks of the maintenance The requirements and regulations for specialist are meant to be explained operation and maintenance are not here in detail. This manual is to be uniform in the EU, but are governed considered as a recommendation. It and specified by each country inde- is closely in line with the maintenance pendently. rules and regulations of the DIBt and In Germany, these requirements are is based on more than ten years of governed and specified by the German practical experience that we have with Institute for Building Technology (DIBt). the KLARO SBR technology. •• document and record every maintenance with the help of the KLARO maintenance report (enclosure) •• carry out the work steps in the sequence in which they are listed in this manual (and in the maintenance report) •• to note down the serial number of the switch cabinet for any queries (is embossed on the nameplate in or fixed on the cabinet) 2. Safety instructions While doing maintenance work on the wastewater and on all surfaces that surfaces coming into contact with it). wastewater treatment plants, special come into contact with wastewater. precautionary measures need to be Inadequate or improper hygiene mea- adopted since there may be viruses, sures may lead to diseases (prevention The precautionary measures include: •• Wearing protective gear or safety clothing. pathogenic germs and worm eggs in of direct contact with wastewater and •• Wearing hygienic hand gloves. ■■ 4 ■■ KLARO GmbH Wash and sterilise hands after they come into contact with wastewater. •• Vaccination for tetanus and hepatitis B. •• Consulting a doctor if wastewater has been swallowed. •• Entry into the plant by any person must be safeguarded by another person, since you need to reckon with harmful gases within the plant. •• Do not drink or eat while working. 3. Maintenance accessories We have compiled a list of equipment, tools and spare parts that you should keep in order to be able to carry out maintenance professionally. Maintenance accessories Characteristics Sludge pipette •• Determining the sludge level in the pre-clarification / sludge storage Figure •• DN40; 2 m + 1 m Buckets + telescopic extraction stick •• Withdrawal of bailed samples from the plant outlet from the integrated sampling facility and sludge samples (SV30) from the SBR tank; •• Plastic cup, 500 ml, •• Telescopic rod, 1.0 – 3.0 m ■■ KLARO GmbH ■■ 5 KLARO Maintenance Manual •• Determining the proportion by volume of the sludge (SV30) Measuring cylinder •• 1,000 ml, Ø 65 mm •• Plastic or glass cylinder, graduated and completely transparent Imhoff funnel + holding frame •• Determining the substances that can be deposited (SS120) •• Glass funnel with division •• 1,000 ml Measuring cup •• Determination of odour, coloration and turbidity •• Glass cup with divisions and spout, 1,000 ml •• Sealable wide-neck made of HDPE Sampling bottles + refrigeration box bottles •• For laboratory analyses •• 1,000 ml for BOD5 and SS120 •• 500 ml for COD, N, P (transferred with 2 ml H2SO4) COD cuvettes •• Reagent cuvettes with chemicals for photometric COD measurement COD photometer •• Analysis of the COD value Safety glasses Oxygen measuring instrument, HACH LANGE HQ30d with sensor LDO101 ■■ 6 •• Eye protection when handling dangerous chemicals •• Measurement of dissolved oxygen [mg/l] in the activation tank and sampling; combined with temperature measurement [°C] ■■ KLARO GmbH KLARO Maintenance Manual •• Measurement of ammonium Ammonium test strips •• Assessing whether the aeration is enough •• Measuring range: 0 to 400 mg/l •• Measurement of nitrate Nitrate / nitrite test strips •• Measuring range: 0 to 500 mg/l •• Measurement of nitrite •• Measuring range: 0 to 80 mg/l Phosphate test strips •• Measurement of total phosphate •• Measuring range: 0 to 80 mg/l •• Determining the pH value pH measurement strips •• 100 pieces •• Measuring range: pH 4.5 - 10 Hygiene hand gloves •• Protecting the hands from germs Sterilisation agent •• Protecting the hands from germs Manhole cover remover •• Removal of shaft covers made of concrete / cast iron Socket wrench •• Socket wrench, 17 mm, for opening small shaft covers made of PE ■■ KLARO GmbH ■■ 7 KLARO Maintenance Manual Tape measure •• Determination of the sludge level height and water levels Cabinet key •• Opening all KLARO switching cabinets for indoor and outdoor installation Screwdriver •• Philips (slotted) screwdriver for dismantling the controller (outdoor cabinets) •• Blade length: at least 14 cm Socket wrench •• Socket wrench for fastening hose clamps •• 7 mm SD card Hose clamps •• Reading from controller (KLplus controller) •• Fastening hose pipes •• 13 / 19 mm Interface cable •• Reading from the controller (ZK, ZKplus and KLbasic controllers) Multimeter •• Measuring capacitance, voltage, current and conductance ■■ 8 ■■ KLARO GmbH KLARO Maintenance Manual Smoke cartridge •• Testing the bleeding of the plant Work gloves •• Protecting the hands while working on the plant Battery •• Replacement batteries for the ZK and ZKplus controllers •• 9V Controllers •• Spare controllers (KLbasic and KLplus) including the connection cables •• Spare coil with armature and spring Solenoid valve •• with a straight stem from 07/2002 to 05/2006 •• with conical stem from 06/2006 Air filter for the Nitto compressor •• Replacement of clogged air filters of a piston (or reciprocating) compressor, NITTO •• different sets for LA60/80, LA120 and LA200 Micro-fuses •• 2 A (slow speed), 8 A (medium speed) Disc aerator •• Replacement of defective disc aerators ■■ KLARO GmbH ■■ 9 KLARO Maintenance Manual Cooling fan •• As a spare for cabinets with a rotary slide compressor or to retrofit cabinets with reciprocating compressors •• As replacement if grommets Grommets break off •• Angled or straight Sealing tape •• In order to reseal hose connections and threads Table 1: Maintenance accessories 4. Maintenance work in the plant 4.1 Visual impression Figure 1: Visual inspection of the tank Figure 2: Minimum water level reached – the pump cannot be lowered any more After opening the shaft manhole cover, Shaft manhole cover can be you first obtain an overview of the visual reached easily / not delivered impression of the KLARO plant. •• the condition of the shaft manhole You need to take decisions regarding: •• the general accessibility to the plant ■■ 10 cover Breakages, cracks, functionality of the child lock for PE covers… ■■ KLARO GmbH •• the condition of the feed pipes and drain pipes Any signs of clogging •• the completeness and proper arrangement of the components installed KLARO Maintenance Manual Aeration equipment, air-lift pump, greyish foam, which collapses imme- Ingress of drainage water and high air hose pipes and sampling diately when touched water levels; any signs of leakage if •• the water levels of the individual chambers An indication that there is biology the level falls below the „minimum in the build-up; often observed du- water level“ Any signs of overflow in the cham- ring the start-up phase. •• Any signs of possible corrosion bers, hydraulic overload and prob- •• Signs of grease deposits, espe- lems with the air-lift pumps •• possible formation of floating sludge in the aeration chamber –– Surfactant foam: solid, white foam, that remains stable when touched Indication of the use of excessive detergent of washing agent –– Egg-white foam: cially in case of restaurants Grease separator overloaded or disposal is due •• the aeration and bleeding of the damage particularly in the case of concrete tanks; accompanied in most cases with technical problems and lack of aeration and bleeding. plant via the building roof, shaft manhole cover or other aeration equipment •• the leak-tightness of the tank externally 4.2. Analysis of wastewater and sludge 4.2.1 Drawing samples from the plant outlet for laboratory analyses A random sample of the discharge from the plant is withdrawn for subsequent laboratory analyses. For this purpose, wastewater is carefully withdrawn with the help of a bucket from the integrated sampling vessel (not the SBR chamber!). While doing so, do not touch the walls of the vessel for drawing samples, since otherwise deposits come loose and worsen the sample disproportionately. The random sample is filled carefully into the sealable sample bottle. There are different sample bottles depending on the laboratory and the parameters to be analysed. •• To determine the quantity of BOD5 the bottle must be filled completely and without any bubbles as far as possible. To do this, tap on the filled and open bottle, so that the air bubbles get released from the edge of the bottle. Fill up the sample bottle once again until it overflows. Close the cap at this stage. •• For the determination of COD, N and P compounds, often bottles are used that already contain sulphuric acid (H2SO4). As a result, all decomposition processes cease and there is no falsification in the analysis resulting from the period of transportation to the laboratory. •• To determine the quantity of SS, about 0.5 litres of the random sample must be filtered and the filter residue must be weighed. In general, glass fibre filters or paper filters having pore widths of 0.3 to 1 µm are used for the filtration. ■■ KLARO GmbH This is why the same random sample may be used for determining the quantity of BOD5. No separate sample bottle is required for this purpose. •• An exact quantity of 1.0 litre of wastewater is needed to determine the quantity of SS120. This is why we recommend that you fill an additional random sample in another sample bottle for the exact determination of the substances that can get deposited. The random sample must be removed carefully from the bottle and stored under refrigeration until the analysis is conducted. ■■ 11 KLARO Maintenance Manual Figure 3: Withdrawing a random sample from the sampling vessel (black) using a bucket Figure 4: Different sample bottles - Filling the random sample Figure 5: Filling the sample The sample bottles must be labelled should be brought to the laboratory as enclosure (or appendix) contains an in a comprehensible manner (Name / soon as possible since the composition overview of typical wastewater para- Date / Place). may change with time. meters and values, which are meant Finally, the samples must be kept under to assist you with the interpretation of refrigeration and stored in a dark place. The parameters with respect to which A refrigeration box with a cold pack is the samples should be analysed de- ideal for this purpose. The samples pend on the local requirements. The ■■ 12 ■■ KLARO GmbH the measured values. KLARO Maintenance Manual 4.2.2 Determining the substances that can be deposited (SS120) The substances that may get depo- Since solid substances get deposited sited (SS120) contained in the random on the slanted wall of the funnel, it is sample, indicate the proportion of the turned to and fro with a jerk 15 minutes solid content and include undissolved prior to the completion of the standing contaminants that may get deposited. time. The quantity of substances that may get The quantity of the substances that deposited is determined in an Imhoff may get deposited should not be more funnel (coneshaped glass). The Imhoff than 0.3 ml/l. funnel must be placed upright in a frame Since the determination of the subs- for this purpose. The random sample tances that may get deposited takes 2 is filled up to the 1,000 ml mark in the hours, we suggest that this measure- Imhoff funnel. The quantity of substan- ment should not be carried out at site ces that may get deposited must be but in your own factory or laboratory. determined by reading the volume of Until then, the sample must be kept substance at the tip of the funnel after under refrigeration. a standing time of 2 hours. Figure 6: Determining the substances that may get deposited in the Imhoff funnel 4.2.3 Assessing the odour, coloration and turbidity Traditional property parameters of a intense). The sample should have a wastewater sample are the odour, co- neutral or earthy smell. If it smells of loration and turbidity. The assessment moulds or has a foul or sanious smell, Turbidity of these semi-qualitative parameters the cleaning power of the wastewater Turbidity means the weakening of ra- reflects an excellent method of recor- treatment plant is faulty (e.g. on account diation passing through the sample. ding the condition of the treatment or of inadequate aeration). Turbidity is caused by suspended so- cleaning performance of a wastewater cleaning or treatment. lids. To assess the turbidity, the random treatment plant, without using measu- Coloration sample must be held in a measuring ring instruments. To assess the coloration, the colour cup against sunlight and the weake- It is best to evaluate the parameters strength and the shade of the colour ning of the light radiation needs to be immediately after withdrawing the ran- are viewed against a white background evaluated. If there are no suspended dom sample. and evaluated. The random sample solids in the random sample, the sam- should be clear to yellowish. A brown ple has no turbidity. If, on the contrary, or grey coloration indicates inadequate there are plenty of suspended solids Odour For the odour test, the measuring cup in the random sample, it becomes must be shaken with the sample filled. highly turbid. Intense turbidity or a The type of the odour is differentiated large amount of suspended solids are subsequently (none, weak, strong or a sign of sludge output. Figure 7: Random sample in a measuring cup for assessing the odour, coloration and turbidity ■■ KLARO GmbH ■■ 13 KLARO Maintenance Manual 4.2.4 Measuring the water temperature A scoop thermometer must be used for sample. Since the temperature is also measuring the temperature. This must measured with the oxygen measuring be held for 1-2 minutes in the random instrument, the scoop thermometer may be dispensed with. 4.2.5 Determining the pH-value The pH-value is the easiest to measure In addition, measuring instruments are with special test strips. You only need available, which measure the pH-value to immerse the test or measurement in multiples of 0.1 pH after calibration. strip in the random sample. As soon The pH-value should lie in a weakly as the test strip has been dipped in the alkaline range between 6.5 and 8.0. sample, it takes up a certain colour. This colour now needs to be compared with the colour scale. There are two types of measuring or test strips (universal and special test strips). The universal test strip can measure pH-values in the range between 1 and 12. The special test strip measures the value in a smaller range (e.g. pH 5 - 8) Figure 8: Determining the pH-value and has greater accuracy. using measurement or test strips 4.3 Analysis in the SBR chamber (aeration tank) Apart from removing a random sample, •• Proportion of sludge by volume For this purpose, the aeration of the ac- direct analyses also need to be carried •• Assessment of the aeration pattern tivation tank must be active or switched out in the activation tank. on in manual operation mode (Valve 2). •• Oxygen concentration 4.3.1 Determining the volume of sludge (SV30): The sludge volume is equivalent to For determining the volume of sludge The sample filled in the standing cylin- the volume of 1 litre of the activated (SV30), the aeration of the activation tank der must now be kept upright without sludge after a settling down period of must be active or it must be switched any vibrations and protected from direct 30 minutes. on in manual mode (valve 2). sunlight for 30 minutes. The volume of sludge is a measure As soon as the activation tank is well of the quantity of biologically active mixed, a sample of the activated sludge sludge. This value is an important pa- can be removed with the help of a bu- rameter in the field of wastewater ana- cket from the activation tank. lysis, since the performance capability The sample withdrawn must be filled of the activation plant is controlled by in a standing cylinder up to the 1,000 the sludge volume. ml mark. ■■ 14 ■■ KLARO GmbH KLARO Maintenance Manual Figure 9: Removal of a sample of the activated sludge for testing the proportion of sludge by volume Figure 10: Filling a sample of the acti- Figure 11: Sludge quantity at the be- Figure 12: Sludge volume after a stan- vated sludge in the standing cylinder ginning of the 30-minute standing time ding time of 30 minutes The volume of sludge is rounded off to It is sufficient to make only one mea- than 400 ml/l, the period of sludge 10 ml/l. If the volume of sludge is more surement to determine the sludge vo- recirculation must be increased. If the than 250 ml/l, the measurement must lume. This measurement reasonably sludge volume is considerably below the be repeated after dilution. reflects the volume of the sludge in 200 ml mark, the recirculation period For this purpose, the activated sludge the activation tank of the SBR plant. may be reduced or disabled completely. sample is diluted with wastewater. The This is why we recommend to dilute sample now diluted should have a the sludge sample and to repeat the sludge volume between 200 and 250 measurement if the sludge volume is ml/l. The new measured value obtained more than 250 ml/l. must be multiplied with a dilution factor. However, after 30 minutes, if the sludge volume in the standing cylinder is more ■■ KLARO GmbH ■■ 15 KLARO Maintenance Manual 4.3.2 Assessment of the aeration pattern: In order to assess the functionality of •• Moderate •• One-sided the wastewater aeration, the aeration Intensive, circulation is clearly Moderate (if multiple membrane identifiable aerators have been installed in the and bubble pattern in the activation tank is observed while aeration is being done. Pay attention to the following •• Coarse bubbles characteristics: Fine bubbles tank) 4.3.3 Measuring the oxygen concentration The oxygen content in the activation tank or the random sample is an important control parameter for wastewater treatment plants. The oxygen concentration is obtained with the help of measuring instruments, for which certain basic knowledge (calibration, maintenance, and storage) is required. The user manual of the measuring instrument must be studied for this purpose. The measured values are Figure 13: Oxygen measuring instrument highly accurate when they are used with the associated probe properly. Measurement in the sample container Hold the measuring probe of the oxygen Do not modify the aeration measuring instrument in the sample •• O2 > 6 mg/l container and take a new measurement. The oxygen concentration should be at least 2 mg/l. In case of substantial deviations, the aeration time of the controller must be adjusted ( see the section „Setting optimal operational values“). We recommend: •• O2 < 2 mg/l Increase the aeration •• O2 = 2 to 6 mg/l Reduce the aeration You need to consider also the following: •• There may be fluctuations depending on the season. The dissolution behaviour of oxygen is better in cold weather than in warm weather. Hence, the measured values in winter are often somewhat higher than in summer. vated sludge ( SV30). If the quantity of activated sludge increases, more oxygen is consumed and the oxygen concentration comes down. This aspect must be kept in mind particularly in plants having seasonal fluctuations and when the time for sludge recirculation in the controller is modified. •• The oxygen concentration also depends on the quantity of the acti- Figure 14: Measurement of the oxygen concentration in the sample container ■■ 16 ■■ KLARO GmbH KLARO Maintenance Manual Measurement in the activation tank The aeration of the activation tank re- of the measuring instrument must now started now. It measures the content mains switched on for the measurement be immersed in the activation tank. of oxygen dissolved in the wastewater of the oxygen concentration. The probe The measuring instrument may be automatically. Figure 15: Immersed probe of the oxygen measuring instru- Figure 16: Display unit of the oxygen measuring instrument ment during aeration Since the SBR process in the activa- and extraction), the oxygen concent- the oxygen concentration reduces, in tion tank for wastewater treatment or ration increases during the aeration contrast (see the following diagram for cleaning takes place in four different phase. Before and after the aeration this purpose). phases one after another chronologi- phase, that is, during the feeding, se- cally (feeding, aeration, sedimentation dimentation and extraction phase, Figure 17: Typical trend of the oxygen concentration in Figure 18: Typical trend of the oxygen concentra- the KLARO SBR chamber in the course of the day tion in the KLARO SBR chamber with additional denitrification during the day In KLARO SBR-plant that have also element, nitrogen. The oxygen concen- ment plant depends on the respective been designed for denitrification, short tration reduces considerably during the phase of the SBR process and a more bursts of aeration are used, prior to the Deni-phase (O2 ≈ 0 mg/l). In order to accurate interpretation of the oxygen actual aeration, to achieve circulation ensure optimal denitrification, the oxy- concentration measured - directly from of the activation tank (the so-called gen concentration should not be more the tank – is often very difficult. This is pre-aeration phase). In the process, than 0.5 mg/l during the denitrification. why we recommend that the oxygen the denitrified microorganisms are Thus, the oxygen concentration in the concentration be determined in the stimulated to convert nitrate into its activation tank of the wastewater treat- sample container. ■■ KLARO GmbH ■■ 17 KLARO Maintenance Manual 4.3.4 Simplified assessment of nitrification and denitrification In order to quickly and easily assess changes its colour, the higher is the storage should be approx. 50 mg/l the effectiveness of the nitrification/ concentration. In order to define the and the concentration of the effluent denitrification, semi-qualitative test effectiveness of the nitrification (NH4- sample from the outlet < 10 mg/l. If strips can be used as an aid. Here, N degradation), a sample is taken the concentration of the sample from a test strip (for ammonium or nitra- from the pre-clarification chamber/ the pre-clarification chamber/sludge te/ nitrite) is always dipped into the sludge storage (first chamber) and storage is much higher than 50 mg/l, taken sample. Afterwards, the con- an effluent sample from the outlet the inlet conditions must be exami- centration contained in the sample is taken from the sample container. ned. can be compared on the basis of a The concentration of the sample from colour scale. The more the test strip the pre-clarification chamber/ sludge Nitrification NH4 content Pre-clarification / Effluent sample from sludge storage the outlet ca. 50 mg/l < 10 mg/l ca. 50 mg/l > 10 mg/l poor nitrification > 50 mg/l > 10 mg/l poor nitrification Result good nitrification, O2 content sufficiently ca. 0 mg/l < 50 mg/l excellent denitrification Denitrification ca. 0 mg/l < 100 mg/l good denitrification NO3 content ca. 0 mg/l > 100 mg/l insufficient denitrification Table 2: Evaluation of nitrification/denitrification test strips Note: The result of the test strips threshold values are usually speci- is specified as NH4 and/or NO3. The fied as NH4-N and/or NO3-N. 4.4 Sludge level measurement The sludge level height in the pre- For this purpose, you need to shift the clarification / sludge storage has a direct layer of floating sludge to the side and impact on the cleaning or treatment dip the transparent sludge dip-stick with performance of a wastewater treatment the open valve in the pre-clarification / plant or septic tank. This is why it is sludge storage right up to the base of indispensable to check the sludge the tank. The valve is closed by pulling level height. The level is measured with a control cable (provided with a ball the help of a sludge dip-stick (acrylic valve) or with a forceful jerk (in case of glass tube). a non-return valve), and the dip-stick may now be pulled out again. ■■ 18 Figure 19: Inserting the Figure 20: Sludge level measurement sludge pipette with a sludge pipette ■■ KLARO GmbH KLARO Maintenance Manual Figure 21: Sludge pipette in the storage pipe The contents of the chamber are re- when 70% of the sludge storage is filled. produced in the sludge pipette as a The attention of the operator must be closed column. The sludge layer of the drawn to the need for disposal. pre-clarification sludge storage can The sludge removed with the help of thus be read directly. To do this, the the sludge pipette must be emptied sludge layer - the solid constituents - out again in the pre-clarification sludge must be clearly identifiable from the storage. By immersing the pipette again solid-free zone. in the aerated chamber, it becomes The sludge height is recorded in the clean inside. report. It is required to arrange for The sludge pipette, at best, must be proper disposal of the sludge from stored in a PVC pipe after use for the the pre-clarification sludge storage sake of hygiene. The storage pipe is for proper operation. It is necessary sealed at the bottom side with a stop- to dispose of the sludge storage latest per in order to trap any residual liquid. Figure 22: Determining the sludge level height with a yardstick 4.5 Cleaning work Finally, general cleaning work should •• Clearing any clogging or jamming be done within the plant: •• Removing deposits •• Replacing damaged installed components or kinked hose pipes ■■ KLARO GmbH •• Skim off the floating sludge on the activation chamber and put in the pre-clarification/sludge storage ■■ 19 KLARO Maintenance Manual 5. Maintenance of the machines 5.1 Air filter The filter for aerating the switch ca- with a screwdriver and the grate must binet (aeration grate on the left and be pulled by hand. The filter mat lies in right side of the housing wall in the the ventilation shaft without any other indoor cabinet or on the back side in fixture and may be shaken or blown off. the outdoor cabinet) must be checked NOTE: and cleaned or replaced if necessary. Clogged or choked filter mats impair To do this, the grate outside the cabi- the aeration and bleeding efficiency net must be removed. The clamp lock of the switch cabinet. Permanent must be loosened by pressing lightly consequences may include: Figure 23: Removing the aeration grate •• Overheating in the cabinet ( Temperature alarm of the controller gets triggered) •• Increased wear and tear of the electrical components, particularly the compressor and solenoid valves •• Reduced oxygen inlet by the compressor into the wastewater treatment plant Figure 24: Checking the filter mat 5.2 Controller 5.2.1 Reading fault messages You need to check the faults that have occurred since the time of the previous maintenance in the logbook of the controller. To do this, call up the following in the operator menu of the controller: •• „read out old errors“ (for KLplus and ZKplus) •• „Display errors or faults“ (for NOTE: There is a capacity to store 128 KLbasic and ZK) This is where the latest message is messages. If this number has been displayed with the date and time. By reached, every new message deletes pressing the button, deleted by the maintenance techni- you can go to the previous messages. cian in the service menu using the or the oldest one. The memory may be „clear logbook“ command. 5.2.2 Power-on hours The total power-on hours of the loads To do this, call up the following in the (valves, compressors, …) as well as the operator menu of the controller: •• „operating hours KLbasic and ZK) utilisation (only for KLplus and ZKplus) must be read out and recorded. ■■ 20 •• „operating hours meter reading“ (for KLplus and ZKplus) ■■ KLARO GmbH report“ (for KLARO Maintenance Manual The power-on hours of the compressor many treatment cycles have actually function „level measuring“ has been provide an indication of whether it is been executed. A standard plant com- set meaningfully. due for maintenance. pletes four cycles per day = 100%. The The „work load xx%“ (only in KLplus display primarily serves the purpose of and ZKplus) provides the ratio of how plausibility check to see whether the 5.2.3 Reading out data Reading out data via cable and PC The logbook of the controller may be •• PC (Laptop) controller. With the help of the KLA- read out on external storage media. •• Serial read cable, RS-232 RO@kom software, data is transmitted There are the following options available •• Possibly, USB - serial adapter and transferred to preformatted Excel at site for this purpose: Reading out with cable + PC (all KLARO •• Reading software KLARO@kom controllers) To read out the data, the RS-232 To read out the logbook via cable, you connector of the cable connected to need the following at site: the socket on the back side of the spreadsheets. These spreadsheets may be edited, saved and printed out, e.g. as an enclosure to a maintenance report. Reading out with an SD card (only KLplus) In order to read the data, the rubber transmitted completely, the display „SD ferred with the help of the KLARO@ stopper at the front of the controller is Card OK“ appears. Now, by pressing kom software from a PC to prefor- removed and an SD memory card is once again, you can exit from matted Excel spreadsheets. These inserted into the free slot. In order to the service menu and remove the SD spreadsheets may be edited, saved start the data transmission, you need memory card. Finally, seal off the card and printed out, e.g. as an enclosure to switch to the service menu to the slot in the controller carefully in order to a maintenance report. „SD Card“ option and confirm with to prevent the ingress of moisture. . As soon as the data has been The data read out in the PC is trans- Figure 25: Reading out the data ma- Figure 26: Reading out data via cable nually and PC ■■ KLARO GmbH Figure 27: Reading out data on SD card ■■ 21 KLARO Maintenance Manual 5.2.4 Functional test In the „Manual Mode“ menu, you can switch the loads on briefly and then again off to test all of them one after another. A malfunction in the electrical system is indicated by the controller as a fault. Proper working of the components should be checked visually in the wastewater treatment plant. NOTES: •• In the ZK and ZKplus controllers, the 9V battery is checked in parallel in the background. •• With the underloading detection activated in the KLplus and ZKplus controllers, the level is measured when valve 1 is in manual mode. •• As an alternative to switching the valves 1-4 manually, the option „operation test“ may be activated in the service menu. After a waiting period of two minutes, the controller automatically switches the valves 1-4 on for a few seconds and then again switches them off. Be careful when withdrawing an outlet sample! During the functional test for valve 3, the air lift generally transfers contaminated or water that has not settled adequately from the SBR chamber into the integrated sampling facility. Sampling for laboratory analyses is then no longer possible. Hence, always remove samples PRIOR to the functional test! 5.2.5 Setting optimal operational values The controllers are preset with the rupted by the „restart the cyc- the current aeration period loading embossed (PE number) and le“ function. set currently in hours per day the class of treatment of cleaning. In the process, for the sake of safety, ty to hold maximum 25 tables or tings may be adjusted to the actual conditions at site. We recommend that such adjustments are made only after a safe start-up phase, for example, in the course of the first maintenance. In or the maintenance report so that you can track the modification at the time of the next maintenance. Typical adjustments are: •• Adjustments of the PE number or cleaning (treatment) class. The current values set are displayed in the „setup report“ menu, for example, „KLARO 8 EW C“. Any other table may be selected in the service menu and activated by pressing . mains untouched. Increasing it may lead to the maximum period setup“. NOTES: menu only when the old cycle The new table selected is dis- has ended or has been inter- played in the „setup report“ rupted by the „restart the cyc- menu only when the old cycle le“ function. has ended or has been inter- ■■ 22 The modified cycle times are displayed in the „setup report“ NOTES: –– When modifying a clock cycle time, always confirm with –– –– The „Aeration phase T5“ re- sheets may be copied with the help of KLARO@kom-Tool for special applications. Consult KLARO for this purpose. •• Adjustment of the aeration times in order to reduce or increase the entry of oxygen during the aeration phase, the clock cycle „Aeration ON T6“ and „Aeration OFF T7“ may be changed in the service menu under the option „duration –– –– spreadsheets. Tables or spread- general, considerably lower running small steps and recorded in the logbook easily here. dix. The controller has a capaci- plant is assumed. The controller set- Control to lower levels should be done in aeration times can be tracked is given in the enclosure or appen- continuous maximum loading of the times may be achieved as a result. with T18. Modifications in the •• An overview of all controller tables KLbasic and KLplus display ■■ KLARO GmbH permissible total cycle time getting exceeded. This then leads to loss of the next cycle (the controller switches to „Cycle pause“) and to reduction in the total aeration period for the day. •• Adjusting the number of cleaning or treatment cycles. In case of plants that are constantly underloaded (e.g. only one person at home), the number of cleaning or treatment cycles may be reduced from four cycles to two cycles. You can achieve this most easily by increasing the cycle time for the „Settlement phase T8“ from the default setting of „90 min.“ to „100 min.“. As a result, the maximum total cycle time permissible gets exceeded and only every second cycle gets executed. In between, the plant switches to the „Cycle pause“ status. KLARO Maintenance Manual •• Adjusting the sludge recirculation time. The period of the sludge recirculation may be reduced or increased via T12. In the ZK and ZKplus, this is done in steps of minutes. In the KLbasic and KLplus, this may be set to the nearest second. The sludge recirculation time should be changed by a maximum of one minute or 60 se- primarily to conserve energy. The fill level, which leads to the commencement of a cleaning or treatment cycle, may be adjusted in the service menu under „Adjust fill level measurement“. The „work load“ in the „operating hours meter reading“ menu provides an indication of the actual ratio of the cleaning cycles to the pause cycles. Adjustment options: conds. •• Adjusting the underloading feature (only in ZKplus and KLplus). The underloading feature serves –– is low, fill levels in the tanks, however, are high and the discharge quality is unsatisfactory –– Increase „water level start at: xxx cm“ if: the loading displayed is high, the fill levels in the tanks, however, is low, the discharge quality is good but the plant operator is dissatisfied with the energy conservation. Reduce „water level start at: xxx cm“ if: the loading level displayed EXAMPLE: Clock cycle Function ACTUAL value Reduce Increase T5 Aeration phase [min] 250 250 250 T6 Aeration on [min] 4 3 5 T7 Aeration off [min] 6 7 5 Table 3: Adjustment of ventilation times 5.3 Compressor The maintenance work and intervals depend on the type of compressor. 5.3.1 „NITTO“ piston compressor Detailed instructions on the operation NOTES: and maintenance as well as drawings –– ly, otherwise the equipment If the compressor is operated are given in the Operating Manual. beyond the 25,000 hours of We recommend the following for main- operation, the air compressi- tenance: on capacity may get impaired. •• Checking the air filter with EVERY This must be compensated by maintenance •• Replacing the piston set after 25,000 hours of operation increasing the aeration period. If tinkling or tapping noises can be heard, the piston set may get damaged irreparably. –– There is a video clip available that demonstrates the maintenance of the compressor in an illustrative manner. You may send us a request for a copy free of charge. must be replaced immediate- ■■ KLARO GmbH ■■ 23 KLARO Maintenance Manual Figure 28: Opening the cover of NITTO compressors Figure 29: Checking the air filter Figure 30: Open housing for replacing Figure 31: Pistons the piston 5.3.2 „BECKER“ or „RIETSCHLE“ rotary slide compressor Detailed instructions on the operation •• Checking the air filter with EVERY and maintenance as well as drawings maintenance, but at least semi- A clogged or choked air filter leads are given in the Operating Manual. annually to reduced air compression capacity We recommend the following for maintenance: –– Omitted for the smaller design, BECKER DT 4.4 – 4.8 –– Blow off or replace contaminated air filters ■■ 24 ■■ KLARO GmbH NOTE: and cooling of the equipment. KLARO Maintenance Manual Figure 32: Checking the air filter •• Checking the slider width at least every 3,000 hours of operation. –– –– –– Disconnect the capacitor NOTE: Use a multimeter (with capaci- The starting capacitor causes the Record the slider width measu- tance measurement feature) with red in the maintenance report crocodile clips. For measuring in order to be able to track wear leads having test tips, you should and tear and procure spare sli- use a clamp (see figure) for as- ders in time. sistance. Measurement directly compressor in the wrong direction (suction instead of compression). your fingers to press the test tips minimum permissible value, the on the leads of the capacitor. rest of the slider may break and least every 3,000 hours of opera- (very weak) capacitor may start the the result just as when you use If the slider width goes below the •• Checking the starting capacitor at tion when it is switched on. A worn on the terminal board will distort NOTE: block the rotor. compressor to run in the right direc- –– Target value [mF] is embossed on the nameplate of the compressor tion. Figure 33: Measuring the capacitance Figure 34: Checking the slider of the capacitor ■■ KLARO GmbH ■■ 25 KLARO Maintenance Manual 6. Troubleshooting 6.1 Poor purification performance A poor purification performance along plant, the first thing to be checked NOTE: with a possible exceedance of limit should be the execution of sampling. When taking samples by means of a values is an indicator of the small waste- In the case of random samples, it must dipper, it must be ensured that the water treatment plant either not working be ruled out that. dipper does not scratch the bottom during the scooping movement or the correctly or increased pollutant levels in the feed. •• the sample container contained walls when inserting and removing A properly planned and regularly main- residues of cleaning agents or the dipper. tained small wastewater treatment plant another sample, If the results are implausible, a se- which is not subject to overloading generally exhibits very stable purification behaviour. Malfunctions need to be expected if the measured values are not in the usual range of variation or are higher than the anticipated values. If limit values are exceeded, action must be taken. Before considering operational or structural changes, the measured value •• too many solids are present in the sample due to contamination of the integrated sampling unit, the dipper or the sample container leading to distortion, •• a mix-up could be possible because of missing, inappropriate or incorrect identification of the sample container. cond measurement must be performed. If the increased outlet value measured is plausible and if there is no overloading of the small wastewater treatment plant, the cause of the present malfunction must be determined. When doing so, keep in mind that it does not always have to be a single cause which is responsible for elevated measured values. must first be checked for plausibility. Increased outlet values may also If increased levels are measured at the be due to the combined effect of outlet of the small wastewater treatment several causes. 6.1.1 Increased SS value If the small wastewater treatment plant is adequately dimensioned and the bioreactor works smoothly, the SS value at the outlet should be about 10 mg/l. Consequently, an increased solids overflow only applies if the SS value exceeds 30 to 50 mg/l at the outlet. ■■ 26 The most common causes for an elevated SS value are: •• Full primary settlement chamber/ sludge storage, •• Increased solids concentration in the bioreactor (SV30 > 400 ml/l), •• Sludge bulking, ■■ KLARO GmbH •• Floc disintegration, •• Hydraulic overload. KLARO Maintenance Manual Observation Cause Elimination Increased solids concentration in the bioreactor Gradually increase excess sludge recirculation Sludge bulking Increase oxygen supply Floc disintegration Adjust pH by means of lime, soda or caustic soda. Check feed for inhibiting substances (disinfectants, medicaments, food residues, residues from renovation work: paint, paste, etc.) Hydraulic overload Check the inlet volumes. Check built-in and electrical components (switch cabinet) Full primary settlement chamber Arrange for desludging of the primary settlement chamber Increased SS value Table 4: Elimination of increased SS values 6.1.2 Increased COD or BOD5 value In new small wastewater treatment plants, it generally takes some time for the activated sludge required for biological purification to form. Up until this moment, the purification performance will not yet reach its full potential. Moreover, an increased COD or BOD5 value at the outlet is due to both particulate and dissolved substances. For example, depending on the organic content, 1 mg/l solids has a COD value of 0.8 – 1.6 mg/l. As with the increased SS value, this may have several reasons. The most common causes include, for example: •• Increased solids concentration, •• Sludge bulking, •• Floc disintegration, •• Hydraulic overload, •• Incorrect or insufficient aeration. An increased solids concentration in the bioreactor may reduce the sedimentation effect. Clear water can no longer sufficiently separate from the sludge floc which results in sludge overflow. An efficient means to counteract solids overflow is an increased excess sludge recirculation. However, the excess sludge recirculation should only be increased gradually. A poorly settleable and easily floating sludge structure (bulking sludge) may also lead to an increased COD or BOD5 value. Bulking sludge refers to excessive growth of filamentous microorganisms. In contrast to flocforming microorganisms, they exhibit poorer settling properties and are discharged from the small wastewater treatment plant together with the clear water. In most cases, sludge bulking is due to an insufficient oxygen supply or an insufficient mixing within the bioreactor. Reduced oxygen conditions stimulate the growth of filament formers. Therefore, the oxygen supply should be checked and increased if necessary. In addition to filamentous microorganisms, the augmented disintegration of sludge floc may result in an increased sludge overflow and thus increased outlet values. Floc integration is usually caused by: For this reason, the pH must always also be determined. If the pH is below 6.5 or above 9.0, this usually results in floc disintegration and an inhibition of purification performance. In order to stabilise the pH, chemical additives (alkalis) must be added to the bioreactor in such an amount and until the pH is set to a range of 6.5–8.0. For cost reasons, the addition of lime is recommended. A hydraulic overload may result in an increased input of solids from the primary settlement chamber into the bioreactor. The bioreactor is then overloaded with increased pollutant levels. Moreover, an increased input of solids into the bioreactor is also caused by a full primary settlement chamber. In such a case, sludge disposal should be arranged for. •• The destruction of the structural substance of the sludge floc due to the pH in the bioreactor being too low or too high, •• Inhibiting substances in the wastewater treatment plant feed, •• Salt impacts in the wastewater treatment plant feed. ■■ KLARO GmbH ■■ 27 KLARO Maintenance Manual Observation Increased COD or BOD5 value Cause Elimination Increased solids concentration in the bioreactor Gradually increase excess sludge recirculation Sludge bulking Increase oxygen supply Floc disintegration Adjust pH by means of lime, soda or caustic soda. Check feed for inhibiting substances (disinfectants, medicaments, food residues, residues from renovation work: paint, paste, etc.) Hydraulic overload Check the inlet volumes. Check built-in and electrical components (switch cabinet) Incorrect or insufficient aeration Check aeration intervals and readjust if necessary Full primary settlement chamber Arrange for the desludging of the primary settlement chamber High proportion of substances with poor degradability or that do not degrade at all Informing the operator about problematic substances Humic materials -- Table 5: Elimination of increased COD or BOD5 values 6.1.3 Increased NH4-N value In small wastewater treatment plants with additional nitrification, the inorganic nitrogen compound ammonium (NH4+) of the raw wastewater is oxidised into nitrate (NO3-). This transformation requires a large amount of oxygen. In order to measure the nitrogen balance, ammonia nitrogen (NH4-N) is used. If the ammonium content at the outlet is elevated, possible causes generally include a reduced activated sludge performance and insufficient aeration. It must be kept in mind that the Observation Increased NH4-N value nitrification performance depends on the temperature in the bioreactor. If the water temperature inside the bioreactor falls below 10°C, the nitrification performance is inhibited. When eliminating faults with the nitrification, the oxygen content should be checked first. If the oxygen content at the outlet is less than 2 mg/l, this represents an insufficient oxygen concentration. Defective devices such as disc aerators, hoses and compressors are possible causes for an insufficient oxygen concentration. Increased NH4-N values at the outlet at water temperatures of below 10°C do therefore not represent a malfunction. The same applies to previous temperature fluctuations even if the current water temperatures are within the range greater than 12°C. Cause Elimination Insufficient oxygenation Increasing the aeration Aerobic sludge age too low Temporarily switch off the sludge recirculation. Water temperature below 10°C -- pH - value is too low (<6.5 > 9) or too high Readjust the pH value by using lime, soda or soda lye. Table 6: Elimination of increased ammonia nitrogen values ■■ 28 NOTE: ■■ KLARO GmbH KLARO Maintenance Manual 6.1.4 Increased Ntot value During denitrification, nitrate is transformed into elemental nitrogen (N2) via nitrite under anoxic conditions (oxygen-free phase). Most bacteria contained in the activated sludge are capable of this process. For an effective denitrification, both sufficient organic carbon and nitrate are needed. If a high concentration of ammonium or nitrate is measured at the outlet, this is indicative of insufficient nitrogen degradation. An improper excess sludge recirculation which heavily reduces the sludge content in the bioreactor does not only impair nitrification performance but also denitrification performance. Observation Increased Ntot value The oxygen input is of critical importance for the denitrification performance. An excess oxygen supply has an inhibiting effect on the denitrifying bacteria. In addition, there must be a sufficient contact between the wastewater and the denitrifying bacteria. On the one hand, this is ensured by means of a complete mixing inside the bioreactor through short aeration periods and, on the other hand, by means of a 30-minute contact time. A sufficiently long contact time is required as denitrification does not begin immediately but only after the dissolved oxygen has been used up by the bacteria. If the anoxic phase is too short and if the mixing inside the bioreactor is insufficient, the nitrate will only be denitrified incompletely. If denitrification is impaired by the contact time being too short or an unfavourable arrangement of the cycle starting times, the denitrification period and the cycles must be readjusted. Cause Elimination Increased oxygenation during the denitrification phase Extending the denitrification phase Insufficient nitrification Improving the nitrification performance by raising the oxygen content in the ventilation phase Contact time too short Extending the mixing process Amount of activated sludge too low Shortening or temporarily switching off the excess sludge removal Water temperature below 10°C -- Table 7: Elimination of increased total nitrogen values ■■ KLARO GmbH ■■ 29 KLARO Maintenance Manual 6.1.5 Increased Ptot value Thanks to the addition of a precipitant, the dissolved phosphates contained in the wastewater are transformed to an undissolved form and can thus be separated. Possible precipitants primarily include iron compounds (iron chloride, iron sulfate, iron chloride sulfate) or aluminium compounds (poly-aluminium chloride, aluminium chloride, sodium aluminate, aluminium sulfate). The precipitation performance significantly depends on the dosage, the pH and the precipitation conditions. Possible causes for increased Ptot values at the outlet are: •• Underdosage of precipitant, •• Empty precipitant canister, treatment plant and is therefore visible from the outside. An underdosage of precipitant can be rectified through an increase (in the case of pumps with potentiometers) or an extension of the pumping duration. If the precipitant canister contains a sufficient amount of precipitant and the dosing pump runs properly, possible causes for an insufficient phosphate precipitation include the disruption of the liquid flow or a dysfunction regarding the uptake of chemicals into the hose. The supply flow may be disrupted if air instead of precipitant is sucked into the hose. This is caused by the hose having been incorrectly inserted into the precipitant canister. •• Defective dosing pump, •• Disruption of the supply flow, •• Dysfunction regarding the uptake of chemicals into the hose, •• Leaking dosing line, •• External impact loads. NOTE: If the hose is attached to a pipe or rod and inserted vertically into the canister down to its bottom, the hose can no longer curl up inside the precipitant canister and suck in air. In addition, clogging of the lines may also block the uptake of chemicals. Clogging is usually due to the following causes: •• Incrustation in the canister, •• Crystallisation of the solution because of low temperatures. In such cases, the clogging must be removed and the precipitant must be replaced. In addition, the precipitant flow may be prevented by defects in the dosing line causing the precipitant to no longer be pumped up to the small wastewater treatment plant. The line must be checked for leaks. If the dosing line is leaking or broken, discharge into the soil must be prevented. External impact loads resulting in an increase of phosphate compounds must be discussed with the operator of the small wastewater treatment plant. Elevated phosphorous loads are usually due to the introduction of food residues. In case of a malfunction regarding phosphate precipitation, the overall dosing mechanism (dosing pump, precipitant canister, hoses) must be checked first. For this purpose, the dosing of the precipitant is to be activated manually and the dosing point is to be checked. The dosing point for the precipitant is exposed inside the small wastewater Figure 35: P-module in the concrete cabinet Observation Increased Ptot value ■■ 30 Cause Elimination Underdosage of precipitant Increase or extension of dosing amount/duration Empty precipitant canister Refill with new precipitant Defective dosing pump Replacement of the defective pump with a new dosing pump Disruption of the supply flow Correct insertion of the dosing hose into the precipitant canister In addition: attachment of the hose to pipe/rod ■■ KLARO GmbH KLARO Maintenance Manual Increased Ptot value Dysfunction regarding the uptake of chemicals into the hose (incrustation, crystallisation) Removal of clogging Replacement of the crystallised precipitant Leaking dosing line Replacement of the dosing line External impact loads with phosphorous compounds Avoiding the introduction of food residues Table 8: Elimination of increased Ptot values 6.1.6 Increased / decreased pH value An increased or decreased pH-value is mostly due to external factors. As an example, a pH of more than 8.5 is a detectable indicator for the introduction of alkaline substances (cleaning agents for the removal of fats and oils). The risk posed to bacteria and thus the risk of an insufficient purification performance of the small wastewater treatment plant increases with the amount, duration and lye concentration of the introduced substances. Even though the wastewater in the small wastewater treatment plant has a certain buffering effect causing the alkalis to be essentially neutralised and preventing damage to the biological components, a pH of more than 9.0 due to the alkalis introduced may inhibit or destroy the bacteria in the bioreactor. Moreover, in combination with elevated wastewater temperatures, a high pH result in the formation of ammonia (NH3). Ammonia has a strong inhibiting effect on nitrification. If the alkalis are already present in the activation (bioreactor), it is only possible to take measures which limit the potential consequences for the purification performance. The following measures are recommended against an increased pH: stances. The risk posed to the purification performance rises with an increasing amount and acidity of the substance. When introducing acidic substances into the bioreactor, the inhibition or destruction (floc disintegration) of the biological components cannot be ruled out. In addition, there is an increased risk of corrosion for built-in components. •• Intensified aeration (maximum possible oxygen supply), The following measures are recommended for controlling a decreased pH: •• Addition of iron and aluminium salts (PAC) in order to neutralise the alkalis, and •• Addition of alkaline neutralisers (calcium hydroxide, soda, caustic soda) •• Monitoring further pH development. If the pH falls below 6.5, this may be due to the introduction of acidic sub- Observation Cause Elimination Increased pH Introduction of alkaline substances Addition of iron and aluminium salts (PAC) Decreased pH Introduction of acidic substances Intensified aeration Addition of alkaline neutralisers (calcium hydroxide, soda, caustic soda) Table 9: Elimination of increased/decreased pH-values ■■ KLARO GmbH ■■ 31 KLARO Maintenance Manual 6.2 Bulking sludge If bulking sludge – activated sludge with very poor settling properties – is present, the activated sludge “stands” in the bioreactor without settling properly during the sedimentation phase. This results in a very high risk of sludge overflow. When determining the sludge volume SV30 under such conditions, there is no compact sludge structure at the bottom of the measuring cylinder even after a settling time of 30 minutes. The sludge floc is of light brown colour and appears very voluminous. Bulking sludge is caused by about 30 different filamentous bacteria which are most readily identified by means of a microscope. The increased growth of filamentous bacteria is due to wastewater-related, plant-related and operational causes. •• Wastewater-related causes: –– Nutrient deficiency phosphorous) (nitrogen/ –– Septic wastewater sulphide) (hydrogen –– Extreme pH-values Observation •• Plant-related causes: –– Removal of deposits from the sewer system and the plant which result in the wastewater becoming septic, –– Increase of the oxygen supply by intensifying aeration intervals, Insufficient aeration (low oxygen supply) –– Increase of the excess sludge discharge, Prior to taking measures against sludge bulking, keep in mind that bulking sludge mainly occurs in transition periods (autumn/winter and spring/summer). In such transition periods, the overall biocoenosis of the activated sludge is subject to more intense changes due to temperature fluctuations. The filamentous bacteria are less sensitive to such changes and propagate more intensively during this time. Meanwhile, the activated sludge is bulking but still exhibits a good performance. If the purification performance is not yet impaired by the overflowing sludge, it is not necessarily required to take intensive countermeasures. –– Addition of calcium hydroxide, iron or aluminium salts in order to weigh down the activated sludge, –– External nutrient addition when detecting nutrient deficiency in the plant’s feed –– Long sludge storage times (digestion) –– Poor mixing •• Operational reasons: –– For controlling excessive sludge bulking, several measures are possible: Cause Elimination Septic wastewater Removal of all deposits from the sewer system and the plant Extreme pH-values Adjust pH by means of lime, soda or caustic soda. Check feed for inhibiting substances (disinfectants, medicaments, food residues, residues from renovation work: paint, paste, etc.). Nutrient deficiency Check the nitrogen and phosphorous concentration in the feed. In case of a deficiency, external addition of nutrients Incorrect or insufficient aeration Check aeration intervals and readjust if necessary Long sludge storage times Arrange for draining of the primary settlement chamber Increased sludge bulking Table 10: Control of bulking sludge ■■ 32 ■■ KLARO GmbH KLARO Maintenance Manual 6.3 Floating sludge and foam A dysfunction similar to sludge bulking is the formation of floating sludge and foam inside the bioreactor. Long-chain fatty acids are degradation products from fats and surfactants (detergents). The formation of floating sludge and foam is characterised by: In addition, they are created due to septic wastewater in the preliminary settlement chamber or with sludge deposits. Foamforming bacteria especially form in so-called stagnation zones due to insufficient mixing. As soon as the effects of an insufficient oxygen supply creating a growth advantage for filamentous bacteria and septic water enabling the formation of fatty acids combine, floating sludge and foam are formed. •• A large, compact floating sludge layer, and •• Brown, greasy foam. Moreover, the foam cannot be removed by means of hosing. In most cases, the process is not impaired by foam formation. The process quality is only influenced if the foam flakes reach the sampling unit or directly enter the outlet. The formation of floating sludge/foam is mainly an operational and aesthetic problem which leads to an increased effort when it comes to removal work. Like sludge bulking, the formation of floating sludge / foam occurs in seasonal transition periods (spring/ summer and autumn/winter). The formation of floating sludge and foam preferably occurs if an increased amount of longchain fatty acids is formed in the wastewater. Observation A targeted elimination of floating sludge/foam formation is only possible to a limited extent. In addition, the excess sludge discharge should be increased temporarily in order to reduce the sludge age inside the bioreactor (lower solids content in the bioreactor). Since the nitrification performance of the bioreactor is reduced, this measure should only be used for plants requiring nitrification if this is absolutely necessary. NOTE: Foam is also formed in the bioreactor during the break-in period. However, this is due to the growth of biomass. The foam is light beige in colour, degrades very quickly and does not represent a malfunction. The measures: •• Hosing, and •• Discharge into the preliminary settlement chamber can only be successful for a short time. In contrast, it is efficient to remove the floating sludge layer from the small wastewater treatment plant. Cause Elimination Septic wastewater Draining of the preliminary settlement chamber / sludge storage Change of the inlet water: •• Less washing machine cycles per day Floating sludge and form formation in the bioreactor Impact loads with surfactants and fats •• Changeover to bio-degradable detergents and cleaning agents •• Reduced use of fat and oil in the kitchen Incorrect or insufficient aeration Check aeration intervals and readjust if necessary High sludge age Increase excess sludge discharge Table 11: Elimination of floating sludge and foam ■■ KLARO GmbH ■■ 33 KLARO Maintenance Manual 6.4 Smells As with municipal wastewater treatment plants, the operation of a small wastewater treatment plant is not completely free of smells. If the ven- ting of the small wastewater treatment plant is intact, no smells are detectable while the plant is in its closed condition. Only if ventilation is insufficient, smells may escape from the small wastewater treatment plant. •• Electrical equipment in the area of the small wastewater treatment plant must be switched off. The equipment must be switched off via the main switch or by remote control. •• The feed situation must be checked. 6.4.1 Smell of gas In the event of a detectable smell of gas and possible streaks in the wastewater, it is likely that readily combustible gases and/or liquids have entered the small wastewater treatment plant. There is an acute risk of explosion and fire. The following immediate measures must be taken: •• The airlift pumps (feed, clear water and excess sludge lift) must be adjusted. 6.4.2 Smell of ammonia If a smell of ammonia is detected, this may indicate an increased feed of ammonium compounds. In addition to increased outlet values, the oxygen consumption in the bioreactor is higher. The feed must be inspected for possible sources of wastewaters containing ammonium (liquid manure, etc.). in the pipes leading to the small wastewater treatment plant cause the formation of hydrogen sulphide (H2S). The H2S contained in the plant can be converted by means of FeCl3. 6.4.3 Smell of rotten eggs If there is a smell of rotten eggs, the feed contains an increased amount of sulphurous substances. Deposits ■■ 34 ■■ KLARO GmbH KLARO Maintenance Manual 7. Maintenance report Location (address): Maintenance Company: Date of maintenance: Serial number: Order no.: Plant size: Actual connection: Operator's name: Street: Postcode / City: Tel.no.: No Is industrial wastewater also introducted? Restaurant without a kitchen Restaurant with a kitchen Others Grease separator available, NG Emptying necessary 1. Visual impression (structural condition of the filled plant): The system is accessible Yes No The manhole cover is in good connection Yes No Feed pipes and drain pipes are free Yes No Installed components OK Yes No Water levels OK Yes No Aeration tank has no floating sludge Yes No No foam formation Yes No No grease deposits Yes No Aeration and bleeding OK Yes No Partitions OK Yes No Corrosion damage Yes No The plant is not leak-proof externally Yes No Remarks: 2. Analysis of wastewater and sludge (Sampling): Hours Sampling time: °C Air temp.: Sampling point: Sample container SBR chamber Sample transport: cooled to 4°C frozen Odour: None None weak strong foul earthy Coloration: weak strong beige brown Turbidity: None weak strong opaque Floating substances: None low plenty SS120: BOD5: mg / l Water temp.: mg / l pH-value: COD: mg / l NH4-N: mg / l SS: Ntotal: ■■ KLARO GmbH °C mg / l mg / l ■■ 35 KLARO Maintenance Manual 3. SBR Reactor Proportion of sludge by volume: ml/l (maximum 400 ml/l) Oxygen concentration: Air intake / Aeration: mg/l (normal about 4-6 mg/l ; at least 2 mg/l) moderate fine bubbles Aeration pattern / Aeration: intensive, circulation is clearly identifiable uniform Remarks: 4. Pre-clarification / Sludge storage + buffer: cm Sludge height: Floating sludge height: cm The operator should arrange for emptying out the septic tank Remarks: 5. Maintenance of the machines: Air filter: Air filter cleaned Air filter replaced Controller: Faults have been read Remarks: Controller type: Total power-on hours: Charging (Valve 1): Discharge (Valve 3): Aeration (Valve 2): Recirculation (Valve 4): UV reactor: Replace the lamp after power on hours: Remarks: Data has been read Functional test / check performed Charging air lift / Valve 1 (red) Aeration / Valve 2 (blue) Discharging air lift / Valve 3 (black) Excess sludge air lift / Valve 4 (white) Remarks: Compressor: Compressor type: Compressor OK Checking the blades (Width of the blades: Condenser OK mm) Replacing the filter Replacing the diaphragms Cooling fan OK Remarks: 6. Supplementary Remarks: Maintenance has been recorded in the logbook Logbook is available Programming has been changed: The fault has been rectified: Supplementary Remarks: 7. To be initiated by the operator: The operator is requested to pay attention to the materials not to be fed (see logbook). The tank is jammed and the operator must ensure discharge. Shut down the tank (arrange for disposal of the sludge storage). Date and signature ■■ 36 ■■ KLARO GmbH KLARO Maintenance Manual 8. Wastewater parameters Wastewater parameters BOD5 [mg/l] Biochemical oxygen demand COD [mg/l] Chemical oxygen demand SS [mg/l] Suspended solids NH4-N [mg/l] Nitrogen-Ammonium Ntotal [mg/l] Total nitrogen Ptotal [mg/l] Total phosphorous SS120 [ml/l] Settleable solids Feed and discharge Explanation Limit values Raw KLARO pro- wastewater cess values Measure for the total of the biologically decomposable wastewater constituents. BOD5 indicates the amount of oxygen 20 - 40 that is need for the biological decomposition of organic substances in a period of five days. 150 - 500 5-9 Measure for the total of all organic wastewater constituents, including those that are difficult to decompose. COD indicates the amount of oxygen 90 - 150 that is necessary for complete oxidation of organic wastewater constituents. Parameters for the degree of contamination 300 - 1000 39 - 48 Measure for the totality of the undissolved wastewater constituents that are removed by filtration. In raw 30 - 75 wastewater, the undissolved substances make up about 1/3 of the contamination. 200 - 700 5 - 15 Measure for the oxidative decomposition of nitrogenous compounds by 10 - 20 nitrifying bacteria (nitrification). Proportion of nitrogen in the wastewater in the form of ammonium. 22 - 80 0,8 - 7 Measure for the efficiency of the nitrogen decomposition (nitrification and denitrification). 25 Total of the organic and inorganic nitrogenous substances in the wastewater. 25 - 100 16 - 20 Measure for the pollution of raw wastewater with phosphorous compounds. 1-5 The elimination of Ptotal takes place to a large extent via the P precipitation. 5 - 20 0,4 - 3 Measure for the totality of the water constituents that settle down within two hours. The substances that settle down make up about 1/4 of the total wastewater constituents. 1 - 20 < 0,1 - 0,3 ■■ KLARO GmbH ■■ 37 KLARO Maintenance Manual pH-value [-] O2 [mg/l] Oxygen concentration Measure of the hydrogen ion concentration and thus, for the acidity of the wastewater. The lower the pH-value, the more acidic is the wastewater. The efficiency of the bacteria to be decomposed depends on the pHvalue (Optimum: 6,5 – 8,0). 7,2 - 8,2 6,5 - 8,0 Measure of the concentration of dissolved oxygen in the wastewater. The oxygen is essential for the aerobic treatment of wastewater. Impurities in the water (wastewater) lead to great wastage of oxygen. Hence, the oxygen concentration of raw wastewater is equal to zero. 0 >= 2 Table 12: Wastewater parameters This Maintenance Manual of KLARO is just a recommendation and is not entitled to completeness. ■■ 38 ■■ KLARO GmbH The KLARO principle Maximum operating reliability! No mechanics, pumps or electrical parts in the wastewater! All components are permanently connected to the filtering tank. All transportation processes are performed by the air-lift pump. All electrical parts are located securely outside the tank in the switch cabinet. Our benefits •• Almost all possible approvals •• Certified underload detection •• Extremely short delivery times thanks to optimised production •• Fully-biological mode of operation •• Legal threshold values undercut by up to 90% •• Quality products, with extremely high customer satisfaction levels •• Minimal power consumption •• 98% treatment performance in 6 hours •• All transportation processes performed by air-lift pump •• TÜV-tested switch cabinets (EPP, indoor switch cabinet, outdoor switch cabinet) •• Treat water and introduce it back into the natural cycle •• Only one tank required for systems of up to 20 PE (Personnel Equivalent) •• Suitable for retrofitting to practically any tank shape •• Retrofitting possible in single, twin, triple and multi-chamber pits •• Installation possible in any type of tank, from plastic to fibreglass to concrete KLARO GmbH Spitzwegstraße 63 95447 Bayreuth Telephone: +49 (0) 921 16279-0 Fax: +49 (0) 921 16279-100 E-Mail: [email protected] More information at www.klaro.eu Technical hotline +49 (0) 921 16279-330 Photo copyright: KLARO GmbH © KLARO GmbH Bayreuth 2013 / Art.-No. KKA 0062-01-13-engl