1
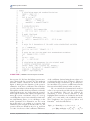
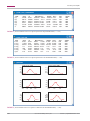
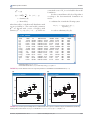
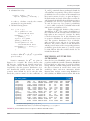
Overview WinBUGS: a tutorial Anastasia Lykou1 and Ioannis Ntzoufras2,∗ The reinvention of Markov chain Monte Carlo (MCMC) methods and their implementation within the Bayesian framework in the early 1990s has established the Bayesian approach as one of the standard methods within the applied quantitative sciences. Their extensive use in complex real life problems has lead to the increased demand for a friendly and easily accessible software, which implements Bayesian models by exploiting the possibilities provided by MCMC algorithms. WinBUGS is the software that covers this increased need. It is the Windows version of BUGS (Bayesian inference using Gibbs sampling) package appeared in the mid-1990s. It is a free and a relatively easy tool that estimates the posterior distribution of any parameter of interest in complicated Bayesian models. In this article, we present an overview of the basic features of WinBUGS, including information for the model and prior specification, the code and its compilation, and the analysis and the interpretation of the MCMC output. Some simple examples and the Bayesian implementation of the Lasso are illustrated in detail. 2011 John Wiley & Sons, Inc. WIREs Comp Stat 2011 3 385–396 DOI: 10.1002/wics.176 HISTORICAL BACKGROUND T he BUGS (Bayesian inference using Gibbs sampling) project was introduced in 1989 by the research group of David Spiegelhalter in the MRC Biostatistics Unit as a software that uses Markov chain Monte Carlo (MCMC) methods in complex Bayesian methods. BUGS was initially a software for DOS and Linux operating systems limited in specialized algorithms. The project started expanding after it moved to the Imperial College in 1996 headed by Nicky Best, and the first version of WinBUGS for Windows became available in 1997. In the following years, WinBUGS was improved and extended by considering more complicated model structures. Later when Jon Wakefield and Dave Lunn joined the group, WinBUGS capabilities improved impressively. The latest version of WinBUGS (1.4.3) was developed jointly by Imperial College and the School of Medicine at St Mary’s, London. More details can be found in Ref 1 and in the web page of OpenBUGS (http://www. openbugs.info). WinBUGS has become widely popular over the last years as it can estimate the posterior distributions ∗ Correspondence to: [email protected] 1 Department of Mathematics and Statistics, Lancaster University, Lancaster, UK 2 Department of Statistics, Athens University of Economics and Business, Athens, Greece DOI: 10.1002/wics.176 Vo lu me 3, September/Octo ber 2011 of the parameters of interest in a variety of models using MCMC. It only requires to specify the model code in which the model likelihood and the prior distribution are defined. The programming syntax and requirements are similar to the ones in R and Splus. For those who are not familiar with programming, there is also DOODLE, a graphical interface in which we can define our model via drawing the corresponding directed acyclic graph (DAG). Moreover, WinBUGS is freely available and this is one of the reasons that contributed in its growing popularity. A detailed manual,2 as well as three volumes of examples3–5 that provide important help and insight to the WinBUGS user, is available in the BUGS project website (www. mrc-bsu.cam.ac.uk). A comprehensive introduction in Bayesian modeling using WinBUGS is also offered by Ntzoufras,6 in which emphasis is given on model building, implementation using WinBUGS, and the interpretation and analysis of the posterior results. The purpose of this article is to provide a comprehensive short tutorial by summarizing the most important features of WinBUGS. It provides information on how to code and compile a model through two simple examples and a more detailed one that illustrates the implementation of Bayesian Lasso method in WinBUGS. The remainder of this article is organized as follows. Section ‘Getting Started with Winbugs’ contains a brief description of the menu bar and detailed illustration of the model specification, the 2011 Jo h n Wiley & So n s, In c. 385 wires.wiley.com/compstats Overview data and the initial values definition using two simple examples. Section ‘Running an MCMC in Winbugs and Obtaining Posterior Summaries’ provides a condensed list of the actions needed to run the MCMC algorithm for a model and how to obtain and analyze the corresponding output. An example of implementing the Bayesian Lasso in WinBUGS can be found in the Section ‘An Illustrating Example—Implementing Bayesian Lasso in Winbugs’. The article closes with a short discussion concerning the future potentials of WinBUGS followed by a short conclusion. GETTING STARTED WITH WINBUGS The Menu Bar The latest version of WinBUGS (1.4.3) as well as installation instructions and the free key for unrestricted use can be found on the software’s website: www.mrc-bsu.cam.ac.uk/bugs/win bugs/contents.shtml. Once the installation process has been completed, WinBUGS can be assessed by double-clicking its shortcut. All main operations are available in a menu bar, which is similar to the ones found at any windows-based program. The basic operations in the menu bar are the File, Window, and Help menus. The File menu handles the usual file actions that are available in any windows-based software (e.g., Open, Close, Save, Print), the Window manages active windows in WinBUGS and the Help provides access to the detailed manual and examples of WinBUGS which are very useful for the user. The Tools, Edit, Attributes, and Text menus refer to editing facilities of the documents in WinBUGS. To be more specific, the Edit menu allows the user to do the usual editing actions of any wordprocessing software (e.g., Copy, Cut, Paste), while the Tools menu manages more specialized actions available for WinBUGS compound documents (insert dates, encode, and decode algorithms). The WinBUGS user can change the color, the font type, and size of the text in a compound document using the Attributes menu, while he/she can find or replace a text, insert a ruler, a paragraph, or blank spaces (amongst other operations) in the Text menu. The most substantial WinBUGS operations are included in the Model and Inference menus. They include all the commands and actions related to running the MCMC algorithm and analyzing its output in order to obtain posterior results. The Specification tool, under the Model menu, is used to compile the model and initialize the MCMC algorithm; the Update tool generates 386 random observations from the posterior distribution and the Monitor Met tool checks the acceptance rate of the Metropolis-Hasting algorithm (in cases it is used). The last set of generated values can be saved using the Save State tool. This set of values can be used as initial values in cases that we want to rerun the MCMC algorithm from the point that a previous MCMC run stopped. The Inference menu provides information about the posterior distribution of the model parameters. This information is based on the analysis of the MCMC output. Under this menu, the most frequently used tool is the Samples tool, which provides basic descriptive summaries and graphical representation for specific attributes of the MCMC output and the corresponding estimated posterior distribution. The Info and Options menus are offering some auxiliary tools for MCMC analysis. From the former menu, we can open or clear a log window (where WinBUGS results and figures are printed) or we can extract the current parameter values using the Node info tool. From the latter menu, we can change some options concerning the output, the blocking and the generation algorithm used to update each parameter. Finally, the Map and the Doodle menus are offering more specialized tools for the user. The Map menu corresponds to the GeoBUGS add-in module and it can be used for spatial modeling and mapping. The Doodle menu is used to construct the DAG that describes the conditional dependencies of the Bayesian model we wish to fit. This tool is essential for those who are not familiar with programming as the model code can be generated from this graphical representation of the model. Nevertheless, it assumes very good knowledge and understanding of Bayesian models and how they can be represented in terms of conditional distributions and hierarchies. How to Code a Model WinBUGS uses its own type of input and output files that are called compound documents and are saved with the odc suffix. The first step in WinBUGS is to specify the model, which includes the likelihood function for the observed sample and the prior information for the parameters. The model code is written in a compound file within the syntax model { ...... } . There are three categories for the model parameters (or nodes): the constant, the stochastic, or random and the logical. The constant nodes are fixed values while the stochastic are random variables, such as the data and the model parameters. The stochastic nodes follow a distribution, which can be 2011 Jo h n Wiley & So n s, In c. Vo lu me 3, September/Octo ber 2011 WIREs Computational Statistics WinBUGS specified by using commands similar with the ones used in R and Splus packages. The logical nodes are mathematical expressions of other (constant or stochastic) components. Example 1 Let’s assume that a part of a Bayesian model includes a normally distributed variable X ∼ Normal(µ, σ 2 = 1/τ ), with known mean µ = 0 and unknown precision τ . If the uncertainty about the precision is expressed by considering the Gamma prior distribution τ ∼ Gamma(0.01, 0.01), this can be expressed in WinBUGS as follows: model{ mu <- 0 a<-0.01 b<-0.01 X ~ dnorm( mu, tau ) tau ~ dgamma( a, b ) sigma2 <- 1/tau # sigma2: variance of the normal distribution A[i,j,k] correspond to the Aijk element. Arrays of lower dimensions or parts of the initial array can be derived using syntax similar to the one used for the matrices; further details can be found in Section 3.3.2 of Ref 6. Calculations among vectors, matrices, and arrays cannot be performed directly in WinBUGS. The following calculation xT y between the vectors x and y can be performed using the function inprod( x[], y[] ) and the multiplication between two matrices A and B of dimension n × k and k × m can be performed using the inprod for all the rows and columns. Thus, the use of the function for is required to define a loop among the rows and the columns, and the multiplication is performed as follows: for (i in 1:n){ for (j in 1:m){ C[i,j] <- inprod (A[i,],B[,j]) } } } In the above syntax, the sign # is used to add comments, ~ is used to specify that a random node follows a distribution and <- is used to define assignments for constant and logical nodes. Nodes mu, a, b are constants here, X and tau are stochastic components and sigma2 is a logical component. The commands dnorm( mu, tau) and dgamma(a,b) are used to specify the normal (with mean mu and variance 1/tau) and the gamma (with mean a/b) distributions respectively. A list with all the distributions available in WinBUGS can be found at the software’s manual2 and in Ref 6, p. 90–91. Each component/node must be uniquely defined in the WinBUGS syntax. Vectors, matrices, and arrays can be represented in WinBUGS in a similar way as in R/Splus packages. In the example above, the random variable X is a scalar. If X is a n-dimensional random vector this is denoted in WinBUGS by X[]. Syntax X[i] refers to the i-th element of vector X for i = 1, . . . , n, whereas, X[i:j] extracts a vector with components the i-th up to the j-th element of X. If M is a matrix this is specified in WinBUGS by M[]. If M is a n × p matrix then M[i,j] corresponds the mij element of M for any i ∈ {1, . . . , n} and j ∈ {1, . . . , p}. The entire i-th row can be extracted by typing M[i,] while the j-th column by M[,j]. The sub-matrix that contains all elements mij with i1 ≤ i ≤ i2 and j1 ≤ j ≤ j2 can be extracted using the syntax M[i1:i2,j1:j2]. A three-dimensional array A is denoted by A[ , , ] and the item Vo lu me 3, September/Octo ber 2011 A set of built-in functions are available within WinBUGS including arithmetic functions such as the absolute value (abs), the exponential (exp), the natural logarithm (log), the square root (sqrt), and the statistical functions such as the sum (sum) the standard deviation (sd) and the rank (rank). A list with the functions that can be used in WinBUGS can be found on the software’s manual.2 Model Specification Suppose that n realizations are available for the response variable y, which follows a distribution with parameter vector θ. Assume that the parameter θ is related with the explanatory variables X1 , X2 , . . . , Xp through a link function h and a parameter vector β. The prior information for β is expressed by a known distribution. This model is specified in WinBUGS with the following syntax. # Likelihood for (i in 1:n){ y[i] ~ distribution.name(theta) } # Link function theta <- [function of beta and X’s] # prior distribution beta ~ distribution.name( ... ) If the parameters β, θ have dimension higher than one, a for loop is needed to specify them. 2011 Jo h n Wiley & So n s, In c. 387 wires.wiley.com/compstats Overview Example 2 for (i in 1:n){ y[i] ~ dnorm( mu[i], tau ) mu[i] <- inprod(X[i,]) , beta[] ) } # prior distributions for (j in 1:p+1){ beta[j] ~ dnorm( 0.0 , 1.0E-4 ) } tau ~ dgamma( 0.01, 0.01 ) # other parameters of interest s2 <- 1/tau s <- sqrt(s2) Consider a normal linear regression model with the response vector y = (y1 , . . . , yn )T following the normal distribution and xi1 , xi2 the realizations of 2 explanatory variables X1 , X2 for i = 1, . . . , n individuals. The Bayesian model is formulated as Yi ∼ N(µi , σ 2 ) for i = 1, . . . , p and the parameter µi is a linear combination of the explanatory variables, µi = β0 + β1 x1i + β2 x2i . The Normal distribution is chosen to express the prior information for β and the Gamma distribution for the precision τ = σ −2 . Hence, βi ∼ Normal(0, 104 ) for i = 0, 1, 2, τ ∼ Gamma(0.01, 0.01). The syntax of the above regression model follows. model{ # definition of the likelihood function for (i in 1:n){ y[i] ~ dnorm( mu[i], tau ) mu[i] <- beta0 + beta1* x1[i] + beta2 * x2[i] } # prior distributions beta0 ~ dnorm( 0.0 , 1.0E-4 ) beta1 ~ dnorm( 0.0 , 1.0E-4 ) beta2 ~ dnorm( 0.0 , 1.0E-4 ) tau ~ dgamma( 0.01, 0.01 ) # other parameters of interest s2 <- 1/tau s <- sqrt(s2) } This syntax can be written in a more general way in order to cover the case with p explanatory variables. This can be achieved by introducing the parameter vector β = (β0 , β1 , . . . , βp )T and the n × (p + 1) data matrix X = (1n , X 1 , . . . , X p ), where 1n is a vector of length n with all elements equal to one and X j (j = 1, . . . , p) is the vector of length n, with elements the observed values of covariate Xj . The syntax can be now written as follows: model{ # definition of the likelihood function 388 } Data and Initial Value Specification To complete the model specification in WinBUGS, we need to insert the data and provide some initial values for the MCMC algorithm. The initial values are used as a starting point in the iterative procedure of the MCMC algorithm. Initial values are needed for all the model parameters, i.e., stochastic components of the model that are not data and for which prior distributions are imposed. The option of random generation of a part or all the initial values is available in WinBUGS but it is advised to be avoided as it may lead to bad starting points entailing slow mixing of the algorithm or even numerical errors such as overflows. The syntax used to initialize values for the model in Example 2 is # INITS list( beta=0, beta1=0, beta2=0, tau=1 ) The data can be written using the list syntax which is similar to the corresponding one used in R/Splus. For example, the data of the Example 2 with 2 explanatory variables of n = 5 observations can be specified as follows: # DATA list(n=5, x1=c(1,2,3,4,5), x2=c(23,57,59,14,36) ) Alternatively, the data can be specified in matrix form as follows: # DATA list(n=5, p=2, X = structure(.Data=c(1,23,2, 2011 Jo h n Wiley & So n s, In c. Vo lu me 3, September/Octo ber 2011 WIREs Computational Statistics WinBUGS 57,3,59,4,14,5,36) .Dim=c(5,2)) Both codes above define the same data matrix but with different types of nodes. The second code is preferable when the number of variables involved is large. It is also advised to use R and the command dput to directly import the data in WinBUGS with this format; see Section 3.4.6.2 in Ref 6 for more details. Alternatively, the data can be represented in a simpler, rectangular form. The names of the vector nodes (followed by []) must be stated in the first row followed by the variable values for each observation in each line. The data must conclude with the command END followed by a blank line. All variables—vector nodes must have the same length. DATA y[] x1[] 20 23 19 6 32 18 22 20 ... ... END (Blank line) x2[] 1 0 1 1 ... x3[] 14 23 12 12 ... RUNNING AN MCMC IN WINBUGS AND OBTAINING POSTERIOR SUMMARIES Once the model, the data, and the initial values have been specified we can compile and run the MCMC algorithm. The procedure to be followed is described below. 1. Open the Specification tool under the Model menu and highlight the word model. WinBUGS checks the syntax of the model by clicking the check model button. A message appears in the bottom left-hand corner of the window indicating whether the model is syntactically correct or not. If an error message appears, the model code must be corrected and revised and then the model syntax must be checked again (note that the cursor indicates the location of the error in the code). 2. If the model is syntactically correct, the load data box becomes accessible. Highlight the word list, if the data are presented in the list form, or the first line of the rectangular form and press the load data button. The message data loaded should appear. If more than one dataset is available we repeat the above procedure until all the data are loaded. Vo lu me 3, September/Octo ber 2011 3. If steps 1 and 2 are successful, then the model is compiled by clicking the corresponding button. The message model compiled should appear. If an error message is produced, then the model code must be corrected and the procedure must be started from step 1 again. 4. Once the model is compiled successfully, the load inits button becomes active. Highlight the word list that contains the initial values of the stochastic components and click the load inits button. The button gen inits can alternatively be used to generate random initial values for the parameters. If the message this chain contains uninitialized variables appears, then some stochastic nodes do not have initial values. In such cases gen inits can be also used. If the message model is initialized appears in the left bottom bar of WinBUGS then the MCMC is ready to start generating random values. 5. Open the Update tool under the Model menu and specify the number of iteration in the burn-in period in the box entitled updates. The number in the box refresh shows how often the results are refreshed, thin defines the lag between stored iterations and iteration shows the current number of iterations of the MCMC algorithm. Insert the desired numbers and click update. The iteration counter will start changing until the required number of iterations is reached. 6. Open the Sample Monitor tool under the Inference menu and select the parameters for which we wish to infer about. Write the name of the parameters in the node box and press set. This should be repeated for all the parameters that we wish to monitor. Return to the update tool and select the number of iterations that we wish to generate and then press the updates button. When the counter reaches the required number of iterations then an MCMC sample from the posterior distribution is available for the monitored variables. Analysis of the MCMC output and inference concerning the posterior distribution can be obtained by the Sample Monitor tool. Summaries of the posterior distributions can be derived by typing the name of the parameter of interest in the node box (or using the pull down menu) and pressing the stats button. The posterior summaries of all monitored parameters can be extracted if we use the asterisk 2011 Jo h n Wiley & So n s, In c. 389 wires.wiley.com/compstats Overview (∗ ) in the node box. A density plot of the marginal posterior distribution of each node can be obtained using the density button. The remaining buttons can be used to obtain a basic analysis of the MCMC output by checking the convergence of the chain (history), the Monte Carlo (MC) error (stats) and the autocorrelation (auto cor). The thinning interval of observations used to derive the summaries can be controlled by the corresponding box. A detailed diagnostic analysis of the MCMC output can be conducted in R, using the CODA7 and BOA8 packages. The observations of the posterior distributions of the WinBUGS output can be obtained in a compatible format using the option coda. AN ILLUSTRATING EXAMPLE— IMPLEMENTING BAYESIAN LASSO IN WINBUGS The Lasso9 is a shrinkage and variable selection method for normal linear regression models. Its estimates are obtained by imposing the L1 norm penalty on the linear regression coefficients. Owing to the shape of the L1 norm, the regression coefficients are shrunk toward zero and some of them are set exactly equal to zero. The Lasso estimates have an apparent Bayesian perspective as they correspond to the posterior mode of a Bayesian normal linear regression model using a double-exponential prior distribution for the regression coefficients. The corresponding model is described by the following formulation: Yi |β, τ ∼ Normal(µi , τ −1 ), for i = 1, . . . , n µ = Xβ with µ = (µ1 , µ2 , . . . , µn )T 1 βj ∼ DE 0, , for j = 1, . . . , p, τλ τ ∼ Gamma(a, d), where τ = 1/σ 2 is the precision of the Normal regression model and λ is the shrinkage parameter which controls the prior variance given by 2/(τ λ)2 . Different values of λ correspond to different levels of shrinkage. Small values of λ correspond to large variance introducing low information in the Bayesian model and essentially not imposing any shrinkage on the model parameters. On the other hand, large values of λ correspond to strong prior that β is close to zero resulting to high levels of shrinkage. To ensure that λ has the same meaning for all covariate effects, we assume, without loss of generality, that all the variables have mean zero and variance equal to one. 390 Example We illustrate the Bayesian Lasso regression using a simulated data set that consists of n = 50 observations and p = 5 covariates generated from independent standardized normal distributions and the response from Yi ∼ Normal(Xi3 + Xi4 , 2.52 ), for i = 1, . . . , 50. The Bayesian Lasso is performed on this dataset for different values of λ by considering 2, 000 updates after discarding additional 1,000 iterations as burn-in period. In the Bayesian implementation, we standardize both the response and the covariates. For this reason, the constant parameter is not included in the model for the standardized variables as it is natural to set it equal to zero. All the variables are standardized within the WinBUGS code (see lines 2–14 in the code of Algorithm 1). Note that WinBUGS allows to define stochastic nodes twice only in the case of transforming response variables as in this example. The original regression parameters are calculated in WinBUGS using simple logical nodes as β0 = y − Sy p bj xj j=1 βj = Sy bj Sxj σ 2 = S2y σz2 where σz2 is the error variance, bj the coefficients of the regression model using the standardized variables, y and xj the sample means, and S2y and S2xj the sample variances for Y and Xj respectively. The code for the above-defined Bayesian Lasso model is given in Algorithm 1. The model was initialized by setting all standardized coefficients equal to zero and the corresponding precision equal to one. Following the arguments in Ref 10, we choose the value of λ = 0.067. We follow the procedure described in Section ‘Running an MCMC in WinBUGS and Obtaining Posterior Summaries’ to obtain summaries for the posterior distribution. The posterior summaries of the parameters of the Lasso regression coefficients and the variance of the regression model are displayed in Figure 1 for the standardized data and in Figure 2 for the original data. The posterior means and medians of the coefficients of X1 and X2 are very low indicating that these are the least important variables. As expected, the variables used to generate 2011 Jo h n Wiley & So n s, In c. Vo lu me 3, September/Octo ber 2011 WIREs Computational Statistics WinBUGS ALGORITHM 1 | WinBUGS Code for the Bayesian Lasso Model. the response (X3 , X4 ) have the highest posterior measures, whereas the last covariate (X5 ) has moderate measures. Similar conclusions are drawn from the Figure 3, which gives the densities of the posterior summaries of the Lasso coefficients. The results here provide some evidence about the important variables, although the variable selection problem is not directly addressed. Moreover, we observe that the posterior means of β are similar to the ordinary least square estimates β = (0.16, −0.19, 0.067, 1.19, 1.67, −1.11)T concluding that our prior was essentially noninformative implementing minor (or no) shrinkage on the model parameters. For illustration, we also rerun the model with λ = 2 resulting to a posterior with summaries given in Figure 4. For this value of λ, the posterior means are shrunk by 42% for β1 and from 5 to 20% for the rest of the coefficients. Differences Vo lu me 3, September/Octo ber 2011 of the coefficients obtained using the two values of λ are depicted in the box plots of Figure 5. The most noteworthy change is observed for β5 , for which zero lies outside the 95% posterior credible interval in the first run and inside this interval in the second run. We can extend the aforementioned model in order to incorporate the variable selection procedure in our formulation. This can be achieved by introducing a vector of binary indicators γ that highlights which variables are included in the model (with γj = 1) or not (with γj = 0) as in Refs 11 and 12. This formulation was proposed by Lykou and Ntzoufras10 and is described below. Yi |β, τ , γ ∼ Normal(µi , τ −1 ), for i = 1, 2, . . . , n (γ ) (γ ) (γ ) µ = Xβ (γ ) with β (γ ) = (β , β , . . . , β )T 2011 Jo h n Wiley & So n s, In c. 1 2 p 391 wires.wiley.com/compstats Overview 1_node_stats_standardized node b[1] b[2] b[3] b[4] b[5] sz mean −0.0505 0.02172 0.3659 0.5782 −0.2293 0.6609 sd 0.1021 0.09605 0.09715 0.09821 0.1006 0.06534 MC error 2.5% 0.002783 −0.2448 0.00228 −0.1711 0.002324 0.1757 0.002123 0.3859 0.002069 −0.4231 0.001564 0.5464 median −0.05336 0.02279 0.3666 0.5757 −0.2312 0.6557 97.5% 0.152 0.2092 0.5611 0.7774 −0.03014 0.8078 start 1001 1001 1001 1001 1001 1001 sample 2000 2000 2000 2000 2000 2000 FIGURE 1 | Posterior summaries of the Lasso regression parameters using standardized data (λ = 0.067). 2_node_stats_full node beta0 beta[1] beta[2] beta[3] beta[4] beta[5] sigma mean 0.1655 −0.1889 0.07233 1.19 1.668 −1.103 2.197 sd 0.1622 0.382 0.3199 0.3158 0.2834 0.4837 0.2173 MC error 2.5% 0.0032 −0.1563 0.01041 −0.9156 0.007593 −0.5699 0.007557 0.5714 0.006126 1.113 0.009954 −2.035 0.0052 1.817 median 0.1688 −0.1996 0.07589 1.192 1.661 −1.112 2.18 97.5% 0.4795 0.5686 0.6966 1.824 2.243 −0.145 2.686 start 1001 1001 1001 1001 1001 1001 1001 sample 2000 2000 2000 2000 2000 2000 2000 FIGURE 2 | Posterior summaries of the Lasso regression parameters for the unstandardized data (λ = 0.067). 3_densities beta0 sample: 2000 beta[1] sample: 2000 3.0 2.0 1.0 0.0 1.5 1.0 0.5 0.0 −0.5 0.0 −2.0 0.5 beta[2] sample: 2000 −1.0 0.0 1.0 beta[3] sample: 2000 1.5 1.0 0.5 0.0 1.5 1.0 0.5 0.0 −0.2 −1.0 0.0 1.0 0.0 beta[4] sample: 2000 1.5 1.0 0.5 0.0 1.0 2.0 beta[5] sample: 2000 1.0 0.75 0.5 0.25 0.0 0.0 1.0 2.0 −3.0 −2.0 −1.0 0.0 FIGURE 3 | Posterior densities of the Lasso regression coefficients for the unstandardized data (λ = 0.067). 392 2011 Jo h n Wiley & So n s, In c. Vo lu me 3, September/Octo ber 2011 WIREs Computational Statistics WinBUGS (γ ) = γj βj 1 βj |τ ∼ DE 0, , for j = 1, . . . , p, τλ τ ∼ Gamma(a, d), βj constrained to zero if Xj is not included in the model formulation. In order to extend the model code of Algorithm 1 according to the above-mentioned formulation we need to γj ∼ Bernoulli(πj ) 1. substitute line 18 with the following syntax where Bernoulli(π ) is the Bernoulli distribution with success probability π . The actual model parameters β (γ ) are denoted with a vector of length p with (γ ) elements βj = γj × βj (for j = 1, . . . , p) which are mu[i] <- inprod(Z.X[i,], bgamma[]) in order to substitute βj by γj bj , 4_stats_lambda2 node b[1] b[2] b[3] b[4] b[5] beta[1] beta[2] beta[3] beta[4] beta[5] beta0 sigma sz mean −0.0291 0.01712 0.3292 0.5424 −0.1876 −0.1089 0.05702 1.07 1.565 −0.9025 0.2077 2.408 0.7242 sd 0.09658 0.09101 0.1033 0.1067 0.1063 0.3613 0.3031 0.3359 0.3078 0.5115 0.167 0.2394 0.07201 MC error 2.5% 0.002671 −0.2226 0.002357 −0.1641 0.002385 0.1267 0.002194 0.3387 0.002806 −0.4028 0.009992 −0.8328 0.007851 −0.5466 0.007752 0.4119 0.006331 0.9774 −1.938 0.0135 0.003606 −0.131 0.006507 1.999 0.001957 0.6013 median −0.0229 0.01255 0.3278 0.541 −0.1829 −0.08568 0.04179 1.066 1.561 −0.88 0.2079 2.385 0.7174 97.5% 0.1582 0.2111 0.5392 0.7633 0.006072 0.5918 0.703 1.753 2.202 0.02921 0.5444 2.93 0.8811 start 1001 1001 1001 1001 1001 1001 1001 1001 1001 1001 1001 1001 1001 sample 2000 2000 2000 2000 2000 2000 2000 2000 2000 2000 2000 2000 2000 Standardized data: b [ j ] = bj ; sz = sz Unstandardized data: beta = b0 (constant term); beta [ j ] = bj ; sigma = s FIGURE 4 | Posterior summaries of the Lasso regression parameters for standardized and unstandardized data (λ = 2). (a) (b) 5_boxplot_lambda2 5b_boxplot_lambda067 box plot: b box plot: b 1.0 1.0 [4] [4] [3] [3] 0.5 0.5 [1] [2] [1] [2] [5] 0.0 −0.5 [5] 0.0 −0.5 FIGURE 5 | Posterior box plots describing the 95% credible intervals of the regression coefficients using the standardized data (obtained by inserting node b in the node box of Compare tool inside the Inference menu.). (a) λ = 0.067; (b) λ = 2. Vo lu me 3, September/Octo ber 2011 2011 Jo h n Wiley & So n s, In c. 393 wires.wiley.com/compstats Overview 2. substitute line 33 by beta0<- meany - sdy * inprod( bgamma[], meansd[] ) in order to calculate correctly the constant parameter for any given model, 3. add the following syntax for (j in 1:p){ # b x gamma for the standardized data bgamma[j] <- b[j] * gamma[j] # prior for gamma gamma[j]~dbern(0.5) # beta*gamma for the unstandardized data betagamma[j] <- beta[j] * gamma[j] } γ γ in order to define bj = γj bj , βj = γj βj and the prior for each γj . Posterior summaries for β (γ ) are given in Figure 6 for λ = 0.067. We clearly observe that the first two coefficients are shrunk toward zero (the posterior means shrunk by 99.6 and 96% respectively). Also the posterior distribution of β5 was dramatically pushed toward zero with the posterior mean shrunk by 83.7%. On the other hand, the posterior means for the coefficients of X3 and X4 remained almost unchanged (shrunk by 8.6 and 0.06% respectively). The posterior inclusion probabilities for each covariate can be estimated from the posterior means of each γj as given in Figure 7. From the results, we clearly observe that covariates X3 and X4 must be included in the model having posterior probabilities 0.9 and 1.0, respectively. Covariates X1 and X2 have very low posterior probabilities (∼ 1.8%), while covariate X5 is included in the model with posterior probability of 17%. Figure 8 displays the densities of the posterior distributions of β (γ ) . The posterior distributions of the coefficients for the non-important variables have high spikes at zero except for covariate X4 , which is the most important one in this illustration and its posterior distribution is well placed away from zero. The posterior distribution of β3 is bimodal, with one mode at zero and one at a positive value. However, the posterior median of the distribution and the posterior mean of the corresponding inclusion probability (given by the mean of γ3 and it is equal to 0.90) indicate that this variable should also be included in the model. DISCUSSION: A FUTURE FULL OF PROMISES Over the last years WinBUGS gained a tremendous popularity within the scientific community. WinBUGS has been used in a wide range of practical problems having different scientific backgrounds. It has been the object of interest in various short courses and workshops. More and more universities include Bayesian data analysis courses using WinBUGS in their syllabus; see ‘BUGS resources online’ link in the 6_stats_gamma node beta0 betagamma[1] betagamma[2] betagamma[3] betagamma[4] betagamma[5] sigma bgamma[1] bgamma[2] bgamma[3] bgamma[4] bgamma[5] sz mean 0.2324 7.3E-4 0.002618 1.087 1.669 −0.1804 2.39 1.951E-4 7.862E-4 0.3343 0.5783 −0.0375 0.7188 sd 0.1997 0.05531 0.04639 0.4784 0.2978 0.4392 0.264 0.01479 0.01393 0.1472 0.1032 0.09131 0.07941 MC error 2.5% 0.009046 −0.08211 5.839E-4 0.0 5.232E-4 0.0 0.02172 0.0 0.003231 1.076 0.01275 −1.541 0.00703 1.941 1.561E-4 0.0 1.571E-4 0.0 0.006681 0.0 0.00112 0.373 0.002651 −0.3204 0.002114 0.5837 median 0.2041 0.0 0.0 1.155 1.669 0.0 2.367 0.0 0.0 0.3552 0.5783 0.0 0.7118 97.5% 0.7027 0.0 0.0 1.844 2.251 0.0 2.98 0.0 0.0 0.5672 0.78 0.0 0.8963 start 1001 1001 1001 1001 1001 1001 1001 1001 1001 1001 1001 1001 1001 sample 10000 10000 10000 10000 10000 10000 10000 10000 10000 10000 10000 10000 10000 Standardized data: bgamma [j] = gj × bj ; sz = sz Unstandardized data: beta = b0 (constant term); betagamma [j] = gj × bj ; sigma = s FIGURE 6 | Posterior summaries of the Lasso regression coefficients with variable selection. 394 2011 Jo h n Wiley & So n s, In c. Vo lu me 3, September/Octo ber 2011 WIREs Computational Statistics WinBUGS 6_stats_gamma2 node gamma[1] gamma[2] gamma[3] gamma[4] gamma[5] mean 0.0181 0.0178 0.9016 1.0 0.173 sd 0.1333 0.1322 0.2979 0.0 0.3782 MC error 2.5% 0.001983 0.0 0.001988 0.0 0.01782 0.0 1.0E-12 1.0 0.01213 0.0 median 0.0 0.0 1.0 1.0 0.0 97.5% 0.0 0.0 1.0 1.0 1.0 start 1001 1001 1001 1001 1001 sample 10000 10000 10000 10000 10000 FIGURE 7 | Posterior summaries the indicator parameters included in the Bayesian Lasso model. 7_densities_gamma beta0 sample: 10000 betagamma[1] sample: 10000 3.0 2.0 1.0 0.0 150.0 100.0 50.0 0.0 −0.5 0.0 −1.0 0.5 0.0 1.0 betagamma[3] sample: 10000 betagamma[2] sampe: 10000 1.5 1.0 0.5 0.0 150.0 100.0 50.0 0.0 −1.0 0.0 −1.0 1.0 betagamma[4] sampe: 10000 1.5 1.0 0.5 0.0 0.0 1.0 2.0 betagamma[5] sample: 10000 15.0 10.0 5.0 0.0 0.0 1.0 2.0 −3.0 −2.0 −1.0 0.0 FIGURE 8 | Posterior densities for model parameters β (γ ) . WinBUGS website for a coherent list of such activities and courses. The popularity of WinBUGS has motivated various expansions and made WinBUGS applicable in a wider range of disciplines, such as social, actuarial science, population genetics, and archaeology. GeoBUGS developed by the team in the Imperial College at St Mary’s Hospital can be used to fit spatial models and produce a range of maps as output. PKBUGS has been developed by Dave Lunn to fit pharmacokinetic models. The WinBUGS development interface (WBDev)13 allows the users to define their own distributions and functions. This was originally designed for social scientists but it has been used by other researchers as well. Lunn has also developed the WinBUGS Differential Interface (WBDiff) which allows the use of complex functions via arbitrary Vo lu me 3, September/Octo ber 2011 systems of ordinary differential equations and the WinBUGS jump interface to perform variable selection through the Reversible Jump MCMC.14,15 WinBUGS’s popularity has also been extended due to its compatibility with other statistical packages and software. WinBUGS runs from GenStat, which is a software for bioscience. It can also be called via R using the R2WinBUGS R-library on Comprehensive R Archive Network (CRAN) site. There are also codes that can be used to call WinBUGS through Stata,16 SAS and a code for Excel that does not require any knowledge of WinBUGS. MATBUGS is a Matlab interface for WinBUGS, which has been extended to run in Linux systems. Details about it can be found on www.mrc-bsu.cam.ac.uk/bugs/winbugs/ remote14.shtml. 2011 Jo h n Wiley & So n s, In c. 395 wires.wiley.com/compstats Overview Note that WinBUGS was now stabilized in version 1.4.3 and it will not be developed any more. Instead, the interest of the group is now turned on the development of OpenBUGS (www.openbugs.info) which is an open source version of WinBUGS with additional features and contributions. This project started in 2004 when Andrew Thomas moved from London to Helsinki and now is stable and reliable package running under Windows, Linux, and MAC operating systems. The possibility that researchers will be able to contribute and improve an already popular and successful software leaves high expectations for the future. CONCLUSION This article summarizes the basic concepts required to perform Bayesian analysis using the WinBUGS. It provides information on model specification and coding, algorithm implementation and output interpretation along with some toy examples, and a more detailed illustration that demonstrates the implementation of Bayesian Lasso in WinBUGS. It can be used as a brief introduction to WinBUGS for researchers with or without statistical background. WinBUGS is a useful computational tool that fits complicated Bayesian models using MCMC methods. It is widely popular due to its numerous extensions and applications in various scientific fields. It is relatively straightforward to use with syntax similar to the one in R and Splus. Alternatively, DOODLE interface can be used to specify the structure of the model through a graphical representation. The recent development of OpenBUGS (the open source version of the program) creates high expectations for the future where any researcher will be able to contribute to the development and the improvement of this popular software. REFERENCES 1. Lunn D, Spiegelhalter D, Thomas A, Best N. The bugs project: Evolution, critique and future directions. Stat Med 2009, 28:3049–3082. 2. Spiegelhalter D, Thomas A, Best N, Lunn D. WinBUGS User Manual, Version 1.4. MRC Biostatistics Unit, Institute of Public Health and Department of Epidemiology and Public Health, Imperial College School of Medicine, UK, 2003. Available at: http://www.mrc-bsu. cam.ac.uk/bugs/winbugs/contents.shtml. (Accessed May 4, 2011). 3. Spiegelhalter D, Thomas A, Best N, Lunn D. WinBUGS Examples, vol 1. MRC Biostatistics Unit, Institute of Public Health and Department of Epidemiology and Public Health, Imperial College School of Medicine, UK, 2003. Available at: http://www.mrc-bsu.cam.ac.uk/ bugs/winbugs/contents.shtml. (Accessed May 4, 2011). 4. Spiegelhalter D, Thomas A, Best N, Lunn D. WinBUGS Examples, vol 2. MRC Biostatistics Unit, Institute of Public Health and Department of Epidemiology and Public Health, Imperial College School of Medicine, UK, 2003. Available at: http://www.mrc-bsu.cam.ac.uk/ bugs/winbugs/contents.shtml. (Accessed May 4, 2011). 7. Best N, Cowles MK, Vines K. CODA: Convergence Diagnostics and Output Analysis Software for Gibbs Sampling Output, Version 0.30. Cambridge: MRC Biostatistics Unit, Institute of Public Health; 1996. 8. Smith BJ. Bayesian Output Analysis Program (BOA), Version 1.1.5 User’s Manual, Technical Report. Department of Public Health, The University of Iowa, 2005. Available at: http://www.mrc-bsu.cam.ac.uk/ bugs/winbugs/contents.shtml. (Accessed May 4, 2011). 9. Tibshirani R. Regression shrinkage and selection via the lasso. J R Stat Soc [SerB] 1996, 58:267–288. 10. Lykou A, Ntzoufras I. ‘‘On Bayesian Lasso Variable Selection and the specification of the shrinkage parameter’’, Technical Report, Athens University of Economics and Business, 2011. 11. Kuo L, Mallick B. Variable selection for regression models. Sankhyā, (B) 1998, 60:65–81. 12. Dellaportas P, Forster J, Ntzoufras I. On Bayesian model and variable selection using MCMC. Stat Comput 2002, 12:27–36. 13. Lunn D. WinBUGS Development Interface (WBDev). ISBA Bull 2003, 3:10–11. 5. Spiegelhalter D, Thomas A, Best N, Lunn D. WinBUGS Examples, vol 3. MRC Biostatistics Unit, Institute of Public Health and Department of Epidemiology and Public Health, Imperial College School of Medicine, UK, 2003. Available at: http://www.mrc-bsu.cam.ac. uk/bugs. 14. Lunn DJ, Whittaker JC, Best N. A Bayesian toolkit for genetic association studies. Genet Epidemiol 2006, 30:231–247. 6. Ntzoufras I. Bayesian Modeling Using WinBugs. New York: John Wiley & Sons; 2009. 16. Thompson JT, Palmer T, Moreno S. Bayesian analysis in Stata using WinBUGS. Stata J 2006, 6:530–549. 396 15. Lunn DJ, Best N, Whittaker J. Generic reversible jump MCMC using graphical models. Stat Comput 2009, 19:395–408. 2011 Jo h n Wiley & So n s, In c. Vo lu me 3, September/Octo ber 2011