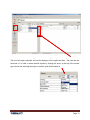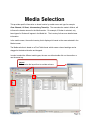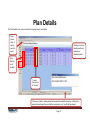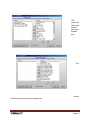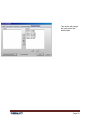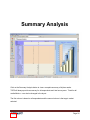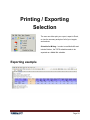
1
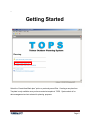
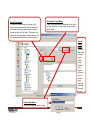
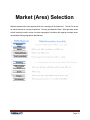
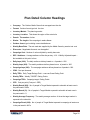
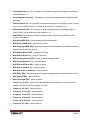
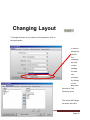
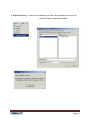
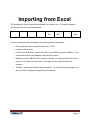
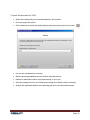
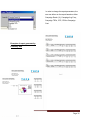
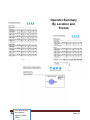
TOPS User Manual 2008 Page 1 Table of Contents Introduction ................................ ................................ ................................ ................................ 4 Features and Functionality ................................ ................................ ................................ ..... 5 Getting Started ................................ ................................ ................................ ........................... 6 Target Market Selection ................................ ................................ ................................ ............. 8 Detailed Target Market ................................ ................................ ................................ ..........10 Open and Save Target Market ................................ ................................ .............................. 10 Second Target Market ................................ ................................ ................................ ...........10 Rename Target Market ................................ ................................ ................................ ..........10 Market (Area) Selection ................................ ................................ ................................ ............12 Media Selection ................................ ................................ ................................ ........................14 Layout ................................ ................................ ................................ ................................ ...14 Plan Details................................ ................................ ................................ ............................... 17 Plan Detail Column Headings ................................ ................................ ................................ 20 Changing Layout ................................ ................................ ................................ .......................22 Summary Analysis ................................ ................................ ................................ ....................26 Graph................................ ................................ ................................ ................................ ........28 Printing / Exporting Selection ................................ ................................ ................................ ....29 Exporting example ................................ ................................ ................................ .................29 Importing from Excel ................................ ................................ ................................ .................31 File Menu ................................ ................................ ................................ ................................ ..33 Reports ................................ ................................ ................................ ................................ .....34 Format Summary by Location and Operator ................................ ................................ ..........34 Market Summary by Format ................................ ................................ ................................ ..36 Market Summary with Frequency Distribution ................................ ................................ ........37 Market Summary with Weekly Accumulation ................................ ................................ .........38 Operator Summary By Location and Format ................................ ................................ ..........40 Glossary................................ ................................ ................................ ................................ ....41 Page 2 Page 3 Introduction TOPS (Telmar’s Outdoor Planning System) now has the capability to perform R&Fs using South African Outdoor data. TOPS is based on a Pivot Table format. The user can drag the column headings in order to make the ranking more user friendly. TOPS is Telmar's newest multi-market analysis planning system for Traditional Out-of-Home Media - incorporating the most advanced modelling techniques to provide highly accurate delivery analyses. TOPS produces reach, frequency and other traditional media analysis calculations with a drill back to area, format and operator data. TOPS schedules can be exported to media mixing programs to put out of-home on the planning grid with television, radio and print. Page 4 Features and Functionality o Time sensitive model o Demographic targeting for all SAARF measured markets o Media Analysis delivery by Province and other custom market definitions o Operator Specific or Market Average planning o Export to Telmar's Media mix o Summary of multiple target markets o Budget and reach goal allocation o Seamless Excel export for all reporting options o Frequency Distribution Page 5 o Getting Started Select the “Create New Blank plan” option or previously saved Plan. Creating a new plan from Template is only available once you have created a template in TOPS. System admin is for data management and not relevant for planning purposes. Page 6 Page 7 Target Market Selection TOPS will automatically prompt the user to create a target(s). To create a target using South African Outdoor data, simply select one of the pre-created targets offered. Click on the + button to expand all demographic variables. The user do not need to code the demographics with ‘and’ and ‘or’, this is done automatically by TOPS Page 8 Page 9 Detailed Target Market To create a multi-criteria target (i.e. Men age 16-24), simply click on the first item, then click the “Add” button in the centre of the target creation screen, then click on the next item then click “Add” again. The user can also double click on the demographic variables required – this will also automatically place them into the doing screen Open and Save Target Market In order to open previous saved target files the user clicks on “Open Target File”. To save Targets, the user clicks on “Save Targets” Second Target Market If the user want ot add a second target market, simply select the clear targets option and enter a second target market as illustrated, save and continue Rename Target Market The user can change the label of the target. Page 10 Page 11 Market (Area) Selection Markets represent the areas against which the campaign will be measured. The two Provinces for which research is currently available is : Gauteng and Kwazulu Natal. Although these areas are still relatively broad in terms of outdoor campaigns, limitations with regards to sample sizes necessitated these geographical breakdowns Page 12 The user can select each area by either do uble clicking on the name or using the arrow keys. The list of all regions selected, will now be displayed on the right hand side. The user can sort the areas i.e. in order to select specific regions by clicking the arrow at the top of the market type column and selecting what type of area the plan will be based on. Page 13 Media Selection This provides specific information on boa rd location by media owner and type for example: Clear Channel, 12 Sheet, Johannesburg Township. The area selection made in Market, will influence the boards returned in the Media section. For example, if Durban is selected, only board types for Durban will appear in the Media list. The inventory list has more detailed area information. In the media screen, the media inventory that is displayed is based on the areas selected in the Market screen. The Media selection is based on a Pivot Table format which means column headings can be dragged to the desired location and dropped. In order to select the different media types, the user can either double click on the medium or use the arrow key. Layout To customize the layout thus to exclude columns Page 14 Column descriptions Operator: The media owner that owns the site Location: The actual location of the board either by province or area depending on the area selected previously Name: OOH format type, size and detailed area. Market: This is the same as location Format: The size of the site Inventory: The total number OOH format types by area by media owner Audience: The size of the market generated by the area the site is in Base Rate: This is the weekly rate per site. Abbreviation of sites ST / V / RUR: Small Town / Village / Rural C / LT: City / Large Town BLK TSHIP: Black Township ST / V: Small Town / Village Page 15 Page 16 Plan Details The Plan Details is the screen in which the outdoor plan is constructed. Once plan is done, it can be export to excel Clicking on column headings will rank ascending / desending order Note that this is not audited To enter the amount of “boards” If the users enters to many panels that exceeds the available inventory, a dialog box applear that will warn the user that the maximum is only 1 and1 will be entered Page 17 Page 18 When right click in the data grid, the following options appear: Apply Value to all items: If the same number of boards are used with the different panels. Optimize Item: Not available in SA Remove Unused Media: The panels that are not selected will be removed in order to supply a summary of the different panels used. Duplicate: This will duplicate the line. Layout: The user can change the layout of the results screen per section. Move: If the user needs to change the order of the board usage, simply select move. Delete Selected Row(s): In the final screen, if the user needs to remove a board selection, simply select “Delete Selected Rows”. Page 19 Plan Detail Column Headings Company: The Outdoor Media Owner that manages/owns the site Format: Outdoor format type incl. the size Inventory Market: The planning market Inventory Location: This shows the region of the actual site Panels: The number of sites Weeks: The length of the campaign in weeks Name: Outdoor format type including a more detailed area Weekly Base Rate: The rate card rate supplied by the Media Owner by week at net cost Discounts: Negotiated discounts can be applied Campaign Cost: Number of units multiplied by weekly base rate DEC / Audience: Average audience of the site per day –VAI: Visibility Adjusted Impact – Not available at this point in time Daily Imps (000): The daily audience delivery based on of panels in ‘000 Weekly Imps (000): The weekly audience delivery based on no. of panels in ‘000 Campaign Imps (000): The campaign audience delivery based on of panels in ‘000 CPM: Cost per thousand Daily TRPs: Daily Target Ratings Point – same as Gross Rating Point Weekly TRPs: Weekly TARGET Rating Points Campaign TRPs: Campaign target Rating Points CPP: Cost per point (Cost per 1 GRP) Weekly Reach (000): No. of people in Target Market exposed to schedule at least once in the past week in 000’s Weekly Reach (%): No. of people in Target Market ex posed to schedule at least once in the past week in % Weekly Average Frequency: The weekly average number. of times the target market is exposed to the schedule Campaign Reach (000): No. of people in Target Market exposed to campaign at least once in the past week in 000’s Page 20 Campaign Reach (%): No. of people in Target Market exposed to campaign at least once in the past week in % Campaign Ave Frequency: The average no. of times the target market is exposed to the campaign Effective Reach (%): No. of people in target market exposed to campaign at least 3+ times in % (user can set this to be 3+ 5+ whatever they choose. It defaults to 3+) Effective Reach (000): No. of people in target market exposed to campaign at least 3+ times in 000’s (can be defined by user defaults to 3+) MAX Panels: The maximum number of panels that are ‘owned’ by the operator in that market for that format MAX Daily IMPS (000): Same as daily just the total possible MAX Weekly IMPS (000): Same but for a week MAX Campaign IMPS (000): Maximum impression possible with the combination of format, panels over the campaign perio ds MAX Weekly Reach (000): Same but for a week MAX Weekly Reach (%): Same for one week MAX Campaign Reach (000): Same for entire campaign period MAX Campaign Reach (%): Same as above MAX Effective Reach (000): Same as above MAX Effective Reach (%): Same as above MAX Weekly Ave Frequency: Same as above MAX Daily TRPs: Maximum number of target rating points that can be achieved in one day MAX Weekly TRPs: Same as above MAX Campaign TRPs: Same as above Frequency 1-4 (000): This is a miss placed frequency distribution so it is the number of people in (000) who saw the message 1 -4 times Frequency 5-9 (000): Same as above Frequency 10-14 (000): Same as above Frequency 15-19 (000): Same as above Frequency 20-24 (000): Same as above Frequency 25-29 (000): Same as above Frequency 30+ (000): Same as above Page 21 Changing Layout To change the layout of any section in the programme, click on the layout button In order to display the total for the campaign by each column heading, the user can activate it by clicking on the drop down box next to Total Summary mode. This screen will change the layout of the first Page 22 section of the detailed plan Page 23 This section will change the second part of the detailed plan This section will change the third part of the detailed plan Page 24 This section will change the fourth part of the detailed plan Page 25 Summary Analysis Click on the Summary Analysis button to v iew a complete summary of all plan results. TOPS will always provide a summary for all respondents and total survey area. Totals for all media Metrics – can also be changed in the layout The first column is based on all respondents and the second column is the target market selected. Page 26 In order to see the detail per section, the user simply click on the + sign which will open up a tree to view the detail. On the right hand side the data is expressed graphically – depending on what is selected, the programme will graph it. Page 27 Graph The graph illustrate the summary of the total results Animate chart: This will rotate the chart Free rotation Move chart: This will move the chart Zoom in / out Axis Size: This will increase / decrease the axis size Edit Chart Analysis: See later explanation Copy chart to clipboard Save Reset Chart: This will change the graph back to the original. Page 28 Printing / Exporting Selection The user can either print your report, export to Excel, or view the summary analysis of all of you r targets and markets. Schedule for Mixing: In order to use Media Mix and include Outdoor, the TOPS schedule needs to be exported as a Media Mix schedule Exporting example Page 29 Export for mixing: In order to mix schedules with other Telmar schedules, the user can choose to Export to Schedule for Mixing Page 30 Importing from Excel TOPS enables the user to import actual schedules of operator sites. The user will need the following columns in the excel spreadsheet Operator Location Format Tab Ref Operator DEC / Ref Aud Panels Wkly Rate In order to create an import spreadsheet, the following needs to be available Ensure operator name is spelled the same as in TOPS Location is South Africa Formats include: Bulletins, Posters 30 -Sheet, Transit Shelters, posters 8-Sheets. If the user added formats to the database, ensure that they match Neither the 4-digit TAB Ref TAB id number for the site or the Operator Ref for the site is required. If the user have the number, it will display on the reports for their own reference The DEC / Audience and Weekly Rate are optional. For the most accurate analysis, use the actual DEC or Audience as supplied by the operator Page 31 To launch this document into TOPS: Select the corresponding survey and database for the locations Pick your target and market On the media grid, launch the media selection wizard from the center of the screen Preview the spreadsheet for accuracy Match imported spreadsheet columns with the required columns Replace or add these location to any data already on your grid Save the package for future use if desired and assign an expiration date if necessary Analyze the imported schedule on the planning grid and in all preformatted reports Page 32 File Menu New: This will create a new plan Open: This will open previosly saved documents Close: This will close documents Save as: This will enable the user to change the same of the previously saved document. Save Template as: To save a document as a template to be used at a later stage Page Setup: This allow the user to change the page layout Print Preview: The user can view the actual page before printing Print: This will print the documents Properties: This will change the plan properties Save: This will save the document for later use. Page 33 Reports Different reports can be generated by TOPS in order to supply clients detailed information. Format Summary by Location and Operator Page 34 In order to change the report parameters, the user can either run the report based on either Campaign Reach (%), Campaign Avg F req, Campaign TRPs, CPP, CPM or Campaign Cost. Examples of report generated by Format by area Page 35 Market Summary by Format The market summary report reflects the summary reach by target markets, by format and an overall campaign reach. The graph also shows the different % reach generated by the selected formats. Page 36 Market Summary with Frequency Distribution In order to see the overall Frequency distribution table for the whole campaign, the user can run thus report. Page 37 Market Summary with Weekly Accum ulation Report Parameters can be set according to the list below. Page 38 This report shows the cumulative reach (if reach was selected) by week by format as well as for the overall campaign Page 39 Operator Summary By Location and Format This report shows the format by region by media Owner Page 40 Glossary Company: The Outdoor Media Owner audience delivery based on no. of Format: Outdoor format type incl. the panels in ‘000 audience delivery based on of panels in market ‘000 Inventory Location: This shows the CPM: Cost per thousand region of the actual site Daily TRPs: Daily Target Ratings Point Panels: The number of sites Weeks: The length of the campaign in – same as Gross Rating Point Outdoor format type including a more Weekly Base Rate: The rate card rate CPP: Cost per point (Cost per 1 GRP) supplied by the Media Owner by week Weekly Reach (000): No. of people in at net cost Target Market exposed to schedule at Discounts: Negotiated discounts can least once in the past week in 000’s be applied Campaign TRPs: Campaign target Rating Points detailed area Weekly TRPs: Weekly TARGET Rating Points weeks Name: Campaign Imps (000): The campaign Inventory Market: The planning Weekly Imps (000): The weekly that manages/owns the site size Weekly Reach (%): No. of people in Campaign Cost: Number of units Target Market exposed to schedule at multiplied by weekly base rate least once in the past week in % DEC / Audience: Average audience of Weekly Average Frequency: The the site per day –VAI: Visibility Adjusted weekly average number. of times the Impact – Not available at this point in target market is exposed to the time schedule Daily Imps (000): The daily audience delivery based on of panels in ‘000 Campaign Reach (000): No. of people in Target Market exposed to campaign at least once in the past week in 000’s Page 41 Campaign Reach (%): No. of people in Target Market exposed to campaign at least once in the past week in % above Campaign Ave Frequency: The average no. of times the target market is Effective Reach (%): No. of people in in one day be 3+ 5+ whatever they choose. It MAX Weekly TRPs: Same as above defaults to 3+) MAX Campaign TRPs: Same as Effective Reach (000): No. of people in above Frequency 1-4 (000): This is a miss least 3+ times in 000’s (can be defined placed frequency distribution so it is the by user defaults to 3+) number of people in (000) who saw the MAX Panels: The maximum number of message 1-4 times panels that are ‘owned’ by the operator Frequency 5-9 (000): Same as above in that market for that format Frequency 10-14 (000): Same as MAX Daily IMPS (000): Same as daily above MAX Weekly IMPS (000): Same but for Frequency 20-24 (000): Same as above combination of format, panels over the campaign periods Frequency 15-19 (000): Same as above MAX Campaign IMPS (000): Maximum impression possible with the MAX Daily TRPs: Maximum number of least 3+ times in % (user can set this to a week as above target rating points that can be achieved just the total possible MAX Weekly Ave Frequency: Same target market exposed to campaign at target market exposed to campaign at MAX Effective Reach (%): Same as above exposed to the campaign MAX Effective Reach (000): Same as Frequency 25-29 (000): Same as above Frequency 30+ (000): Same as above MAX Weekly Reach (000): Same but for a week MAX Weekly Reach (%): Same for one week MAX Campaign Reach (000): Same for entire campaign period MAX Campaign Reach (%): Same as above Page 42