1
National Conference on Engineering Trends in Medical Science – NCETMS - 2014
Brain Computer Interface
Shweta Sanjay Borikar1, Snehal Ramesh Kochre2, Prof. Yugandhara D Zade3
1
2
Final year,Biomedical Engineering, S.G.B.A.U Amravati
Final year,Biomedical Engineering, S.G.B.A.U Amravati
3
Assistant Professor, BME, D.B.N.C.O.E.T, Yavatmal.
Yavatmal (M.S), India
Abstract—Brain-computer interface (BCI) is a fast-growing
emergent technology, in which researchers aim to build a
direct channel between the human brain and the
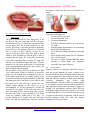
computer.The device was designed to help those who
have lost control on their limbs, or other bodily
functions, such as patients with amyotrophic lateral
sclerosis (ALS) or spinal cord injury A Brain Computer
Interface (BCI) is a collaboration in which a brain accepts
and controls a mechanical device as a natural part of its
representation of the body. Computer-brain interfaces are
designed to restore sensory function, transmit sensory
information to the brain, or stimulate the brain through
artificially generated electrical signals.A brain-computer
interface is a new communication link between a functioning
human brain and the outside world. BCI uses brain activity to
command, control, actuate and communicate with the world
directly through brain integration with peripheral devices and
systems. The signals from the brain are taken to the computer
via the implants for data entry without any direct brain
intervention. BCI transforms mental decisions and/or
reactions into control signals by analysing the bioelectrical
brain activity.
Keywords—BCI, Bioelectrical Brain activity, ALS.
I. INTRODUCTION
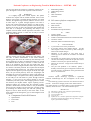
Brain Gate is a brain implant system developed by the biotech company Cyberkinetics in 2003 in conjunction with
the Department of Neuroscience at Brown University. The
device was designed to help those who have lost control on
their limbs, or other bodily functions, such as patients with
amyotrophic lateral sclerosis (ALS) or spinal cord
injury.The possibility of establishing a direct
communication and control channel between the human
brain and computers or robots has been a topic of scientific
speculation and even science fiction for many years. Over
the past twenty years, this idea has been brought to fruition
by numerous research and development programs, and has
evolved into one of the fastest-growing areas of scientific
research. This technology, called brain-computer interface
(BCI) technology, provides a new output channel for brain
signals to communicate or control external devices without
using the normal output pathways of peripheral nerves and
muscles. A BCI recognizes the intent of the user through
the electrophysiological or other signals of the brain.
Electrophysiological signals may be recorded over the
scalp, underneath the scalp, or within the brain; other types
of physiological signals may be recorded by magnetic
ISSN: 2231-5381
sensors or other means. In real time, a brain signal is
translated into output commands that accomplish the desire
of the user. The most common example of use of such
technology is the direct control of a computer cursor by a
person or animal using a BCI based on electrophysiological
signals.
A BCI allows a person to communicate with or control the
external world without using conventional neuromuscular
pathways. That is, messages and control commands are
delivered not by muscular contractions but rather by brain
signals themselves. This BCI feature brings hope to
individuals who are suffering from the most severe motor
disabilities, including people with amyotrophic lateral
sclerosis (ALS), spinal cord injury, stroke, and other
serious neuromuscular diseases or injuries. BCI technology
holds promise to be particularly helpful to people who are
“locked-in,” cognitively intact but without useful muscle
function. Restoration of basic communication capabilities
for these people would significantly improve their quality
of life as well as that of their caregivers, increase
independence, reduce social isolation, and potentially
reduce cost of care.
BCI research has undergone an explosive growth in recent
years. At present, there are over 400 groups worldwide
engaging in a wide spectrum of research and development
programs, using a variety of brain signals, signal features,
and analysis and translational algorithms. In this review,
we discuss the current status and future prospects of BCI
technology and its clinical applications.
II.
METHODOLOGY
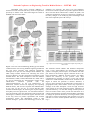
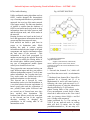
A. The Human Brain
All of it happens in the brain. The brain is undoubtly the
most complex organ found among the carbon-based life
forms. So complex it is that we have only vague
information about how it works. The average human brain
weights around 1400 grams. The most relevant part of
brain concerning BCI’s is the cerebral cortex. The cerebral
cortex can be divided into two hemispheres. The
hemispheres are connected with each other via corpus
callosum. Each hemisphere can be divided into four lobes.
They are called frontal, parietal, occipital and temporal
lobes.
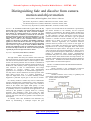
Cerebral cortex is responsible for many higher order
functions like problem solving, language comprehension
http://www.ijettjournal.org
Page 1
National Conference on Engineering Trends in Medical Science – NCETMS - 2014
and processing of complex visual information. The cerebral
cortex can be divided into several areas, which are
responsible of different functions. This kind of knowledge
has been used when with BCI’s based on the pattern
recognition approach. The mental tasks are chosen in such
a way that they activate different parts of the cerebral
cortex.
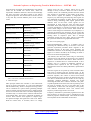
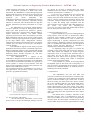
Cortical Area
Function
Auditory Association Area
Processing of auditory
information
Auditory Cortex
Detection of sound quality
(loudness, tone)
Speech Center (Broca’s
area)
Speech production and
articulation
change across the cell, (~100mv) which can be read
through a variety of devices. When we want to make a
voluntary action, the command generates from the frontal
lobe. Signals are generated on the surface of the brain.
These electric signals are different in magnitude and
frequency. By monitoring and analysing these signals we
can understand the working of brain. When we imagine
ourselves doing something, small signals generate from
different areas of the brain. These signals are not
largeenough to travel down the spine and cause actual
movement. These small signals are, however, measurable.
A neuron depolarizes to generate an impulse; this action
causes small changes in the electric field around the
neuron. These changes are measured as 0 (no impulse) or 1
(impulse generated) by the electrodes. We can control the
brain functions by artificially producing these signals and
sending them to respective parts. This is through
stimulation of that part of the brain, which is responsible
for a particular function using implanted electrodes.
B. Electroencephalography
Prefrontal Cortex
Problem solving, emotion,
complex thought
Motor Association Cortex
Coordination of complex
movement
Primary Motor Cortex
Initiation of voluntary
movement
Primary Somatosensory
Cortex
Receives tactile information
from the body
Sensory Association Area
Processing of multisensory
information
Visual Association Area
Complex processing of visual
information
Wernicke’s Area
Language comprehension
Table1: Cortical areas of the Brain and their function
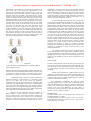
A. Main Principle
Main principle behind this interface is the bioelectrical
activity of nerves and muscles. It is now well established
that the human body, which is composed of living tissues,
can be considered as a power station generating multiple
electrical signals with two internal sources, namely muscles
and nerves. We know that brain is the most important part
of human body. It controls all the emotions and functions
of the human body. The brain is composed of millions of
neurons. These neurons work together in complex logic
and produce thought and signals that control our bodies.
When the neuron fires, or activates, there is a voltage
ISSN: 2231-5381
Electroencephalography (EEG) is a method used in
measuring the electrical activity of the brain. The brain
generates rhythmical potentials which originate in the
individual neurons of the brain. These potentials get
summated as millions of cell discharge synchronously and
appear as a surface waveform, the recording of which is
known as the electroencephalogram.
The neurons, like other cells of the body, are electrically
polarized at rest. The interior of the neuron is at a potential
of about –70mV relative to the exterior. When a neuron is
exposed to a stimulus above a certain threshold, a nerve
impulse, seen as a change in membrane potential, is
generated which spreads in the cell resulting in the
depolarization of the cell. Shortly afterwards, repolarization
occurs.
The EEG signal can be picked up with electrodes either
from scalp or directly from the cerebral cortex. As the
neurons in our brain communicate with each other by firing
electrical impulses, this creates an electric field which
travels though the cortex, the dura, the skull and the scalp.
The EEG is measured from the surface of the scalp by
measuring potential difference between the actual
measuring electrode and a reference electrode. The peakto-peak amplitude of the waves that can be picked up from
the scalp is normally 100 µV or less while that on the
exposed brain, is about 1mV. The frequency varies greatly
with different behavioural states. The normal EEG
frequency content ranges from 0.5 to 50 Hz.
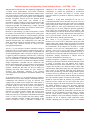
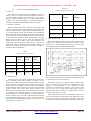
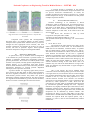
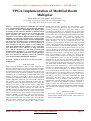
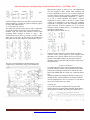
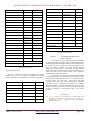
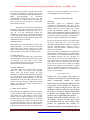
Frequency information is particularly significant since the
basic frequency of the EEG range is classified into five
bands for purposes of EEG analysis. These bands are called
brain rhythms and are named after Greek letters.
http://www.ijettjournal.org
Page 2
National Conference on Engineering Trends in Medical Science – NCETMS - 2014
Five brain rhythms are displayed in Table.2. Most of the
brain research is concentrated in these channels and
especially alpha and beta bands are important for BCI
research.
Band
Frequency [Hz]
Delta
0.5- 4
Theta
4- 8
Alpha
8- 13
Beta
13- 22
Gamma
22-30
In the first approach the subject concentrates on a few
mental tasks. Concentration on these mental tasks produces
different EEG patterns. The BCI can then be trained to
classify these patterns. In the second approach the user has
to learn to self-regulate his or her EEG response, for
example change the beta rhythm amplitude. Unlike in the
pattern recognition approach, the BCI itself is not trained
but it looks for particular changes (for example higher
amplitude of a certain frequency) in the EEG signal. This
requires usually a long training period, because the entire
training load is on the user.
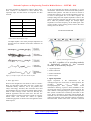
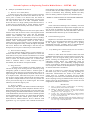
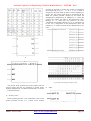
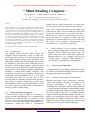
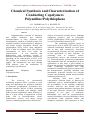
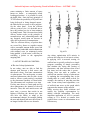
III. BLOCK DIAGRAM
Table.2.Common EEG frequency ranges
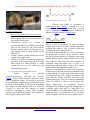
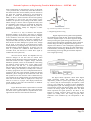
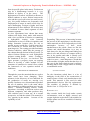
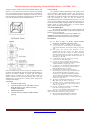
The alpha rhythm is one of the principal components of
the EEG and is an indicator of the state of alertness of
the brain.
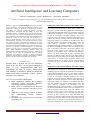
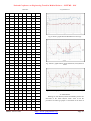
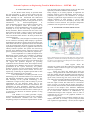
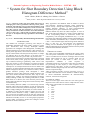
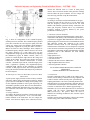
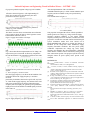
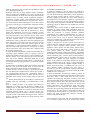
Figure (b): General Approach of BCI
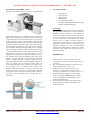
Any BCI, regardless of its recording methods
or applications, consists of four essential
elements, as described by Wolpaw:
1. Signal acquisition
2. Feature extraction
3. Feature translations
4. Device output
Figure (a): Examples of alpha, beta, theta and delta rhythms
1 .Signal Acquisition
C. BCI Approaches
What are the thoughts the user thinks in order to control a
BCI? An ideal BCI could detect the user’s wishes and
commands directly. However, this is not possible with
today’s technology. Therefore, BCI researches have used
the knowledge they have had of the human brain and the
EEG in order to design a BCI. There are basically two
different approaches that have been used. The first one
called a pattern recognition approach is based on cognitive
mental tasks. The second one called an operant
conditioning approach is based on the self-regulation of the
EEG response.
ISSN: 2231-5381
Signal acquisition is the measurement of the
neurophysiologic state of the brain. In BCI operation, the
recording
interface
(i.e.,
electrodes,
for
electrophysiological BCI systems) tracks neural
information reflecting a person's intent embedded in the
on-going brain activity. As discussed in the last section, the
most common electrophysiological signals employed for
BCI systems include: EEG recorded by electrodes on the
scalp; ECoG recorded by electrodes placed beneath the
skull and over the cortical surface; and local field potentials
(LFPs) and neuronal action potentials (spikes) recorded by
microelectrodes within brain tissue. The brain electrical
http://www.ijettjournal.org
Page 3
National Conference on Engineering Trends in Medical Science – NCETMS - 2014
signals used for BCI operation are acquired by the
electrodes, amplified, and digitized.
these systems will be effectively implemented for many
Biomedical applications.
2. Feature Extractions
The signal-processing stage of BCI operation occurs in two
steps. The first step, feature extraction, extracts signal
features that encode the intent of user. In order to have
effective BCI operation, the electrophysiological features
extracted should have strong correlations with the user's
intent. The signal features extracted can be in the timedomain or the frequency-domain. The most common signal
features used in current BCI systems include: amplitudes or
latencies of event-evoked potentials (e.g., P300), frequency
power spectra (e.g., sensorimotor rhythms), or firing rates
of individual cortical neurons. An algorithm filters the
digitized data and extracts the features that will be used to
control the BCI. In this step, confounding artefacts (such as
60-Hz noise or EMG activity) are removed to ensure
accurate measurement of the brain signal features.
3. Feature Translations
The second step of signal processing is accomplished by
the translation algorithm, which converts the extracted
signal features into device commands. Brain
electrophysiological features or parameters are translated
into commands that will produce output such as letter
selection, cursor movement, control of a robot arm, or
operation of another assistive device. A translation
algorithm must be dynamic to accommodate and adapt to
the continuing changes of the signal features and to ensure
that the possible range of the specific signal features from
the user covers the full range of device control.
ACKNOWLEDGEMENT
This work was generously supported by Prof. Ravi Varma
N. Head of Department, Biomedical Engineering, Dr.
Bhausaheb Nandurkar College of Engineering and
Technology, Yavatmal (M.S) and Dr. V.G. Arajpure,
Principal, D.B.N.C.O.E.T,Yavatmal.
REFERENCES
[1]
Talairach J, Tournoux P (1988). Co-planar Stereotaxic Atlas of
the HumanBrain, New York: Thieme.
[2]
Mazziotta JC, Toga AW, Evans AC, and Fox P, Lancaster J
(1995) a Probabilistic Atlas of the Human Brain: Theory and
Rationale for its Development, Neuroimaging 2: 89-101.
[3]
Altenmuller, E.O., W. Gruhn and D. Parlitz et al. (1997),
“Music Learning Produces Changes in Brain Activation
Patterns: A Longitudinal DC-EEG-study Unit”, International
Journal of Arts Medicine, Vol. 5, pp. 28-34.
[4]
Raz, N., U. Linden Berger, K.M. Rodriue, K.M. Kennedy, D.
Head and A. Williamson (2005), “Regional Brain Changes in
Aging Healthy Adults: General Trends, Individual Differences
and Modifiers”, Cerebral Cortex, Vol. 15(11), pp. 1676-1689.
[5]
Rossi, S., C. Miniussi, P. Pasqualetti, C. Babiloni, P.M.
Rossini and S.F. Cappa (2004), “Age-related Functional
Changes of Prefrontal Cortex in Long-term Memory: A
Repetitive Trans cranial Magnetic Stimulation Study”, Journal
of Neuroscience, Vol. 24(36), pp. 7939-7944.
[6]
Thomae, H. (1970), “Theory of Aging and Cognitive Theory
of Personality”, Human Development 13, pp. 1-16.
[7]
Sowell, E.R., B.S. Peterson, P.M. Thompson, S.E. Welcome,
A.L. Henkenius and A.W. Toga (2003), “Mapping Cortical
Change across the Human Life Span”, Nature Neuroscience,
Vol. 6(3), pp. 309-315.
[8]
Jung T-P, Makeig S, Humphries C , Lee TW, McKeown MJ,
Iragui
V,
and
Sejnowski
TJ, "Removing
Electroencephalographic
Artifacts by Blind
Source
Separation,"Psychophysiology, 37:163-78, 2000 .
[9]
Jung T-P, Makeig S, Westerfield W, Townsend J, Courchesne
E, and Sejnowski TJ, "Removal of eye activity artifacts from
visual event-related potentials in normal and clinical
subjects," Clinical Neurophysiology 111:1745-58, 2000 .
4. Device Output
The signal features thus extracted and translated provide
the output to operate an external device. The output might
be used to operate a spelling program on a computer screen
through letter selection, to move a cursor on a computer
screen], to drive a wheelchair or other assistive devices to
manipulate a robotic arm, or even to control movement of a
paralysed arm through a neuroprosthesis. At present, the
most commonly used output device is the computer screen,
and it is used for communication.
IV. CONCLUSION
The Brain Computer Interface has proved to be boon to
the disabled persons by providing them independent
environment not by manual control but by mere “thinking”.
Brain-computer interfaces and their potential applications
engender great excitement. However, it must be stressed
that in their present state, it remains to be seen how far, and
in what direction, applications for BCIs will develop. Hope
ISSN: 2231-5381
http://www.ijettjournal.org
Page 4
National Conference on Engineering Trends in Medical Science – NCETMS - 2014
“Combining Biometric Id Cards and Online Credit
Card Transaction”
Miss.Neelima U. Kantode#1, Miss.Darshana G. Badwaik#2
1
2
Information Technology Department,DBNCOET, Yavatmal/Sant Gadge Baba Amravati University,Amravati,India
Information Technology Department,DBNCOET, Yavatmal/Sant Gadge Baba Amravati University,Amravati,India
Abstract—
Internet shopping, a strong alternative to
traditional “go, see, touch and buy” shopping, has been one of
the mostly used facilities of the Internet. Several online
shopping systems serve internet users all around the world
and enable people to get the products they need with a small
effort. Internet shopping can be considered as “see and buy”
retailing. While the “see” part is implemented by the expertise
and imagination of web designers, different payment schemes
have been devised for the “buy” part. The most used media
are online credit card transaction systems. Several different
methodologies have been developed for credit card
transactions. However, research has shown that most of
internet users do not fully trust credit card payment systems
because of financial risks such as loss of money. Various
approaches have been performed in order to gain the
consumers’ trust in credit card transactions; but no solution
has been found to overcome the weaknesses in those systems.
This paper proposes a new solution that combines biometric
ID card with online credit card transactions. Since the
implementation details such as the type and the matching
algorithm of the biometrics data might vary between
countries because of the project requirements and laws, the
proposed system remains local for the each country that
might adopt the solution. To elucidate the proposed system
and provide a concrete example, we used Turkish e-ID pilot
system as the identity verification module since it best fits the
requirements of the framework.
Keywords—internet shopping; e-ID; biometrics; credit
card transaction; multi-factor authentication;
I. INTRODUCTION
Internet shopping is one of the most popular uses of the
internet. As internet technology evolves, more advanced online
systems are developed and uses of those systems increase
dramatically. Everyday Internet users all around the globe browse
merchant Web sites to buy products and services. Users browse
the online stores and obtain their needs with minimum effort
compared to traditional retailing systems. The difference occurs in
the manner of payment; while using a POS device to perform a
payment with their credit cards in offline retailing, consumers
provide their personal data together with credit card details over
the Internet in order to complete an online payment. However,
most people do not volunteer giving such details because of
financial risks. To calculate the percentages of customers’
perceptions in different risks for internet shopping, S. M. Forsythe
and B. Shi have analyzed a data set taken from Graphic,
Visualization, and Usability (GVU) Centre from Georgia Institute
of Technology. In the analysis of the public survey that has been
ISSN: 2231-5381
performed with 5645 participants, 23% of the applicants have
mentioned financial risk (i.e., risk regarding loss from online
credit card usage) in internet shopping. Spoofing, phishing,
intrusion, possible malicious changes to the data sent over wire,
denial of services (DOS), overcharging the customers are
financial risks that discourage internet users from performing
online shopping using their credit cards. Several methods have
been devised to overcome the financial theft possibilities and gain
the costumers’ trust back. However, no definite solution has been
devised to completely overcome the mentioned risks and promise
an entirely safe and theft proof shopping environment for internet
users. Using the capabilities of biometric ID card, this framework
proposes a safer shopping environment for both consumer and the
merchant, which sells products and service over the web. Since
the e-ID system provides a ready to use security and identification
infrastructure, the banks and the merchants need to spend less
effort in integrating the framework then implementing security
mechanisms themselves. Though being a local solution because of
the specific e-ID implementation, the framework both provides
identity verification for the consumers via multi factor
authentication and verifies the merchants’ institutional info to
ensure a safe path of payment from the consumers’ bank accounts
to the merchants’ bank accounts. The deficiency of the ECommerce transactions has enforced people to research new
methodologies. One of such methodologies is Visa’s “Verified by
Visa” program, which has been then adopted by MasterCard as
“MasterCard SecureCode” and by JCB International as
“J/Secure”. This program introduces a password protection
mechanism to online credit card transactions.
The approach is based on a protocol called 3D Secure. In
this protocol, the credit card issuer bank approves the fund
transfer after authenticating the cardholder via a previously
defined password for which the user is prompted during an online
credit card transaction. However, being an easy to use system
especially for the users, the strength the protocol offers by
password approach has also become the weakness because of
phishing and key loggers. The side effect to the user is keeping
the password secret.
II.AUTHENTICATION AND AUTHERIZATION
Authentication
Authentication is verification of the identity of the entity
requesting access to a system. It is the process of determining
whether someone or something is, in fact, who or what it is
declared to be. In private and public computer networks
(including the Internet), authentication is commonly done through
the use of logon passwords. Knowledge of the password is
assumed to guarantee that the user is authentic. Each user
registers initially (or is registered by someone else), using an
assigned or self-declared password. On each subsequent use, the
http://www.ijettjournal.org
Page 5
National Conference on Engineering Trends in Medical Science – NCETMS - 2014
user must know and use the previously declared password. The
weakness in this system for transactions that are significant (such
as the exchange of money) is that passwords can often be stolen,
accidentally revealed, or forgotten.
For this reason, Internet business and many other
transactions require a more stringent authentication process. The
use of digital certificates issued and verified by a Certificate
Authority (CA) as part of a public key infrastructure is considered
likely to become the standard way to perform authentication on
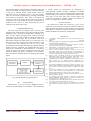
the Internet. Logically, authentication precedes authorization
(although they may often seem to be combined)
Figure 1: Process of authentication
Authorization
Authorization is the process of giving someone
permission to do or have something. In multi-user computer
systems, a system administrator defines for the system which
users are allowed access to the system and what privileges of use
(such as access to which file directories, hours of access, amount
of allocated storage space, and so forth). Assuming that someone
has logged in to a computer operating system or application, the
system or application may want to identify what resources the
user can be given during this session. Thus, authorization is
sometimes seen as both the preliminary setting up of permissions
by a system administrator and the actual checking of the
permission values that have been set up when a user is getting
access. Logically, authorization is preceded by authentication.
III.TYPES OF BIOMETRIC
AUTHENTICATION
AND
OTHER
TYPE
technologies, not voice recognition. In this process, a
person’s voice is transformed into text and compared to
an original template. Although this is fairly easy
technology to implement because many computers
already have built-in microphones, the enrollment
procedure is more complicated than other biometrics, and
background noise can interfere with the scanning, which
can be frustrating to the user.
Handwritten Signature - Signature verification analysis
the way a person signs their name, such as speed and
pressure, as well as the final static shape of the signature
itself.
Retina recognition - It is a method of biometric
authentication that uses data related to unique
characteristics associated with the pattern of blood vessels
located at the back of an individual’s eyes.This
technology is personally invasive and requires skilled
operators. It results in retina codes of 96 bytes when used
for authentication to some Kbytes in the case of
identification. Facial recognition techniques exploit
characteristics such as relative eyes, nose and mouth
positioning, and the distances between them.
Iris recognition - A form of authentication that uses data
linked to features associated with the colored part of the
eye of a user. It involves analyzing the patterns of the
colored part of the eye surrounding the pupil. It uses a
fairly normal camera and does not require close contact
between the eye and the scanner. Glasses can be worn
during an iris scan, unlike a retinal scan.
OF
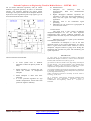
Types of biometric authentication
Fingerprint recognition – Fingerprint is the most widely
used form of authentication where the pattern of a user’s
fingerprint is used. It can be deployed in a broad range of
environments and provides flexibility and increased
system accuracy by allowing users to enroll multiple
fingers in the template system.
Facial recognition - It uses data related to the unique
facial features of a user. It involves analyzing facial
characteristics. It is a unique biometric in that it does not
require the cooperation of the scanned individual; it can
utilize almost any high-resolution image acquisition
device such as a still or motion camera.
Voice pattern - This form of authentication uses the
unique pattern of a user’s voice. It relies on voice-to-print
ISSN: 2231-5381
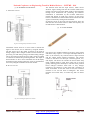
Figure 2: Biometric authentication
IV. E-ID SYSTEM
An identity document(also called a piece of
identificationor ID) is any document which may be used to verify
aspectsof a person's personal identity. If issued in the form of
asmall, mostly standard-sized card, it is usually called an identity
card (IC). In some countries the possession of agovernment-
http://www.ijettjournal.org
Page 6
National Conference on Engineering Trends in Medical Science – NCETMS - 2014
produced identity card is compulsory while inothers it may be
voluntary. In countries which do not haveformal identity
documents, informal ones may in some circumstances be
required.
The EID System is actually three separate services:
Identity Management Service – Provides for the
creation and management of identity accounts
(commonly called E-ID accounts) for the entire
university community.
Authentication Service – Provides an EID credential
(e.g., password) verification service and supports login
session management for web-based campus services.
Directory Service – Provides "lookup" services for
EID identifiers, affiliations, and other information of
interest across campus.
Turkish e-id system
Turkish e-ID system is a pilot project that has been started
in 2006 by TUBITAK UEKAE and is still in development. The
project development is planned to be finished in May 2010. There
have been three pilot phases for e-ID card personalization and
distribution. The first phase was performed in TUBITAK UEKAE
in April 2008 and 100 ID cards were personalized and given to
the employees as cardholders. The second pilot phase was carried
out in Bolu (Turkey) in three months starting from August 2008
and 13,000 ID cards were personalized and given to citizens. The
final phase started in July 2009 and is planned to be finished in
May 2010 as the last step of the project. In this final phase, nearly
300,000 ID cards are planned to be personalized and handed over
to the citizens. Health care was chosen to be the first application
of the Turkish e-ID project. For that, 5 patients’ clinics in 1 state
hospital, 95 pharmacies and 9 family doctors joined the project
for using the ID card in medical treatments and evaluate the
services offered by the system. Besides health care, there are also
10 automation companies that are planning to integrate the pilot
e-ID project into their identification infrastructure.
Turkish e-ID system, offers different identity verification
schemes depending on the required authentication level. The most
basic level is the visual identity verification scheme that someone
(e.g., a police officer) matches the citizen photo that is printed or
engraved on the card surface to the cardholder for identification
by naked eye. In this scheme, the security level is very low and
fraud possibility is high because of the human factor. The most
secure and reliable scenario is an electronic authentication
scenario that relies on the citizens smartcard, public data, PIN and
biometric verification, in other words multi-factor authentication.
Turkish e-ID system components enable this highest level of
identity verification to be also used in remote authentication.
Turkish e-ID System Components
Turkish e-ID card is a smart card that operates AKIS
national smart card operating system. The citizens’ biometric data
is stored into a special file element that requires symmetric
authentication for read access. Symmetric authentication via
External Authenticate and Internal Authenticate APDU
commands is performed between the citizen ID card and another
special smart card called Secure Access Module (SAM), which is
embedded into the special Card Access Device (CAD) that is
designed by TUBITAK UEKAE. SAM contains symmetric keys
that are needed to verify a citizen card and asymmetric keys and
ISSN: 2231-5381
certificates that are issued by governmental certificate authorities.
CAD is a specialized card reader that is also capable of enrolling
and verifying fingerprint and finger-vein data.
Remote Biometric Authentication in Turkish e-ID system
Having an embedded SAM card and biometric enrolment
support, CAD is able to access the fingerprint or finger vein data
of the citizen, verify the data locally and sign the biometric
verification result so that the result can be verified at remote
systems. The CAD requires user’s PIN input, performs data
matching and creates a signed single use identity verification
package (IVP). IVP contains timestamp, the biometric matching
result, the citizen’s demographic data, arbitrary data field that
might be used for signing external data and the SAM’s certificate.
Since governmental certificate authorities issue the CAD
certificates, any remote system will be sure that a higher authority
approves the authentication result by validating the package via
the official identity verification service (IVS), a web service
provided in the e-ID system. The IVS marks the IVP as expired
after validation in order to guarantee that it has been used only
once.
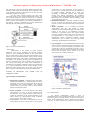
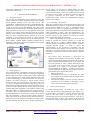
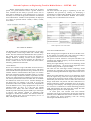
V.PROPOSED FRAMEWORK
Having a remote biometric authentication system
available, we demonstrate online credit card transaction system
prototype. The structure of the system is depicted in figure 2. We
have grouped the system components into domains according to
their roles and relations. The verification domain contains two
components, the IVS and the issuing bank, which as the name
implies issues the customer’s credit card and performs payment
according to identity verification result. Acquiring domain
represents the target of the payment. There are two components of
this domain, 1) the merchant that sells products or service to the
customer and 2) the acquiring bank, which provides the
merchant’s account that the transfer will be made to. The
customer domain stands for the user side of the system and has
four components; 1) the customer’s computer, 2) biometric ID
card, 3) CAD and 4) the customer. In this framework, we do not
only aim the identification of the customer but also we verify the
merchant and order data to ensure a proper fund transfer. To
achieve this we use the arbitrary data field of IVP to store the
order details package (ODP) which is created by the merchant.
The ODP is a signed package that contains the merchant’s info
and bank account details, order info and merchants public
certificates. This approach protects both the customer and the
merchant; because the IVP now contains both source and target
accounts; and the certificates of sides ensure the integrity of IVP
and ODP and protect the transaction from malicious attempts.
Another approach is, using virtual credit card number in online
payments. In this approach, a credit card holder is assigned a
virtual credit card that shares the same account as the cardholder’s
physical credit card. It can be used in online transactions as a
traditional credit card until its expiry date. The virtual card has a
card number, a CVC number, an expiry date and a flexible
monetary limit that can be redefined by the user prior to a
transaction and reset periodically. The advantage offered by a
virtual credit card is that, even if the credit card number is stolen
together with other details, it cannot be used until the user
redefines a new temporary limit for a new transaction. Though
decreased, the theft possibility occurs between the time span
starting with a limit redefinition and ending with a transaction or
http://www.ijettjournal.org
Page 7
National Conference on Engineering Trends in Medical Science – NCETMS - 2014
periodical reset. An alternative to virtual credit card, which can be
used several times, is the “Single Use Card Number”. In this
approach, the card-issuing bank provides the user a single use
card number, which expires after single use in a transaction. This
approach limits fraud possibility; and defeats the key loggers
because of single use. However, this approach forces the user to
perform a purchase with this number as soon as possible, because
keeping the number secure becomes a challenge for the user.
Although being valuable and widely used approaches, the current
solutions remain specific for each bank and customer pair. Either
the users have to keep several passwords secret for each credit
card they own and deal with worm and key-logger issues
themselves or spend time keeping track of single use or virtual
credit card numbers. A more user friendly and securer approach is
needed in order to both keep users satisfied and make them feel
safe when they attempt to make online purchases. The idea of
using biometric ID card in online transactions comes into play at
this point, because it offers several usage advantages and a more
powerful and legitimate identity verification mechanism.
identification. As being passwords that are physically bound to
human and not needed to be memorized, biometrics provides
more reliable identity verification (“Is this person who he claims
to be?”). Consequently, if the used biometric verification system
is powerful enough, it nearly becomes impossible to perform an
online transaction without the customer’s knowledge, even if
someone steals her card and PIN somehow.
Another advantage of biometric ID card is that the e-ID
system provides an authentication scheme that is approved by the
governmental authorities. This introduces a more legitimate and
central identity verification framework, which can be utilized in
different applications. Hence, various organizations such as health
care institutions, banks, police officers might integrate this central
authentication framework into their systems for specific identity
verification needs. This makes the biometric ID card the central
key and enables citizens to use the same card in every application
via a card access device. Thereby, the citizen does not need to
memorize several passwords or keep tokens for each account she
has but the PIN number and the ID card. Using the central
biometric identity verification framework, a bank will be able to
verify the identity of the person who needs to perform a remote
transaction (e.g., online purchase). This saves the banks from
investing large amounts of money to research a powerful
authentication mechanism and enables them spend less effort and
financials by integrating an already tested and ready to use
security infrastructure.
The proposed framework has been exemplified using
Turkish e-ID System since the system and its components best fit
the MFA requirements of the framework. Thereby, we introduce
the Turkish e-ID system, which is an ongoing pilot project, and
denote how the facilities it provides can be integrated into our
framework.
CONCLUSION
Figure 3: Overview of the framework
VI.ADVANTAGES OF BIOMETRIC ID CARD IN CREDIT
CARD TRANSACTION
Biometric ID card provides multi-factor authentication (MFA), a
security system in which multiple authenticators are used in order
to increase the validity of identity verification. Some of those
authenticators are passwords, tokens, keys, cards and biometrics.
Authentication factors for MFA are usually grouped into
these three categories: 1) what you know (e.g., password), 2) what
you have (e.g., token), and 3) who you are (e.g., biometric).
Combination of these categories decreases the vulnerability that
arises when each authenticator is used alone in an authentication
scenario. In other words, hacking one’s secret password is easier
than hacking the password and fingerprint together. Thereby,
multi-factor authentication provides a more reliable infrastructure
than a traditional password authentication scheme.
Biometric ID card implements the three categories of
MFA as follows. 1) “What you know” is the PIN of the e- ID
card, 2) “What you have” is the smart card that is issued by the
government to the citizen, and 3) “Who you are” is the biometric
data of the citizen saved securely in the smart card or a central
database for biometric authentication and play the key role in
ISSN: 2231-5381
Security in online payment systems has been a wide research area
since the early days of the Internet and several approaches have
been devised by various organizations. However, there has been
no certain solution overcome the deficiencies in these systems
completely.
Looking at the problem from a different mirror, we have
introduced a solution based on the rapidly developing smart card
based biometric ID systems and given a sample implementation
on Turkish e-ID system. The sample implementation is explained
with a successful purchase scenario.
The combination of biometric ID cards and online
transaction might be used in countries that use biometric ID card
with some modifications according the specific implementation
details of their e-ID solutions. Although the solution is not global
because of the e-ID system differences for each country, it
provides high security and safety for both the customer and the
merchant in local e-commerce systems.
REFERENCES
[1] AKIS national smart card operating system, developed by
TUBITAK UEKAE. 3.12.2009
[2] JCB Global Site, E-Commerce Solution J/Secure. 03.12.2009
[3] MasterCard SecureCode, Credit Card Security: Safe & Secure
Online Shopping. 03.12.2009
http://www.ijettjournal.org
Page 8
National Conference on Engineering Trends in Medical Science – NCETMS - 2014
[4] TUBITAK UEKAE, National Research Institute of
Electronics and Cryptology. 03.12.2009
[5] Turkish e-ID Card Access Device advertisement booklet. .pdf
03.12.2009
[6] Turkish Electronic Card Distribution System. 03.12.2009
[7] Verified by Visa, A simple password protected identity
checking service.03.12.2009
[8] S. Banerjee, S. Karforma, A Prototype Design for DRM based
Credit Card Transaction in E-Commerce, Department
ofComputer Science, University of Burdwan, Golpbag, Burdwan:
ACMUbiquity, Vol. 9, Issue 18, 2008.
[9] An article by Miles Brignal, Verified by Visa scheme confuses
thousands of internet shoppers, Money news & features,
TheGuardian, 21 April 2007.
[10] Q. Xiao, Security Issues in Biometric Authentication,
Workshop on Information Assurance and Security. United States
Military Academy, West Point, NY, USA: Proceedings of the
IEEE,
2005.
[11] A. Ross and A. K. Jain, Biometrics: When Identity Matters,
West Virginia University, Morgantown, WV 26506 USA,
Michigan State University, East Lansing, MI 48824 USA:
Springer-Verlag Berlin Heidelberg, 2004.
ISSN: 2231-5381
http://www.ijettjournal.org
Page 9
National Conference on Engineering Trends in Medical Science – NCETMS - 2014
Neuro-Soft Computing Approach for the Design of
Near-Optimal Classifier for Quality Assessment of
Food Product
Prof. Abhijeet Shinde, Ms. Yashshree Chavan
Assistant Professor, Department of Electornics &
Telecommunication,D.B.N.C.O.E.T.,Yavatmal,Maharashtra, India
Student of Master of Engg., Department of Digital Electronics, D.B.N.C.O.E.T.,Yavatmal,Maharashtra,India
Abstract -This paper gives the best neural network classifier for
quality assessment of food product.We are using Back propogation
network, multilayer perceptron & Radial basis fuction for this
perpose, And finally best network will be choosen for the quality
Assessment.
Keywords –Neural network, Sensors,MLP, Radial Basis Function
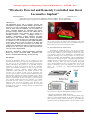
1. INTRODUCTION
Electronic noses (E-Nose) have been developed as systems for
the automated detection and classification of odors, vapors, and
gases. Electronic Nose is a smart instrument that is
designed to detect and discriminate among complex
odours using an array of sensors. The array of sensors
consists of a number of broadly tuned (non-specific)
sensors that are treated with a variety of odour sensitive
biological or chemical materials. This instrument provides
a rapid, simple and non-invasive sampling technique, for
the detection and identification of a range of volatile
compounds. The key function of an electronic nose is to
mimic human olfactory system. The human nose is still
consideration the primary tool employed in industry to
characterize the odour of a variety of consumer products.
E-Nose is a device that identifies the specific components of an
odor and analyzes its chemical makeup to identify it [1].To
humans, the sensation of flavor is due to three main
chemoreceptor systems. These are gustation (sense of taste by
tongue), olfaction (sense of smell by nose) and trigeminal (sense
of irritation of trigeminal receptors). The sense of taste is used to
detect certain non-volatile chemicals, which enter the mouth.
The sense of smell is used to detect certain volatile compounds.
Receptors for the trigeminal sense are located in the mucous
membranes and in the skin. They respond to certain volatile
chemicals and it is thought to be especially important in the
detection of irritants and chemically reactive species. In the
perception of flavor all three chemoreceptor systems are
involved but olfaction plays by far the greatest role.
ISSN: 2231-5381
The proposed research aims at design of near-optimal classifier
using neural networks for quality analysis of food or dairy
products using E-Nose. The data generated by E-Nose are nonlinear and overlapping in the feature space. This justifies the
applicability of Nero-Soft Computing Approach for the input
data classification in food or dairy product industry. The
proposed research aims at the design of near-optimal classifier
for quality analysis/ assessment of food or dairy products using
E-Nose.
1.1 Aims and Objectives:
E-Nose is a new and promising technology which aimed
to rapidly becoming a valuable tool for the organoleptic
evaluation of food parameters related to taste and smell and
could replace human sensory panels
in
quality
control
applications, wherethe objective, rapid and syntheticevaluation o
f the aroma of many specimens is required. An electronic nose
is generally composed of a chemical sensing system (sensor
array or spectrometer) and a pattern recognition system, such as,
artificial neural network [2]. The proposed system aims at
providing, real-time, knowledge of odor being produced by ENose to assess the quality of food or dairy products.
E-Noseconsists of a sampling system (for a reproducible
collection of the mixture), an array of sensors (which is the heart
of the system), electronic circuitry and data analysis software
[1].E-Nose using arrays of chemical sensors can be divided into
three categories according to the type of sensitive material used:
inorganic crystalline materials (e.g. semiconductors, as in MOSFET structures, and metal oxides); organic materials and
polymers; biologically derived materials. Comparatively to
classical techniques (e.g. the combination of gas
chromatography and mass spectroscopy (GC-MS)), E-Nose are
simpler and more accurate devices. They recognize a fingerprint
that is global information, of the samples to be classified [3,4].
http://www.ijettjournal.org
Page 10
National Conference on Engineering Trends in Medical Science – NCETMS - 2014
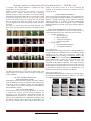
An essential objective of this research work is to ensure that the
technology would be robust, sufficiently sensitive, and able to
identify and quantify odors from food or dairy products. An
odour stimulus generates a characteristic fingerprint (or smellprint) from the sensor array. Patterns, or finger-prints, from
known odours are then used to construct a database and train a
pattern recognition system so that unknown odours can
subsequently be classified, i.e. identified. Thus E-Noses
comprise of mechanical components to collect and transport
odours to the sensor array as well as electronic circuitry to
digitize and store the sensor responses for signal processing.
Generally speaking, electronic noses are faster to respond, easier
to use and relatively cheaper in comparison with conventional
analytical techniques, such as gas chromatography/mass
spectroscopy and flame ionization detection, so that they have
wide applications in environmental monitoring [5, 6] , food and
beverage industry , medical diagnosis [7], public security [8] ,
odour classification of grains [9] and others.
Dealing with E-Nose signals is still crucial for artificial
olfaction to reliably recognize various odors due to time
variance of the signals. Aim of this research work is to develop
Neural Network based Near-Optimal Classifier to assess the
quality food or dairy product, such as, tea or basmati rice or
milk using E-Nose.
Existing method to check the quality of these products is done
by Human Tester. For example tea quality/grade is decided on
the basis of decision given by Tea Tester who is a human being.
There is a lot of error, deviation in the measurement by human
being. To avoid this optimum classifier system based on
electronic nose using neural network could be designed which
would more reliable and accurate [28, 29].
1.2 Scope and Limitation
Using Electronic-nose we can sense a smell and with a
technology called Digital scent technology it is possible to
sense, transmit and receive smell through internet, like smelling
a perfume online before buying them, sent scented E-cards
through scent enabled websites, and to experience the burning
smell of rubber in your favorite TV games etc. As a
multidisciplinary research, most studies on electronic noses
focused on the sensitivities of the chemical sensor array and the
pattern recognition methods to process the signals obtained from
the sensor array. With the development of functional material
technology, signals can be obtained via various sensors, such as
metal oxide semiconductor, optical, con-ducting polymer (CP),
quartz crystal microbalance and surface acoustic wave sensors
[10] . Some pattern recognition methods have been introduced
into electronic noses [11, 12]. Neural networks are usually
considered to be one of the most promising methods to solve
this complex and non-linear problem, because they can cope
with nonlinear problems and handle noise or drift better than
ISSN: 2231-5381
conventional statistical approaches. So many neural networks to
process signals from sensor arrays are reported, such as back
propagation trained neural network [13] , radial basis function
neural network, probabilistic neural network , self-organizing
network.
There are few disadvantages to the E-Nose technology which
includes the price. The cost of an E-Nose is very high which the
main hurdle in doing the research work. Another disadvantage
has been the delay between successive tests, the time delay
ranging between 2 to 10 minutes during which time; the sensor
is to be washed by a reactivating agent, which is applied to the
array so as to remove the odorant mixture from the surface and
bulk of the sensors active material [26].
2 LITERATURE REVIEW
A brief review of the research works in relation to the E-Nose is
as follows:
Ritaban Dutta, and Ritabrata Dutta [14] has presented in
research on Electronic Nose basedENT bacteria identification in
hospital environment is a classical and challenging problem of
classification. An electronic nose (e-nose), comprising a hybrid
array of 12 tin oxide sensors (SnO2) and 6 conducting polymer
sensors has been used to identify three species of bacteria,
Escherichia coli (E. coli), Staphylococcus aureus (S. aureus),
and Pseudomonas aeruginosa (P. aeruginosa) responsible for
ear nose and throat (ENT) infections when collected as swab
sample from infected patients and kept in ISO agar solution in
the hospital environment.
S. Ampuero and J.O. Bosset [15] have proposed the model for
Electronic Nose. Most of the reported applicability studies of
electronic noses to different aspects of quality assessment in
dairy products show satisfactory results. Published literature
reports the classification of dairy products by sample type with
MOS sensors; by ageing with MOS, CP and MS-based
instruments; by geographic origin with an MS-electronic nose;
by processing stage with CP sensors. A successful model for
milk shelf-life prediction was implemented with a MOS system.
The identification and classification of different types of qualitydeterioration have also been published: different off-odours in
milk with an MS-based tool, lower quality of casein samples
with MOS sensors, identification of microbial contamination in
milk with CP, MS, etc. Nevertheless, in most cases the results
will have to be confirmed on a larger scale to make sure that the
classifications obtained are still valid with a larger intra-group
variability, which is generally found in the case of natural
products.
Simona Benedettiet. al. [16] have suggested a model of
Electronic Nose for honey classification. Seventy samples of
honey of different geographical and botanical origin were
http://www.ijettjournal.org
Page 11
National Conference on Engineering Trends in Medical Science – NCETMS - 2014
analyzed with an electronic nose. The instrument, equipped with
10 Metal Oxide Semiconductor Field Effect Transistors
(MOSFET) and 12 Metal Oxide Semiconductor (MOS) sensors,
was used to generate a pattern of the volatile compounds present
in the honey samples. The sensor responses were evaluated by
Principal Component Analysis (PCA) and Artificial Neural
Network (ANN). Good results were obtained in the
classification of honey samples by using a neural network model
based on a multilayer perceptron that learned using a back
propagation algorithm. The methodology is simple, rapid and
results suggest that the electronic nose could be a useful tool for
the characterization and control of honey.
Huichun Yu and JunWang [17] made investigation to evaluate
the capacity of electronic nose to classfiy the tea quality grade.
In their experiment the volume of vial and headspace generated
time were considered corresponding to the 5 g. tea samples. The
four tea groups were measured and response values at four
different collection times were conducteed by PCA, LDA and
ANN. The method of ANN was performed and 90 % of the total
tea samples were classified correctly by using the backpropogation neural network.
Jun Fu et. al. [18] developed a model in which the concept of
Electronic Noise is used for pattern recognition.In this paper, a
biologically inspired neural network, based on anatomical and
electroencephalographic studies of biological olfactory systems,
is applied to pattern recognition in electronic noses. Classifying
six VOCs commonly presented in the headspace of Chinese rice
wine, its performance to eliminate the concentration influence
and counteract sensor drift is examined and compared with the
simple nonparametric algorithm and the well-known BPNN.The neural network has a good performance in classification
of six VOCs of different concentrations, even for the patterns
obtained 1 month later than what was used for training. Its
flexibility and robust fault tolerance are quite suitable for
electronic nose applications, subjecting to the problems
associated with the susceptibility to concentration influence and
sensor drift.
As per Federica Cheli et. al. [19] proposed that it is possible to
differentiate and classify maize samples contaminated and noncontaminated with aflatoxins by using an electronic nose
equipped with 10 MOS sensors. Despite the small number of
samples, the electronic nose was able to detect a clear difference
in volatile profile of maize in the presence and absence of
aflatoxins using PCA analysis. By the use of LDA a correct
classification of maize contaminated and non-contaminated with
aflatoxins was achieved. Results indicate that electronic nose
may be successfully applied as rapid and non-destructive
method for screening of commodities contaminated with fungal
toxins, in order to select samples that must undergo further
accurate quantitative analysis. Further improvements of the
model are needed in order to eliminate or minimize the
ISSN: 2231-5381
component in the model not directly related to aflatoxins
concentration, to evaluate the potentiality of classification
below/above legal limits and maybe to develop robust
regression models for prediction of aflatoxin content in maize
samples.
J. Brezmes et. al.[20] made investigated on the use of a
concentration chamber in the E-Nose has also proven to be very
useful; signals are stronger because fruit vapors are accumulated
during a long period of time and many pieces can be measured
together. More-over, since group measurements can be done,
our proto-type can be easily adapted to practical applications
where single piece measurements are not cost-effective. The
results obtained prove that our Electronic Nose monitors peach
and pear ripeness successfully. Measurements with apples were
not as good and further research will be done in order to
increase the accuracy with this particular fruit.
W.A. Collier et. al. [21] proposed a model in which an
electronic nose can be used to discriminate among four milk
samples, among four yoghurt samples, and among four cultured
and non-cultured dairy products with a high degree of success if
the measurements on the samples were all made in a single
experiment. It has also been demonstrated that a ‘‘singleelectrode’’ array can be used to make these discriminations.
More rigorous control of manufacturing conditions of arrays or
preparation steps could ensure that the sensing surfaces are more
reproducible, enabling classification of samples based on
previously stored databases of training sets.
S.Capone, M. Epifani, F. Quaranta, P. Siciliano, A. Taurino, L.
Vasanelli [22] developed a model in which the rancidity of milk
by means of electronic nose and dynamic PCA analysis.
Semiconductor thin films based electronic nose were used to
recognise the rancidity of two differeent kinds of milk (UHT
and pasteurised) during their ageing days. The employed sensor
array consists of five different SnO2 thin films prepared by
means of sol-gel technology. The data coming from the response
of sensors have been elaborated by PCA, in order to obtain a
classification of the data clusters related to different milk ageing
days and so track the dynamic evolution of milk rancidity.
Graham E. Searle and Julian W. Gardner [23] presented linear
black-box (inverse) models for an E-nose system that can be
successfully employed for strain classification of cyanobacteria.
The models performed as well as the previously employed
artificial neural network techniques, with the advantage that
they require less computing power to implement. However, for
the more complex problem of growth phase classification, the
technique was only moderately successful; failing to compete
with the results obtained elsewhere using nonlinear neural
network techniques. Thus such modeling techniques could be
appropriate for use in relatively simple applications where
available computing power is limited, such as in a handheld
http://www.ijettjournal.org
Page 12
National Conference on Engineering Trends in Medical Science – NCETMS - 2014
instrument. Future refinements of the techniques could make
them suitable for more challenging classification problems,
where currently artificial neural networks are most suitable.
Vassilis S. Kodogianniset. al. [24] presented an alternative
approach based on gas-sensing technology was taken to
investigate the suitability of such a system as a point-of-care
device. It should be emphasized here that this system is not
being proposed as a replacement for a clinician’s diagnosis but
rather to supplement other diagnostic methods. It also helps the
clinician deliver better service as the E-Nose system has the
potential advantage of making decisions 24 h per day, seven
days per week. This study suggests that the e-nose combined
with advanced learning-based processing tools is able to identify
specific bacterial pathogens with accuracy and speed, even with
a small sample quantity, at the point-of-care. Chronic renal
failure and tuberculosis are also two diseases where people
could benefit from new point-of-care devices based on gas
sensors.
Marco Trincavelliet. al. [25] used E-noses to discriminate
among various bacteria regularly found in the blood cultures.
This is an important application of electronic olfaction that
could significantly improve the current methodologies and be
successfully used in clinical settings. The results presented show
that the bacteria can be accurately discriminated using the
method. Further the proposed methods have been tested on a
large dataset, (an order of magnitude larger than earlier studies).
Their next step will be the starting of clinical trials to test the
robustness of the method and its applicability in a clinical
setting. In particular, they will examine the effect of the
genealogy of the bacteria (i.e., different strains of the same
species on discrimination performance).
From the extensive literature review it is evident that the
concept of E-Nose is applied in the field of health care,
environment and food industry. Currently the biggest market for
electronic noses is the food industry. Applications of electronic
noses in the food industry include inspection of food quality by
odour, control of food cooking processes, inspection of fish,
monitoring the fermentation process, checking rancidity of milk
etc. In food industry, quality assurance systems need to be rapid
and more accurate. Generally qualitative assessment of food
spoilage is made by human sensory panels that evaluate air
samples and discriminate which food products are good or
unacceptable. Bacterial contamination of food and drinks can
generate unpleasant odours and toxic substances. Therefore,
different industries are interested in the application of E-Nose
both for monitoring of storage quality degradation and for
detecting microbial contaminants. Electronic nose can be used
for accurately detection for all contaminations in the food
product. In some instances E-Nose can be used to augment or
replace panels of human experts. In other cases, E-Nose can be
used to reduce the amount of analytical chemistry that is
ISSN: 2231-5381
performed in food in food production especially when
qualitative results will do.
3. PROPOSED METHODOLOGY DURING THE TENURE
OF THE RESEARCH WORK
The demand of E-nose in food or dairy industry is growing
because of its versatility and ease of operation of these
instruments make them appropriate for fast and accurate
analysis of various products or for monitoring the quality in the
production process. The study has shown that commercial ENose can be used for the evaluation of various products in these
industries. The uses of E-Nose can successfully distinguished
quality of products such as tea, coffee, honey, basmati rice etc.
The E-Nose can also be used to know the pollution of the gases
emitted by various industries
The special features of neural networks such as capability to
learn from examples, adaptations, parallelism, robustness to
noise, and fault tolerance have opened their application to
various fields of engineering, science, economics, etc. In all
types of artificial neural networks, the basic structure consists of
a number of interconnected processing units, called neurons.
The calculations that each neuron performs, along with the way
that the neurons are interconnected, determine a particular
neural network type.
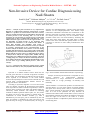
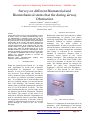
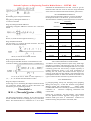
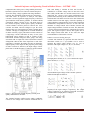
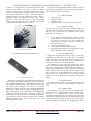
The advantage of neural classifiers over linear classifiers is that
they can reduce misclassifications among the neighborhood
classes as shown in following Fig. 1. The use of neural networks
in this work is therefore proposed due to its learning ability, and
capacity for solving nonlinear and complicated problems.
Fig. 1 Neural networks based classifier verses linear classifier
The main objective of our research is to classify the quality of
food or dairy product available in the market by employing an
efficient near-optimal neural network based classifier using E-
http://www.ijettjournal.org
Page 13
National Conference on Engineering Trends in Medical Science – NCETMS - 2014
Nose. Pattern recognition is an important part of E-Nose
technology would be done using neural networks. The main
problem associated with neural network is long processing time
and large training sample required. The main advantages using
this algorithm are learning may be fast and parallel computing is
possible, weight analysis is easier for modular network, better
generalization performance. The design of neural network will
be done using MATLAB or Neurosolutions softwares
Actual experiment on electronic–nose will be done at CDACKolkata and database will be generated. CDAC-Kolkata has
given permission to perform experiments at their facility on the
E-Nose set up. The unique and dominant features of the data set
shall be extracted from the E-Nose after performing
experiments. The features will then be applied to the Neural
networks to train and design it optimally so as to further classify
the test product to know its quality.
Implementation Scheme in various phases:
1) Study of the sensors chosen for classification.
2) Nonlinear parameter identification of the selected sensors.
3) Development of a basic neural network based model for
sensor data classification.
4) Development different possible efficient neural network
models for that, and their comparison.
5) Determination of best possible neural network model from
the various efficient models implemented.
6) Testing and validation of the final neural network model.
In this research, it is proposed to use different neural network
structures such as MLP, Generalized Feedforward Neural
Networks, Modular Feedforward Neural Networks, Principal
Component Analysis NN, RBF NN, and Support Vector
Machines for modeling of different intelligent sensors
Akaike’s Information Criterion for train, crossvalidation and test data
Minimum descriptive length for train, cross-validation
and test data
Sensitivity Analysis for train, cross-validation and test
data
Receiver Operating Characteristics for train, crossvalidation and test data
Confusion matrices for train, cross-validation and test
data
4. IMPLICATIONS
Electronic Nose is an important concept which is used in food
industries to assess the quality of food. Food products contain
off-flavor compounds created by a variety of mechanisms, such
as, through the action of natural and microbial enzymes and
chemical changes catalyzed by light or heavy metals. However,
detection of aroma compounds using electronic noses has
become more and more important.Potential applications in odor
assessment by electronic noses in the food area are numerous;
they have been used for quality control, monitoring process,
aging, determination of geographical origin, adulteration,
contamination, and spoilage.
There is no universal sensor system that can solve all odor
analysis problems. Instead there is a need to employ intelligent
application-specific sensor systems that are appropriate to the
application. This means building in intelligence through the
development of suitable sensor structures, sensor materials and
pattern recognition methods. New pattern recognition methods
would make use of the transient information in the sensor signal
to enhance the identification ability of the system. This requires
the use of dynamic models, for the sensor system, which can
account for the drift in sensor parameters.
This research work is an attempt to develop a NeuroSoftcomputing system to assess the quality of food product
which will be more accurate, more reliable, and optimal.
undertaken. The generalization performance of different models
5. REFERENCES
will be validated meticulously on the basis of the following
1.
important parameters:
2.
MSE on train, cross-validation and test data
NMSE on train, cross-validation and test data
Correlation coefficient for train, cross-validation and
test data
% Error for train, cross-validation and test data
ISSN: 2231-5381
3.
4.
Esmaeil MAHMOUDI, “Electronic Nose Technology and its
Applications”, J. Sensors & Transducers, vol 107, no. 8, pp. 17-25,
Aug 2009.
Francesco Masulli, Matteo Pardo, Giorgio Sberveglieri, and Giorgio
Valentini, “Boosting and classification of electronic nose data”,
Proceedings of the Third International Workshop on Multiple
Classifier Systems , MCS 2002 , Pages 262-271.
Gardner, J.; Bartlett, P.N., “Electronic Nose. Principles and
Applications”, Oxford University Press: Oxford, UK, 1999.
Diana Hodgins, Derek Simmonds, “Electronic Nose and its
applications to the manufacture of food products”, J. Automat Chem
, vol 17, no.5, pp. 179-185, 1995.
http://www.ijettjournal.org
Page 14
National Conference on Engineering Trends in Medical Science – NCETMS - 2014
5.
6.
7.
8.
9.
10.
11.
12.
13.
K.C. Persaud, P. Wareham, A.M. Pisanelli, E. Scorsone, “Electronic
nose a new monitoring device for environmental applications”, J.
Chemical Senses vol.30, no 1, pp. 252-253, 2005.
R.E. Baby, M. Cabezas, E.N. Walsoe de Reca, “Electronic nose: a
useful tool for monitoring environmental contamination”, Sensors
and Actuators B, vol 69, no.3, pp. 214-218, Oct 2000.
J.W. Gardner, H.W. Shin, E.L. Hines, “An electronic nose system to
diagnose illness”, Sens. Actuators B, vol 70, no. 1-3, pp. 19-24, Nov
2000.
J. Yinon, “Detection of explosive by electronic noses”, Anal. Chem.,
vol 75, no.5, pp. 98A-105A, Mar 2003.
T. Borjesson, T. Eklov, A. Jonsson, H. Sundgren, J. Schnurer,
“Electronic Nose for odour classification of grains”, Cereal Chem.,
vol 73, no. 4, pp. 457-461, 1996.
D. James, S.M. Scott, Z. Ali, W.T. O’Hare, “Chemical sensors for
electronic nose systems”, Microchim. Acta , vol 149, pp. 1–17, 2005.
E.L. Hines, E. Llobet, J.W., Gardner, “Electronic noses: a review of
signal processing techniques”, IEE Proc., Circuit Device Syst.,
vol.146, no. 6, pp. 297–310, Dec.1999.
R. Gutierrez-Osuna, “Pattern analysis for machine olfaction: a
review”, IEEE Sensors Journal, vol 2, no. 3, pp. 189–202, 2002.
A.K. Srivastava, “Detection of volatile organic compounds using
26.
27.
28.
29.
samples using an electronic nose”, IEEE Trans. Biomedical
Engineering, vol. 57, no. 12, pp. 2884 – 2890, 2010.
Fructuoso Ma. L.L. , Llobet E. , Vilanova X. , Recasens I. , Orts J. ,
Saiz G. , Correig X. , “ Evaluation of electronic nose to assess fruit
ripeness”, IEEE Sensors Journal,Vol 5, no. 1, pp. 97-108, Feb.
2005.
Keller P., “Electronic noses and their applications”, IEEE
Northcon/Technical Applications Conference (TAC’95) ,
Sberveglieri G., “Coffee analysis with an electronic nose”, IEEE
Transactions on Instrumentation and Measurement, vol. 51, Issue 6,
pp. 1334-1339, Dec 2006,
Bandyopadhyay R., Bhuyan M., Tudu B. , Ghosh D., Jana A.,
“Electronic nose for black tea classification and Correlation of
measurement with ‘Tea Taster’ marks”, IEEE Transactions on
Instrumentation and Measurement, Vol 57, no.7, pp.1334-1339, July
2008.
Sn
gas-sensor array and artificial neural network”, Sens.
Actuators B, vol. 96, no. 1-2, pp. 24-37, 2003.
14. Ritaban Dutta, and Ritabrata Dutta, “Intelligent Bayes Classifier for
ENT infection classification in hospital environment”, Biomedical
Engineering Online, Volume 5.
< http://WWW.biomedicalengineering-online.com/content/5/1/65>
15. S. Ampuero, J.O. Bosset, “The electronic nose applied to dairy
products: a review”, Sens. Actuators B, vol. 94, pp. 1-12, 2003.
16. Simona Benedetti, Saverio Mannino, Anna Gloria Sabatini, Gian
Luigi Marcazzan,“Electronic nose and neural network use for the
17.
18.
19.
20.
21.
22.
23.
24.
25.
classification of honey”, Apidologie, Vol. 35, No. 4, pp. 397-402,
2004.
Huichun Yu, JunWang, “Discriminationof LongJinggreen-tea
gradeby electronic nose”, Sensors and Actuators B, vol 122, pp.134140, 2007.
Jun Fu, Guang Li, Yuqi Qin, Walter J. Freeman, “A pattern
recognition method for electronic noses based on an olfactory neural
network”, Sens. Actuators, B, vol 125, no. 2, pp. 489-497, 2007.
Federica Cheli, Anna Campagnoli, Luciano Pinotti, Giovanni
Savoini, Vittorio Dell’Orto, “Electronic nose for determination of
aflatoxins in maize”, Biotechnol. Agron. Soc. Environ, vol.13, pp. 3943, 2009.
J. Brezmes, E. Llobet, X. Vilanova, G. Saiz, X. Correig, “Fruit
ripeness monitoring using an Electronic Nose”, Sens. Actuators B,
vol 69, no. 3, pp. 223-229, 2000.
W.A. Collier, D.B. Baird, Z.A. Park-Ng, N. More, A.L. Hart,
“Discrimination among milks and cultured dairy products using
screen-printed electrochemical arrays and an electronic nose”,
Sens. Actuators B, vol. 92, no. 1-2, pp. 232-239, 2003.
S.Capone, M. Epifani, F. Quaranta, P. Siciliano, A. Taurino, L.
Vasanelli, “Monitoring of rancidity of milk by means of an electronic
nose and a dynamic PCA analysis,” Sens. Actuators , B, vol 78, no.
1-3, pp. 174-179, 2001.
Graham E. Searle, Julian W. Gardner, “System Identification of
Electronic Nose Data From Cyanobacteria Experiments”, IEEE
Sensors Journal, Vol 2, Issue 3, , pp. 218-229, June 2002.
Vassilis S. Kodogiannis, John N. Lygouras, Andrzej Tarczynski, and
Hardial S. Chowdrey, “Artificial odor discrimination system using
electronic nose and neural networks for the identification of urinary
tract infection”, IEEE Trans. Information Technology in
Biomedicine, vol 12, no. 6, pp. 707-713, Nov. 2008.
Marco Trincavelli, Silvia Coradeschi, Amy Loutfi, Bo S oderquist,
and Per Thunberg, “Direct identification of bacteria in blood culture
ISSN: 2231-5381
http://www.ijettjournal.org
Page 15
National Conference on Engineering Trends in Medical Science – NCETMS - 2014
Short Term Hydrothermal Scheduling Using Fuzzy
Decision Making Technique
Anubhav Ranjan Tiwari1, Gaddam Aditya2
12
M-Tech Scholar, Electrical Engg. , Lovely Professional University, India
Abstract—There are so many techniques for solving the
hydro thermal scheduling problem, and many researchers
have done so many work regarding hydrothermal scheduling
by using different techniques like particle swarm
optimization, fuzzy decision making technique, and newton
raphson method for solving hydrothermal scheduling
problem. Hydrothermal scheduling can be done in three basis,
for long term medium term and short term basis. But here in
this paper short-term fixed head hydrothermal scheduling
using fuzzy decision making technique is used for solving the
hydrothermal problem and for minimizing the total cost, and
for minimizing the gaseous pollutants like SO2, NO2,CO2
emissions. In order to get the minimum overall production
cost.
Key words—Hydrothermal scheduling, fuzzy decision.
range problem. The validity of time period for long range problem
is ranges from 1 year to several years and for short range problem
hour by hour scheduling is required. Since the time period for the
short range is small, so the water inflows and loads are considered
fully known with complete certainty.
II ECONOMIC LOAD DISPATCH PROBLEM
In the objective problem formulation two important in
an electrical thermal power system are considered. These are
economy and environmental impact because of so2 & co2
emissions. The optimization problem is defined as:
Minimize F1=∑
aip2gi+bipgi+ci) Rs/hr
Minimize F2 = ∑
d1ip2gi+e1ipgi+f1i) Kg/h
MinimizeF3 = ∑
d2ip2gi+e2ipgi+f2i) Kg/h
I INTRODUCTION
In a modern power system there may be several conventional
hydro plants which is connected to various load centres via a
lossy transmission network with negligible incremental cost
involved in hydro generation. The main problem is to minimize
the operating cost of the hydro thermal system so as to minimize
the fuel cost of the thermal plant under the constraint of water
available for the hydro generation for a specified time, then we
can achieve the hydro thermal scheduling in a planned way [2].
Many approaches and methods have been proposed to solve the
hydro thermal scheduling problem, hydro thermal scheduling of
power system with stochastic inflow , with Newton rap son
method , with particle swarm optimization technique and with the
use of modular and software method for solving the hydrothermal
optimization problem etc. [3-5].
The basic aim of hydro thermal scheduling is to
minimize the generation cost of the power system however to
meet environmental regulations enforced in current years.
Emission control has turn into one of the important operational
aim in thermal power generation there are so many gaseous
pollutants like SO2, CO2, NO2from thermal generating plants. In
scheduling of hydro thermal power plant the main concern is to
minimize these gaseous pollutants as well as cost and losses but
here we reducing only the emissions of oxides of carbons and
oxides of sulphur.
In hydrothermal co-ordination our main concern is to
minimize the overall cost of the operating system and to reduce
the losses as well as gaseous pollutants subject to the operating
constraint of hydro and thermal plants, over the optimization
interval. The integrated operation of hydro thermal system is
divided into two separate problems, long range problem and short
ISSN: 2231-5381
Minimize F4 = ∑
Subject to
d3ip2gi+e3ipgi+f3i) Kg/h
∑
pgi – (PD + PL) = 0
Pgimin ≤ Pgi ≤ Pgimax
(i = 1,2,…..,NG)
Where
NG is the number of total generators
ai, bi, ci are the cost coefficient
d1i, e1i and f1i are so2 emission coefficients
d2i, e2i and f2i are co2 emission coefficients
PD is the power demand
PL is the transmission losses, which are approximated in terms of
B-coefficients
III DECISION MAKING
“Consider the imprecise nature of the decision maker’s judgment,
it is natural to assume that the decision maker may have fuzzy or
imprecise goals for each objective function. We can define the
fuzzy sets by the equation which is known as membership
function. These functions shows the degree of membership in
some fuzzy sets using values from 0 to 1”. [16]. “The membership
http://www.ijettjournal.org
Page 16
National Conference on Engineering Trends in Medical Science – NCETMS - 2014
value 0 shows incompatibility with the sets, while 1 means
complete compatibility. By taking description of the minimum
and maximum values of each objective function together with the
rate of increase of satisfaction, the decision maker must detect
membership function µ(Fi) in a subjective manner. Here it is
assumed that µ(Fi) is
strictly monotonic decreasing and
continuous function” defined as:
By taking the partial derivative of the augmented objective
function with respect to the decision variable.
=∑
{
the value of membership function shows that how far in the scale
from 0-1 a non-inferior solution is satisfying the Fi objective. The
some of all the membership function values µ(Fi) (i= 1,2,3,….m)
for all the objectives can be find out in order to measure the
accomplishment of each non-dominated solution can be rated
with respect to all the k non-dominated solutions by normalizing
its accomplishment over the sum of accomplishment of k nondominated solutions as follows:
∑
)
∑
–1)=0
PD +PL – ∑
gi =
0
Where,
= 2ai Pgi +bi
(i=1,2,……..,m)
µkD = ∑
+λ(
( i= 1,2,………,NG)
=
)
k
= 2dkiPgi + eki
= Bi0 + ∑
(k= 1,2,3)
Bij Pgj
These equations are obviously nonlinear.
We use classical method to solve these equations and to find a
solution with a appropriate initial guess formerly the water
constrained & LaGrange multiplier is obtained, the generation of
thermal and hydro unit can be determined.
)
V CONCLUSION
thefunction µD can be used as a membership function for nondominated solutions, in a fuzzy set and expressed as fuzzy
fundamental priority ranking of the non-dominated solutions. the
solutions that attains the maximum membership µkD, in the fuzzy
set so obtained can be chosen as the ’best’ solution or the one
having cardinal priority ranking.
IV ALGORITHM
F1(Pg), F2(Pg) are the objective functions to be minimized over the
set of admissible decision vector P. To generate the non-inferior
solution to the specified intent problem, we use a weighting
method. In this weighting method we convert the problem into a
scalar optimization as given below
Minimize
∑
Subject to
∑
Pgimin ≤ Pgi ≤ Pgi max
∑
k
k Fk (Pgi)
gi –
(PD + PL) = 0
(i = 1,2,…..,NG)
REFERENCES
= 1 (wk ≥ 0)
Where
This approach yields meaningful result to the decision
maker when solved many times for different values of wk
(k=1,2,…M). weighting factors wk are determined based on the
relative importance of various objectives, which may vary from
place to place and utility to utility. The constrained scalar
optimization problem is converted into unconstrained scalar
optimization problem. Each constrained equation as associated
with an multiplier function known as lagrange multiplier. The
desired objective function is
L=∑
k Fk +
The uncertainties present in water inflows, system load demand,
operating cost equation coefficient and NOx emission coefficients
affects the short term hydrothermal schedule. The generation
schedule based upon deterministic cost function result in the
lowest expected overall cost. The proposed method provide the
means to consider
1) The inaccuracies and uncertainties in the hydrothermal
schedule.
2) Allowed explicit trade-off between overall operating cost, NOx
emission and risk level with the weightage given and
3) And provide the decision maker with the best solution from the
non-inferior solution with the help of fuzzy set theory. In this
paper also we are using a fuzzy decision making technique in
order to get the overall minimum production cost of the entire
hydrothermal system. And also for the minimization of gaseous
pollutants like NOx emission, SO2 & CO2 emissions.
λ (PD + PL – ∑
ISSN: 2231-5381
gi )
[1] D.P Kothari . J.S Dhillan ―optimal hydro thermal scheduling‖
power system optimization pg-249
[2] J.S Dhillan , S.C Parti, D.P Kothari ―fuzzy decision making
in multi objective long-term scheduling of hydro thermal system‖
19 april 2000.
[3] S.D kavatza, G.C Contexis , ―hydro thermal scheduling of
power system with stochastic inflows‖ department of EE, national
technical university of Athens, Greece.
[4] M.M. salama, M.M. elgazar et al ―optimal generation
scheduling of multi chain hydro thermal system using constriction
factor based particle swarm optimization technique‖ international
journal of scientific and research publication, vol-3 , issue4,
april2013.
[5] S.D.Kavatza, G.C.Contaxis hydrothermal scheduling of power
system with stochastic inflows.ieee.
http://www.ijettjournal.org
Page 17
National Conference on Engineering Trends in Medical Science – NCETMS - 2014
[6] G. da Cruz Jr, S. Soares (may-1996), non uniform composite
representation of hydroelectric system for long term hydrothermal
scheduling.IEEE.
[7] Md. Sayeed Salam, Khalid Mohamed Nor, Abdul Razak
Hamdan (feb-1998), hydrothermal scheduling based lagrangian
relaxation approach to hydrothermal Coordination, vol-13, no.1,
IEEE.
[8] T.D.H. Cau and R.J. Kaye (march- 2002), evolutionary
optimisation method for multistorage hydrothermal scheduling,
vol-149, no. 2.
[9] Wilfredo S. Sifuentes, Alberto Vargas,(august-2007),
Hydrothermal Scheduling Using Benders Decomposition:
Accelerating Techniques , vol-22 no.3
[10] V.R. Sherkat, K. Moslehi, E.O. Lo, G. Sanchez, J. Diaz,
moduiar and flexible soltbare for medium- and short-term ikdrotherw&scheduling, vol. 3, no. 2,ieee.
[11] A.A.F.M. Carneiro, S. Soares, P.S. Bond, a large scale
application of an optimal deterministic hydrothermal scheduling
algorithm, vol-5, no. 1, IEEE
[12] Tiago Norbiato dos Santos and Andre Luiz Diniz(AUG2009), A New Multiperiod Stage Definition for the Multistage
Benders Decomposition Approach Applied to Hydrothermal
Scheduling, VOL. 24, NO. 3, [13] Xaiomin Bai, S.M.
Shahidehpour (MAY-1996), hydro-thermal scheduling by tabu
search and decomposition method, vol-11, no. 2,ieee. 22
ISSN: 2231-5381
[14] Chandrasekar Samudi, S.M. Shahidehpour, hydro-thermal
scheduling by tabu search and decomposition method, vol-11, no.
2, ieee.
[15] A. Farhat, M. E. El-Hawary, Short-Term Hydro-Thermal
Scheduling Using an Improved Bacterial Foraging Algorithm,
IEEE.
[16] Momoh JA, Ma XW, Tomsovik K, Overview and literature
survey of fuzzy set theory in power system, IEEE Trans Power
system 1955 vol 10 no.3
[17] D.P Kothari, J.S Dhillon second edition ―power system
optimization.
[18]www.brighthub.com/environment/renewableenergy/articles/7826.aspx
[19] S.P.Umayal and N.Kamaraj(December 2005), Stochastic
Multi Objective Short Term Hydrothermal Scheduling Using
Particle Swarm Optimization ,IEEE Indicon 2005 conference.
[20] G. Zayaraz et. al( 2009), Evaluation of Software
Architectures using Multi-criteria Fuzzy Decision Making
Technique, IEEE.
[21] Yinghai Li et. al. A Modified Shuffled Frog Leaping
Algorithm and Its Application to Short-term Hydrothermal
Scheduling, 2011 Seventh International Conference on Natural
Computation
http://www.ijettjournal.org
Page 18
National Conference on Engineering Trends in Medical Science – NCETMS - 2014
Artificial Intelligence and Learning Computers
Ashwini s. Raghamwar#1, Payal s. Raghamwar*2, Tejaswini m. Chaudhari#3
#1,*2,#3
Student of Computer Science & Engineering , Jawaharlal Darda College Of Engg & Tech. Yavataml , S.G.B.A.U ,
Amravati,Maharashtra,India
Abstract— The term artificial intelligence is used to describe a
property of machines or programs: the intelligence that the system
demonstrates. Among the traits that researchers hope machines
will exhibit are reasoning, knowledge, planning, learning,
communication, perception and the ability to move and
manipulate objects. Constructing robots that perform intelligent
tasks has always been a highly motivating factor for the science
and technology of information processing. Unlike philosophy and
psychology, which are also concerned with intelligence, AI
strives to build intelligent entities such as robots as well as
understand them. Although no one can predict the future in detail,
it is clear that computers with human-level intelligence (or better)
would have a huge impact on our everyday lives and on the future
course of civilization Neural Networks have been proposed as an
alternative to Symbolic Artificial Intelligence in constructing
intelligent systems. They are motivated by computation in the
brain. Small Threshold computing elements when put
togetherproduce powerful information processing machines. In
this paper, we put forth the foundational ideas in artificial
intelligence and important concepts in Search Techniques,
Knowledge Representation, Language Understanding, Machine
Learning, Neural Computing and such other disciplines.
V. INTRODUCTION
Starting from a modest but an over ambitious
effort in the late 50’s, AI has grown through its
share of joys, disappointments and selfrealizations. AI deals in science, which deals
with creation of machines, which can think like
humans and behave rationally. AI has a goal to
automate every machine.
AI is a very vast field, which spans:
Many application domains like Language
Processing, Image Processing, Resource
Scheduling, Prediction, Diagnosis etc.
Many types of technologies like Heuristic
Search, Neural Networks, and Fuzzy Logic
etc.
Perspectives like solving complex problems
and
understanding
human
cognitive
processes.
Disciplines like Computer Science, Statistics,
Psychology, etc.
ISSN: 2231-5381
DEFINITION OF INTELLIGENCE & TURING TEST
The Turing Test, proposed by Alan Turing (1950), was
designed to provide a satisfactory definition of intelligence.
Turing defined intelligent behavior as the ability to achieve
human-level performance in all cognitive tasks, sufficient
to fool an interrogator. Roughly speaking, the test he
proposed is that the computer should be interrogated by a
human via a teletype, and passes the test if the interrogator
cannot tell if there is a computer or a human at the other
end. His theorem (the Church-Turing thesis) states that
“Any effective procedure (or algorithm) can be
implemented through a Turing machine. “ Turing machines
are abstract mathematical entities that are composed of a
tape, a read-write head, and a finite-state machine. The
head can either read or write symbols onto the tape,
basically an input-output device. The head can change its
position, by either moving left or right. The finite state
machine is a memory/central processor that keeps track of
which of finitely many states it is currently in. By knowing
which state it is currently in, the finite state machine can
determine which state to change to next, what symbol to
write onto the tape, and which direction the head should
move.
DEFINITION OF INTELLIGENCE & TURING TEST
The Turing Test, proposed by Alan Turing (1950), was
designed to provide a satisfactory definition of intelligence.
Turing defined intelligent behavior as the ability to achieve
human-level performance in all cognitive tasks, sufficient
to fool an interrogator. Roughly speaking, the test he
proposed is that the computer should be interrogated by a
human via a teletype, and passes the test if the interrogator
cannot tell if there is a computer or a human at the other
end. His theorem (the Church-Turing thesis) states that
“Any effective procedure (or algorithm) can be
implemented through a Turing machine. “ Turing machines
are abstract mathematical entities that are composed of a
tape, a read-write head, and a finite-state machine. The
head can either read or write symbols onto the tape,
basically an input-output device. The head can change its
position, by either moving left or right. The finite state
machine is a memory/central processor that keeps track of
which of finitely many states it is currently in. By knowing
which state it is currently in, the finite state machine can
determine which state to change to next, what symbol to
http://www.ijettjournal.org
Page 19
National Conference on Engineering Trends in Medical Science – NCETMS - 2014
write onto the tape, and which direction the head should
move.
Areas of Artificial Intelligence
INDUCTION: Induction is a process where in , after
studying certain facts , we reach to a conclusion.
E.g.: Socrates is a man; all men are mortal; therefore
Socrates is mortal.
ABDUCTION: ‘P’ implies ‘Q’, but ‘Q’ may not always
depend on ‘P’.
E.g.: If it rains , we can’t go for a picnic.
The fact that we are not in a position to go for a picnic does
not mean that it is training. There can be other reasons as
well.
Knowledge Representation
Learning
Importance of knowledge representation was realized
during machine translation effort in early 1950’s.
Dictionary look up and word replacement was a tedious
job. There was ambiguity and ellipsis problem i.e. many
words have different meanings. Therefore having a
dictionary used for translation was not enough.
The most important requirement for an AI system is that it
should learn from its mistakes. The best way of teaching an
AI system is by training & testing. Training involves
teaching of basic principles involved in doing a job.
Testing process is the real test of the knowledge acquired
by the system wherein we give certain examples & test the
intelligence of the system. Examples can be positive or
negative. Negative examples are those which are ‘near
miss’ of the positive examples.
Requirement of an Artificial Intelligence system
No AI system can be called intelligent unless it learns &
reasons like a human. Reasoning derives new information
from given ones.
One of the major challenges in this field is that a word can
have more than one meaning and this can result in
ambiguity.
Natural Language Processing (NLP)
E.g.: Consider the following sentence
Spirit is strong but flesh is weak.
When an AI system was made to convert this sentence into
Russian & then back to English, following output was
observed.
Wine is strong but meat is rotten.
Thus we come across two main obstacles. First, it is not
easy to take informal knowledge and state it in the formal
terms required by logical notation, particularly when the
knowledge is less than 100% certain. Second, there is a big
difference between being able to solve a problem “in
principle” and doing so in practice.
Even problems with just a few dozen facts can exhaust the
computational resources of any computer unless it has
some guidance as to which reasoning steps to try first.
A problem may or may not have a solution. This is why
debugging is one of the most challenging jobs faced by
programmers today. As the rule goes, it is impossible to
create a program which can predict whether a given
program is going to terminate ultimately or not.
NLP can be defined as:
Application Spectrum of NLP
Reasoning
It is to use the stored information to answer questions and
to draw new conclusions. Reasoning means, drawing of
conclusion from observations.
Reasoning in AI systems work on three principles namely:
DEDUCTION: Given 2 events ‘P’ & ‘Q’, if ‘P’ is true then
‘Q’ is also true.
E.g.: If it rains, we can’t go for a picnic.
ISSN: 2231-5381
language on the computer. I.e. making the
computer understand the language a normal
human being speaks.
It deals with under structured / semi structured
data formats and converting them into complete
understandable data form. The reasons to process
natural language are; Generally - because it is
exciting and interesting, Commercially – because
of sheer volume of data available online,
Technically – because it eases out ComputerHuman interaction.
It provides writing and translational aids.
Helps humans to generate Natural Language with
proper spelling, grammar, style etc.
It allows text mining i.e. information retrieval,
search engines text categorization, information
extraction.
NL interface to database, web software system,
and question answer explanation in an expert
system.
Hurdles
There are various hurdles in the field of NLP, especially
speech processing which result in increase in complexity of
http://www.ijettjournal.org
Page 20
National Conference on Engineering Trends in Medical Science – NCETMS - 2014
the system. We know that, no two people on earth can have
similar accent and pronunciations. This difference in style
of communicating results in ambiguity.
Another major problem in speech processing understands
of speech due to word boundary. This can be clearly
understood from the following example:
I got a plate. / I got up late.
Universal Networking Language
This is a part of natural language processing. The key
feature of a machine having artificial intelligence is its
ability to communicate and interact with a human. The only
means for communication and interaction is through
language. The language being used by the machine should
be understood by all humans. Example of such a language
is ENGLISH.
Vision (Visibility Based Robot Path Planning)
Consider a moving robot. There are two things, robots have
to think and perform while moving from one place to
another:
1. Avoid collision with stationary and moving objects.
2. Find the shortest distance from source to destination.
One of the major problems is to find a collision free path
amidst obstacles for a robot from its starting position to its
destination. To avoid collision two things can be done viz
1) Reduce the object to be moved to a point form. 2) Give
the obstacles some extra space. This method is called
Mikownski method of path planning.
Perceptron training convergence theorem
Whatever be the initial choice of the weights, the PTA will
eventually converge by finding the correct weight values
provided the function being trained is linearly separable.
This implies Perceptron Training Algorithm will absorb the
threshold with negative weight. Σ Wi Xi + (-1) θ ≥ 0
Conclusion
AI combined with various techniques in neural networks,
fuzzy logic and natural language processing will be able to
revolutionize the future of machines and it will transform
the mechanical devices helping humans into intelligent
rational robots having emotions.
Expert systems like Mycin can help doctors in diagnosing
patients. AI systems can also help us in making airline
enquiries and bookings using speech rather than menus.
Unmanned cars moving about in the city would be reality
with further advancements in AI systems. Also with the
advent of VLSI techniques, FPGA chips are being used in
neural networks.
The future of AI in making intelligent machines looks
incredible but some kind of spiritual understanding will
have to be inculcated into the machines so that their
decision making is governed by some principles and
boundaries.
References
Neural-networks
Neural networks are computational consisting of simple
nodes, called units or processing elements which are linked
by weighted connections. A neural network maps input to
output data in terms of its own internal connectivity. The
term neural network derives from the obvious nervous
system analogy of the human brain with processing
ISSN: 2231-5381
elements serving as neurons and connection weights
equivalent to the variable synaptic strengths. Synapses are
connections between neurons - they are not physical
connections, but miniscule gaps that allow electric signals
to jump across from neuron to neuron. Dendrites carry the
signals out to the various synapses, and the cycle repeats
1. Department of Computer Science & Engineering –
Indian Institute of Technology, Bombay
2. AI - Rich & Knight
3. Principles of AI - N J Nelson
4. Neural Systems for Robotics – Omid Omidvar
5. http://www.elsevier.nl/locate/artint
6. http://library.thinkquest.org/18242/essays.shtml
http://www.ijettjournal.org
Page 21
National Conference on Engineering Trends in Medical Science – NCETMS - 2014
Non-Invasive Device for Cardiac Diagnosis using
Nadi Shastra
Parth B. Shah#1, Siddaram Mahajan#2, A. V. Leio#3, Dr.Shaik Jameel. *4
#
*
Student, Biomedical Engineering department, VIT University.
Assistant Professor, Department of Medical Biotechnology, VIT University.
Vellore, Tamil Nadu, India.
Abstract— Analysis of pulse waveforms is very important for
diagnosis of cardiovascular functions non-invasively. Arterial
stiffness is a predictor of arteriosclerosis. Pulse Wave Velocity
(PWV) is an index parameter for arterial stiffness. PWV depends
on blood pressure at the measuring time. It is one of the
parameter for early detection of arterial sclerosis. Cardio-ankle
vascular index (CAVI) is a stiffness index and shows the artery
stiffness from the region of the aorta to the region of ankle. It is
not depending on blood pressure at the measuring time.
Arteriosclerosis contributes to the cardiovascular disease. It
shows high mortality and morbidity with respect to
Arteriosclerosis. Arterial sclerosis with the coronary is evaluated
by Coronary Angenography (CAG). Ultrasonography is also
used for analysis of coronary artery disease. As we are dealing
specially with atherosclerosis we are going to take arterial pulses
and blood pressure of normal and diseased patients. As we know
diabetic patients are more prone to get atherosclerosis we will try
to analyse them. Analysis of 3 fingers (index, middle, and ring
finger) pulse rate at different time intervals (morning , afternoon
, evening) helps us to analyse the disease and develop the device
for it which is inexpensive Polyvinylidene fluoride(PVDF) sensor
are best sensor to get readings (Blood pressure , Pulse wave
velocity).
digestion and metabolism(Pitta), whereas energy that forms
structure of the body(Kapha).These three doshas helps
todetermine individual's constitution and contribution to the
function of the body in normal condition. They contribute to
the disease process when they are out of balance. Nadipariksha is done at the root of the thumb by examining the
radial artery using three fingers. The radial pulse is usually
chosen as the site to read the Nadi (pulse) because it is most
convenient to read and is more readily available than other
pulse sites.
Keywords— Atherosclerosis, Pulse Wave Velocity (PWV), Cardio
Ankle Vascular Index (CAVI), Polyvinylidene Fluoride (PVDF)
VI. INTRODUCTION
Ayurveda is an Indian medical science which has not
received great value due to scientific recognition in modern
times. Today, the development of efficient and non-invasive
device required as an alternative to the recent medical
sciences felt especiallyto the recent sciences of health care and
research field. Currentlytraditional medical sciences are
getting new thrust to treat disease.
According to Ayurveda, diagnosis is a root to find out the
cause of a disease. The basis for the diagnosis and treatment
under Ayurveda are natural constitutions (prakruti) in terms of
the three basic principles Vata, Pitta, and Kapha. Which are
collectively called Tridosha. The method of evaluating
Tridosha is called as prakruti nidana. Space, Air, Fire, Water
and Earth, are the five basic elements in human body, the
combination of which manifest Tridosha [1]. Vata is
manifested by air and space, pitta is manifested by fire and
water and kapha is manifested by earth and water.In the
physical body, the energy of movement(Vata), the energy of
ISSN: 2231-5381
Fig. 1 Nadi- Parikshan measurement method in Ayurveda [2]
Analysis of arterial pulse waveform is important for noninvasive
diagnosis
of
cardiovascular
functions.
Arteriosclerosis is a major contributor to cardiovascular
disease, based on a high percentage of mortality and
morbidity.
Arterial stiffness is a well-known predictor of arteriosclerotic
vascular disease. It is one of the indexes of arterial stiffness
with pulse wave velocity (PWV). But, it is known that pulse
wave velocity depends on the blood pressure at measuring
time. It is one of the parameter for early detection of
atherosclerosis.Cardio-ankle vascular index (CAVI) is derived
from stiffness parameter and reflects the stiffness of the artery
from the origin of the aorta to the ankle as a whole.
Conspicuous feature is independency from the blood pressure
at measuring time.
http://www.ijettjournal.org
Page 22
National Conference on Engineering Trends in Medical Science – NCETMS - 2014
VII.
TABLE III
REFERENCE BLOOD PRESSURE RANGE
EVALUATION METHODLOGY
D. Subjects
For evaluation of cardiac disease we subjected 3 types of
subjects. They are normal, disease and diabetes subjects. As
we know diabetic subjects are more prone to get cardiac
disease. Analysis of them helps us to understand the disease
condition very well. We subjected 150 people (normal 50,
diseased 50 & diabetic 50) with different ages for analysis.
E. Chemistry of Blood
Blood is bodily fluid which transports the nutrients and
oxygen to the cells and transport metabolic waste from same
the cells. Blood contains certain amount of lipid molecules in
it for transportation process and to influence the metabolism
process. Binding of this lipid molecule to each other forms the
larger lipid molecule, which affect the flow of blood. Change
in the blood flow affects the normal metabolism of human
which results in disease. In our study we measured lipid
profile of blood that is HDL, LDL, Total cholesterol and
triglycerides value along with blood pressure. Analysis of
lipid profile helps in determination of disease condition. In
diseased and diabetic patients the lipid profile changes as
compared with normal human.
Category
Systolic
Diastolic
(mm Hg)
(mm Hg)
Normal
120
80
Prehypertension
120 – 140
80 – 90
High blood pressure 140 – 180
90 – 110
Hypertensive crisis
Higher than 110
Higher than 180
G. Pulse Measurement
Due to the pulsatile nature of blood flow, arterial blood
pressure has a characteristic waveform. The contour of this
pressure wave varies throughout the body, as well as with
increasing age and cardiovascular disease states.
TABLE I
REFERENCE LIPID PROFILE RANGE
Desirable
Borderline
High risk
(mg/dl)
(mg/dl)
(mg/dl)
Cholesterol
<200
200-239
240
Triglycerides
<150
150-199
200
HDL cholesterol
60
35-45
Below 40
LDL cholesterol
60-130
130-159
160-189
F. Blood Pressure
Fig. 2Typical arterial pressure waveforms according to age [3]
Blood pressure is the pressure of the blood in our arteries.
Every individual need certain amount of pressure in our
arteries to keep the blood flowing around your body. Systolic
blood pressureis the highest level of blood pressure which
occurs when heart contracts and blood is forced through the
arteries.Diastolic blood pressureis the lowest level of blood
pressure which occurs when heart relaxes between each
beat.Everyone’s blood pressure varies during the day. It tends
to be highest in the morning and lowest at night. Change in
the blood pressure is another parameter for early detection of
disease condition. So in our study we measured blood pressure
using sphygmomanometer in all 3 types of subjects. Normal
blood pressure 120/80mmHg.Change in blood pressure is
categorised as in Table no II.
H. Pulse Wave Velocity Measurement
ISSN: 2231-5381
Pulse Wave Velocity is an index to assess arteriosclerosis
and it is regarded as an early detector of cardiac dysfunction.
Analysis of arteriosclerosis is very important to help
prevention of cardiovascular diseases. The pressure pulse
velocity varies over the range from about 11m/sto 15m/sin
stiff peripheral arteries, where as in normal arteries it has a
velocity in the range of 8 to 9m/s.
PWV measurement is based on measurement of two pulse
waves at two different positions that is the radial artery at the
wrist and the ankle. By determining the pulse transit time
between these points & the distance measured between these
http://www.ijettjournal.org
Page 23
National Conference on Engineering Trends in Medical Science – NCETMS - 2014
two locations, pulse wave velocity may then be calculated.
The pressure pulse detection is done by using two
piezoelectric sensors which generate a measurable voltage at
the output contacts if they are mechanically deformed.The
pulse referred to here will be the pressure pulse as opposed to
the flow pulse measured by ultrasound Doppler[4].
I. Cardio Ankle Vascular Index (CAVI) Measurement
It is an arterial stiffness parameter. It has been used, as a
marker, related to arteriosclerosis including the aorta, femoral
artery and tibial artery. CAVI is independent of blood pressure
[5].Arterial stiffness occurs in patients with hypertension,
diabetes mellitus, dyslipidemias, and obesity and metabolic
syndrome, conditions or disease processes that are known to
be pathophysiologically linked with cardiovascular disease
[6]. Based on its association with cardiovascular disease, it
has beenproposed that the evaluation and monitoring of
arterial stiffness may be useful for determining cardiovascular
disease risk and for monitoring therapy [7]. Furthermore, no
special technique is required for the measurement of CAVI.
Several reports have shown the usefulness of CAVI for the
detection of atherosclerotic diseases [8].
VIII.
PRINCIPLE OF CAVI
Pulse wave velocity (PWV) from the heart to the ankle is
obtained by measuring the length from the origin of the aorta
to the ankle, and by calculating T=tb+tba. Blood pressure is
measured at the brachial artery. Ps: systolic blood pressure,
Pd: diastolic blood pressure, ΔP: Ps-Pd, ρ: blood density, ΔP:
pulse pressure, L:length from the origin of the aorta to the
ankle, T: time taken for the pulse wave to propagate from the
aortic valve to the ankle, tba: time between the rise of
thebrachial pulse wave and the rise of the ankle pulse wave,
tb: time between aortic valve closing sound and the notch of
brachial pulse wave, t’b: time between aortic valve opening
sound and the rise of the brachial pulse wave[9].
CAVI is calculated using PWV from the aortic valve
origin to the ankle region and blood pressure measured at the
upper arm (Fig. 3). The formula for CAVI uses the BramwellHill’s equation, which represents the relationship between
PWV and volume change [10] and is derived from the
stiffness parameter β first proposed by Hayashi et.al.[11].
CAVI is calculated as follows:
CAVI = a {(2ρ/ΔP) × ln(Ps/Pd) ×PWV2} + b
where ‘Ps’ is the systolic blood pressure, ‘Pd’ is the diastolic
blood pressure, ‘PWV’ is the pulse-wave velocity from the
aortic origin to the ankle region via the femoral artery, ‘ΔP’ is
Ps - Pd, ‘ρ’ is the blood viscosity, and ‘a’ and ‘b’ are constants
for converting a CAVI value to a value obtained by
Hasegawa’s method [12,13].
ISSN: 2231-5381
Fig. 3 CAVI Measurement
CAVI is calculated using PWV from the aortic valve
origin to the ankle region and blood pressure measured at the
upper arm (Fig. 3). The formula for CAVI uses the BramwellHill’s equation, which represents the relationship between
PWV and volume change [10] and is derived from the
stiffness
A. Factors that affect CAVI
Increase in CAVI is due to:
Aging, Male, Arteriosclerotic diseases Haemodialysis
patients, cerebral infarction Coronary artery disease, chronic
kidney diseases, Arteriosclerosis risks, Diabetes mellitus,
Hypertension, Dyslipidemia Metabolic syndrome, Smoking
Decrease in CAVI is due to:
Weight reduction, Glucose control insulin, Glimepiride, Blood
pressure control, ARB, CA-antagonist, Cholesterol control
Statin, EPA,and Smoking cessation.
IX.
ACQUIRED DATA
The below Table III systematically shows the acquired
data from both normal and disease patient. And followed by
it, Fig. 4, Fig.5, Fig. 6 shows the graphical representation of
acquired data.
http://www.ijettjournal.org
Page 24
National Conference on Engineering Trends in Medical Science – NCETMS - 2014
ACQUIRED DATA
TABLE IIIII
AGE
SBP
DBP
HDL
LDL
TCL
PWV
CAVI
20
148
92
41
154
225
9.6
15.64
21
122
82
47
111
117
8.8
15.38
25
129
83
81.5
72.5
134.5
5.75
6.33
26
127.33
84.66
52
91
177.66
7.266
10.09
27
133.6
83.6
56.72
99.8
179.8
7.56
10.71
28
130
84
63
112
210
7
9.30
29
131.33
85.33
54.33
130
201
6.733
8.49
30
136
86
53
108
181
7.4
10.03
31
133.33
85.33
56.33
107.06
189.33
6.966
9.02
32
142
86
54
137
219
8
11.46
33
142
88
55
133.66
193.33
7.33
9.52
34
140
88.8
53
124
198.4
7.66
10.43
35
140
88.8
45
100.8
170.2
8.78
13.70
36
132
84
42
91.33
163
9.467
16.87
37
139.5
87.5
46.75
126
201.25
8.325
12.43
38
137.33
88.66
50
96.466
180.33
8.4
12.68
39
145
91
39
137
213.5
9.75
16.40
40
143
88
54.5
125.8
204.5
7
8.65
41
134
86
60
107
180
7
9.05
42
145.5
89.5
46.75
131.15
213.25
8.4
12.24
43
135
84
46
145.9
214
9.5
16.72
44
146
90.5
46.75
162
205.25
8.775
13.27
45
136
88
48
119
208
7.8
11.03
46
146
88
42.5
13.7
180
8.6
12.91
47
158
98
36
100
153
11.2
19.97
48
129
83
40
90.5
158
9.7
18.03
49
144
86
41
142
195
8.8
13.76
50
150
93
34
125.5
209.5
11.3
21.41
51
149.33
92
34.33
129.66
209.33
10.466
18.50
55
148
94
36
103
253
10.8
19.60
56
140
94
42
120
192
9.5
15.63
57
132
84
56
82
148
6.8
8.70
58
150
94
42
134
260
9.4
14.74
59
136
88
42
99
160
9.2
15.35
ISSN: 2231-5381
Fig. 4 shows a graph between BloodPressure and Age
Fig. 5shows a graph between Total cholesterol (TCL),PWV &
CAVI
Fig. 6shows the graph between HDL, LDL,and CAVI & Age.
X. DISCUSION
Readings of 150 diseased, normal and diabetic patients are
described in the Table III,were mean value of all the
parameters of same age people is considered on the basis of
http://www.ijettjournal.org
Page 25
National Conference on Engineering Trends in Medical Science – NCETMS - 2014
the acquired readings of blood pressure, cholesterol, PWV and
CAVI is calculated. It is found from Fig.4 that with increase
in the age of diseased patient, blood pressure levels are
increasing, also the cholesterol level,i.e., the plot of HDL,
LDL v/s CAVI which is plotted in Fig.6. The Fig.5 shows that
with increase in cholesterol value, PWV is increasing and
even CAVI value is increasing. Hence, study of CAVI can be
considered as an early marker for detection of deposition of
cholesterol and a device to detect Atherosclerosis can be
designed on the basis of the CAVI.
XI. PROPOSED DEVICE
The basic input for the designed device will be pulse
detected by the PVDF pressure sensor which would be further
amplified using a precision Instrumentation amplifier by a
gain of 1000. Signal processing block would include two
major filters one of which would be a Band pass filter with
appropriate frequency range. The second filter would be a
Notch filter designed for 50Hz which is to remove the noise
due to power supply. The processed signal would then be sent
to DAQ Card. The sampling rate will be set to 1000
samples/second or 1000 Hz. The DAQ unit performs analog to
digital conversion. Therefore, the sampled data that will be
read into the LabVIEW or MATLAB will be a continuous
stream of discrete data points of double precision. This data
would be further processed in LabVIEW or MATLAB to
detect the chances of atherosclerosis by analysing the acquired
signal.
is mainly caused by development of cholesterol in
artery,smoking, diabetes, obesity. Analysis of blood
pressure,pulse wave velocity and measurement cardio-ankle
vascular index (CAVI) helps us to determine the disease at the
early stage. As we know pulse wave velocity (PWV) and
CAVI are the predictor of cardiac diseases and analysis of
them is very important to detect the disease.
ACKNOWLEDGMENT
We would like to thank VIT University to give us this
opportunity to do this project. We also would like to thank our
guide Dr.Shaik Jameel for his timely support, encouragement
and guidance to complete the project successfully and we also
thank VIT Health Care Centre for valuable data.
REFERENCES
[1]
[2]
[3]
[4]
[5]
[6]
[7]
[8]
[9]
[10]
[11]
Fig. 7 Block diagram of proposed device
[12]
XII.
CONCLUSION
[13]
Atherosclerosis is one of the major diseases which is
caused by the abnormality in arterial pulse. The abnormality
ISSN: 2231-5381
S. Upadhyaya, "NadiVijnaana" Ist Ed., Vedic Life Sciences Pvt. Ltd.,
(1986) pp47.
Online.
Available
http://2.bp.blogspot.com/_OSqu5PTyO6g/SgwhZLnTvmI/AAAAAAA
AASE/o9l9V4Nvat0/s400/pulso.jpg
A Clinical Guide: Pulse Wave Analysis(2005) [Online] Available:
http://www.atcormedical.com/users_guide.html
J McLaughlin et al 2003;Extracts from recent publications on st+d
pulse wave velocity system,Physiol. Meas. 24 693Shirai K, Song M, Suzuki J, Kurosu T, Oyama T, et al. (2011)
Contradictory effects of β1- and α1-aderenergic receptor blockers on
cardio-ankle vascular stiffness index (CAVI) - the independency of
CAVI from blood pressure. J Atheroscler Thromb 18: 49-55.
Shirai K, Utino J, Otsuka K, Takata M. A novel blood pressureindependent arterial wall stiffness parameter; cardio-ankle vascular
index (CAVI). J Atherosclerosis Thromb 2006; 13: 101– 107.
]. Kazuhiko Kotani1 and Alan T Remaley2*. Cardio-Ankle Vascular
Index (CAVI) and its Potential Clinical Implications for
Cardiovascular Disease, Kotani and Remaley, Cardiol Pharmacol 2013,
2:2
[8]. Tanaka H, Munakata M, Kawano Y, Ohishi M, Shoji T, et al.
(2009) Comparisonbetween carotid-femoral and brachial-ankle pulse
wave velocity as measuresof arterial stiffness. J Hypertens 27: 20222027.
[9]. Kotani K, Remaley AT (2013) Cardio-Ankle Vascular Index
(CAVI) andits Potential Clinical Implications for Cardiovascular
Disease. Cardiol Pharmacol 2: 108. doi:10.4172/cpo.1000108
[10]. Bramwell JC, Hill AV (1922) Velocity of the pulse wave in man.
Proc Roy SocB 93: 298-306.
[11]. Hayashi K, Handa H, Nagasawa S, Okumura A, Moritake K
(1980) Stiffnessand elastic behavior of human intracranial and
extracranial arteries. J Biomech13: 175-184.
[12].Hasegawa M (1970) Fundamental research on human aortic pulse
wavevelocity. Jikei Medical Journal 85: 742-760.
[13]. Hasegawa M, Arai C (1995) Clinical Estimation of vascular
elastic function andpractical application. Connective Tissue 27: 149157.
http://www.ijettjournal.org
Page 26
National Conference on Engineering Trends in Medical Science – NCETMS - 2014
Computer Assisted Navigation Surgery
Vaibhav Zamre#1, Mohanish Chandurkar*2
#
Studentof Biomedical engineering Departmentof AmravatiUniversity
Yavatmal, India
Abstract— Modern minimally invasive surgery has made huge
advances in both technique and technology. However, the
minimally invasive surgeon is still faced with daunting challenges
in terms of visualization and hand-eye co-ordination. We have
been developing a set of techniques for assisting surgeons in
navigating and manipulating the three-dimensional space within
the human body. Despite rapid developments in the research
areas medical imaging, medical image processing and robotics,
the use of computer assistance in surgical routine is still limited
to diagnostics, surgical planning, and interventions on mostly
rigid structures. In order to establish a computer aided workflow
from diagnosis to surgical treatment and follow-up, several
proposals for computer assisted navigation surgery interventions
have been made in recent years. By means of different pre- and
intraoperative information sources, like surgical planning’s,
intra-operative imaging, and tracking devices, surgical
navigation systems aim at supporting surgeons in localizing
anatomical targets, observing critical structures, and sparing
healthy tissue. We concentrate on approaches which can be
applied in orthopaedic surgery, ENT surgery, neurosurgery,
radiosurgery, oral and maxillofacial surgery, visceral surgery
has special needs for image guidance due to limitations in
perception.
Keywords— computeraided surgery, computer
intervention, image guided surgery,surgical navigation.
assisted
I.
INTRODUCTION
Computer assisted navigation surgery represents a surgical
concept and set of methods, that use computer technology for
pre-surgical planning, and for guiding or performing surgical
interventions. Computer assisted navigation surgery is also
known as computeraided surgery, computer assisted
intervention, image guided surgery and surgical navigation.
Computer assisted navigation surgery has been a lead in factor
for the development of robotic surgery. Navigation systems
track objects with precision expressed as root mean square
equalling even up to 0.15 mm. Application of navigation
system combined with imaging technique makes surgical
operations less invasive, which results in the reduced risk of
infection, smaller scar and a shorter time of rehabilitation.
Imaging techniques allow surgeon to create individual virtual
models for virtual surgery planning. Navigation system tracks
the positions of surgical tools in relation to the patient’s
coordinate systems. Medical imaging enables low-invasive
surgery, whereas the position of surgical instruments is
monitored on screen.
II.
OBJECTIVES
To overcome the daunting challenges in terms of
visualization and hand-eye co-ordination by
minimally invasive surgeon
To improve surgical accuracy, reliability and to allow
the surgeons to retain ultimate control of the
procedure and to avoid prolong time in the operating
room
III.
HISTORY
The first attempts in 3D mapping/navigation of human tissues
were made by V. Horsley and R. Clarke in 1906. They have
built a rectangular stereotactic headframe that had to be fixed
to the head. It was based on cartesian principles and allowed
them to accurately and reproductibly guide needle-like
electrodes for neurophysiological experiments. They have
experimented animals and were able to contribute to the
mapping of the cerebellum. Improved versions of the
Horsley–Clarke apparatus are still in used today in
experimental neurosurgery.
The first stereotactic device for humans was also developed in
neurosurgery, by E. Spiegel and H. Wycis in 1947. It was
used for surgical treatment of Parkinson's disease and, during
time, its applicability was extended for the surgical treatment
of tumors, vascular malformations, functional neurosurgery
etc. The system was based both on headframes and X-ray
images taken for all three planes of space.
Fig. 1 Stereotactic Headframes.
ISSN: 2231-5381
http://www.ijettjournal.org
Page 27
National Conference on Engineering Trends in Medical Science – NCETMS - 2014
structures, and thus allow a computer to differentiate, and
visually separate for a human, the different tissues and
structures. The image data taken from a patient will often
include intentional landmark features, in order to be able to
later realign the virtual dataset against the actual patient
during surgery. See patient registration.
2) Image Analysis And Processing:
Image analysis involves the manipulation of the patient’s 3D
model to extract relevant information from the data. Using the
differing contrast levels of the different tissues within the
imagery, as examples, a model can be changed to show just
hard structures such as bone, or view the flow of arteries and
veins through the brain.
Fig. 2Halo rings
Further development of stereotactic surgery was made by
Brown, Roberts and Wells in 1980.They have developed a
halo ring that was applied on the skull, during a CT scan and
neurosurgical interventions. This method provided improved
surgical guidance and was in fact the first development of
computer guided surgery.
Patient image registration for the head area has developed for
nearly two decades on the same principle of combining CT
scans with mechanical reference devices such as headframes
or halo rings. But the clinical experience showed that
headgear is very uncomfortable to wear and even impossible
to apply on little children, because their lack of cooperation;
furthermore, the headframes can create artifacts in
preoperative data gathering, or during surgery.
IV.
METHODOLOGY
A. General Principles
1) Creating A Virtual Image Of The Patient:
The most important component for Computer assisted
navigation surgery is the development of an accurate model of
the patient. This can be conducted through a number of
medical imaging technologies including CT, MRI, x-rays,
ultrasound plus many more. For the generation of this model,
the anatomical region to be operated has to be scanned and
uploaded into the computer system. It is possible to employ a
number of scanning methods, with the datasets combined
through data fusion techniques. The final objective is the
creation of a 3D dataset that reproduces the exact geometrical
situation of the normal and pathological tissues and structures
of that region. Of the available scanning methods, the CT is
preferred, because MRI data sets are known to have
volumetric deformations that may lead to inaccuracies. An
example data set can include the collection of data compiled
with 180 CT slices that are 1 mm apart, each having 512 by
512 pixels. The contrasts of the 3D dataset (with its tens of
millions of pixels) provide the detail of soft vs. hard tissue
ISSN: 2231-5381
3) Diagnostic, Preoperative Planning, Surgical
Simulation:
Using specialized software the gathered dataset can be
rendered as a virtual 3D model of the patient, this model can
be easily manipulated by a surgeon to provide views from any
angle and at any depth within the volume. Thus the surgeon
can better assess the case and establish a more accurate
diagnostic. Furthermore, the surgical intervention will be
planned and simulated virtually, before actual surgery takes
place. Using dedicated software, the surgical robot will be
programmed to carry out the pre-planned actions during the
actual surgical intervention.
4) Surgical Navigation:
In computer-assisted surgery, the actual intervention is
defined as surgical navigation. Using the surgical navigation
system, the surgeon will use special instruments, which are
connected to the navigation system to touch an anatomical
position on the patient. This position is simultaneously shown
in the images taken from this patient. The surgeon can thus
use the instrument to 'navigate' the images of the patient by
moving the instrument.
5) Robotic Surgery:
Robotic surgery is a term used for correlated actions of a
surgeon and a surgical robot (that has been programmed to
carry out certain actions during the preoperative planning
procedure). A surgical robot is a mechanical device (generally
looking like a robotic arm) that is computer controlled.
Robotic surgery can be divided into three types, depending on
the degree of surgeon interaction during the procedure:
supervisory-controlled, telesurgical, and shared-control. In a
supervisory-controlled system, the procedure is executed
solely by the robot, which will perform the pre-programmed
actions. A telesurgical system, also known as remote surgery,
requires the surgeon to manipulate the robotic arms during the
procedure rather than allowing the robotic arms to work from
a predetermined program. With shared-control systems, the
surgeon carries out the procedure with the use of a robot that
offers steady-hand manipulations of the instrument. In most
robots, the working mode can be chosen for each separate
http://www.ijettjournal.org
Page 28
National Conference on Engineering Trends in Medical Science – NCETMS - 2014
intervention, depending on the surgical complexity and the
particularities of the case.
V.
SYSTEMS AND METHODS
1) Navigation System:
Fig. 1 shows the configuration of the navigation system. The
system consists of an image acquisition device (CT or MRI),
optical position tracking device and main PC for data
segmentation, communication and other computational tasks.
The patient is scanned by X ray CT or MRI and 3D voxel data
is sent to the main PC through RS232C. The data is then
segmented and reconstructed as a 3D surface model. Patient to
image registration is done prior to the operation. During the
operation, the tracking device reads the positions of optical
markers on the surgical tool and sends them to the main PC
where the tool’s orientation and the position of its tip are
computed so that surgeons can know its correct position
during operation. These processes are all controlled by the 3D
Slicer module. Another module separately handles the IV
rendering so that the IV image can be updated as the surgeons
manipulate the surface model.
the IV images, we still need a normal display for other
information such as the distance to the target and the current
position and orientation of the tool. Furthermore, the spatial
resolution of the IV image is limited, and small tissues might
be properly visualized. For that reason, we built a
synchronized display system that simultaneously displays
normal and IV images.
3) Patient-Image Registration:
When the registration tool’s tip touches the bone surface, 3D
information about the surface is acquired and compared with
the 3D surface model of the bone. A registration matrix
between the two surfaces is computed using iteration closest
point (ICP) algorithm developed by Besl and Mckay after the
initial registration is done. After the transformation, the
positional relation between the bone and surgical tool will be
accurate enough so that surgeons can know the correct
position of the tool during the operation.
Patient registrationis the concept and set of methods
needed to correlate the reference position of a virtual 3D
dataset gathered by computer medical imaging with the
reference position of the patient. This procedure is crucial in
computer assisted surgery, in order to insure the
reproducitibility of the preoperative registration and the
clinical situation during surgery. The use of the term "patient
registration" out of this context can lead to confusion with the
procedure of registering a patient into the files of a medical
institution.
i.
How Patient Image Registration Is Performed?: In
computer assisted surgery, the first step is to gather a 3D
dataset that reproduces with great accuracy the geometry
of the normal and pathological tissues in the region that
has to be operated on. This is mainly obtained by using
CT or MRI scans of that region. The role of patient
registration is to obtain a close-to-ideal reference
reproducitibility of the dataset – in order to correlate the
position (offset) of the gathered dataset with the patient's
position during the surgical intervention.
Patient registration,
Eliminates the necessity of maintaining the same
strict position of the patient during both preoperative
scanning and surgery
Provides the surgical robot the necessary reference
information to act accurately on the patient, even if
he has (been) moved during the intervention
Fig. 3 System configuration.
2) Flow Of Surgery:
Prior to the operation, a 3D model to be used for navigation is
created from the CT data. Objects of interest are segmented
from the data set on the basis of the pixels’ values. Depending
on the complexity of the object interest, the segmentation can
be done automatically or semi-automatically. At this point,
surgeons can locate the target or critical tissues (vessels,
nerves) and plan the surgical path to avoid those parts. The
next task is to register the 3D model to the patient, which is
called patient-to-image registration. The most common way to
do this is to plant markers directly on the patient’s body and
perform multi-point registration. This method is effective but
planting a marker on patient increases the invasive aspect of
the surgery. Here, we shall assume that a minimally invasive
registration method is to be used. By recording a set of surface
data and comparing it with the surface model, patient-toimage registration can be done accurately and less invasively.
During the operation, images are displayed on normal and IV
displays. Although the 3D structure is properly reproduced in
ISSN: 2231-5381
4)
3d-Integral Videography
IV records and reproduces 3-D images by using a micro
convex lens array and a high-pixel-density flat display, e.g.,
an LCD display. This display is usually placed at the focal
plane of the lens array so that light rays from the
corresponding pixels will converge and form a single dot in
physical space (Fig. 3). Many types of data can be processed
to produce IV images of 3D objects. Here, we discuss the two
http://www.ijettjournal.org
Page 29
National Conference on Engineering Trends in Medical Science – NCETMS - 2014
main methods of making IV, the volume ray-casting method
and the pixel distribution method.
(a)
Fig. 4. Principle of integral videography;
Computer generated elemental images. (b) IV image spatial
formation.
The volume ray-casting method directly processes the volume
data (CT, MRI, US). It is basically an extended volume
rendering method in which a light ray must go through a
micro lens before intersecting with the screen.
The pixel distribution method constructs an IV image from a
set of multi-view images acquired by geometrically based
surface rendering. This method processes CG surface models,
and therefore, it can produce high-quality images with
manyvisual effects. In addition, peripheral devices such as
surgical tools can be visualized in the IV image as a simple
CG model. For these reasons, our system uses pixel
distribution as the primary method for rendering IV images.
VI.
APPLICATIONS
Computer assisted surgery is the beginning of a revolution in
surgery. It already makes a great difference in high precision
surgical domains, but it is also used in standard surgical
procedures.
1) Computer Assisted Orthopaedic Surgery (Caos)
The application of robotic surgery is widespread in
orthopaedics, especially in routine interventions, like total hip
replacement. It is also useful in pre-planning and guiding the
correct anatomical position of displaced bone fragments in
fractures, allowing a good fixation by osteosynthesis. Early
CAOS systems include the HipNav, OrthoPilot, and
Praxim.Computer-assisted orthopaedic surgeryis a discipline
where computer technology is applied pre-, intra- and/or postoperatively to improve the outcome of orthopedic surgical
procedures. CAOS is an active research discipline which
brings together orthopaedic practitioners with traditionally
technical disciplines, such as engineering, computer science
and robotics. The principal idea behind CAOS is that
operative outcomes will be improved through the use of
computer technology. Taking the example of joint
replacement, the task of the surgeon is to integrate the new
ISSN: 2231-5381
joint components into the patient's existing anatomy; CAOS
technologies allow the surgeon to:• Plan the component placement in advance, including
determination of the appropriate component sizes.
• Measure the intra-operative placement of the components in
real time, making sure that the plan is adhered to.
• Measure the post-operative result.
It has not yet been proved that CAOS technologies result in a
significant long-term improvement in operative outcome.
Whilst the surgeon (or even medical students in laboratory
studies) can achieve better results in terms of planned vs.
achieved placement of components, it is not clear whether the
plan has been constructed optimally.
Further, because of the functional adaptability of bone, errors
in component placement may become unimportant in the long
term. Because of the relatively short time period over which
CAOS has developed, long-term follow-up studies have not
yet been possible. With CAOS, the surgeon can more
accurately pinpoint anatomical landmarks that might be hard
to see in a small incision. This navigation system then guides
the surgeon through different bone cuts and finally to
implantation. Computer-assisted orthopaedic surgery is mostly
used in knee implant surgery because of the precision the
surgeon gets with femoral and tibial bone cuts. It is also used
to navigate acetabular components placement where correct
cup inclination is crucial. Computer-assisted orthopaedic
surgery is a system where a computer interacts with body
parts via infrared lights and gate detectors. There are systems
that require C-Arm images or CAT scans and the newest and
most evolved systems are imageless systems, this means that
no pre scans of any kind are necessary. The imageless systems
are far less complicated, are lower cost and more patient
friendly since the pre scans are not necessary. The imageless
systems will also bring down operation time. The negative
aspect of imageless systems is that they might be less
accurate.
2) 5.2 Computer Assisted Neurosurgery
Tele-manipulators have been used for the first time in
neurosurgery, in the 1980s. This allowed a greater
development in brain microsurgery, increased accuracy and
precision of the intervention. It also opened a new gate to
minimally invasive brain surgery, furthermore reducing the
risk of post-surgical morbidity by accidentally damaging
adjacent centres.
3) Computer Assisted Oral And Maxillofacial Surgery
Bone segment navigation is the modern surgical approach in
orthognathic surgery (correction of the anomalies of the jaws
and skull), in temporo-mandibular joint (TMJ) surgery, or in
the reconstruction of the mid-face and orbit. It is also used in
implantology where the available bone can be seen and the
position, angulation and depth of the implants can be
http://www.ijettjournal.org
Page 30
National Conference on Engineering Trends in Medical Science – NCETMS - 2014
simulated before the surgery. During the operation surgeon is
guided visually and by sound alerts. IGI (Image Guided
Implantology) is one of the navigation systems which use this
technology.
gestures and also reduces the redundancy of the
surgeon’s acts. This significantly improves
ergonomics in the operating theatre, decreases the
risk of surgical errors and reduces the operating time.
4) Computer Assisted Ent Surgery
Image-guided surgery and computer assisted navigation
surgery in ENT commonly consists of navigating preoperative
image data such as CT or cone beam CT to assist with
locating or avoiding anatomically important regions such as
the optical nerve or the opening to the frontal sinuses. For use
in middle-ear surgery there has been some application of
robotic surgery due to the requirement for high-precision
actions.
5) Computer Assisted Visceral Surgery
With the advent of Computer assisted surgery, great
progresses have been made in general surgery towards
minimal invasive approaches. Laparoscopy in abdominal and
gynecologic surgery is one of the beneficiaries, allowing
surgical robots to perform routine operations, like
colecystectomies, or even hysterectomies. In cardiac surgery,
shared control systems can perform mitral valve replacement
or ventricular pacing by small thoracotomies. In urology,
surgical robots contributed in laparoscopic approaches for
pyeloplasty or nephrectomy or prostatic interventions.
Radiosurgery is also incorporating advanced robotic systems.
CyberKnife is such a system that has a lightweight linear
accelerator mounted on the robotic arm. It is guided towards
tumor processes, using the skeletal structures as a reference
system (Stereotactic Radiosurgery System). During the
procedure, real time X-ray is used to accurately
position the device before delivering radiation beam.
VII.
ADVANTAGES
[1]
[2]
[3]
[4]
[5]
[6]
[7]
[10]
[11]
[12]
[13]
[14]
[15]
[16]
The surgeon can easily assess most of the surgical
difficulties and risks and have a clear idea about how
to optimize the surgical approach and decrease
surgical morbidity.
During the operation, the computer guidance
improves the geometrical accuracy of the surgical
ISSN: 2231-5381
REFERENCES
[8]
[9]
6) Computer Assisted Radiosurgery
It enhance surgeon’s capability to carry out various
“minimally invasive” surgical procedures.
Faster, easier and steadier surgery.
More accurate.
Enhanced visualisation.
Less pain to patient.
Shorter recovery time.
Shorter hospital stays.
[17]
Interactive 3D Navigation System for Image-guided Surgery.
Huy Hoang Tran1, Kiyoshi Matsumiya1, Ken Masamune1, Ichiro
Sakuma2, 3, hi1 and Hongen Liao2, 3. The International Journal of
Virtual Reality, 2009, 8(1): 9-16
Fluoroscopy-based Navigation System in Orthopaedic Surgery.
Merloz Ph (1), Troccaz J (2), Vouaillat H (1), Vasile Ch (1), Tonetti J
(1), Eid A (1),
Plaweski S (1).
Navigating Inner Space: 3-D Assistance for Minimally Invasive
Surgery.
Darius Burschka, Jason J. Corso, Maneesh Dewan, William Lau, Ming
Li, Henry Lin, Panadda Marayong, Nicholas Ramey, Gregory D. Hager
1), Brian Hoffman, David Larkin, and Christopher Hasser.2).
Navigation in Endoscopic Soft Tissue Surgery -Perspectives and
Limitations.
M. Baumhauer, M. Feuerstein, H.P. Meinzer, and J. Rassweiler.
Improving surgical precision – application of navigation system in
orthopedic surgery. Ewelina Świątek-Najwer1,*, Romuald Będziński1,
Paweł Krowicki1, Krzysztof Krysztoforski1, Peter Keppler2, Josef
Kozak3.
Acta of Bioengineering and Biomechanics Vol. 10, No. 4, 2008
Surgical wayfinding and navigation processes in the human body.
Thomas Stu¨ deli.(2009)
Media related to Computer assisted surgery at Wikimedia Commons.
Computer-assisted Surgery- http://knowcas.com
Computer-assisted Surgery: An Evolving Technology
http://www.healio.com/journals/ortho/%7B4ee571ab-8cc6-4a0d-8f60
39c0f8663f5d%7D/computer-assisted-surgery-an-evolvingtechnology?fulltext=1
Evolution of concept of Computer-assisted Surgery, History, etc
http://link.springer.com/article/10.1007%2F978-3-540686279_2/lookinside/000.png
Why Computer-assisted Surgery, applications, advantages & ethical
issues
http://www.aboutstryker.com/hip/expectations/riskscomplications.php
http://www.ijettjournal.org
Page 31
National Conference on Engineering Trends in Medical Science – NCETMS - 2014
Advanced Wireless Communication
Pravin R. Ghawghave#1, Nilesh G. Khanderao*2
#
Studentof Biomedical engineering Departmentof AmravatiUniversity
Yavatmal, India
Abstract— 4G is the next generation of wireless networks that
will totally replace 3G networks. It is supposed to provide its
customers with better speed and all IP based multimedia
services. 4G is all about an integrated, global network that will
be able to provide a comprehensive IP solution where voice, data
and streamed multimedia can be given to users on an "Anytime,
Anywhere" basis. 4G presents a solution of this problem as it is
all about seamlessly integrating the terminals, networks and
applications. Wi-Fi is a kind of new technology about wireless
broadband access. Compared with conventional wireless
technologies, it has faster speed, wider range and better security.
In this paper, the concepts and characteristics of Wi- Fi
are introduced and to highlight the benefits, challenges in
deployment and scope of 4G technologies.
Keywords—4G mobile communication, CRE, Internet telephony,
CDMA, FDMA, packet radio networks, TDMA, Ad-hoc,
Infrastructure, W- LAN, Wi-Fi, Construction of the network.
I.
INTRODUCTION
The major expectation from the fourth generation (4G) of
wireless communication networks is to be able to handle
much higher data rates which will be in the range of 1Gbits in
WLAN environment and 100Mbits in cellular networks [1]. A
user, with large range of mobility, will access the network and
will be able to seamlessly reconnect to different networks
even within the same session. The spectra
Allocation is expected to be more flexible and even flexible
spectra shearing among the different sub networks is
anticipated. In such, so called composite radio environment
(CRE), there will be need for more adaptive and
reconfigurable solutions on all layers in the network. In other
words there will be need for adaptive link, MAC [6], network
and TCP layer including cross layer optimization. This also
refers to mobility management and adaptive radio resource
management. The composite radio environment will include
presence of WLAN, cellular mobile networks, digital
audioand video broadcasting, satellite, mobile ad hoc and
Sensor networks. Within the more advanced solutions focus
will be on active networks [2],[3] including programmable
networks, [7],[8] evolution to 4G wireless networks,
programmable 4G mobile network architecture, cognitive
packet networks, the random neural networks based
algorithms, game theory models in cognitive radio networks,
cognitive radionetworks as a game and biologically inspired
networks including bionet architectures [9]. The networks
management will deal with topics such as self-organization in
4G networks, mobile agent based network management [4],
mobile agent platform, mobile agents in multi-operator
ISSN: 2231-5381
networks, integration of routing algorithm and mobile agents
and ad hoc network management. The network information
theory [10],[11] has become an important segment of the
research dealing with effective and transport capacity of
advanced cellular network, capacity of ad hoc networks,
information theory and network architectures, cooperative
transmission in wireless multi-hop ad hoc networks, network
coding, capacity of wireless networks using MIMO
technology and capacity of sensor networks with many to one
transmissions. In addition, energy efficient wireless networks
and QoS management will be also in the focus of research.
II.
4G NETWORKS AND COMPOSITE RADIO
ENVIRONMENT
In the wireless communications community we are
witnessing more and more the existence of the compositeradio
environment (CRE)and as a consequence the need for
Reconfigurability concepts. The CRE assumes that different
radio networks can be cooperating components in a
heterogeneous wireless access infrastructure, through which
network providers can more efficiently achieve the required
capacity and QoS levels. Reconfigurability enables termin als
and network elements to dynamically select and adapt to the
most appropriate radio access technologies for handling
conditions encountered in specific service area regions and
time zones of the day. Both
Concepts pose new requirements on the management
of wireless systems. Nowadays, multiplicities of radio access
technology (RAT) standards are used in wireless
communications. As shown in Fig. 1, these technologies can
be roughly categorized into four sets:
Cellular networks that include second generation
(2G) mobile systems, such as Global system for Mobile
Communications (GSM) [6], and their evolutions, often called
2.5G systems, such asenhanced digital GSM evolution
(EDGE), General Packet Radio Service (GPRS) [3] and IS
136 in US. These systems are based on TDMA technology.
Third-generation (3G) mobile networks, known as Universal
MobileTelecommunications Systems (UMTS) (WCDMA and
cdma2000) [6] are based on CDMAtechnology that
providesup to 2Mbit/s. In these networks 4G solutions are
expected to provide up to 100 Mbit/s. The solutions will be
based on combination of multicarrier (including MC CDMA)
and space time signal formats. The network architectures
include macro, micro and Pico cellular networks and home
(HAN) and personal aria networks (PAN). Short range
communications will be using ultra wid band (UWB)
communications.
http://www.ijettjournal.org
Page 32
National Conference on Engineering Trends in Medical Science – NCETMS - 2014
Broadband radio access networks (BRANs) or
wireless local area networks (WLANs), which are expected to
provide up to 1Gbit/s in 4G. These technologies are based on
OFDMA and space time coding
platforms can cooperate. The fixed (core and backbone)
network will consists of public and private segments based on
IPv4 and IPv6-based infrastructure. Mobile IP (MIP) will
enable the maintenance of IP-level connectivity regardless of
the likely changes in the underlying radio technologies used
that will be imposed by the CRE concept.
Fig. 1 Composite radio environment in 4G networks
Fig. 2 depicts the architecture of a terminal that isCapable of operating in a
CRE context.
Digital voice and video broadcasting (DVB) [5] and satellite
communications will be suing OFDMA signaling formats.Ad
hoc and sensor networks with emerging applications.
Although 4G is open for new multiple access schemes, the
CRE concept remains attractive for increasing the service
provision efficiency and the exploitation possibilities of the
available RATs. The main assumption is that the different
radionetworks, GPRS, UMTS, BRAN/WLAN, DVB, and so
on, can be components of a heterogeneous wireless access
infrastructure.
Anetwork
provider
(NP)
can
ownseveralcomponents of the CR infrastructure (in
otherwords, canown licenses for deploying and operating
different RATs), and can also cooperate with affiliated NPs.
In any case, an NP can rely on several alternate radio
networks andtechnologies, for achieving the required capacity
and quality of service (QoS) levels, in a cost-efficient manner.
Users are directed to the most appropriate radio networks and
technologies, at different service area regions and time zones
of the day, based on profile requirements and network
performance criteria. The management system in each
network manages a specific radio technology; however, the
ISSN: 2231-5381
The terminals include software and hardware components
(layer 1 and 2 functionalities) for operating with different
systems. The higher protocol layers, in accordance with their
peer entities in the network, support continuous access to IPbased applications. Different protocol boosters can further
enhance the efficiency of the protocol stack. Most
communications networks are subject to time and regional
variations in traffic demands, which lead to variations in the
degree to which the spectrum is utilized. Therefore, a
service’s radio spectrum can be underused at certain times or
geographical areas, while another service may experience a
shortage at the same time/place. Given the high economic
value placed on the radio spectrum and the importance of
spectrum efficiency, it is clear that wastage of radio spectrum
must be avoided. These issues provide the motivation for a
scheme called dynamic spectrum allocation(DSA), whichaims
to manage the spectrum utilized by a converged radio system
and share it between participating radio networks over space
and time to increase overall spectrum efficiency as shown in
Fig. 3.
http://www.ijettjournal.org
Page 33
National Conference on Engineering Trends in Medical Science – NCETMS - 2014
A protocol booster is transparent to the protocol
being boosted. Thus, the elimination of a protocol booster will
not prevent end-to-end communication, as would, for
example, the removal of one end of a conversion (e.g., TCP/IP
header compression unit [5]. In what follows we will present
examples of protocol boosters.
Fig. 3Architecture of a terminal that operates in a composite radio
environment
Composite radio systems and reconfigurability,
discussed above, are potential enablers of DSA systems.
Composite radio systems allow seamless delivery of services
through the most appropriate access network, and close
network cooperation can facilitate the sharing not only of
services, but also of spectrum. Figure3. Fixed spectrum
allocation compared to contiguous and fragmented DSA.
III.
PROTOCOL BOOSTERS
As pointed out in Fig. 2, elements of the reconfiguration
in 4G networks are protocol boosters.A protocol booster is a
software or hardware module that transparently improves
protocol performance. The booster can reside anywhere in the
network or end systems, and may operate independently (oneelement booster), or in cooperation with other protocol
boosters (multi-element booster). Protocol boosters provide an
architectural alternative to existing protocol adaptation
techniques, such as protocol conversion.
A protocol booster is a supporting agent that by itself is
not a protocol. It may add, delete, or delay protocol messages,
but never originates, terminates, or converts that protocol. A
multi-element protocol booster may define new protocol
messagesto exchange among themselves, but these protocols
are originated and terminated by protocol booster elements,
and are not visible or meaningful external to the booster .
IV.
WI-FI (WIRELESS FIDELITY)
Wireless Technology is an alternative to Wired
Technology, which is commonly used, for connecting devices
in wireless mode. Wi-Fi (Wireless Fidelity) is a generic term
that refers to the IEEE 802.11 communications standard for
Wireless Local Area Networks (WLANs).Wi-Fi Network
connects computers to each other, to the internet and to the
wired network.
The Wi-Fi was invented in 1991 by NCR
Corporation with speed 1Mb\s -2Mb\s.
Vic Hayes has been named as father of Wi-Fi.
Europe leads Wireless phone technology. U.S. Lead in Wi-Fi
systems.
A. Wi-Fi: How it works
The typical Wi-Fi setup contains one or more Access
Points (APs) and one or more cliets. An AP broadcasts its
SSID (Service Set Identifier, "Network name") via packets
that are called beacons, which are broadcast every 100 ms.
The beacons are transmitted at 1 Mbit/s, and are of relatively
short duration and therefore do not have a significant
influence on performance. Since 1 Mbit/s is the lowest rate of
Wi-Fi it assures that the client who receives the beacon can
communicate at least 1 Mbit/s. based on the settings (e.g. the
SSID), the client may decide whether to connect to an AP.
Also the firmware running on the client Wi-Fi card is of
influence. Say two APs of the same SSID are in range of the
client, the firmware may decide based on signal strength to
which of the two
APs it will connect. The Wi-Fi standard leaves
connection criteria and roaming totally open to the client. This
is strength of Wi-Fi, but also means that one wireless adapter
may perform substantially better than the other. Since Wi-Fi
transmits in the air, it has the same properties as a nonswitched ethernet network. Even collisions can therefore
appear like in non-switched ethernet LAN's. Channels Except
for 802.11a, which operates at 5 GHz, Wi-Fi uses the
spectrum near 2.4 GHz, which is standardized and unlicensed
by international agreement although the exact frequency
allocations vary slightly in different parts of the world, as does
maximum permitted power. However, channel numbers are
standardized by frequency throughout the world, so authorized
frequencies can be identified by channel numbers. The
frequencies for 802.11 b/g span 2.400 GHz to 2.487 GHz.
Each channel is 22 MHz wide and 5 MHz spacers between the
channels are required. With the required spacers, only 3
channels (1,6, and 11) can be used simultaneously without
interference.
Fig. 4 shows the information flow in a generic two element booster.
ISSN: 2231-5381
http://www.ijettjournal.org
Page 34
National Conference on Engineering Trends in Medical Science – NCETMS - 2014
B. Examples of Standard Wi-Fi Devices
1) Wireless Access Point (WAP):
A wireless access point (AP) connects a group of wireless
stations to an adjacent wired local area network (LAN). An
access point is similar to an ethernet hub, but instead of
relaying LAN data only to other LAN stations, an access point
can relay wireless data to all other compatible wireless
devices as well as to a single (usually) connected LAN device,
in most cases an ethernet hub or switch, allowing wireless
devices to communicate with any other device on the LAN.
2) Wireless Routers:
A wireless router integrates a wireless access point with an
ethernet switch and an ethernet router. The integrated switch
connects the integrated access point and the integrated
ethernet router internally, and allows for external wired
ethernet LAN devices to be connected as well as a (usually)
single WAN device such as a cable modem or DSL modem. A
wireless router advantageously allows all three devices
(mainly the access point and router) to be configured through
one central configuration utility, usually through an integrated
web server. However one disadvantage is that one may not
decouple the access point so that it may be used elsewhere.
3) Wireless Ethernet Bridge:
A wireless Ethernet bridge connects a wired network to a
wireless network. This is different pointfrom an accessin the
sense that an access point connects wirelessdevices to awired
network at the data-link layer. Two wireless bridges may be
used to connect two wired networks over a wireless link,
useful in situations where a wired connection may be
unavailable, such as between two separate homes.
4) Range Extender:
A wireless range extender (or wireless repeater) can
increase the range of an existing wireless network by being
strategically placed in locations where a wireless signal is
sufficiently strong and near by locations that have poor to no
signal strength. An example location would be at the corner of
an L shaped corridor, where the access point is at the end of
one leg and a strong signal is desired at the end of the other
leg. Another example would be 75% of the way between the
access point and the edge of its useable signal. This would
effectively increase the range by 75%.
5) Wi-Fi vs. cellular:
Some argue that Wi-Fi and related consumer technologies
hold the key to replacing cellular telephone networks such as
GSM. Some obstacles to this happening in the near future are
missing roaming and authentication features (see 802.1x, SIM
cards and RADIUS), the narrowness of the available spectrum
and the limited range of Wi-Fi. It is more likely that WiMax
will compete with other cellular phone protocols such as
GSM, UMTS or CDMA. However, Wi-Fi is ideal for VoIP
applications e.g. in a corporate LAN or SOHO environment.
ISSN: 2231-5381
Early adopters were already available in the late '90s, though
not until 2005 did the market explodes. Companies such as
Zyxel, UT Starcomm, Sony, Samsung, Hitachi and many
more are offering VoIP Wi-Fi phones for reasonable prices
MEDICAL APPLICATION OF ADVANCED WIRELESS
COMMUNICATION
A. Wi-Fi
These unlicensed technologies are commonly used with
cell phones, handheld devices and personal computers, but can
also be used for implanted or body-worn medical devices.
These devices operate in the 902-928, 2400-2483.5 and 57255850 MHz bands at distances up to a few hundred feet.
B. Patient Monitoring System
Repeated or continuous observations or measurements of
the patient, his or her physiological function, and the function
of life support equipment, for the purpose of guiding
management decisions, including when to maketherapeutic
interventions, and assessment of those interventions.
C. Army Building 4G CommunicationSystem For Wounded
Warrior Care
Medics are often faced with wounded soldiers that need
immediate attention that only a trained surgeon can help with.
Moreover, once the surgeon finally gets his hands on the
patient, knowing the background of the injury and the
subsequent medical details can dramatically speed up
initialization of proper care. Additionally, triaging multiple
injuries in the field by deciding who gets the medevac first
can be improved if doctors at the hospital have a good sense
of what the status of the wounded is.
The Army is working on a system that can manage patient
data from injury site to recovery, including providing live
audio/video communication for medics in the field. The
system relies on a number of devices and 4G cellular
networking to send vitals to and communicate with the doctor
while everything is being recorded for further review. Surely a
similar system can be translated for use for civilian care and
integrated into ambulances and clinics.
REFERENCES
[1]
[2]
[3]
[4]
Glisic S. Advanced wireless communications: 4G technology,
John Wiley & Sons, 2004, Chichester, London
Gelenbe, E.; Zhiguang Xu; Seref, E.; Cognitive packet networks
11th IEEE International Conference on Tools with Artificial
Intelligence, 9-11 Nov. 1999 Page(s):47 – 54
T. Faber, .ACC: Using Active Networking to enhance feedback
congestion control mechanisms, IEEE Network Magn., Vol. 12,
no. 3, pp. 61-65, May/June 1998.
M. Bregust, T. Magedanz, Mobile agents-enabling technology for
Active Intelligent Network implementation, IEEE Network Magn,
vol. 12, no. 3, pp. 53-60, May/June 1998.
http://www.ijettjournal.org
Page 35
National Conference on Engineering Trends in Medical Science – NCETMS - 2014
[5]
Digital Video Broadcasting (DVB), http://www.dvb.org, Jan.
2002.
[6] http://www.wiley.com/go/glisic
[7] S. Rooney, Jacobus E. van der Merwe, S. A. Crosby, I. M. Leslie,
The Tempest: a framework for safe, resource-assured,
programmable networks,. IEEE Communications, Vol. 36, No. 10,
Oct. 1998.
[8] J.-F. Huard, A. A. Lazar, A programmable transport architecture
with QoS guarantee, IEEE Communications, Vol. 36, No. 10, pp.
54-63, Oct. 1998
[9] Suzuki, J.; Suda, T.; A middleware platform for a biologically
inspired network architecture supporting autonomous and adaptive
applications, IEEE Journal on Selected Areas in Communications,
Volume 23, Issue 2, Feb. 2005 Page(s):249 – 260
[10] P.Gupta, and P. R. Kumar- The Capacity of Wireless Networks IEEE Transactions On Information Theory, Vol. 46, No. 2, March
2000 , pp.388-404
[11] L. -L. Xie, and P. R. Kumar - A Network Information Theory for
Wireless Communication: Scaling Laws and Optimal Operation IEEE Transactions On Information Theory, Vol. 50, No. 5, May
2004, pp. 748-767
ISSN: 2231-5381
http://www.ijettjournal.org
Page 36
National Conference on Engineering Trends in Medical Science – NCETMS - 2014
System with Real Time Clock PWM Based
Power Line Variation.
Umeshpande#1, Shivani Bhutada#2
Dr. Bhausaheb Nandurkar College of Engineering & Technology
Waghapur, Yavatmal – 445001
Abstract:
Now a days we facing very critical situation for electricity
in form of load shading therefore we must need to save
power as much as possible but the question is how to do it
without changing the daily needs the answer is use as much
energy as we need for the situation.
Like nearly all dimmer circuits, the project describe here
relies on phase angle control of the alternating voltage
applied to the lamp. The process not only improves the life
expectancy of the lamp, but also prevents unnecessary
electromagnetic pollution in the direct vicinity of the
dimmer. To be able to dim a lamp using phase angle
control, it is necessary from the circuit to detect when the
instantaneous level of the mains voltage equals zero volts.
Wastage of power is not desirable in any system. So it is
very much economic to have this arrangement so that
power is not wastage during day time where manual
operation possible.
Key words: AVR micro controller, Graphic LCD, RTC,
Regulator IC 7805, ZCD IC MOC3021.
Introduction:
Now a day we are facing very critical situation for
electricity in the form of load shading we observe
that supply of electricity is not sufficient to satisfy the
growing demand. In small town, there is load shading
for 2 – 3 hours. But in rural areas situation more
critical. People in villages face load shading for at
least 8 – 9 hours. Another 10 – 15 years will be
required to generate enough power to match the
demand of electricity.
So the only option we are left with is to save the
power we are going to save the power by varying the
intensity of light. So by implementing this process we
can save a large amount of power and hence problem
like load shading which is becoming critical day by
day can be solved.
Objective:
To make an innovative project this can save
maximum amount of power.
To make a system that can control devices
automatically.
To over the limitations of LDR and
temperature sensors.
ISSN: 2231-5381
To built a system which can be easily
handled.
To develop a smart project this can control
intensity with respect to time.
Background study:
In country such as France, Germany, Belgium, UK
and northern part of the US, street lights are burning
and average of 4000 hours per year. Considering that
the average wattage of the lamp is around 50 watts,
considering that a 100000 inhabitant city contains
about 18000 lamps such a city spend around 11 Giga
watt hours. Considering that producing 1 kWh
implies the emission of 340 grams of CO2, [1] the
street lights of such a city are responsible for the
emission of 3700 tons of CO2 in the atmosphere per
year.
Technologies and techniques now exist to:
Save electricity with outing impacting the
lighting level perceived by citizen.
Automatically identify 99% of lamp and
blast failure, saving on maintenance cost and
increasing security.
Block diagram and working:
The block diagram comprises of power supply, an
AVR micro controller which is the heart of the
circuit; it control the operation of all the blocks, a
zero cross detector, Triac, LCD, Real Time Clock, an
http://www.ijettjournal.org
Page 37
National Conference on Engineering Trends in Medical Science – NCETMS - 2014
emergency light. A 230 volt 50 Hz power supply is
connected to blocks.
A 230 volt power supply is converted into 5 volt DC
supply which is used for supplying the micro
controller. The conversion is done with the help of a
step down transformer which brings down the 230
volts to 12 volt [2]. Now to convert this 12 volt AC
into DC, we are using a rectifier circuit; further a
capacitor is used to remove ripples. Now a constant 5
volt DC supply is obtained using regulator IC.
The power supply is connected to the ZCD (zero
crossing detectors) as shown in the block diagram. It
is a circuit that detects the zero cross of the input AC
supply. The micro controller is
Connected to the zero crossing detector, the micro
controller, with the help of ZCD generates PWM
(pulse width modulation), which is used for varying
the intensity [3].
The micro controller is also connected to a real time
clock and a LCD. The function of real time clock is
to obtain real time. The LCD connected which shows
different modes. The modes comprises of different
intensity at different time as shown in the table
below:
Modes
1
2
3
4
Time
6 pm to
pm
9 pm to
am
1 am to
am
4 am to
am
9
Intensity
80 %
1
100%
4
60%
6
30%
greater flexibility as different modes are set for
different time period. As per the requirement modes
can be adjusted. Whole project is automatic so, no
supervision is required. AC power is controlled
successfully. In case of power failure, RTC takes care
of time and corresponding modes. So this project is
efficient and , cheap and maintenance free.
References:
[1] Hirak Patangia, Sri Nikhil Gupta Gourisetti, “Real Time
Harmonic elimination using a modified carrier,” CONIELECOMP,
Mexico, Feb 2012.
[2] Linear Electronics Circuit by Ramakant Gaikawad, page – 21.
[3] Communication Engineering by Davis Kennedy page – 104.
Future Scope:
This project is helpful in bringing down load shading,
and if further progresses are made in the project, it
can be used for automation in industries.
Software code can be made more efficient by
including the condition for cloudy atmosphere and
situation in which brightness drop down during day
time.
Manual setting of modes will not be required if code
for varying day and night lengths during season
change is included in software code.
This project can be implemented by using GSM
module and modes can be set by sending SMS
through cellular phone.
Conclusion:
This project is very efficient in saving power. Use of
Triac results in fast switching. This project has
ISSN: 2231-5381
http://www.ijettjournal.org
Page 38
National Conference on Engineering Trends in Medical Science – NCETMS - 2014
Wheelchairs for the Handicapped Based On
Artificial Intelligence
Nikhil S. Bodhale#1, Pankaj M. Ingle*2
#1&*2
Student of Mechanical Engineering, Dr. Bhausaheb Nandurkar College of Engineering and Technology, Amravati
University, Yavatmal, India.
Abstract— A brief survey of research in the development of the behaviour-based approach. In our experience the
autonomy in wheelchairs is presented and to build a series of behaviour-based approach allows developers to generate robot
motions which are more appropriate for use in assistive
intelligent autonomous wheelchairs is discussed. A standardized
autonomy management system that can be installed on readily technology than traditional Cartesian intelligent robotic
available power chairs which havebeenwell-engineered over the approaches. In Cartesian robotics, on which most
years has been developed and tested. A behaviour-based conventional approaches to intelligent robotics are based,
approach wasused to establish sufficient on-board autonomy at "recognition" of the environment, followed by planning for
minimal cost and material usage, while achievinghigh efficiency,
the generation of motion sequence and calculation of
sufficient safety, transparency in appearance, and extendability.
So far, the add-onsystem has been installed and tried on two kinematics and dynamics for each planned motion, occupy the
centre of boththeoretical interest and practice. By adopting a
common power wheelchair models.
behaviour-based approach wheelchairs can be built which can
operate daily in complex real-world environments with
Keywords— Wheelchairs, Handicapped chairs, handy cycles.
increased performance inefficiency, safety, and flexibility, and
I.
INTRODUCTION
greatly reduced computational requirements. In addition,
Improving life style of the physically challenged people improvements in the robustness and graceful degradation
to a great extent. In recent times there have been a wide range characteristics are expected from this approach. The system
of assistive and guidance systems available in Wheelchair to looks after both longitudinal (forward and backward) and
make their life less complicated. In recent times there have angular (left and right) movements of the chair. In addition,
been various control systems developing specialized for we implemented on-board capability to carry out
people with various disorders and disabilities. The systems "recognition" of the environment followed by limited vocal
that are developed are highly competitive in replacing the old interactions with the user, power wheelchair for use by people
traditional systems. There are many assistive systems using with various types and degrees of handicap based on our
visual aids like Smart Wheelchair systems, Using Joystick and experience, methods used and some issues related to the
much more. There are even systems based on voice application of the behaviour-based approach to realize an
recognition too. The basic assisting using voice control is to intelligent wheelchair and possibly other assistive
detect basic commands using joystick or tactile screen. These technologies are discussed. A brief survey is also presented of
applications are quite popular among people with limited other groups who are working in this area [2].
upper body motility. There are certain drawbacks in these
systems. They cannot be used by people of higher disability
II.
OBJECTIVES
because they require fine and accurate control which is most
Automated wheelchairs that are equipped with sensors &
of the time not possible. This paper reports the preliminary data processing unit are termed as Smart Wheelchair. Our goal
work in developing a wheelchair system that involves the is to design and develop a system that allows the user to
movement of Head in directing the wheel chair. The system robustly interact with the wheelchair at different levels of the
enables the patient to have command over the Wheelchair its control and sensing.
direction of movement and will also sense the user about the
obstacles in the path to avoid collision. This wheelchair helps
III.
SYSTEM CONFIGURATION
the user to move in environments with ramps and doorways of
A regular battery powered wheelchair produced and
little space. This work is based on previous research in
marketed inwas used asthe base of the first implementationof
wheelchairs must be highly interactive to enable the system to
theconcept. A set of sensors, a computerizedautonomy
work most efficiently [5].
management unit, andnecessaryharnesses were built.
With the accelerated rate of aging of the population being
reported in many post-industrial countries, demand for more
A. Planned functions of the chair
robotic assistive systems for people with physical ailments or
loss of mental control is expected to increase. This is a
1) Basic collision avoidance
seemingly major application area of service robots in the near
This is achieved by behaviours which monitor and
future. For the past six years, we have been developing a
respond to inputs from on-board CCD camerasor those which
range of autonomous mobile robots and their software using
ISSN: 2231-5381
http://www.ijettjournal.org
Page 39
National Conference on Engineering Trends in Medical Science – NCETMS - 2014
respond to active infrared (IR) sensors. When the chair
encounters an obstacle, it firstreduces its speed, and then
depending on the situation it faces, stops or turns away from
the obstacleto avoid hitting it. The obstacle can be inanimate
(e.g., a column in a hallway, a light pole on thesidewalk, a
desk, a standing human) or animate (a passerby, a suddenly
opened door in its path, anapproaching wheelchair).
Encountering a moving obstacle, the chair first tries to steer
around it. If it cannot, it stops and backs off if the speed of the
advancing obstacle is slow enough (e.g., 20centimeters per
second). Otherwise, it stays put until the obstacle passes away.
Thus, if the chairencounters another wheelchair, both chairs
can pass each other smoothly as long as there is enoughspace
in the passage for two chairs. A fast paced human usually does
not affect the chair’s progressand at most causes the chair to
temporarily slow down or steer away [6].
2) Passage through a narrow corridor:
When surrounded by walls on each side of the path, as in
a hallway, the chair travelsautonomously from one end to the
other parallel to the walls [6].
3) Entry through a narrow doorway:
The chair automatically reduces its speed and cautiously
passes through a narrow doorway whichmay leave only a few
centimetres of space on each side of the chair. Some types of
ailment such asParkinson’s disease or polio often deprive a
human of the ability to adjust the joystick of a
powerwheelchair through such a tight passage [4].
4) Manoeuvre in a tight corner:
Similarly, when the chair is surrounded by obstacles (e.g.,
walls, doors, humans), it is oftendifficult to handle the
situation manually. The autonomous chair should try to find a
break in thesurroundings and escape the confinement by itself
unless instructed otherwise by the user.
orientation needs to be adjusted finely. Such fine adjustments
are necessarytypically when a wheelchair tries to enter a
narrow opening such as a doorway.The entire mechanical and
electrical structure, the electronics, and the control circuitry of
theoriginal power wheelchair were used without modification.
The prototype autonomy managementsystem still allows the
chair to operate as a standard manually controlled electric
wheelchair usingthe joystick. The joystick can be used
anytime to seamlessly override the control whenever the
userwishes even in autonomy mode. additions to the chair
were also kept to a minimum. AI components added to the
chairwere made visually as transparent as possible [1]. Two
processor boxes, one for vision-based behaviour generation
and the other for non-vision behaviour generation are tacked
neatly under the chair’s seat,hidden completely by the
wheelchair’s original plastic cover. Sensors are hidden under
the footrests,inside the battery case, and on other supporting
structures. Only the two CCD cameras are a littlemore visible:
they are attached to the front end of the two armrests for a
good line of sight. A smallkeypad and miniature television set
are installed temporarily over the left armrest to
enterinstructions and for monitoring.The non-vision behaviour
generator is based on a Motorola 68332 32-bit micro
controller. Amulti-tasking, real-time operating system was
developed and installed as the software framework.This
combination gave the system the capability to receive realtime signals from a large numberof sensors and to send drive
outputs to the two motors which govern the wheels. The chair
currentlyhas several bump sensors and 12 active infrared (IR)
sensors which detect obstacles in close vicinity(less than 1
meter) of the chair. Signals from the cameras are processed by
a vision-based behaviour generation unit based on a DSP
board[8].
5) Landmark-based navigation:
Two CCD colour cameras on-board the chair are used for
functions explained in (1), (2), and (3)above. They constantly
detect the depth and size of free space ahead of the chair. The
cameras arealso used to identify landmarks in the environment
so that the chair can travel from its presentlocation to a given
destination by tracing them.[6] An on-board topological map
is used to describe thesystem of landmarks.
B. Hardware structure
Fig. 1 Schematic Diagram
As a standard powered wheelchair, model 760V has two
differentially driven wheels and twofree front casters.
Although they are designed to rotate freely around their
vertical and horizontalaxis, these casters typically give
fluctuations in delicate manoeuvres due to mechanical
hysteresis thatexists in them because of design constraints (the
rotating vertical shaft of the support structure ofthe caster
cannot be at the horizontal centre of the caster). This
sometimes causes the chair to wiggleparticularly when its
ISSN: 2231-5381
C. Software structure
Software for the vision system is also built according to
behaviour basedprinciples. The major difference between this
and conventional image processing is that itconsists of
behaviours, each of which generates actual behaviour output
to the motors. It can presentlydetect depth and size of free
space, vanishing point, indoor landmarks, and simple motions
http://www.ijettjournal.org
Page 40
National Conference on Engineering Trends in Medical Science – NCETMS - 2014
up to 10meters ahead in its path. Indoor landmarks are a
segment of ordinary office scenery that naturallycomes in
view of the cameras. No special markings are placed in the
environment for navigation.There are also a large number of
behaviours invoked by IRs and bumpers which
collectivelygenerate finer interactions with the environment.
Vision-based and non-vision behaviours jointlyallow the chair
to proceed cautiously but efficiently through complex office
spaces. Note that thereis no main program to coordinate
behaviours.Currently, the autonomy program occupies about
35 Kbytes for all of the vision relatedprocessing and 32
Kbytes for other behaviour generation and miscellaneous
computation. Of the 35Kbytes for vision related processing,
only about 10 Kbytes are directly related to behaviour
generation. The rest are involved in various forms of signal
pre-processing: generation of depth map,calculation of the
size of free space, estimation of the vanishing point, and
detection of specificobstacles in the immediate front of the
chair.Of the remaining 25 Kbytes, approximately 20 Kbytes
are used in the neural network systemfor detecting landmarks
and referencing a topological map [7]. The current
implementation of thelandmark system consumes only 256
Bytes per landmark, although this figure may change in
thefuture as more sophisticated landmark description might
become necessary. The current system has
space for up to 64 landmarks but this can also be adjusted in
future versions.Of the 32 Kbytes of non-vision processing
(i.e., processing of inputs from IR’s , bump sensors,voice I/O,
etc.), again no more than several Kbytes are spent for
generating behaviours. A considerable amount of code
hasbeen written to deal with trivial periphery, such as keypad
interface, voice I/O, and LCD display.The comparable
inefficiency of coding is because these non-behavioural
processing had to be described in more conventional
algorithms.
IV.
APPLICATIONS
Hospitals
Health care centres
Old age home
Physically handicapped individuals
In industries as robot to carry goods.
Automatic gaming toys.
Communication
Control of Mechanical systems
Sports
Feedback in Computer Based Learning environment
V.
ADVANTAGES & DISADVANTAGES
A. Advantages
Power wheelchairs, also referred to as electric
wheelchairs, are a common aid to daily living for people who
are disabled or elderly. Power wheelchairs provide many
ISSN: 2231-5381
advantages for wheelchair-bound people. Many people who
require a wheelchair find a power wheelchair offers more
benefits than a bulky manual wheelchair.
Increased mobility, For disabled people who cannot
use their arms to power a manual wheelchair, or for
people who do not have the upper body strength to
self-propel a manual wheelchair, power wheelchairs
offer the ability to be mobile with the use of a joystick
or mouthpiece, such as the sip and puff control
described by Wheelchair.ca or a tongue-controlled
wheelchair.
Increased Manoeuvreability, Power wheelchairs use
casters that swivel a full 180 degrees to provide more
manoeuvreability, especially in small areas, according
to the Electric Wheelchairs Centre. Manoeuvreability
is one of the key problems associated with wheelchair
use. Power wheelchairs allow a disabled individual to
get around tight spaces and move through smaller
areas, which is especially beneficial at home.
Increased Physical Support, A power wheelchair can
have the option to allow for more physical support,
including adjustable seating such as tilt and recline.
Power wheelchair users can also adjust the height of
the chair to see their environment more clearly. Some
power wheelchairs also have the option of elevation to
help a person get to a standing position.
Increase disabledpeople’s ability to live independently
– to enjoy the same choice, control and freedom as
any other citizen –at home, at work, and as members
of the community.
Enable young disabled children and their families to
enjoy „ordinary‟ lives, through access to childcare,
early education and early family support to enable
them to care for their child effectively and remain
socially and economically included;
Support disabled young people and their families
through the transition to adulthood. Transition will be
better planned around the needs of the individuals and
service delivery will be smooth across the transition.
Increase the number of disabled people in
employment while providing support and security for
those unable to work.
Improving the life chances of disabled people.
B. Disadvantages
The disadvantage faced by disabled people imposes
significant economic and social costs.
Although power wheelchairs do have some
disadvantages, many of them can be turned into
advantages with extra money or additional features.
Typically a power wheelchair will not fold up or
come apart. Most individuals who need to travel may
not have a van or larger vehicle to store the power
wheelchair; therefore they will have to make other
http://www.ijettjournal.org
Page 41
National Conference on Engineering Trends in Medical Science – NCETMS - 2014
plans. You may have to purchase an additional
manual wheelchair for trips. Another option would
be to spend more money on a power wheelchair and
purchase one that folds ups or will disassemble fairly
easily. The fold up power wheelchairs is available in
most stores; however, they can cost quite a bit more
than traditional power wheelchair.
Even since power wheelchairs have increased in
popularity, there are still many disabled, injured, or
elderly individuals who are unable to purchase a
power wheelchair. The number one reason why an
individual who would like to purchase a power
wheelchair cannot is due to financial reasons. Before
purchasing a power wheelchair or completely ruling
one out, it is important to speak with insurance or
Medicare representatives. Many individuals are not
aware of the fact that if a wheelchair is advised by a
doctor, it may be fully or partial covered.
VI.
FUTURE SCOPE
We can make a wheelchair which can be operated by
a wireless remote. Output of sensor can be applied to
wireless transmitter circuit and can received at
wheelchair circuit by receiver circuitry. So wireless
operation can reduce wiring arrangements.
Instead of using acceleration motion (Head
Movement) we can use eye retina using optical
sensor to move wheelchair in different direction.
Using retina movement we would be able to drive a
wheelchair.
We can use voice command IC to interface our voice
signals with microcontroller. So computer interfacing
may not be needed. The voice stored in IC could be
sufficient to analyze speaker’s voice Command.
ISSN: 2231-5381
Researchers are going on development of handicap
wheelchair using nervous system of human.
VII.
CONCLUSIONS
The wheelchairs based on commercially available motorized
wheelchairs have been built using behaviour-based AI. The
size of the software is significantly smaller than control
programs for similar vehicles operatingin the real world
environment implemented using conventional AI and robotics
methodologies. Oneof the chairs is now capable of travelling
to its indoor destinations using landmark-based navigation.
The performance of our system configuration indicates there
is a cautious possibility today to build a functionalintelligent
wheelchair that is practical and helpful to people with certain
types and degrees ofhandicap.
REFERENCES
[14]
[15]
[16]
[17]
[18]
[19]
[20]
[21]
G. Pires, N. Honório, C. Lopes, U. Nunes, A. T Almeida, Autonomous
Wheelchair for Disabled People, Proc. IEEE Int. Symposium on
Industrial Electronics (ISIE97), Guimarães, 797-801.
Takashi Gomi and Ann Griffith, Developing Intelligent Wheelchairs
for the Handicapped
H.R. Everett, Sensors for Mobile Robots - Theory and Application,
A.K. Petus Ltd., 1995.
D.A. Bell, J. Borenstein, S. P. Levine, Y. Koren, L. Jaros, “An
Assistive Navigation System for Wheelchairs Based upon Mobile Robot
Obstacle Avoidance,” Proceedings of the IEEE Conference on
Robotics and Automation, 1994, pp. 2018-2022.
Rakhi A. Kalantri, D.K. Chitre, Automatic Wheelchair using Gesture
Recognition, International Journal of Engineering and Advanced
Technology (IJEAT) ISSN: 2249 – 8958, Volume-2, Issue-6, August
2013
D. A. Bell, S. P Levine, Y. Koren,, L. A Jaros, J. Borenstein,, "Desgn
Criteria For Obstacle Avoidance in a Shared-Control System",
RESNA’94, Nashville, 1994.
Amos G. Winter, V. Assessment of Wheelchair Technology , Tanzania
International Journal for Service Learning in Engineering Vol. 2, No.
1, pp. 60-77, Fall 2006 ISSN 1555-9033
Giuseppe Quaglia ⁎, Walter Franco, Riccardo Oderio, Wheelchair.q, a
motorized wheelchair with stair climbing ability, Mechanism and
Machine Theory 46 (2011) 1601–1609
http://www.ijettjournal.org
Page 42
National Conference on Engineering Trends in Medical Science – NCETMS - 2014
MRI-HIFU
Trunal M. Juware#1, Vrushali Bangale*2
#
#
Student Department of Biomedical Engineering , Amravati universityYavatmal,Maharastra,India
Student Department of Computer Engineering , Amravati universityYavatmal,Maharastra,India
ABSTRACT
MRI-guided 'high-intensity focused ultrasound' (MR-HIFU)
is a new, image-guided, non-invasive technique which enables
treatment of benign and malignant tumors by thermo
ablation by ultrasound waves. The treatment is completely
guided by MRI, which offers advantages for therapy
planning, monitoring and visualization of the treatment
result. MR-HIFU has a broad spectrum of applications,
including ablation of uterine fibroids, breast cancer, and liver
metastases. Most of these applications are still under research.
The advantage of the non-invasive character of the treatment
is that it can be performed on an outpatient basis and that
recovery is fast. The University Medical Center Utrecht, the
Netherlands, has a MR-HIFU system that, as well as for preclinical experimental applications, is used for clinical
treatment of uterine fibroids.
Keywords: HIFU, thermo ablation, uterine fibroid, ultrasound.
Introduction
High-Intensity Focused Ultrasound (HIFU, or sometimes FUS for
Focused Ultrasound) is a highly precisemedical procedure that
applies high-intensity focused ultrasound energy to locally heat
and destroy diseased or damaged tissue through ablation. HIFU is
a hyperthermia therapy, a class of clinical therapies that use
temperature to treat diseases. HIFU is also one modality of
therapeutic ultrasound, involving minimally invasive or noninvasive methods to direct acoustic energy into the body. In
addition to HIFU, other modalities include ultrasound-assisted
drug delivery, ultrasound hemostasis, ultrasound lithotripsy, and
ultrasound-assisted thrombolysis. Clinical HIFU procedures are
typically performed in conjunction with an imaging procedure to
enable treatment planning and targeting before applying a
therapeutic or ablative levels of ultrasound energy. When
Magnetic resonance imaging (MRI) is used for guidance, the
technique is sometimes called Magnetic ResonanceguidedFocused Ultrasound, often shortened to MRgFUS or
MRgHIFU. When diagnostic Sonography is used, the technique is
sometimes called Ultrasound-guided Focused Ultrasound
(USgFUS or USgHIFU). Currently, MRgHIFU is an approved
therapeutic procedure to treat uterine fibroids in Asia, Australia,
Canada, Europe, Israel and the United States. USgHIFU is
approved for use in Bulgaria, China, Hong Kong, Italy, Japan,
Korea, Malaysia, Mexico,
ISSN: 2231-5381
Poland, Russia, Romania, Spain and the United Kingdom.
Research for other indications is actively underway, including
clinical trials evaluating the effectiveness of
HIFU for the treatment of cancers of the brain, breast, liver, bone,
and prostate. At this time non-image guided HIFU devices are
cleared to be on the market in the US, Canada, EU, Australia, and
several countries in Asia for the purposes of body sculptingSelect
the test sequence corresponding to your standard of choice
What is HIFU?
MR-HIFU or Magnetic Resonance Imaging guided HighIntensity-Focused-Ultrasound is a non-invasive alternative which
uses high-intensity ultrasound waves that are focused into small
areas to produce heat for killing tumor cells.
The focused sound waves coagulate the myoma tissue at the
point of focus without affecting the surrounding tissue. To ensure
efficient ablation, the focused ultrasonic beam moves quickly
over the lesion to be ablated (Volumetric ablation). The myoma
tissue, at the point of focus, heats up to approx. 60-65 degree C
and is consequently necrosed. The procedure is monitored with
real-time MR images which provide real-time feedback through
thermal mapping.
The HIFU concept:
In high intensity focused ultrasound (HIFU), a specially designed
transducer is used to focus a beam of ultrasound energy into a
small volume at specific target locations within the body. The
focused beam causes localized high temperatures (55 to 90°C) in
a region as small as 1 x 1 x 5 mm. The high temperature,
maintained for a few seconds, produces a well-defined region of
necrosis. This procedure is referred to as ultrasound ablation. The
tight focusing properties of the transducer limit the ablation to the
target location. In many applications, the ultrasound therapy is
guided using diagnostic ultrasound.
However, ultrasound imaging does not provide the high resolution
images, real-time temperature monitoring, and adequate post
treatment lesion assessment required for fast and effective
therapy. In contrast to ultrasound, MR imaging offers excellent
soft tissue contrast, 3D imaging capabilities, and noninvasive
temperature measurement techniques.
http://www.ijettjournal.org
Page 43
National Conference on Engineering Trends in Medical Science – NCETMS - 2014
CONSTRUCTION & WORKING
Block Diagram:
Focusing:
How HIFU works:
As an acoustic wave propagates through the tissue, part of it is
absorbed and converted to heat. With focused beams, a very small
focus can be achieved deep in tissues (usually on the order of
millimeters, with the beam having a characteristic "cigar" shape in
the focal zone, where the beam is longer than it is wide along the
transducer axis). Tissue damage occurs as a function of both the
temperature to which the tissue is heated and how long the tissue
is exposed to this heat level in a metric referred to as "thermal
dose". By focusing at more than one place or by scanning the
focus, a volume can be thermally ablated. At high enough
acoustic intensities, cavitation (micro bubbles forming and
interacting with the ultrasound field) can occur. Micro bubbles
produced in the field oscillate and grow (due to factors including
rectified diffusion), and can eventually implode (inertial or
transient cavitation). During inertial cavitation, very high
temperatures inside the bubbles occur, and the collapse is
associated with a shock wave and jets that can mechanically
damage tissue. Because the onset of cavitation and the resulting
tissuedamage can be unpredictable, it has generally been avoided
in clinical applications. However, cavitation is currently being
investigated as a means to enhance HIFU ablation and for other
applications.
ISSN: 2231-5381
The ultrasound beam can be focused in these ways:
• Geometrically, for example with a lens or with a spherically
curved transducer.
• Electronically, by adjusting the relative phases of elements in an
array of transducers (a "phased array"). By dynamically adjusting
the electronic signals to the elements of a phased array, the beam
can be steered to different locations, and aberrations in the
ultrasound beam due to tissue structures can be corrected
http://www.ijettjournal.org
Page 44
National Conference on Engineering Trends in Medical Science – NCETMS - 2014
How MRI does guided HIFU works?
Advantages of HIFU
The MRI acquires high resolution 3-D images of the fibroid and
o
o
o
o
o
o
No blood loss
Quick recovery
Non-surgical
Radiation free
An outpatient procedure
It reduces morbidity and mortality among
women of child bearing age
Conclusion:
surrounding structures. These images are used for accurate
planning and mapping of the treatment. During treatment, the
HIFU transducer focuses the ultrasound beam into the fibroid as
per the planned areas (cells) and heats the tissue up to 65 degree
Celsius, coagulating it. This is called sonication. . Sonalleve MRI
guided HIFU ensures patient safety by having a number of safety
mechanisms built into the system. All of these ensure that apart
from the tissue being targeted, no other organ or tissue is affected
by the treatment. During treatment, the MRI plays an important
role by monitoring temperatures within the treatment areas as well
as in the surrounding tissues. The recorded temperatures are then
superimposed in the form of colour coded maps on the 3-D
images that are being used for the treatment monitoring. The realtime feedback loop ensures that adequate heating takes place,
treating every bit of tissue that has been targeted and volumetric
ablation (a Philips proprietary technology) helps treat larger
volumes efficiently and quickly. Thermal mapping contributes to
safety by ensuring that the treatment remains within the
recommended temperature levels, and that the surrounding tissues
are not affected at all. In addition, Motion detection with
automatic adjustment/suspension of sonication also ensures that
the procedure is safe. An emergency stop button that is controlled
by the patient allows the patient to pause the treatment whenever
she needs to, and the treatment can be resumed once she is
comfortable.
From above all detail description I have to conclude that
MRI-guided HIFU ablation may be a safe and effective
minimally invasive technique for the treatment of
uterine fibroids. HIFU treatment on uterine fibroid was
proved to be effective in this study through analyzing
70 cases clinical data of examinations and results.
However, how to evaluate the therapy efficacy is
always cared. Because HIFU is a new technique from
ultrasound, the tumor response to therapy mostly are
accurately evaluated by using contrast-enhanced
ultrasound and MRI imaging combined with routine
ultrasound, color Doppler flow imaging and power
Doppler ultrasound.
REFERENCES
1.
2.
3.
4.
5.
ISSN: 2231-5381
Vollenhoven BL, Lawrence AS, Healy DL (1990)
uterine fibroids: a clinical review. Br J Obstet Gynecol
97:285298
Haar GT.Therapeutic applications of ultrasound, Prog
Biophys Mol Biol 2007; 93(13):111-29.
Radeleff B, Eiers M, Bellemann N et al (2010)
Expulsionof dominant submucosal fibroids after
uterine artery emobolization. Eur J Radiol 75:e57–e63.
Magnetic Resonance Guided Focused Ultrasound
Surgery, United States Patent# 5247935 Harvey
Cline, Robert Ettinger, Kenneth Rohling Ronald
Watkins, filed March 1992
Focused US system for MR imaging-guided tumor
ablation HE Cline, K Hynynen, RD Watkins, WJ
Adams, JF Schenck
http://www.ijettjournal.org
Page 45
National Conference on Engineering Trends in Medical Science – NCETMS - 2014
Bio-inspired “Superglue” can mend‘Broken
Hearts’
#
Niharika Singh#1, Akshata Wadaskar*2
1(BE Student, Biomedical Engineering, DBNCOET, Amravati University, Yavatmal, Maharashtra, India)
*2(BE Student, Biomedical Engineering, DBNCOET, Amravati University, Yavatmal, Maharashtra, India)
AbstractWe have been using Staples and sutures have been using for
decades and there has been really minimal innovation. They have
inherent limitations. These are difficult to place in small spaces like
during laparoscopic or minimally invasive procedures. One
example of glue that has approved is a medical “grade crazy glue”
or “super glue”. It’s only been approved for minimal uses. When
we use it inside the body, we actually have to dry the tissue before
we apply it because it’s just so highly reactive. The glue HLAA
(Hydrophobic Light Activated Adhesive) can be used in operations
to seal holes in the heart. It is polyglycerol sebacate acrylate
(PGSA). This paper presents the discovery of medical superglue
and its approach to heal or patch up holes in the blood vessels and
heart walls with easier technology. This adhesive sets in few
seconds when exposed to UV light. This important contribution of
this work include: Discovery of a new light activated glue which
can replace the use of sutures and staples and to form a watertight
seal to wet tissue.
Keywords- Polyglycerol Sebacate Acrylate, HLAA, Sutures,
Staples.
I.
INTRODUCTION:
It is a minimally invasive technique in which light
activated glue is used as an adhesive to patch up the
holes in blood vessels and the heart’s walls since both
the glue and the light can be delivered by thin tools.
Adhesive testing is done in most demanding and
dynamic environment in the body- the heart and is
found to be successful. Existing medical glues are not
strong enough to use in challenging situations, for
example where there is high blood flow or if tissue is
moving such as in the heart. The medical glues that
are currently used are water soluble, so they can be
easily washed away, and also they can be activated
by contact with blood. Contraction of heart and
constant blood flow make reconnecting blood
vessels, attaching devices and sealing holes in the
heart during surgery difficult. Sutures and staples are
routinely used, but are not elastic and can exert
damaging pressure on tissue. Yet most currently
ISSN: 2231-5381
available medical grade superglues are toxictriggering an inflammatory response and buckle
under the high pressure force of blood flowing in
larger vessels. This new material is able to resist
physiologic blood pressures while maintaining some
elasticity, allowing for proper function of the vessels.
The ways of sealing congenital heart defects in
infants that are needed, were creating a laundry list of
properties of the ideal surgical glue. The material had
to be elastic, biodegradable, biocompatible and had to
stick strongly to the tissue under wet conditions,
especially in presence of blood and found that the
pre- polymer (poly glycerol sebacate acrylate), or
PGSA, fit all of criteria except that it was only
partially adhesive. A modified PGSA was well
attached to the tissue and imparted the material with
on-demand adhesiveness. The resulting glue contains
a chemical that when activated by Ultra-violet light
creates free radicals that lock the polymer in place but
allows the material to remain elastic.
II.
METHODOLOGY:
In California, slugs and sandcastle worms
are found. These creatures can produce viscous
secretions that are not easily washed away and do not
mix with water. Studying these secretions which are
viscous and water repellant, a material is made that
performs well under this condition, is elastic and
biocompatible, and fully biodegrade over time. A
compound of two naturally occurring substances –
glycerol and sebacic acid is developed which is
named as hydrophobic light activated adhesive
(HLAA). The mixture is viscous and easy to spread
over the surface. When activated to UV light, it
becomes a strong and flexible adhesive.
http://www.ijettjournal.org
Page 46
National Conference on Engineering Trends in Medical Science – NCETMS - 2014
Fig no.2.Structural formula for Sebacic acid
Glycerol also called as glycerine is a
simple polyol (sugar alcohol) compound. It is a
colourless, odourless, viscous liquid that is widely
used in pharmaceutical. The glycerol backbone is
central to all lipids known as triglycerides.
Fig.1. Slugs and sandcastle worms
a) A series of experiments that have been performed:
Comparison of patches covered in HLAA
with current medical glue by sticking them to
the outside of rats' hearts
Comparative studies of
HLAA to
conventional stitches by making a hole in the
heart of two groups of rats, and used the
HLAA patches to close it in one group (n=19)
and compared this to using stitches in the
other (n=15)
Putting patches coated with HLAA on the
septum of four pigs' hearts
Gluing of a small cut measuring 3-4mm to a
pig artery in the laboratory using HLAA and
then assessed at what pressures it would
remain closed to see if it could cope with
human blood pressures
Fig no.3. Structural formula for glycerol
HLAA is used in operations on small and large
animals that would be similar to human operations,
including the repair of cuts to blood vessels and
closing holes in the wall of the heart.
The research found that HLAA is 50% as strong as
the medical glue currently in use. However, when
the glue is put onto patches, it is possible to put it into
position without the glue being washed off. It is then
fixed with UV light. When the same technique is
performed using the current type of glue, it is
immediately activated when it comes into contact
with the blood and is therefore harder to use.
Patches covered with HLAA sticks to the outer layer
of the hearts of rats and could be repositioned before
b) Constituents of the glue and their chemistry
Sebacic
acid is
a
naturally sticking with the UV light, whereas the patches using
occurring dicarboxylic acid with the structure current medical glue can’t. Staples and sutures have
(HOOC) (CH2)8(COOH). In its pure state it is a white been using for decades and there has been really
flake or powdered crystal. The product is described minimal innovation. They have inherent limitations.
as non-hazardous, though in its powdered form it can These are difficult to place in small spaces like
be prone to flash ignition (a typical risk in handling during laparoscopic or minimally invasive
fine organic powders).Sebacic acid is a derivative procedures. One example of glue that has approved is
of castor oil, with the vast majority of world a medical “grade crazy glue” or “super glue”. It’s
production occurring in China which annually only been approved for minimaluses. When we use it
exports over 20,000 metric tonnes, representing over inside the body, we actually have to dry the tissue
before we apply it because it’s just so highly reactive
90% of global trade of the product.
ISSN: 2231-5381
http://www.ijettjournal.org
Page 47
National Conference on Engineering Trends in Medical Science – NCETMS - 2014
for chunks to break off, and cause an embolism or a
stroke.
Fig no.5. Implantation of glue on heart walls
Fig.no.4. Image of glue being applied to open incision
c)
Implantation:
The glue is viscous and it is in a liquid state, so we
can inject it. We can even paint it on. We can place
this onto the surface of a patch-like material and then
we can deploy this. So, in some instances, we may
use the glue alone by injecting through a minimally
invasive device for example wherever we inject the
glue, as soon as it hits a surface, because it’s so
viscous, it just stays there. Then also, what is found
which is quite fascinating is that the glue is able to
penetrate into the tissue. So, it actually goes into the
tissue fibres and then when we shine UV light, this
actually cures and locks the glue into place. . In other
instances, we can coat it on the surface of a patch and
even a biodegradable patch so the entire system, the
glue, and the patch will degrade.
We can shine a fairly low level of intensity of light
over a short period of time. So typically, it only takes
maybe 5 to 30 seconds to get a complete cure. So we,
in our initial experiments, we actually looked at this
in extensive detail and found intensities of light that
did damage the tissue. But then we were able to scale
that back and it still achieved a strong fast cure
without doing damage to the tissue. As it is
biocompatible, so if being gelatinous it breaks off
from where you deploy it, the cells and tissue can
grow over them quickly. And so, right after we place
this glue into heart or onto the surface of a blood
vessel for example, within just a few days, it’s
already starting to be coated with cells and other
tissue. So, that will significantly limit the potential
ISSN: 2231-5381
Properties of the adhesive:
• It sticks well to wet tissues
• It repels blood and water
• It is non inflammatory
• It is thick and sticky until it is activated by
UV light
• It allows proper functioning of vessel resisting
physiologic blood pressure
• It is a non toxic polymer that doesn’t mix with
water
• It sets quickly when exposed to UV radiations
• It is a viscous liquid
• The glue is elastic, biocompatibleand sticks
strongly to tissue under wet conditions
especially in presence of blood.
III.
CONCLUSION:
Actually, when we use this glue inside the body we
need not to care whether the tissue is dried or not
because the glue is water and blood repellent and thus
it can successfully heal the surface of a patch. Along
with this adhesive material is made from naturally
occurring
substances
and
shows
high
biocompatibility. Therefore when we would implant
it, it wouldn’t promote immunity action against the
glue and thus would promote the body in support of
healing. The performance analysis shows that the
hydrophobic light activated glue (HLAA) can reach
an agreement that it can successfully meet the needs
of surgeons and doctors in operating with the tissues
having constant blood flow and also during
minimally invasive procedures.
http://www.ijettjournal.org
Page 48
National Conference on Engineering Trends in Medical Science – NCETMS - 2014
IV.
FUTURE WORK:
VI.
What has been shown so far is a proof of principal
and a potential for use in the clinic .This is a major
improvement over current suturing adhesives that
often loose their stickiness in bloody situations. And
it has the added benefit of working quickly because
its adhesiveness is activated by ultraviolet light,
which enables surgeons to quickly activate the
material when they need to seal a hole. Many infants
born with heart defects have to undergo repeated
surgeries as they grow. Replacing the sutures and
staples used in surgery today with fast-acting,
biodegradable glues could help make these cardiac
procedures faster and safer.
V.
ACKNOWLEDGEMENT:
[24]
[25]
[26]
[27]
[28]
[29]
[30]
[31]
[32]
[33]
[34]
This work has been completed with the help of our
principal sir, HOD sir of BME department, Prof.
A.Fursule sir and Prof.Sandeep Ghughe sir.
ISSN: 2231-5381
[22]
[23]
[35]
[36]
REFERANCES:
(2002) The IEEE website. [Online]. Available: http://www.ieee.org/
M. Shell. (2002) IEEEtran homepage on CTAN. [Online]. Available:
http://www.ctan.org/texarchive/macros/latex/contrib/supported/IEEEtran/
Robbins and Cotran “Pathologic basis of disease” 8 th edition –Kumar,
Abbas, Fausto and Aster.
Chemistry part- 2nd class 12th –Dr. S.M.Bhatt, Shri.H.B. Jadhav,
Mr.K.N.Joshi, Dr.L.S.Patil
Rediscovering the Golden State: California Geography, 2nd Edition
Paperback -By William A. Selby
http://www.amazon.co.in/
book ultraviolet radiation in the solar system, (astrophysics)
http://www.lavoisier.fr/notice/gb410934.html
The Sun: A User's Manual –By Claudio Vita-Finzi
The Sun and Space Weather –By Arnold Hanslmeier
https://www.landesbioscience.com/curie/chapter/3611/
blogs.discovermagazine.com/
Bretti, C.; Crea, F.; Foti, C.; Sammartano, S. (2006). "Solubility and
Activity Coefficients of Acidic and Basic Nonelectrolytes in Aqueous
Salt Solutions.
Solubility and Activity Coefficients of Suberic, Azelaic, and Sebacic
Acids in NaCl (aq), (CH3)4NCl(aq), and (C2H5)4NI(aq) at Different Ionic
Strengths and at t = 25 °C". J. Chem. Eng.
en.wikipedia.org
http://www.chemspider.com/
http://www.ijettjournal.org
Page 49
National Conference on Engineering Trends in Medical Science – NCETMS - 2014
DSP Based Standalone ECG Monitoring System : A
Case Study
Mr. Pranav A. Deshmukh, Mr. Abhijeet S. Tikhile, Mr. Chetan G. Thote
Department of Electronics and Telecommunication Engineering, Dr. Bhausaheb Nandurkar College ofEngineering &
Technology,Yavatmal.
Abstract— This paper describes the implementation of
low cost standalone Digital Signal Processing (DSP)
hardware for ECG monitoring in order to assist
physician or cardiologist to carry out their visual
observation in ECG monitoring. The visual observation
is in real time, where the acquired ECG from the
subject can be seen on the graphic LCD and it is
important to ensure the signal is stable and consistent
before the pre-recording session take place which would
help the cardiologist’s or physician’s in analysis and
diagnosis, accurately. The design of the DSP hardware
based stand alone system are divided into three
hardware units, first the digital signal processor with
memory unit, second is the signal monitoring displays
unit and third is analog front end unit. Firmware
development in this system design is to attach each
hardware unit to perform specific functions in carrying
out operation on the stand alone system. The
advantages of this system are the ability to run in standalone operation and as well as eligibility of updating on
board pre-program algorithm for ECG analysis which
existing ECG monitoring equipment are lacking, which
means that this stand alone system could be
programmed to suit a particular need.
computer. After that, ECG recording also have had evolved
throughout the decades with the growth of technology in
signal processing. Later on, the impact of the signal
processing achievements created a paradigm shift and
alters the being of hardware computation when
mathematically algorithms are applied in signal analysis.
Since then, the algorithmic activities show favors
in non-computer dependant operation with efficiency in
numerical processing. Then, it is followed by the influential
of its outcome which is ushering the microprocessor step
into higher stage by means of doing solo numerical
computing. Follow by the pro-active influent, leads the
conventional microprocessor to cushion the successor
which is succeeded with a greater benefit of achievements
when the digital signal processor (DSPs) is introduced and
in promotion in year 1971. Thus, the DSPs offers built in
and integrated with mathematical capabilities and
proficiency of numeric functional as compared with others
available non-DSP terms in the general microprocessor.
Nevertheless, it is also capable of doing on chip" analysis,
which is, including real time signal processing. Therefore,
the advantages of DSPs had open door to enable ECG
analysis to be done in real time processing instead of
recording and stored for later analysis.
Keywords— Electrocardiogram (ECG), Digital Signal
The introduction of DSP processor had brought
forward realization for integrating DSP board to computer
based for real time ECG analysis. One of the common
hardware tools involved ECG in computing is the plug n
play DAQ card. In this system, add on hardware such as
data acquisition card is required for this purpose. Where the
dependency for plug in data acquisition card in the
computer itself required software development, such as
firmware and application software is necessary to establish
communication link with the connected card. Those
integrated data acquisition card with software application
can provide a magnificent outcome, but lack of mobility,
expensive and computer dependant. But a custom build
Printed Circuit Board (PCB) with specialty electronics
design are more prefer to use in standalone operation for
specific task.
Processing (DSP),Analog to Digital Converter(ADC)
I.INTRODUCTION
Non-invasive Electrocardiogram approach has become the
standard practice in clinical environment, after it is first
made known by Eithoven. Then, the discovery of ECG
brings forward the opportunities for further research and
development. So, in year 1947, modern ECG recording
machine is introduced by Norman Jeff holter. Later it is
called Holter Ambulatory Electrocardiography. Hence
along the path it gave birth to the ECG recording system
which is populated by the invention of microprocessor in
the later years. Indeed, ECG recording trend is turning a
new leaf when microprocessor is embedded with electronic
gadget in various hardware platforms, which allows full
assessment to the collected data of electrocardiography.
However, in the early microprocessor system, the ECG
signal is compressed while the system is in recording
mode, then it is stored and the analysis is done on
ISSN: 2231-5381
1.1 Electrocardiogram
Electrocardiography (ECG or EKG from Greekkardia,
meaning heart) is a transthoracic (across the thorax or
http://www.ijettjournal.org
Page 50
National Conference on Engineering Trends in Medical Science – NCETMS - 2014
chest) interpretation of the electrical activity of the heart
over a period of time, as detected by electrodes attached to
the surface of the skin and recorded by a device external to
the body. The recording produced by this noninvasive
procedure is termed an electrocardiogram (also ECG or
EKG). An ECG is used to measure the rate and regularity
of heartbeats, as well as the size and position of the
chambers, the presence of any damage to the heart, and the
effects of drugs or devices used to regulate the heart, such
as a pacemaker. Most ECGs are performed for diagnostic
or research purposes on human heart, but may also be
performed on animals, usually for diagnosis of heart
abnormalities or research.
An ECG is a way to measure and diagnose
abnormal rhythms of the heart, and helps to diagnose
properly particularly abnormal rhythms caused by damage
to the conductive tissue that carries electrical signals, or
abnormal rhythms caused by electrolyte imbalances. In
a myocardial infarction (MI), the ECG can identify if the
heart muscle has been damaged in specific areas, though
not all areas of the heart are covered.The ECG cannot
reliably measure the pumping ability of the heart, for which
ultrasound-based (echocardiography) or nuclear tests are
used. It is possible for a human or other animal to be
in cardiac arrest, but still have a normal ECG signal (a
condition known as pulse less).
The ECG device detects and amplifies the tiny
electrical changes on the skin that are caused when
the heart muscle depolarizes during each heartbeat. At rest,
each heart muscle cell has a negative charge, called the
membrane potential, across its cell membrane. Decreasing
this negative charge towards zero, via the influx of the
positive cations, Na+ and Ca++, is called depolarization,
which activates the mechanisms in the cell that cause it to
contract. During each heartbeat, a healthy heart will have
an orderly progression of a wave of depolarization that is
triggered by the cells in the senatorial, spreads out through
the atrium, passes through the atrioventricular node and
then spreads all over the ventricles. This is detected as tiny
rises and falls in the voltage between two electrodes placed
either side of the heart which is displayed as a wavy line
either on a screen or on paper. This display indicates the
overall rhythm of the heart and weaknesses in different
parts of the heart muscle.
Figure Shows Schematic representation of normal
ECG. The P waves, QRS complex and T waves shows the
activation of the right and left atria, depolarization of the
right and left ventricles and ventricular activation.
ISSN: 2231-5381
Fig: Schematic representation of normal ECG
1.2 Digital Signal Processing
Digital Signal Processing deals with algorithms
for handling large chunk of data. This branch identified
itself as a separate subject in 70s when engineers thought
about processing the signals arising from nature in the
discrete form. Development of Sampling Theory followed
and the design of Analog-to-Digital converters gave an
impetus in this direction. The contemporary applications of
digital signal processing was mainly in speech followed by
Communication, Seismology, Biomedical etc. Later on the
field of Image processing emerged as another important
area in signal processing.
Fig. The basic Signal Processing Platform
The figure shows represents a Real Time digital
signal processing system. The measure and can be
temperature, pressure or speech signal which is picked up
by a sensor (may be a thermocouple, microphone, a load
cell etc). The conditioner is required to filter, demodulate
and amplify the signal. The analog processor is generally a
low-pass filter used for anti-aliasing effect. The ADC block
converts the analog signals into digital form. The DSP
block represents the signal processor. The DAC is for
Digital to Analog Converter which converts the digital
signals into analog form. The analog low-pass filter
eliminates noise introduced by the interpolation in the
DAC.
http://www.ijettjournal.org
Page 51
National Conference on Engineering Trends in Medical Science – NCETMS - 2014
II. LITRATURE REVIEW
At first, Holter relied entirely on personal funds
but later (beginning in 1952) received grants from the
National Institutes of Health and, still later, from private
funds. Although he and Generalised that small-sized
equipment would be essential for successful practical
telemetering of physiologic data, the first goal was to see if
transmission
of
electroencephalograms
or
electrocardiograms (ECGs) was possible irrespective of the
size of the equipment. Their first success was in
broadcasting electroencephalograms and recording them
accurately in a boy who was riding a bicycle nearby.
Shortly thereafter, Holter switched from the brain to the
heart because the heart’s voltage is about 10 times greater
than that of the brain, therefore making the electronics
easier, and because heart disease is far more prevalent than
cerebral disease.[2]
Taddei et al (1995) designed a rule-based system
for two lead ECG recordings which employs a geometric
algorithm that calculates a 2D loop for the ST segment. For
each cardiac beat the ST segment deviations are estimated
in the two leads and then each pair of values is graphically
represented sequentially in time. A graphical rule is used to
identify ischemic episodes. The system was tested using
the ESC ST-T database and the Achieved sensitivity and
positive predictive accuracy is 82% and 81%, respectively.
Costas Papaloukas et al (2002) developed Novel
Rule-based Expert System was examined in detecting
electrocardiogram (ECG) changes in long duration ECG
recordings. The system distinguishes these changes
between ST-segment deviation and T-wave alterations and
can support the produced diagnosis by providing
explanations for the decisions made. The European Society
of Cardiology ST-T Database was used for evaluating the
performance of the system. Sensitivity and positive
predictive accuracy were the performance measures used
and the proposed system scored 92.02% and 93.77%,
respectively, in detecting ST segment episodes and 91.09%
and 80.09% in detecting T-wave episodes.
Costas Papaloukas et al (2006) presented a novel
methodology for the automated detection of ischemic beats
that employed classification using association rules. The
main advantage of the proposed methodology is the
combination of high accuracy with the ability to provide
interpretation for the decisions made, due to the
employment of association rules for the Classification. The
performance of their approaches compares well with
previously reported results using the same subset from the
ESC ST-T 24 database and indicates that it could be part of
a system for the detection of ischemic episodes in long
duration ECGs.
Erik Zellmer et al (2009) presented a highly
accurate ECG beat classification system. It uses continuous
wavelet transformation combined with time domain
morphology analysis to form three separate feature vectors
ISSN: 2231-5381
from each beat. Each of these feature vectors are then used
separately to trainthree different SVM classifiers.
Philip Langley et al (2010) proposed an algorithm for
analysing changes in ECG morphology based on PCA is
presented and applied to the derivation of surrogate
respiratory signals from single lead ECGs. The respiratory
induced variability of ECG features, P waves, QRS
complexes, and T waves are described by the PCA. The
assessment of ECG features and principal components
yielded the best surrogate for the respiratory signal.
III. STANDALONE ECG MONITORING SYSTEM
Figure1: Block diagram of prototype DSP stand alone system with the
tapped ECG is checked with oscilloscope and display on the graphic LCD.
The tap ECG also captured by the DSP processor and displayed on the
window at Code Composer 3x/4x.
From Figure1 shows the
operation for Analog Front End (AFE) unit interface with
volunteer subject as shown in Figure 1(a), Figure 1(b) and
Figure 1(c) respectively.
Figure 1(a) shows the tapped ECG from test
subject, it is tapped from the Lead II formation on human
body skin surface with four disposable electrodes placed on
the right arm (white color), left arm (black color), right leg
(green color) and left leg (red color), all the color code
were referred to electrodes placement on human body.
Figure 1(b) shows the oscilloscope screen display
from the output of AFE, this means that it is functional.
Then, in Figure 1(c) shows that the output from AFE is
able to read by microcontroller, PIC18F452 and display the
tap ECG to the Graphic LCD. Emulator XDS510PP
(PLUS) from Spectrum Digital Incorporated was attached
to on board JTAG connector at TMS320VC33 by
communicate through Code Composer 3x/4x in order to
visualized the tap ECG at the graphical windows as
depicted in Figure 1(d).
The capacity of the graphical windows can only
display 2000 data. As a result, 7 cycles of tap ECG data
were captured in approximately 7 second, all the captured
http://www.ijettjournal.org
Page 52
National Conference on Engineering Trends in Medical Science – NCETMS - 2014
signal were labeled with its P, Q, R, S and T waves. These
collected tapped ECG data are temporary stored in the
external RAM as shown in Figure 1(d).
IV.HARDWARE PLATFORM.
In this DSP hardware design, is utilizing two
processors by means of putting a single DSP processor
(lack of tasks' oriented but capable of mathematical and
algorithm executions) and a single microcontroller
(performs best in tasking, but lack of DSP terms) into one
system board. Therefore, this will provide separate traffic
management for tasking and signal processing without
over-loading each processor's work load.
This approach is depicted in Figure 1, the
microcontroller is maintaining to display the tap ECG from
ADC chip to the graphic LCD and the DSP processor is
focused on reading the tapped ECG signal from the codec
chip. However, the Universal Serial Bus (USB) in this DSP
hardware design is for downloading the ECG analysis
algorithm to the ROM and it is also use for power up the
DSP hardware.
DSP hardware based stand alone system design is
divided into three functional units. The solid lines with
arrows symbol represent the flow of data and information.
The dashed lines with green, red and blue color represent
the functional hardware units. The DSP hardware consists
of three functional hardware units, they are;
a).Signal processing with memory unit
b). Signal monitoring displays unit
c). Analog front End unit
a). Signal processing with memory unit: This unit provides
signal altering, changing, re-solving, modification, storage
and communication protocol. The mains components are
floating point DSP processor (TMS320VC33), Electrical
Erasable Programmable Read only Memory EEPROM
(CAT28LV64W) and Static Random Access Memory
SRAM (CY7C1041DV33). The SRAM memory is
expandable in both the data bus and address bus width.
b). Signal monitoring displays unit: This unit provides
display on graphical liquid crystal displays (GLCD) for
monitoring ECG as shown in Figure 1. In this unit, the
microcontroller, PIC18LF452 is configured to interact with
graphical liquid crystal displays (GLCD). The
microcontroller is added in this unit without interrupting
the TMS320VC33, because the microcontroller performs
best in tasking order, which capable of task orientation and
lack of DSP terms. However, the ADC0820 received the
input from the tap ECG signal through signal conditioning
circuit (SCC) and the converted ADC data is latch to the
output port of ADC0820. Then the tap ECG signal from
SCC output was capture and converted by 8 bit Analog to
Digital Converter chip set (ADC0820) and translated by
PIC18LF452 into GLCD code in order to display on the
GLCD.
ISSN: 2231-5381
Figure 2, shows that, upon initialization, the
microcontroller put to observe the FT245RL chip set to get
acknowledge and the observation is done through Port A of
PIC18LF452. As the acknowledge signal is detected, and
then the firmware will proceed to next step’s label as ‘A’.
If there is no feed back for acknowledge signal by the
FT245RL, then in this case, the next stage will begin with
monitoring the external interrupt and the firmware loops. If
the interrupt is detected, PIC18LF452 will initialize the
Graphic LCD panel and begin to read the ADC data from
Port C of PIC18LF452. After that, the tap ECG is put on
GLCD screen to display as the ECG monitoring signal.
c) Analog front End unit; this unit provides interaction
through peripherals connectivity with the real world
environment. The peripherals such as in Figure 1 shows
that the ECG is delivered to the main board through the
custom build AFE device. This AFE input consists of; i)
Signal conditioning circuitry (SCC), ii) Codec chip,
PCM3003 and iii) Analog to digital converter chip set,
ADC0820. In this DSP hardware design, is utilizing two
processors by means of putting a single DSP processor
(lack of tasks’ oriented but capable of mathematical and
algorithm executions) and a single microcontroller
(performs best in tasking, but lack of DSP terms) into one
system board. Therefore, this will provide separate traffic
management for tasking and signal processing without
over-loading each processor’s work load.
(a) Test Subject: Resting in static condition
Figure 2: Real time ECG observation from test subject is captured and
displayed on the graphic LCD.
This approach is depicted in Figure 1, the microcontroller
is maintaining to display the tap ECG from ADC chip to
the graphic LCD and the DSP processor is focused on
reading the tapped ECG signal from the codec chip.
However, the Universal Serial Bus (USB) in this DSP
hardware design is for downloading the ECG analysis
algorithm to the ROM and it is also use for power up the
DSP hardware.
.1 DSP Processor (TMS320VC33)
The TMS320VC33 DSP is a 32-bit, floating-point
processor manufactured in 0.18-μm four-level-metal
http://www.ijettjournal.org
Page 53
National Conference on Engineering Trends in Medical Science – NCETMS - 2014
CMOS (Timeline) technology. The TMS320VC33 is part
of the TMS320C3x generation of DSPs from Texas
Instruments. The TMS320C3x’s internal busing and special
digital-signal-processing instruction set have the speed and
flexibility to execute up to 150 million floating-point
operations
per
second
(MFLOPS).
The
TMS320VC33optimizes speed by implementing functions
in hardware that other processors implement through
software or microcode. This hardware-intensive approach
provides performance previously unavailable on a single
chip.
The TMS320VC33 can perform parallel multiply
and ALU operations on integer or floating-point data in a
single cycle. Each processor also possesses a generalpurpose register file, a program cache, dedicated ARAUs,
internal dual-access memories, one DMA channel
supporting concurrent I/O, and a short machine-cycle time.
High performance and ease of use are the results of these
features. General-purpose applications are greatly enhanced
by the large address space, multiprocessor interface,
internally and externally generated wait states, one external
interface port, two timers, one serial port, and multipleinterrupt structure.
The TMS320C3x supports a wide variety of system
applications from host processor to dedicated coprocessor.
High-level-language support is easily implemented through
a register-based architecture, large address space, powerful
addressing modes, flexible instruction set, and wellsupported floating-point arithmetic.
The TMS320VC33 is a superset of the
TMS320C31. Designers now have an additional 1M bits of
on-chip SRAM, a maximum throughput of 150 MFLOPS,
and several I/O enhancements that allow easy upgrades to
current systems or creation of new baselines. This data
sheet provides information required to fully utilize the new
features of the TMS320VC33 device.
The simplified architecture of TMS320C6713 is shown in
the Figure below. The processor consists of three main
parts CPU, peripherals and memory.
Figure: Simplified block diagram of TMS320C67xx family
4.2. Microcontroller, PIC18F452
The Microcontroller, PIC18F452 is 32 K. These
devices come in 28-pin and 40/44-pin packages. The 28-
ISSN: 2231-5381
pin devices do not have a Parallel Slave Port (PSP)
implemented and the number of Analog-to-Digital (A/D)
converter input channels is reduced to 5.
A microcontroller, a digital device, can read, execute
and transmit only digital signals. On the contrary, the
outputs of the most of the transducers are analog in nature.
Thus it is hard to interface these transducers directly with
controllers. Analog-to-digital convertor (ADC) ICs are one
way to make the analog input compatible with the
microcontroller.Using an external ADC adds complexity to
the
circuit.
To
avoid
this
complexity, PIC
Microcontrollers have in-built ADC module which reduces
the cost and connections of the circuit.
4.3 Signal Conditioning Circuit
Signal conditioning is a process of manipulating an
analog signal in such way that it is optimized for further
processing. Most common example will be Analog-toDigital Converters (Abbreviate to ADC in future use).
Signal conditioning is typically categorized into three
stages; Filtering, Amplifying, Isolation. In Filtering stage,
goal is to eliminate the undesired noise from the signal of
interest. Usually low-pass, high-pass, or band-filter is
implemented to eliminate unwanted signal.
In Amplifying stage, the goal is to increase the
resolution of the input signal and increase the Signal-toNoise Ratio (SNR). For example, the output of typical
temperature sensor is in range of few millivolts and it is
most likely too low for ADC to process directly. In
addition, the noise within circuit is typically in range of
few millivolts too, making ADC unable to distinguish
between noise and signal of interest.
Lastly Isolation is a process of converting filtered
& amplified signal to other form such as frequency so to
pass the signal to measurement device without a physical
connection. In uMAVRK module, an Isolation process is
handled by built-in RF transmitter.
4.4 ADC 0820-N
The ADC0820-N uses two 4-bit flash A/D
converters to make an 8-bit measurement . Each flash ADC
is made up of 15 comparators which compare the unknown
input to a reference ladder to get a 4-bit result. To take a
full 8-bit reading, one flash conversion is done to provide
the 4 most significant data bits (via the MS flash ADC).
Driven by the 4 MSBs, an internal DAC recreates an
analog approximation of the input voltage. This analog
signal is then subtracted from the input, and the difference
voltage is converted by a second 4-bit flash ADC (the LS
ADC), providing the 4 least significant bits of the output
data word.
The internal DAC is actually a subsection of the
MS flash converter. This is accomplished by using the
same resistor ladder for the A/D as well as for generating
the DAC signal. The DAC output is actually the tap on the
resistor ladder which most closely approximates the analog
http://www.ijettjournal.org
Page 54
National Conference on Engineering Trends in Medical Science – NCETMS - 2014
input. In addition, the “sampled-data” comparators used in
the ADC0820-N provide the ability to compare the
magnitudes of several analog signals simultaneously,
without using input summing amplifiers. This is especially
useful in the LS flash ADC, where the signal to be
converted is an analog difference.
V. CONCLUSION
We have presented the DSP based stand alone system
design by using digital signal processor as the core
processing unit. The DSP hardware is able to visualize the
tap ECG on the graphical LCD (GLCD) as well as the
digital signal processor is able to capture the tap ECG as
shown on the graphical window in Code Composer 3x/4x.
Nevertheless, this system design has laid the ground work
for standalone operation in ECG monitoring purposes by
using digital signal processor for real time signal
processing.
The hardware system is ready to run any processing
algorithm related to ECG. The algorithm can be
continuously changed and tested to improve system
performance and efficiency.
VI. REFERENCES
[1].Goh Chun Seng*, Sh-Hussain Salleh, J. M. Najeb, I. Kamarulafizam,
Mahyar Hamedi and Alias Md Noor “Design and development of
standalone DSP prototype for QT interval processing and monitoring”
Accepted 30 March, 2012
[2]. Barold, S. and S. J. Norman, “Jeff” Holter Father of ambulatory ECG
monitoring," Journal of Interventional Cardiac Electrophysiology, Vol.
14, No. 2, 117{118, Springer, 2005.}
[3]. Garvey, J. L., ECG techniques and technologies," Emergency
Medicine Clinics of North
America, Vol. 24, No. 1, 209{225,
Elsevier, 2005.
[4].Trusov, A. A., I. Chepurko, A. R. Schofield, and A. M. Shkel. A
standalone programmable signal processing unit for versatile
characterization of MEMS gyroscopes," IEEE Conferences,
2007.
ISSN: 2231-5381
http://www.ijettjournal.org
Page 55
National Conference on Engineering Trends in Medical Science – NCETMS - 2014
Vision Based Hand Gesture Recognition for Robotic
Control
Amol R Gondkar ( M.E Student)
SNJB COE, Chandwad
ISSN: 2231-5381
Sandip D. Sahane (B.E Student)
DBNCOET, Yavatmal
http://www.ijettjournal.org
Page 56
National Conference on Engineering Trends in Medical Science – NCETMS - 2014
FPGA Implementation of Modified Booth
Multiplier
Shaikh Maheboob, Sunil Sakhare,Abhay Kasetwar.
Group Guide, Group Member Electronics &Telecommunication Engg.
Sant Gadge Baba Amravati University (M.S) India.
Abstract— To design a high speed multiplier with reduced
error compensation technique. The fixed-width multiplier
is attractive to many multimedia and digital signal
processing systems which are desirable to maintain a fixed
format and allow a little accuracy loss to output data. This
paper presents the Design of error compensated
truncation circuit and its implementation in fixed width
multiplier. To reduce the truncation error, we first slightly
modify the partial product matrix of Booth multiplication
and then derive an effective error compensation function
that makes the error distribution be more symmetric to
and centralized in the error equal to zero, leading the
fixed-width modified Booth multiplier to very small mean
and mean-square errors. However, a huge truncation
error will be introduced to this kind of fixed-width
modified Booth multipliers. To overcome this problem,
several error compensated truncation circuit approaches
have been proposed to effectively reduce the truncation
error of fixed-width modified Booth multipliers.
Keywords—Arithmetic, Booth Encoder, Compressors, Radix4,VHDL,Xilinx.
I.
INTRODUCTION
High processing performance and low power dissipation are
the most important objectives in many multimedia and digital
signal processing (DSP) systems, where multipliers are always
the fundamental arithmetic unit and significantly influence the
system‟s performance and power dissipation. To achieve high
performance, the modified Booth encoding which reduces the
number of partial products by a factor of two through
performing the multiplier recoding has been widely adopted in
parallel multipliers. Moreover, nxn fixed-width multipliers
that generate only the most significant product bits are
frequently utilized to maintain a fixed word size in these loss
systems which allow a little accuracy loss to output data.
Significant hardware complexity reduction and power saving
can be achieved by directly removing the adder cells of
standard multiplier for the computation of the least significant
bits of 2n-bit output product. However, a huge truncation error
will be introduced to this kind of direct-truncated fixed-width
multiplier (DTFM). To effectively reduce the truncation error,
various error compensation methods, which add estimated
compensation value to the carry inputs of the reserved adder
cells, have been proposed. The error compensation value can
be produced by the constant Scheme. The constant scheme
ISSN: 2231-5381
through had aptively adjusting the compensation value
according to the input data at the expense of a little higher
hardware complexity. However, most of the adaptive error
compensation approaches are developed only for fixed-width
array multipliers and cannot be applied to significantly reduce
the truncation error of fixed-width modified Booth multipliers
directly. To overcome this problem, several error
compensation approaches [1]–[3] have been proposed to
effectively reduce the truncation error of fixed-width modified
Booth multipliers. In [1], the compensation value was
generated by using statistical analysis and linear regression
analysis. This approach can significantly decrease the mean
error of fixed-width modified Booth multipliers, but the
maximum absolute error and the mean-square error are still
large. [2] divided the truncated part of the bit product matrix
of Booth multiplication into a major group and a minor group
depending on their effects on the truncation error. To obtain
better error performance with a simple error compensation
circuit, Booth encoded outputs are utilized to generate the
error compensation value. In [3], a systematic design
methodology for the low-error fixed-width modified Booth
multiplier via exploring the influence of various indices in a
binary threshold was developed to decrease the product error.
The fixed-width modified Booth multipliers in [2] and [3]
achieve better error performance in terms of the maximum
absolute error and the mean-square error when compared with
the previous published multiplier in [1]. However, their mean
errors are much larger than that of [1]. The smaller mean error
and mean-square error represent that the error distribution is
more symmetric to and centralized in the error equal to zero
(denoted as zero error). For many multimedia and DSP
applications, the final output data are produced from
accumulating a series of products rather than from a single
multiplication operation directly. This paper is organized as
follows. In section II, the modifisssssed booth multiplier is
briefly reviewed. The implementation results and outputs are
showed. describes the detailed comparison of booth multiplier
and modified booth multiplier. Finally ,section III concludes
this paper.
II.
PROPOSED LOGIC
Here booth multiplier is going tomodified as Multiplier,
partial product, partial product shifter, adder blocks are
shown in below figure.
http://www.ijettjournal.org
Page 57
National Conference on Engineering Trends in Medical Science – NCETMS - 2014
Fig.1. Block diagram of modified booth multiplier
These problems can be overcome by modified Booth
algorithm. process three bits at a time during recoding.
Recoding the multiplier in higher radix is a powerful way to
speed up standard Booth multiplication algorithm. In each
cycle a greater number of bits
can be inspected and eliminated therefore, total number of
cycles required to obtain products get reduced. Number of
bits inspected in radix r is given by n = 1 + log
Algorithm for modified booth is given below [5]:
In each cycle of radix-4 algorithm, 3 bits are inspected and two
are eliminated. Procedure for implementing radix-4 algorithm
is as follows
Fig .Block diagram of multiplier
Append a 0 to the right of LSB.
Extend the sign bit 1 position if necessary to ensure
that n is even.
According to the value of each vector, find each
partial product.
For example:
Multiplicand: 0110010110101001
Multiplier : 0000111101010101
Product : 0000011000010110101010000001101
A. Booth multiplier
Conventional array multipliers, like the Braun multiplier and
Baugh
Woolly
multiplier
achivecomparatively
goodperformance but they require large area of silicon, unlike
the add-shift algorithms which require less hardware and
exhibit poorer performance. The booth multiplier makes use
of booth encoding algorithm in order to reduce the number of
partial product by considering two bits of the multiplier at a
time ,there by achieving a speed advantage over other
multiplier architectures. This algorithm is valid for both
signed and unsigned numbers. It accept the number in 2s
compliment from, based on radix2 computation
B. Modified booth multiplier
The modified Booth encoding
or
modified Booth
algorithm , was proposed by O. L. Macsorley in 1961 [4].
The recoding method is widely used to generate the partial
products for implementation of large parallel multipliers,
which adopts the parallel encoding scheme. One of the
solutions of realizing high-speed multipliers is to enhance
parallelism, w hich helps to decrease the number of
subsequent stages. The
original version of Booth
algorithm (Radix-2) had two drawbacks.
The number of add subtract operations and the
number of shift operations becomes variable and
becomes inconvenient in designing
parallel
multipliers.
The algorithm becomes inefficient when there are
isolated 1 s.
ISSN: 2231-5381
C. Modified booth encoder
Modified Booth encoding is most often used to avoid variable
size partial product arrays. Before designing a MBE, the
multiplier B has to be converted into a Prior to convert the
multiplier, a zero is appended into the Least Significant Bit of
the multiplier. The figure above shows that the multiplier has
been divided into four partitions and hence that mean four
partial products will be generated using booth multiplier
approach Instead of eight partial products being generated
using conventional multiplier. Zn = -2* Bn+1 + Bn + Bn-1
Let‟s take an example of converting an 8-bit number into a
Radix-4 number. Let the number be -36 = 11011100. Now we
have to append a „0‟ to the LSB. Hence the new number
becomes a 9-digit number that is 110111000. This is now
further encoded into Radix-4 numbers according to the
following given table.
http://www.ijettjournal.org
Page 58
National Conference on Engineering Trends in Medical Science – NCETMS - 2014
generator is designed to produce the product by multiplying
the multiplicand A by 0, 1, -1, 2 or -2. A 5 to 1 MUX is
designed to determine which product is chosen depending on
the M, 2M, 3M control signal which is generated from the
MBE. For product generator, multiply by zero means the
multiplicand is multiplied by “0”.Multiply by “1” means the
product still remains the same as the multiplicand value.
Multiply by “-1” means that the product is the two’s
complement form number. Multiply by “-2” is to shift left one
bit the two’s complement of the multiplicand value and
multiply by “2” means just shift left the multiplicand by one
place.
Table 1: Modified booth encoder
Fig .Block diagram of partial product
Fig..Block diagram of booth encoder
Fig .Example of showing partial product (6-bit)
Fig .Block diagram of booth decoder
The decoder block generates the partial product from the
selector signals that they are generated in encoder block.
Example: Multiplicand = 0110010110101001 Bits = 0110 Out
= 1111001101001010
E. Adder
D. Partial product
Partial product generator is the combination circuit of the
product generator and the 5 to 1 MUX circuit. Product
ISSN: 2231-5381
http://www.ijettjournal.org
Fig .Block diagram of adder
Page 59
National Conference on Engineering Trends in Medical Science – NCETMS - 2014
Adder takes the inputs performs addition operation and
generates sum, carry outputs For example:
Fig 2 Graph representation of modified multiplier and
multiplier
Fig 2 Graph representation of modified multiplier and
multiplier in this graph vertical axis is power consumption,
horizontal axis is complexity. We know from this graph
complexity and power consumption is less in modified booth
multiplier, when compared to multiplier. So, modified
multiplier is used to save power, complexity is reduced, speed
increment can be performed.
III.
CONCLUSION
In this paper, FPGA implementation of modified Booth
multiplier has been proposed. In the proposed multiplier, the
Partial product matrix of Booth multiplication was slightly
modified as booth encoder, decoder, and mix. In booth
encoder, encoding table is derived from the booth multiplier,
according to this table we perform shifting, two’s complement
in new way. So, modified multiplier is used to save power,
complexity is reduced, speed increment can be achieved.
When booth multiplier and modified booth multiplier we can
save the power up to 40% respectively
IV.
REFERENCES
S. J. Joe, M.-H. Tsai and Y.-L. Tsao, “Low-error reduced-w`+idth
BoothMultipliers for DSP applications,” IEEE Trans. Circuits Syst. I,
Fudam.Theory Appl., vol. 50, no. 11, pp. 1470–1474, Nov. 2003.
[2] K.-J. Cho, K.-C. Lee, J.-G. Chung, and K. K. Parhi, “Design of low
errorFixed-width modified Booth multiplier,” IEEE Trans. Very Large Scale
Integr. (VLSI) Syst., vol. 12, no. 5, pp. 522–531, May 2004.
[3] M.-A. Song, L.-D. Van and S.-Y. Kuo, “Adaptive low-error fixed
widthBooth multipliers,” IEICE Trans. Fundamentals, vol. E90-A, no.6, pp.
1180–1187, Jun. 2007
[4] O. L. MacSorley, “High speed arithmetic in binary computers”,
Proc.IRE,vol.49,pp. 67-91, 1961
[5] L.P. Rubinfield, “A proof of the modified Booth s algorithm for
multiplication”,IEEE Trans. Comput., vol. C-24, pp. 1014-1015, Oct.1975.
[1]
Table 2: Parameters comparison
ISSN: 2231-5381
http://www.ijettjournal.org
Page 60
National Conference on Engineering Trends in Medical Science – NCETMS - 2014
“ Mind Reading Computer ”
Priti S.Atkari*1,
Arati R. Ghagre*2, Leena D. Lohakare *3
B.E.2nd yr, Department of Biomedical Engineering ,
Dr.Bhausaheb Nandurkar College of Engineering&Technology,Yavatmal
AbstractMind reading is a type of negative thinking style common among
those with Social anxiety disorder (SAD). When you mind read, you
believe that you know what other people are thinking about you –for
example, that you are socially inept or awkward. Mind reading is a
specific type of "probability overestimation," which is a more general
term for overestimating the likelihood that negative events. It is also
true that when any human being interacts with machines, their mind
states changes and this knowledge can be used by machines to take
that action. With this idea we can make a mind reading computer
which can make his own decision on the bases of human expressions
and gestures. The technology of mind reading by the machines is
called mind reading computer.
synthetic devices, and learning how to control those
devices much the way we control our arms and legs
today. These experiments lend hope that people with
spinal injuries will be able to someday use their brain
to control a prosthetic limb, or even their own arm. A
BMI could, e.g., allow a paralysed patient to convey
her/his intentions to a computer program. But also
applications in which healthy users can benefit from
the direct brain computer communication are
conceivable, e.g., to speed up reaction times.
Keyword: interact with machine, Computer, FNIRS, SAD,
Mind reading is a type of negative thinking
style common among those with Social anxiety
disorder (SAD). When you mind read, you
believe that you know what other people are
thinking about you for example, that you are
socially inept or awkward. Mind reading is a
specific type of "probability overestimation,"
XV.
XIII.
INTRODUCTION
Any human being expresses their feeling and
thoughts with his behaviour, states of mind, face
expressions and gestures. It is also true that when
any human being interacts with machines, their
mind states changes and this knowledge can be used
by machines to take that action. With this idea we
can make a mind reading computer which can make
his own decision on the bases of human expressions
and gestures. The technology of mind reading by the
machines is called mind reading computer. This
technology can create a lot of impact on the present
technology which mind-blind. So it is very good
exercising that when we are not able to take
decision than out machine can take those decision.
The ability to attribute mental state to other from
their behaviour and to use that knowledge to guide
our own action and predict those of is known as
theory of mind or mind reading.
XIV.
BRAIN MACHINE INTERFACE
A brain-machine interface (BMI) is an attempt to
mesh our minds with machines. It is a communication
channel from a human's brain to a computer, which
does not resort to the usual human output pathways as
muscles. It is about giving machine-like capabilities to
intelligence, asking the brain to accommodate
ISSN: 2231-5381
XVI.
MIND READING COMPUTER
A computer that can read human minds has unveiled
by scientist. It translates thought signals into speech
through sensors place on the brain.
XVII.
A COMPUTATIONAL MODEL OF MIND-READING
Drawing inspiration from psychology, computer
`vision and machine learning, the team in the
Computer Laboratory at the University of
Cambridge has developed mind-reading machines
— computers that implement a computational model
of mind-readingto infer mental states of people from
their facial signals. The goal is to enhance humancomputer interaction through empathic responses, to
improve the productivity of the user and to enable
applications to initiate interactions with and on
behalf of the user, without waiting for explicit input
from that user. There are difficult challenges:
http://www.ijettjournal.org
Page 61
National Conference on Engineering Trends in Medical Science – NCETMS - 2014
XVIII.
Fig.1. processing stages in the mind read
Using a digital video camera, the mind-reading
computer system analyses a person’s facial
expressions in real time and infers that person’s
underlying mental state, such as whether he or she is
agreeing or disagreeing, interested or bored,
thinking or confused.Prior knowledge of how
particular mental states are expressed in the face is
combined with analysis of facial expressions and
head gestures occurring in real time. The model
represents these at different granularities, starting
with face and head movements and building those in
time and in space to form a clearer model of what
mental state is being represented. Software from
never vision identifies 24 feature points on the face
and tracks them in real time. Movement, shape and
colour are then analyzed to identify gestures like a
smile or eyebrows being raised. Combinations of
these occurring over time indicate mental states. The
relationship between observable head and facial
displays and the corresponding hidden mental states
over time is modelled using Dynamic Bayesian
Networks. The mind-reading computer system
presents information about your mental state as
easily as a keyboard and mouse present text and
commands. The Affective Computing Group at the
MIT Media Laboratory is developing an emotionalsocial intelligence prosthesis that explores new
technologies to augment and improve people’s
social interactions and communication skills.
WORKING:
ISSN: 2231-5381
FIG.2. FUTURISTIC HEADBAND
The mind reading actually involves measuring the
volume and oxygen level of the blood around the
subject's brain, using technology called functional
near-infrared spectroscopy (fNIRS).
The user wears a sort of futuristic headband that
sends light in that spectrum into the tissues of the
head where it is absorbed by active, blood-filled
tissues. The headband then measures how much
light was not absorbed, letting the computer gauge
the metabolic demands that the brain is making.
The results are often compared to an MRI, but can
be gathered with light weight, non-invasive
equipment.
fig.3. mind reading computer
Wearing the fNIRS sensor, experimental subjects
were asked to count the number of squares on a
rotating onscreen cube and to perform other tasks.
The subjects were then asked to rate the difficulty of
the tasks, and their ratings agreed with the work
intensity detected by the fNIRS system up to 83
percent of the time. "We don't know how specificwe
can be about identifying users' different emotional
states," cautioned Sergio Fantini, a biomedical
engineering professor at Tufts. "However, the
particular area of the brain where the blood-flow
change occurs should provide indications of the
brain's metabolic changes and by extension
workload, which could be a proxy for emotions like
frustration.""Measuring
mental
workload,
frustration and distraction is typically limited to
qualitatively observing computer users or to
administering surveys after completion of a task,
potentially missing valuable insight into the users'
changing experiences. Preliminary results show that
using button-sized sensors, which attach under the
chin and on the side of the Adam's apple, it is
possible to pick up and recognize nerve signals and
patterns from the tongue and vocal cords that
correspond to specific words.
http://www.ijettjournal.org
Page 62
4.
National Conference on Engineering Trends in Medical Science – NCETMS - 2014
ADVANTAGES AND USES
Mind Controlled Wheelchair
This equipment is little different from the BrainComputer Typing machine, this thing works by
mapping brain waves when you think about moving
left, right, forward or back, and then assigns that to
a wheelchair command of actually moving left,
right, forward or back. The result of this is that you
can move the wheelchair solely with the power of
your mind. This device doesn't give you mind
bullets (apologies to Tenacious D) but it does allow
people who can't use other wheelchairs get around
easier. In everyday life, they could even be used to
communicate on the sly - people could use them on
crowded buses without being overheard .The
finding raises issues about the application of such
tools for screening suspected terrorists -- as well as
for predicting future dangerousness more generally.
We are closer than ever to the crime-prediction
technology of Minority Report.The day when
computers will be able to recognize the smallest
units in the English language—the 40-odd basic
sounds (or phonemes) out of which all words or
verbalized thoughts can be constructed. Such skills
could be put to many practical uses. The pilot of a
high-speed plane or spacecraft, for instance, could
simply order by thought alone some vital flight
information for an all-purpose cockpit display.
There would be no need to search for the right dials
or switches on a crowded instrument panel. The
initial success "doesn't mean it will scale up", he
told New Scientist. "Small-vocabulary, isolated
word recognition is a quite different problem than
conversational speech, not just in scale but in kind."
XIX.
APPLICATION:
Help paralytic patient
Help handicapped people
ISSN: 2231-5381
Help comma patient
Help people who cant speak
Can be use for military purposes and sting
operation
Eliminate the capability to lie
Conclusion
Tufts University researchers have begun a threeyear research project which, if successful, will allow
computers to respond to the brain activity of the
computer's user. Users wear futuristic-looking
headbands to shine light on their foreheads, and then
perform a series of increasingly difficult tasks while
the device reads what parts of the brain are
absorbing the light. That info is then transferred to
the computer, and from there the computer can
adjust its interface and functions to each individual.
One professor used the following example of a real
world use: "If it knew which air traffic controllers
were overloaded, the next incoming plane could be
assigned to another controller."
Hence if we get 100% accuracy these computers
may find various applications in many fields of
electronics where we have very less time to react.
FUTURE SCOPE
XX.
XXI.
1.
2.
3.
It is use to control wheelchair by mind
Brain computer typing machine by thinking
about left and right hand movement user
can control the virtual keyboard
REFERENCES
www.eurescom.de/message/default_Dec2004.asp
blog.marcelotoledo.org/2007/10
www.newscientist.com/article/dn4795-nasa-developsmindreading-system
http://bvnunet.com/app/trackback/9540
http://www.ijettjournal.org
Page 63
National Conference on Engineering Trends in Medical Science – NCETMS - 2014
To Study and Analyse Different Type’s of
Multipliers
Amruta Gawande, Priya Berad,Abhay Kasetwar,
1
B.E. final year, EnTc, DBNCOET, Yavatmal, Maharashtra, India – 445001.
B.E. final year, EnTc, DBNCOET, Yavatmal, Maharashtra, India – 445001.
3
Assistant Professor, EnTc, DBNCOET, Yavatmal, Maharashtra, India – 445001.
2
Abstract— There are different entities that one would like to
optimize when designing a VLSI circuit. These entities can
often not be optimized simultaneously, only improve one
entity at the expense of one or more others can be the target.
The design of an efficient multiplier circuit in terms of power,
area, and speed simultaneously, has become a very
challenging problem.
In Very Large Scale Integration, low power VLSI
design is necessary. Multiplication occurs frequently in finite
impulse response filters, fast Fourier transforms, convolution,
and many other important DSP systems.
The objective of a good multiplier is to provide a
physically compact, good speed and low power consuming
chip. To save significant power consumption of a VLSI design,
it is a good direction to reduce its dynamic power that is the
major part of total power dissipation. In this paper, we made
a performance wise comparison of different multipliers. The
booth multiplier will reduce the number of partial products
generated by a factor of 2. The adder will avoid the unwanted
addition and thus minimize the switching power dissipation.
This paper presents study of an efficient implementation of
high speed multiplier like serial multiplier, parallel multiplier,
array multiplier, shift & add multiplier, Booth multiplier.
Here we compare the working of these multipliers in order to
find a better option.
Keywords —Different Multiplier
XXII.
INTRODUCTION
Multipliers play an important role in today’s digital signal
processing and various other applications. With advances
in technology, many researchers have tried and are trying
to design multipliers which offer either of the following
design targets – high speed, low power consumption,
regularity of layout and hence less area or even
combination of them in one multiplier thus making them
suitable for various high speed, low power and compact
VLSI implementation.
The common multiplication method is “add and
shift” algorithm. In parallel multipliers number of partial
products to be added is the main parameter that determines
the performance of the multiplier. To reduce the number of
partial products to be added, Modified Booth algorithm is
one of the most popular algorithms. the amount of shifts
between the partial products and intermediate sums to be
added will increase which may result in reduced speed,
ISSN: 2231-5381
increase in silicon area due to irregularity of structure and
also increased power consumption due to increase in
interconnect resulting from complex routing. On the other
hand “serial-parallel” multipliers compromise speed to
achieve better performance for area and power
consumption. The selection of a parallel or serial multiplier
actually depends on the nature of application. In this
seminar we introduce the multiplication algorithms and
architecture and compare them in terms of speed, area,
power and combination of these metrics.
XXIII.
RELATED WORK
Research of Multiplier in 1951 by Y.Sangmitra it begins
with a multiplication of two no.i.e multiplicand &
multiplier then its result produce the partial product. The
most basic form ofmultiplier consists of forming the
product of two binarynumbers. This may be accomplished
through successive addition and shifts in which each
addition is condition on one of the multipler bit.
Jayasharee
Taralabenchi,kavana
Hegde,Soumya
Hegde,Siddalingesh
S.Navalgund,”Implimentation of binary multiplication
using Booth and Systolic Algorithm on FPGA ,using
VHDL”, International Conference & Workshop on Recent
Trend s in Technology,(TCET) 2012.Compare the power
consumption of the multiplier we find that serial multipliers
consume more power. So where power is an important
criterion there we should prefer parallel multiplier like
booth multiplier to serial multipliers.
High
performance
systems
such
as
microprocessors,digital signal processors, filters, ALU etc.
which is need of hour now days requires a lot of
components. One of main component of these high
performance system is multiplier.
WHAT IS MULTIPLIER?
Multiplication is one of the basic functions used in
digital signal processing (DSP). It requires more hardware
resources and processing time than addition and
subtraction. In fact, 8.72% of all instructions in a typical
processing unit is multiplier. The multiplier is a fairly large
block of a computing system. The amount of circuitry
http://www.ijettjournal.org
Page 64
National Conference on Engineering Trends in Medical Science – NCETMS - 2014
involved is directly proportional to square of its resolution
i.e., a multiplier of size of n bits has O (n2) gate.
The most basic form of multiplier consists of
forming the product of two binary numbers. This may be
accomplished through successive additions and shifts in
which eachaddition is condition on one of the multiplier bit
as shown below:
TYPE OF MULTIPLIERS
Multipliers
are
categorized
relative
to
their
applications, architecture and the way the partial products
are produced and summed up. Based on all these, a
designer might find following types of multiplier
A. SERIAL MULTIPLIER
B. PARALLEL MULTIPLIER
C. ARRAY MULTIPLIER
D. SHIFT AND ADD MULTIPLIER
E. BOOTH MULTIPLIER
A ) SERIAL MULTIPLIER
BASIC OF MULTIPLIER:
1. Basic binary multiplier:
The operation of multiplication is rather simple
in
digital
electronics.
It
has
it’s
origin from the classical algorithm for the product
of two binary numbers. This algorithm uses
addition and shift left operations to calculate the
product of two numbers.
Serial multiplier is the partial products are
added serially then serial adder is used with least hardware.
serial multiplier is used as area and power is of utmost
important and delay can be tolerated . This circuit uses one
adder to add the m * n partial products. The circuit is
shown in the fig. below for m=n=4. Multiplicand and
Multiplier inputs have to be arranged in a special manner
synchronized with circuit behaviour as shown on the
figure. The inputs could be presented at different rates
depending on the length of the multiplicand and the
multiplier. Two clocks are used, one to clock the data and
one for the reset. A first order approximation of the delay is
O (m,n). With this circuit arrangement the delay is given as
D =[ (m+1)n + 1 ] tfa.
2. Partial product generation:
Partial product generation is the very first step in
binary multiplier. These are the intermediate terms
which are generated based on the value of
multiplier. If the multiplier bit is ‘0’, then partial
product row is also zero, and if it is ‘1’, then the
multiplicand is copied as it is. From the 2nd bit
multiplication onwards, eachpartial product row is
shifted one unit to the left as shown in the above
mentioned example.
NEED OF MULTIPLIER
1.
The design of an efficient multiplier circuit
in terms of power, area, and speed
simultaneously.
2.
The need of multiplier is increasing the
high
speed of processor.
ISSN: 2231-5381
Figure1: structure of serial multiplier
http://www.ijettjournal.org
Page 65
National Conference on Engineering Trends in Medical Science – NCETMS - 2014
As shown the individual PP is formed individually. The
addition of the PPs are performed as the intermediate
values of PPs addition are stored in theDFF, circulated and
added together with the newly formedPP.This approach is
not suitable for large values of M or N.
B ) SERIAL/PARALLEL MULTIPLIER
The multiplier uses the serial-parallel method of addition to
calculate the result of multiplying two 8-bit numbers as
shown in figure 2.1 below. The multiplier receives the two
operands A and B and outputs the result C. Operands A and
B are loaded in parallel into 8-bit registers and the result C
is shifted into a 16-bit register. Multiplication begins on the
assertion of a START signal and once the calculation is
complete a STOP signal is asserted.
The serial-parallel multiplier is based on the addition of
bits in the corresponding column of the multiplication
process as shown below. Each column is added in one
clock cycle generating the corresponding bit. The resulting
bit is then shifted into output register. Therefore the entire
multiplication process for the 8 by 8-bit multiplier requires
16 clock cycles to complete the calculation.
Figure2: Structure of Serial/Parallel
C ) ADD AND SHIFT MULTIPLIER
Shift-and-add multiplication is similar to the multiplication
performed by paper and pencil. This method adds the
multiplicand X to itself Y times, where Y denotes the
multiplier. To multiply two numbers by paper and pencil,
the algorithm is to take the digits of the multiplier one at a
time from right to left, multiplying the multiplicand by a
single digit of the multiplier and placing the intermediate
product in the appropriate positions to the left of the earlier
results. As an example, consider the multiplication of two
unsigned 4-bit numbers, 8(1000) and 9 (1001).
The block diagram for the multiplier is shown in figure
below. The first operand, A, is loaded in parallel and the
most significant bit is shifted out during each clock cycle.
Operand B is also loaded in parallel and its value is stored
in the register for the entire multiplication process. The
result C is generated by shifting the added bits of each
column one by one into the resultant register. Therefore
register RA is a parallel load shift register, RB is a parallel
load parallel output register, and RC is a serial input
parallel output register.
ISSN: 2231-5381
In the case of binary multiplication, since the digits are 0
and 1, each step of the multiplication is simple. If the
multiplier digit is 1, a copy of the multiplicand (1*
multiplicand) is placed in the proper positions; if the
multiplier digit is 0, a number of 0 digits (0* multiplicand)
are placed in the proper positions. Consider the
http://www.ijettjournal.org
Page 66
National Conference on Engineering Trends in Medical Science – NCETMS - 2014
multiplication of positive numbers. The first version of the
multiplier circuit, which implements the shift-and-add
multiplication method for two n-bit numbers, is shown in
Figure.
Figure 4. shows the basic steps needed for the
multiplication. The algorithm starts by loading the
multiplicand into the B register, loading the multiplier into
the Q register, andinitializing the A register to 0. The
counter N is initialized to n. The least significant bit of the
multiplier register (Q0) determines whether the
multiplicand is added to theproduct register. The leftshift
ofthe multiplicand has the effect of shifting theintermediate
products to the left, just as when multiplying by paper and
pencil. The right shift of the multiplier prepares the next bit
of the multiplier.
ARRAY MULTIPLIERS:
Figure 3. The first version of the multiplier circuit.
The 2n-bit product register (A) is initialized to 0.
Since the basic algorithm shifts the multiplicand register
(B) left one position each step to align the multiplicand
with the sum being accumulated in the product register, we
use a 2n-bit multiplicand register with the multiplicand
placed in the right half of the register and with 0 in the left
half. Figure 3.12 shows the basic steps needed for the
multiplication.
Array multiplier is well known due to its regular structure.
Multiplier circuit is based on add and shift algorithm. Each
partial product is generated by the multiplication of the
multiplicand with one multiplier bit. The partial product are
shifted according to their bit orders and then added. The
addition can be performed with normal carry propagate
adder. N-1 adders are required where N is the multiplier
length.
Figure 5: Structure of array multiplier
Figure 4. The first version of the multiplication algorithm.
ISSN: 2231-5381
http://www.ijettjournal.org
Page 67
National Conference on Engineering Trends in Medical Science – NCETMS - 2014
significant bit) Q0 of Q register. This is denoted by Q-1. A
and Q-1 are initially set to 0. Control logic checks the two
bits Q0 and Q-1. If the twi bits are same (00 or 11) then all
of the bits of A, Q, Q-1 are shifted 1 bit to the right. If they
are not the same and if the combination is 10 then the
multiplicand is subtracted from A and if the combination is
01 then the multiplicand is added with A. In both the cases
results are stored in A, and after the addition or subtraction
operation, A, Q, Q-1 are right shifted. The shifting is the
arithmetic right shift operation where the left most bit
namely, An-1 is not only shifted into An-2 but also remains
in An-1. This is to preserve the sign of the number in A and
Q. The result of the multiplication will appear in the A and
Q.
Product(a*b)
Although the method is simple as it can be seen
from this example, the addition is done serially as well as
in parallel. To improve on the delay and area the CRAs are
replaced with Carry Save Adders, in which every carry and
sum signal is passed to the adders of the next stage. Final
product is obtained in a final adder by any fast adder
(usually carry ripple adder). In array multiplication we need
to add, as many partial products as there are multiplier bits.
BOOTH MULTIPLIER
It is a powerful algorithm for signed-number
multiplication, which treats both positive and negative
numbers uniformly. For the standard add-shift operation,
each multiplier bit generates one multiple of the
multiplicand to be added to the partial product. If the
multiplier is very large, then a large number of
multiplicands have to be added. In this case the delay of
multiplier is determined mainly by the number of additions
to be performed. If there is a way to reduce the number of
the additions, the performance will get better.
Booth algorithm is a method that will reduce the number of
multiplicand multiples.The multiplicand and multiplier are
placed in the m and Q registers respectively. A 1 bit
register is placed logically to the right of the LSB (least
ISSN: 2231-5381
Design issues:
Booth's algorithm can be implemented in many ways. This
experiment is designed using a controller and a datapath.
The operations on the data in the datapath is controlled by
the control signal received from the controller. The
datapath contains registers to hold multiplier, multiplicand,
intermediate results, data processing units like ALU,
adder/subtractor etc., counter and other combinational
units. Following is the schemetic diagram of the Booth's
multiplier which multiplies two 4-bit numbers in 2's
complement of this experiment. Here the adder/subtractor
unit is used as data processing unit.M, Q, A are 4-bit and
Q-1 is a 1-bit rigister. M holds the multiplicand, Q holds
the multiplier, A holds the results of adder/subtractor unit.
The counter is a down counter which counts the number of
operations needed for the multiplication. The data flow in
the data path is controlled by the five control signals
generated from the controller. these signals are load (to
load data in registers), add (to initiate addition operation),
http://www.ijettjournal.org
Page 68
National Conference on Engineering Trends in Medical Science – NCETMS - 2014
sub (to initiate subtraction operation), shift (to initiate
arithmetis right shift operation), dc (this is to decrement
counter). The controller generates the control signals
according to the input received from the datapath. Here the
inputs are the least significant Q0 bit of Q register, Q-1 bit
and count bit from the down counter.
IMPLICATION
1. Multipliers
are
extensively
used
in
microprocessor, DSP and communication
applications.
2. Higher throughput arithmetic operations are
important to achive the desired performance in
many real time signal and image processing
application.
3. Multiplier used in the biomedical signal
processing.
4. Multipliers are now required in cryptographic &
error correction circuit.
CONCLUSION
This paper gives a clear concept of different
multipliers.Multipliers are one the most important
componentof many systems. Different multipliers are
compared from the result of power consumption and total
area.
Multipliers are used to speed up the calculation
and makes the system faster.
Performance of multipliers is one of the most
important aspect in the system performance. So always
there is a great need to find a better solution in case of
multipliers. Thegreat research is going on for finding the
multipliers that consume less power with maintaining the
speed of operation.
REFERENCES
ADVANTAGE OF MULTIPLIER
[1] Pooya Asadi, “A New Optimized Tree Structure in High-Speed
Modified Booth Multiplier Architecture”, American Journal of Scientific
Research, ISSN 1450-223X Issue 52 (2012), pp. 48-56.
1.
In VLSI system used in different
multiplier to reduce the partial product &
delay.
[2] Leonardo L.de Oliveira, Eduardo Costa, Sergio Bampi, João Baptista
and José Monteiro, “Array Hybrid Multiplier versus Modified Booth
Multiplier: Comparing Area and Power Consumption of Layout
Implementations of Signed Radix-4 Architectures”, IEEE, 2004.
2.
Booth algorithm is a method that will
reduce the number of multiplicand
multiples.
3.
Booth multiplier is faster than other
multiplier.
It is the powerful algorithm for sign
number multiplication, which treats both
positive & negative uniformly.
[3] Jayashree Taralabenchi, Kavana Hegde, Soumya Hegde , Siddalingesh
S. Navalgund, “Implementation of Binary Multiplication using Booth and
Systolic Algorithm on FPGA using
VHDL”, International Conference & Workshop on Recent Trends in
Technology, (TCET) 2012.
4.
[4] Y. Sangamitra, “High-Accuracy Fixed-Width Modified Booth
multipliers For Lossy Applications”, International Journal of
Communications and Engineering, Volume 01–
No.1,Issue: 01
March2012.
.
ISSN: 2231-5381
http://www.ijettjournal.org
Page 69
National Conference on Engineering Trends in Medical Science – NCETMS - 2014
“Wirelessly Powered and Remotely Controlled mm Sized
Locomotive Implant’’
DilshadPathan*1
DikshaTorve*2
1#
(Biomedical engineering department, DBNCOET, Yavatmal/ SGBAU, Amravati,(MH),India)
2#
(Biomedical engineering department, DBNCOET, Yavatmal/ SGBAU, Amravati,(MH), India)
ABSTRACT:The implantable device that is wirelessly powered and
controlled for locomotion in a fluid medium is presented. To
improve in an order of magnitude for existing methods in
terms of thrust conversion efficiency, the two scalable lowpower propulsion methods are described. The wireless
prototype occupies 0.6mm×1mm in 65 nm CMOS with an
external 2mm×2mm receiver antenna. The IC consists of a
matching network, a rectifier, a bandgap reference, a
regulator, a demodulator, a digital controller, and highcurrent drivers that interface directly with the propulsion
system. It receives 500 µW from a 2 W 1.86 GHz power signal
at a distance of 5 cm. Asynchronous pulse-width modulation
on the carrier allows for data rates from 2.5–25 Mbps with
energy efficiency of 0.5 pJ/b at 10 Mbps. The received data
configures the propulsion system drivers, which are capable of
driving up to 2 mA at 0.2 V and can achieve speed of 0.53
cm/sec in a 0.06 T magnetic field.
Keywords —Biomedical telemetry,implantable biomedical
devices, low power, micro-scale fluid propulsion, noninvasive, wireless health monitoring, wireless powering.
IntroductionInvention in implantable devices that are capable of in vivo
controlled motion can serve a variety of existing applications, and
they also open up new possibilities for emerging non-invasive
medical technologies. Drug delivery is an especially attractive
application, as drugs can be precisely targeted to problematic
regions with minimal disturbance to the rest of the body.
Additionally, precision guidance through fluid cavities
couldenhance both endoscopic and cardiac procedures that
currently rely on catheter systems, such as angioplasty and
coronary stent treatments, cardiac arrhythmia ablation surgeries,
and diagnostic techniques like endo-myocaridial biopsies. Heart
disease is the leading cause of death, and this technology could
improve the effectiveness of these procedures as well as reducing
costs. with this enhancements and cost reductions ,it is possible
to develope new non- invasive procedures for cardiac care or
endoscopy that can aid in prevention, early detection, and
treatment of a variety of conditions.fig1shows the conceptual
operation of the prototype travelling through the bloodstream
with MHD propulsion.
Fig.1conceptual operation of the divice in the blood stream
The section I present the analysis and stimulation of the fluid
propulsion method best on Lorentz forces.section II Describes the
design of the wireless power transmission system.
III. ELECTROMAGNETIC PROPULSION
Propulsion for implantable devices has not been possible
because of the high power requirement for mechanical de- signs,
and the high complexity of passive magnetic designs. Our prior
work based on Lorentz forces demonstrates two methods with
significant advantages over existing techniques in terms of power
efficiency, scalability, and controllability . The first method drives
current directly through the fluid usingmagneto-hydrodynamic
(MHD), and the second switches current in a loop of wire to
oscillate the device, which experiences asymmetric drag fluid
forces. In both methods, the force is proportional to current, and
therefore maximizing current will maximize the speed. Fig.2
shows the operation of magneto-hydrodynamic(MHD)
Propulsion.
Fig.2 operation of magneto-hydrodynamic (MHD) propulsion
A. Magneto-hydrodyanmic (MHD) Propulsion
MHD propulsion drives electric currents through fluids, so the
efficiency of this method depends on the fluid conductivity. The
basic principle of motion is described in Fig. 2. The conductivity
of The thrust force for MHD propulsion is the Lorentzforce on the
ISSN: 2231-5381
http://www.ijettjournal.org
Page 70
National Conference on Engineering Trends in Medical Science – NCETMS - 2014
current flowing through the fluid. These forces are given in the
equation below, where I is the current in the wire, L is a vector
denoting the length and direction of the wire, and B is the
background magnetic field:
F=IL×B
II. WIRELESS CHIP ARCHITECTURE
The purpose of the chip was to create a wireless prototype that
demonstrates the effectiveness of the propulsion system at the
mm-scale. The specifications were derived from the requirements
of the propulsion methods, which need approximetly 1mA of
current for cm/sec speeds. network, a charge- pump connected
rectifier, a regulator, a bandgap reference circuit, a demodulator,
a digital controller, and configurable electrode drivers. There are
no external components except for the receiving antenna.
A. Antenna and Matching Network
The antenna dominates the size of the prototype, and is
implemented with a 2mm×2mm loop on a PCB using Rogers 4350
substrate. External components are not possible due to size
constraints, so a balanced L-match consisting of only capacitors
was implemented because on-chip inductors have significant loss
and occupy large area
Fig. Integrated circuit architecture
A. Wireless Power Transmission
The transmitter consists of a signal generator , a highfrequency amplitude modulator, a power amplifier, and a
4cm×4cm loop antenna fabricated on PCB. The IC was wire
bonded to a 2mm×2mm antenna fabricated on a Rogers 4350
substrate to minimize RF losses. The measurements are shown in
fig4.
B. Start-up and Power-on Reset Circuits
Start-up circuitry for the initial power-on is necessary to
ensure that the antenna impedance maintains a match and that
the chip enters a knownstate. A start-up 1network that turns on a
pass transistor for the digital supply voltage is shown in
C. Power Management
When the antenna receives 500 µW, the RF input voltage to the
rectifier is 350 mV. Conventional diode-capacitor ladder rectifiers
suffer from low efficiency at low input voltage. Therefore, chargepump connected self-driven synchronous rectifiers (SDSR) based
on] are used with low-VT Devices.
Fig4 -Measured link gain in air and water
D. Clock and Data Recovery
The low modulation depth and fluctuating input power make it
impossible to use a fixed reference voltage for the ASK threshold
detector. Instead, a dynamic reference voltage is generated
concurrently with envelope detection
E. Controller
The digital controller receives data and clock signals from the
demodulator, and configures the propulsion system drivers and
the adaptive loading network. Data transmission begins with a 5bit prefix that, when received, enables a shift register to begin
accepting the 55-bit data packet
B. ASK-PWM Data Transfer
C. Fluid Propulsion
The IC was designed to function with either of the described fluid
propulsion mechanisms. The chip and receive antenna are
encapsulated in RF-transparent epoxy to protect them from the
fluid. The leads from the electrodes are exposed to adapt the
device for use with either of the fluid propulsion methods.
F. Configurable High-Current Drivers
The chip has 6 high-current electrode drivers with configrable
strength to accommodate both propulsion mechanisms. Each of
the drivers can be independently set to propulsion from the
fristrectifire, ground, or left floating.
I V. EXPERIMENTAL VERIFICATION
The Experimental test verified all the elements of the design
including wireless power transmission, the ASK-PWM data
transfer the analog and digital Circuitry ,and the two propulsion
schemes.
ISSN: 2231-5381
The setup for asymmetric fluid drag propulsion is verysimilar to
MHD propulsion. The device is connected to 40loops of wire,
which are oriented to oscillate it. The prototypehas an attached
fin that experiences asymmetric fluid dragwhen oscillating. By
changing the orientation of the magneticfield, the device can
http://www.ijettjournal.org
Page 71
National Conference on Engineering Trends in Medical Science – NCETMS - 2014
oscillate along the surface of the water, orinto and out of the
water.
V.
CONCLUSION
In this work, we have demonstrated a fully wireless 3mm×4mm
prototype capable of controlled motion in a fluid environment,
requiring only a static background magnetic field generated from
permanent magnets. The device is wirelessly powered and
operates with approximately 250 µW, and travels controllably at
0.53 cm/sec in a 0.06 T field. Additionally, data transfer is fast
and efficient, achieving rates of 25 Mbps and consuming only 0.5
pJ/bit at 10 Mbps. These devices can serve as a versatile tool for
a variety of medical treatments that require precise guidance
including drug delivery, diagnostics, and cardiac catheter
treatments..
REFERENCE
[1] S. Tamaz, R. Gourdeau, A. Chanu, J.-B. Mathieu, and S. Martel,“Realtime MRI-based control of a ferromagnetic core for
endovascularnavigation,” IEEE Transactions on Biomedical Engineering,
vol. 55,no. 7, pp. pp. 1854 – 1863, 2008.
[2] B. Nelson, “Towards nanorobots,” Solid-State Sensors, Actuators
andMicrosystems Conference. TRANSDUCERS 2009.International,
pp.2155–2159, June 2009.
[3] D. Pivonka, A. S. Y. Poon, and T. H. Meng,“Locomotive microimplantwith active electromagnetic propulsion,”Proc. IEEE Engineering
inMedicine and Biology Society Annual Intl. Conference (EMBC),
Minneapolis,MN, USA, pp. 6404–6407, Sept. 2009.m/v cmos voltage
reference circuit
[4] D. Pivonka, T. Meng, and A. Poon, “Translating electromagnetic
torqueinto controlled motion for use in medical implants,” in
Engineeringin Medicine and Biology Society (EMBC), 2010 Annual
InternationalConference of the IEEE, 31 2010-sept. 4 2010, pp. 6433 –
6436Fig.-Spectrum of the 1.86 GHz carrier modulated at 9%
depth with an 8.3MHz clock.
ISSN: 2231-5381
http://www.ijettjournal.org
Page 72
National Conference on Engineering Trends in Medical Science – NCETMS - 2014
Alive Human Detector
Preeti Kale1, Priyanka Bhave2, Rajesh Kshirsagar3
1
B.E. final year, EnTc, DBNCOET, Yavatmal, Maharashtra, India – 445001.
B.E. final year, EnTc, DBNCOET, Yavatmal, Maharashtra, India – 445001.
3
Assistant Professor, EnTc, DBNCOET, Yavatmal, Maharashtra, India – 445001.
2
Abstract— Natural calamities do occur and they are
unstoppable. But humans are becoming increasingly aware in the
concept of intelligent rescue operations in such calamities so that
precious life and material can be saved though calamities cannot
be stopped. Still there are lots of disasters that occur all of a
sudden and Earthquake is one of such things. Earthquakes
produce a devastating effect and they see no difference between
human and material. Hence a lot of times humans are buried
among the debris and it become impossible to detect them. A
timely rescue can only save the people who are buried and
wounded. Detection by rescue workers becomes time consuming
and due to the vast area that gets affected it becomes more
difficult. So the concept proposed helps in identifying the position
of alive people and rescue operations.
A hardware prototype of the life detection system has
been developed and experimental results show that the proposed
method is cost effective and efficient method which not only
detects life signals but also the identifies people in a given area, to
facilitate rescue team operations in case of emergencies. By the
advent of this system, the world death rate as a cause of natural
disasters like earthquake may decrease to greater extent. In line
with this philosophy, one of the most challenging parts of this
project is to find a lightweight and low cost solution that can fit
on human body.
Keywords —life detection, alive human detector, USART, FLIR.
XXIV. INTRODUCTION
There are many different kinds of catastrophe in
natural and man-made disaster like earthquake, flooding,
hurricane and they cause different disaster area like collapsed
building, landslide or crater. During these emergency
situations, and especially in urban disaster, many different
people are deployed (policeman, fire fighters and medical
assistance). They need to cooperate to save lives, protect
structural infrastructure, and evacuate victims to safety. In
these situations, human rescuers must make quick decisions
under stress, and try to get victims to safety often at their own
risk. They must gather determine the location and status of
victims and the stability of the structures as quickly as
possible so that medics and fire fighters can enter the disaster
area and save victims. All of these tasks are performed mostly
by human and trained dogs, often in very dangerous and risky
situations. This is why since some year; mobile robots have
been proposed to help them and to perform tasks that neither
human dogs nor existing tools can do. For this project, we will
focus only sensors which will work in a disaster environment
ISSN: 2231-5381
of manmade structure, like collapsed buildings. They are
called Urban Search and Rescue operation.
There are several teams working on Human body.
Currently, Mellon University is being found by the National
Science Foundation to investigate the use of semi-autonomous
robots for urban search and rescue. These Sensors will assist
firemen, police, and disaster agencies with reconnaissance,
site evaluation, and human detection. The goal of this research
is to develop hardware sensors and software systems (user
interfaces and navigation, planning and coordination module)
to support these tasks. Compare to the other projects, Team is
capable of navigating the difficult terrain of a disaster site but
lacks sensors for victim detection. The contribution of this
work is to provide a sensor suite for human detection in the
urban disaster environment.
The philosophy of the USAR project at Carnegie
Mellon is that the robot team should be low cost, semiautonomous, heterogeneous, and work together under a human
coordinator. In line with this philosophy, one of the most
challenging parts of this project is to find a lightweight and
low cost solution that can fit on human body. Conditions in a
disaster area are extreme with many unknown parameters.
Victims may be covered in debris, trapped in voids, or
entombed, making it difficult to find them and determine their
state of health. This is why it will be important to choose a set
of different sensors which are complementary and able to
operate in these conditions.
The selected sensors will be integrated with military.
This involved developing hardware and low level data
acquisition software solutions. Tests will be used to determine
the robustness, limitations, and accuracy of each sensor and
this data will be used to develop a comprehensive system that
fuses the information from all the sensors to determine the
location and probability of human presences.
XXV. LITERATURE REVIEW
In this section, we will discuss the work done in the
area of human detection so far. Many universities in USA,
Japan and Europeare purchasing urban search and rescue
robotics. Three of the most advanced research teams are
discussed in this paper:
A. CRASAR (Centre for Robot-Assisted Search and Rescue)
Steve Burien suggested on Human Detection for
Robotic Urban Search and Rescue university of South Florida
That is may be the most advanced project for a search and
http://www.ijettjournal.org
Page 73
National Conference on Engineering Trends in Medical Science – NCETMS - 2014
rescue robot [1]. The aim of this robot is to help the first-aid
workers by giving them a picture of a place that they cannot
reach. So they can see the environment, see if there are
victims, or something else. This robot was used for first time
in real conditions on 11th September 2001 in the World Trade
Center disaster [1].
Developing snake robots for exploration of small space in
disaster sites. They are designed so that they can be
dismantled into many parts for transportation to the site
though their mobility in a disaster area is somewhat limited.
The snake robots are equipped only with a camera and
microphone and do not seek to detect victims autonomously.
C. iRobot:
US Government developed some robots which
replace the human in several interventions, when it is too
dangerous or too small to enter. They have many different
projects. Some robots are used exploration in urban or outside
places. Jackpot robot for example has an aluminium body and
it has different sensors like, cameras, microphones, laser range
finders, Sonar and IR sensors [6].
Fig.1: Jackpot robot after the World Trade Centre
This robot use different sensor like millimeter wave
radar for measuring distance, a camera for vision and a
forward-looking infrared camera (FLIR) for the human heat
detection [7]. Another new sensor has just been implemented
on this robot recently. This is aSpO2 sensor to measure the
oxygen quantity in blood. Then the user will be able to know
if the victim is still alive. This robot is totally operated with a
human. It sends its information to the user to allow him to take
decision and to drive the robot in an interesting place.
B. Utility Vehicle for Search:
Researchers from Kobe University have several
homogeneous small robots that can link together to form a
large robot in order to climb large obstacles. Most of their
research appears to be focused [2] on large scale coordination
efforts such as disaster relief after the Hanshin-Awaji
Earthquake that hit Kobe City in 1995 refer in [2]. They have
also developed a simulator for Robot Cup-Rescue Simulation
league emphasizes coordination rather than victim detection
and issues individual robots must solve.
Fig. 3: Robots from iRobot
Another project is deployed, which has a team of
little robots that it can place where it wants. This robot has the
calculation power of a big robot and the flexibility and
mobility of little ones .In the future, these robots will help
victims and give them the first aid rescue, like give morphine
using an auto-injector or information via a bilateral radio [3].
D. Urban robot:
In the NASA’s Jet Propulsion laboratory, they have
done some research to avoid earthquake for an urban robot
with different sensors mounted on it (stereo camera, IR
distance sensor, GPS) in [4].
XXVI. METHODOLOGY
This project consists of three main parts. The first
step is to determine the state of the art in which special
emphasis is given on sensors for victim detection. Next, a set
of appropriate and complementary sensors are selected in
Fig. 2: Utility Vehicle for Search
ISSN: 2231-5381
http://www.ijettjournal.org
Page 74
National Conference on Engineering Trends in Medical Science – NCETMS - 2014
accordance with chosen criteria mainly that the sensors have
to be low-cost and lightweight.
Fig. 5 shows the block diagram of the proposed
methodology.
Fig 5.Alive human detector
The Alive human detector work on three main sections
these are as:
A. Input section:
In an input section, the temperature transducer is
used to detect the temperature of human body. After detecting
the temperature, Wheatstone bridge changes the resistance
according to which current and in voltage parameter changes.
These parameters are applied to thefilter circuit to convert
them into acceptable input for ADCwhich converts them into
digital form. For this purpose, we need ADC of PIC
microcontroller.
Analog-to-digital conversion is an electronic process
in which a continuously variable signal is changed, without
altering its essential content; into a multi-level (digital) signal.
The input to an analog-to-digital converter (ADC) consists of
a voltage that varies among a theoretically infinite number of
values. Examples are sine waves, the waveforms representing
human speech, and the signals from a conventional television
camera. The output of the ADC, in contrast, has defined levels
or states. The number of states is almost always a power of
two -- that is, 2, 4, 8, 16, etc. The simplest digital signals have
only two states, and are called binary. All whole numbers can
be represented in binary form as strings of ones and zeros.
Microcontroller executesthe program of transmission of serial
data over a long display communication by usingUSART
microcontroller and GSM module.
B. Monitor Section:
In a monitor section, we are able to display
temperature of human body in simple visualBasic display
software of GSM module.GSM (Global System for Mobile
Communications) is a low-cost hardware equipment to create
a system for remote monitoring and remote control. The
system can be controlled and monitored via Short Message
Service (SMS) from anywhere that covered by GSM (Global
System for Mobile Communications) service.
ISSN: 2231-5381
A GSM network is composed of several functional
entities, whose functions and interfaces are of a generic GSM
network. The GSM network can be divided into three broad
parts. The Mobile Station is carried by the subscriber. The
Base Station Subsystem controls specified. Figure 1 shows the
layout the radio link with the Mobile Station. The Network
Subsystem, the main part of which is the Mobile services
Switching Center (MSC), performs the switching of calls
between the mobile users, and between mobile and fixed
network users. The MSC also handles the mobility
management operations.
C. Detection Section:
In this section, we are able to detect whether the body
is alive or not. The mic (work as a sound transducer) converts
sound heart beat of human body into electrical signal which is
very low frequency signal. So we need amplifier for this
process. This signal applied to the opt coupler used as a
comparator. When signal, received from amplifier, is 0v; then
opt coupler output is 0V.When the signal received from
amplifier circuit is more than 0V up to the +5V, comparator
output is high. Output of comparator also needs to connect in
the form of digital signal that’s why the signal is applied to
ADC through multiplexer. Again the PIC microcontroller
executes the data transmission program and transmits this data
via USART to GSM module display.
A Universal Asynchronous Receiver/Transmitter,
abbreviated UART is a piece of computer hardware that
translates data between parallel and serial forms. UARTs are
commonly used in conjunction with communication standards
such as EIA, RS-232, RS-422 or RS-485. The universal
designation indicates that the data format and transmission
speeds are configurable. The electric signaling levels and
methods are handled by a driver circuit external to the UART.
The Universal Asynchronous Receiver/Transmitter
(UART) takes bytes of data and transmits the individual bits
in a sequential fashion. At the destination, a second UART reassembles the bits into complete bytes. Each UART contains a
shift register, which is the fundamental method of conversion
between serial and parallel forms. Serial transmission of
digital information (bits) through a single wire or other
medium is less costly than parallel transmission through
multiple wires.In UART is transmitting and received data
simultaneously by using transmitting and received pin of
microcontroller. In a transmitting pin of transfer data and
receiving pin of received data. Time to handle an interrupt
from the UART and prevents loss of received data at high
rates.[5]
D. GPS AND GSM SECTION:
The GPS module is used to detect the position of
human body (soldier). It displays the location of longitude and
latitude on LCD display. In this way, the human body is
detected at any position using this module.On first section
we can detect the temperature of human body and display it on
http://www.ijettjournal.org
Page 75
National Conference on Engineering Trends in Medical Science – NCETMS - 2014
LCD screen and in third section we can detect the position of
human body using GPS satellite communication.
The following figure shows the interfacing of GSM
module with PC computer port.
orbiting the Earth at height of 20,180kmon 6 different orbital
planes. Their orbits are inclinedat55° to the equator, ensuring
that list 4 satellites are in radio communication with any point
on the planet. Each satellite orbit The Earth in approximately
12 hours and has four atomic clocks on board. During the
development of the GPS system, particular Emphasis was
placed on the following three aspects: [8]
1. It had to provide users with the capability of determining
position, speed and time, whether in motion Orates.
2. It had to have a continuous, global, 3-dimensional
positioning capability with a high degree of accuracy,
irrespective of the weather.
3. It had to offer potential for civilian use.
XXVII. APPLICATIONS
Fig.6. Interfacing GSM modem to PC computer port
GSM modem is interfaced with PC computer port
through expansion slot of the motherboard of computer
peripheral.GSM module work on a +5v and computer system
work on +12v power supply. That’s why it needs to isolate the
voltage of for MAX232 to shift the voltage +5v for GSM
module and +12v for computer system. For proper
transmission and reception of serial communicated data in
between computer and GSM modules.
The Global Positioning System (GPS) is a spacebased satellite navigation system that provides location and
time information in all weather conditions, anywhere on or
near the Earth where there is an unobstructed line of sight to
four or more GPS satellites. Using the Global Positioning
System (GPS, a process used to establish a position at any
point on the globe)
The Following two values can be determined anywhere on
Earth.
1. One’s exact location (longitude, latitude and height coordinates) accurate to within a range of 20m to approx. 1mm.
2. The precise time (Universal Time Coordinated, UTC)
accurate to within a range of 60ns to approx.5ns. Speed and
direction of travel (course) can be derived from the coordinates as well as the time. The coordinates and time values
are determined by 28 satellites orbiting the earth.
GPS receivers are used for positioning, locating,
navigating, surveying and determining the time and are
Employed both by private individuals (e.g. for leisure
activities, such as trekking, balloon flight sand cross country
Skiing etc.) And companies (surveying, determining the time,
navigation, vehicle monitoring etc.). GPS (the full
descriptions: Navigation System with Timing and Ranging
Global Positioning System, NAVSTARGPS) was developed
by the U.S. Department of Defences (DOD) and can be used
both by civilians and military personnel. The civil signal SPS
(Standard Positioning Service) can be used freely by the
general public, whilst the Military signal PPS (Precise
Positioning Service) can only by authorized government
agencies. The first Satellite was placed in orbit on 22nd
February 1978, and there are currently 28 operational satellites
ISSN: 2231-5381
The proposed alive human detector can be used in various
fields. Some of the advantages are discussed below:
A. Military Services :
Alive human detector is a system useful for military
services for detection of human body and check the exact
position of body using GPS.
B. In Chemical factory :
In chemical factory, when this module which will connect
to body then after any difficulty we will detect how many
body alive or not.
XXVIII. ADVANTAGES
A. It is small unmanned fully autonomous & a light
weight system and therefore it can be fielded in
narrow passage very easily as it is futilely
autonomous no controlling is required.
B. Due to its light weight power requirements are less
and easy to carry. Its microcontroller based circuitry
makes it simple and compact and provides more
flexibility as in future if any change is required then
only by changing the program its functionality can be
changed.
C. All through low cost standard processing hardware
was chosen. It performs well and is capable of doing
work efficiently.
D. It has caterpillar type wheel arrangement it help in
the movement of the vehicle in rough terrain. Also its
turning radius is very small.
XXIX.
CONCLUSION AND FUTURE SCOPE
In this way the contribution of this work is to provide
a sensor suitable for human detection in the urban disaster
environment. One of the most challenging parts of this project
is to find a lightweight and low cost solution. Hence we will
detect the alive human body.
http://www.ijettjournal.org
Page 76
National Conference on Engineering Trends in Medical Science – NCETMS - 2014
Hence many life’s can be saved by using this
autonomous module during an earthquake disaster in a short
duration which becomes time consuming and unaffected if
done manually. This module can be improved by using high
range sensors and high capacity motors. Some more sensors
like mobile phone detector, metal detector etc. can be
implemented to make this vehicle more effective.
ACKNOWLEDGMENT
We avail this opportunity to express our deep sense of
gratitude and whole hearted thanks to Head of the
Department,
Electronics
and
Tele-communication
Engineering, Prof. S. A. Chavan for their invaluable guidance
and encouragement to embark this paper.
We are thankful to whose esteemed suggestions and
encouragement from time to time have always been
unparalleled stimuli for us to travel eventually towards
completion of this seminar.
We also put sincere thanks to Dr. V. G. Arajpure
(Principal DBNCOET Yavatmal) for constant motivation and
providing necessary infrastructure.
REFERENCES
Institute Production Robotique (IPR)LSRO2 – VRAI-Group
“Human Detection for Robotic Urban Search and Rescue” Steve
BurienMicro technique February 2004 Steve Burien.
2) International Journal of Business Intelligent “Live Human
Detecting Robot
for
Earthquake Rescue Operation”
Mrs.Vijayaragavan Assistant Professor (Electrical &Electronics
Engineering) Baath University.
3) Alive Human Detector.pdf
4) Design and implementation of human alive detector using PIR
sensor.”Viswanath K.Reddy
5) J. Casper and R. Murphy, "Workflow Study on Human-Robot
Interaction in USAR", ICRA2002, pp 1997-2003
6) J. Casper “Human-Robot Interactions during the Robot-Assisted
Urban Search AndRescue Response at The World Trade Canter’s
Thesis, Computer Science and Engineering USF, South Florida,
2002.
7) Chen KM, Huang Y, Zhang JP, Norman A, “RF life detection
Systems for searching human being”, IEEE Transaction on
biomedical engineering, Pages 105-114, JAN 1991
www.alldatasheet.com/ULN2003/TEXAS
8) Global Positioning System (GPS) Resources by Sam Worley, Iowa
State University
http://www.cnde.iastate.edu/staff/swormley/gps/gps.html
1)
ISSN: 2231-5381
http://www.ijettjournal.org
Page 77
National Conference on Engineering Trends in Medical Science – NCETMS - 2014
Survey on different Biomaterial and
Biomechanical stents that the during airway
Obstruction
Snehal D. Gulhane#1, Sonali H. Gajbhiye#2,
#
B.E 2ndyr, Department of Biomedical Engineering,
Dr. Bhausaheb Nandurkar College of Engineering and TechnologyYavatmal
Maharashtra, India.
II.
Abstract
Airway and coronary arteries can be obstructedby a variety
of diseases. Airway are mainly obstructedby lung cancer,
scar inflammation or weakening of the airway wall .the
main cause of cholesterol in the human body. The aim of
the presented work was determination of the biomechanical
characteristics of the vascular stent maid of stainless steel
(cr-ni-mo) and co- cr- w-ni alloy. In order to determine the
strength characteristics of the analyzed stent the finite
element method was applied. Geometrical model of the
vascular stent, which was meshed with the use of the
SOLID95 element was worked out. Although their success
has been outstanding, the patients that have received stents
are vulnerable to thrombosis and rest enosis. Appropriate
solution were suggestion provided to overcome the
difficulties of the patient.
Keyword: stents, chromium-cobalt, stainless, steel,
radioactive stents, friction in stents
I.
INTRODUCTION
Stents are generally used instead of – or along
with –angioplasty. In recent years a dynamic
development in diagnostics of vascular
diseases, as well as in operational procedures,
was observed. Even though, this should be
clearly mentioned that operational procedures
on arteries are palliative procedure operations
only. It is collapsed into a small diameter and
put over a balloon catheter. It is moved into the
area of the blockage. The coronary stents are
mainly made of metallic biomaterials (stainless
steel, Co-Cr-W-Ni and Ni-Ti alloys). The four
main biomaterials that are used to make stents
are Stainless SteelCobalt Chromium, Tantalum
and Nitinol. The purpose of this article is to
study these different materials. Implantation of
stent is a minimally invasive procedure. During
the angioplasty procedure, a thin tube called a
catheter is placed through the groin or arm and
passed through an artery to the site of the
blockage.
ISSN: 2231-5381
RADIOACTIVE STENTS
Radioactive stents have been shown to inhibit
recurrentblockage of arteries (rest enosis)
following angioplasty.This article investigates
alternative methods to produce calibration
technique for the stents related to
nationalstandards. In order to provide accurate
clinical dosimeter, calibration of these sources
is required. Air kerma strength this calculated
after charge is collected in an ionization
chamber at consecutive distances from a
stationary source, known as the "seven
distance technique". This technique has been
extended to a Low Dose Rate (LDR) 192Ir
source in preparation to measure the 198Au
stents. The emitted gamma ray energies are
similar for these two isotopes,(198Au
E(gamma) = 405 keV and 192Ir E(gamma) =
397keV) so this should be an effective
calibration tool for198Au radioactive stents.
Fig. 1 Radioactive Stents
III.
FRICTION IN STENTS
Friction is a component in stents that can be an
advantage and a disadvantage. First because
friction can be good so that it doesn’t slide
http://www.ijettjournal.org
Page 78
National Conference on Engineering Trends in Medical Science – NCETMS - 2014
from its specific place in the artery. Friction can
also be a disadvantage because it is very
difficult to deploy it in the artery. The
deployment of a stent it is difficult to advance a
balloon catheter as more friction between the
wire and the vessel wall exists in a small vessel,
very low profile balloons are frequently used
Deployment of stents in small vessels may be
more challenging. Friction is higher and stent
advancement is more difficult. The lesions may
be localized in more distal segments of after
tortuous segments.
In vitro experiments have shown that stents
without side holes, those made with material
with a low coefficient of friction or containing
a hydrophilic coating, resist bacterial
colonization at sites of surface irregularity and
sludge formation because they are not as
smooth as one would like. Coated stents have
low coefficient of friction that may increase
stent longevity. The coating provides maximum
Friction reduction, which aids the passage of
the catheter through lesions in blood vessels To
reduce friction coatings are used. Hydrophilic
polymer coating further
stenos - leading to
the formation of free jets – are involved. This
paper presents a progress report on ongoing
efforts to develop a viable method for the
treatment of transition in arterial flows within
the framework of two equation models of
turbulence.
IV.
MECHANICAL PROPERTIES
Through the years the materials that are used to
make stents have been changing. These
advances in the discovery of new materials for
the production of stents are moving very
quickly. In almost every biomechanical product
the use of stainless steel is the main choice
other materials excluding stainless steel are the
Nickel – Titanium (Nitinol), Silicon, Cobalt
chromium. According to different sources and
different companies and what products they
offer stainless steel is most use. In a second
perspective we find the nitinol. This material is
very popular in the market because of his
capability of self –
ISSN: 2231-5381
Fig.2
Response of Metals Stress vs Strain
Expanding. This process is interesting because
the process of the angioplasty is not necessary.
Other materials are not as frequently use in the
marketplace because of their recent
introduction to the public. Some are like the
silicone and cobalt chromium. As a way to
look always for the new things and finding out
what is new and effective we compare what is
new in the market and what is already well
established.When doing an analysis of the
value in a stress – strain diagram we found that
if the modulus is higher means that the slope of
the curve in the linear elasticity part is steepest.
Meaning that is need a bigger stress to develop
a considerable strain.
A) Cobalt chromium
For the chromium cobalt there is a lot of
ambiguity in the field of the construction of
stents because of their early introduction to the
world. This material is also used for other
biomechanical devices like hip replacement.
The modulus of elasticity is defined by
Hooke’s law. is 235Gpa.For cr-co.
B) Stainless steel
May corrode inside the body under certain
circumstances such as highly stressed and
oxygen depletion region that’s why suitable for
fracture plates screws etc. modules of elasticity
is 193gpa.
http://www.ijettjournal.org
Page 79
National Conference on Engineering Trends in Medical Science – NCETMS - 2014
V.
RESULT
One cannot put any type of material in the
human body. Biocompatibility must be
evaluated first for any kind of material. Each of
the material has its up sides and down sides.
The majority of stents that we see in the market
are of stainless steel however, there are several
materials that have been used in human body.
But co-cr has been found more elastic than
stainless steel.
VI.
[15].http://www.prairieheart.com/news/coated.stents/Co
ated Stents: A Revolution In Heart Care..
[16]http://www.public.iastate.edu/~svetinol/papers/
BME205.pdf
[17]http://generalmedicine.jwatch.org/cgi/content/full/2
003/
1104/1,Will Sirolimus-Eluting Stents Consign Bare
Metal to History?
[18].http://guidant.com/news/300/web_release/nr_00039
6.shtml
[19]http://medicine.ucsf.edu/htc/patient/patient.what.thr
omb. html
CONCLUSIONS
Selections of mechanical properties of metallic
biomaterial as well as physio-chemical
properties of stent are important issues when
forming of application features is involved. The
forming is based on selection of proper
biomechanical characteristics determined with
an implantation procedure taken into account.
This results from an expansion of a stent
Conclusions.co-cr as suitable the co-castanets
have similar safety in relation to stainless steel
but co-cr is more elastic in comparison to
stainless steel hence for proper arterial blood
flow and accurate calibration of stents co-cr is
better.
VII.
REFERENCES
[1].Bloomberg
News, El Nuevo Día, February 4, 2004,
p.96
[2]. www.avestapolarit.com
[3]. http://65.18.188.177/, Cordis Coronary Stent
[4]http://advancedstent.com/stent .html, SLK-View Stent
[5]. Gere, James M. 2001. Mechanics of Materials. 5th
Ed.
Brook/Cole Thomson learning
[6]The Associated Press. July 25, 2000 Journal of the
American Heart Association
[7http://www.prairieheart.com/news/coated.stents/
Coated Stents: A Revolution In Heart Care.
[8] http://www.public.iastate.edu/~svetinol/papers/
BME205.pdf
.[9]http://www.sma.org.sg/smj/4006/articles/4006me.htm
l
[10]http://www.designnews.com/index.asp?layout=
article&articleid=CA91445&cfd=1
.[11]http://www.diariomedico.com/cardio/n250700BI.ht
ml
[12] The Associated Press. July 25, 2000 Journal of the
American Heart Association
[13]http://www.mrs.org/publications/bulletin/2000/aug/P
iehler.pdf
[14]. http://www.nitinol.com/4applications.htm#arch
ISSN: 2231-5381
http://www.ijettjournal.org
Page 80
National Conference on Engineering Trends in Medical Science – NCETMS - 2014
“ System for Shot Boundary Detection Using Block
Histogram Difference Method”
Atul N. Chirde1, Kishor S. Abhang2, Prof. Salim A. Chavan3
12
Final year B.E EXTC Department&Amravti University, India
Abstract— Retrieval of video from large digital video storage is
challenging task. Video segmentation is first step in the process
of efficient video indexing retrieval. Video shot boundaries needs
to be clearly detected which will help in key frame extraction and
then video retrieval .The shot transition are of two types i.e.
Abrupt Transition & Gradual Transition .In Gradual Transition
, there are three types – fade in /fade out, dissolve and wipe. In
our topic we developed multi-stage algorithm for shot boundary
detection.
Keywords— Shot boundary detection, Histogram detection
I.INTRODUCTION
The demand for intelligent processing and analysis of
multimedia information has been rapidly growing in recent
years. Researchers have actively developed different
approaches for intelligent video management, including shot
transition detection, key frame extraction, video retrieval, etc.
Among these approaches, shot transition detection is the first
step of content-based video analysis and key frame is a simple
yet efficient form of video abstract. It can help users to
understand the content at a glance and is of practical value.
Video can be represented by a hierarchical structure consisting
of five levels (video, scenes, group, key frame and shot) from
top to bottom increasing in granularity, while a shot is the
basic unit of video. A shot is defined as a sequence of frames
captured by the camera in a continuous manner and without
interruptions. An interruption between the shot is called as the
transition. An abrupt transition between shots corresponds to a
sudden change(cut) between two consecutive frames, while a
gradual transition prolongs itself throughout a small
(comparing to entire video sequence) number of frames. The
later can be further classified as dissolve, fade, wipe or other
complex types. A fade is slow change in brightness of images
usually resulting in (fade out) or starting with (fade in) a solid
black frame. In a dissolve, the scene from the previous shot
slowly fades out,while the image from next shot slowly fades
in simultaneously.
Shot boundary detection (SBD) is an essential step towards
semantic video retrieval and indexing, it aims to segment the
video into some consecutive partitions temporally. The idea of
SBD is simply finding the discontinuity of visual contends. It
is difficult to build general model to detect the type and
location of these transition. Usually , a SBD system extracts
one or more low level features, then run pair-wise comparison
between the current frame and successive frame and decide
whether the boundary occurs or not. Now,people proposed a
general model construction method and emerged various
methods for model construction.
ISSN: 2231-5381
Many approaches used different kinds of features to detect
shot boundary, including histogram, shape information,
motion activity. Among these approaches, histogram is the
popular approach. However, in these histogram-based
approaches, pixels, space distribution was neglected.
Different frames may have the same histogram. In view of
this, we divided each frame into ‘r’blocks, and the difference
of the corresponding blocks of consecutive frames was
computed by color histogram, thedifference D(i,i +1) of the
two frames was obtained by adding up all the blocksdifference
in the meanwhile, the difference V(i,i +1) between two frames
i and i +1 was measured again without using blocks. Based on
D(i,i +1) and V(i,i +1), shot boundary was determined.
Getting over the drawback of the paper, we propose more
efficient algorithms for shot boundary detection and key frame
extraction with automatic threshold.
II. BASICS OF VIDEO
The video carries multimodal information like speech, audio
,text and picture information. The pictorial information in
video is considered to be the series of images what are called
frames. These frames are run at a specific speed (say 30
frames per second) to make them it video. As per
theproduction
standards
a
video
sequence
is
composed typically of a set of many video shots. To facilitate
the processing of video objects, a video sequence is first
segmented into video shots. A shot is a (finite) sequence of
frames recorded contiguously from the same camera (usually
without viewpoint change).
Video processing typically involves processing of live or
recorded video from one or more cameras to enhance images
or extract multimodal information for characterization,
selection, retrieval and recognition
III.TYPES OF VIDEO
There are several types of the video exit. The video types are
depends on the codec that are used to compressed the videos.
Some of the video formats are mentioned below
MPEG
AVI
VLC
OGG
FLY
TIFF
XCF
PSD
http://www.ijettjournal.org
Page 81
National Conference on Engineering Trends in Medical Science – NCETMS - 2014
Credited in the revised template as follows: “original version
of this template was provided by courtesy of Causal
Productions (www.causalproductions.com) ”.
IV. IMAGE
Image is the array of the pixels. The image may be black and
white, gray scale, RGB image or RGBa. Technically speaking
the following terms are used.
A digital video consists of frames that are presented to the
viewer's eye in rapid succession to create the impression of
movement. "Digital" in this context means both that a single
frame consists ofpixels and the data is present asbinary data,
such that it can be processed with a computer. Each frame
within a digital video can be uniquely identified by its frame
index, a serial number.
The image or the frame in a video is as shows in fig below
Fig(2):- Pixel in the image.
One wrong concept about the pixel is that pixels are square
form. But this is wrong concept, it depends. Pixel might be in
the form of square, dot, lines or rectangular form also.] Types
of Transition:VI.THERE ARE TWO TYPES OF TRANSITION
1.
2.
Gradual transition
Abrupt transition
1.Gradual transition
5.Fig(1):- Image (frame)
So from now whenever we talk about the frame, it is nothing
but the image.
VI.
PIXEL
Pixel is the smallest part of the frame.In digital imaging,
a pixel, or pix (for picture) and (for element) is a physical point
in a raster image, or the smallest addressable element in
a display device; so it is the smallest controllable element of a
picture represented on the screen. The address of a pixel
corresponds to its physical coordinates. LCD pixels are
manufactured in a two-dimensional grid, and are often
represented using dots or squares, but CRT pixels correspond
to their timing mechanisms and sweep rates.
Each pixel is a sample of an original image; more samples
typically provide more accurate representations of the
original. The intensity of each pixel is variable. In color image
systems, a color is typically represented by three or four
component intensities such as red, green, and blue, or cyan,
magenta, yellow, and black.Fig (2) shows the portion of image
in the pixels.
ISSN: 2231-5381
Gradual transition is the slow change from one frame to
another frame. In this kind of transitions the two shots are
combined using chromatic, spatial or spatial-chromatic effects
which gradually replace one shot by another. These are also
often known as soft transitions and can be of various types,
e.g., wipes, dissolves, fades.
a] Fade in / Fade out:The termsfade-out and fade-in are used to describe a transition
to and from a blank image. In the fade in effect, the totally
dark image change into the bright one while in case of the
fade out , the bright one convert into dark gradually.
b] Dissolve:Like the fade, a dissolve involves gradually changing the
visibility of the picture. However, rather than transitioning
from a shot to a color, a dissolve is when a shot changes into
another shot gradually. Dissolves, like cuts, can be used to
create a link between two different objects, a man telling a
story, and a visual of his story, for instance
c] Wipe:A wipe involves one shot replacing another, travelling from
one side of the frame to another. Think of a vertical line
passing from the right side of the frame to the left. On the left
side of this line, we have shot A, and on the right side of this
line is shot B. When this line reaches the left edge of the
frame, shot B will completely fill the scene, and the transition
http://www.ijettjournal.org
Page 82
National Conference on Engineering Trends in Medical Science – NCETMS - 2014
is complete. This example describes a vertical line wipe,
though this is but one type of wipe.
Another common type of wipe uses objects in the scene,
rather than an invisible vertical line. One interesting
application of this creates the illusion of a camera passing
through the ceiling of the bottom floor of a multi-story house
to the ground of the floor above. In this case, shot A would
consist of the camera rising to the ceiling, and shot B would
have the camera rising from the ground. A wipe transition
give the impression the camera is passing between the floors
of a house.
The wipe has several types like horizontal, diagonal, star,
heart shape, zig-zag, vertical, clockwise, anti-clockwise, door
etc.
2.Abrupt Transition:The abrupt transitions only involve the cut effect. This is the
sudden change in the image, where one frame converting to
another suddenly.
VII. IDEA OF SHOT DETECTION
IMAGE SEGMENTATION:Each frame is divided into blocks with m rows and n columns.
Then the difference of the corresponding blocks between two
consecutive frames is computed. Finally, the final difference
of two frames is obtained by adding up all the differences
through different weights.
VIII. ATTENTION MODEL
Aswe know the crimes are increasing day by day. So we need
to increase the security. Several security companies are
emerging to give the protection. Surveillance cameras are
implemented here and there for increasing the security. So
what we do the different, we are taking the advantage of the
Surveillance cameras and giving input to our algorithm it will
give the key frames that is those frames where there the
ISSN: 2231-5381
change in the picture occurs. So if we are retrieving the
shooting of the cameras it will help us to detect where the
change occurred.
IX.MATCHING DIFFERENCE
There are six kinds of histogram match. Color histogram was
used in computing the matching difference in most literatures.
However, through comparing several kinds of histogram
matching methods, we reached a conclusion thathistogram
outperformed others in shot recognition. Hence, histogram
matching method is proposed in this paper with the adaptive
threshold.
X.PREVIOUS APPROCHES TO SHOT DETECTION
Thereare several approaches to detect the shot and lots of
research had done in this topic. Some of them are as below.
1. General Approaches: Pixel Comparison
Block Difference
Histogram Comparison
Edge Change Ratio
2. Recent Work: Histogram Block Difference
Average frame similarity
Pixel Comparison:This method is also called as the Sum of Absolute Difference
(SAD) method. This is both the most obvious and most simple
algorithm of all: The two consecutive frames are
comparedpixelby pixel, summing up theabsolute values of the
differences of each two corresponding pixels. The result is a
positive number that is used as the score. SAD reacts very
sensitively to even minor changes within a scene: fast
movements of the camera, explosions or the simple switching
on of a light in a previously dark scene result in false hits. On
the other hand, SAD hardly reacts to soft cuts at all. Yet, SAD
is used often to produce a basic set of "possible hits" as it
detects all visible hard cuts with utmost probability.
Histogram Comparison:In this method histogram difference of two consecutive frames
are calculated. Basically transition is abrupt i.e. cut; frames
are suddenly changes from one to another.
Histogram difference of two consecutive frames.
http://www.ijettjournal.org
Page 83
National Conference on Engineering Trends in Medical Science – NCETMS - 2014
XI. PROPOSED ALGORITHM
Here, we are using histogram with adaptive threshold for shot
detection and key frames extraction. The algorithm differs
from conventional methods mainly in the use of image
segmentation and attention model. Matching difference
between two consecutive frames is computed with different
weights. Shot are detected with automatic threshold. Key
frames are extracted by using reference frame-based approach.
The following flow chart represents the proposed algorithm.
STAGES IN PROPOSED ALGORITHM:Fig (6):- Histogram of different images
StageI)VideoSegmentation
Stage V) Block Differenc
So it is easy to computing different parameter in gray scale
rather than RGB.
Fig (3):- Video segmentation.
Fig (4) shows the video segmentation, in this original video
file is con1verted into video shot and then into different
frames.
Stage II) RGB to Gray
The frames may have colour in RGB. In this step we are
converting colour frames from RGB to gray scale. As RGB
contain 24 bit representation so the possible combination of
RGB colour is up to1.6 million whereas, gray scale contains 8
bit representation so the possible combinations are up to 256.
.
Stage IV) Histogram Difference
Now, we are taking the histogram of each block
Stage III)Divide Frames into Blocks
In this stagewe are converting the each frame into blocks of
size M×N
Fig (4):- frame divided into size of M×N.
The figure shows the image is divided into the different blocks
of size M×N. Here the frame is divided into 4columns and 3
rows. We are dividing the image into blocks to overcome
disadvantages of the general approachesThe frames may have
colour in RGB. In this step we are converting colour frames
from RGB to gray scale. As RGB contain 24 bit
representation so the possible combination of RGB colour is
up to1.6 million whereas, gray scale contains 8 bit
representation so the possible combinations are up to 256.
Now, we are considering the two consecutive frame and
taking
the
block
by
block
difference
up
.
Frame k
Frame
k+1
Fig (5):- Histogram of the block.
The figure shows the gray cale intensities on the x-axis while
on the Y –axis number of pixels are taken. In short the graph
shows, for what intensity how much pixels are there in that
image.The different image shows the different histogram as
below
ISSN: 2231-5381
Computing histogram matching difference between the
corresponding blocks between consecutive frames in video
sequence. H (i, j, k) and H (i, j, k +1) stand for the histogram
of blocks at (i, j) in the kth and (k+1)th frame respectively.
Here we are taking square of the difference because we do not
want the negative value.
Now from the block difference of the consecutive frames, the
block difference of whole frame is given by
http://www.ijettjournal.org
Page 84
National Conference on Engineering Trends in Medical Science – NCETMS - 2014
……………..
(1)
Where,
initialized the threshold factor less than 1 then we get less
threshold value and wise versa we will have larger threshold
value if we have initialized the threshold factor greater than 1.
XII. EXPERIMENTAL RESULT
Now to show the algorithm is effective, we have calculated
the abrupt transition i.e cut detection , precision and recall.
The formulae for calculating recall and precision are as below.
) is histogram of frame k
) is histogram of frame k+1
L is total no of blocks
Recall =
Stage VI) Histogram block difference
Computing histogram difference between two consecutive
frames
Precision =
VIDEO
RECALL
PRECISION
Video 1
70.60%
82.70%
………...….
(2)
Where, wij stands for the weight of block at (i, j)
Video 2
74.90%
83.10%
Video 3
62.50%
75.01%
Stage VII)Mean Deviation
The next stage is to compute the mean deviation. The mean
deviation is calculated as follows,
Video 4
69.00%
81.53%
Video 5
72.60%
88.36%
Video 6
82.93%
91.42%
Video 7
65.81%
85.00%
Average
71.19%
83.87%
…………… (3)
Where, Fv denote total number of frame.
Stage VIII) Standard Deviation
In this stage the standard deviation is calculated for the two
consecutive images. That standard deviation is calculated by s
……………….. (4)
Let F (k) be the kth frame in video sequence, k =
1,2,…., Fv(Fv denotes the total number of video.
Stage IX) Adaptive Threshold
In this stage, we are calculating the adaptive threshold for the
two consecutive frames which are under observation. The
threshold is given by following formula.
𝑻𝒉𝒓𝒆𝒔𝒉𝒐𝒍𝒅
𝑴. 𝑫 + 𝑻𝒉𝒓𝒆𝒔𝒐𝒍𝒅 𝒇𝒂𝒄𝒕𝒐𝒓 ∗ 𝑺𝑻𝑫)
……… (5)
The mentioned threshold is adaptive as the mean deviation
and the standard deviation are changing for every consecutive
frame. The threshold factor is initialized as 1. If we have
ISSN: 2231-5381
Table :- Experimental results.
XIII. CONCLUSION & FUTURE SCOPE
An effective shot change detection system using multi-stage
algorithm is presented. After detecting a shot we can extract
the KEY frame from the video.Histogram method is very time
consuming process but the accuracy is higher especially in
Gradual transitions.It shows a very good performance at
detecting the cuts, fades, and dissolve and for wipe;it has
relatively good result too.This method is well supported to the
uncompressed stream. In future this method can extend to all
types of videos and also extend for any format of the video.
XIV. REFERENCES
[1] Weigang Zhang, Jianqiu Lin, Xiaopeng Chen, Qingming
Huang and Yang Liu, “Video shot detection using Hidden
Markow models with complementary
feature” IEEE
COMPUTER SOCIETY. Proceedings of the first international
conference on
innovative computing, information and
control 2008.
[2]Jian ling, Yi-QunLian, Yue-Ting Zhaung, “New method
for shot gradual transition detection using support vector
machine” IEEE proc of the 4th international conference on
machine learning and cybernatics 5599-5604, 2007
http://www.ijettjournal.org
Page 85
National Conference on Engineering Trends in Medical Science – NCETMS - 2014
[3]Y. Nakajima, K. Ujihara, and A. Yoneyama, “Universal
scene change detection on MPEG-coded data domain,” in Vis.
Commun. and Image Process., 1997, vol. 3024, Proc. SPIE,
pp. 992–1003.
[4]M. Sugano, Y. Nakajima, H. Yanagihara, and A.
Yoneyama, “A fast scene change detection on MPEG coding
parameter domain,” in Proc. IEEE Int. Conf. Image
Processing, vol. 1, Oct. 1998, pp. 888–892.
Uncompressed And Compressed Video,” IEEE Transactions
on Consumer Electronics, vol. 46, no. 3, pp. 769-779, 2000.
[8]Kintu Patel, “Key Frame Extraction Based on Block based
HistogramDifference and Edge Matching Rate”, International
Journal of ScientificEngineering and Technology, Volume
No.1, Issue No.1 pg:23-30
[4]J. Mas, and G. Fernandez, "Video Shot Boundary
Detection based on Colour Histogram," Notebook Papers
TRECVID2003, 2003.
[9]Y. Cheng, X. Yang, and D. Xu, “A method for shot
boundary detection with automatic threshold”, TENCON’02.
Proceedings. 2002 IEEE Region 10 Conference on
Computers,
Communication,
Control
and
Power
Engineering[C], Vol.1, October 2002: 582-585.
[5]Y. Zhuang, Y. Rui, T.S. Huang, and S. Mehrotra,
“Adaptive key frame extraction using unsupervised
clustering”, Proceeding.ICIP’98[C], Chicago, IL, 1998, Vol.1,
pp. 866-870.
[10] ZuzanaCernekova, Ioannis Pitas “Information TheoryBased Shot Cut/FadeDetection and Video Summarization” in
IEEE proc. in circuits and systems for video technology,
VOL. 16, NO. 1, JANUARY 2006.
[6]D.J. He, N. Geng, “Digital image processing”, Pressof
Xidian University. July, 2003, First Edition, pp.104-106.
[7]W. A. C. Fernando, C. N. Canagarajah, and D. R. Bull, “A
Unified Approach To Scene Change Detection In
ISSN: 2231-5381
http://www.ijettjournal.org
Page 86
National Conference on Engineering Trends in Medical Science – NCETMS - 2014
Pill Camera
Tejaswini Bankar#1, Akanksha Ware*2
#
Student of B.E 2ndyear, Department of Biomedical Engineering,
Dr. Bhausaheb Nandurkar College of Engineering and Technology Yavatmal.
Abstract—The aim of technology is to make products in a large
scale for cheaper price and increased quality. The current
technologies have attained a part of it,but the manufacturing
technology is at macrolevel. The future lies in
manufacturing product right from the molecular level.Research
in this direction started way back in eighties. At that time
manufacturing at molecular and atomic level was laughedabout.
But due to advent of nanotechnology we have realized it to
acertain level. One such productmanufactured is PILL
CAMERA, which is used for the treatment of cancer, ulcer
andanemia. It has made revolution in the fieldof medicine. This
tiny capsule can passthrough our body, without causing
anyharm. We have made great progress inmanufacturing
products. Looking back from where we stand now, we started
fromflint knives and stone tools and reached thestage where we
make such tools with more precision than ever. The leap in
technologyis great but it is not going to stophere.
Keywords— Pill Camera, Cancer Camera.
I.
INTRODUCTION
With our present technology wemanufacture products by
casting, milling, grinding, chipping and the likes. Withthese
technologies we have made morethings at a lower cost and
greater precisionthan ever before. In the manufacture of these
products we have been arrangingatoms in great thundering
statistical herds.All of us know manufactured products
aremade from atoms. The properties of those products depend
on how those atoms arearranged. If we rearrange atoms in dirt,
water and air we get grass. The next stepin manufacturing
technology is tomanufacture products at molecular level.The
technology used to achievemanufacturing at molecular
levelis³nanotechnology´. Nanotechnology is the creation of
useful materials, devices and system throughmanipulation of
such minuscule matter .Nanotechnology deals withobjects
measured in nanometres. Nanometre can be visualized as
billionthof a meter or millionth of a millimetre or itis 1/80000
width of human hair.
A. Pill Camera May Make Cancer Diagnose
The new camera-pill may make endoscopies thing of the past
recent news coverage has heralded the arrival of a new
“camera you can swallow” that “could help detect early stages
of cancer of the oesophagus”.
The high-tech device, about the size of a large
vitamin pill, uses optical lasers to photograph the insides of
the stomach and oesophagus in detail.
ISSN: 2231-5381
Diagnosis of esophagus cancer
Fig.1oesophagul cancer
It is hoped that this new investigative technique may help spot
early signs of cancers of the digestive system, such
as oesophagealcancer (also known as cancer of the gullet).
The researchers suggest the cancer camera is a quick, simple
and pain free imaging method that patients may prefer
to endoscopy – the current method of investigating the lining
of the digestive system – where a thin tube with a camera and
a light source at the end is passed down into the oesophagus.
Endoscopies have a number of practical disadvantages,
including:
They are often performed under sedation, so they can
be time-consuming
They require specially-trained staff, so they can be
expensive to carry out (specialist staff usually want
specialist pay rates). Because of these disadvantages,
diagnosing oesophageal cancers can place a strain on
resources.However, if this new technology is proved
to be quick, safe andeffective (and that is a very big
‘if’) then the diagnosis process may become a lot
easier.
Another advantage is that the camera can provide
more detailed images than current investigative
methods such as endoscopy.
II.
CANCER CAMERA
The cancer camera is a new way of investigating the
lining of the gastrointestinal tract for signs of diseases such as
cancer, or abnormal cells that are likely to go on to become
cancerous.
The cancer camera, or “opto -mechanically engineered
pill”, is a small (12.8mm by 24.8mm) high-tech pill-shaped
laser camera that is attached to a thin string-like wire, called a
tether. The pill, which is swallowed, captures microscopic
images of the lining of the oesophagus and gut at high
resolution as it travels naturally through the digestive tract.
http://www.ijettjournal.org
Page 87
National Conference on Engineering Trends in Medical Science – NCETMS - 2014
The wire also allows an operator to control the position of the
pill in the digestive tract to look at specific areas of interest.
III.
WORKING
It is slightly larger than normal capsule. The patient
swallows the capsule and the natural muscular waves of the
digestive tract propel it forward through stomach, into small
intestine, through the large intestine, and then out in the stool.
It takes snaps as it glides through digestive tract twice a
second. The capsule transmits the images to a data recorder,
which is worn on a belt around the patient's waist while going
about his or her day as usual .The physician then transfers the
store data to a computer for processing and analysis. The
complete traversal takes around eight hours and after it has
completed taking pictures is comes out of body as excreta.
Study results showed
B. Pill camera platform components
Sensor array belt
Data recorder
Real time viewer
Workstation and rapid software
IV.
USES
Crohn’s disease
Malabsorption Disorders
Tumors of the small intestine and vascular Disorder
Ulcerative Colitis
Disorders related to small bowel injury
Fig.2 Camera pill
That the camera pill was safe, without any side effects, and
was able to detect abnormalities in the small intestine,
including parts that cannot be reached by the endoscope .The
tiniest endoscope yet takes 32-megapixel images per second
and offloads them wirelessly. See how it works inside the
body in an animation. Pop this pill, and eight hours later,
doctors can examine a high-resolution video of your intestines
for tumours and other problems .This capsule was developed
by the Japanese RF System Lab. The patient gulps down the
capsule, and the digestive process begins .Over the next eight
hours, the pill travels passively down the oesophagus and
thoroughly 20 to 25 feet of intestines, where it will capture up
to 870,000 images. The patient feels nothing .Batteries would
be too bulky,so the cam draws its power through induction
charging. A vest worn by the patient contains a coil that
continuously transmits power .Start Snapping When it reaches
the intestines, the Sayaka camera begins capturing 30 twomegapixel images per second (twice the resolution of other
pill cams). Fluorescent and white LED’s in the pill illuminate
the tissue walls. Sayaka is the first that gets a clearer picture
by mounting the camera facing the side and spinning 360
degrees so that it shoots directly at the tissue walls. As the
outer capsule travels through the gut, an electromagnet inside
its polarity.
A. Components Used in Pill Camera
Optical dome
Lens holder
Lens
ISSN: 2231-5381
Illuminating LED’S
CMOS image sensor
Battery
ASIC transmitter
Antennae
V.
ADVANTAGES
A pill camera can be easily swallowed.
It provides doctors more detailed images and the
entire digestive track not visible by other techniques
and records 870,000 images.
Harmless to the patient of and easier than a
endoscopy and it include the avoidance of standard
endoscopy. .
The patient can continue their everyday life once he
/she has successfully swallowed the pill cam and no
sedation is necessary for capsule endoscopy.
Doctors can steer the images of the internal body as
they wish.
The pill cam platform is an efficient, patient –
friendly and clinically proven diagnostic solution that
provides accurate visualization of the gastrointestinal
tract in its natural state.
VI.
CONCLUSIONS
Wireless capsule endoscopy represents a significant
technical breakthrough for the investigation of the small
bowel.
The endoscopy system is the first of its kind to be able to
provide noninvasive imaging of the entire small intestine.
It is cheap because it so small it doesn’t require anesthesia and
sedation, which increase cost of the traditional proce.
REFERENCES
[1]
[2]
[3]
[4]
[5]
Pink tentacle. “Sayaka: Next- generation capsule endoscope”.
www.nanotechgov Web sites:
www.sciencedaily.com
ww.zyvex.com
Mylonki M, et al. “Wireless capsule endos comparision with push
enteroscopy in patients with gastcopy and copy colonoscopy
negative gastrointestinal bleeding”.
http://www.ijettjournal.org
Page 88
National Conference on Engineering Trends in Medical Science – NCETMS - 2014
Serum based diagnosis of asthma using Raman
Spectroscopy
Tejas Thaware#1,Rajashri Ramteke#2
#
B. E. 2ndyear Biomedical Engineering,
Dr. Bhausaheb Nandurkar College of Engineering and Technology, Yavatmal, Maharashtra, India.
Abstract- The currently prescribed tests for asthma diagnosis
require compulsory patient compliance, and are usually not
sensitive to mild asthma. Development of an objective test
using minimally invasive samples for diagnosing and
monitoring of the response of asthma may help better
management of the disease. Raman spectroscopy (RS) has
previously shown potential in several biomedical applications,
including pharmacology and forensics. In this study, we have
explored the feasibility of detecting asthma and determining
treatment response in asthma patients, through RS of serum.
Serum samples from 44 asthma subjects of different grades
(mild, moderate, treated severe and untreated severe) and from
15 reference subjects were subjected to Raman spectroscopy.
Differences like changes in protein structure, increase in DNA
specific bands and increased glycosaminoglycans-like features
were more prominent with increase in asthma severity.
Multivariate tools using Principal-component-analysis (PCA)
and Principal-component based-linear-discriminant analysis
(PC-LDA)
followed
by
Leave-one-out-cross-validation
(LOOCV), were employed for data analyses.
Keywords-phenotypes,
Glycosaminoglycans,leukotrienes,sarcoidosis,Galactosamine,
glucoronic acid and glucosamine.
I.
INTRODUCTION
Asthma is a chronic inflammatory disorder of the
airways characterized by airway hyperresponsiveness (AHR) and reversible airflow
obstruction that fluctuates over time . Airway
obstruction and allergic inflammation during the
disease occur due to release of IgE and proinflammatory cytokines such as T helper cell type
2 (Th2) and other immune effector cells producing
toxic inflammatory molecules that ultimately elicit
obstruction. Based on clinical parameters, patients
are assigned to distinct categories (mild,
moderate, severe or very severe) that allow
optimal medical decisions on treatment and
prognosis to be made for individual
phenotypes.Current diagnosis of asthma is based
on a history of wheeze, shortness of breath, and
cough, which are variable in severity and over
time. However, these are primarily based on
ISSN: 2231-5381
demonstrating abnormal airway physiology,
which may not always be present in mild asthma,
leading to a decreased sensitivity.
Raman spectroscopy (RS), a vibrational
spectroscopic method based on inelastic scattering
of light. In light of need for better diagnostic tools
with attributes like rapidity, objectivity and the
use of minimally invasive samples, RS could
serve useful for detection of asthma. Thus, this
was carried out to explore the potential
applicability of RS in detecting disease-related
perturbations in serum of mild, moderate and
severe asthma as well as reference subjects.
II.
MATERIALS AND METHODS
A. Subject recruitment
1) Subject screening-A sample size of 44 subjects was
included in the active arm of the study. The
asthmatic conditions were further classified into 4
different categories viz., mild (n=12), moderate
(n=12), untreated severe (n=10) and treated severe
(n=10) cases.
2) Serum separation.-A quantity of 5 ml blood was
collected from each subject in a micro-centrifuge
tube with the help of a sterile injection after
informed and written consent. Samples were
placed standing for 30 minutes to allow clot
formation and then centrifuged at 3500 rpm for 10
minutes. After removing the fat body with the
help of a microtip, samples were centrifuged again
at 3500 rpm for 10 minutes. After 24 hours,
samples were allowed to thaw passively,
following which Raman spectra were acquired.
B. Raman spectroscopy
1) Spectral acquisition.-After
passive thawing,
samples were subjected to Raman spectroscopy by
placing 30 μl serum sample on calcium fluoride
(CaF2) window and recording spectra using Fiber
Optic Raman microprobe. This Raman system
http://www.ijettjournal.org
Page 89
National Conference on Engineering Trends in Medical Science – NCETMS - 2014
consists of laser as an excitation source and HE
785 spectrograph coupled with CCD as dispersion
,correction and detection elements respectively.
Optical filtering of unwanted noise, including
Rayleigh signals, is accomplished through
‘Superhead’, the other component of the system.
Optical fibers were employed to carry the incident
light from the excitation source to the sample and
also to collect the Raman scattered light from the
sample to the detection system. Spectra were
integrated for 10 seconds and averaged over 6
accumulations.Spectra were interpolated in 8001800 cm-1 region.
where the samples could be transported to a
centralized facility for analyses.
A. Spectral features
Difference in spectra was obtained by subtracting
normalized average spectrum of reference group
from all asthma groups: mild, moderate, treated
severe and untreated severe (Figure 2 A-D). All
positive peaks belong to the pathological groups
(mild, moderate, treated severe and untreated
severe asthma), while all negative peaks are the
features of reference group. These peaks may be
the indicative of molecules like proteins, plasma
free amino acids and DNA with relatively higher
concentrations persisting in the pathological
(asthmatic) groups’ sera.
Figure 1.experimental setup for Raman Spectroscopy
normalized first
derivatives of spectra were subjected to
multivariate unsupervised principal component
analysis (PCA) and supervised Principal
Component-Linear Discriminant Analysis (PCLDA). PCA is a routinely used method for data
compression and visualization. LDA provides data
classification based on an optimized criterion
which is aimed for better class separability. LDA
models were validated by Leave-one-out crossvalidation (LOOCV). LOOCV is a type of
rotation estimation used mainly for smaller
datasets.
2)
III.
Multivariate
analysis-Vector
RESULT
This study was undertaken to explore the
possibility of RS based diagnosis of asthma using
a minimally invasive sample like serum. Such an
approach could serve as an objective method for
asthma diagnosis for all patients (irrespective of
age) and could also enable “distance diagnosis”
ISSN: 2231-5381
Figure 2.Difference spectra of the asthma groups.
A. Mild asthma-reference, B. Moderate asthmareference, C. Treated severe asthmareference, D. Untreated severe asthmareference.
In the untreated severe difference spectra,
increased number of positive peaks could be
observed in the same region. The bands
observed could be attributed to the enhanced
immune hyper-responsiveness in severe
asthmatic conditions that might lead to a
higher secretion of histamines, leukotrienes
and prostaglandins and the increased
deposition of glycosaminoglycans (like
galactosamine,
glucoronic
acid
and
glucosamine) in the airways.
http://www.ijettjournal.org
Page 90
National Conference on Engineering Trends in Medical Science – NCETMS - 2014
IV.
CONCLUSION
Preliminary findings indicated the possibility of
classifying reference and asthma conditions
distinctly, as well as specific classifications based
on the state of severity of the asthmatic grades.
Spectral comparisons indicate changes in protein
structure, increased DNA and possible presence of
molecules
like
histamine,
prostaglandins,
leukotrienes and glycosaminoglycans (GAGs).
Treated and untreated severe groups were
classified distinctly, thus indicating that treatment
related changes may also be detected using RS.
Further, subjects with other pulmonary disorders
like, chronic obstructive pulmonary disorder,
cystic fibrosis, sarcoidosis, tuberculosis and
bronchiectasis would be included to determine
disease specificity of the stated method.
12. Enright PL, Lebowitz MD, Cockroft DW (1994) Physiologic measures:
pulmonary function tests. Am J RespirCrit Care Med 149: S9–S20.
doi:10.1164/ajrccm/149.2_Pt_2.S9. PubMed: 8298772.
13. Hunter CJ, Brightling CE, Woltmann G, Wardlaw AJ, Pavord ID
(2002) A comparison of the validity of different diagnostic tests in
adultswith asthma. Chest 121(4): 1051-1057. doi:10.1378/chest.121.4.1051.
PubMed: 11948032.
14. Good DM, Thongboonkerd V, Novak J, Bascands JL, Schanstra JP et
al. (2007) Body fluid proteomics for biomarker discovery: lessons from the
past hold the key to success in the future. J Proteome Re
ACKNOWLEDGMENT
The authors acknowledge the assistance of Ms.
Kalaibhani, Research Officer, Department of
Biostatistics, All India Institute of Medical
Sciences for performing the statistical analyses.
REFERENCES
[37]
1. Shifren A, Witt C, Christie C, Castro M (2012) Mechanisms of
remodeling in asthmatic airways. J Allergy 2012: 316049. Doi:
[38] 2. Barrios RJ, Kheradmand F, Batts LK, Corry DB (2006) Asthma:
Pathology and Pathophysiology. Arch Pathol Lab Med 130: 447–
451. PubMed: 16594736.
[39] 3. Bloemen K, Verstraelen S, Van den Heuvel R, Witters H,
Nelissen I et al. (2007) The allergic cascade: review of the most
important molecules in the asthmatic lung. ImmunolLett 113(1): 6–
18. doi:10.1016/j.imlet.2007.07.010. PubMed: 17765979.
[40] 4. World Health Organization (2007) Global surveillance, prevention
and control of chronic respiratory diseases: a comprehensive
approach. Geneva: WHO Press. p. 155.
[41] 5. World Health Organization (2008) the global burden of disease:
2004 update. Geneva: WHO Press. p. 146.
[42] 6. Anderson GP (2008) Endotyping asthma: new insights into key
pathogenic mechanisms in a complex, heterogeneous disease. Lancet
372(9643): 1107–1119. Doi:10.1016/S0140-6736(08)61452-X.
PubMed: 18805339.
[43] 7. Montuschi P, Barnes PJ (2011) new perspectives in
pharmacological treatment of mild persistent asthma. Drug Discov
Today 16: 1084–1091. doi:10.1016/j.drudis.2011.09.005. PubMed:
21930234.
[44] 8. Montuschi P (2010) Toward a Personalized Pharmacotherapy of
Respiratory
Diseases.
Front
Pharmacol 1:
131.
doi:
10.3389/fphar.2010.00131
[45] 9. British Thoracic Society; Scottish Intercollegiate Guidelines
Network (2003) British guideline on the management of asthma.
Thorax 58: Suppl 1: i1–94.
[46] 10. National Institutes of Health (1997) Guidelines for the diagnosis
and management of asthma. National Asthma Education and
Prevention Program Expert Panel Report 2. Washington, DC: U.S.
Government Printing Office. NIH Publication 97–4051.
11. Initiative Globalfor Asthma (1995) Global strategy for asthma
management and prevention. NHLBI/WHO Workshop Report.
Washington, DC: U.S. Government Printing Office. NIH Publication 023659.
ISSN: 2231-5381
http://www.ijettjournal.org
Page 91
National Conference on Engineering Trends in Medical Science – NCETMS - 2014
The Implimentation and Structure of Object
Character Intelligence Recognition Perform Via
Open Source Computer Vision (OpenCV)
1
2
Miss.Priyanka R. Chaudhari1, Miss. Priyanka A. Varma2
Computer Department,DBNCOET, Yavatmal/Sant Gadge Baba Amravati University,Amravati,India
Computer Department,DBNCOET, Yavatmal/Sant Gadge Baba Amravati University,Amravati,India
Abstract—In this paper, we present a technology which is a
computer vision is that the representation in the updation form,
OpenCV-Open Source Computer Vision Library we are using
as reference for performing our execution and demonstrate the
result. The Object Character Recognitiion Is the technology
which can recognize and analyze the specific object and that can
get the out as text which is the editable form. The Object may be
paper, picture which might any format and reali-time desktop
or anything else. We are are here defining that the suphrial
system which works like intelligence. And also we define the
representation of structure and alogorithm in that included.
More recently, the term Intelligent Character Recognition (ICR) has
been used to describe the process of interpreting image data, in
particular alphanumeric text.
One example of OCR is shown below. A portion of a
scanned image of text, borrowed from the web, is shown along with
the corresponding (human recognized) characters from that text.
Keywords –Object Chatacter Recogntion, OpenCv, Computer
Vision Library
Fig 1- Sacanned Image of Text and in corresponding recognized
organiation
IINTRODUCTION
Machine replication of human functions, like reading, is an ancient
dream. However, over the last five decades, machine reading has
grown from a dream to reality. Optical character recognition has
become one of the most successful applications of technology in the
field of pattern recognition and artificial intelligence. Many
commercial systems for performing OCIR exist for a variety of
applications, although the machines are still not able to compete
with human reading capabilities.
2. Recognizing license plate numbers.
B.Methods of OCR
A. OCIR
By 1950 the technological revolution was moving forward at a
high speed, and electronic data processing was becoming an
important field. Data entry was performed through punched cards
and a cost-effective way of handling the increasing amount of data
was needed. At the same time the technology for machine reading
was becoming sufficiently
mature for application, and by the middle of the 1950’s OCR
machines became commerciallyavailable. The first true OCR
reading machine was installed at Reader’s Digest in 1954. This
equipment was used to convert typewritten sales reports into
punched cards for input to thecomputer.
OCR (Object Character Recognition) also called
Object Character Reader is a system that provides a full
alphanumeric recognition of printed or handwritten characters at
electronic speed by simply scanning the form.
ISSN: 2231-5381
A few examples of OCR applications are listed here. The most
common for use OCR is the first item; people often wish to convert
text documents to some sort of digital representation.
1. People wish to scan in a document and have the text of that
document available in a word processor.
The main principle in automatic recognition of patterns, is first
to teach the machine which classes of patterns that may occur and
what they look like. In OCR the patterns are letters, numbers and
some special symbols like commas, question marks etc., while the
different classes correspond to the different characters. The teaching
of the machine is performed by showing the machine examples of
characters of all the different classes. Based on these examples the
machine builds a prototype or a description of each class of
characters. Then, during recognition, the unknown characters are
compared to the previously obtained
descriptions, and assigned the class that gives the best match.
C.Components of an OCR system
A typical OCR system consists of several components. In figure
3 a common setup is illustrated. The first step in the process is to
digitize the analog document using an optical
http://www.ijettjournal.org
Page 92
National Conference on Engineering Trends in Medical Science – NCETMS - 2014
scanner. When the regions containing text are located, each symbol
is extracted through a
segmentation process. The extracted symbols may then be
preprocessed, eliminating noise, to facilitate the extraction of
features in the next step.
sophisticated techniques for the recognition of a great variety of
typeset fonts and also handprinted characters. Below the future of
OCR when it comes to both research and areas
of applications, is briefly discussed.
A..Future improvements
New methods for character recognition are still expected to
appear, as the computer technology develops and decreasing
computational restrictions open up for new approaches.
There might for instance be a potential in performing character
recognition directly on
grey level images. However, the greatest potential seems to lie
within the exploitation of
existing methods, by mixing methodologies and making more use of
context.
IV OPENCV
The identity of each symbol is found by comparing the extracted
features with descriptions of the symbol classes obtained through a
previous learning phase. Finally contextual information is used to
reconstruct the words and numbers of the original text.
II FUNCTION OF OCR:
Forms can be scanned through a scanner and then the
recognition engine of the OCR system interpret the images and
turn images of handwritten or printed characters into ASCII
data (machine-readable characters).
The technology provides a complete form processing and
documents capture solution.
Allows an open, scaleable and workflow.
Includes forms definition, scanning, image
pre-processing, and recognition capabilities
Advantages:
Quicker processing; no moving or storage of
questionnaires near operators.
Savings in costs and efficiencies by not having the paper
questionnaires.
Scanning and recognition allowed efficient management
and planning for the rest of the processing workload.
Reduced long term storage requirements, questionnaires
could be destroyed after the initial scanning, recognition
and repair.
Quick retrieval for editing and reprocessing.
Minimizes errors associated with physical handling of the
questionnaires.
III THE FUTURE OF OCR
Open Source Computer Vision Library (OpenCV) and also
provides a general background to the field of computer vision sufficient to use OpenCV effectively.
Computer vision is a rapidly growing field, partly as a result of
both cheaper and more capable cameras, partly because of
affordable processing power, and partly because vi- sion
algorithms are starting to mature. OpenCV itself has played a role
in the growth of computer vision by enabling thousands of people
to do more productive work in vision. With its focus on real-time
vision, OpenCV helps students and professionals efficiently
implement projects and jump-start research by providing them
with a computer vision and machine learning infrastructure that
was previously available only in a few mature research labs.
A. Computer Vision
Computer vision is the transformation of data from a
still or video camera into either a decision or a new
representation. All such transformations are done for achieving
some particular goal. The input data may include some
contextual information such as “the camera is mounted in a
car” or “laser range finder indicates an object is 1 meter away”.
The decision might be “there is a person in this scene” or “there
are 14 tumor cells on this slide”. A new representation might
mean turning a color image into a grayscale im- age or
removing camera motion from an image sequence.
V. WORKING OF TESSERACT
In geometry, the tesseract, also called an 8-cell or regular
octachoron or cubic prism. Is the four-dimensional analog of the
cube; the tesseract is to the cube as the cube is to the square. Just as
the surface of the cube consists of 6 square faces, the hyper surface
of the tesseract consists of 8 cubical cells.
Tesseract is object character recognition engine for
various operating systems. Tesseract is considered one of the most
accurate open source OCR engines currently available. It is written
in the C, C++, so it is platform independent. It can be used in other
applications in the form of Dynamic Link Library (DLL). So it can
be easily added as the reference in the form of DLL in other
application to use the functionality provided by Tesseract.
A. Architecture Of Tesseract OCR Engine
Through the years, the methods of character recognition has
improved from quite primitive schemes, suitable only for reading
stylized printed numerals, to more complex and
ISSN: 2231-5381
Tesseract OCR works in step by step manner as per the
block diagram shown in fig. First step is Adaptive Thresholding,
which converts the image into binary images. Next step is connected
http://www.ijettjournal.org
Page 93
National Conference on Engineering Trends in Medical Science – NCETMS - 2014
component analysis, which is used to extract character outlines. This
method is very useful because it does the Tesseract was probably
first to provide this kind of processing. Then after, the outlines are
converted into Blobs. Blobs are organized into text lines, and the
lines and regions are analyzed for some fixed area or equivalent text
size. Text is divided into words using definite spaces.
CONCLUSION
The specializes character classification to the typeface of the
current document, while the third exploits style consistency in
typeset text. The method depends only on properties, and varies
from language to language. While at first blush these four notions
seem very different, we shall see that the borders are
fuzzy.Although Tesseract is command-based tool but as it is open
source and it is available in the form of Dynamic Link Library, it
can be easily made available in graphics mode. The input images are
specific, which are vehicle number plates, so in these specific
images Tesseract provides better accuracy.
ACKNOWLEDGEMENT
We would like to Thanks Prof. S. R.Patil, Department of
Computer Engineering, DBNCOET, Yavatmal for kind support and
guidance to carry out this work.
We arealso thankful of our Hon. Principal Dr. V. G.
Arajpure for providing all the facilities, and accomplish our
requirements of this research paper effectively & smoothly
REFERENCE
[1]
process as shown in fig 1. In the first pass, an attempt is made to
recognize each word fromthe text. Each word passed satisfactory is
passed to an adaptive classifier as training data..The adaptive
classifier tries to recognize text in more accurate manner. As
adaptive classifier has received some training data it has learn
something new so final phase is to resolve various issues and to
extract text from images.
Advantages:
Tesseract is Open source
Tesseract provides results with 100% accuracy.
When the image is gray. and 61% accuracy
(complex color image)
Platfom independent
Tesseract solve the problem of different word
spacing
ISSN: 2231-5381
S.V. Rice, G. Nagy, T.A. Nartker, Optical Character
Recognition: An illustrated guide to the frontier.
[2] S.V. Rice, F.R. Jenkins, T.A. Nartker, The Fourth Annual
Test of OCR Accuracy, Technical Report 95-03, Information
Science Research Institute, University of Nevada, Las Vegas,July
1995.
[3] R.W. Smith, The Extraction and Recognition of Text
fromMultimedia Document Images, PhD Thesis, University
ofBristol, November 1987. R. Smith, “A Simple and Efficient
Skew DetectionAlgorithm via Text Row Accumulation”, Proc. of
the 3rd Int.Conf. on Document Analysis and Recognition (Vol. 2),
IEEE1995, pp. 1145-1148.
[4] P.J. Rousseeuw, A.M. Leroy, Robust Regression and
Outlier Detection, Wiley-IEEE, 2003.
[5] S.V. Rice, G. Nagy, T.A. Nartker, Optical Character
Recognition: An Illustrated Guide to the Frontier, Kluwer
Academic Publishers, USA 1999, pp. 57-60.
[6] P.J. Schneider, “An Algorithm for Automatically Fitting
Digitized Curves”, in A.S. Glassner, Graphics Gems I,
Morgan Kaufmann, 1990, pp. 612-626.
[7] ] R.J. Shillman, Character Recognition Based on
Phenomenological Attributes: Theory and Methods, PhD.
Thesis, Massachusetts Institute of Technology. 1974.
B.A. Blesser, T.T. Kuklinski, R.J. Shillman, “Empirical
Tests for Feature Selection Based on a Pscychological
Theory of Character Recognition”, Pattern Recognition 8(2),
Elsevier, New York, 1976.
[8] M. Bokser, “Omnidocument Technologies”, Proc. IEEE
80(7), IEEE, USA, Jul 1992, pp. 1066-1078.
[9] H.S. Baird, R. Fossey, “A 100-Font Classifier”, Proc. of
the 1st Int. Conf. on Document Analysis and Recognition,
IEEE, 1991, pp 332-340.
[10] G. Nagy, “At the frontiers of OCR”, Proc. IEEE 80(7),
IEEE, USA, Jul 1992, pp 1093-1100.
G. Nagy, Y. Xu, “Automatic Prototype Extraction for
Adaptive OCR”, Proc. of the 4th Int. Conf. on Document
Analysis and Recognition, IEEE, Aug 1997, pp 278-282.
[11] Marosi, “Industrial OCR approaches: architecture,
algorithms and adaptation techniques”, Document
http://www.ijettjournal.org
Page 94
National Conference on Engineering Trends in Medical Science – NCETMS - 2014
Constant Frequency Unified Power Flow Controller
for Wind Power Generator connected
With Micro Grid
K.E.CH.VIDYA SHEKAR1
M..Tech scholarsDepartment of Electrical Engineering,
Lovely Professional University, Punjab, India.
Abstract— The paper proposes the application of constant
frequency unified power quality conditioner to overcome the
power quality issues in fixed speed wind mill connected with the
micro grid. The power circuit of a constant frequency unified
power flow controller (CF-UPFC) is based on a combination of
UPFC, and frequency regulator (matrix converter). This
equipment incorporates compensation functions like voltage
sag, voltage swell, reactive power compensation, current
harmonic rejection, and also provides frequency regulation.
Integrated series and parallel active filter (UPFC) is a universal
solution for the most power quality problems. The main
drawback is that it cannot regulate the supply frequency
variation. Here CF-UPFC the matrix converter is used for
frequency regulation. This integration, the compensator
compensates all the power quality issue for fixed speed
induction wind generator. Simulation results are presented to
confirm that this approach has better performance over the
existing power quality conditioners for FSIWG connected with
micro grid.
Keywords— Micro Grid, UPFC, Matrix converter, CF-UPFC,
FSIWG.
R.K.SHARMA2
H O D Department of Power Electronics andDrives,
Lovely professional university, Punjab, India
A unified power flow controller is an advanced concept
in the power quality control field. The unified power flow
controller is implemented based on the idea of integration of
a series active filter and shunt active filter that share a single
DC link [4]. Unified power flow controller can be applied in
a power system for current harmonic compensation, voltage
compensation and reactive power control [5].but the main
drawback is that it cannot compensate frequency regulation.
This drawback is overcome by introducing constant
frequency unified power flow controller (CF-UPFC)[6] . CFUPFC which is a combination of unified power flow
controller and matrix converter.This modified unified power
flow controller the PWM converter to perform active
filtering, and the matrix converter also performs the function
of frequency regulation.The Pulse Width Modulation
technique (PWM) is commonly used to control all these
converters. The switching rate is high so the PWM converter
can produce a controlled current or voltage waveform with
high fidelity. [7]. It can simultaneously compensate the load
current harmonics, supply voltage harmonics and frequency
regulation.
XXX. INTRODUCTION
A micro grid is a combination of interconnected distributed
generators, loads and intermediate storage units that
cooperate with each other to be collectively treated by the
grid. Micro grid can operate in grid-connected mode or in
island mode. In grid connected mode, the micro grid either
draws or supplies power to the main grid, depending on the
generation and load. Power quality events and pre-set
conditions will make the micro grid disconnect from the main
grid and operate as a separate island. Typical micro gird
sources include combustion engines, small wind turbines and
photovoltaic systems [1]. The main problem in micro grid is
power quality issues when connected to heavy loads. If the
load increases frequency and voltage will vary [2].If the
supply frequency and voltage varies beyond the power
quality, the utility equipment may not work properly.
Fig 1 a UPFC schematic
ISSN: 2231-5381
http://www.ijettjournal.org
Page 95
National Conference on Engineering Trends in Medical Science – NCETMS - 2014
whereas the full-load losses (i.e. losses at rated power)
increase due to increased currents in the generator windings
and also reduce the power reduction. Too low voltages can
cause the relay protection to trip the wind turbines.
B. Frequency range
According to electricity boards and manufacturers, the grid
frequency in India can vary from 47 to 51.5 Hz. Most of the
time, the frequency is below the rated 50 Hz. For wind
turbines with induction generators directly connected to the
micro grid, frequency variation will be very considerable.
Frequency variation is directly affected by the power
production of wind mill [11].
Fig 2 Basic configuration of unified power flow controller
Fig. 2 shows an arrangement of the constant frequency
unified power flow controller. The constant frequency unified
power flow controller can solve all power quality issues like
voltage sag, voltage swell, and eliminate current harmonics
and frequency regulation (by using the matrix converter ).
Matrix converter has many advantages when compared to
traditional frequency changers. Matrix converter can convert
the supply frequency in a wide range [8].It can also
compensate the voltage sag and swell efficiently by adjusting
the modulations [9][10]. In Matrix converter, (MC) it is
possible to control the phase angle between the voltage and
current on the output. Size, high power density and easier
maintenance are the attractive characteristics of matrix
converter. Sinusoidal input current, controlled input power
factor, regeneration capability and magnitude-frequency
controlled output voltages are the advantages of a matrix
converter. In this paper CF-UPFC has been implemented in
micro grid connected wind mill and analyzed its performance
has been analyzed.
II. POWER QUALITY ISSUES IN WIND MILL CONNECTED WITH
MICRO GRID
A perfect power supply would be one that is always available
and always within voltage and frequency tolerances, and has
a pure noise-free sinusoidal wave shape. Power quality issues
are the important problems in micro grids. Especially, for
wind turbine generator systems, there are some international
standards available that characterize the power quality of a
grid connected wind turbine IEC 61400-21and EN 50160
standards.
A. Voltage unbalance
According to the electricity board, the variation in the steady
state voltage is in the range from + 5% to –15% at the wind
turbine terminals in the wind farms. For low voltages, the
noload losses decrease slightly due to reduced iron losses,
ISSN: 2231-5381
C. Harmonics and inter harmonics
The emission of harmonic and inter harmonic currents from
wind turbines with directly connected induction generators is
expected to be negligible. But Wind turbines connected to the
grid through power converters however emit harmonic and/or
inter harmonic currents that contribute to the voltage
distortion. Inverters based on new technologies have a
limited emission of harmonics at lower frequencies compared
to the converters used in the first generation of variable speed
wind turbines. Instead they produce inter harmonics at higher
frequencies. Due to this harmonics the wind turbines
generator affects
*High System Losses
* Generator Overheating
* Low Power Factor
* Electronic Protective Device Malfunction
* High Telephone Interference Factor
* Increased generator Vibration
III. SYSTEM CONFIGURATION OF CONSTANT
FREQUENCY
UNIFIED POWER FLOW CONTROLLER
A. Construction
The basic components of the CF-UPFC is the voltage source
inverter (VSI’s) sharing a common DC storage capacitor and
a matrix converter connected to the power system through
coupling transformers. One VSI is connected parallel to the
transmission line via a shunt transformer, while the other one
is connected in series through a series transformer. The series
converter is connected in series with the supply through a
transformer (T1,T2,T3) while shunt converter is connected in
parallel with the passive filter(LP(1,2,3)RP(1,2,3))and
(RP(1,2,3)CP(1,2,3)). The passive filters are used to
minimize the switching oscillation in the converter output.
Each converter
and filter consists of three single phase voltage-source PWM
inverters using power IGBTs. The shunt converter
http://www.ijettjournal.org
Page 96
National Conference on Engineering Trends in Medical Science – NCETMS - 2014
compensates the reactive power, voltage stability and current
harmonic rejection .The series converter controls the power
flow to the utility, voltage regulation and voltage harmonic
rejection. The dc terminals of the inverters are connected to
each other with a dc capacitor. of 2200 pF. The matrix
converter is used to regulate the supply frequency to the fixed
speed induction wind turbine generator. A detailed UPLM
construction scheme is shown in fig.3 .The main circuit of
the constant frequency unified power quality conditioner
consists ofmatrix converter placed in between the series
converter and shunt converter arranged as per the circuit
diagram. This type of arrangement is called as tandem based
converter. This type of arrangement can avoid the limitations
of matrix converter [13][14]. The matrix converter consists of
a single-stage converter which has an array of mxn (3X3)
bidirectional power switches to link. It consists of nine
bidirectional switches arranged in three groups, each being
associated with an output line. This bi-directional switches
arrangement connects mxn of the input lines to mxn of the
output lines. Commonly, the matrix converter can change the
input frequency to the output. In this paper the power rating
of matrix converter is 450 KVA, the input voltage of three
phases 440 V, and the frequency of output is 50 Hz regulated.
back each sharing a common dc link. One inverter is
controlled as a variable voltage source in the series active
filter (APF), and the other as a variable current source in the
shunt APF. Fig. 3 shows a basic system configuration of a
general UPFC consisting of the combination of a series APF
and shunt APF. The main aim of the series APF is harmonic
isolation between load and supply. It has the capability of
voltage imbalance compensation as well as voltage regulation
and harmonic compensation at the PCC. It also solves the
drawback of voltage transfer ratio of matrix converter and
output voltage harmonic of matrix converter. The shunt APF
is used to absorb current harmonics, compensate for reactive
power and negative-sequence current, and regulate the dc
link voltage between both APFs. It also solves the input
current harmonics of the matrix converter.
B Matrix Converter Working Principle
A matrix with elements Sij, represents the state ofeach bidirectional switch (on=1, off=0),which can be used to
represent the matrix output voltages (Vu, Vv, Vw) as
functions of the input voltages (Va, Vb, Vc) as follows,
The input phase currents (ia, ib, ic) are related to the output
phase currents (iu, iv, iw) by,
Assume that the input voltages of the converter system of
balanced sinusoidal waveform as.
Figure. 3. The Proposed constant frequency unified power
quality conditioner for wind mill
Where Vmi and ωi are the amplitude and the angular
frequencyof the input voltages, respectively. The output
voltages aredesired to be balanced sinusoidal waveforms.
Consider adesired output phase of voltage as
The constant frequency unified power quality conditioner
consists of two voltage source inverters connected back to
ISSN: 2231-5381
http://www.ijettjournal.org
Page 97
National Conference on Engineering Trends in Medical Science – NCETMS - 2014
Where Vmoand ωo are the amplitude and the angular
frequency of the converter output voltage respectively.
IV. CONTROL SCHEMES OF CONSTANT FREQUENCY
Then it is converted to (d q) reference frame (park transform)
The magnitude of output current can be controlled by setting
the values of idref, iqref .idiqcompared with reference value
and corresponding voltages are generated. Again it converted
in to Clark transformation. It can be written as
Fig 4 UNIFIED POWER FLOW CONTROLLER for
windmill
The control system of Universal Power Line Manager
consists of three sections
When the above values are fed to the voltage controller (d-q),
the phase voltage U u, Uv and Uw will be obtained. After the
anti-transformed phase voltages (U u,U vandUw ) the
coordinate
systems are obtained. Depending upon the control signal the
space vector modulator produces corresponding pulse width
modulation (PWM) signal to the matrix converter.
A. Frequency Regulating Control Block
The control diagram of the Matrix converter basedfrequency
regulated power supply for Utility is shown in Fig.4. Control
system of frequency regulator in matrix Conventional space
vector pulse width modulation is used to switch the matrix
converter. The control method of this frequency regulator is
similar to that of the flux oriented vector control technique of
AC motor drives. The speed control loop is omitted and the
B. Voltage sag swell control
The function of the series APF is to compensate the voltage
disturbance in the source side, which is due to the fault in the
distribution line at the PCC. The series APF control
algorithm calculates the reference value to be injected by the
series Active Power Filter (APF) transformers, comparing
thepositive-sequence component with the load side line
voltages. The proposed series APF reference voltage signal
generation system is shown in Fig. 4. In equation (8), supply
voltages v(Sabc) are transformed to d-q-0 coordinates
the output frequency f Converter and the sampling time t. The
supply frequency fs, is compared with the reference
frequency fs*.The frequency error signal Δfs is applied to a
frequency regulator/ controller. Usually the PI (proportionalintegral) type controller generates the reference frequency
fref. When fref is added to fs, the required supply frequency
fref* is obtained. This fref* is fed to the PLL which produce
the corresponding θ(sin θ,cos θ). The reference output
voltage vector (represented byUα ,Uβ) is provided by the
output current controller, and the reference input current
vector (represented by I ref) is determined by the input
voltages and the input displacement angle θ through the input
power factor control. The output currents have been
transformed i(abc)into i(α,β). This can be written as
The voltage in d axes ( vSd ) given in (9) consists of average
and oscillating components of source voltages ( sd v and sd
v~ ). The average voltage sd v is calculated by using second
order LPF (low pass filter).
ISSN: 2231-5381
The load side reference voltages v*Labc are calculated as
given
in equation (10). The switching signals are assessed by
comparing reference voltages ( v*Labc ) and the load
voltages (VLabc ) and through sinusoidal PWM controller.
http://www.ijettjournal.org
Page 98
National Conference on Engineering Trends in Medical Science – NCETMS - 2014
These three-phase load reference voltages are compared with
load line voltages and errors are then processed by sinusoidal
PWM controller to generate the required switching signals
for series APF IGBT switches.
C. current Harmonics Control
The shunt APF described in this part is used to compensate
the current harmonics and reactive power generated by the
nonlinear load. The shunt APF reference current signal
generation block diagram is shown in Fig. 5. The
instantaneous reactive power (p-q) theory is used to control
shunt APF in real time. In this theory, the instantaneous
three-phase currents and voltages are transformed to (α-β-0)
Coordinates as show in equation (11) and (12).
The source side instantaneous real and imaginary power
components are calculated by using source currents and
Phase-neutral voltages as given in (13). The instantaneous
real and imaginary powers include both oscillating and
average components as shown in (14). Average components
of p and q consist of positive sequence components ( p and q)
of source current. The oscillating components ( p ~ and q~ )
of p and q include harmonic and negative sequence
components of source currents. In order to reduce neutral
current, p0 is calculated by using average and oscillating
components of imaginary power and oscillating component
of the real power as given in equation (14). isα isβ is0are the
reference currents of shunt APF in α, β coordinates. These
currents are transformed to
three-phase system as shown in (15).
The reference currents are calculated in order to compensate
neutral, harmonic and reactive currents in the load. These
reference source current signals are then compared with
threephase source currents, and the errors are processed by
hysteresis band PWM controller to generate the required
switching signals for the shunt APF switches in expressed in
the equation [15].
V. SIMULATION RESULT
To validate the effectiveness of the proposed system based
wind mill, different cases have been examined for this study.
In the proposed topology simulations are carried out using
MAT LAB/ SIMULINK for voltage sag, current harmonics,
and
frequency regulation investigations. Results of each test are
described below. All the simulations are simulated with the
discrete sampling time of T=t/ts. (sec).Here ts=3*104 and t is
the one cycle period of the wave form.
A Voltage sag
In Fig. 6 the CF-UPFC compensates the sag and swells
voltage effectively as shown in the simulation result. During
the sag and swell condition the wind power production is
Fig 5 Control system of shunt and series active filter
ISSN: 2231-5381
http://www.ijettjournal.org
Page 99
National Conference on Engineering Trends in Medical Science – NCETMS - 2014
Fig 6:power production against voltage sag swell condition
affected as shown in figure(6). After implementing CFUPFC, the sag and swell is not affected by the wind
production as shown in figure(7).
Fig.7.CF-UPFC based compensated power production
voltage sag, swell condition
B Current harmonics
The matrix converter draws non sinusoidal current from the
power supply as shown in figure 8. In the figure the current
total harmonic distortion is 100 %.
Figure.7.supply current before CF-UPQC
Fig.9. Supply current after CF-UPQC implemented in wind
mill
Fig. 9 shows that after the implementation of CF-UPQC, the
input current goes to sinusoidal. It effectively compensates
the current harmonics. The simulation result shows the single
After the implementaion of the CF-UPFC the
windmillterminal frequency is 50 Hz constant when the input
frequencyvariation condition.so the power production by
wind mill
also constant shown in figure 11.
Fig.11. supply frequency (vs) power production
VI. CONCLUSION
This paper has investigated the effects of fixed speed Wind
turbine generator on voltage sag, voltage swell and supply
frequency variation conditions. A new system constant
frequency unified power flow controller (CF-UPFC) has been
proposed to evaluate the wind mill connected with microgrid
system. Simulation studies have been carried out in
MATLAB/SIMULINK software to examine the impacts of
FSIWTG on the steady-state under unbalanced, supply
frequency fluctuation conditions. This new power quality
conditioner compensates the voltage sag, swell, supply
frequency and mitigates the current harmonics. Simulation
shows that the CFUPFC behaves satisfactorily during steady
state and transient periods. The proposed system effectively
mitigates almost all power quality issues present in the
windmill.
REFERENCES
phase only. The total current is 20KA. The simulation
iscarried out for a period of 0.2 sec to 0.57sec as shown in
figure9.
C . Power frequency variation control
Here the supply frequency is 50 Hz at normal condition. The
permissible limit of the supply frequency is 49.5Hz to
50.51Hz
particularly for FSIWTG. But in micro grid it will vary from
47 -52Hz. In this supply frequency, the variation of the wind
mill power production will be affected. When the supply
frequency increases rapidly, the generator power production
rapidly decreases from 400 KW to 100KW rapidly as shown
in the figure 10.
Fig .10 .supply frequency (vs) power production
ISSN: 2231-5381
[1]
B.Awad,N.Jenkins. “Control of Distributed Generation”
Electrotechink
Nad Information Techink,vol 12 ,2008,pp409-414.
[2]
E. Haesen, F. Minne, J. Driesen, M.Bollen “Hosting Capacity for
Motor
Starting in Weak Grids” IEEE International Conference on Future
Power Systems. 2005 pp 6-12, .
[3] B.Prokuda, “Power quality site surveys for industrial and commercial
buildings” IEEE Industrial and Commercial Power Systems Technical
Conference, 1994. pp 97 – 103
[4] H.Akagi, E. Watanabe, E,M. Aredes, “Combined Series and Shunt
power Conditioners” Instantaneous Power Theory and Applications to
Power Conditioning .ch6 , 2007,pp265 - 374
[5] K. Palanisamy, J.SMishra, I.J Raglend, D.P .Kothari, IEEE Joint
International Conference Power Electronics, Drives and Energy
Systems (PEDES) & 2010 Power India, 2010 pp1-5 .
[6] P.JenoPaul, I.J Raglend, T.R.D Prakash, “ Constant frequency-unified
power quality conditioner” IEEE International Conference on
Emerging
Trends in Electrical and Computer Technology (ICETECT), 2011 ,
pp 1- 8 .
[7] Khadkikar, V.; Chandra, A.; Barry, A.O.; Nguyen, T.D. Conceptual
Study of “Unified Power Quality Conditioner (UPQC)”, IEEE
International Symposium on Industrial Electronics ,Vol( 2) , 2006 , pp
1088 - 1093
[8] L .Ribickis, I.Galkin, “Direct frequency converters for induction motor
drives” IEEE International Symposium on Industrial Electronics,
1999.
http://www.ijettjournal.org
Page 100
National Conference on Engineering Trends in Medical Science – NCETMS - 2014
ISIE '99. Proceedings of the Vol 1 ,1999 , pp 26 - 30 .
[9] Yang Mei, Kai Sun,Daning Zhou,Lipei Huang “ Analysis and
Compensation of matrix converter operation under abnormal input
voltage conditions” IEEE International Power Electronics and Motion
Control Conference,. IPEMC 2004. Vol3 2004 , pp 1311 - 1315 .
[10] I .Sato, J .Itoh, H .Ohguchi, A .Odaka, H .Mine,“Method of Matrix
Converter Drives Under Input Voltage Disturbances Improvement ”
IEEE Transactions on Power Electronics,Vol 22( 1) 2007 ,
pp 132 - 138
[11] K. C. Divyaa; P.S. Nagendra Raoa Effect of Grid Voltage and
Frequency Variations on the Output of WindGenerators” Electric Power
Components and Systems, Taylor & Francis no36: vol
6,2008.pp 602 — 614.
[12] M .Imecs, A.M. Trzynadlowski, I.I .Incze, C .Szabo,
“Vector control schemes for Tandem-converter fed induction motor
drives”“IEEE Transactions on Power Electronics, Vol 20(2), 2005 , pp
493 - 501 .
[13] P.Jenopaul “Shunt Active and Series Active Filters-Based Power
Quality Conditioner for Matrix Converter” Advances in Power
Electronics.2011,pp1-9.
[14] P.JenoPaul, I.J Raglend, T.R.D Prakash “power quality improvement
of
matrix converter using UPQC” Transaction of Measurement and
Control,2011,vol.1pp23.
ISSN: 2231-5381
http://www.ijettjournal.org
Page 101
National Conference on Engineering Trends in Medical Science – NCETMS - 2014
A survey on Adaptive Clustering Routing Protocol using
Twice Cluster Head Selection
Kaustubh L. Thakare
Manish S. Chaudhary
Department of Electronics and Telecommunication
Priyadarshini College Of Engineering, Nagpur
Department of Electronics and Telecommunication
ABSTRACT
Networking together hundreds or thousands of cheap
microsensor nodes allows users to accurately monitor
a remote environment by intelligently combining the
data from the individual nodes. These networks
require robust wireless communication protocolsthat
are energy efficient and provide low latency. In this
paper, we develop and analyze low-energy adaptive
clustering
hierarchy (LEACH),
a
protocol
architecture for microsensor networks that combines
the ideas of energy-efficient cluster-based routingand
media access together with application-specific data
aggregation to achieve good performance in terms of
system lifetime, latency, and application-perceived
quality. LEACH includes a new, distributed cluster
formation technique that enables self-organization of
large numbers of nodes, algorithms for adapting
clusters and rotating cluster head positions to evenly
distribute the energyload among all the nodes, and
techniques to enable distributed signal processing to
save communication resources. Our results show that
LEACHcan improve system lifetime by an order of
magnitude compared with general-purpose multihop
approaches.
Index
Terms—
Data
aggregation,
protocol
architecture, wireless microsensor networks.
1. INTRODUCTION
ADVANCES in sensor technology, low-power
electronics, and low-power radio frequency (RF)
design have enabled the development of small,
relatively inexpensive and low-power sensors,
called microsensor, that can be connected via a
wireless network. These wireless microsensor
networks represent a new paradigm for extracting
data from the environment and enable the reliable
monitoring of a variety of environments for
applications that include surveillance, machine
failure
diagnosis,
and
chemical/biological
detection. An important challenge in the design of
these networks is that two key resources—
communication bandwidth and energy—are
Priyadarshini College of Engineering
significantly more limited than in a tethered
network environment. These constraints require
innovative design techniques to use the available
bandwidth and energy efficiently.
In order to design good protocols for wireless
microsensor networks, it is important to understand
the parameters that are relevant to the sensor
applications. While there are many ways in which
the properties of a sensor network protocol can be
evaluated, we use the following metrics.
A. Ease of Deployment
Sensor networks may contain hundreds or
thousands of nodes, and they may need to be
deployed in remote or dangerous environments,
allowing users to extract information in ways that
would not have been possible otherwise. This
requires that nodes be able to communicate with
each other even in the absence of an established
network infrastructure and predefined node
locations.
B. System Lifetime
These networks should function for as long as
possible. It may be inconvenient or impossible to
recharge node batteries. Therefore, all aspects of
the node, from the hardware to the protocols, must
be designed to be extremely energy efficient.
C. Latency
Data from sensor networks are typically time
sensitive, so it is important to receive the data in a
timely manner.
D. Quality
The notion of “quality” in a microsensor network is
very different than in traditional wireless data
networks. For sensor networks, the end user does
not require all the data in the network because
The data from neighbouring nodes are highly
correlated, making the data redundant and the end
user cares about a higher-level description of
events occurring in the environment being
monitored.
2. BACKGROUND
Since both device and battery technology has
only recentlymatured to the point where
microsensor nodes are feasible, this is a fairly new
field of study. Researchers have begun discussing
not only the uses and challenges facing sensor
ISSN: 2231-5381
http://www.ijettjournal.org
Page 102
National Conference on Engineering Trends in Medical Science – NCETMS - 2014
networks, but have also been developing
preliminary ideas as tohow these networks should
function as well as theappropriate low-energy
architecture for the sensor nodes themselves.
There have been some application-specific
protocols developedfor microsensor networks.
Clare et al. developed a timedivisionmultipleaccess (TDMA)MAC protocol for low-energy
operation. Using a TDMA approach saves energy
by allowingthe nodes to remain in the sleep state,
with radios powered-down, for a long time.
Intanagonwiwat et al. developed directeddiffusion,
a protocol that employs a data-driven model to
achieve low-energy routing.
Recently, there has been much work on “poweraware”routing protocols for wireless networks. In
theseprotocols, optimal routes are chosen based on
the energy ateach node along the route. Routes that
are longer, but whichuse nodes with more energy
than the nodes along the shorterroutes, are
favoured, helping avoid “hot spots” in the
network.In LEACH, we use randomized rotation of
the cluster headpositions to achieve the same goal.
Another method of wireless communication is
to use clustering.In this case, nodes send their data
to a central clusterhead that forwards the data to
get it closer to the desired recipient.Clustering
enables bandwidth reuse and can, thus,
increasesystem capacity. Using clustering enables
better resource allocationand helps improve power
control.
While conventional cluster-based networks rely
on a fixed infrastructure, new research is focusing
on ways to deploy clusteringarchitectures in an adhoc fashion. Earlywork by Baker et al. developed a
linked cluster architecture,where nodes are
assigned to be ordinary nodes, clusterhead nodes,
or gateways between different clusters. Thecluster
heads act as local control centres, whereas the
gatewaysact as the backbone network, transporting
data betweenclusters. This enables robust
networking
with
point-to-pointconnectivity.
Another ad-hoc clustering protocol, the near
termdigital radio (NTDR), uses a clustering
approach with a two-tierhierarchical routing
algorithm. Nodes form local clusters,and intracluster data are sent directly from one node to
thenext, whereas inter-cluster data are routed
through the clusterhead nodes. This protocol
enables point-to-point connectivityand does not use
low-energy routing or MAC; therefore, it isnot
suited for microsensor networks. LEACH builds on
this work by creating a new ad-hoc cluster
formation algorithm thatbetter suits microsensor
network applications.
ISSN: 2231-5381
3. Literature Survey
3.1 A survey on sensor networks
The authorspresent communication architecture
for sensor networks and proceed to survey the
current research pertaining to all layers of the
protocol stack: Physical, Data Link, Network,
Transport and Application layers.
A sensor network is defined as being composed
of a large number of nodes which are deployed
densely in close proximity to the phenomenon to be
monitored. Each of these nodes collects data and its
purpose is to route this information back to a sink.
The network must possess self-organizing
capabilities sincethe positions of individual nodes
are not predetermined. Cooperation among nodes is
the dominant feature of this type of network, where
groups of nodes cooperate to disseminate the
information gathered in their vicinity to the user.
Major differences between sensor and ad-hoc
networks:
Number of nodes can be orders of magnitude higher.
Sensor nodes are densely deployed
Sensor nodes are prone to failure.
Frequent topology changes.
Broadcast communication paradigm.
Limited power, processing and power capabilities.
Possible absence of unique global identification per
node.
The authors point out that none of the studies surveyed
has a fully integrated view of all the factors drivingthe
design of sensor networks and proceeds to present its
own communication architecture and designfactors to be
used as a guideline and as a tool to compare various
protocols. After surveying the literature,this is our
impression as well and we include it in the open research
issues that can be explored for futurework. The design
factors listed by the authors:
Fault Tolerance: Individual nodes are prone to
unexpected failure with a much higher probability
thanother types of networks. The network should
sustain information dissemination in spite of failures.
Scalability: Number in the order of hundreds or
thousands. Protocols should be able to scale to such
high degree and take advantage of the high density of
such networks.
Production Costs: The cost of a single node must be
low, much less than $1.
Transmission Media: RF, Infrared and Optical.
Power Consumption: Power conservation and power
management are primary design factors.
3.2 Directed Diffusion: A Scalable and
Robust Communication
Problem
Sensor networks have different requirements than
other wireless networks. The need for robustness
andscalability leads to the design of localized algorithms,
http://www.ijettjournal.org
Page 103
National Conference on Engineering Trends in Medical Science – NCETMS - 2014
where sensors only interact with other sensors in
restricted vicinity and have at best an indirect global
view.
Approach
The authors argue in favour of designing localized
algorithms and present directed diffusion as a set
ofabstractions that describe the communication patterns
underlying such algorithms. The design featuresdiffer
from traditional wireless networks and are data-centric
and application-specific.
Data-centric refers to the fact that in sensor networks
we
are
mostly
interested
in
retrieving
informationmatching certain attribute values and very
rarely we will be interested only in data from a specific
node. Thisapproach decouples data from the sensor that
produced it and unique identification of nodes is of
secondary importance. Application-specific refers to the
awareness across all layers of the specific application so
thatintermediate nodes can perform data aggregation,
caching and informed forwarding.
The authors proceed to describe a two-level cluster
formation algorithm, where cluster heads are elected
based on available energy. They present a localized
algorithm for object tracking to demonstrate the
difficulties that arise. The design is difficult because
localized algorithms need to produce a certain
globalbehaviour with at best indirect global knowledge.
Furthermore, localized algorithms tend to be sensitive in
the choice of parameter values.
In order to overcome these difficulties, they suggest
the design and prototyping of adaptive fidelity
algorithms, where the fidelity of the retrieved data can be
traded against energy efficiency, network lifetime and
network bandwidth. Furthermore, by developing
techniques for characterizing the performance of
localizedalgorithms it is possible to quantify those
tradeoffs and produce the expected behaviour.
The authors propose .directed diffusion. to be used as
an abstraction to model the communication patternsof
localized algorithms. The data that each sensor generates
is characterized by a number of attributes.Other sensors
that are interested in a certain type of data, disseminate
this interest to the network (in theform of attributes and
degree of interest). As the interests disseminate, gradients
are established that directthe diffusion of data when it
becomes available, i.e., reverse paths are established for
data that matches aninterest.
3.3Energy-efficient communication protocol for
wireless microsensor networks
The authors present a 2-level hierarchical routing
protocol (LEACH) which attempts to minimize
globalenergy dissipation and distribute energy
consumption evenly across all nodes. This is achieved by
theformation of clusters with localized coordination, by
rotating the high-energy cluster heads and by
locallycompressing data.
The model used in this paper makes the following
assumptions:
There exists one fixed base station with no energy
constraints and a large number of sensor nodes that are
mostly stationary, homogeneous and energy
constrained.
ISSN: 2231-5381
The base station is located at some distance from the
sensor nodes and the communication between a sensor
node and the base station is expensive.
The purpose of the network is to collect data through
sensing at a fixed rate (i.e. there is always something to
send) and convey it to the base station. The raw data is
too much and must be locally aggregated into a small
set of meaningful information.
The nodes self-organize into local clusters with one
node in each cluster acting as a cluster head. Once a
cluster has formed, the cluster members send their data to
the cluster head (low energy transmission) which in turn
combines the data and sends it to the base station (high
energy transmission). This organization of the nodes
creates a 2-level hierarchy.
For their analysis, the authors compare their scheme
with a direct communication protocol (each sensor sends
data directly to the base station) and the minimum-energy
routing protocol. In the latter, data destined for the base
station is routed through many intermediate nodes that
can each be reached with minimum energy transmission.
A static clustering scheme is also used where cluster
heads are not rotated. Their results indicate that LEACH
reduces communication energy by as much as 8x. Also,
the first node death inLEACH occurs over 8 times later
and the last node dies over 3 times later.
3.4 A Transmission Control Scheme for Media
Access in Sensor Networks
Problem
Media access control in sensor networks must be
energy efficient and allow fair bandwidth allocation to all
the nodes. The authors examine how CSMA based
medium access can be adapted for sensor networks.
CSMA strategies include listening to the channel before
transmission, using explicit positive or negative
acknowledgments to signal collision, relying on time
synchronized slotted channels or performing collision
detection. However, these approaches are not directly
applicable due to the characteristics of sensor networks:
Network operates as a collective structure. Its
primary goal is the sampling of the environment and
the propagation of the samples, possibly processed
and aggregated, toward one or more gateways.
Traffic tends to be periodic and highly correlated.
Conventional schemes make the assumption
ofstochastically distributed traffic.
Every node is both a data source and a router.
Node capabilities are very restricted.
Equal cost per unit time for listening, receiving and
transmitting.
Approach
The authors outline a CSMA-based MAC and
transmission control scheme to achieve fairness while
being energy efficient. They categorize media access
control mechanisms into listening, backoff, contention
control and rate control mechanisms.Listening combined
with backoff mechanism: Neighbouring nodes will sense
the same event and attemptto transmit at the same time.
According to the proposed scheme, whenever nodes need
http://www.ijettjournal.org
Page 104
National Conference on Engineering Trends in Medical Science – NCETMS - 2014
to transmit theyintroduce random delay followed by a
constant listening period. If the channel is free, then they
transmit.Otherwise, they enter in a backoff period, during
which the radio is turned off. This backoff period is
alsoapplied as a phase shift to the periodicity of the
application, aiming to desynchronize nodes.Contention
control mechanism: Such a mechanism should use the
minimum number of control packets. If the traffic load
justifies it, then a combination of request-to-send (RTS)
and clear-to-send (CTS) controlpackets can be used.
Rate control mechanism: MAC should control the rate of
the originating data of a node in order to allow route-thru
traffic to access the channel and reach the base station.
The adaptive rate control proposed, usesloss as collision
signal to adjust transmission rate in a manner similar to
the congestion control in TCP.
All CSMA schemes achieve good channel utilization
and aggregate fairness is almost insensitiveto the
presence of backoff. However, backoff plays an
important role in maintaining proportional fairness
when using a fixed window size or binary
exponential decrease in window size.
Randomness in the pre-collision phase provides
robustness.
Schemes with constant listen period achieve best
energy efficiency.
Following a transmission failure with a random shift
in the sampling interval, allows the nodes tobreak
away from synchronization which listening and back
off fail to detect.
Interesting Points
The adaptive rate control balances the in-node
generated traffic with the route-thru traffic by
usingpacket loss as a signal to decrease traffic.
Notion of a phase shift at the application level to
break the periodicity of the sensor sampling.
Metrics for multihop fairness and energy efficiency
(measuring bandwidth delivery to base station)for
evaluating MAC schemes.
Good overview of the purpose and characteristics of
sensor networks in the introduction.
Evaluation platform consists of only 10 nodes with
on base station in both single and multihop scenarios.
3.5 The Resurrecting Duckling:
Problem
Provide support for secure transient association
between a master and a slave device or between peers in
awireless ad-hoc network. Consider, as an example, a
universal remote that controls most appliances in
yourhome which are networked in a wireless ad-hoc
fashion. The remote needs to be associated with each
ofthe appliances in a secure way, in the sense that an
identical remote purchased by your neighbour will not
beable to control these devices.
Approach
The solution proposed is formalised in the
Resurrecting Duckling security policy model. The slave
device is termed as the duckling and the master controller
acts as its mother duck. The name and terminology is
ISSN: 2231-5381
inspired by biology and specifically from the fact that a
duckling recognizes as its mother the first moving object
it sees that makes a sound when it emerges from its egg.
This phenomenon is called imprinting.
Consequently, a device can be in one of two states:
imprint able (waiting for a shared secret that will
associate it with another master device) and imprinted
(already associated).
The imprinting can take place with physical electrical
contact, which transfers a secret key that binds the device
to the specified master forever. In the original model,
once a device is associated with another master device, it
only obeys that device until it is instructed to become
imprint able again.
However, this model was too limiting since it did not
allow interaction with other entities. It was extended in
the second paper to include the specification of policy
where for each action the master device specifies what
credentials are required to be presented by a another
device in order to request that action.
3.6Talking to strangers: Authentication in adhoc
wireless networks
Problem
Provide support for secure communication and
authentication in wireless ad-hoc networks without
anypublic key infrastructure. Specifically, when device A
chooses to establish connection to a previouslyunknown
device B, device A needs know that it is actually
communicating securely and authentically withdevice B
and not with an attacker.
Approach
The approach is an extension and formalization of
the .Resurrecting Duckling policy model. and
providesbootstrapping secure wireless communication
through pre-authentication over a location limited
channel.The location-limited channel is different from
the main wireless link and is chosen so that it has two
specialsecurity
properties:
(i)
demonstrative
identification (identification based on physical context)
(ii) Authenticity, in the sense that is difficult for an
attacker to transmit on the channel undetected. As an
example,good candidates for a location-limited channel
are actual physical contact, sound, infrared, etc, (in
generalcommunication technologies with inherent
physical limitations).This approach does not require
secrecy, necessary in the .Resurrecting Duckling, making
it impervious toeavesdropping. This is achieved through
public key cryptography. The participants use the
location-limited channel to exchange their public keys or
the digests of the keys. This concludes the preauthenticationphase and they can proceed to authenticate
themselves over the wireless channel and establish a
secret keyfor the session.
4. Existing Protocol: (LEACH)
Low-Energy
Adaptive
Clustering Hierarchy
(LEACH), proposed by Heinzelman et al. is one of the
pioneering clustering routing approaches for WSNs. The
basic idea of LEACH has been an inspiration for many
subsequent clustering routing protocols. The main
objective of LEACH is to select sensor nodes as CHs by
http://www.ijettjournal.org
Page 105
National Conference on Engineering Trends in Medical Science – NCETMS - 2014
rotation, so the high energy dissipation in communicating
with the BS is spread to all sensor nodes in the network.
The operation of LEACH is broken up into lots of
rounds, where each round is separated into two phases,
the set-up phase and the steady-state phase. In the set-up
phase the clusters are organized, while in the steady-state
phase data is delivered to the BS. During the set-up
phase, each node decides whether or not to become a CH
for the current round. This decision is based on the
suggested percentage of CHs for the network and the
number of times the node has been a CH so far. This
decision is made by the node choosing a random number
between 0 and 1. The node becomes a CH for the current
round if the number is less than the following threshold:
Where,P is the desired percentage of CHs, is the current
round, and is the set of nodes that have not been elected
CHs in the last 1/P rounds. When a node is elected CH
successfully, it broadcasts an advertisement message to
the other nodes. According to the received signal strength
of the advertisement, other nodes decide to which cluster
it will join for this round and send a membership
message to its CH. In order to evenly distribute energy
load among sensor nodes, CHs rotation is performed at
each round by generating a new advertisement phase
based on Equation (1). During the steady-state phase, the
sensor nodes sense and transmit data to the CHs. The
CHs compress data arriving from nodes that belong to
the respective cluster, and send an aggregated or fused
packet to the BS directly. Besides, LEACH uses a
TDMA/code-division multiple access (CDMA) MAC to
reduce inter-cluster and intra-cluster collisions. After a
certain time, which is determined a priori, the network
goes back into the set-up phase again and enters another
round of CH election. Figure showed the basic topology
of LEACH.
Fig: The Basic Topology of LEACH
The advantages of LEACH include the following:
(1) Any node that served as a CH in certain round cannot
be selected as the CH again, so each node can equally
share the load imposed upon CHs to some extent;
(2) Utilizing a TDMA schedule prevents CHs from
unnecessary collisions; (3) Cluster members can open or
ISSN: 2231-5381
close communication interfaces in compliance with their
allocated time slots to avoid excessive energy dissipation.
There exist a few disadvantages in LEACH as follows:
(1) It performs the single-hop inter-cluster, directly from
CHs to the BS, routing method, which is not applicable
to large-region networks. It is not always a realistic
assumption for single-hop inter-cluster routing with long
communication
range.
Besides,
long-range
communications directly from CHs to the BS can breed
too much energy consumption; (2) Despite the fact that
CHs rotation is performed at each round to achieve load
balancing, LEACH cannot ensure real load balancing in
the case of sensor nodes with different amounts of initial
energy, because CHs are elected in terms of probabilities
without energy considerations. Sensor nodes, with lower
initial energy, that act as CHs for the same number of
rounds as other sensor nodes, with higher initial energy,
will die prematurely. This could bring about energy holes
and coverage problems; (3) since CH election is
performed in terms of probabilities, it is hard for the
predetermined CHs to be uniformly distributed
throughout the network. Thereby there exist the elected
CHs that are concentrated in one part of the network and
some nodes that have not any CHs in their vicinity;
(4)The idea of dynamic clustering brings extra overhead.
For instance, CH changes and advertisements may
diminish the gain in energy consumption.
5. Taxonomy of Clustering Schemes:
In the literature, clustering attributes in WSNs,
generally, can be roughly classified into cluster
characteristics, cluster-head characteristics, clustering
process and entire proceeding of the algorithm. In this
section, we discuss a lot of detailed clustering attributes
for WSNs, and propose a more comprehensive and finegrained taxonomy compared to that of previous work.
The categories included in the taxonomy are individually
analyzed in the subsections that follow.
5.1 Classification of Clustering Attributes in WSNs
5.1.1 Cluster Characteristics
Variability of Cluster Count: Based on variability of
cluster count, clustering schemes can be classified into
two types: fixed and variable ones. In the former scheme,
the set of cluster-head are predetermined and the number
of clusters is fixed. However, the number of clusters is
variable in the latter scheme, in which CHs are selected,
randomly or based on some rules, from the deployed
sensor nodes.
Uniformity of Cluster Sizes: In the light of uniformity of
cluster sizes, clustering routing protocols in WSNs can
be classified into two classes: even and uneven ones,
respectively with the same size clusters and different size
clusters in the network. In general, clustering with
different sizes clusters is used to achieve more uniform
energy consumption and avoid energy hole.
Intra-Cluster Routing: According to the methods of intercluster routing, clustering routing manners in WSNs also
include two classes: single-hop intra-cluster routing
methods and multiple-hop ones. For the manner of intracluster single-hop, all MNs in the cluster transmit data to
the corresponding CH directly. Instead, data relaying is
used when MNs communicate with the corresponding
CH in the cluster.
Inter-Cluster Routing: Based on the manners of intercluster routing, clustering routing protocols in WSNs
include two classes: single-hop inter-cluster routing
manners and multiple-hop ones. For the manner of inter-
http://www.ijettjournal.org
Page 106
National Conference on Engineering Trends in Medical Science – NCETMS - 2014
cluster single-hop, all CHs communicate with the BS
directly. In contrast to it, data relaying is used by CHs in
the routing scheme of inter-cluster multiple-hop.
5.1.2. Clustering Process
Control Manners: Based on control manners of
clustering, clustering routing methods in WSNs can be
grouped into centralized, distributed and hybrid ones. In
centralized methods, a sink or CH requires global
information of the network or the cluster to control the
network or the cluster. In distributed approaches, a sensor
node is able to become a CH or to join a formed cluster
on its own initiative without global information of the
network or the cluster. Hybrid schemes are composed of
centralized and distributed approaches. In this
environment, distributed approaches are used for
coordination between CHs, and centralized manners are
performed for CHs to build individual clusters.
Parameters for CH Election: Based on the parameters
used for CH election, clustering approaches can be
categorized as deterministic, adaptive, and random ones.
In deterministic schemes, special inherent attributes of
the sensor nodes are considered, such as the identifier
(ID), number of neighbours they have. In adaptive
manners, CHs are elected from the deployed sensor
nodes with higher weights, which includes such as
residual energy, communication cost, and etc. In random
modes, mainly used in secure clustering algorithms, CHs
are elected randomly without regard to any other metrics
like residual energy, communication cost, etc.
Objectives: As discussed in the previous section, a few
objectives have been pursued for cluster construction,
such as data aggregation/fusion, load balancing, faulttolerance, guarantee of connectivity, lifetime extension,
quality of service, etc. Accordingly, clustering methods
in WSNs can be classified into the above categories
based on different objectives
[2]
[3]
[4]
[5]
[6]
[7]
[8]
pp.
179-181,doi:CNKI:SUN:JYRJ.0.2008-03-068
(in
Chinese).
Akkaya K., Younis M., “A survey on routing protocols for
wirelesssensor networks,” Ad Hoc Networks, Vol. 3, 2005,
pp. 325-349,doi:10.1016/j.adhoc.2003.09.010.
Heinzelman W., Chandrakasan A., Balakrishnan H.,
“Energyefficientcommunication protocol for wireless
microsensor networks,”Proc. Of the 33rd Annual Hawaii
Int’l Conf. on SystemSciences(HICSS-33), Maui:IEEE
Computer Society, 2000, pp. 3005-3014.
Heinzelman W. B., Chandrakasan A. P., Balakrishnan H.,
“Anapplication-specific protocol architecture for wireless
microsensornetworks,”
IEEE
Trans
on
Wireless
Communications, Vol. 1, No. 4,2002, pp. 660-670,
doi:10.1109/TWC.2002.804190.
Wu Xinhua, Wang Sheng, “Performance Comparison of
LEACH andLEACH-C Protocols by NS2,” Proc.of the 9th
InternationalSymposium on Distributed Computing and
Applications
to
Business,Engineering
and
Science(DCABES 2010), IEEE Computer Society,Aug.
2010, pp. 254-258, doi:10.1109/DCABES.2010.58.
C. Intanagonwiwat, R. Govindan, and D. Estrin, “Directed
diffusion: Ascalable and robust communication paradigm
for sensor networks,” inProc. Fourth Annu. ACM Int. Conf.
Mobile Computing and Networking(MobiCom), Boston,
MA, Aug. 2000, pp. 56–67.
A. Woo and D. Culler. A Transmission Control Scheme for
Media Access in Sensor Networks. InACM MobiCom, 2001.
D. Balfanz, D. Smetters, P. Stewart, and H. Wong. Talking
to strangers: Authentication in adhocwireless networks. In
Symposium on Network and Distributed Systems Security,
2002.
6. Entire Proceeding of Algorithm:
Algorithm Stages: In general, a complete clustering
routing algorithm comprises two basic stages, i.e., cluster
construction and data transmission, but the consideration
degree of algorithms may differ in different stages. Based
on algorithm stages of whole process of clustering
algorithms, clustering routing protocols in WSNs can be
classified into cluster construction based and data
transmission based ones. In the former algorithm, cluster
construction is mainly discussed, while data transmission
is concerned less or performed by a relatively simple
way.
Conclusion:
Considering the nodes remaining energy and their
distances to the regional centre in a wireless sensor
network makes the nodes with more remaining energy
more possible to become cluster heads and these
cluster heads will not appear at the edge of the region,
so the cluster heads can cover larger area. Reselecting
cluster head in the cluster makes the cluster head as
close as possible to the centroid of the cluster area and
its energy is greater than the average residual energy
of nodes in the cluster, reducing the energy
consumption for inside cluster communications.
References:
[1] Mao Xiaofeng, Yang Min, et al., “SURVEY ON
WIRELESSSENSOR NETWORK APPLICATIONS,”
Computer Applicationsand Software, Vol. 25, No. 3, 2008,
ISSN: 2231-5381
http://www.ijettjournal.org
Page 107
National Conference on Engineering Trends in Medical Science – NCETMS - 2014
Chemical Synthesis and Characterization of
Conducting Copolymers
Polyaniline/Polythiophene
S. R. TAKPIRE and *S. A. WAGHULEY
*
Department of Physics, Dr. B. N. College of Engg. Tech., Yavatmal-445 001, India.
Department of Physics, Sant Gadge Baba Amravati University, Amravati-444 602, India.
Abstract
Oligomerization reactions of thiophene
and
aniline
monomers
and
chemical
copolymerization of these oligomers were
investigated for synthesis of sample powder. The
chemical oxidative polymerization of thiophene
and aniline mixture polyaniline (PANI) and
polythiophene (PTh) occurs when anhydrous
FeCl3 is used as oxidative agent. The different
concentration of FeCl3 was taken for
polymerisation.
It was observed that
homopolymer and copolymer colloids of
different compositions are formed, respectively,
depending on the concentration of FeCl3 used.
The product was collected in form of powder
sample. The characteristic was done through
FTIR analysis. Also the mechanism of
conductivity was discussed.
Keywords:
Thiophene;
Copolymerization.
Aniline;
1. Introduction
The
discovery
of
electronically
conducting polymers offers a promise to open
many new applications for polymeric materials.
In particular, polythiophene, polyaniline have
attracted attention. But all of these conducting
polymers are insoluble and infusible which
makes practical applications rather difficult [1].
Due to a great variety of applications in many
fields, such as electrochromism, electro
luminescence, sensors, and energy storage
systems, conducting polymers have become the
ISSN: 2231-5381
subjects of increased research interest. Although
conducting polymers, such as polyaniline
(PANI), polythiophene (PTh), polypyrrole (PPy)
etc. have been studied extensively [2].
The conducting polymers based on
heterocycles such as PANI, PTh and PPy have
attracted considerable attention in recent years
due to their high conductivity, interesting
electrochemical properties and easy preparation.
Several applications of these polymers are
promising
such
as
batteries,
sensors,
electrochromic devices, and electronic devices
[3]. Electrochemically generated polythiophene
and polyaniline films are advantageous for these
applications as they show a good stability to
oxygen and moisture in both undoped and doped
forms. Conducting copolymers have high
potential for modifying the physical properties of
the homopolymers, providing materials with
intermediate properties between two polymer
systems and potentially soluble and processable
conducting materials [4].
Attempts
have
been
made
to
copolymerize different kinds of heterocyclic
compounds such as aniline-thiophene improve
the processability of the resulting conducting
structure. However, only limited work was
reported about aniline-thiophene copolymer due
to the large difference between the oxidation
potentials of two types of monomers.
Bithiophene was used for copolymerization
instead of thiophene. However thiophene is more
conventional, could synthesize aniline and
thiophene copolymers and composites in Fecl3
http://www.ijettjournal.org
Page 108
National Conference on Engineering Trends in Medical Science – NCETMS - 2014
and is used on electropreparation of conducting
with a magnetic stirrer, which gives rise to the
polymers [5].
formation of a black precipitate. The resulting
Among the conducting polymers, special interest
black precipitate was vacuum filtered. The
has been focused on PANI due to excellent
precipitate was washed with copious amounts of
thermal and environment stability combined with
triply distilled water until the washings were
relatively high level of electrical conductivity.
clear. The copolymer and mixture of PTh/PANI
Nevertheless a few applications have been
so obtained was soft jet-black powder, dried in a
reported based on PANI because it exhibits poor
desiccator’s overnight and again dried in an oven
mechanical properties. For the commercial use of
at 40 °C. In this way, different samples
conducting polymer composites, a complete
copolymer PTh, PANI were prepared with
different concentration (2-6M) of FeCl3.
understanding of their properties is necessary.
Considerable efforts have been made over several
The IR spectra of powders were recorded on
decades to study the effect of filler on the
Shimadzu (Model-8201) FTIR in the KBr
dynamic electric and mechanical properties of the
medium at room temperature in the region 3900–
polymer [6].
450 cm−1 at a 0.97 cm−1 resolution averaging 16
scans.
In this present research work, PTh/PANI
copolymerized and mixture conducting polymers
3. Results and Discussion
were synthesized through chemical route by
using different concentration of oxidant (FeCl3)
in the form of powder samples. The thick films of
The FTIR spectrum (Fig. 1.) of the
powder samples were prepared by screensample of 1:4 M concentrations was taken to
printing technique on a glass substrate.
confirm
the
copolymerization
of
aniline/thiophene monomer mixture.
FTIR
spectrum of PTh/PANI characteristics bands
2. Experimental
observed at 1576, 1457, 1366, 1134, 911 cm–1 is
six principal absorption peaks were observed in
1)
AR grade chemicals (MerckFTIR spectrum. The peaks at 1590 cm-1 and 1508
India), monomer of thiophene and aniline, ferric
cm-1 are assigned to C-C ring stretching
chloride, were used in the present work. The
vibrations. The peaks at 1292 cm-1 correspond to
thiophene and aniline monomers were used in 1:1
NH bending. The corresponding peaks for the
M. The solution of 1M FeCl3 was prepared with
polyaniline salt appear at 1593, 1505, 1292,
organic solvent (methanol). After the rigorous
1246, and 845 cm-1 respectively. The peak at
stirring, drop-by-drop mixture of monomers was
2388 cm-1 could be attributed as due to N-H
added in to the solution. In the polymerization
stretching mode and the 1685cm-1 bands to the
reaction of mixture of monomers, it was observed
N-H bending vibration [8]. The peak value
that as soon as the monomer mixture was added
697cm-1 may be assigned to C-Cl stretching. The
to the solution, the color changed almost
peak value 2923 cm-1 was assigned to C-H
instantaneously and the solution became dark
stretching vibration in PTh. The bands 1458,
green/black. There was an increase in
1596 cm-1 may be assigned to C=C stretching in
temperature of the solution during the start of
PTh. The C-H in-plane bending and C-S bending
reaction, which was an indication of exothermic
were observed at 1118 cm-1 and 747 cm-1
reaction [7]. The reaction was carried out at room
respectively [9]. The peaks value 1424, 1180,
temperature. The reaction was stirred for 24 h
907, 637 cm-1 may be assigned to the copolymer.
ISSN: 2231-5381
http://www.ijettjournal.org
Page 109
% Absobtion
National Conference on Engineering Trends in Medical Science – NCETMS - 2014
In
metals
and
conventional
semiconductors, charge transport occurs in
delocalized states. Such a model is no longer
valid
in
low
conductivity
organic
semiconductors, where a simple estimate shows
that the mean free path of carriers would become
lower than the mean atomic distance [11]. In
these materials, the π-electrons are delocalized
within a molecule and the carrier transport occurs
through hopping of charges from one molecule to
another.
Since the π-conjugated system in
conducting polymers extends over the whole
polymer chain, the conducting polymers can be
regarded
as
one-dimensional
polymer
semiconductors [5]. In these materials, in
Wavenumber (cm )
addition to direct electron and hole excitations
across the semiconductor band gap, the onedimensional system may support a host of exotic
Fig.1. FTIR spectra of copolymer PTh/PANI with 4M
carrier types like solitons (topological defects
concentration of FeCl3.
without charge, with spin ½), polarons (electrons
and holes, self-trapped by carrier-lattice
Most polymers are insulator because their
interactions)
soliton-polarons
(charged
electrons are localized, that is, each of the
topological defects without spin, self-trapped by
electrons is attached to its own nucleus [10]. In
carrier-lattice interactions), bipolarons (two
organic solids, intramolecular interactions are
carriers with charge of the same sign, bound by
mainly covalent, but intermolecular interactions
lattice distortion), and polaron-excitons (two
are due to much weaker Vander Waals and
carriers with charge of opposite sign, bound by
London forces [5]. However, the conducting or
lattice distortion).
semiconducting polymers have the conjugated
double bonds. The double bond consists of a σ4. Conclusions
bond and a π-bond. The electrons in the σ-bonds
form the backbone of the chain, dominating the
The chemical synthesis of PTh/PANI
mechanical properties of the polymers. Due to
copolymer is a simple method. The
the π-orbital overlap of neighbouring molecules
copolymerization was confirmed from FTIR
of the conjugated structure, the π-electrons
analysis. FTIR spectrum of PTh/PANI
delocalize along the entire chain, which provides
characteristics bands were observed at peaks
their semiconduting and conducting properties
1576, 1457, 1366, 1134, 911 cm–1 and these
[5]. The σ-bonds form completely filled, lowshowed six principal absorption peaks in FTIR
lying energy bands have a much larger ionization
spectrum. The peaks values 1424, 1180, 907, 637
potential than π-electrons (and a much large
cm-1 may be assigned to the copolymer. The
bandgap) and thus do not contribute in a major
conducting or semiconducting polymers have the
way to the electrical and optical properties. The
conjugated double bonds. The double bond
π-bands, however, form an energy band in which
consists of a σ-bond and a π-bond. The electrons
each carbon atom contributes one electron, and
in the σ-bonds form the backbone of the chain,
thus the band should be half-filled because of the
dominating the mechanical properties of the
spin degeneracy [10].
polymers. Due to the π-orbital overlap of
-1
ISSN: 2231-5381
http://www.ijettjournal.org
Page 110
National Conference on Engineering Trends in Medical Science – NCETMS - 2014
neighboring molecules of the conjugated
structure, the π-electrons delocalize along the
entire chain, which provides their semiconduting
and conducting properties.
Acknowledgements
Authors are thankful to Head, Department
of Physics Sant Gadge Baba Amravati
University, Amravati for providing necessary
facilities. One of the authors S.A. Waghuley is
thankful to University Grant Commission (New
Delhi), for financial assistance in term of minor
research project F.No. 37-565/2009 (SR).
References:
[1] B.C.Roy, M.D.Gupta, L.Bhowmik, J.K.Ray, Bull.Mater.Sci., 24
(2001) 389.
[2] S. A. Waghuley, R. S. Bobade, A. V. Kohle, G. G. Muley, S. S.
Yawale, F. C.
Raghuvanshi, B. H. Pawar, S. P. Yawale, Optoelectronics and Advanced
Materials-Rapid Communications(OAM-RC), 4 (2010) 97.
[3] S.A. Waghuley, Journal of Electron Devices, 10 (2011) 433.
[4] K.A.Koparkar,
K.R.Nemade, R.S.Palaspagar, S.S.Kosalge,
G.T.Bhalerao, G.G.Muley, B.H.Pawar, S.A.Waghuley, Bionano Frontier
(Special Issue), (2010) 27.
[5] S.A. Waghuley, Ph.D. Thesis, Sant Gadge Baba Amravati University,
Amravati, India,(2007).
[6] A.Shakoor, T.Z. Rizvi, A.Nawaz, Mater Sci: Mater Electron, 22
(2011) 1076.
[7] S.A. Waghuley, S.M. Yenorkar, S.S. Yawale, S.P. Yawale, Sensors
and Actuators B, 128 (2008) 366.
[8] J. Stejskal, Pure Appl.Chem., 74 (2002) 857.
[9] S.Gnanakan, M. Rajasekhar, A. Subramania, Int. J. Electrochem. Sci.,
4 (2009)
1289
[10] M.S. Xuediao Cai, Ph.D. Thesis, Dreshan University of Technology,
China, (2005).
[11] A.B. Kaiser, Advanced Materials, 13 (2001) 927.
ISSN: 2231-5381
http://www.ijettjournal.org
Page 111
National Conference on Engineering Trends in Medical Science – NCETMS - 2014
Sign Language Glove with Text Synthesizer
Imran S. Khan#1, Priyanka N. Bendre*2
#
PG student Department of Electronics & Telecommunication, DBNCOET, Yavatmal, SGBAU, Amravati,
(ms) India
*PG student Department of Electronics & Telecommunication, DBNCOET, Yavatmal, SGBAU, Amravati,
(ms )India
Abstract— Sign language is a language used by deaf and dumb
people and it is a communication skill that uses gestures instead of
sound to convey meaning simultaneously combining hand shapes,
orientation and movement of the hands, arms or body and facial
expressions to express fluidly a speaker’s thoughts. Signs are used
to communicate words and sentences. A gesture in a sign language
is a particular movement of the hands with a specific shape made
out of it. A sign language usually provides sign for whole words. It
can also provide sign for letters to perform words that don’t have
corresponding sign in that sign language. In this paper Flex
Sensor plays the major role, Flex sensors are sensors that change
its resistance depending on the amount of bend on the sensor.
This paper uses ATMEGA 16 controller to control all the
processes and flex sensors will track the movement of fingers as
well as entire palm. LCD will be used to display the user’s gesture
into text message.
Keywords— Sign language, text synthesizer, flag sensors,
ATMEGA 16 Microcontroller.
[1] I.INTRODUCTION
Aims to extend the communication capabilities of those with
hearing and speech disabilities after interacting with hearing and
speech impaired athletes at their school, the quad squad team set
out to develop a way for those who know sign language to
communicate easily with those whose don’t. Their solution
includes a hardware component the gloves fitted with various
sensors and a software component which translates the hand
signals into text in real time.
The goal of paper is to recognize hand gestures using flex
sensor, for the people, suffering in physiologically disability of
speaking or in non communicative state. The dumb people are
unable to speak but they can move their hand, finger using
gesture movement. This gesture movement generate thesignal
and these signal display on display board in the form of text
message. Normal people cannot understand the sign language of
dumb people but by reading text from display board they can
understand the feelings of dumb people and they know what
these people want. This paper provides easy communication of
dumb people with normal person. For such type of people we are
using flex sensor which gives the analog voltage of movement and
the same voltage converted into digital information of the
necessity of the persons to be displayed on the LCD screen
attached at the receivers end forrespectivevoltage value captured
by the flex sensors. The wireless communication is achieved by
using RF cc2500 module.
ISSN: 2231-5381
[2]
II .BLOCK DIAGRAM
SIGNAL
CONDITIONING
ATMEGA 16
MICRO
CONTROLLER
INPUT DATA
DISPLAY
Fig. 1 Block Diagram
For the system to be implemented, requirement of following
different modules were considered as the individual blocks for
operation.
1. Input sensors for Hand Gesture Recognition.
2. Signal Conditioning for Data Compatibility to next
Stage.
3. Microcontroller for Data Process and Action.
4. Display Device for Data and Menu Display.
In this paper, flex sensors will act as an input device,
generating different voltages from its output pin. Now this
input will be send to the microcontroller for processing by
executing the code embedded in the microcontroller. Here
Microcontroller will send a signal that the information will be
display on LCD screen and the encoder will do encoding
before sending to the receiver end via transmitter using
CC2500.
In the receiver end a receiver module will be attached
with the circuit which will detect the signal transmitted from
the transmitter end and send to the decoder for decoding the
signal into its original form, after decoding the signal, the
signal send to microcontroller, after that the information will
be display on LCD screen.
http://www.ijettjournal.org
Page 112
National Conference on Engineering Trends in Medical Science – NCETMS - 2014
[3]
III. WORKING OF MODULE
The function starts with the 8-pin receiver, which receive
whatever signal coming from the RF CC2500 transreceiver
module. The receiver fed this digital signal to microcontroller
through serial transmission for processing and whatever
information is transmitted by RF CC2500 transreceiver
module will display on LCD at the receiver. In this circuit,
buzzer is attached to CC2500 module which indicates that the
signal is continuously coming from transmitter.
In both the circuit we are using soft wire antenna. There are
DIP switches used in both section to match the frequency for
the authenticate communication.
A. Transmitter Circuit
[4]
IV. FLEX SENSOR
Fig.2 Circuit Diagram of Transmitter Section
Transmitter section works as a circuit used to transmit the
signal to the receiver; this is achieved by using RF module.
The flex sensors gives the output of gesture in the form of
analog voltages, these voltages are fed to microcontroller for
processing over that analog voltage, and these analog voltages
can be converted into digital by using ADC, which are inbuilt
in AVR microcontroller for processing the data. The output of
microcontroller is fed to serial transmitter and LCD display
for displaying the message where the signal is transmitted to
receiver by using RF CC2500 transreceiver module
B. Receiver Circuit
Fig. 4 Flex Sensor
Flex sensors are normally attached to the glove using needle
and thread. They require a 5-volt input and output between 0
and 5 V, the resistivity vary with the sensor’s degree of bend
and the voltage output changes accordingly. The sensors
connect to the device via three pin connector (ground, live,
and output). The device can activate the sensors from sleep
mode, enabling them to power down when not in use thus
greatly reducing power consumption. The flex sensor pictured
below changes resistance when bent. It only changes
resistance in one direction. A flex sensor has a resistance of
about 10 K-Ohms. As the flex sensor is bent, the resistance
increases to 30- 40 kilo ohms at 90degrees. The sensor
measures 0.25 inches wide, 4.5 inches long and 0.19 inches
thick.
Fig. 5 Basic Flex sensor circuit
Fig.3 Circuit Diagram of Receiver Section
ISSN: 2231-5381
http://www.ijettjournal.org
Page 113
National Conference on Engineering Trends in Medical Science – NCETMS - 2014
In this two or three sensors are connected serially and the
output from the sensors is input to the analog to digital
converter in the controller. The outputs from the flex sensors
are input to LM258/LM358 op-amps and used a non-inverted
style setup to amplify their voltage. Greater the degree of
bending the lower the output voltage. The output voltage is
determined based on the equation {Vin [R1 / (R1 + R2)]},
where R1 is the other input resistor to the non-inverting
terminal. Using the voltage divider concept the output voltage
is determined and it ranges from 1.35v to 2.5v.
In our paper we used ATmega16microcontroller, because it
satisfies our all requirements, also its data processing speed is
fast as compare to other microcontroller.
VI. ADVANTAGES
Low cost system
Compact system
Flexible to users
It takes less power consumption to operate system.
[6]
1.
2.
3.
4.
[7] VII. APPLICATIONS
This approach can be used in various applications that are
related to speech disabilities and that have many advantages
and may vary on the basis of conditions, some of the
applications are as follows
1.
2.
3.
4.
Fig. 6 Gloves with Flex sensor
[5]
V. MICROCONTROLLER ATMEGA 16
Fig.7 AT-Mega 16 Microcontroller
ATmega16 is an 8-bit high performance microcontroller of
Atmel’s Mega AVR family. Atmega16 is based on enhanced
RISC (Reduced Instruction Set Computing) architecture with
131 powerful instructions. Most of the instructions execute in
one machine cycle. Atmega32 can work on a maximum
frequency of 16MHz. ATmega16 has 16 KB programmable
flash memory, static RAM of 1 KB and EEPROM of 512
Bytes. The endurance cycle of flash memory and EEPROM is
10,000 and 100,000, respectively. ATmega32 consist of 4
input/output ports, which we can use to obtained output and to
give input as per need. It consist of inbuilt ADC, USART,
Analog Comparator, SPI, JTAG, hence there is no need
toattached external devices.
ISSN: 2231-5381
It was basically designed for the patient or dumb
people those are in non-communicative state, with
the help of movements they can communicate,
sofollowing are the cases in which the patient can
make use of our device
Physically challenged persons
Conveying information related operations
This approach has wider range of application in ICU,
ICCU, and general ward of a hospital.
[8] VIII. FUTURE WORK
Changes are the prominent and key aspect in technology
development. No developer can say that his / her proposed
system is complete and no future changes are required. Every
system has some life and need some development or
improvisation as per current or future demands.
The completion of this prototype suggests that sensor
gloves can be used for partial sign language recognition. More
sensors can be employed to recognize full sign language. A
handy and portable hardware device with built in translating
system, speakers and group of body sensors along with the
pair of data gloves can be manufactured so that a deaf and
dumb person can communicate to any normal person
anywhere. We can send message to anyone by using GSM
module
[9] IX.LIMATATION
As none of existing system is 100% accurate it may have
some limitations in it such as it works under the 100 meter of
range
[10] X. CONCLUSION
Sign language is a useful tool to ease the communication
between the deaf or dumb community and the normal people.
Yet there is a communication barrier between these
communities with normal people. This paper aims to lesser the
communication gap between the deaf or dumb community and
the normal world. This paper was meant to be a prototype to
check the feasibility to recognize sign language using sensor
http://www.ijettjournal.org
Page 114
National Conference on Engineering Trends in Medical Science – NCETMS - 2014
gloves. With this paper the deaf or dumb people can use the
gloves to perform sign language and it will be converted in to
speech so that normal people can easily understand. The main
feature of this paper is the gesture recognizer is a standalone
system, which is applicable in daily life.
REFERENCES
[47]
[48]
[49]
[50]
[51]
[52]
[53]
[54]
Charlotte Baker Shenk & Dennis Cokely, American Sign Language, A
teacher’s resource text on Grammar and Culture, Clerc Books
Gallaudet University Press, Washington D.C., 1981.
Al-Saihati, “Feature Extraction for Real Time recognition of the Arabic
Sign language”, MS thesis, KFUPM 2006.
M. Martinez and A. C. Kak, “PCA versus LDA”, IEEE Transaction on
Pattern Analysis and machine intelligence, Vol. 23, No. 2, pp. 228233, 2001.
Sanshzar Kettebekov, Mohammed Yeasin and Rajeev Sharma,
“Improving Continuous Gesture Recognition with Spoken Prosody”,
Proceedings of the 2003 IEEE Computer Society Conference on
Computer Vision and Pattern Recognition (CVPR’03), ISBN # 10636919/03, pp.1-6.
Masumi Ishikawa and Hiroko Matsumura, “Recognition of a HandGesture Based on Self organization Using a Data Glove”, ISBN # 07803- 5871-6/99, pp. 739-745.
Byung-Woo Min, Ho-Sub Yoon, Jung Soh, Yun-Mo Yangc, and
Toskiaki Ejima, “Hand Gesture Recognition Using Hidden Markov
Models”, ISBN # 0-7803-4053-1/97, pp.4232-4235
Attila Licsár and Tamás Szirány, “Dynamic Training of Hand Gesture
Recognition System”, in Proceedings of the 17th International
Conference on Pattern Recognition (ICPR’04), ISBN # 1051- 4651/04,
“Sign language-to-speech translating gloves” Darren Quick
ISSN: 2231-5381
http://www.ijettjournal.org
Page 115
National Conference on Engineering Trends in Medical Science – NCETMS - 2014
Distinguishing fade and dissolve from camera
motion and object motion
Amol Alkari1, Milind Gajghate2, Prof. Salim A. Chavan3
1
PG Student, Department of E&TC, DBNCOET, Yavatmal, 445001, India
PG Student,Department of E&TC, DBNCOET, Yavatmal, 445001, India
3
Associate Prof, Department of E&TC,DBNCOET, Yavatmal, 445001, India.
2
Abstract— To reconstruct scenes from a given video, the key
frames need to be extracted to represent the main content of each
shot. In this paper, efficient key frame extraction techniques
based mainly on transition detection are proposed. The main
idea is to measure the similarity of content of two consecutive
frames and based on that locate the fadesand dissolves. A new
algorithm which combines the histogram similarity and edge
change ratio is used to locate transition between shots. To
enhance its effectiveness, an adaptive thresholding technique is
applied. For fade and dissolve detection, an approach called
edge-based contrast (EC) is proposed. The proposed algorithms
were tested on a large variety of videos of different kinds and
formats. The simulation results are tabulated. Future work may
be focused on improvement in the values of recall and precision
especially in presence of object and camera motion.
Keywords— key frames, fade, dissolve, transition.
XXXI. INTRODUCTION
The high number and variety of available videos makes the
search and retrieval of content a more and more difficult task.
The search and visualization effort of videos implies a waste
of time. All of these problems can be reduced or eliminated if
proper indexing and retrieval methods could be applied. The
demand for video summary work originates from a viewing
time constraint as well as communication and storage
limitations in security, military and entertainment
applications. For example in an entertainment application, a
user may want to browse summaries of his/her personal video
taken during several trips; in a security application, a
supervisor might want to see a 2 minutes summary of what
happened at particular airport gate in the last 10 minutes.
In a military situation a soldier may need to communicate
strategic informationwith a limited battery energy transmitter.
Instead of sending all frames, better option is to transmit a
subset of the frames with higher SNR quality. A video
summary generator that can optimally select frames based on
an optimality criterion is essential for these applications. The
solution to this problem is typically based on a twostep
approach: first identifying video shots from the video
sequence and then selecting key frames according to some
criterion from each video shot to generate video summary for
the sequence.
To identify video shot boundaries and determine key
frames by thresholding, a technique require two pass
ISSN: 2231-5381
sequence. We assume that all the information is presented by
the frames included in the summary and the temporal
distortion is introduced by the missing frames. Gradual shot
change detection is one of the most important issue in the field
of video indexing, retrieval. Among the various types of
gradual transitions, the fade and dissolve type the gradual
transition is consider the most common one, but it is most
difficult one to detect. In most of the existing fade and
dissolve detection algorithms, the false/miss detection
problem caused by motion is very serious. In this paper we
present a novel fades and dissolve type transition detection
algorithm that can correctly distinguish fades and dissolve
from camera and object motion. This paper is based on the
video processing using MATLAB software. A shorter version
of the original video sequence called frame is desirable in a
number of applications where storage, communication
bandwidth and power are limited. While distinguishing the
fade and dissolve from camera motion and object motion, we
introduce a frame distortion metric and the temporal distortion
which is then modelled as the frame distortion between the
original and the reconstructed sequences.
XXXII. CLASSIFICATION OF TRANSITION EFFECT
Abrupt Transition
Abrupt transition is the instantaneous transitions
which can be observe in two consecutive frames. Ex. Cut
Gradual Transition
Gradual transitions occurs slowly or gradually and
can be observe along a range of frames
Ex. 1) Fade (Fade In and Fade Out)
2) Dissolve
3) Wipe
Fig. 1Different types of transition
http://www.ijettjournal.org
Page 116
National Conference on Engineering Trends in Medical Science – NCETMS - 2014
FADE (FADE IN-FADE OUT)
A fade is a transition in which every pixel on the screen
fades into single colour typically white or black.
detection results obtained from the non-sampled video
sequence, our algorithm worked better on the sampled video
sequence. Second, we have even noted that the probability
that the intensity of a pixel either increases or decreases
between two consecutive frames is 1/2 in a non-dissolve
sequence. Usually the following three measures are used to
measure the quality of algorithm.
XXXIV. PERFORMANCE MEASURE
For the evaluation of detection algorithm, the precision
and recall can be computed using following formulae.
Fig.2 Consecutive frames illustrating a fade-to-back transition
FADE IN
It is a gradual transition of a scene by increasing overall
brightness and contrast until clear frame is obtained.
Recall(R)
Precision (P)
Where C, M and F are the numbers of correct, miss and
false detects respectively.F1 is a combined measure that
results in high value ifand only if both precision and recall
result in high values:
Fig. 3 Frame in fades in
FADE OUT
It is a gradual transition of a scene by diminishing overall
brightness and contrast until all the contents are lost (Usually
a black frame).
Fig. 4 Frame in fade out
DISSOLVE
Dissolve is a gradual super-imposition of two consecutive
shots. The first shot fades out while the second shot
simultaneously fades in.
Fig. 5 Dissolve transition
XXXIII. FALSE DETECTION AND MISDETECTIONS
In this section, we focus on the issues of false detection and
misdetection of dissolves. First, it is possible that some
consecutive frames may show no intensity change during
longer dissolve sequences. To correctly detect longer dissolve
sequences while maintaining correct detection in the original
sequences, we dynamically sample video frames to ensure that
most of the pixels will change in intensity. In contrast to the
ISSN: 2231-5381
F1measure
∗ ∗
The recall and precision values are calculated by checking
if the transition framewindows overlapped. Therefore only
one frame overlap between the reference and detected
transitions is required to produce good results. Additional
performance indicators are needed to describe how accurately
the system is able to spot the starting point and length of the
transitions. This accuracy is measured using frameprecision
and frame recall.
These values are calculated using only the reference
transitions that were found and the corresponding detected
transitions. That is the detected transitions and the reference
transitions without a match are discarded when calculating
these values.
XXXV. MOTION ANALYSIS
Motion analysis is a topic in computer vision, image
processing and machine vision that studies applications in
which two or more consecutive images from an image
sequencesare processed to produce information based on the
apparent motion in the images. In some applications, the
camera is fixed relative to the scene and objects are moving
around the scene. In some applications the scene is more or
less fixed and the camera is moving and in some cases both
the camera and the scene are moving. The motion analysisis
used to detect motion i.e. find the points in the image where
something is moving. The information that is produced is
often related to a specific image in the sequence,
corresponding to a specific time-point but then depends also
http://www.ijettjournal.org
Page 117
National Conference on Engineering Trends in Medical Science – NCETMS - 2014
on the neighbouring images. This means that motion analysis
can producetime-dependent information about motion.
Applications of motion analysis can be found in rather diverse
areas such as surveillance, medicine, film industry, and
navigation of autonomous vehicles. A video camera can be
seen as an approximation of a pinhole camerawhere each
point in the image is illuminated by some point in the scene in
front of the camera. Each visible point in the scene is
projected along a straight line that passes through the camera
aperture and intersects the image plane. This means that at a
specific point in time, each point in the image refers to a
specific point in the scene. This scene point has a position
relative to the camera and if this relative position changes, it
corresponds to a relative motion in 3D.
It is a relative motion since it does not matter if it is the
scene point or the camera or both that are moving. It is only
when there is a change in the relative position that the camera
is able to detect that some motion has happened. By projecting
the relative 3D motion of all visible points back into the
image, the result is the motion field, describing the apparent
motion of each image point in terms of a magnitude and
direction of velocity of that point in the image plane. A
consequence of this observation is that if the relative 3D
motion of some scene pointsisalong their projection lines, the
corresponding apparent motion is zero.
The camera measures the intensity of light at each image
point. In practice, a digital camera measures this light field at
discrete points i.e. pixels but given that the pixels are
sufficiently dense, the pixel intensities can be used to
represent most characteristics of the light field that falls onto
the image plane. A common assumption of motion analysis is
that the light reflected from the scene points does not vary
over time. As a consequence, if an intensity I has been
observed at some point in the image, the same intensity I will
be observed at a position that is displaced relative to the first
one as a consequence of the apparent motion. Another
common assumption is that there is a fair amount of variation
in the detected intensity over the pixels in an image. A
outcome of this assumption is that if the scene point that
corresponds to a certain pixel in the image has a relative 3D
motion, then the pixel intensity is likely to change over time.
Motion analysis is also applicable in the manufacturing
process. Using high speed video cameras and motion analysis
software, one can monitor and analyseassembly lines and
production machines to detect inefficiencies or malfunctions.
Manufacturers of sports equipment such as baseball bats and
hockey sticks also use high speed video analysis to study the
impact of projectiles. Motion analysis can be divided into two
types
1. Camera Motion Analysis
level video feature, CMA is quite important for video retrieval
and it is also quite useful for video content analysis.
When the camera moves fast, there will be
significant displacement between consecutive frames, which
may lead to inaccurate optical flow estimation.
An initial estimation of the camera motion model is
computed by linear least square and in each of the following
iterations, the motion vectors that have large bias from the
model estimated in the previous iteration are removed before
re-estimating the camera motion model. Video with these
significant camera and object motion large view point changes
and significant object motion between the consecutive frames
brings the significant appearance variance. In thispaper we
present a camera motion approach which work affectively for
video indexing.
2. Object Motion Analysis
Object motion analysis includes moving object
detection and tracking. Object detection in videos involves
verifying the presence of an object in image sequences and
possibly locating it precisely for recognition. To distinguish
difference moving object, motion classifications is done by
classifying object motion into several levels according to
corresponding position, orientation and magnitude.
XXXVI. RESULT
Finally the result that we have observed manually and the
result obtained from algorithm are tabulated and considered
for the determination of recall and precision.
Manual Observations
Camera Motion Analysis (CMA) aims at finding out
the information of camera movements during shooting based
on analysing video data and a parametric model that reflects
the image coordinate correspondences between consecutive
frames. Since camera motion information is important low
ISSN: 2231-5381
http://www.ijettjournal.org
Page 118
National Conference on Engineering Trends in Medical Science – NCETMS - 2014
CLIP1
CLIP 2
CLIP
CLIP 4
CLIP5
CLIP 6
CLIP 7
CLIP 8
CLIP 9
CLIP 10
7
FADE
0
DISSPLVE
7
FADE
0
DISSOLVE
18
FADE
5
DISSOLVE
22
FADE
32
DISSOLVE
1
FADE
6
DISSOLVE
28
2
DISSPLVE
10
FADE
12
DISSOLVE
7
FADE
10
DISSOLVE
24
FADE
0
DISSOLVE
8
FADE
1
DISSPLVE
7
FADE
0
DISSOLVE
15
FADE
6
TOTAL FADE
67
DISSOLVE
20
TOTAL DISSOLVE
136
FADE
34
DISSOLVE
0
FADE
4
DISSOLVE
30
CLIP5
CLIP 6
CLIP 7
CLIP 8
CLIP 9
CLIP 10
Table 2 Result from Algorithm
XXXVII.
Table 1 Manual Observation
Result from Algorithm
The set of videos that we have considered for manual
observation is given as an input to the Matlab code and the
result obtained from the programme is tabulated in the table 2.
ISSN: 2231-5381
DISSOLVE
FADE
81
CLIP 4
0
6
TOTAL DISSOLVE
CLIP 3
FADE
DISSOLVE
40
CLIP 2
26
0
TOTAL FADE
CLIP1
DISSOLVE
FADE
FADE
0
DISSOLVE
7
FADE
2
DISSPLVE
12
FADE
12
DISSOLVE
8
FADE
10
FUTURE EXPANSION AND
CONCLUSIONS
In this paper, we have proposed an efficient method
for detecting gradual transitions. Also shot boundary detection
method using colour histogram difference as the main feature
of analysis in front of camera and moving objects.In this
paper, an effective camera and object motion analysis
approach for video analysis is considered. The experimental
results show that our method especially works effectively on
shots from action movies which contain more significant
camera motions and object motions.
In this paper, we have proposed an efficient method
for detecting dissolve-type gradual transitions. Recall values
obtained by this algorithm are in the [77% - 85%] range while
precision values are in the [66% - 82%] range. The main
contributions of this paper are the threshold of proposed
algorithm can be determined theoretically.A binomial
distribution model is used to distinguish real dissolves from
motion. As most general motions can be filtered out by using
a very low threshold, a real dissolve effect can be easily
detected.
REFERENCES
[55]
W. A. C. Fernando, C. N. Canagarajah, D. R. Bull, (1999) IEEE
International Conference on Image Processing 3, 299-303J. S.
Boreczky and L. A. Rowe. Comparison of Video Shot Boundary
Detection Techniques.
http://www.ijettjournal.org
Page 119
National Conference on Engineering Trends in Medical Science – NCETMS - 2014
[56]
[57]
[58]
[59]
[60]
[61]
W. A. C. Fernando, C. N. Canagarajah, and D. R. Bull, “Fade and
dissolve detection in uncompressed and compressed video sequences,”
in Proc. IEEE Int. Conf. Image Processing, vol. 3, Oct. 1999
In Storage and Retrieval for Still Image and Video Databases IV, Proc.
SPIE (2000)
Tong Zhang and Carlo Tomasi. Fast, Robust, and Consistent Camera
Motion Estimation. Computer Vision and Pattern Recognition.(2003)
FabricioTiburzi and JesúsBescós, “Camera Motion Analysis in On-line
MPEG Sequences”, in Proceedings of Eighth InternationalWorkshop
on Image Analysis for Multimedia Interactive Services, Santorini,
Greece(2007)
J. Xiao, H. Cheng, F. Han, H. S. Sawhney. Geo-spatial aerial video
processing for scene understanding and object tracking.(2009)
Chih-Wen Su, Hong-Yuan Mark Liao, Hsiao-RongTyan and Kuo-Chin
Fan“A Motion-Tolerant Dissolve Detection Algorithm,” IEEE
transactions on mulmultimedia, vol. 7, no. 6, December
ISSN: 2231-5381
[62]
[63]
[64]
[65]
[66]
JehoNamand Ahmed H. Tewfik, “Detection of Gradual Transitions in
Video
Sequences Using B-Spline Interpolation,” IEEE transactions
on multimedia, vol. 7, no. 4, august 2005 667
Joe Diggins, “Detecting Cross-Fades in Interlaced Video with 3:2 Film
Cadence,” IEEE transactions on circuits and systems for video
technology, vol. 19, no. 7, July 2009 1063
Qing-GeJi, Jian-Wei Feng, Jie Zhao and Zhe-Ming Lu “Effective
Dissolve Detection Based on Accumulating Histogram Difference and
the Support Point,”978-0-7695-4180-8/10 © 2010 IEEEDOI
10.1109/PCSPA.2010.110
Tuanfa Qin, JiayuGu, Huiting Chen, Zhenhua Tang “A Fast Shotboundary Detection based on K-step Slipped Window,” 978-1-42446853-9/10/2010 IEEE
Zhang xiaona, Qi guoqing, Wang Qiang and Zhang Tao “An Improved
Approach of Scene Change Detection in Archived Films” 978-1-42445900-1/10©2010 IEEE
http://www.ijettjournal.org
Page 120
National Conference on Engineering Trends in Medical Science – NCETMS - 2014
“Cell
Breathing Techniques for Load Balancing in
Wireless LANs”
Nikhil N. Dukare#1, Suraj D. Dhale*2
#
#
Student Department of Computer Engineering , Amravati university,Yavatmal,Maharastra,India
Student Department of Computer Engineering , Amravati university,Yavatmal,Maharastra,India
ABSTRACT
Maximizing network throughput while providing fairness is
one of the key challenges in wireless LANs (WLANs). This goal
is typically achieved when the load of access points (APs) is
balanced. Recent studies on operational WLANs, however,
have shown that AP load is often substantially uneven. To
alleviate such imbalance of load, several load balancing
schemes have been proposed. These schemes
commonly require proprietary software or hardware at
the user side for controlling the user-AP association. In
this paper we present a new load balancing technique by
controlling the size of WLAN cells (i.e., AP’s coverage
range), which is conceptually similar to cell breathing in
cellular networks. The proposed scheme does not
require any modification to the users neither the IEEE
802.11 standard. It only requires the ability of
dynamically changing the transmission power of the AP
beacon messages. We develop a set of polynomial time
algorithms that find the optimal beacon power settings
which minimize the load of the most congested AP. We
also consider the problem of network-wide min-max load
balancing. Simulation results show that the performance
of the proposed method is comparable with or superior
to the best existing association-based method.
INTRODUCTION
Recent studies on operational IEEE 802.11 wireless LANs
WLANs) have shown that traffic load is often unevenly
distributed among the access points (APs). In WLANs, by
default, a user scans all available channels and associates
itself with an AP that has the strongest received signal
strength indicator (RSSI), while being oblivious to the load
of APs. As users are, typically, not evenly distributed, some
APs tend to suffer from heavy load, while their adjacent APs
may carry only light load. Such load imbalance among APs
is undesirable as it hampers the network from fully utilizing
its capacity and providing fair services to users. In this
paper, we present a novel load balancing scheme that
reduces the load of congested APs by forcing the users near
the boundaries of congested cells to move to neighboring
less congested cells. We achieve this via cell size
dimensioning by controlling the transmission power of the
AP beacon messages. In this paper, a WLAN cell is defined
as a region in which the AP beacon signal has the strongest
ISSN: 2231-5381
RSSI. Our approach is conceptually similar to cell breathing
in cellular networks. We present an optimal algorithm that
finds deterministic min-max load balancing solutions.
Informally, a WLAN is called min-max load balanced, if it
is impossible to reduce the load of any AP without
increasing the load of other APs with equal or higher load.
Our approach is practical since it does not require either user
assistance or standard modification.
The project entitled as “Cell Breathing Techniques for
Load Balancing in Wireless LANs” developed using .NET using
C#.
Modules display as follows.
Client Model
Server Model
Network Model
Cell Breathing Approach
Congestion Load Minimization
Algorithmic challenges
MODULE DESCRIPTION
CLIENT MODEL
A client is an application or system that accesses a
remote service on another computer system, known as a
server, by way of a network. The term was first applied to
devices that were not capable of running their own stand-alone
programs, but could interact with remote computers via a
network. These dumb terminals were clients of the timesharingmainframe computer.
SERVER MODEL
In computing, a server is any combination of hardware
or software designed to provide services to clients. When used
alone, the term typically refers to a computer which may be
running a server operating system, but is commonly used to
refer to any software or dedicated hardware capable of
providing services.
NETWORK MODEL
Generally, the channel quality is time-varying. For the
ser-AP association decision, a user performs multiple
samplings of the channel quality, and only the signal
attenuation that results from long-term channel condition
changes are utilized Our load model can accommodate various
additive load definitions such as the number of users
associated with an AP. It can also deal with the multiplicative
user load contributions.
http://www.ijettjournal.org
Page 121
National Conference on Engineering Trends in Medical Science – NCETMS - 2014
CELL BREATHING APPROACH
We reduce the load of congested APs by reducing the size of
the corresponding cells. Such cell dimensioning can be
obtained, for instance, by reducing the transmission power of
the congested APs. This forces users near the congested cells’
boundaries to shift to adjacent (lesscongested) APs. The
separation between the transmission power of the data traffic
and that of the AP beacon messages. On one hand, the
transmission bit rate between a user and its associated AP is
determined by the quality of the data traffic channel.
Transmitting the data traffic with maximal power3 maximizes
the AP-user SNR and the bit rate. On the other hand, each user
determines its association by performing a scanning operation,
in which it evaluates the quality of the beacon messages of the
APs in its vicinity.
CONGESTION LOAD MINIMIZATION
The algorithms presented in Section 4 minimize the load
of the congested AP, but they do not necessarily balance the
load of the non congested APs, as demonstrated in Examples 4
and 5. In this section, we consider min-max load balancing
approach that not only minimizes the network congestion load
but also balances the load of the non congested APs. As
mentioned earlier, the proposed approach can be used for
obtaining various max-min fairness objectives by associating
each users with appropriate load contributions. Unfortunately,
min-max load balancing is NP-hard problem and it is hard to
find even an approximated solution. In this paper, we solve a
variant of the min-max problem, termed min-max priorityload balancing problem, whose optimal solution can be found
in polynomial time.
ALGORITHMIC CHALLENGES
FEASIBILITY STUDY
The feasibility of the project is analyzed in this phase and
business proposal is put forth with a very general plan for the
project and some cost estimates. During system analysis the
feasibility study of the proposed system is to be carried out.
This is to ensure that the proposed system is not a burden to
the company. For feasibility analysis, some understanding of
the major requirements for the system is essential.
Three key considerations involved in the feasibility analysis are
ECONOMICAL FEASIBILITY
TECHNICAL FEASIBILITY
SOCIAL FEASIBILITY
ISSN: 2231-5381
This study is carried out to check the economic impact
that the system will have on the organization. The amount of fund
that the company can pour into the research and development of the
system is limited. The expenditures must be justified. Thus the
developed system as well within the budget and this was achieved
because most of the technologies used are freely available. Only
the customized products had to be purchased.
1)
2) TECHNICAL FISIBILITY
3) This study is carried out to check the technical
feasibility, that is, the technical requirements of the system.
Any system developed must not have a high demand on the
available technical resources. This will lead to high demands
on the available technical resources. This will lead to high
demands being placed on the client. The developed system
must have a modest requirement, as only minimal or null
changes are required for implementing this system.
SOCIAL FEASIBILITY
The aspect of study is to check the level of acceptance of
the system by the user. This includes the process of training the
user to use the system efficiently. The user must not feel threatened
by the system, instead must accept it as a necessity. The level of
acceptance by the users solely depends on the methods that are
employed to educate the user about the system and to make him
familiar with it. His level of confidence must be raised so that he is
also able to make some constructive criticism, which is welcomed,
as he is the final user of the system.
SYSTEM REQUIREMENT SPECIFICATION
A greedy algorithm that reduces the power level of the
congested APs until any of the congested APs reaches to the
minimal power level. This will shift users from congested APs
to their neighbors, and the set of congested APs and their load
may change during the execution of the algorithm. A complete
knowledge model is feasible when all users collect the RSSI
information from all of the nearby APs. Such a feature is
suggested, for instance, in the IEEE 802.11- k proposal.
Unfortunately, this feature is currently not available in most
existing WLANs. We use this model as a building block for
the limited knowledge solution.
ECONOMICAL FEASIBILITY
EXISTING SYSTEM
Cell breathing has been studied mostly in the context of
CDMA cellular networks. The coverage and capacity of a CDMA
cell are inversely related with each other .The increase of the
number of active users in a cell causes the increase of the total
interference sensed at the base station. Therefore, in congested
cells, users need to transmit with higher power to maintain a certain
signal-to-interference ratio at the receiving base station. As the
users in a congested cell increase their transmission power, they
also increase their interference to the neighboring cells since all
cells use the same frequency in CDMA networks. As a result, the
overall network capacity may decrease. Furthermore, since the
maximal transmission power of the users is bounded, the users who
are far from the base station may experience poor services. To
overcome these problems, the cell breathing approach was
proposed. In essence, they reduce the size of congested cells.
PROPOSED SYSTEM
we address the problem of minimizing the load of the
congested APs. Let us call the AP with the maximal load as
congested AP and its load as congestion load. We designed two
polynomial time algorithms that find optimal solutions, one for the
complete knowledge model and the other for the limited knowledge
model. These results are intriguing, because similar load balancing
problems, are known to be strong NP-hard. It is particularly
interesting that a polynomial time optimal algorithm exists for the
limited knowledge model. Second, we address the problem of minmax load balancing. This is a strong NP-hard problem. In , it is
http://www.ijettjournal.org
Page 122
National Conference on Engineering Trends in Medical Science – NCETMS - 2014
proved that there exists no algorithm that guarantees any coordinate
wise approximation ratio, and the approximation ratio of any
prefix-sum approximation algorithm is at least nlogn , where n is
the number of APs. In this paper, we solve a variant of this minmax problem, termed min-max priority load balancing, whose
optimal solution can be calculated in polynomial time for both
knowledge models. Here, the AP load is defined as an ordered pair
of the aggregated load contributions of its associated users and a
unique AP priority.
REQUIREMENTS SPECIFICATION
product or system. Software design serves as a foundation for all
the software engineering steps that follow. Without a strong design
we risk building an unstable system – one that will be difficult to
test, one whose quality cannot be assessed until the last stage.
During design, progressive refinement of data structure,
program structure, and procedural details are developed reviewed
and documented. System design can be viewed from either
technical or project management perspective. From the technical
point of view, design is comprised of four activities – architectural
design, data structure design, interface design and procedural
design.
DATA FLOW DIAGRAM
U
1
1. HARDWARE REQUIREMENTS
U
•
•
•
•
•
•
A
P
2
U
3
System
: Pentium IV 2.4 GHz
Hard disk : 40 GB
Floppy drive
: 1.44 MB
Monitor : 15 VGA colour
Mouse
: Logitech.
RAM
: 256 MB
Balan
cing
U
Ove
4
Arloa
d
P
U
5
U
Bala
ncing
6
Ove
U-User
rloa
AP - Access
Point
U
2. SOFTWARE REQUIREMENTS
Ad
P
7
U
•
•
•
•
Operating system :- Windows XP / 7
Front End
: - Visual Studio 2010
Coding Language :- Visual C# .Net
Back-End
: - Sql Server 2008.
8
U
9
Fig. Data flow diagram
STATE
DIAGRAM
SYSTEM DESIGN
ANALYSIS AND DESIGN
Select the APs
Software design sits at the technical kernel of the
software engineering process and is applied regardless of the
development paradigm and area of application. Design is the first
step in the development phase for any engineered product or
system. The designer’s goal is to produce a model or representation
of an entity that will later be built. Beginning, once system
requirement have been specified and analyzed, system design is the
first of the three technical activities -design, code and test that is
required to build and verify software.
Sending signal load
to APs
Overload
yes
?
Balancing load by
Cell breathing
Method
No
Passing signal load
Sequentially to
SYSTEM IMPLEMENTATION
server
The importance can be stated with a single word
“Quality”. Design is the place where quality is fostered in software
development. Design provides us with representations of software
that can assess for quality. Design is the only way that we can
accurately translate a customer’s view into a finished software
ISSN: 2231-5381
S
Reaching the
server
Fig. State diagram
http://www.ijettjournal.org
Page 123
National Conference on Engineering Trends in Medical Science – NCETMS - 2014
SYSTEM IMPLEMENTATION
Implementation is the stage of the project when the theoretical
design is turned out into a working system. Thus it can be
considered to be the most critical stage in achieving a successful
new system and in giving the user, confidence that the new system
will work and be effective. The implementation stage involves
careful planning, investigation of the existing system and it’s
constraints on implementation, designing of methods to achieve
changeover and evaluation of changeover methods.
Implementation is the process of converting a new
system design into operation. It is the phase that focuses on user
training, site preparation and file conversion for installing a
candidate system. The important factor that should be considered
here is that the conversion should not disrupt the functioning of the
organization.
TECHNOLOGY DETAILS
Visual Studio
A programming language and environment developed by
Microsoft. Based on the BASIC language, Visual Studio was one
of the first products to provide a graphical programming
environment and a paint metaphor for developing user interfaces.
Instead of worrying about syntax details, the Visual Studio
programmer can add a substantial amount of code simply by
dragging and dropping controls, such as buttons and dialog boxes,
and then defining their appearance and behavior. Although not a
true object-oriented programming language in the strictest sense,
Visual Studio nevertheless has an object-oriented philosophy. It is
sometimes called an event-driven language because each object can
The purpose of the system testing is to consider all the
likely variations to which it will be suggested and push the system
to its limits. The testing process focuses on logical intervals of the
software ensuring that all the statements have been tested and on
the function intervals (i.e.,) conducting tests to uncover errors and
ensure that defined inputs will produce actual results that agree
with the required results. Testing has to be done using the two
common steps Unit testing and Integration testing. In the project
system testing is made as follows:
The procedure level testing is made first. By giving
improper inputs, the errors occurred are noted and eliminated. This
is the final step in system life cycle. Here we implement the tested
error-free system into real-life environment and make necessary
changes, which runs in an online fashion. Here system maintenance
is done every months or year based on company policies, and is
checked for errors like runtime errors, long run errors and other
maintenances like table verification and reports.
UNIT TESTING
Unit testing verification efforts on the smallest unit of
software design, module. This is known as “Module Testing”. The
modules are tested separately. This testing is carried out during
programming stage itself. In these testing steps, each module is
found to be working satisfactorily as regard to the expected output
from the module.
INTEGRATION TESTING
Integration testing is a systematic technique for
constructing tests to uncover error associated within the interface.
SYSTEM TESTING AND MAINTENANCE
react to different events such as a mouse click.
Testing is vital to the success of the system. System
testing makes a logical assumption that if all parts of the system are
correct, the goal will be successfully achieved. In the testing
process we test the actual system in an organization and gather
errors from the new system operates in full efficiency as stated.
System testing is the stage of implementation, which is aimed to
ensuring that the system works accurately and efficiently.
In the testing process we test the actual system in an
organization and gather errors from the new system and take
initiatives to correct the same. All the front-end and back-end
connectivity are tested to be sure that the new system operates in
full efficiency as stated. System testing is the stage of
implementation, which is aimed at ensuring that the system works
accurately and efficiently. The main objective of testing is to
uncover errors from the system. For the uncovering process we
have to give proper input data to the system. So we should have
more conscious to give input data. It is important to give correct
inputs to efficient testing. Testing is done for each module. After
testing all the modules, the modules are integrated and testing of
the final system is done with the test data, specially designed to
show that the system will operate successfully in all its aspects
conditions. Thus the system testing is a confirmation that all is
correct and an opportunity to show the user that the system works.
Inadequate testing or non-testing leads to errors that may appear
few months later. This will create two problems Time delay
between the cause and appearance of the problem. The effect of the
system errors on files and records within the system.
ISSN: 2231-5381
In the project, all the modules are combined and then the entire
programmer is tested as a whole. In the integration-testing step, all
the error uncovered is corrected for the next testing steps.
APPLICATION
In mobile networks nowadays using cell breathing technology
for roaming purpose to avoid overload in home network
Cell breathing method which finds deterministic global
optimal solutions for providing fairness to get the digital
voice clarity.
FUTURE ENHANCE
In future we can introduce this cell breathing technology in
internet connection mainly in WIFI technology. Already in this
project we proved that by using this method we can avoid the
network traffic or overload on APs.
If we apply this technology on WIFI connection means, we
can increase the speed of the internet and get connection
continuously without any interrupt. Definitely in future cell
breathing method would occupy the major part of the
communication field.
CONCLUSION
We presented a novel scheme for optimal load balancing
in IEEE 802.11 WLANs. We provided rigorous analysis of the
http://www.ijettjournal.org
Page 124
National Conference on Engineering Trends in Medical Science – NCETMS - 2014
problem and presented two algorithms that find Deterministic
optimal solutions. The first algorithm minimizes the load of the
congested AP(s) in the network, and the second algorithm produces
an optimal min-max (Priority) load balanced solution. These
optimal solutions are obtained only with the minimal information
which is readily available without any special assistance from the
748 IEEE TRANSACTIONS ON MOBILE COMPUTING, VOL.8
In this paper, we assume only the control on the transmission
power of the AP beacon messages. The simulations show that even
a small number of power levels, e.g., between 5 and 10, is enough
to achieve near optimal results.
REFERENCES
1)
Y. Bejerano and S.J. Han, “Cell Breathing Techniques
for Load Balancing in Wireless LANs,” Proc. IEEE
INFOCOM, 2006.
2)
M. Balazinska and P. Castro, “Characterizing Mobility
and Network Usage in a Corporate Wireless Local-Area
Network,” Proc. USENIX Int’l Conf. Mobile Systems,
Applications, and Services (MobiSys ’03), 2003.
3)
T. Henderson, D. Kotz, and I. Abyzov, “The Changing
Usage of a Mature Campus-Wide Wireless Network,”
Proc. ACM MobiCom, pp. 187-201, 2004.
4)
T. Togo, I. Yoshii, and R. Kohno, “Dynamic Cell-Size
Control According to Geographical Mobile Distribution
in a DS/CDMA Cellular System,” Proc. IEEE Personal,
Indoor, and Mobile Radio Comm. Symp. (PIMRC ’98),
pp. 677-681, 1998.
ISSN: 2231-5381
http://www.ijettjournal.org
Page 125
National Conference on Engineering Trends in Medical Science – NCETMS - 2014
A Review on Different Wireless Broadband Access
Techniques
Sanket G. Sawarkar1, Ashish S. Bhave2, Priyanka N. Bendre3
1
B.E. final year, Electronics & Telecommunication Department , Amravati University Maharashtra, India
B.E. final year, Electronics & Telecommunication Department, Amravati University Maharashtra, India
3
Assistant Professor, Electronics & Telecommunication Department, DBNCOET, Yavatmal, Maharashtra, India
2
Abstract— Gi-Fi will help to push wireless communications to
faster drive. For many years cables ruled the world. Optical
fibers played a dominant role for its higher bit rates and faster
transmission. But the installation of cables caused a greater
difficulty and thus led to wireless access. The foremost of this is
Bluetooth which can cover 10m. Wi-Fi followed it having
coverage area of 100m. No doubt, introduction of Wi-Fi wireless
networks has proved a revolutionary solution to “last mile”
problem. However, the standard’s original limitations for data
exchange rate and range, number of channels, high cost of the
infrastructure have not yet made it possible for Wi-Fi to become
a total threat to cellular networks on the one hand, and hardwire networks, on the other. Gi-Fi or Gigabit Wireless is the
world’s first transceiver integrated on a single chip that
operates at 60GHz on the CMOS process. It will allow wireless
transfer of audio and video data up to 5gigabits per second, ten
times the current maximum wireless transfer rate, at one-tenth
of the cost, usually within a range of 10 meters. It utilizes a 5mm
square chip and a 1mm wide antenna burning less than 2 mW
of power to transmit data wirelessly over short distances, much
like Bluetooth.
The development will enable the truly wireless office and home
of the future. As the integrated transceiver is extremely small, it
can be embedded into devices. The breakthrough will mean the
networking of office and home equipment without wires will
finally become a reality. In this we present a low cost, low power
and high broadband chip, which will be vital in enabling the
digital economy of the future.
Keywords-Wireless
Technology,
Zigbee,
Bluetooth,
Wi-Fi,
Wimax,Gi-Fi.
I. INTRODUCTION
Wireless technology improvement has become follower in
today’s modern life. One of the greatest improvements made
on wireless technology field was inventing a new wireless
home. Short-range wireless technologies have long been seen
as a solution, however most cannot deliver the multi-gigabit
speeds needed to transmit high-quality video signals. Those
can have been prohibitively expensive. NICTA’s Gi-Fi
research team has overcome both of these challenges.
This is a lot faster than any current Wi-Fi speeds. The
world's first Gi-Fi wireless network chip developed at
Australia's peak federal technology incubator has entered its
ISSN: 2231-5381
commercialization phase. The NICTA (National ICT
Australia Limited) Gi-Fi research team has succeed in
taking complex 60GHz transmission technology and
shrinking it to the point where it can be built on a single
silicon chip. The Gi-Fi chip is good news for personal area
networking because there is no internet infrastructure
available to cop it with. It can have a span of 10 meters. GiFi or Gigabit Wireless is the world’s first transceiver
integrated on a single chip that operates at 60GHz.Gi-Fi is a
wireless transmission system which is ten times faster than
Wi-Fi. It will allow wireless transfer of audio and video data
up to 5 gigabits per second, low power consumption,
usually within a range of 10 meters. This technology
providing low-cost, high broadband access, with very high
speed large files exchange within seconds.Multi-gigabit
wireless technology that removes the need for cables
between consumer electronic devices. The best part about
this new technology Gi-Fi is its cost effectiveness and
power consumption; it consumes less than 2 mW of power
for its operation.
II. LITERATURE REVIEW
Wireless means transmitting signals using radio waves as the
medium instead of wires. There are different wireless
technologies are introduced ZigBee is one of them broadly
categorized as a low rate WPAN, and its closest technology is
Bluetooth. A good bit of energy has been spent in analyzing
whether ZigBee and Bluetooth are complementary or
competing technologies, but after a quick look at the two, it
can be seen that they fall a lot farther down the
complementary side of the spectrum. They are two different
technologies with very different areas of application and
different means of designing for those applications. While
ZigBee is focused on control and automation, Bluetooth is
focused on connectivity between laptops and the like, as well
as more general cable replacement. ZigBee uses low data
rate, low power consumption, and works with small packet
devices; Bluetooth uses a higher data rate, higher power
consumption, and works with large packet devices[1].ZigBee
networks can support a larger number of devices and a longer
range between devices than Bluetooth. Because of these
differences, the technologies are not only geared toward
http://www.ijettjournal.org
Page 126
National Conference on Engineering Trends in Medical Science – NCETMS - 2014
different applications, they don't have the capability to extend
out to other applications [2].
Bluetooth must rely on fairly frequent battery recharging,
while the whole goal of ZigBee is for a user to be able to put
a couple of batteries in the devices and forget about them for
months to years. In timing critical applications, ZigBee is
designed to respond quickly, while Bluetooth takes much
longer and could be detrimental to the application. Thus, a
user could easily use both technologies as a wireless solution
in a PAN to suit all types of applications within that network
[6].
After that for wireless internet access we have used WIFI technology.Wi-Fi stands for “wireless fidelity”. Wi-Fi
technology builds on IEEE 802.11 standards [7]. Wi-Fi
allows the deployment of local area networks (LANs)
without wires for client devices, typically reducing the costs
of network deployment and expansion. Spaces where cables
cannot be run, such as outdoor areas and historical buildings,
can host wireless LANs. It is based on IEEE802.11
established in 1990 [7]. But Wi-Fi has some limitations like
Wi-Fi technology is still using local area network (LAN) for
the predictable future with some limited speed of data
transmission, to overcome this problem WIMAX is work,
which provides faster speed but has coverage up to 50 km
which interconnects the LAN & MAN also compared with
WI-FI range is limited [8].
In 1998, the IEEE (The Institute of Electrical and Electronics
Engineers) began standards project to specify a point-tomultipoint broadband wireless access system suitable for the
delivery of data, voice, and video services to fixed customer
sites. The initial standard, designated IEEE 802.16 was
developed for the higher microwave bands (> 10 GHz) where
line-of-sight between system antennas is required for reliable
service [9].
In 2001 wimax is introduced, IEEE 802.16 wimax has High
data rate, high power and having Point To Point, Line Of
Sight configuration which is known as fixed wimax [9].
In 2003 the new version of wimax is presented [9]. IEEE
802.16a enhances the medium access control layer so that it
can supportmultiple physical layer specification which is
having Medium data rate, Point To Point and also Point to
Multipoint, fixed. In this version security issues are improved
[9].
Wimax allows data rate up to 70 Mbps to overcome this
problem again new technology is introduced that is Gi-Fi
[10].
Gi-Fi or Gigabit Wireless is the world’s first transceiver
integrated on a single chip that operates at 60GHz on the
CMOS process. It will allow wireless transfer of audio and
video data up to 5gigabits per second, ten times the current
maximum wireless transfer rate, at one-tenth of the cost,
usually within a range of 10 meters. It utilizes a 5mm square
chip and a 1mm wide antenna burning less than 2 mW of
power to transmit data wirelessly over short distances, much
like Bluetooth [12].
ISSN: 2231-5381
III. ZIGBEE TECHNOLOGY
It would be common to find as many as a hundred of
ZigBee chips around the house in the form of light switches,
fire and smoke detectors, thermostats, kitchen appliances,
video and audio remote controls, security systems, etc .
Recently, ZigBee has become one of the most promising
technologies for home networks. ZigBee is a specification
for a suite of networking, security and application software
layers using small, low-power, low data rate communication
technology based on IEEE 802.15.4 standard for personal
area networks.
There have been various studies on ZigBee based home
networks. To realize remote home automation based on
ZigBee, implementation issues of home gateway and device
nodes are proposed. It presents hardware platform
consideration and software implementation for each of
them. Similarly, hardware design issues are discussed for
various home devices such as wireless communications
transceiver modules base, USB expansion base and control
switches for electrical appliances in a room.
ZigBee is designed for wireless controls and sensors. It
could be built into just about anything you have around your
home or office, including lights, switches, doors and
appliances. These devices can then interact without wires,
and you can control them from a remote control or even
your mobile phone. It allows wireless two-way
communications between lights and switches, thermostats
and furnaces, hotel-room air conditioners the front desk, and
central command posts. It travels across greater distances
and handles many sensors that can be linked to perform
different tasks. ZigBee has been designed to transmit
slowly. It has a data rate of 250kbps (kilobits per second),
pitiful compared with Wi-Fi, which is hitting throughput
20Mbps or more. But because ZigBee transmits slowly, it
doesn't need much power, so batteries will last up to 10
years. Because ZigBee consumes very little power, a
sensorto five years on a single double-A battery. Therefore,
the phone will be able to act as a remote control for all the
ZigBee devices it encounters.
In these environments, the transceiver wakes up, listens for
an open channel and transmits small packets of data at lower
data rates. Then it shuts down until the next event is
indicated. The sequencing, fast power on latency, lower data
rates and small data packets allow an 802.15.4 transceiver to
select time increments where the data transmission will be
most effective. As mentioned previously, for sensing and
control subsystems, data transmission range and power
requirements are best supported with ZigBee technology
solutions. The typical range defined by the ZigBee Alliance
specification is 10–75m; however, many solutions offer lineof-sight ranges well beyond this. It is important to review the
number and types of transceiver channels available in
relation to the planned design.
The transmission range varies with the environment all from
10 to 75 meters. Longer range can be obtained with smarter
http://www.ijettjournal.org
Page 127
National Conference on Engineering Trends in Medical Science – NCETMS - 2014
antennas; smart network designs or one can add power
amplifiers to the transceiver. The analog portion of the
receiver converts the desired signal from RF to the digital
baseband. Dispreading of signal is done in the digital portion
of the receiver. The digital part of the transmitter does the
spreading signal, whereas the analog part of the transmitter
does the modulation and conversion to RF. The choice of the
receiver architecture is mainly a compromise of functional
performance, power consumption and requirement of
external components. Both analog receiver and transmitter
architectures are direct-conversion “DCR” .
IV. BLUETOOTH TECHNOLOGY
Bluetooth is an open wireless technology standard for
exchanging data over short distances (using short wavelength
radio transmissions) from fixed and mobile devices, creating
personal area networks (PANs) with high levels of security.
Created by telecoms vendor Ericsson in 1994, it was
originally conceived as a wireless alternative to RS-232 data
cables. It can connect several devices, overcoming problems
of synchronization. Today Bluetooth is managed by the
Bluetooth Special Interest Group. Bluetooth uses a radio
technology called frequency-hopping spread spectrum, which
chops up the data being sent and transmits chunks of it on up
to 79 bands (1 MHz each) in the range 2402-2480 MHz’s
This is in the globally unlicensed Industrial, Scientific and
Medical 2.4 GHz short-range radio frequency band.
V.WI-FI TECHNOLOGY
Wi-Fi stands for “wireless fidelity”. Wi-Fi technology builds
on IEEE 802.11 standards. Wi-Fi allows the deployment of
local area networks (LANs) without wires for client devices,
typically reducing the costs of network deployment and
expansion. Spaces where cables cannot be run, such as
outdoor areas and historical buildings, can host wireless
LANs. As of 2010 manufacturers are building wireless
network adapters into most laptops. The price of chipsets for
Wi-Fi continues to drop, making it an economical networking
option included in even more devices. Wi-Fi has become
widespread in corporate infrastructures. Different competitive
brands of access points and client network-interfaces can
inter-operate at a basic level of service. Products designated
as "Wi-Fi Certified" by the Wi-Fi Alliance are backwards
compatible. "Wi-Fi" designates a globally operative set of
standards: unlike mobile phones, any standard Wi-Fi device
will work anywhere in the world.
Wireless LANs may not be desirable for a number of
reasons. Most of these have to do with the inherent
limitations of the technology.
1. Security:
To combat this consideration, wireless networks may choose
to utilize some of the various encryption technologies
available. Some of the more commonly utilized encryption
methods, however, are known to have weaknesses that a
dedicated adversary can compromise.
2. Reliability:
Like any radio frequency transmission, wireless networking
signals are subject to a wide variety of interference, as well
as complex propagation effects that are beyond the control of
the network administrator.
Fig. Bluetooth Devices
Table: Comparison of Bluetooth & Zigbee
ISSN: 2231-5381
3. Speed:
The speed on most wireless networks (typically 1-54 Mbps)
is far slower than even the slowest common wired networks
(100Mbps up to several Gbps). However, in specialized
environments, the throughput of a wired network might be
necessary.
VI. WIMAX TECHNOLOGY
Wimax stands for Worldwide Interoperability for Microwave
Access. Wimax technology is a telecommunications
technology that offers transmission of wireless data via a
number of transmission methods; such as portable or fully
mobile internet access via point to multipoint’s links. The
Wimax technology offers around 70 Mega Bits per second
without any need for the cable infrastructure. Wimax
technology is based on Standard that is IEEE 802.16, it
usually also called as Broadband Wireless Access. Wimax
technology is actually based on the standards that making the
possibility to delivery last mile broadband access as a
substitute to conventional cable and DSL lines.
http://www.ijettjournal.org
Page 128
National Conference on Engineering Trends in Medical Science – NCETMS - 2014
Wimax would operate similar to Wi-Fi but at higher
speeds, over greater distances and for a greater number of
users. WiMAX has the ability to provide service even in
areas that are difficult for wired infrastructure to reach and
the ability to overcome the physical limitations of traditional
wired infrastructure. WiMAX could potentially be deployed
in a variety of spectrum bands: 2.3GHz, 2.5GHz, 3.5GHz,
and 5.8GHz.
2. Mobile Wimax:
The latest 802.16e task group is capitalizing on the new
capabilities this provides by working on developing a
specification to enable mobile WiMAX clients. These clients
will be able to hand off between WiMAX base stations,
enabling users to roam between service areas.
Fig. WIMAX Network
Table:Comparison of Wi-fi & Wimax.
VII. TYPES OF WIMAX
The WiMAX family of standards concentrates on two types
of usage models a fixed usage model and a mobile usage
model. The basic element that differentiates these systems is
the ground speed at which the systems are designed to
manage. Based on mobility, wireless access systems are
designed to operate on the move without any disruption of
service; wireless access can be divided into three classes;
stationary, pedestrian and vehicular.
1.Fixed Wimax:
Service and consumer usage of WiMAX for fixed access is
expected to reflect that of fixed wire-line service, with many
of the standards-based requirements being confined to the air
interface. Because communications takes place via wireless
links from Customer Premise Equipment (CPE) to a remote
Non Line-of-sight (NLOS) base station, requirements for link
security are greater than those needed for a wireless service.
The security mechanisms within the IEEE 802.16 standards
are sufficient for fixed access service. Another challenge for
the fixed access air interface is the need to set up high
performance radio links capable of data rates comparable to
wired broadband service, using equipment that can be self
installed indoors by users, as is the case for Digital
Subscriber Line (DSL) and cable modems. IEEE 802.16
standards provide advanced physical (PHY) layer techniques
to achieve link margins capable of supporting high
throughput in NLOS environments. The 802.16a extension,
refined in January 2003, uses a lower frequency of 2 to 11
GHz, enabling NLOS connections.
ISSN: 2231-5381
VIII. GI-FI TECHNOLOGY
When telling people to migrate from Wi-Fi or Wi-Max to GiFi, the question you usually hear is why. There are actually a
few good reasons to move to the new technology.
The process of Gi-Fi would use a chip that transmits at an
extremely high 60GHz frequency versus the 5GHz used for
the fastest forms of Wi-Fi.
Mixing and signal filtering used in Gi-Fi technology would
keep the signal strong versus the longer ranged but slower
and more drop prone Wi-Fi option of today.
The GiFi uses the short-range wireless technology would
potentially be a competitor or more than likely a replacement
for Wi-Fi and things like Bluetooth might want to look out as
well.
Mixing and signal filtering used in Gi-Fi technology would
keep the signal strong versus the longer-ranged but slower
and more drop-prone Wi-Fi option of today. The chip in Gi-fi
would likely cost about $10 or less to build. This and a small
design would allow cell phones and other small devices to
add the technology without significantly drive up the price,
according to the company. The change opens the possibility
of a successor to UWB and its related technology Wireless
USB, which matches the same range but roughly the same
480Mbps peak speed of its wired equivalent.
In recent years, new wireless local area networks
(WLANs) such as Wi-Fi and wireless personal area networks
(WPAN) such as Bluetooth have become available. Now we
can compare the GI-FI technology with the existing
technologies like Bluetooth, Wi-Fi.
http://www.ijettjournal.org
Page 129
National Conference on Engineering Trends in Medical Science – NCETMS - 2014
Fig. High Speed Data Transmission Using Gi-Fi
Table:Comparison between Bluetooth, Wi-Fi, Gi-Fi.
X.REFERENCES
IX. CONCLUSION
In this paper different wireless technologies is defined that
will allow wireless transfer of audio and video data up to 5
gigabits per second, ten times the current maximum wireless
transfer rate, at one-tenth of the cost, usually within a range
of 10 meters that operates at 60GHz on the CMOS process.
This technology removes cables that for many years curled
the world and provides high speed data transfer rate. The
comparison that is performed between Gi-Fi and existing
wireless technologies in this paper shows that these features
along with some other benefits such as Low-cost chip, No
Frequency Interference, Low Power Consumption and High
Security that are explained in detail in this paper, makes it
suitable to replace the existing wireless technologies for data
transmission between devices that are placed in the short
distances from each other. Gi-Fi technology has much
number of applications and can be used in many places and
devices such as smart phones, wireless pan networks, media
access control and mm-Wave video-signals transmission
systems. Finally it is conspicuous that more research should
be done in the field of this new wireless technology and its
applications.
[1]ZigBee Alliance, “Network Specification”, ZigBee Document 02130r10,
December 14th, 2004.
[2]ZigBee Alliance, “ZigBee Application Profile. Home Control, Lighting ”,
ZigBee Document 03540r6,
December 14th, 2004.
[3]ZigBee Alliance, “ZigBee Device Profile”, ZigBee Document 03529r7,
December 14th, 2004.
[4]AChipconCompany/Figurewireless,http://www.figure8wireless.com/Zigb
ee.html
[5] Freescale Semiconductor Corporation, http://www.freescale.com/zigbee
[6]Bluetooth Wikipedia
[7]K. Ramadas and R. Jain, WiMAX System Evaluation Methodology
(Wimax Forum),January 2007
[8] www.freewimaxinfo.org
[9] http://computer.howstuffworks.com/winmax.html
[10] http://www.intel.com/technology/magazine/standards/st08031.pdf
[11]Marzieh Yazdanipour, Afsaneh Yazdanipour, Amin Mehdipour and
Mina Yazdanipour “Evaluation of Gi-Fi Technology for Short-Range”
UACEE International Journal of Advances in Computer Networks and its
Security – Volume 2: Issue 3 [ISSN 2250 - 3757].
[12] J.Santhan Kumar Reddy “Gi-Fi Technology” International Journal of
Advanced Scientific and Technical Resear Issue 3 volume 1, JanuaryFebruary 2013
[13]Evolution of Gi-Fi technology-International Journal of Computer
Science and Network, Volume 2, Issue 3, June 2
ISSN: 2231-5381
http://www.ijettjournal.org
Page 130
National Conference on Engineering Trends in Medical Science – NCETMS - 2014
An Intelligent Algorithm for
Data Routing Over Peer To Peer Networks to
Avoid Insecurity of Data and Eeicp (Energy
Efficient Protocol for Wireless Sensor Network)
Charushila Jadhaao#1, Sneha Dohare*2, Ashwin Motikar#3
1
2
B.E. final year, EnTc ,Department , Amravati University Maharashtra, India – 445001.
B.E. final year, EnTc Department,, Amravati University Maharashtra, India – 445001.
33
Assistant Professor, EnTc, DBNCOET, Yavatmal,Maharashtra, India – 445001.
Abstract- In this paper, we evaluate the performance of
the AntNet routing algorithm in terms of efficiency and
security in peer-to-peer networks. Using the network
simulator NS2, a simulator is implemented for a
network of 8-nodes which simulates the ant colony
intelligence in deciding the most efficient and secured
path from source to destination nodes. In the simulator,
a variety of network scenarios is considered. The
AntNet routing algorithm has the ability to detect faulty
and malicious nodes and abandon them from the
routing tables of the intermediate nodes. Hence, a
healing is established so that packets are efficiently and
securely transferred from source to destination. In
addition, the probabilistic nature of AntNet routing
distributes the network traffic of data packets over
several optimal and suboptimal paths which lead to
improve the network performance and minimize the
packet latency.
And an energy efficient inter cluster
coordination protocol developed for the wireless sensor
networks has been proposed. By controlling the
topology, longevity and scalabity of the network can be
increased.
Clustering sensor node isan effective
topology for the energy constrained networks. So
cluster based algorithm has been developed in which
different levels of clusters aare considerd on the basis
of received signal strength to recognize the distance of
clusters from the BS (base station) and to determine the
number of cluster coordinator to make routes for the
CHs to transmit the data.Based on the investigation of
existing protocol in which cluster heads send data
directly to the based station, it is found that direct
transmission by the CHs is nit an optimal solution and
dissipates a lot of energy, so in this a novel
EEICCP(energy
efficient
inter
cluster
coordination)protocol has been proposed which evenly
distributes the energy load among the sensor nodes and
used the multihope approach for the CHs. For this
algorithm, MATLAB is implemented.
ISSN: 2231-5381
1.INTRODUCTION:The P2P network comprises a collection of nodes that
can cooperate and collaborate with each other to offer
opportunities
for
real-time
communication,
collaboration and information sharing in a large-scale
decentralized and distributed manner. A node in a
P2P network can access information present in the
network using peer discovery followed by a search
and retrieval phase. The most distinct characteristic
of P2P computing is that there is a symmetric
communication between the peers; each peer has both
a client and a server role. Both parties have the same
capabilities and both can initiate a connection. It is
the opposite of the client/server model in the sense
that there is no central entity that the other parties
contact but every single entity is able to initiate a
connection directly with all other entities.
Routing in computer networks refers to the process of
discovering, selecting, and employing paths from one
node to another in the network. Routing involves two
basic activities: determining optimal routing paths
and transporting information packets through an
inter-network. Routing protocols use metrics to
evaluate what path will be the best for a packet to
travel. Routing determines the overall performance of
a network in terms of throughput and transmission
delay. Routing process involves building forward
tables, one for each node in the network, which tell
incoming data which link to use to continue their
travel towards the destination node [4]. While
directing traffic from source to destination, the goal
of the routing algorithm is to maximize the network
performance and minimize costs.
http://www.ijettjournal.org
Page 131
National Conference on Engineering Trends in Medical Science – NCETMS - 2014
A P2P system can take many forms . Email, Internet
Relay Chat and Napster are all examples of P2P
systems. Routing on these networks is either
centralized or statically configured and is therefore
unproblematic. Another class of P2P networks is the
overlay network. Overlay networks build a virtual
topology on top of the physical links of the network.
Nodes leave and join this network dynamically and
the average uptime of individual nodes is relatively
low. The topology of an overlay network may change
all the time. Once a route is established, there is no
guarantee of the length of time that it will be valid.
Routing in these networks is therefore very
problematic.
Great interest was devoted to the routing problem and
several routing algorithms were proposed. Static
routing determines the path taken by a packet on the
basis of the source and destination without regard to
the current network state . This path is usually chosen
as the shortest one according to some cost criterion.
Adaptive routing, on the other hand, adapts the
routing policy to the varying traffic conditions. Open
shortest path first (OSPF) is one of the most widely
used routing protocols. In OSPF, every node gathers
information about the entire network and calculates
the best path to each destination. For every
destination, the interface to this path issaved in the
routing table. While OSPF minimizes the static link
cost, it cannot react to thedynamic nature of the
network. While OSPF protocol is a static,
deterministic algorithm, AntNet on the other hand
introduces a dynamic, probabilistic approach. AntNet
is a dynamic algorithm for packet routing in
communication networks, originally proposed by M.
Dorigo and G. Di Caro in 1997. In AntNet, a group
of mobile agents (or artificial ants) build paths
between pair of nodes; exploring the network
concurrently and exchanging obtained information to
update the routing tables.
In this discourse, we evaluate the performance of the
AntNet routing algorithm in terms of efficiency and
security in peer-to-peer networks. Using the network
simulator NS2 , a simulator is implemented for a
network of 8-nodes which simulates the ant colony
intelligence in deciding the most efficient and
secured path from source to destination. In the
simulator, a variety of network scenarios is
considered.
2.LITRATURE SURVEY
A. Crowds
Crowds are an anonymous network developed by
Michael K. Reitter and Aviel D. Rubin. The degree
ISSN: 2231-5381
of anonymity given by crowds can be ranged as
probable innocence which defends
against large
number of attackers. This mechanism will defend
against internal attackers and a corrupt receiver, but
provides no anonymity against a global attacker or a
local eavesdropper.
Crowds, was named for the notion
“blending into a crowd”, which operates by grouping
users into a large and geographically diverse group
“crowd”, in which every user’s intention is to hide
their identity while communicating with some web
server. The anonymity is achieved by hiding one’s
actions with the actions of many others while
traversing one’s message. In this way, crowds make
it difficult for web servers to trace the original
initiator of the message because, it is equally likely to
have originated from any member of the crowd. Even
the members in the crowd cannot distinguish the
initiator of a message from those who are forwarding
the requests . Crowds will try to provide sender’s
anonymity from all the nodes in the network along
with the receiver.
On the other hand, it provides receiver
anonymity only from adversaries and not from the
sender. The other drawbacks of Crowds include, they
failed to defend against denial-of-service attacks by
rogue crowd members . Also, the anonymity of
sender is exposed to local eavesdropper
B.Onion Routing
Onion routing is a technique developed by
David Goldschlag, Michael Reed and Paul Syverson
for anonymous communication over a network. This
technique is developed based on David Chaum’s mix
networks . The main goal of this protocol is to protect
the identity of an initiator and responder of a message
and also the content of the message while it is
traversing over the network. Routing onions is the
core concept used by this protocol for anonymous
communication. This concept deals with encoding
routing information in a set of encrypted layers.
The anonymous communication between
two nodes in this protocol happens in the following
way :When an initiator wants to establish anonymous
communication with a responder, he will approach
application proxy. This will in turn forward this
message to Onion proxy. Onion proxy will randomly
select some routers and establish a route constructing
an Onion. This Onion, is a recursively layered data
structure that contains the information about the route
to be followed over a network. These routers in onion
are termed as core onion routers
The next step in this process is to forward
this onion to entry funnel which is an entrance for
routing in the network. Entry funnel will decrypt the
first layer to see the information about next hop in the
http://www.ijettjournal.org
Page 132
National Conference on Engineering Trends in Medical Science – NCETMS - 2014
route. This process continues until the onion reaches
exit funnel. Exit funnel is responsible for traversing
the packet to its destination. Onion Routing relies on
Public
KeyCryptography
for
anonymous
Communication assuming that onion proxy will
know public keys of all the routers in the network.
Here, a router can only decrypt the corresponding
layer with its private key.
The Routers can only know the information
about the previous hop and next hop in the route. If
an attacker compromises a node in the route, it can
only get very little information keeping the
anonymity of original source and destination. But, it
is stated that onion routing will provide anonymity
only from third parties and the nodes involved in the
communication knows each other.
D.ANT ROUTING
P2P networks like Ants and MUTE, based on this
routing algorithm, in a way to provide anonymity
while sharing files among various peers in the
network. The basic idea of this algorithm is inspired
by the techniques of real ants in searching for food.
D.1 Route Discovery:
As the name states this phase helps in discovering
various available routes between sender and receiver
of a message. In a way to find a route to reach
receiver, sender makes a random walk or a broadcast
search that leads it towards the receiver.
D.2 Route Maintenance:
This phase helps in the improvement of routes
between a sender and receiver. This algorithm
doesn’t need any special packets for route
maintenance. It depends on the pheromone deposited
by every message in their traversal to find the
shortest path and for better maintenance of route. The
pheromone here is the clue left by a message at every
node in its traversal. This clue is nothing but a pseudo
identity of sender/receiver. Based on these clues, a
shortest path is selected.
D.3 Route Failure Handling:
This phase helps in handling the failed routes which
is quite common in adhoc networks. The reason for
route failures lies in the mobility of nodes in the
network. This algorithm recognizes a route failure
through a missing acknowledgement. If a node finds
an error message, then it will first deactivate the link
by setting the pheromone value to 0. The node then
searches for an alternative link in its routing table. If
it finds any alternative link, then it will traverse the
ISSN: 2231-5381
message via, that link. Otherwise, a new route is
created getting back to the initial phase.
3.PEER TO PEER NETWORKDefination:Peer-to-Peer systems are distributed systems
consisting of interconnected nodes able to selforganize into network topologies with the purpose of
sharing resources such as content, CPU cycles,
storage and bandwidth, capable of adapting to
failures and accommodating transient populations of
nodes while maintaining acceptable connectivity and
performance without requiring the intermediation or
support of a global centralized server or authority.
In a peer-to-peer (P2P) network, every machine plays
the role of client and server at the same time.
Although a P2P network has a number of advantages
over the traditional client- model in terms of
efficiency and fault-tolerance, additional security
threats can be introduced.
Peer-to-peer (P2P) is an alternative network model to
that provided by traditional client-server architecture.
P2P networks use a decentralized model in which
each machine, referred to as a peer, functions as a
client with its own layer of server functionality1. A
peer plays the role of a client and a server at the same
time. That is, the peer can initiate requests to other
peers, and at the same time respond to incoming
requests from otherpeers on the network. It differs
from the traditional client-server model where a
client can only send requests to a server and then wait
for the server’s response.
4. NETWORK ROUTING:-
Packets are to be routed from source to
destination .Such packets we need transverse
many cross-points similar to traffic
intersection in a road transportation network
cross-points in the Internet are known as
routers. A router’s function are to read the
destination address marked in an incoming
IP packet to consult its internal information
to identify on outgoing link to which the
packets is to be forwarded to the packets ..
Suppose that traffic suddenly increase , for
an example , because of many users trying
to download from the same website ,then
packets are generated can possibly be
queued at routers or even dropped .Since a
http://www.ijettjournal.org
Page 133
National Conference on Engineering Trends in Medical Science – NCETMS - 2014
router maintains a finite amount of space
known as buffer , to temporarily stored
backlogged packets , it is possible to reach
the buffer limit . Since the basic principle of
TCP/IP allow the possibility of IP packet not
being delivered or being dropped enrout ,
the finite buffer at a router is not a problem .
On the other hand , from the efficient
delivery point of view ,it is desirable not to
have any packets loss (or at least minimize
it) during transit. This is because there liable
delivery notion works on the principle of
retransmission and acknowledgement and
any dropped would mean an increase in
delay due to the need of retransmission ..
Thus for efficient delivery of packet there
are several key factors to consider routers
with a reasonable amount buffer space link
with adequate bandwidth actual transmission
with minimal error (to minimized packet
being garbled ), & the router’s efficiency in
switching a packet to the appropriate
outgoing link.
5. ANTNET BASED ALGORITHM:A.The Ant Colony Optimization
In ant colony, ants are able to find the
shortest path between a food source and
their home colony . Real ants communicate
via pheromones. The ant deposits a certain
amount of pheromone when it walks. An ant
tends to choose a path positively correlated
to the pheromone intensity of found trials.
The pheromone trail evaporates over time .
If many ants choose a certain path and lay
down pheromones, the intensity of the trail
increases. Thus, this trail attracts more and
more ants; a process that results in ant
highway following the shortest pat. Ants
also have the ability to adapt to the
environmental changes, for example, finding
the new and shortest path once the old one is
no longer feasible due to a new obstacle.
ISSN: 2231-5381
Fig.ACO
Ant colony optimization ACO mimics in
software the behavior of real ants in colony.
In applying ACO in network routing, an
artificial ant is typically realized as a simple
program consisting of simple procedures
that simulate the laying and sensing of
pheromone, and data structures that record
trip times and the nodes that it passes .
Moving from one node to another, an
artificial ant emulates laying of pheromone
by updating the corresponding entry in the
routing table in a node which records, for
example, the number of ants that pass that
node. In ant colony based algorithms, a set
of artificial ants move on the graph which
represents the instance of the network.
While moving they build solutions and
modify the problem representation by
adding collected information. The most
important application of ACO is network
routing as it is desired to transfer data
packets from a source to a destination in an
efficient way
http://www.ijettjournal.org
Page 134
National Conference on Engineering Trends in Medical Science – NCETMS - 2014
B.The AntNet Routing
Fig. ANTNET ROUTING
Unlike traditional routing algorithms such as
OSPF, AntNet dropped the deterministic
way of routing and introduces a probabilistic
approach. An overview of the entire network
is no longer needed. The link state database
of AntNet is smaller than the database of
OSPF as an AntNet node only needs to keep
information about the links between itself
and the adjacent node, and. all the nodes in
the network.
Routing decisions are based on the basis of
local and approximate information about the
current and the future network states.
Each artificial ant builds a path from its
source to its destination node. While
building the path, it collects explicit
information about the time length of the path
components and implicit information about
the load status of the network . This
information is then back propagated by
another ant moving in the opposite direction
and is used to modify the routing tables of
the visited nodes. AntNet system comprises
two sets of homogeneous mobile agents
called forward and backward ants .
They possess the same structure but they can
sense different inputs and they can produce
different independent outputs. Forward ants
gather information. On a regular time base,
every node sends one forward ant with a
random destination over the network.
This forward ant is forward by some
intermediate nodes to its final destination, in
a way that balances between exploitation of
known good paths and the exploration of
new, possibly better paths. Backward ants
are created out of forward ants once they
have reached their destination. The
backward ant follows exactly the same path
as the forward ant but in the opposite
direction resulting in adapting the
probabilities in the routing table of all
intermediate nodes.
ISSN: 2231-5381
C. 1)ANTNET ALGORITHM
Algorithm AntNet1.0
Suppose a data network, with N nodes,
where s denotes a generic source node, when it
generates an agent or ant toward a destination d. Two
types of ants are
defined:
1. Forward Ant, denoted Fs d, which will
travel from the source node s to adestination
d.
2. Backward Ant, denoted Bs d, that will be
generated by a forward ant Fs d in
thedestination d, and it will come back to s
following the same path traversed by Fs
d,with the purpose of using the information
already picked up by Fs d in order to
update routing tables of the visited nodes.
Every ant transports a stack Ssd(k) of data,
where the k index refers to the k-est visited
node, in a journey, where Ssd(0)= s and Ssd
(m)= d, being m the amount of
jumps performed by Fs d for arriving to
d.Let k be any network node; its routing
table will have N entries, one for each
possibledestination.Let j be one entry of k
http://www.ijettjournal.org
Page 135
National Conference on Engineering Trends in Medical Science – NCETMS - 2014
routing table (a possible destination). Let Nk
be set of neighboring nodes of node k.Let
Pji be the probability with which an ant or
data packet in k, jumps to a node i, i _ Nk,
when the destination is j (j_k). Then, for
each of the N entries in the node k routing
table, it will be nk values of Pji subject to
the condition: Pji i_Nå_1 ; j=1,...,N . (1)
The following lines show AntNet1.0
pseudocode, using the symbols and
nomenclature already presented: Argentine
Symposium on Artificial Intelligence
BEGIN
{ Routing Tables Set-Up: For each node k
the routing tables are initialized with a
uniform distribution:
Pji nk1, _i_Nk . (2)
DO always (in parallel)
{
STEP 1: In regular time intervals, each node
s launches an Fs
_
d ant to a
randomly chosen destination d.
/*During its trip to d, when Fs
_
d reach a node k, (k
_
d), it does step 2*/
DO (in parallel, for each Fs
_
d
{ STEP 2: Fs
_
d pushes in its stack Ss
_
d(k) the node k identifier and the
time elapsed between its launching from s to
its arriving to k.
Fs
_
d selects the next node to visit in two
possible ways:
(a) It draws between i nodes, i
_
ISSN: 2231-5381
Nk, where each node i has a Pdi
probability (in the k routing table) to be
selected.
IF the node selected in (a) was already
visited
(b) It draws again, but with the same
probability for all
neighbor nodes i, i
_
Nk. Fs
_
d jumps to chosen node.
IF the selected node was already visited
STEP 3: A cycle is detected and Fs
_
d pops from its
stack all data related to the cycle nodes,
since the
optimal path must not have any cycle. Fs-d
comes
back to step 2 (a).
END IF
END IF
}WHILE jumping node_d
STEP 4: Fs_d generates another ant, called
backward ant Bs_d.
Fs_d
transfers to Bs_d its stack Ss_d and then
dies.
/*Bs_d, will follow the same path used by
Fs_d, but in the opposing
direction, that is, from d to s*/
DO (in parallel, for each Bs_d ant)
{
/*When Bs_d arrives from a node f, f_Nk to
a k, it does step 5*/
STEP 5: B-d updates the k routing table and
list of trips, for theentries regarding to nodes
k’ between k and d inclusive, according to
the data carried in Ss_d (k’).
IF k_sBs_d will jump from k to a node with
identifier given by Ss_d (k-1)
END IF
}
WHILE (k_s)
}
http://www.ijettjournal.org
Page 136
National Conference on Engineering Trends in Medical Science – NCETMS - 2014
}
END
C.2 EEICCP ALGORITHM:Algorithm of EEICCP protocol works in this
way , that after the data transmission by all the nodes
of all the clusters , one round gets complete and
election phase restart. The cluster heads are elected
on the basis of the number of the clusters. As 1055
nodes are taken in simulation newly protocol,
deviding the 1000 nodes into 10 clusters of 100 nodes
each. As there are layers of clusters one above the
other so the formula of sum of first n natural numbers
(_n(n+1)/2) is used to calculate CHs needed for the
10 clusters(n) and they are in increasing the sequence
sterting from the depth first which has only 1 CH
(with highest distance from the BS) and they are in
the order of (1,2,..10) as movement is accomplished
from depth to the BS , so clusters nearest to the BS
has 10 CHs. In each cluster out of all the CHs in that
cluster one is the CH for the nodes of that cluster and
other acting as the CCOs(cluster coordination) for the
clusters.
Election phase :Ech_elec=l(Ee+Es.d²) + n1.l(Ee + Ebf)
Algorithm for data transmission
1.set k=0, n=1
2. set j= no. of cluster-k
3. Repeat while j≥1
4. If j!=1 then
Cluster[j-1][n+1]=cluster[j][n]
[increment] set n=n+1
Else
Base_station = cluster[j][n]
[increment]k=k+1
Set n=1
End of if structure
5. [decrement] set j=j-1
Go to step 2
6.End of step 3 loop
7.Exit
6 . CONCLUSION
algorithm is securable so that malicious nodes are
ruled out to avoid leakage of transmitted information.
The probabilistic nature of AntNet routing distributes
the stream of data packets over several optimal and
suboptimal paths which improves the network
performance and minimize packet latency
EEICCP:- The new multihope clustering
best routing protocol EEICCP has been described,
which minimizes the usage and further increases the
network lifetime by uniform distributing load of
energy among all the sensor nodes. EEICCP out
performs conventional protocols that send data
directly to the base station through their respective
CHs. Dividing in the network into layers of clusters
has been proved to be a good approach in reducing
the energy to great extent. Each node has the equal
responsibility of receiving data from all other nodes
in the cluster and to transmit the aggregating signal to
the base station.
REFERENCE
[1] L. Lertsuwanakul and H. Unger, “An Improved Greedy
Routing Algorithm for Grid using Pheromone-Based Landmarks”,
World Academy of Science, Engineering and Technology, vol 59,
2009, pp. 172-176.
[2] E. Stone, T. Czerniak, C. Ryan and R. McAdoo, “Peer to Peer
Routing”,
http://ntrg.cs.tcd.ie/undergrad/
4ba2.05/
group6/index.html
[3] G. D. Caro and M. Dorigo, “Mobile Agents for Adaptive
Routing,” Tech. Report IRIDIA, 1997.
[4] S.I. Matta and A. Bestavros “SEP_A Stable Election Protocol
for cluster heterogeneous wireless sensor network” Technical
Report BUCS-TR-2004-022G.
[4] M. Strobbe, V. Verstraete and E. V. Breusegem,
“Implementation and Evaluation of AntNet, a Distributed Shortestpath Algorithm”, Proc. of Advanced Industrial Conference on
Telecommunications/Service Assurance with Partial and
Intermittent
Resources
Conference/
E-Learning
on
Telecommunications Workshop. AICT/SAPIR/ELETE 2005. July
2005 pp. 320 – 325.
[6] K. Ghosh, P.P.Bhattacharya and P. Das, “Effect of Multipath
Fading and Propogation Environment on Performance of Fermat
Point Based Energy Efficient Geocast Routing Protocol.
[7] J. Zheng and A. Jamalipour, “Wireless Sensor Network . A
networking Perspective,” John Wiley and Sons , Hoboken 2009.
In this paper, the performance of AntNet
routing algorithm is evaluated through simulation
using NS-2 Simulation package. A variety of network
scenarios with 8 nodes is considered. The protocol is
proved to be robust in the sense that faulty nodes are
detected and bypassed. The broken links are
abandoned from the routing tables and a healing is
established so that packets are routed from their
sources to destinations. In addition, the AntNet
ISSN: 2231-5381
http://www.ijettjournal.org
Page 137