1
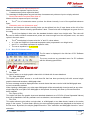
PA² Software The New Almen Software from Peening Accessories USER’s MANUAL 1 Introduction Thank you for choosing PA² Software that we wish very useful to you. This product has been designed and tested by experienced users, making it very accurate and powerful. Advanced functionalities have been integrated to make it user friendly and to avoid any possible mistake, in particular for fresh operators in production and control phases of the shot peening process. PA² Software meets SAE-J2597 requirements. As it is always possible to make it better, your accurate user’s comments and recommendations for improvements will be much appreciated. PA² Software User’s Manual 2012-04 1/ 20 Table of Contents 1 Introduction .........................................................................................................................................................1 2 Computer configuration .....................................................................................................................................3 2.1 Computer environment..............................................................................................................................3 2.2 Equipment ...................................................................................................................................................3 2.3 Display .........................................................................................................................................................3 2.4 Software development tools .....................................................................................................................3 3 Software protection ............................................................................................................................................3 4 Installation procedure ........................................................................................................................................3 5 4.1 Downloading from PEENING ACCESSORIES Website......................................................................3 4.2 Extraction from a CD or DVD ...................................................................................................................5 4.3 Asking for the serial number.....................................................................................................................5 4.4 Input the serial number received by e-mail return ................................................................................6 PA² Software Use ..............................................................................................................................................7 5.1 5.1.1 Measurements data format...............................................................................................................7 5.1.2 Table for measurement data input ..................................................................................................8 5.1.3 Chart title and message box for results and automatic comments display ...............................9 5.1.4 Main PA² Software menu ................................................................................................................10 5.1.5 Graphic chart ....................................................................................................................................12 5.2 Datasheets ................................................................................................................................................12 5.2.1 Navigation .........................................................................................................................................12 5.2.2 Data input ..........................................................................................................................................12 5.3 6 Chart description ........................................................................................................................................7 Multigraph chart........................................................................................................................................15 5.3.1 What is the use of Multigraph? ......................................................................................................15 5.3.2 How building a Multigraph? ............................................................................................................16 5.3.3 Multigraph functionalities ................................................................................................................16 5.3.4 Display properties ............................................................................................................................16 5.3.5 Multigraph Example .........................................................................................................................17 Almen Gage Connection with the computer ................................................................................................19 6.1 USB Gage-PC connection ......................................................................................................................19 6.2 Gadge driver configuration .....................................................................................................................20 6.3 Automatic data transmission ..................................................................................................................20 PA² Software User’s Manual 2012-04 2/ 20 2 Computer configuration 2.1 Computer environment PA² software is designed to work in a PC environment, with Microsoft Windows XP-SP 2, or later operating system. 2.2 Equipment PA² software is very light and does not require a lot of space in your hard disk. Nevertheless, the RAM memory and processor speed should be as high as possible to ensure comfortable use. 2.3 Display PA² Software accepts automatically the following screen sizes: screen and graphic card with a resolution of 1024 x 768 pixels, or higher. PA² Software is not suitable for narrow display types such as Netbook or Notebook formats. 2.4 Software development tools Microsoft “.NET Framework 4” must be operational before starting PA² Software. Therefore, if it is not operational when installing PA Software, it is necessary to ask your Computer Administrator to install it. Free download from the following link (English, USA): http://www.microsoft.com/download/en/details.aspx?displaylang=en&id=17851 It is recommended to download the language version of your country in order to get all of PA² Software message boxes in your own language. 3 Software protection WARNING! PA² software is protected by the mean of a serial number which is allowing the traceability, the updating of the original software files and preventing any use out of a related commercial contract. Full permanent activation is granted only for one computer. For several computers a commercial contact for multi-computer use and dedicated serial numbers are required. 4 Installation procedure Whatever is the way to receive PA² Software, it is a fully operational and free version, but with a limited granted amount of use for testing. File recording will be disabled after 40 times saving or resaving. All the files saved during the test period will remain accessible either directly from windows explorer or from PA² menu. In order to get full rights for permanent use, it is necessary to input the serial number that will be granted by PEENING ACCESSORIES (see 4.3). 4.1 Downloading from PEENING ACCESSORIES Website Before any tentative to download PA² Software, it is necessary to double check that you have all authorizations from your computer administrator. At least, check if “.NET Framework 4” is installed in the program files list through <Configuration panel>, <install uninstall program files> (XP) or <Programs, Programs and features> (Vista, Seven). PA² Software User’s Manual 2012-04 3/ 20 Step-1 downloading Download link: http://pa2.pointdoc.net/ After reaching the server this window will welcome you. - No need to Login (free downloading) - Click on the blue link of your choice: EXE Version if you have full rights from the administrator, Or Zip Version if you do not want to execute but only after save, unzip and scan for virus, before installation. Then follow the instructions… Note that at this step, for higher safety you can still choose to save instead of executing and then execute only after scan for virus. If downloading does not happen smoothly, you can still go back to the previous zip option. At this step, the warning from Windows is normal. Just check that the program name to be downloaded looks like here beside. Then click on execute. PA² Software User’s Manual 2012-04 4/ 20 Step-2; Installing Double check if the directories are suitable. proposed A PA2 subfolder will be created in your [my] Documents folder, in which will be placed, by default, the graphics that you want to save and the provided example charts. 4.2 Extraction from a CD or DVD Start this set up file. The procedure to follow is exactly the same as described in 4.1, but starting at step-2 4.3 Asking for the serial number At the installation step, an amount of free use is granted, allowing for testing the full functionalities of PA² Software. At the end of this test period, the following message will show up and PA² Software will be usable only after you input the serial number to be automatically inquired to PEENING ACCESSORIES, following this procedure: Click on the question mark <?> in the main menu at the top of PA² window. Select <About> Click on the link apply for a serial number This will automatically connect with ACCESSORIES server for downloading. PA² Software User’s Manual 2012-04 the PEENING 5/ 20 After reaching the server, this window will welcome you. At this step, it is necessary to have already a commercial contract with PEENING ACCESSORIES that will receive automatically your serial number request and will check the commercial status before any serial number transmission. - Fill the Identification fields with your company name, first name, last name and e-mail address. - Click on <Submit> When this message is displayed, PEENING ACCESSORIES will be automatically warned about your inquiry. You can close the navigator and check the e-mail reply that will contain the serial number. Here below, is the content of the e-mail return message: Hello, Hereafter the serial number of your PA2 Software, which allows unlimited use: 35fc-99ab-ee36-2dc3 To input your serial number, use the PA2 software menu "? / About". You can select and copy it (CTRL-C) out of this mail and then you can paste it. You can also enter it manually. Thank you for your confidence 4.4 1) 2) 3) 4) 5) 6) Input the serial number received by e-mail return Open the e-mail message from PEENING ACCESSORIES containing the serial number. Select the activation key, and copy it in the clipboard, Restart PA² Software, Click on the question mark <?> in the main menu at the top of PA² window. Select <About>, Click on <Paste Serial Number> to paste your activation key. When the clipboard is empty or does not contain the proper data format, the button <Paste Serial Number > does not show up. You can then either click on < Input serial number > and manually input the serial number, or come back to your e-mail message and copy the serial number into the clipboard. Click on the “OK” button to confirm. PA² Software User’s Manual 2012-04 6/ 20 PA² is now ready for use with permanent rights. 5 PA² Software Use 5.1 Chart description The 5 main areas are shown in the hereafter screen copy and described in the next sections: Main menu Measurements data format Graphic chart Chart title and message box for results and automatic comments display Table for measurements data input 5.1.1 Measurements data format Almen strip type Select the Almen strip type you intend to use “N”; Thin type for low peening intensity range, “A“; standard type or “C”; Thick type for high peening intensity range, Arc height units Select “inch/1000” (Imperial units) or “mm/100” (metric system) or input any “potatoes” units that will be used only for the active file, Exposure units Select “cycles” or “s” or “min” or “kg/m²” or “Passes” or “min/m”, Almen intensity specification range Input the maximum and minimum required limits of Almen intensities, Saturation point definition Input the maximum arc height increase, in %, when exposure is doubled; generally 10%, Exposure zoom Input a percentage of the maximum exposure input which will be added to it and used as the maximum abscise value for graphic display (from 0% to 200%). The cursor can also used, Computed values The Almen saturation curve is displayed as soon as 2 measurement points are entered into the input table. When pointing anywhere at the curve, the exposure and corresponding computed arc height will be displayed in this frame, PA² Software User’s Manual 2012-04 7/ 20 5.1.2 Table for measurement data input Description of the 6 input lines Notes: 1. Each table column refers to one measurement point with the related inputs, selections and computed values, 2. The orange highlighted columns contain measurement points out of maximum the allowed distance from the curve. The maximum allowed distance is defined inside the <Options> menu (see 5.1.3 & 5.1.4). These points are marked with a red triangle in the chart. If the triangle is pointing downside < >, the point is too high above the computed curve; positive distance. If the triangle is pointing upside < >, the point is too low underneath the computed curve; negative distance. Measurement point number Check marks will automatically appear as soon as starting to input data in each column. When removing some check marks, the input values remain in memory and table display, but they are no longer taken into account for calculation and graphic display. To take back the inputs into account for computation, just click in the check area at the top of the column. This function is very useful for analyzing and showing the influence of each of the measurement points on the final result. Charts with different combinations can be saved and printed separately or displayed in the same “Multigraph” chart (see section 5.3). Exposure Input here the value of the exposure to the peening stream. The exposure units selected in Almen measurements data format will automatically apply for calculation, display and memory inputs. If you have selected “min” as “exposure units”, 1.5 min will be accepted as 1min and 50 sec ,1.3 min will be accepted as 1min and 30 sec and 1.8 min will be accepted as 2min and 20 sec. Arc Height Input here the arc height value after peening either red on the Almen gage display or directly send by USB port to the computer (see section 6), Pre Bow Input here the arc height value before peening either red on the Almen gage display or directly send by USB port to the computer, Compensated value No input there; the effective arc height after removing the pre-bow will be automatically calculated and used as actual input value for further calculation steps. Computed value No input there; the effective arc height will be automatically displayed here after computation. Distance (Deviation) No input there; the effective distance from the measurement point to the computed curve will be automatically calculated, taken into account and displayed here after computation. PA² Software User’s Manual 2012-04 8/ 20 "Draw again" button and "Automatically" checkbox (top left) When the "Automatically" box is checked each new input in the table causes recalculation and the immediate drawing of the curve; this can be unpleasant when enter lots of data are entered, especially with Almen gage. To avoid this drawback, uncheck this box. It is then needed to click on the "Draw again" button to update the chart. The "Automatically" box is selected by default when a graphic is loaded from the memory, but it is disabled when a new chart is created. “Ascending sort” button As the software allows you to input values in any order, not necessarily growing, this function allows sorting values, after input, into the growing order of exposure time first, and then compensated values in case when several exposures are identical. Select “all” or “none” option When the “All” option is selected, then all the measurement points with full data inputs will be taken into account for computation. When the “None” option is selected, then no input will be taken into account for computation. This option is useful before re-selection of some measurement points. 5.1.3 Chart title and message box for results and automatic comments display Chart name; input here the chart title, as short and clear as possible i.e. “First test – Inside top – S110 - 40 psi” Warning: If you do not change it until the file saving step, this chart name will be used as default file name for the 1st file save. Therefore the following signs are prohibited: “ ? , ” , / , \ , < , > , * , І , : ”. 1st 2nd and 3rd lines of automatic comments; several messages can be displayed there. These messages are just advises and will not bring any automatic reaction from the software. Therefore, it is the choice of the user to follow or not follow the advice. The 1st line displays intensity range error messages in brown color: - “Almen intensity is too low to be measured with N type” - “Switch Almen strip from type N to thicker type A” - “Switch Almen strip from type A to finer type N” - “Switch Almen strip from type A to thicker type C” - “Switch Almen strip from type C to finer type A” - “Almen intensity is too high to be measured with C type” The 2nd line displays comments according to Almen saturation curve building method as described in Standards or peening manuals: PA² Software User’s Manual 2012-04 9/ 20 “New measurement required beyond ‘2t’” Means maximum exposure input is too low. - “4 measurement points required at least” This message is displayed as long as less than 4 measurement points are input or simply selected. - “New measurement required lower than xx” Means minimum exposure input is too high. The 3rd line of comments warns up when the Almen intensity is out of the specified tolerance span; - “Saturation point out of tolerance span” Minimum and maximum Almen intensity limits can be defined into the 2 input boxes at the left of the screen under the “Almen Intensity specifications” label. These limits will be displayed as green lines in the chart The 4th line displays in blue color the standard deviation value in arc height units. This value will be used to define whether measurement points are close enough from the computed curve; see tools option in the main menu. The 5th line displays in brown color the “a” and “b” values where: “a“ is the arc height limit (horizontal asymptote value) expressed in arc height units, and “b” is a constant expressed in exposure units, The curve equation is: a . x / (x + b). 5.1.4 Main PA² Software menu The file name is displayed in the title bar of PA² Software window. The menu works as any standard menu for PC software with the following specificities: Menu, File - File, Open This option works on a single graphic chart which is linked with its own datasheet. - File, Open Multigraph This option gives direct access to a multi-chart file that has been previously built with several single graphic charts and saved as a Multigraph chart. An error message could be displayed when several charts that were used to build the Multigraph were moved, renamed or deleted. When opening a Multigraph, any other open Multigraph will be automatically closed as well as any other single chart that is not part of the Multigraph to be opened. A warning will show up if these files have been modified. - File, Export (CSV) This option will save the graphic chart and attached datasheet as a CSV file (Coma Separated Values) that can be handled to feed any software such as tabulator, text treatment or database… - File, Print This option allows to print either a single chart, or a Multigraph or two data sheets, based on the active page on the screen. To allow faster opening, the last registered graphics are displayed at the bottom of the file menu. By default, the simple graphics have the ".alm" extension and Multigraph have the ".amm" extension. PA² Software User’s Manual 2012-04 10/ 20 Menu, Tools - Tools, Multigraph This option works on all graphic charts that are currently open (maximum 6). Multigraph (or <F5>) allows the compiling of several single charts on the same graphic chart and the saving of this as a new multichart file (see Multigraph). - Tools, Options Options functionality will open the following window and give access to some software settings: Language Select here your language. Default Values Input or select here the values that will be taken into account for any new file filling. Points out of Range Input here the maximum distance from the curve to a measurement point, measured in amplitude of standard deviation. Metric/Imperial Units Input here your own format description of arc height units. Display 2T Default Path Input here the path to use in order to open or save any file if not changed at the saving or finding step. The browse button can be used to change the path. PA² Software User’s Manual 2012-04 When activated, the coordinates of the “2T” theoretical point will be displayed. 11/ 20 5.1.5 Graphic chart Arc height input units Measurement point out of xxxx Imperial/Metric conversion of arc height input units Measurement point units Almen intensity Almen intensity tolerance span Measurement point out of xxxx Computed Almen curve Measurement point out of maximum distance from the curve Saturation point 2 x T display Measurement point out of xxxx Saturation time,‘T’ 5.2 Datasheets All data related to the Almen curve building and the associated graphic chart can be saved here spread on 2 data sheets and sorted by topic of interest. 5.2.1 Navigation To access to the data sheet from the graphic chart, select the thumbnail “DataSheet1” or “DataSheet2” at the top of the graphic chart. To go back to the graphic chart, select the thumbnail “Chart” bottom at the top of the graphic chart. 5.2.2 Data input White input boxes accept text data format with no restriction except the length. Grey boxes cannot receive data, depending on another input box content. Some boxes can only receive data from a selection list; click on the <▼> button at the right of the input box. 5.2.2.1 Data input, Page-1/2 The data are dispatched through 4 areas - Customer Data Input here all information allowing defining clearly the company, organization or internal Department who is ordering the shot peening work. - Work Part Input here all information allowing defining clearly the work part name, location in the assembly, reference code, peening area, material and its main characteristics. PA² Software User’s Manual 2012-04 12/ 20 - Specifications List Input here all standards and specifications references governing the shot-peening process, including customer and internal specifications and technical data sheets, purchase order… - Main requirements Input here the main requirements from the drawings, specifications, technical sheets, purchase order and any other contractual document. Note: Almen strip type is a multi choice input area where only N, A, C standard types can be selected. The Almen strip type input here is automatically copied in the graphic chart. Inside the datasheets, any label not marked with “ * “ can be changed; the modifications will apply to any existing and new files, except the 8 labels from the “Specific Data“ group in Datasheet 2 which will remain specific to each file if not changed. Warning! The new labels will be effective for any other data sheet, including the ones already saved. I.e.; if the blue label of 3rd line on the right is “Date”, any new datasheet will have “Date” as label of the 3rd line at right. PA² Software User’s Manual 2012-04 13/ 20 5.2.2.2 Data input, Page-2/2 The data are dispatched through 3 areas - Process parameters Input here all information about the process, machinery and parameters. Some of the blue data box tittles are interactive and will change according to your equipment and type selection. - Movements Input here all information about automatic work part or nozzle movement. - Specific data In this area, the 8 blue labels (Free) can be changed as well as well as the data content, up to your need. The label change will be effective only for the active data sheet. PA² Software User’s Manual 2012-04 14/ 20 5.3 Multigraph chart PA² Software offers the possibility to display up to 6 Almen curves together in the same graphic chart named “Multigraph”. 5.3.1 What is the use of Multigraph? The Multigraph functionality allows to: Display the different Almen curves for several Almen strip holders on the same component Compare several Almen curves from the same production campaign, Show the variation of Almen intensity versus air pressure, wheel turbine rpm, shot size and hardness… Represent the Almen curves (Max 4) in between the minimum and maximum tolerance limits, Check the influence of critical Almen measurement items such as different screw types used to mount the Almen strips, Almen strips pre-bow, re-use of Almen strips (forbidden)… PA² Software User’s Manual 2012-04 15/ 20 5.3.2 How building a Multigraph? 1 - Close any single chart that should not be included into the Multigraph, 2 - Open each of the single charts that will be included into the Multigraph, 3 - Select <Tools>, <Multigraph> or press <F5> which will automatically generate a new Multigraph chart. If the single charts use different types of Almen strips or different exposure units, a message will warn that only charts complying with the first chart will be selected. 5.3.3 Multigraph functionalities The active single chart is the one of which title is highlighted with a white background. In order to clarify the display, only the measurement points for the active single chart are displayed. To come back to a single chart, double click on its title or use <window> in the main menu. To remove a curve from the display but not from the Multigraph, just remove its check at the left. To display it back, click again in the check. To display the saturation points, select your option (all, selection or none) inside the control box titled “Display saturation points”. 5.3.4 Display properties Click on <Properties> to change the color and thickness of the lines. The following window will open: PA² Software User’s Manual 2012-04 16/ 20 5.3.5 Multigraph Example In this showcase, minimum and maximum tolerance Almen cures will be built for mm-A 0.18 and 0.22. 2 Almen measurements curves will be integrated into a Multigraph, together with the tolerance curves in order to check which one is acceptable for production and make a decision. Recommendation: to ensure that any change in individual data set will be taken into account for the Multigraph building, do not save the Multigraph chart until all data of each chart are actually set. 5.3.5.1 Building the tolerance curves It is necessary to build the minimum and maximum tolerance curves just as any other Almen saturation curve, looking for a saturation point as close as possible from the tolerance values of mm-A 0.18 and 0.22. PA² Software User’s Manual 2012-04 17/ 20 5.3.5.2 Building different curves in between the tolerance limits Applying peening parameters in between the minimum and maximum amplitude of peening parameters defined at the previous step will produce Almen curves in between the 2 tolerance curves. PA² Software User’s Manual 2012-04 18/ 20 5.3.5.3 Multigraph and results exploitation Here above, the Multigraph allows understanding the followings: The lower is the Almen intensity, the longer is the saturation time, Close to the lower Almen intensity tolerance limit, a given time variation induces low difference in arc height. Close to the upper Almen intensity tolerance limit, the same amount of time variation induces a much higher difference in arc height, but saturation time is much shorter. This allows making decisions, depending on your own constraints in terms of industrial process, equipment capability and specification requirements... 6 Almen Gage Connection with the computer The Almen gage can be connected through a USB port and simply used as data input device. 6.1 USB Gage-PC connection Warning! The gage driver has to be installed, set up and active before any tentative to connect and use the gage. The PEENING ACCESSORIES’ gage driver, is “GageWedge”. GadgeWedge is supplied with the connexion cable (optional). GadgeWedge can also be downloaded for free following this link: http://www.sylvac.ch/index.php?option=com_docman&task=doc _details&gid=159&Itemid=55&lang=en PA² Software User’s Manual 2012-04 19/ 20 6.2 Gadge driver configuration Before any tentative to download and install GageWedge, it is necessary to double check that you have all authorizations from your computer administrator. GageWedge is designed as a very basic interface for Sylvac measuring tools. It allows feeding gage readings directly into Windows programs. GageWedge is designed to be extremely easy to use. Standard RS232 transmission Sylvac parameters: 4800 bauds, 7 data bits, even parity, 2 stop bits, For Windows OS and Windows7. Choose the port which the Almen gage is connected to. Select “Use coma as decimal separator”. Select “filer out non numeric characters”. Post amble keystroke should always be selected. 6.3 Automatic data transmission Once GageWedge is active, PA² requires no other specific artifice to be used with the Almen gage. GageWedge will transmit the data from the Almen gage to the computer. To input data from the Almen gage, place the Almen strip in the gage and press the on/off gage button. To input the next measurement, it is necessary to press again the <Set> button. At any time, data can be input indifferently through the computer keyboard or through the gage connection. After configuration of the gage driver, it is then possible to allow the number of digits and the measurement sign, positive or negative (see gage software user’s manual). PA² Software User’s Manual 2012-04 20/ 20