1
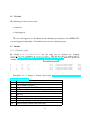
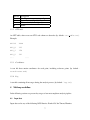
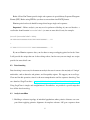
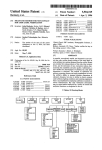
November 12, 2014
MetAmp: a tool for Meta-Amplicon analysis
User Manual
Ilya Y. Zhbannikov1 , Janet E. Williams1 , James A. Foster1,2,3
3
Institute for Bioinformatics and Evolutionary Studies, University of Idaho, Moscow, ID
83844-3051,
2
Department of Biological Sciences, University of Idaho, Moscow, ID 83844-3051,
1
Department of Bioinformatics and Computational Biology, University of Idaho, Moscow, ID
83844-3051,
Keywords:
Bioinfomatics, 16S genes, microbial studies, meta-analysis, data mining
Correspondence:
Ilya Y. Zhbannikov
Department of Bioinformatics and Computational Biology
University of Idaho
Moscow, ID 83844-30521
Email: [email protected], [email protected]
1
Description
MetAmp tool was developed to analyze microbial amplicon data by combining several marker
regions from 16S rRNA gene. Such marker regions serve as unique identifications for species.
There are nine variable regions in total in bacterial 16S rRNA gene and even more marker regions,
because marker region can contain itself several variable regions.
MetAmp was developed by Ilya Y. Zhbannikov ([email protected], [email protected]),
James A. Foster ([email protected]) and Janet Williams ([email protected]).
2
Installation
MetAmp is easy to install. However, you must have R (www.r-project.org), Python 2.7.6
(at least, because older versions may not support some features) (www.python.org), GCC
(https://gcc.gnu.org/) and make sure that you have a stable Internet connection..
1. Download or clone MetAmp from our GitHub repository (http://github.com/
izhbannikov/MetAmp), for example:
git clone http://github.com/izhbannikov/MetAmp
2. In Terminal: cd to the MetAmp directory and execute Makefile: $make. In some cases
you have to be a system administrator, so you need to compile MetAmp with the following
command: $sudo make. First, the installation script will check for required tools: R,
Python and gcc. Then it builds and installs required packages and data for evaluation.
You can also run make install to avoid checking stage.
3. Installation summary:
$git clone http://github.com/izhbannikov/MetAmp
1
$cd MetAmp/
$make
3
Quick start
You have to provide reference libraries, your amplicon data and output directory where all analysis
results will be strored:
One marker region:
python metamp.py -r data/gold21/gold21.fasta \
-r1 data/gold21/gold21_V13V31.fasta \
-l1 data/even/SRR072220_V13V31_relabeled.fastq
\
-o test
Here:
• metamp.py - program name.
• -r data/gold21/gold21.fasta - passing the reference file, that contains whole 16S
sequences, in forward and reverse complement.
• -r1 data/gold/gold21 V13V31.fasta - passing the reference file that contains
marker (region V1-3) sequences extracted from gold21.fasta (whole 16S), in forward and
reverse complement.
• -l1 data/even/SRR072220 V13V31 relabeled.fastq - amplicon emprirical
reads. ”relabeled” means that a barcode sequences were attached to each read label.
• -o test - output directory with all analysis results.
Three variable regions:
2
python metamp.py -r data/gold21/gold21.fasta \
-r1 data/gold21/gold21_V13V31.fasta \
-l1 data/even/SRR072220_V13V31_relabeled.fastq
\
-r2 data/gold21/gold21_V35V53.fasta \
-l2 data/even/SRR072220_V35V53_relabeled.fastq
\
-r3 data/gold21/gold21_V69V96.fasta \
-l3 data/even/SRR072239_V69V96_relabeled.fastq
\
-o test
In this case:
• -r2 data/gold/gold21 V35V53.fasta - a reference file that contains marker (region V3-5) sequences extracted from gold21.fasta (whole 16S), in forward and reverse complement.
• -l2 data/even/SRR072220 V35V53 relabeled.fastq - amplicon empirical
reads.
• -r3 data/gold/gold21 V69V96.fasta - a reference file that contains marker (region V3-5) sequences extracted from gold21.fasta (whole 16S), in forward and reverse complement.
• -l3 data/even/SRR072239 V69V96 relabeled.fastq - amplicon empirical
reads.
To get help from the program, you can use python metamp.py -h:
$python metamp.py -h
usage: metamp.py -o [--output] -r [--ref] <reference 16S seqs> \
3
-r1 [--ref1] <reference marker seqs> \
-l1 [--lib1] <your amplicon library> \
[options]
optional arguments:
-h, --help
show this help message and exit
-o OUTPUT, --output OUTPUT
Output directory.
-r REF16S, --ref REF16S
Output file with keywords.
-r1 REF1, --ref1 REF1
Reference marker sequences for marker type #1
-r2 REF2, --ref2 REF2
Reference marker sequences for marker type #2
-r3 REF3, --ref3 REF3
Reference marker sequences for marker type #3
-r4 REF4, --ref4 REF4
Reference marker sequences for marker type #4
-r5 REF5, --ref5 REF5
Reference marker sequences for marker type #5
-r6 REF6, --ref6 REF6
Reference marker sequences for marker type #6
-r7 REF7, --ref7 REF7
Reference marker sequences for marker type #7
-r8 REF8, --ref8 REF8
4
Reference marker sequences for marker type #8
-r9 REF9, --ref9 REF9
Reference marker sequences for marker type #9
-l1 LIB1, --lib1 LIB1
Amplicon sequences for marker #1
-l2 LIB2, --lib2 LIB2
Amplicon sequences for marker #2
-l3 LIB3, --lib3 LIB3
Amplicon sequences for marker #3
-l4 LIB4, --lib4 LIB4
Amplicon sequences for marker #4
-l5 LIB5, --lib5 LIB5
Amplicon sequences for marker #5
-l6 LIB6, --lib6 LIB6
Amplicon sequences for marker #6
-l7 LIB7, --lib7 LIB7
Amplicon sequences for marker #7
-l8 LIB8, --lib8 LIB8
Amplicon sequences for marker #8
-l9 LIB9, --lib9 LIB9
Amplicon sequences for marker #9
-qual QUAL, --qual QUAL
Quality score threshold (default=15)
-minlen MINLEN, --minlen MINLEN
Minimum read length (default=250)
5
3.1
Test data
The following test data sets were used:
• data/even/
• data/staggered/
The even and staggered are the Human mock community pyrosequence data (SRX021555),
even and staggered community, 21 microbial species and one eucariotic species.
3.2
Results
3.2.1
Clustering results
By default it is clusters.clstr but the name can be changed (by changing
clust filename parameter in config.R file). This file has the uc format and described at http://drive5.com/usearch/manual/ucout.html. Below we provide an
example and copy the format description from www.drive5.com:
H
H
H
H
H
0
1
1
5
22
250
250
250
250
250
99.6
100.0
100.0
100.0
98.8
+
+
+
+
+
0
0
0
0
0
0
0
0
0
0
250M
250M
250M
250M
250M
read11;barcodelabel=TCAG;
read6;barcodelabel=TCAG;
read12;barcodelabel=TCAG;
read7;barcodelabel=TCAG;
read22;barcodelabel=TCAG;
OTU_1
OTU_2
OTU_2
OTU_4
OTU_20
Description of uc format is directly taked from http://drive5.com/usearch/
manual/ucout.html
Field Description
1
Record type S, H, C or N (see table below).
2
Cluster number (0-based).
3
Sequence length (S, N and H) or cluster size (C).
4
For H records, percent identity with target.
5
For H records, the strand: + or - for nucleotides, . for proteins.
6
Not used
7
Not used
8
Compressed alignment or the symbol ’=’ (equals sign).
9
Label of query sequence (always present).
10
Label of target sequence (H records only).
6
Record
H
S
C
N
3.2.2
Description
Hit. Represents a query-target alignment
Centroid (clustering only)
Cluster record (clustering only)
No hit
OTU table
An OTU table, where rows are OTUs and colums are barcodes (by default - otu table.txt).
Example:
OTUId
TCAG
OTU_8
123
OTU_9
158
OTU_2
341
...
3.2.3
....
Coordinates
A text file that contain coordinates for each point, including reference points (by default coordinates.crd)
3.2.4
Log
A text file containing all messages during the analysis process (by default - log.txt)
4
MetAmp workflow
In the following sections we present key stages of our meta-amplicon analysis pipeline.
4.1
Input data
Input data can be any of the following NGS libraries: Roche 454, Ion Torrent, Illumina.
7
Roche 454 and Ion Torrent provide single-end sequences in special binary Sequence Flowgram
Format (SFF). Before using SFF files you have to convert them into FASTQ format.
Illumina paired-end reads should be merged into longer single-end sequences.
Important! - Before analysis, you may need to perform re-labeling of your read headers: a
read header should contain barcodelabel (see more at www.drive5.com), for example:
@read1;barcodelabel=TCAG;
GATGAACGCTGGCGGCGTGCCTAATACATGCAAGT...AT
+
IIIAAAIIIIIIIIIIIIIIIHHHIAAAAAAAAAA...II
If you use Illumina sequence data, you also have to merge overlapping paired-end reads. Later
I will provide the scripts that can do these things above, but for now you can simply use scripts
provided at www.drive5.com.
4.2
Data denoising
Data denoising is necessary for downstream analysis because it removes the majority of ’foreign’
nucleotides, such as barcodes and primers, and low-quality regions. We suggest you to use SeqyClean tool for this operation, since it is the most comprehensive tool for sequence denoising. You
can download SeqyClean here: https://bitbucket.org/izhbannikov/seqyclean.
Using SeqyClean is simple and straightforward. Nevertheless, we provided a special script that
does all the data de-noising.
4.3
Analysis workflow
1. Building a reference topology of microbial populations,where pairwise distances are computed from applying pairwise alignment of complete reference 16S gene sequences from
8
RDP database, see Figure 1(a), top plane. We use the percent sequence identity in order to
compute the distances between sequences.
2. Computing a guide ”amplicon” topology for each reference 16S sequence. To do this, we
extract marker regions (for example V1- V3 and V6-V9) from reference complete 16S sequences (”reference points”) and place them on to the plane with the same methodology that
was used for building the reference topology of complete 16S (see Figure 1(a), bottom plane,
hollow green circles).
3. add empirical amplicon sequences (in fact, amplicon consensus sequences), obtained through
amplicon sequencing of microbial data (Figure 1b, bottom, filled blue circles). This topology
is the same empirical topology as if the empirical data would be clustered with existing
methods
4. Normalized empirical topologies are formed foreach marker through mapping of each empirical point back to the reference 16S sequence topology. Mapping between the reference
topology and guide ”amplicon” topology is achieved with affine transformation. Guide sequences are so match with the corresponding reference 16S sequences, from where they
were obtained from (see Figure 1a, top, solid green circles), and, in turn, carry the empirical
amplicon sequences (or consensus amplicon sequences) back to the 16S plane.
5. Repeating stages 2-4 for each variable region.
6. Clustering and building OTUs.
7. Final statistics.
9
(a)
(b)
(c)
Figure 1: Ilustration of “meta-amplicon” analysis algorithm. (a) Computing reference (top plane)
and guide (bottom plane) topologies. Pairwise sequence dissimilarity is used to compute distances
between reference sequences. The same approach is used for guide sequences, originated from
corresponding whole 16S gene sequences. Reference and guide points are then placed on to the
planes with multidimensional scaling. (b) The empirical amplicon sequences (hollow blue circles)
are places on to the bottom plane along with the guide circles (hollow green) circles and with the
same metric. Such guide sequences are then mapped back to the reference 16S plane, carrying
empirical sequences (solid blue circles). (c) Then this is repeated for each of marker (variable)
region.
10
4.4
Output files
• Clustering results (*.clstr) - by default it is clusters.clstr but the name can be
changed (by editing clust filename parameter in config.R file)
• An OTU table, where rows are OTUs and colums are barcodes (by default otu table.txt).
• A text file that contain coordinates for each point, including reference points (by default coordinates.crd)
• A text file containing all messages during the analysis process (by default - log.txt)
5
Provided data
We provided some data that can be used in your projects. For evaluation purposes we provided
small data set. Description of provided data is given below:
• gold folder contains ’Gold Dataset’ (gold.fa) containing the ChimeraSlayer reference
database in the Broad Microbiome Utilities (http://microbiomeutil.sourceforge.net/), version
microbiomeutil-r20110519. This contains more than 5000 sequences in both orientations
(forward and reverse-complemented.).
• In addition, we supply a dataset that contains 1500 microbial 16S sequences extracted from
the ’Gold Dataset’.
• Evaluation data set contains a smal set of reference sequences (21 sequences) and empirical amplicon sequences (data/even.zip and data/staggered.zip). Amplicon sequences
contain sequence data from Human Mock Community. More information provided here:
http://www.hmpdacc.org/HMMC/
11
Evaluation:
Name
even
staggered
gold21.fasta
gold21 V13V31.fasta
gold21 V35V53.fasta
gold21 V69V96.fasta
Description
Even community: SRR053818, SRR072220, SRR072239
Staggered community: SRR072221, SRR072223, SRR072237
contains 21 reference 16S sequences
contains 21 reference marker sequences (1-3 regions)
contains 21 reference marker sequences (3-5 regions)
contains 21 reference marker sequences (6-9 regions)
The even and staggered are the Human mock communuty (HMP) pyrosequence data
(SRX021555: http://www.ncbi.nlm.nih.gov/sra?term=SRX021555). Detailed description of these datasets (and sequencing protocols) is under the following link: http://
www.hmpdacc.org/HMMC/
5.0.1
Directory map and descriptions of folders
MetAmp
data
gold21
gold1500
gold5000
src
Packages
blastparser
bin
python scripts
data - contains reference sequences, evaluation data and other data that can potentially be
useful
data/gold - contains ’gold’ reference sequences from Broad Institute. data/gold1500 - contains
1500 ’gold’ reference sequences extracted from the previous ’gold’ dataset. data/gold21 - contains
21 ’gold’ reference sequences extracted from the previous ’gold’ dataset. This dataset was used to
evaluate MetAmp src - contains source files.
Packages - contains installation files.
12
Packages/blastparser - a parser for blastn files.
bin - binary files (alignment and clustering programs).
python scripts - Python scripts from www.drive5.com.
6
Parameters
You can adjust parameters in file config.R. It contains parameters such as path to temporary
directory, names of the output files, etc. Below we describe those parameters in details.
6.1
config.R
usearch and usearch7 - paths to alignment tool (we use USEARCH, see www.drive5.com)
R LIBS - Path to installed BLASTParser package (BLASTParser parses output files from
USEARCH and creates distance matrices)
clust filename - Filename of file with final clusters
otu table filename - Filename of final OTU table
coord filename - Filename of output file with NMDS coordinates of each reference and empirical
point (see ’Analysis workflow’)
chime ref - Chimeric reference database
tmp dir - A directory that contains temporary files
keep tmp files - Keep or not temporary files
7
Acknowledgements
This work was made possible by NIH Grants P20GM16448 and P20GM16448, and NSF Grant
DBI0939454.
13