1
Work in Progress
Index to free software for Econometricians
Gretl - An easy to use econometric package
R
JMulti
Octave
Scilab
Maxima
Libreoffice(OpenOffice)
LaTeX
Text Editors
Programming
Kompozer
Gretl
1. Downloading and installing gretl (GNU Regression and Econometric Timeseries Library)
Obtaining Gretl: Quoting from http://gretl.sourceforge.net/ gretl is a cross-platform software package for econometric analysis, written in the C programming
language. It is free, open-source software. You may redistribute it and/or modify it under the terms of the GNU General Public License (GPL) as published by the
Free Software Foundation. A windows version may be downloaded by selecting gretl for Windows on the list on the left hand side of the home page. There are
two versions of the install program available gretl-1.9.5.exe and gretl_install.exe. The first of these is the latest “stable” version. The second is the latest
development snapshot which may contain some updates and bug fixes but may have some new bugs. I use the second version and update occasionally. I keep the
previous version in case I need to revert but this has not proven necessary. A user’s guide and a reference manual are contained in the download or may be
downloaded separately from the web-site.
Installing gretl: Installation is simple. Double click on the downloaded file and follow the instructions. You may accept the suggested defaults.
Other gretl resources:
1. The gretl web site contains versions of the X12-ARIMA and TRAMO/SEATS seasonal adjustment programs which are can be called from within gretl and can
save their output in gretl format
2. The web site also contains data sets and script files for
Wooldridge, Introductory Econometrics
Gujarati, Basic Econometrics
Stock and Watson, Introduction to Econometrics
Davidson and MacKinnon, Econometric Theory and Methods
Marno Verbeek’s Guide to Modern Econometrics
3. Lee Adkins gretl page, http://www.learneconometrics.com/gretl.html contains a downloadable guide to the use of gretl with (Using gretl for Principles of
Econometrics, 3rd edition) and other useful links.
4. There is a gretl wiki site at http://gretlwiki.econ.univpm.it/wiki/index.php/Main_Page. This also contains some useful links
2 Using Gretl
There are basically about 3 ways to use gretl
1. Using the programs graphical user interface (GUI) – This is similar to many Windows programs where you use the mouse and mouse clicks to select various
actions from drop-down menus. As you will see most of the menus are self explanatory. For the moment to start the GUI just double click on the gretl icon that the
install program that the installed on your desktop.
2. Using gretl scripts – All these menu items can be completed by issuing commands in the gretl programming (script) language. These commands can be saved to a
file and the set of instructions in the file can be rerun from the saved file. (In some organisations the internal audit function (or management may insist that a record
of econometric analysis be kept to aid replication. Unless the work is of a very simple nature this is the only way to ensure that an analysis can be replicated.)
3. Combining GUI and scripting – If you run Gretl from the GUI it has the facility to save the menu choices and options you take as a script file. You may then use
and possible expand and amend that script file as a basis for further analysis.
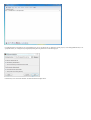
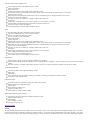
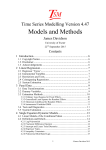
When you start the GUI the window below is displayed.
In working through any econometric project I recommend that one set up a specific directory or subdirectory for that project (C:\Users\frainj\gretl\introduction). I can
specify that directory as working directory using the|File|Working Directory| menu item as in the following Figure.
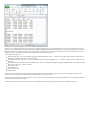
In that directory I have an Excel file denmark .xls which is illustrated in the figure below.
The data set is a rectangle with observations in rows and series in columns. Missing data can be represented by blank cells, by NA or several other options. (See users’
guide). The data are imported from Excel using the Menu items |File|Open Data|Import|Excel| and selecting the relevant file. Gretl will try to determine various features of
the file and will ask you to confirm these features. (It generally does this well). In the current case it determines that the data are time series and labels the observations
with the correct dates. The data are now entered on the Gretl Workplace. Gretl can import data from
a large number of other programs
Plain text (ASCII) files – These can be brought in using gretl's |File|OpenData| Import ASCII. . . | menu item, or the import script command. For details on what
gretl expects of such files, see Section 4.4. of the users’ guide.
Comma-Separated Values (CSV) files – These can be imported using gretl's |File|Open Data|Import CSV. . . menu item, or the import script command. See also
Section 4.4.
Spreadsheets: MS Excel, Gnumeric and Open Document (ODS) – These are also brought in using gretl's |File|Open Data|Import| menu. The requirements for such
files are given in Section 4.4. of the user’s manual
Stata data files (.dta).
SPSS data files (.sav).
Eviews workfiles (.wf1)
JMulTi data files
gretl can also access some Rats 4 and GiveWin through its data bank routines. On occasion owners of proprietary software may make changes to their native data
formats and it is possible that the gretl routines may not work with the latest versions of these formats.
Gretl has its own native data format and it is possible to save all or a selection of our data in this format with the menu item |File|Save Data|. It can then be loaded directly
from the |File| Open Data|User File| menu item.
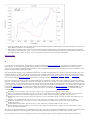
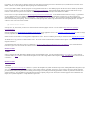
Examining the menu items shows the variety of work that can be completed in gretl. The following graph and its annotations were produced in two steps.
1. A basic graph containing the two series was produced using the menu item |View|Graph selected Variables|Time Series Plot| and choosing the two variables to be
plotted. This does not produce a very informative graph.
2. Right clicking on the graph brings up a context box. Select the edit item to bring up a tabbed options box. First select the lines tab and change the axis for line 2
LYR to right axis. Next select the main, x-axis, y1-axis and y2-axis to add various other labels to the graph. Note that various other options are available. There is
no problem trying these to see how you get on. You can use the options in the context box to save the graph in various formats.
Return to Index
R
R is a comprehensive statistical package. Base R package is available for download from http://www.r-project.org/. You will get a faster download if you choose a
nearby mirror site. To install basic R simply run the install the program. If you are working in 64-bit windows you can install both the 64-bit and 32-bit versions
versions. If you are installing (or updating) R packages in Windows 7 start R as administrator (Right click on R icon on desktop and select "run as administrator"). The
packages can then be installed or updated from within R.
Many modern statistical techniques become available in R long before they are available in commercial packages. The system is open to the extent that source code is
available for all routines on CRAN (Comprehensive R Archive Network). Currently the system consists of a base package and over 3000 supplementary packages.
To get an idea of the coverage of R for econometrics one might look at the CRAN task views for Econometrics, Time Series , Finance, and Social Sciences. Various
other task views available at http://cran.r-project.org/ indicate other areas that may be of interest to economists and econometricians.
One of the reasons that I use R because it is easier to do the hard things in R. It is probably true to say that, until one gets accustomed to R, it is harder to do the easier
things in R. I would, therefore, recommend R to an experienced economist who wishes to use some routine or a variant of an existing routine that is not easily available
in a standard package. It would also be useful to anyone who wished to obtain a deeper understanding of a particular routine or who wished to control some aspect of a
process. However anyone I know that has mastered the steep learning curve of R finds it convenient to use for ordinary tasks. If you wish to learn R you might start by
reading through An Introduction to R. You might browse through the list of contributed documentation at http://cran.r-project.org/. “Econometrics in R” by Grant
Farnsworth (PDF) is an introduction to R for Econometrics. There is a list of books (110 at this time) on R at http://www.r-project.org/. Of particular interest for
econometrics are
David Ruppert. Statistics and Data Analysis for Financial Engineering. Use R! Springer, 2010. ISBN: 978-1-4419-7786-1.
Paul S. P. Cowpertwait and Andrew Metcalfe. Introductory Time Series with R. Springer Series in Statistics. Springer, 2009. ISBN: 978-0-387-88697-8.
Giovanni Petris, Sonia Petrone, and Patriza Campagnoli. Dynamic Linear Models with R. Use R. Springer, 2009. ISBN: 978-0-387-77237-0.
Bernhard Pfaff. Analysis of Integrated and Cointegrated Time Series with R, Second Edition. Springer, New York, 2nd edition, 2008. ISBN 978-0-38775966-1.
Jonathan D. Cryer and Kung-Sik Chan. Time Series Analysis With Applications in R. Springer, New York, 2008. ISBN 978-0-387-75958-6.
Hrishikesh D. Vinod. Hands-on Intermediate Econometrics Using R: Templates for Extending Dozens of Practical Examples. World Scientific,
Hackensack, NJ, 2008.
Christian Kleiber and Achim Zeileis. Applied Econometrics with R. Springer, New York, 2008. ISBN 978-0-387-77316-2.
Robert H. Shumway and David S. Stoffer. Time Series Analysis and Its Applications With R Examples. Springer, New York, 2006. ISBN 978-0-38729317-2 (new edition now available ?)
There are also several general introductory texts on R listed in the same source. There is a form of standardised documentation that accompanies each package. Many of
the contributed packages have accompanying vignettes which describe the theory underlying the package and give examples on how to use the package.
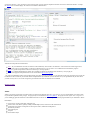
If you are going to use R you need to use a program/script editor to write your program/script files. There is a simple editor included in the base R windows GUI
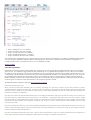
(graphical user interface). Once you begin to do more advanced work you need a better development environment. Several are available at the moment. Currently I
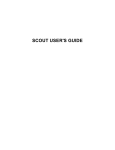
use RStudio and recommend it highly. The initial screen of RStudio is illustrated below.
Alternative R development environments include
Emacs. My recommended site for Emacs for Windows is that maintained by Vincent Goulet. He distributes a version of Emacs that contains support for R,
LaTeX, Octave and several other additions. I would not recommend Emacs to a new user of R as it is a bit different to the usual Windows programs.
Tinn-R is a popular development for R that I have used in the past. Some people like it
Rcmdr is a a platform-independent basic-statistics GUI (graphical user interface) for R which has been extended by a variety of plug-ins.
Several other program development interfaces for R are described in http://sciviews.org/_rgui/.
My current recommendation would be to begin with the simple GUI in base R and move to RStudio. For any particular user the range of packages he may require will
be different from those another may need and the methods of implementation may be different. If you can find an R-user in your organisation he may be able to advise
you what is best in your case. It took me a long time to get accustomed to R but the investment has been worthwhile.
Return to Index
JMulti
Jmulti is a GUI based program for the econometric analysis of univariate and multivariate time series. It provides easy access to a limited number of procedures which
may be difficult to implement in other packages. The program may be downloaded from http://www.jmulti.de/. The program is based requires Java 1.6 or greater. If
you are installing pay particular instructions to the installation instructions on the web site. According to the website the program facilities may be summarised as follows
Initial Analysis
various tools for creating, transforming, editing time series
Unit Root tests: ADF, HEGY (quarterly, monthly), Schmidt-Phillips, KPSS, Unit Root test with structural break
Cointegration tests: Johansen Cointegration test with response surfaces, Saikkonen & Lütkepohl test
kernel density estimation
spectral density plots
crossplots
autocorrelation analysis
VAR (can be used for univariate modelling as well)
VAR modelling (with arbitrary deterministic/exogenous variables)
subset model estimation
output in matrix form
automatic model selection (various strategies based on information criteria)
residual analysis with tests for nonnormality, autocorrelation, ARCH, spectrum, kernel density, autocorrelation plots, crosscorrelation
GARCH analysis for residuals
Impulse Responses with bootstrapped confidence intervals also for accumulated responses, orthogonal and forecast error versions
Forecast Error Variance Decomposition
forecasting, also levels from 1st differences, asymptotic confidence intervals for levels
causality tests
stability analysis: bootstrapped Chow tests, recursive parameters, recursive residuals, CUSUM test
SVAR modelling: AB model, Blanchard-Qua Model with bootstrapped standard errors
SVAR Forecast Error Variance Decomposition
SVAR Impulse Responses with bootstrapped confidence intervals
VECM
VECM modelling (with arbitrary deterministic/exogenous variables)
restrictions on cointegration space, Wald test for beta restrictions
Johansen, Two Stage, S2S estimation procedures
EC term can be fully or partly predetermined
subset model estimation
output in matrix form
automatic model selection (various strategies based on information criteria)
residual analysis with tests for nonnormality, autocorrelation, ARCH, spectrum, kernel density, autocorrelation plots, crosscorrelation
Impulse Responses with bootstrapped confidence intervals also for accumulated responses, orthogonal and forecast error versions
Forecast Error Variance Decomposition
forecasting, also levels from 1st differences, asymptotic confidence intervals for levels
causality tests
stability analysis: bootstrapped Chow tests, recursive parameters, recursive eigenvalues
SVEC modelling with bootstrapped standard errors
SVEC Forecast Error Variance Decomposition
SVEC Impulse Responses with bootstrapped confidence intervals
GARCH Analysis
univariate ARCH, GARCH, T-GARCH estimation with different error distributions
residual analysis for ARCH residuals with robustified test for no remaining ARCH (S. Lundbergh, T. Teraesvirta), plotting of variance process, kernel density for
residuals
multivariate GARCH(1,1) estimation, residual analysis, plotting of variance process together with univariate estimates, kernel density for residuals
Smooth Transition Regression
STR model specification with exogenous/deterministic variables
linearity tests
STR estimation
various specification tests for no remaining nonlinearity, nonnormality, no remaining serial dependency, parameter constancy
various plots to check estimated model
Nonparametric Analysis
lag selection for univariate models based on linear and nonlinear selection criteria
nonlinear estimation with configurable 3D plots
residual analysis
model selection for volatility process
estimation of volatility process
residual analysis for volatility estimation residuals
ARIMA Analysis with fixed regressors (univariate)
lag selection for AR and MA parameters with Hannan-Rissanen procedure
estimation with fixed regressors
residual analysis
ARCH modelling of residuals
forecasting with fixed regressors
Return to Index
Octave
The basic element in programs like GAUSS, Matlab, Ox, Octave and Scilab is a matrix. One can regard them as matrix manipulation languages where on can easily
translate the matrix equations in textbooks and papers into computer instructions. New methods are often implemented first in one of these languages. In my opinion
they are much easier to program than standard econmometric packages. This is borne out by an examination of the software used in articles in the Journal of Applied
Econometrics. In 155 articles, that gave details of software used, in this Journal covering the period 1995 to 2008 Ohms (2011) calculates that 58 used Gauss and 17
Matlab. Stata at 21 was the most popular statistical package but is still far behind Gauss.
Octave is quite similar to Matlab so that most programs are easily portable between the two. Base Matlab programs will often run in Octave without any amendment.
Octave version for Windows 3.2.4 may be downloaded from http://octave.sourceforge.net/. When I install I generally follow the option to install all Octave-Forge
toolboxes. These often correspond to various toolboxes in Matlab and provide additional functionality to that available in base Matlab.
Octave version 3.2.4 may be downloaded from http://www.gnu.org/software/octave/download.html. Use the Windows binaries from Octave Forge. (Cygwin binaries
are also available but unless you are familiar with Cygwin I would not recommend them). I would recommend that you install Octave in a directory that has no
embedded blanks (e.g. "c:\octave" rather than "c:\Program Files". I also install all Octave Forge toolboxes. This is equivalent to installing a lot of Matlab toolboxes and
increases the functionality of the package. However it installs the oct2mat package which contains a bug which interferes with various plotting functions. The simple
solution is to start Octave and issue the command
pkg rebuild -noauto oct2mat
and exit [Cntrl + D]. the next time you start Octave oct2mat will not be loaded and graphics will work. For more details see http://wiki.octave.org/wiki.pl?
OctaveForWindows.
Much of my Matlab notes An Introduction to Matlab for Econometrics are also applicable to Octave. The Econometrics Toolbox for MATLAB by James P LeSage
is broadly compatible with Octave. I have tried several routines and they worked.
Michael Creel has an econometrics text with applications implemented in Octave. This test is available in pdf and may be downloaded from http://idea.uab.es/~mcreel/.
The Matlab GUI is very good and is far ahead of that in Octave. The version of Octave mentioned here contains the editor Notepad++ which works but is not well
integrated with Octave.
An implementation of the Linux GUI for Octave is available from http://www.outsch.org/2011/01/29/qtoctave-0-10-1-for-windows/. I have used this interface in
Linux and it is good. I have also used the emacs interface to Octave but this is for emacs addicts.
Return to Index
Scilab
Scilab is a program with similar functionality to Matlab but with a somewhat different syntax. It can be downloaded from http://www.scilab.org/. It also contains an
econometric toolbox grocer which is a much extended and updated version of the LeSage Matlab toolbox adapted for Scilab. I am surprised that it is not used more in
econometrics.
Return to Index
Maxima
According to http://maxima.sourceforge.net/ "Maxima is a system for the manipulation of symbolic and numerical expressions, including differentiation, integration, Taylor
series, Laplace transforms, ordinary differential equations, systems of linear equations, polynomials, and sets, lists, vectors, matrices, and tensors. Maxima yields high
precision numeric results by using exact fractions, arbitrary precision integers, and variable precision floating point numbers. Maxima can plot functions and data in two
and three dimensions." The main difference between Maxima and standard computer packages is that Maxima, like commercial programs such as Mathematica and
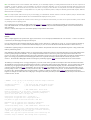
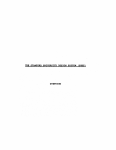
Maple, can do symbolic manipulation. A simple illustration is given below.
1.
2.
3.
4.
5.
In step 1. the integral of 1/(1+x^3) is calculated
In step 2. the derivative of the result is calculated
In step 3. the result of the previous step is simplified
In step 4. the definite integral from 0 to 1 is calculated.
In step 5. the numerical value of this result is calculated.
These calculations were completed using the GUI wxmaxima and do not require a great knowledge of maxima itself. At its simplest you will find that maxima is useful as
a check on your algebra, differentiation, integration, solutions to differential equations. The GUI is not as sophisticated as that in Mathematica or Maple but it is an
extremely powerful system and very useful if you do not have access to Mathematica or Maple.
Return to Index
Libreoffice(OpenOffice)
LibreOffice has been developed from the earlier OpenOffice suite. Currently the two suites are being developed in parallel but LibreOffice appears to be attracting the
greater resources. Any comments here apply equally to both suites. Both packages are very compatible with Microsoft Office. If you are a heavy user of Visual Basic
for Applications you may find that your code may need some amendment. (I do not use Visual Basic for Applications and an not familiar with problems that may occur).
I have found any of my Microsoft Office Word and Excel files have been fully exchangeable with LibreOffice. I have edited many Microsoft .doc, .docx, .xls and .xlsx
files in LibreOffice and reopened the files in Microsoft Office and have never encountered any problems. In preparing data for econometric packages I find that the
facilities in LibreOffice are superior to those in Microsoft Office and I prefer to use LibreOffice. The menu system in LibreOffice is similar to that in Office XP and does
not have the type of GUI in the later versions of Microsoft Office. Some people may regard this as a benefit.
The following description of LibreOffice is taken from http://www.libreoffice.org/features/.
What does LibreOffice give you?
Write r is the word processor inside LibreOffice. Use it for everything, from dashing off a quick letter to producing an entire book with tables of contents,
embedded illustrations, bibliographies and diagrams. The while-you-type auto-completion, auto-formatting and automatic spelling checking make difficult tasks
easy (but are easy to disable if you prefer). Writer is powerful enough to tackle desktop publishing tasks such as creating multi-column newsletters and
brochures. The only limit is your imagination.
Calc tames your numbers and helps with difficult decisions when you're weighing the alternatives. Analyze your data with Calc and then use it to present your
final output. Charts and analysis tools help bring transparency to your conclusions. A fully-integrated help system makes easier work of entering complex
formulas. Add data from external databases such as SQL or Oracle, then sort and filter them to produce statistical analyses. Use the graphing functions to display
large number of 2D and 3D graphics from 13 categories, including line, area, bar, pie, X-Y, and net – with the dozens of variations available, you're sure to find
one that suits your project.
Impre ss is the fastest and easiest way to create effective multimedia presentations. Stunning animation and sensational special effects help you convince your
audience. Create presentations that look even more professional than the standard presentations you commonly see at work. Get your collegues' and bosses'
attention by creating something a little bit different.
Draw lets you build diagrams and sketches from scratch. A picture is worth a thousand words, so why not try something simple with box and line diagrams? Or
else go further and easily build dynamic 3D illustrations and special effects. It's as simple or as powerful as you want it to be.
Base is the database front-end of the LibreOffice suite. With Base, you can seamlessly integrate your existing database structures into the other components of
LibreOffice, or create an interface to use and administer your data as a stand-alone application. You can use imported and linked tables and queries from
MySQL, PostgreSQL or Microsoft Access and many other data sources, or design your own with Base, to build powerful front-ends with sophisticated forms,
reports and views. Support is built-in or easily addable for a very wide range of database products, notably the standardly-provided HSQL, MySQL, Adabas D,
Microsoft Access and PostgreSQL.
Math is a simple equation editor that lets you lay-out and display your mathematical, chemical, electrical or scientific equations quickly in standard written
notation. Even the most-complex calculations can be understandable when displayed correctly. E=mc2 .
LibreOffice also comes configured with a PDF file creator, meaning you can distribute documents that you're sure can be opened and read by users of almost
any computing device or operating system.
If one is working on a less powerful PC one might consider using gnumeric or abiword. gnumeric is a spreadsheet program that can read and write excel files and do
many of the calculations that an economist might wish to do with a spreadsheet. In effect many of the statistical functions in gnumeric are more accurate than those in
other spreadsheets.
abiword is a relatively small wordprocessor. Both of these packages can export files for use in LaTeX.
Return to Index
LaTeX
TeX is a computer program used to produce books, papers, lecture slides etc. In was developed by Donald Knuth in the 1970's and 1980's. LaTeX is a set of macros
in (extensions to) the TeX language developed by Leslie Lamport.
One sets out the structure of the document by listing the parts, chapters, sections, subsections etc. Within each part, section etc. one sets out in plain text and mark-up
the content of the part, section etc. LaTeX then does all the formatting for you. (You can of course fine tune the results afterwards but this is often not necessary.)
In mathematics, engineering and physics LaTeX has become a de facto standard. Many thousands of books have been published using LaTeX. Many journals in these
fields are produced using LaTeX.
Many publications in other fields, including economics, are also produced using LaTeX but it has not been as successful in these fields as in more technical fields because
LaTeX was primarily designed for mathematics. If you are writing technical material then it is much easier to produce good output with LaTeX than with a word
processor. If you have a lot of equations and graphs LaTeX is also quicker than a word processor. Latex can also produce tables of contents, lists of tables and lists of
figures. It has a helper program (bibtex) that reads bibliographic material from a separate file and manages citations within the document and produces lists of
references. This external file of bibliographic material can be managed by another helper program (Jabref) and can be extended and used for several documents.
The following is a small sample tex file. It is largely self explanatory. Any tex file consists of first a preamble and secondly the content of the document and its structure.
The preamble here consists of the single \documentclass(article) statement. In general other auxiliary packages will be included here. If you are starting LaTeX I would
advise that you get an appropriate preamble from a colleague. Don't worry if you don't understand it all in the beginning. If you have the bandwidth in your internet
connection I would recommend the Protext TeX distribution. This is based on the Miktex TeX distribution but is a little easier to install. The install will take at least an
hour and perhaps even more. To generate the .tex file you need a text editor. Do not even think of using a word processor. Several text editors have special facilities
for editing .tex files. MikTeX installs the editor TeXworks by default. I would have a preference for another editor Texmaker which I think offers more help to a
beginner. If a colleague uses another editor and is willing to give some help and advice then you should try his editor. Alternatively if you already use emacs then it has an
excellent Tex mode, AucTeX.
% WARNING!
%
Do not type any of the following 10 characters except as directed:
&
$
#
%
_
{
}
^
~
\
\documentclass{article}
\begin{document}
% Your input file must contain these two lines
% plus the \end{document} command at the end.
\section{Simple Text}
% This command makes a section title.
Words are separated by one or more spaces. Paragraphs are separated by
one or more blank lines. The output is not affected by adding extra
spaces or extra blank lines to the input file.
Double quotes are typed like this: ``quoted text''.
Single quotes are typed like this: `single-quoted text'.
Long dashes are typed as three dash characters---like this.
Emphasized text is typed like this: \emph{this is emphasized}.
Bold
text is typed like this: \textbf{this is bold}.
\subsection{A Warning or Two}
% This command makes a subsection title.
If you get too much space after a mid-sentence period---abbreviations
like etc.\ are the common culprits)---then type a backslash followed by
a space after the period, as in this sentence.
Remember, don't type the 10 special characters (such as dollar sign and
backslash) except as directed! The following seven are printed by
typing a backslash in front of them: \$ \&
The manual tells how to make other symbols.
\end{document}
\#
\%
\_
\{
and
\}.
% The input file ends with this command.
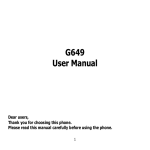
Loading this file into Texmaker and running TeX produces the pdf file below.
There is a good introduction to Latex on http://en.wikibooks.org/wiki/LaTeX. This book is available there in html, pdf and LaTeX source. Further material is listed at
http://www.tug.org/begin.html and in the links there. If you going to write technical material in economics then an investment in LaTeX is worthwhile.
Lyx is an alternative Graphical interface to LaTeX which can be downloaded from http://www.lyx.org/.
Return to Index
Text Editors
I have commented several times on the need to use a text editor rather than a word processor. Notepad the text editor distributed with Windows is particularly
primitive and can only edit one file at a time. I use Scite and Notepad++ . Both programs are very easy to use and are valuable if you have to edit or browse various
test files. I should also mention that I use emacs as a text editor. Emacs was originally used in emacs as a programmers editor and has many worthwhile features. Some
Windows users may find certain aspect of emacs counter-intuitive. An extended version of windows by Vincent Goulet is recommended for Windows.
Return to Index
Programming
If one has a need for programming there are programming IDEs available at http://www.bloodshed.net/devcpp.html (Dev-C++) and http://www.codeblocks.org/
(Code::Blocks). I have used these in conjunction with the Gnu Compillers.
Kompozer
Kompozer may be downloaded from http://kompozer.net/ According to the web site
KompoZer is a complete web authoring system that combines web file management and easy-to-use WYSIWYG web page editing.
KompoZer is designed to be extremely easy to use, making it ideal for non-technical computer users who want to create an attractive, professional-looking web
site without needing to know HTML or web coding
.Almost all of my web pages have been edited and set-up with Kompozer or the earlier Nvu.
Return to Index