1
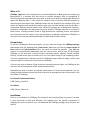
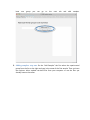
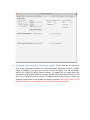
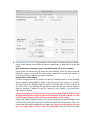
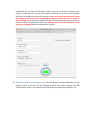
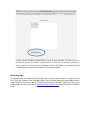
RNA-‐seq analysis with CANEapp User Manual Dmitry Velmeshev Patrick Lally Faghihi’s lab University of Miami Contents What is it? .......................................................................................................... 3 Prerequisites: ..................................................................................................... 3 Installation: ........................................................................................................ 3 Testing: .............................................................................................................. 4 Analysis quick guide: .......................................................................................... 4 1. Creating a new project. 4 2. Adding experimental groups. 4 3. Adding samples: step one. 5 4. Adding samples: step two. 6 5. Adding samples: specifying RNA-‐seq library. 7 6. Specifying analysis settings. 8 7. Setting up differential gene expression analysis. 9 8. Submitting the analysis. 10 9. Checking status of a running project. 11 10. Retrieving the data. 12 11. Primer design. 13 Retrieving logs: ................................................................................................ 14 What is it? CANEapp (application for Comprehensive automated Analysis of Next-‐generation sequencing Experiments) is a software tool that strives to provide biologists with no background in bioinformatics and computational science with an easy way to perform cutting-‐edge analysis of large-‐scale RNA-‐seq data. It also minimizes hands-‐on time to perform RNA-‐seq analysis by automating all the analysis steps. CANEapp comes with the Graphical User Interface (GUI) that makes the experimental design and analysis setup easy and user-‐friendly, and also includes a streamlined RNA-‐seq analysis pipeline that efficiently manages the computational resources, parallelizes computation and automates the entire analysis. CANEapp operates on a variety of UNIX servers, including Amazon Cloud or High-‐performance computing servers and requires zero interaction with the server or any command line or installation operations. CANEapp is a free open-‐source software distributed under the GNU General Public License. Prerequisites: To use the CANEapp for RNA-‐seq analysis, you just need two things: the CANEapp package downloaded from our webpage and a Linux server. Make sure you have the latest version of Java installed and Python version 2.7 on the server to initiate the pipeline. Since RNA-‐seq analysis is computationally demanding, you will need a server with at least 30 GB of RAM. CANEapp can be used with a variety of Linux operating systems (Ubuntu, CentOS, RedHat, Fedora), a cloud server (such as Amazon EC2) or a Linux cluster using LSF job scheduling system. If you are using Amazon Cloud just search for CANEapp Amazon Machine Image, create a new instance based on it and use it as the server for CANEapp. If you are not using an Amazon Cloud server but have administrative rights, run CANEapp as the root user and all prerequisites will be installed automatically! Otherwise you need to contact you system administrator to install the prerequisites. You can simply provide the administrator with shell script with all prerequisites that can be found in the misc folder of CANEapp. For CentoOS, RedHat and Fedora: CANE_library_CentOS.sh For Ubuntu: CANE_library_Ubuntu.sh Installation: There is no installation for CANEapp! The Graphical User Interface (GUI) component is written in Java and works on Mac and Windows. GUI together with the pipeline component of CANEapp will do all the work for you. Just download the CANEapp package, unzip and open the JAR file. Testing: The package includes the “example” folder with two samples (two small Fastq files for each sample) from paired-‐end RNA-‐seq of human tissue. These files can be used to quickly test CANEapp on your system. Use them to perform analysis of paired-‐end data and compare two experimental groups (1 sample each) to familiarize yourself with CANEapp and test the package. Analysis quick guide: Open the CANEapp JAR file. You will start on the “Manage projects” tab. On this tab you can create new projects, check status of running projects and remove existing projects. 1. Creating a new project. Click “Create new project” button, then type in the name of the project (please no spaces) and browse to a location on your computer where you want to save the files related to the project. Press submit. Now you project is displayed in the list of recent projects and you can proceed to designing your experiment. 2. Adding experimental groups. Click on the next tab (“Add groups”). Type in the group name and press “Add Group”. Please no spaces in group names. If you want to remove a group from the list, select the group and press “Remove Group”. Once you added at least one group you can go to the next tab and add samples. 3. Adding samples: step one. On the “Add Samples” tab first select the experimental group from the list on the right and type in the name of the first sample. Then you have two options: either upload raw data files from your computer or use the files you already have on the server. 4. Adding samples: step two. Specify if your sequencing is single or paired-‐end. If you chose to upload the data from the computer, browse to the raw read file. The accepted format is fastq but you can use tar.gz, tar, gz or bz2-‐compressed fastq files, as well as SRA (NIH Short Sequence Archive) files. In case your files are already on the server specify the full path to the file (including the file name) on the server. 5. Adding samples: specifying RNA-‐seq library. Now you need to specify the type of RNA-‐seq library prep you used for your experiment. You can select from a list of predesigned libraries if you know which prep you used or specify a custom library prep. It is necessary to specify the strand selection used in the prep; the other parameters such as adaptor sequences and adaptor lengths are optional. In most cases “Default” will work just fine but if you have additional information about your library it will help with the analysis accuracy. For additional options see below. If you want to modify library settings, unclick the “Default” checkbox to the right of the library. Adaptor sequences are important if you choose to trim the adaptor sequences before performing read alignment; in case you performed size selection and your fragment are bigger that the read length it is not required. If you don’t know which adaptors were used standard Illumina adaptors will be used. Adaptor lengths help in calculating mean insert length and will help with TopHat alignment. If you have information about your library’s size distribution (e.g. from Bioanalyzer trace), specify fragment mean and coefficient of variation (CV). Finally, click “add sample”. Proceed with the rest of the samples. 6. Specifying analysis settings. Next, navigate to the next tab and specify the analysis settings. You have to select the alignment program (TopHat or STAR). TopHat is a more conventional tool that is relatively slow but does not require a lot of resources, whereas STAR is a more recent aligner with ultrafast performance but requires a lot of RAM. Then select the species and the assembly. By default, the pipeline will perform adaptor trimming (“Trim raw reads” option), will filter out single-‐exon transcripts (“Filter transcripts” option) based on what percentage of all samples (Total Filter) or samples from one group (Group Filter) expresses the transcript. The pipeline will then filter out lowly expressed genes (“Filter lowly expressed genes” option) based on minimum number of reads mapping to a gene. You can modify these options; however, the CANEapp was tested with the default options and demonstrated good results so in general the defaults will work well. The species and assembly can be selected using the drop-‐down menus; it is also possible to add new species/assembly by clicking “add species” button and specifying species name, assembly name, URL link to the fasta genome file and the gtf file containing gene annotations. If you are familiar with TopHat, STAR and Cufflinks and want to modify the options for these tools, click “Use Custom Settings” next to one of them. For TopHat or STAR you have to put the options the same way you would use them in the command line (say, if you want to change the max insertion length for TopHat alignment to 2, you would paste “--max-insertion-length 2” in the TopHat option box). 7. Setting up differential gene expression analysis. On the next tab you can select from three alternative workflows for differential gene expression analysis: Cuffdiff, edgeR or DESeq2. If you wish you can run all three in parallel. You can use default options for Cuffdiff or specify custom options. For edgeR you can select from two approaches to differential expression testing: Generalized Linear Models (GLM) or exact test. You can also use them in parallel. For edgeR and DESeq2 you need to select the pairwise combinations of the groups you want to compare. Warning: in order to use edgeR or DESeq2 you need at least two replicates per experimental group. 8. Submitting the analysis. Now proceed to the final tab. You need to specify your user name, server address, home folder and either a password or a public key to access the server. High-‐performance computing servers using IBM Platform LSF Session Scheduler If your server is a cluster using LSF system for job scheduling, check the “Server Uses Job Scheduler” option and specify the cluster queue, amount of memory and number of cores to be used for a job and max time to run a job. Using Amazon Cloud Instance If you are using Amazon EC2 to perform the analysis, the easiest way is to use CANEapp Amazon Machine Image (AMI) to create a new instance with the amount of resources you need. Search for CANEapp AMI and create an instance with as much resources as you need. Then in the CANEapp GUI provide the public key for your instance together with the instance IP address in the GUI. Make sure the instance is running before submitting the analysis. ! Before submitting the analysis, make sure you have at least 30 GB of RAM (or more for large projects) and enough disk space for the analysis. As a rule of thumb, you will need free space 3 times the size of the raw data to safely run the analysis. Finally, click “Submit Analysis” button. If it is the first time you are using CANEapp on the current server, it will take a minute to transfer the pipeline files to the server. After that you will see file transfer window with a progress bar. Make sure the computer does not go to the sleep mode while the files are transferring! Once the files have been transferred, you will see a notification window. Now you can check the status of the project or close the GUI. The rest of the process will take on the server side. CANEapp will utilize all available resources of the server so you can run only one project at a time and should avoid running resource-‐demanding processes on the same server together with CANEapp. If you are using a cluster with the LSF job submitting system you can run several projects in parallel but make sure software and reference installation steps have been completed before starting another project. 9. Checking status of a running project. Once the project has been submitted, you can check its status at any time on the “Manage Projects” tab. Select a project and click “Check Status” button. You will see the current step of the pipeline the projects is at. 10. Retrieving the data. Once the project is completed, the Status will read “Done”. It will enable the Retrieve Output Files button. Click the button, and you will see a window with a bar showing the progress of output files download. Once the files have been downloaded, you can locate them in the local project folder. The files will include one tab-‐delimited text file for each pairwise comparison between groups containing all the genes, another tab-‐delimited file containing only differentially expressed genes (based on FDR) and the third file containing genes filtered by both the expression and FDR. These files can be opened in Excel and contain information including the gene ID, gene name, gene classification, raw read counts for each sample (first column for each sample) and FPKM (second column for each sample), log of fold change between the groups and statistical values for differential expression. The other two output files are the GTF (Gene Transfer Format) files for all genes and for only differentially expressed genes. These files can be used to visualize reconstructed transcripts and loci on IGV (Integrated Genome Viewer). 11. Primer design. Once analysis have been completed and you have identified genes differentially expressed in your experiment, you might want to perform qRT-‐PCR validation of the gene expression estimated with RNA-‐seq or confirm presence of novel, previously unannotated genes. For that purpose CANEapp includes a primer design tool. In order to use it, open the tab-‐delimited output file from CANEapp and select the genes you are interested in validating. Copy the first column contacting the Gene IDs (XLOC). Then navigate to the Primer Design tab and paste the IDs in the window. Press “Submit Gene List” and wait until primers are designed. Primers will be designed preferentially to span a splice junction common to all the isoforms of a gene or to span a common exon. If there are no common junctions or exonic regions, no primers will be designed. Once primer design is complete, the file containing primer sequences will appear in your project folder. Retrieving logs: If you experience any problems with CANEapp (for instance, analysis stops on a specific step), click “Get Logs” button on the “Manage projects” tab. Archived logs will be downloaded to your project folder on the local machine. Please email the archive and the “output.txt” file in your project folder to Dmitry Velmeshev ([email protected]) with the subject “CANEapp issue”.