1
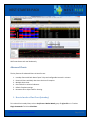
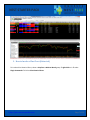
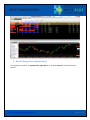
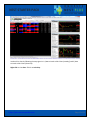
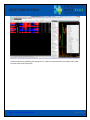
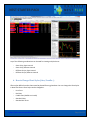
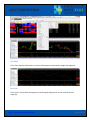
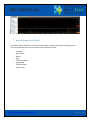
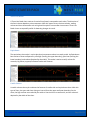
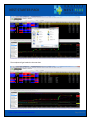
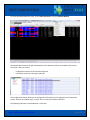
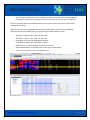
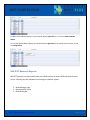
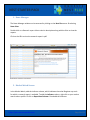
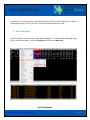
NEST STARTER PACK Omnesys Technologies Nest Starter Pack February, 2012 https://plus.omnesysindia.com Page 1 of 36 NEST STARTER PACK Document Information DOCUMENT CONTROL INFORMATION DOCUMENT VERSION VERSION NOTES Nest Starter Pack User Manual 1.1 This document explains the features and functionality of Nest Starter Pack Proprietary Notice This document contains confidential information of Omnesys Technologies Pvt Ltd, which is provided for the sole purpose of permitting the recipient to evaluate the deployment document submitted herewith. In consideration of receipt of this document, the recipient agrees to maintain such information in confidence and to not reproduce or otherwise disclose this information to any person outside the group directly responsible for evaluation of its contents, except that there is no obligation to maintain the confidentiality of any information which was known to the recipient prior to receipt of such information from Omnesys Technologies Pvt Ltd, or becomes publicly known through no fault of recipient, or is received without obligation of confidentiality from a third party owing no obligation of confidentiality to Omnesys Technologies Pvt Ltd. https://plus.omnesysindia.com Page 2 of 36 NEST STARTER PACK Contents Introduction to Nest Starter Pack ................................................................................................................. 4 Advanced Charts ........................................................................................................................................... 5 1. How to Invoke a Plus Chart (Intraday) .............................................................................................. 5 2. How to Invoke a Plus Chart (Historical) ............................................................................................ 7 3. How to Change Intervals (Intraday) .................................................................................................. 9 4. How to Change Intervals (Historical) .............................................................................................. 10 5. How to view multiple charts ........................................................................................................... 11 6. How to Change Chart Styles (Line/ Candle…) ................................................................................. 14 Line Chart ............................................................................................................................................ 15 Bar Chart ............................................................................................................................................. 15 Candle Chart........................................................................................................................................ 16 Standard Chart (OHLC Chart) .............................................................................................................. 16 Standard HLC Chart ............................................................................................................................. 16 7. How to change Price Styles? ........................................................................................................... 17 Standard .............................................................................................................................................. 18 Point Figure ......................................................................................................................................... 18 Renko .................................................................................................................................................. 19 Kagi ...................................................................................................................................................... 19 Three Line Break ................................................................................................................................. 20 Equivolume ......................................................................................................................................... 20 Candle Volume .................................................................................................................................... 20 Heiken-Ashi ......................................................................................................................................... 21 8. How to Change Chart Preference Settings ..................................................................................... 21 9. How to Add an Indicator ................................................................................................................. 23 Nest Plus charts contain over 40 built-in technical indicators. The left-hand side of the chart panel consists of the Indicator list. To add any indicator to the chart, select an indicator from the list double-click on it enter the configuration click on Apply. ............................................................. 23 https://plus.omnesysindia.com Page 3 of 36 NEST STARTER PACK 10. How to Save and Upload Templates ........................................................................................... 25 11. How to draw Study Lines and Symbols ....................................................................................... 27 12. Other options in Plus Charts ....................................................................................................... 28 Market Monitor .......................................................................................................................................... 28 Market Movers ........................................................................................................................................... 32 NSE-IPFT Research Reports ......................................................................................................................... 33 1. News Manager ................................................................................................................................ 34 2. Market Watch Screen ..................................................................................................................... 34 3. News Dialog Bar .............................................................................................................................. 36 Introduction to Nest Starter Pack Nest Starter Pack is a FREE service of Nest Plus which includes some basic, but important tools for trading efficiently. Nest Starter Pack includes: Advanced Charts Market Monitor Market Movers NSE-IPFT Research Report Nest Starter Pack benefits you by providing “Advanced Charts” across exchanges, with configurable intervals and over 40 built-in indicators, an alert tool called “Market Monitor”, a tool that scans stocks based on certain pre-defined conditional queries, called “Market Movers”, and “NSE-IPFT Research Reports” presented by NSE and CRISIL. The most important advantage of Nest Starter Pack is that all these tools are made available to all users registered on Nest Plus for FREE! https://plus.omnesysindia.com Page 4 of 36 NEST STARTER PACK We’ll now discuss each tool elaborately. Advanced Charts The key features of Advanced Charts in Nest Plus are: 1. 2. 3. 4. 5. 6. Intraday Charts with back data of upto 7 days and configurable intervals in minutes. Historical Charts with daily data since the time of inception. Multiple charts view. Over 50 built-in technical indicators. Default Template settings. Numerous Price Styles used for charting. 1. How to Invoke a Plus Chart (Intraday) To invoke a Plus Intraday Chart, select a Scrip from a Market Watch group right-click on it select Plugin Commands click on Plus Chart. https://plus.omnesysindia.com Page 5 of 36 NEST STARTER PACK By default, an intraday candle-stick chart with 1-minute interval will get invoked. The chart panel is split into 2 sections: The Chart view on the right-hand side, and The Indicators List on the left-hand side. https://plus.omnesysindia.com Page 6 of 36 NEST STARTER PACK 2. How to Invoke a Plus Chart (Historical) To invoke a Plus Historical Chart, select a Scrip from a Market Watch group right-click on it select Plugin Commands click on Plus Historical Chart. https://plus.omnesysindia.com Page 7 of 36 NEST STARTER PACK By default, a historical candle-stick chart with daily data for 3 months interval will get invoked. The chart panel is split into 2 sections: The Chart view on the right-hand side, and The Indicators List on the left-hand side. https://plus.omnesysindia.com Page 8 of 36 NEST STARTER PACK 3. How to Change Intervals (Intraday) To change the interval for an intraday chart, right-click on it select Interval select the desired interval. https://plus.omnesysindia.com Page 9 of 36 NEST STARTER PACK The following intervals are available in Nest Plus charts: 1 Min (Default on invoke) 5 Min (Predefined) 30 Min (Predefined) 1 Hour (Predefined) Configured (User-defined) To configure the interval, select Configure(d) from the intervals option enter the required interval (in minutes) click on Set Interval. 4. How to Change Intervals (Historical) To change the interval for an historical chart, right-click on it select Historical select the desired interval. https://plus.omnesysindia.com Page 10 of 36 NEST STARTER PACK The following Historical data ranges are available in Nest Plus charts: 3 Month (Default on invoke) 6 Month (Predefined) 1 Year (Predefined) Configured (User-defined) To configure the historical data range, select Configure(d) from the historical option enter the required range (from date and to date) click on Apply. 5. How to view multiple charts With Nest Plus, you can invoke upto 5 charts at a time by using the “Lock Scrip” feature. https://plus.omnesysindia.com Page 11 of 36 NEST STARTER PACK Invoke a Plus chart by following the steps given in 1 (How to Invoke a Plus Chart (Intraday)) and 2 (How to Invoke a Plus Chart (Historical). Right-click on the chart click on Lock Scrip. https://plus.omnesysindia.com Page 12 of 36 NEST STARTER PACK Invoke a new chart by following the steps given in 1 (How to Invoke a Plus Chart (Intraday)) and 2 (How to Invoke a Plus Chart (Historical). https://plus.omnesysindia.com Page 13 of 36 NEST STARTER PACK Any of the following combinations can be used for viewing multiple charts: Same Scrip; Same Interval Same Scrip; Different Interval Different Scrips; Same Interval Different Scrips; Different Interval 6. How to Change Chart Styles (Line/ Candle…) Chart styles define how the chart must be plotted for any given data. You can change the Chart Styles in Nest Plus Charts. Chart Styles can be changed to: Line Chart Bar Chart Candle Chart (default on invoke) Standard Chart Standard HLC Chart https://plus.omnesysindia.com Page 14 of 36 NEST STARTER PACK Line Chart A line chart displays information as a series of data points connected by straight line segments. Bar Chart A bar chart is a chart with rectangular bars with lengths proportional to the values that they represent. https://plus.omnesysindia.com Page 15 of 36 NEST STARTER PACK Candle Chart A candlestick chart is a combination of a line-chart and a bar-chart, in that each bar represents the range of price movement over a given time interval. Standard Chart (OHLC Chart) A standard chart is an OHLC chart that represents price movement for a financial instrument over a given time interval, such that it uses vertical lines for High and Low and horizontal intercepts for Open and Close prices. Standard HLC Chart This chart style is similar to the Standard chart style, except that with this type of chart, Open price is disregarded and only High, Low and Close are illustrated. https://plus.omnesysindia.com Page 16 of 36 NEST STARTER PACK 7. How to change Price Styles? Price Styles define what data is used and how this data is used to plot charts. Following are the price styles that the user can use to view charts in Nest Plus Charts: Standard Point Figure Renko Kagi Three Line Break Equivolume Candle Volume Heiken-Ashi https://plus.omnesysindia.com Page 17 of 36 NEST STARTER PACK Standard A standard price style simply uses market data for price and volume, in relation to the time interval selected to plot a chart. Point Figure Point and figure chart style is used in technical analysis, to attempt to predict financial market prices. This type of chart does not plot price against time, instead it plots price against changes in direction by plotting a column of Xs as the price rises and a column of Os as the price falls. https://plus.omnesysindia.com Page 18 of 36 NEST STARTER PACK Renko Renko is a type of chart that is only concerned with price movement; time and volume are not included. A renko chart is constructed by placing a brick in the next column once the price surpasses the top or bottom of the previous brick by a predefined amount. This type of chart is supposed to be effective for traders to identify key support/resistance levels. Kagi The Kagi chart style is used for tracking price movements and to make decisions on purchasing stock. It uses a series of vertical lines to illustrate general levels of supply and demand for certain assets. This type of chart is independent of time and only changes direction once a predefined reversal amount is reached. https://plus.omnesysindia.com Page 19 of 36 NEST STARTER PACK Three Line Break A Three Line Break chart consists of vertical lines (boxes) connected to each other. The direction of the lines is drawn based on price movements. With this type of chart, the time relation, trading volume and chart information such as high and low prices are not taken into account. Three Line Break charts are especially useful for detecting changes in trends. Equivolume The equivolume chart style is a price plot that incorporates volume into each period. An Equivolume box consists of three components: price high (forming the upper boundary), price low (forming the lower boundary) and volume (depicted by the width). This makes it easier to verify volume for reversals, big moves, support/resistance breaks and climaxes. Candle Volume A candle volume chart style combines the features of candle stick and equivolume charts. With this type of chart, the open and close during an interval form the upper and lower boundary for the chart, the high and low are marked by the wicks or lines similar to a candle stick, and the volume is depicted by the width of the chart. https://plus.omnesysindia.com Page 20 of 36 NEST STARTER PACK Heiken-Ashi The Heikin-Ashi chart is constructed like a regular candlestick chart, except that it plots the Close as the average price of the current bar and the Open as the mid-point of the previous bar. It is one of many techniques used in conjunction with candlestick charts to improve the isolation of trends and to predict future prices. 8. How to Change Chart Preference Settings You can change the chart appearance through customization and preference settings in Nest Plus charts. Right-click on the chart click on Preference Settings. https://plus.omnesysindia.com Page 21 of 36 NEST STARTER PACK The following settings can be changed in Nest Plus charts: Fore Colour BackGround Colour Grid Colour Gradient Top Colour Uptick Colour Gradient Bottom Colour Downtick Colour Series Colour Trendline Colour Tooltip Panel Colour Candle Outline Uptick Separator Colour Candle Outline Downtick Show ToolTip Horizontal Separators Title Borders Show X Grid Show Y Grid Right Alignment Left Alignment Semi Log Scale Linear Scale https://plus.omnesysindia.com Page 22 of 36 NEST STARTER PACK 9. How to Add an Indicator Nest Plus charts contain over 40 built-in technical indicators. The left-hand side of the chart panel consists of the Indicator list. To add any indicator to the chart, select an indicator from the list double-click on it enter the configuration click on Apply. The indicator will get plotted on the chart. The list of indicators in Nest Plus charts include: https://plus.omnesysindia.com Page 23 of 36 NEST STARTER PACK Accumulative Swing Index Aroon Aroon Oscillator Bollinger Bands Chaikin Money Flow Chaikin Volatility Chande Momentum Oscillator Commodity Channel Index Comparitive RSI Detrended Price Oscillator Directional Movement System Ease of Movement Exponential Moving Average Fractal Chaos Bands Fractal Chaos Oscillator High Minus Low High/ Low Bands Historical Volatility Linear Regression Forecast Linear Regression Intercept Linear Regression R-Squared Linear Regression Slope MACD MACD Histogram Mass Index Median Price Momentum Oscillator Money Flow Index Moving Average Envelope Negative Volume Index On Balance Volume Parabolic SAR https://plus.omnesysindia.com Performance Index Positive Volume Index Price Oscillator Price ROC Price Volume Trend Prime Number Bands Prime Number Oscillator Rainbow Oscillator Relative Strength Index Simple Moving Average Standard Deviation Stochastic Momentum Index Stochastic Oscillator Swing Index Time Series Moving Average Trade Volume Index Triangular Moving Average TRIX True Range Typical Price Ultimate Oscillator Variable Moving Average Vertical Horizontal Filter VIDYA Moving Average Volume Oscillator Volume ROC Weighted Close Weighted Moving Average Welles Wilder Smoothing Williams %R Williams Accumulation Distribution Page 24 of 36 NEST STARTER PACK 10. How to Save and Upload Templates Nest Plus charts allow you to save templates and upload them on other charts. Templates are useful because they allow you to produce the same set of indicators with the same configuration, without having to add each indicator individually. To save a template, right-click on the chart click on Save Template provide a template name save on your machine. This template can then be uploaded on a different chart. To upload a saved template, right-click on the chart click on Upload Template select the template and click on Open. https://plus.omnesysindia.com Page 25 of 36 NEST STARTER PACK The template will get loaded on the new chart. https://plus.omnesysindia.com Page 26 of 36 NEST STARTER PACK You can also set a template as default. To do this, after uploading a template, right-click on the chart click on Set as Default Template. The default template will get loaded every time any chart is invoked. 11. How to draw Study Lines and Symbols Study Lines are useful for chart analysis. You can easily add multiple study lines on Nest Plus Charts. To add a study line, right-click on the chart click on Study Lines click on the selected study line to be drawn drag and drop the mouse pointer to draw the study line. The following study lines can be drawn on Nest Plus charts: Ellipse Rectangle Trend Line Speed Lines Gann Fan Fibonacci Arcs Fibonacci Fans https://plus.omnesysindia.com Fibonacci Retracements Fibonacci Time Zones Tirone Levels Quadrant Lines Raff Regression Error Channel Horizontal Line Page 27 of 36 NEST STARTER PACK 12. Other options in Plus Charts To zoom in/ zoom out from the chart, right-click on the chart select Zoom select the relevant option to navigate through the chart. The data table converts the chart data into a tabular form. To access the data table, right-click on the chart click on Data Table. You can view crossover points between vectors and indicators in Crossover Details, which can be accessed by right-clicking on the chart selecting Crossover Details. Market Monitor Market Monitor is an alert tool that streams in real-time updates on all stocks that breach certain market indicators, which include: 52-week High 52-week Low Day’s High https://plus.omnesysindia.com Day’s Low Approaching Upper Circuit Limit Approaching Lower Circuit Limit Page 28 of 36 NEST STARTER PACK To access the Market Monitor panel, click on Nest Plus menu click on Market Monitor. The Market Monitor panel will get invoked which can be docked anywhere in the Nest Trader screen. This panel is split into 2 parts: Configuration section (on the left-hand side) and Information section (on the right-hand side) The configuration section allows you to configure the information that is displayed in the information section. Click on the collapse sign (-) next to “ALL” to view the individual indicators. The following indicators are available with a check-box: https://plus.omnesysindia.com Page 29 of 36 NEST STARTER PACK 52 Week High 52 Week Low Day’s High Day’s Low Upper Circuit Lower Circuit To stream in the updates of only few triggers, untick the checkbox for “ALL” tick the checkboxes for which data should be streamed in. To filter for only one trigger condition, right-click on a trigger condition click on “Onclick Filter”. Click on the Trigger Condition to filter the information with data of only that Trigger. To view for all triggers, click on “ALL”. To change the colour of the text for any trigger condition, right-click on that trigger condition click on Change Colour; or double-click on the trigger condition. Select the preferred colour, and click on OK. The colour of the text for the selected trigger condition will change to the selected colour. The information section displays real-time updates of the Trigger Conditions selected. The following details are displayed for each update: Time: The time at which the alert was triggered from the exchange. Exchange: The exchange in which the stock met its trigger condition. Trading Symbol: The symbol for which the alert was triggered. Market Indicator: The trigger condition which was breached. https://plus.omnesysindia.com Page 30 of 36 NEST STARTER PACK Text: The details of the alert, which includes the stock’s price at which the alert got triggered, the change in stock price from previous close in % and the previous close price of that stock. The most important feature of the Marker Monitor tool is that it allows you to act on these stocks immediately and easily. Right-click on any stock in the Market Monitor panel to place orders in that stock. The following important options are available when you right-click on the Market Monitor panel: Buy Order: To place a “Buy” order for that stock. Sell Order: To place a “Sell” order for that stock. Order Book: To invoke the “Order Book” window. Trade Book: To invoke the “Trade Book” window. Market Picture: To view the Market Picture for that stock. Add to Market Watch: To add that stock to your active market watch. Scroll Lock: To lock the scroll on the selected scrip. https://plus.omnesysindia.com Page 31 of 36 NEST STARTER PACK Market Movers Market Movers is a powerful scanner tool that lists out the most active securities in terms of: Volume Leaders Value Leaders % Gainers % Losers To invoke the Market Movers panel, click on the Nest Plus menu select Market Movers. The Market Movers panel displays the following details: Rank Symbol Exchange (Value) Using Market Movers, you can rank “n” number of stocks for which data is available. To do this, enter the number of scrips in the edit box for “Scrips” and click on the tab (Volume/ Value/ % Gainers/ % Losers) to view those stocks. https://plus.omnesysindia.com Page 32 of 36 NEST STARTER PACK To add a stock in Market Movers to your Market Watch, right-click on it click on Add to Market Watch. To view the Market Movers display is maximized mode, right-click on the market movers panel click on Configuration. NSE-IPFT Research Reports NSE-IPFT Research can be viewed inside your NOW terminal in several different ways for ease of use. Following are the methods of accessing the research reports. 1. News Manager Logs 2. Market Watch Screen 3. News Dialog Bar https://plus.omnesysindia.com Page 33 of 36 NEST STARTER PACK 1. News Manager The News Manager window can be accessed by clicking on the Nest Plus menu selecting News View. Double click on a Research report title to view its description along with the links to view the reports. Click on the URL to view the research report in pdf. 2. Market Watch Screen In the Market Watch, add the Indicator column, which indicates the value R against any stock for which a research report is available. To add the Indicator column, right-click on your market watch column profile click on Reposition Columns and add the Indicator. https://plus.omnesysindia.com Page 34 of 36 NEST STARTER PACK To view the research report, right-click on a stock in market watch select Tools and select News. https://plus.omnesysindia.com Page 35 of 36 NEST STARTER PACK Double-click on a research title to view the description of the research along with the links for the complete report. Click on the URL to view the complete research in pdf. 3. News Dialog Bar Research Reports can also be seen in the News Dialog Bar. To add the News Dialog Bar, rightclick in your market watch click on Dialog Bars and select News Bar. End of Document https://plus.omnesysindia.com Page 36 of 36