1
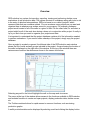
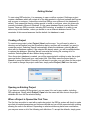
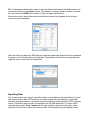
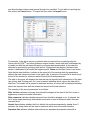
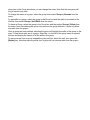
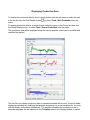
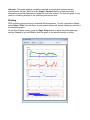
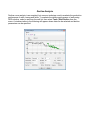
RESys
Reservoir Evaluation System
REProduction
Well Production Data Analysis
Users Manual
Copyright 2006-2010, The Comport Computing Company
All Rights Reserved
Introduction
RESys is an integrated software system for performing oil and gas reservoir evaluations.
Based on an integrated database and using object oriented software design techniques,
RESys is a modular and extensible software system consisting of various specialized
modules for the analysis and evaluation of well logs, core data, production data and more.
The modular integrated design allows the system to be extensible, so that additional modules
can be added without requiring a rewrite or redesign of the rest of the system. In addition, due
to the modularity and integrated database, individual modules can be optimized.
RESys is designed as a standalone, yet integrated system. Each module can be used by
itself; however the full power of integrated software is unleashed when the various modules
are combined.
REProduction comprises the module for viewing and analyzing production data. As a
standalone program, it allows the visualization of production data and decline curve analysis,
but REProduction is fully integrated into RESys.
At Comport Computing we value the comments and suggestions of our software users. If you
find a bug, please let us know. We'll fix it as fast as possible and send you a free updated
copy of the software. In addition, if you suggest an enhancement which we implement, you'll
receive a free upgrade to the new version.
Corrections or comments on REProduction or on this manual should be sent by email to
“[email protected]”.
Overview
REProduction is a system for importing, exporting, viewing and performing decline curve
evaluations of well production data. The system consists of a database along with tools to aid
in the entry of data and interpretations. RESys is based on so-called “projects” which
represent data that are somehow related. You can create as many projects as you want and
organize them in whatever way makes sense for your purpose. For example, perhaps a
project would consist of all of the wells in a given oil field. On the other hand, for a student, a
project might be all of the work done during a class or in conjunction with a project. It really is
up to you as to how you want to organize your projects and data.
It is important to understand that the project database contains all of the information needed
to perform evaluations. If you need to make a backup of the project, simply copy the project
database.
Once a project is created or opened, the leftmost side of the REProduction main window
shows the list of wells and well groups included in the project. A map showing the location of
the wells is displayed on the right side of the window. At the top of the window there are
various menus and tool bar buttons as shown in the screen shot below.
Selecting any well in the list will highlight the well on the map and vice-versa.
The menu at the top of the window allows access to the functions available in REProduction
and includes functions to create and open projects, display production data, decline curves,
etc.
The Toolbar contains buttons for rapid access to common functions, such as viewing
production graphs.
A well's production data can be displayed by selecting a well and clicking the display button
. (Note that the single dot indicates a single well.) The production display is controlled by
templates which can be configured as desired. Although a simple default template is built in,
in many cases it may be preferable to redefine the templates to display the desired
information. The ability to edit, save and load templates is provided interactively from the
display window.
Note that there is no limit to number of templates that can be defined, nor is there a software
limit to the amount of data, the size of the display or the number of graphs that may be
displayed. Instead, the limitations will mainly be determined by the screen size.
The Project menu contains functions to create, open and close projects, and edit project
information.
The Groups menu allows groups of wells to be defined.
The Map menu allows adjustment of the map display.
The Tools menu permits the display of the various graphs and decline curves, importing and
editing data, and the option to automatically load the last project when REProduction is
started.
The Language menu allows the use of either English or Spanish text on all of the windows in
RELogAnalysis. To change the language, simply select the desired language from the menu.
The Help menu allows information concerning the version of RELogAnalysis to be displayed.
To see the version information, select Help | About.
Getting Started
To start using REProduction, it is necessary to open or define a project. Defining a project
creates a database which will contain all of the data needed to view and evaluate well logs as
well as cores or outcrops. It should be noted that RESys uses a Microsoft Jet database by
default. That means that there's nothing special to install or configure, since Jet drivers are
normally included in Microsoft Windows. It’s the same database format used by Microsoft
Access. Once any RESys module, including REProduction, is installed, it is ready to use
without any further hassles, unless you decide to use a different database format. The
remainder of this manual assumes that the default Jet database is used.
Creating a Project
To create a new project, select Project | New from the menu. You will need to select a
directory and a filename from the file selection dialog, and then will be asked if you want to
create the project. Selecting Yes will automatically create the database, selecting No will
abort with no database created. If the selected file already exists, you will be asked whether
to replace the database. Selecting Yes will overwrite the existing file, erasing all of its
contents. Selecting No will abort without doing anything.
Once the project database is created, you will be presented with a dialog to enter the project
name as shown. Simply add your own project title. Click Ok to save the project data or
Cancel to accept the default. Normally you will want to provide your own name for the project.
If you need to change the project name later, simply select Project | Edit from the menu.
Opening an Existing Project
If you have an existing RESys project, you can open it for use by any module, including
RELogAnalysis. Simply select Project | Open from the menu and then choose the project
database file from the file selection dialog.
When a Project is Opened the First Time
The first time a module is used with a particular project, the RESys system will check to make
sure that all needed parameters and units are defined and you will be presented with a dialog
allowing the units to be defined. Depending on what modules may have been used before,
you may see some or all of the following unit definitions. To accept the defaults, simply press
Ok. To change the default units, select or type the desired unit name in the Unit column and
a conversion factor in the Factor column. For example, to specify depth in meters, use m as
the unit name and 3.28084 (the number of feet in a meter) as the factor.
Note that once set, these values and units definitions cannot be changed, since doing so
would corrupt the database.
After the units have been set, REProduction uses two parameters that will need to be defined.
As shown in the following dialog, the Standard Temperature and Pressure are required and
might be used in some volume calculations.
Importing Data
Of course a project isn't of much use without data, so normally the next step will be to import
well and production data. REProduction can easily import well, well trajectory, completion
intervals, geological markers, well pressures and production data provided in ASCII columnar
format. (Production data can also be imported from IHS 298 report files.) To import ASCII
columnar data, select Tools | Import and the type of data to import from the menu, then
select the text file that contains the columnar data. The following dialog will display the file
and allow the data columns and general format to be specified. To quit without importing any
files, select the Cancel button. To import the files, select the Import button.
For example, in the above screen, production data is imported from a typical production
format used by OFMTM and other production export formats, where each well is delineated by
a header line with the well name followed by columnar data as described. In this case the
data can be imported by specifying that the first 3 lines should be skipped, that each data
section is delineated by a header line beginning with *Name and the date format is as shown.
Note that the data definition is shown in the upper left of the window while the parameters
defining the data format are shown in the upper right. A preview of the data file is shown at eh
bottom of the window for reference while choosing the format parameters.
The table in the upper left displays the data that can be imported with a description of the data
type (string, date, floating point, etc.) and a number indicating which column the data will be
read from. If a header line is present to delineate sections, a column will be displayed allowing
data to be imported from both the header line as well as the data sections.
The meaning of the import parameters is as follows:
Skip 1st lines indicates how many lines should be skipped at the start of the file in order to
bypass any extraneous header information.
Skip comments indicates whether comment lines should be skipped or not. If selected, the
list of space separates strings that indicate comments is used to determine which lines are
comment lines.
Header line indicates whether the file is divided into sections separated by header lines. If
selected, the string shown will be used to determine which lines are section headers.
Separator line indicates whether data sections are separated by separator lines with a
special format. If selected the text will be used to determine which lines separate data
sections.
Null Values indicates whether the file contains data where the value is not specified. If
selected, the list of space separated strings will be used to determine whether data values
represent Null values.
Logical True contains a list of strings that will be interpreted as true for Boolean (true/false)
data. Boolean variables with values not in the list will be considered false.
Date Format contains a format string that will be used to import dates. in general the string
should contain the characters d to indicate day, M to indicate month and y to indicate year
with any appropriate separators, such as /. Note that d or M represents a number without
leading zeros while dd or MM indicates that the number will always have 2 digits with a
leading zero if required. In general, yy should be used for 2 digit years and yyyy (prefered)
for 4 digit years.
Except for basic well data, new wells will not be created while importing data, so any data
associated with well names not defined in the project will be skipped. After Importing data, a
summary of the data imported and skipped will be shown and the data can be saved to a log
file for reference if desired.
Compact Production Data
Many production data systems store or export zeros for times when wells are off production.
For old wells, it is possible that production data is given every month for many years and may
even comprise the majority of the production data. Clearly there is no logical reason to save
these values, since there is in effect no value to save.
To remove the extraneous, nonexistent production data from the database, REProduction
automatically performs a compaction procedure after data has been imported. Note that no
real data is deleted, only production data entries that are all zero are removed to save space
in the project database.
In case that manual editing of production data has been done, the data can be manually
compacted by selecting Tools | Compact Production from the menu. Any consecutive zero
production records will be removed from the database, but the first zero record following nonzero data will be retained. The data compacting process can take quite some time for large
projects.
Defining Groups
For various purposes, it is often useful to define groups of wells for visualization and
evaluation. Groups can represent anything whatsoever. For example a group can be defined
for all well in the North of a field, or all wells drilled in a certain year, or all wells in a specific
reservoir. Individual wells can be included in several groups, if desired, for example a well in
the North that was drilled in a certain year might appear in 2 separate groups. REProduction
does not place a limitation of how the groups are defined.
To create a Group, select Groups | New from the menu. A new group will be added to the
group tree in the Group box where you can change the name. Note that the new group will
not yet contain any wells.
To change the name of a group, select the group, then select Groups | Rename from the
menu.
To add wells to a group, select the group in the Group box and the wells to be added in the
Well list, then select Groups | Add Wells from the menu.
To delete a Group, select the group in the Group box and then select Groups | Delete from
the menu. Note that deleting the group only removes the group definition, it does not delete
any wells from the project.
Once a group has been defined, selecting the group will highlight the wells in the group on the
map. To see which wells are in a group, select the + to the left of the group name to expand
the tree and display the names of all the wells in the group.
To remove a well from a group, expand the group well list, select the well, then press the
[Delete] key. Note that removing wells from a group will not remove wells from the project.
Displaying Production Data
To display the production data for a well, simply double click the well name or select the well
in the list and click the Well Display button
menu.
or select Tools | Well Production from the
To display production data for a group of wells, select the group in the Group list, then click
the Group Display button or select Tools | Group Production from the menu.
The production data will be displayed using the current template, which can be modified and
redefined as desired.
The first time you display production data, a standard template will be used , but much better
displays are possible by modifying the template and saving it in a new template file. You may
edit the display configuration interactively. The modified template can be saved to a file or
alternate templates can be loaded from the Template menu in the Display window. A typical
customized display is shown above.
On the display, the number and order of graphs can be defined, along with the scale, colors
and display options for each. As detailed later in this manual, REProduction supports 2 types
of graphs for display purposes. On each graph, the horizontal and vertical scales can be
modified by pressing the right mouse button and selecting from the popup menu.
Display Templates
The production displays in REProduction are controlled by templates, which the user
configures interactively. Please note that the user never really needs to see the templates,
since the results are always visible on the display. On the Display screen, each Graph is
separated from the graphs above and below by an invisible separator that can be moved with
the mouse. When the mouse cursor is over a Graph separator, the cursor will change to 2
parallel lines with arrows. To change the height of a Graph, simply the separator up or down
as desired while pressing the left mouse button.
Each display template consists of a number of “Graphs” or vertical segments. A display
template can contain any number of Graphs. To modify the display configuration a track can
be selected with the mouse by pressing the left mouse button. When selected, a border will
appear around the selected graph.
To add additional Graphs to the display, select Graph | New | Insert to insert a graph before
the currently selected graph or Graph | New | At End to add a graph at the bottom of the
display. To delete the currently selected graph, select Graph | Delete.
When you first run REProduction or any other time a user defined template is not available or
not specified, REProduction automatically uses a default template. The means to load and
save display templates are found in the Template menu on the Display screen. To load a
previously saved template, select Template | Open from the menu and select the desired
graph template file (*.gtf) from the file dialog. To update the template currently in use, select
Template | Save from the menu. If you are using the standard template, you will be required
to enter a filename. To save the current configuration to a new template file, select Template
| Save As and enter a filename on the file dialog. You can create as many templates as
needed or desired.
To revert to the default template, select Template | Default from the menu.
Display Graph Types
REProduction has 2 different types of graphs that can be displayed in any order. Once a
graph has been added, you can change the type of graph and the options by selecting the
graph and choosing the desired graph type from the Graph | Type menu. Each graph type
has additional configuration options accessible from the menu.
Production. A Production graph displays curves or point data, including production rates and
pressures.
To add a curve to a Production graph, select Graph | Curves | New. To change the
appearance of an existing curve, select Graph | Curves | Edit <curve>, where <curve> is an
existing curve name. On the resulting dialog, you can change the curve to be displayed, set
the color for the curve, determine whether to show the curve or the points or both and also
define the curve scale to be used.
Intervals. This graph displays completion intervals and geological markers that are
interpreted for the well. Select from the Graph | Curves submenu to determine what
information should be displayed and adjust the colors as desired. The intervals graph is very
useful in visualizing changes to the producing interval with time.
Printing
REProduction supports printing to standard Windows printers. To print a production display,
select Graph | Print from the menu. A print preview screen will appear, showing a preview of
the displayed graphs.
On the Print Preview screen, press the Page Setup button to adjust the printer and page
settings, Cancel to quit and Print to send the graph to the selected printer or plotter.
Decline Analysis
Decline curve analysis is an empirical, but common technique used to evaluate the production
performance of wells, leases and fields. To evaluate the decline performance of wells using
REProduction, select a well from the well list, then select Tools | Well Decline from the
menu. A window similar to the following will appear where data can be selected and decline
parameters can be specified.
Technical Description
This section of the manual documents and explains the technical details of the calculations in
REProduction.
Decline Parameters
REProduction implements various decline analysis methods.