1
Statistics
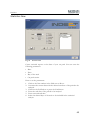
Parking duration diagram
The parking duration diagram gives you an overview of how many cars have
parked how many hours in your car park.
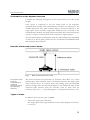
Entries and Exits
of the selected day (date and time relevant) or average of the selected time
period (only date relevant)
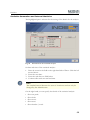
You can read your clients’ parking behaviour from this diagram. You have
two possibilities to perform a query:
• Analysis of a day: set date and time (e.g. 08:00 - 16:00)
• Analysis of several days: set date. Time is irrelevant, since the data are
automatically taken from 00:00 to 24:00
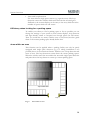
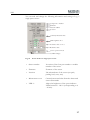
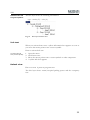
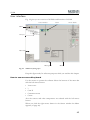
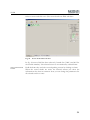
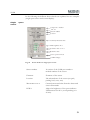
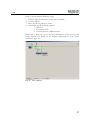
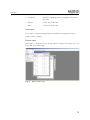
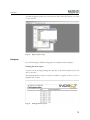
Fig. 46:
Example diagram: Entries and exits
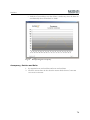
Occupancy in percent
of the selected day (date and time relevant) or average of the selected time
period (only date relevant)
This diagram shows the occupancy of your car park. You have two
possibilities to perform a query:
• Analysis of a day: set date and time (e.g. 08:00 - 16:00)
73