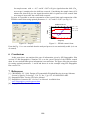
1
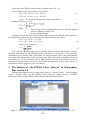
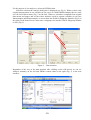
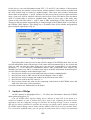
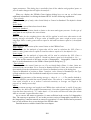
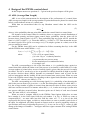
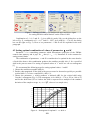
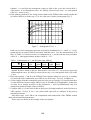
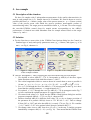
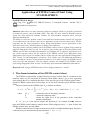
XXXII. Seminar ASR '2007 “Instruments and Control”, Farana, Smutný, Kočí & Babiuch (eds)
© 2007, VŠB-TUO, Ostrava, ISBN 978-80-248-1272-4
Application of EWMA Control Chart Using
STATGRAPHICS
NOSKIEVIČOVÁ, Darja
Doc., Ing., CSc.,
KŘJ-639, VŠB-TU Ostrava, 17. listopadu, Ostrava - Poruba, 708 33
[email protected]
Abstract: today there are many statistical software packages wholly or partially specialized
in statistical process control methods (SPC). They offer not only classical Shewhart control
charts but also advanced methods suitable for non-standard situations when classical
Shewhart methods fail.
The ability to select the suitable control chart and insert measurements into the PC program
is not sufficient for the effective and correct application of the selected control chart. The PC
programs ask for some parameters theirs setting determinates correct application of the
selected control chart. And information in Helps is not sufficient.
This paper deals with this problem when the EWMA control chart is applied using statistical
software Statgraphics Plus version 5.0. In the first part of this paper a brief description of the
EWMA control chart including determination of conditions for its effective application is set
out. In the next part there are the analysis of the EWMA control chart application using
Statgraphics Plus version 5.0 and the analysis of the helps for this application in Statgraphics
Plus version 5.0 and Statgraphics Centurion. Next chapter sets out additional information
that is needed for the user of the mentioned software to be able to apply the EWMA control
chart correctly and efficiently. The last chapter contains an example of the EWMA control
chart using Statgraphics Plus version 5.0 with help of the mentioned additional information.
Keywords: ARL, design of EWMA control chart, design parameters λ and K
1 The characterization of the EWMA control chart
The EWMA (exponentially weighted moving average) control chart is a solution for the
situation when we are interested in detecting small shifts (about 1,5σ or less) supposing
uncorrelated data. For correlated data there exists special type of the EWMA control chart –
dynamic EWMA control chart. In this paper we do not deal with this special EWMA control
chart.
The test criterion in the EWMA chart Yk is defined as follows:
k
y k = ( 1 − λ ) k .Y0 + λ . ∑ ( 1 − λ ) k − j . f ( x j ) for j = 1,2,...,k and for 0 < λ < 1,
j =1
where
If
f(x j)
k
Y0
Y0 = μ0 ( μ0
(1)
- means the value of the sample measure,
- means the subgroup order,
- means the target level of the parameter of the controlled
quantity distribution.
is the process target) and function f(xj) is a sample mean x j , then we
have the EWMA control chart for sample means. When subgroup size n = 1, then we have the
EWMA control chart for individuals.
EWMA control charts are charts with memory which is unlimited and unequal. Properties
of this memory are determinated by the parameter λ (0 < λ < 1).
177
Center line in the EWMA control chart for sample means CL = μ0 .
Control limits for this control chart are as follows:
UCL = CL + K .σ EWMA = μ0 + K .σ EWMA
,
LCL = CL − K .σ EWMA = μ0 − K .σ EWMA
,
where K - means the constant for setting control limits.
Standard deviation σEWMA is:
σ EWMA =
σ0
n
λ
[
2−λ
.
. 1 − ( 1 − λ )2 k
]
(2)
(3)
σ0
where
- means a target level of standard deviation of controlled quantity,
n
- means a subgroup (sample) size,
k
- means a subgroup order.
As opposed to the Shewhart control charts control limits in the EWMA chart depend on
the sample time moment k but quite quickly they approach steady state values
UCLa = CL + K .σ a = μ0 + K .σ a ,
(4)
LCL = CL − K .σ = μ − K .σ ,
a
a
0
a
where σa we compute as
σa =
σ0
λ
.
(5)
n 2−λ
To be effective against a small process shift the EWMA control chart must be correctly
designed. That means we must design suitable combination of parameters λ a K so that this
combination gives suitable ARL performance for detecting small shift of the predetermined
size. What does it mean? Does every user know what ARL performance is and how the values
of parameters λ a K are connected with it? When he does not know it and when he relies on
the helps in software that he uses can he find sufficient information in these helps? We try to
find answer to these questions in the next chapter.
.
2 The analysis of „the EWMA Chart Analysis“ in Statgraphics
Plus version 5.0
From the main Menu bar [4] we must choose Special – Quality Control – Time Weighted
Charts – EWMA Chart (for the EWMA control chart for sample means) or EWMA
Individuals Chart (for the EWMA control chart for individual observations).
Figure 1 – Selection of the control chart from the main menu of Statgraphics Plus v. 5.0
178
For the purpose of our analyse we select the EWMA chart.
After this selection the Analysis dialog box is displayed (see Fig. 2). When we have only
original measurements in one variable (in our case it is called EWMAexample) then we enter
it to the field Observations (Fig. 2 on the left). When we elsewhere computed from original
data means and ranges and we have these statistics saved in separate variables (in our case
Meanexample and Rangeexample) we move them into fields for Subgroup Statistics (Fig.2 on
the right). In the both cases we must enter a subgroup size into the field for Subgroup Number
or Size (Fig. 2).
5
5
Figure 2 - Data insertion
Regardless of the way of the data insertion after clicking on the OK (down) we can see
Analysis summary on the left and EWMA control chart on the right (Fig. 3) in the next
windows.
Figure 3 - Analysis summary
179
On the left we can read information about UCL, CL and LCL, the number of observations
beyond the limits, the number of observations, and the number of observations excluded from
the study (initial study or control to standard study). This report also provides information
about values of parameters λ and K, estimates for the process mean, process sigma and mean
range. Some user will be satisfied with this result in spite of the fact that he does not know
what it is initial study or control to standard study, where to select type of the study, why
system works with such values λ and K, what is ARL performance of this chart and so on.
Answers to this questions and possibility to change design of the EWMA chart we can find in
the EWMA Chart Options. This dialog box is available from all the tabular and graphical
panes using the right mouse (Fig. 4).
4
1
3
2
5
Fig. 4 - Chart Options dialog box
This Dialog Box is decisive one for the effective design of the EWMA chart. Here we can
read all information about effectiveness of the chart offered automatically by the system and
when we find out that this chart design does not meet our requirements we can change
parameters λ a K so that their combination ensures ARL performance that satisfies our
demands in a better way. But is a common user able to read this information in the dialog box
or to do effective changes in the chart design? And
1. does he know when to use initial study and when control to standard study?
2. does he know what is ARL and can he set the adequate value of ARL?
3. does he know when to change the number in the field next to the ARL?
4. does he know what is the best value of λ ?
5. does he know what is the value for the computing control limits in the EWMA chart and
what is the best value of this parameter?
Can such common user find answers in the helps?
3 Analysis of Helps
On-line manual in Statgraphics Plus v. 5.0 offers this information about the EWMA
chart options dialog box [2]:
„Use the EWMA Chart Options dialog box to indicate if study will be an initial or a
control to standard, to enter a number that will be used as the weighting factor that will be
applied to each new subgroup average to calculate the moving average, to enter a number
that will be used to calculate to calculate the average run length, and to indicate location of
the EWMA and the Range control limits and the numbers that will be used to calculate them.
For a control to-standard study, you can specify the values that will be used for the mean and
180
sigma parameters. This dialog box is available from all the tabular and graphical panes so
you can make changes that will affect the analysis“.
When we display the EWMA Chart Options dialog box we can try to find some
additional information via clicking the button HELP. It offers following explanation:
„Type of study
Determines the type of study, either Initial Study or Control to Standard. The default is Initial
Study.
Initial Study
Computes the control limits based on the data.
Control to Standard
Computes the control limits based on limits or the mean and sigma you enter. In this type of
study data do not influence the control limits.
Lambda
Enter a value for the weighting factor that will be applied to each new observation in the
moving average calculation. A larger value of lambda gives more weight to more recent
subgroups. Enter a value greater than or equal to .001 and less than or equal to 1, the default
is 0,1.
EWMA control limits
Enter values for the location of the control limits on the EWMA Chart.
Upper Sigma
Enter a value for the multiple of sigma that will be used to calculate the UCL. Enter a
numeric value greater than or equal to 0 and less than or equal to 10, the default is 3,0.
Lower sigma
Enter a value for the multiple of sigma that will be used to calculate the UCL. Enter a
numeric value greater than or equal to -10 and less than or equal to 0, the default is -3,0.“
In the on line manual of the latest version of Statgraphics - Statgraphics Centurion XV
there is such information as to the EWMA Chart Options dialog box [3]:
„Type of study:
Determines how the control limits are set. For an Initial Study (Phase 1) chart, limits are
estimated from current data. For a Control to Standard (Phase 2) chart, the control limits are
determinated from the information in the Control to Standard section of the dialog box.
Control to Standard: to perform a Phase 2 analysis, select Control to Standard for the Type
of Study and then enter the established standard process mean and sigma.
Lambda is:
The smoothing parameter of the moving average λ where 0 < λ < 1. The smaller lambda is,
the more influence past data has on the plotted values. The value of λ and the sigma multiple
k are often selected so as to achieve a desired sensitivity or average run length in the
presence of small process shift.
ARL is:
The approximate average run length for an EWMA chart with selected λ and k. If you enter
new values, the ARL will be updated instantaneously. Note that sigma multiple for the EWMA
chart has been lowered to k = 2,7 rather than k = 3,0 in order to achieve the same false alarm
ARL as a normal 3-sigma Shewhart chart.“
As we can see the answer to question 1 is more sufficient in the version 5 of Statgraphics
Plus. The answers to questions 2-5 are in this previous version of Statgraphics insufficient. In
the Statgraphics Centurion manual are answers to questions 2-5 more detailed and represented
but it is not sufficient for a correct design of the EWMA chart.
Detailed answers could be found in the next chapter.
181
4 Design of the EWMA control chart
In this chapter answers to questions 2 – 5 given in the previous chapter will be given.
4.1 ARL (Average Run Length)
ARL is one of the measurements for description of the performance of a control chart.
ARL (average run length) is the average number of points that must be plotted in control chart
before a point indicates an out-of –control state.
When data are uncorrelated then for any Shewhart control chart the ARL can be
computed as:
(5)
1
ARL =
p
where p is the probability that any point falls outside the control limit in a control chart.
For instance in the control chart for variables where we suppose normal distribution of
the controlled quantity and three-sigma control limits, probability that the point will lie
between these control limits is 0,9973. Thus probability that any point will lie outside the
limit is 1-0,9973=0,0027 (= p). From this ARL(0) = 1/0,0027 ≅ 370. That means that an outof-control signal will be given on average every 370 samples (points in a chart) even if the
process remains in control.
For the EWMA chart ARL can be calculated as follows assuming that L(u) is the ARL
and the EWMA starts with EWMA0 = u (1):
L( y ) f {[ y − ( 1 − λ )u ] / λ}dy
UCL
L( u ) = 1 + ( 1 / λ )∫
LCL
where
(6)
- UCL a LCL are control limits,
- f(x) is the N(μ, σ 2 / n ) density function,
- μ represents the true process mean,
- σ is the nominal process standard deviation,
- n is a sample size.
The ARL corresponding to a risk of the false alarm α (i.e. probability that a point in a
control chart falls outside the limits even if the process is in control) is called ARL(0). It is the
average number of points before an out-of-control signal is given when the process is actually
in control. The risk α needs to be as low as possible so ARL(0) should be as high as possible.
In practice decision about ARL(0) depends on economical factors such as costs for the
process interruption and the looking for the out-of-control state causes costs. When we want
to have the EWMA control chart corresponding to three-sigma limits Shewhart control chart
with α = 0 ,0027 then we use ARL(0) = 370.
The ARL corresponding to a risk of missing signal β (i.e. probability of not detecting the
shift in the process mean of a given size δ on the first subsequent sample) is called ARL( δ ) .
It is the average number of points in control chart that must be taken to detect a true process
shift once one has occurred. For instance when ARL( δ ) = 8 , it takes on average 8 points after
true process shift has occurred before detection (point out of limit) of such out-of-control
state. We want ARL( δ ) to be minimal.
When we want to compute ARL(0) in the EWMA Chart Options dialog box we must
have number 0 in the field signed with the red number 3 in Fig. 4. When we want to
compute ARL( δ ) , we must enter into this field the value of δ . δ is a size of the shift
expressed in the process sigma σ which we want to detect as soon as possible (critical size of
the shift). Its magnitude will likely depend on factors such as a process capability relative to
specifications and costs of adjusting the process [1]. As we can see on Fig. 5, values of ARL
change with changes of lambda λ and upper and lower sigma constant K for setting EWMA
control limits.
182
λ
λ
K
K
Figure 5 - Influence of changes of lambda and upper and lower sigma
for setting EWMA control limits K on the value of ARL
Combination of λ = 0 ,2 and K = 3 gives ARL(0) nearly 560 (see the dialog box on the
left on Fig. 5), combination of λ = 0 ,17 and K = 2,827 gives ARL(0) = 370 (see the dialog
box on the right on Fig. 5). How to set parameters λ and K will be explained in the next
paragraph.
4.2 Setting optimal combination of values of parameters λ and K
Parameter λ is a smoothing parameter which determinates properties of the EWMA
control chart memory and it pays for λ that (0 < λ < 1). Parameter K is the constant for
setting control limits.
The combination of parameters λ and K is considered to be optimal in the sense that for
a fixed false alarm α this combination produces the smallest possible risk β for a specified
shift in the process mean. For setting of optimal values of λ and K we can use nomograms
[1].
We recommend the following steps for setting optimal values λ and K:
1. Choose the smallest acceptable ARL(0).
2. Decide what magnitude of the shift in the process must be detected as quickly as possible
(critical shift δ ) i.e. have a small ARL ( ARL( δ ) ).
3. Choose the parameter λ which produces a minimal ARL for the critical shift using
Crowder´s nomogram (Fig. 6). This nomogram is for ARL(0) = 370 or 250 or 100 or 50
and for the shift from 0,25 to 4 where the shift is expressed as a multiple of the standard
deviation of the sample average Δ ( Δ = δ . n , where n is a sample size).
1
50
100
0 .9
250
0 .8
370
0 .7
0 .6
λ 0 .5
0 .4
0 .3
0 .2
0 .1
0
0
0 .5
1
1 .5
2
Δ
2 .5
3
3 .5
4
Figure 6 – Nomogram for optimal λ vs. shift Δ
183
Optimal λ is read from the nomogram so that we find on the x-axis the critical shift δ
expressed as Δ and through the curve for ARL(0) selected in the step 1 we read optimal
value of λ on the y-axis.
4. Find optimal parameter K for setting control limits in the EWMA chart which satisfies the
in-control ARL(0) set in the step 1. Use for it the next Crowder´s nomogram (Fig. 7).
3.5
370
250
3
100
2.5
50
K 2
1.5
1
0.5
0
0.1
0.2
0.3
0.4
0.5
0.6
0.7
0.8
0.9
1
λ
Figure 7 – Nomogram of K vs. λ
Each curve in this nomogram represents all possible combinations of λ and K ( λ ≥ 0,01)
producing the in-control ARL(0) associated with that curve. For the documentation of it
there is a table 1 in which you can see combinations of λ and K (with the most preferable
values of λ ) that approximately produce ARL(0) = 370.
Table 1 Combinations of λ and K for the same ARL(0)
λ 0,05
0,10
0,15
0,20
0,25
2,701
2,8005 2,859
2,898
K 2,490
370,3
370,0
370,3
370,0
370,4
ARL(0)
0,4
2,959
370,5
Optimal K can be found so that we find on the x-axis value of λ set in the previous step
and through the curve for ARL(0) selected in the step 1 we read optimal value of K on the
y-axis.
5. Enter this optimal λ and K to the EWMA Chart Options dialog box (see Fig. 4, numbers
4,5) and read if this combination gives ARL(0) set in the step 1 (see Fig. 4, number 2).
6. As the reading from the nomograms need not to be precise enough, it is possible that there
is some difference between target ARL(0) (step 1) and ARL(0) in Statgraphics. In that case
we must try to change precision of the parameters λ and K (predominantly only K is
changed) to obtain the target value of ARL(0).
7. Compute ARL( δ ) for the critical shift so that you will change number 0 in the field next to
ARL (number 3 in Fig. 4) for δ - the critical shift expressed as a multiple of the process
standard deviation σ .
After these steps click OK to run computations and construction of the EWMA control
chart with determinated parameters.
These steps are shown on the example in the next chapter.
184
5. An example
5.1 Description of the situation
We have 20 samples with 5 independent measurements of the quality characteristics (in
mm) in each (sample size is 5). Sample interval is 30 minutes. We want to detect as soon as
possible shift from μ0 = 100mm (target value of the process mean) to μ1 = 110 mm (critical
value of the process mean with which the process produces unacceptable portion of
nonconforming units). The target process standard deviation σ 0 is 20 mm. We want to apply
the two-sided EWMA control chart for sample means corresponding to the ARL(0)
performance of classical two-sided Shewhart chart for sample means based on the target
values of μ and σ .
5.2 Solution
A. For the first time we must select in the EWMA Chart Options dialog box the Control to
Standard type of study and specify parameters mean ( μ0 = 100mm ) and sigma ( σ 0 is 20
mm) – see Fig. 8, character A.
B5
A
B5
5
B5
Figure 8 – Steps A and B5
of the example solution
A
Figure 9 – Step B6 of the example solution
B. Then we find optimal λ and K applying the steps described in the previous chapter.
1. We decided to select ARL(0) = 370. It corresponds to ARL(0) of the three sigma
limits Shewhart control chart with false alarm α = 0 ,0027 .
2. The critical magnitude which we want to detect in control chart as soon as possible is
10 mm ( μ1 − μ0 ), i.e. δ = ( μ1 − μ0 ) / σ 0 = 10 / 20 = 0 ,5 . Δ = δ . n = 0 ,5. 5 = 1,118 .
3. For Δ = 1,118 through the curve for ARL(0) = 370 in nomogram on the Fig. 6 we have
found that the optimal parameter λ is approximately 0,17.
4. For optimal λ = 0 ,17 through the curve for ARL(0) = 370 in nomogram on the Fig. 7
we have read that the optimal parameter K is approximately 2,83.
5. We entered read values of λ and K into the EWMA Chart Options dialog box and the
program computed ARL(0) = 373,2 (see Fig. 8, character B5).
6. Because obtained ARL(0) is different from value 370, we try to change precision of
the parameter K to produce ARL(0) closer to 370. We left λ = 0 ,17 and we change
K from 2,83 to 2,827 and after that ARL(0) is exactly 370 (see Fig. 9). We consider
λ = 0 ,17 and K = 2,827 to be optimal values that give minimal ARL( δ ) .
7. We change value next to ARL from 0 to 0,5 (see δ in the step 2) and the program
immediately computes ARL( δ ) = 8 ,1 (see Fig. 10). That means that the EWMA chart
185
for sample means with λ = 0 ,17 and K =2,827 will give signal about the shift 0 ,5σ 0
on average 8 samples after the shift has occurred. Considering the sample interval 30
minutes the chart will give the signal about this shift via point out of the control limit
on average 4 hours after the critical shift occurred.
For now it is possible to run the computation of the control limits and construction of the
EWMA control chart using optimal parameters λ = 0 ,17 and K =2,827 (see Fig. 11).
EWMA Chart for
112
UCL = 107,7
CTR = 100,0
EWMA
108
LCL = 92,29
104
100
96
92
0
5
10
15
20
25
30
Subgroup
Figure 10 - Step B7
Figure 11 - EWMA control chart
From the Fig. 11 we can conclude that the analyzed process is not statistically stable (it is out
of control).
6 Conclusions
It this paper there was analyzed the rate of information given by SW Statgraphics Plus
version 5.0 and Statgraphics Centurion XV as to the correct design of the EWMA control
chart. It was concluded that given information is not sufficient. The paper offers the procedure
for setting optimal parameters λ and K and shows it on the example using SW Statgaphics
Plus version 5.0.
7 References
[1] CROWDER, S.V. 1989. Design of Exponentially Weighted Moving Average Schemes.
Journal of Quality Technology. Vol. 21, No. 3, pp. 155-162.ISSN 0022-4065.
[2] Statgraphics Plus Version 5.0 Online Manual.
[3] Statgraphics Centurion XV. On-line User Manual. Available from
www.statgraphics.com/documents.htm.
[4] Statgraphics Plus Version 5.0.
186