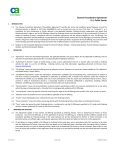
1
DaTARIUS DaTABANK™
User Manual
Version 1.8
DaTABANK™ User Manual
DaTARIUS is a world-leading supplier of test equipment, not just proving
but also improving optical media quality through comprehensive products
and services embracing process optimization.
Our Analyzers and Evaluators support all formats: pre-recorded, recordable,
and rewritable, and our revolutionary DaTABANK technology is fully Bluray (BD) and HD-DVD enabled.
Complementing these testers are optimization products, including our MF
DisCO temperature regulator; and inspection systems, with print label, disc
orientation and ident code validation.
We also offer extensive training through our service and test centres
worldwide.
For the past 20 years, DaTARIUS has been at the forefront of optical media
technology with our commitment to the future of the industry and our
customers.
DaTARIUS Technologies GmbH
Anton Maria Schyrle-Str. 7
A-6600 Reutte
AUSTRIA
Service Hotline:
Email:
Website:
+43 5672 206 206
[email protected]
www.datarius.com
DaTARIUS Technologies Inc.
26429 Rancho Pkwy So.
Suite 130
Lake Forest, CA. 92630 USA
Service Hotline:
Email:
Website:
+1 866 383 8378
[email protected]
www.datarius.com
DaTARIUS Technologies GmbH
Unit 801-5, 8th Floor, Delta House, No. 3 On Yiu Street, Shatin,
New Territories, Hong Kong
China
Service Hotline:
Email:
Website:
page 2 of 102
+852 2561 8078
[email protected]
www.datarius.com
Version 1.8
DaTABANK™ User Manual
Contents
1. System Description ............................................................................ 5
2. Powering up the system..................................................................... 7
3. Installing the DaTAVIEW™ application ........................................ 8
4. Software directory structure ............................................................ 8
5. The DaTAVIEW™ application........................................................ 9
6. DaTAVIEW™ operational elements and menu .................. 10
6. DaTAVIEW™ operational elements and menu ........................... 10
6.1. Toolbar .............................................................................................................................. 11
6.2. Parameter Display............................................................................................................ 12
6.3. Menu Test.......................................................................................................................... 13
6.4. Menu View ........................................................................................................................ 19
6.5. Menu Archive ................................................................................................................... 21
6.6. Menu Device...................................................................................................................... 26
6.7. Menu Settings ................................................................................................................... 35
6.8. Menu System..................................................................................................................... 39
6.10. Menu Help....................................................................................................................... 45
7. DaTAVIEW™ Configuration ........................................................ 47
7.1. Configuration of start buttons ........................................................................................ 47
7.2. Configuration of views ..................................................................................................... 48
7.3. Configuration of results display...................................................................................... 49
7.4. Configuration of signals................................................................................................... 52
7.5. Configuration for data export......................................................................................... 52
7.6. Configuration of limits..................................................................................................... 54
7.7. Configuration of archives ................................................................................................ 57
7.8. Configuration of users and user-groups......................................................................... 59
7.9. Configuration of Grid assignment .................................................................................. 62
8. Measurements.................................................................................. 63
8.1. Starting measurements .................................................................................................... 63
8.2 High-speed Jitter Measurements (JCHS / JCDiff)......................................................... 69
page 3 of 102
Version 1.8
DaTABANK™ User Manual
8.2.1 Introduction ................................................................................................................ 70
8.2.2 Calibration .................................................................................................................. 71
8.2.3 Measurements............................................................................................................. 71
8.2.4 Measurements at reference-speed............................................................................. 72
8.2.5 Measurements at multi-speed ................................................................................... 72
8.3.1. Display of measurement results ............................................................................... 76
8.3.2. Print measurement results........................................................................................ 78
8.3.3. Save and load measurement results......................................................................... 81
8.3.4. Export and Import measurement results................................................................ 83
8.3.5. Trend charts............................................................................................................... 87
8.3.6. Key data search ......................................................................................................... 87
8.3.7. Measurement data..................................................................................................... 88
8.4 Copy Protection ............................................................................................................. 89
9.1. Calibrating the driveCubes™ ......................................................................................... 93
9.2. Calibration Results........................................................................................................... 95
9.3. Calibration Report ........................................................................................................... 96
9.4. Calibration History .......................................................................................................... 97
10. Download........................................................................................ 98
10.1. Firmware download ....................................................................................................... 98
11. Update of DaTAVIEW.................................................................. 99
Appendix - A. List of measured signals ........................................... 100
DVD-ROM ............................................................................................................................. 100
DVD±R(W) ............................................................................................................................ 101
Appendix - B. Glossary of terms ...................................................... 102
page 4 of 102
Version 1.8
DaTABANK™ User Manual
1. System Description
The technological experience DaTARIUS has gained from being part of the industry for
decades was brought to bear in what is now the flagship DaTABANK™.
The DaTABANK™ is a state-of-the-art quality assurance tool for the optical media
industry. It was developed with the highest attention to measurement accuracy and
flexibility of hardware and software. Due to the system’s modular design, software and
hardware can be easily upgraded.
The typical DaTABANK™ configuration consists of one DaTAHUB and one or more
DaTASTATIONs. The DaTAHUB takes care of system control and management and
allows multiple Stations to be added, whilst DaTASTATIONs are the units containing all
measurement electronics. This includes the driveCubes™ which contain drives with the
optical pickups, as well as DaTARIUS player boards, signal conditioning boards and
versatile processor boards.
page 5 of 102
Version 1.8
DaTABANK™ User Manual
The system is also available as a stand-alone version. This stand-alone version consists of a
main station with a side arm mounted touch screen display and keyboard. Further stations
cannot be added.
The user interface software of the DaTABANK™ is called DaTAVIEW™. It is used to
operate the system and view and manage the measurement results. Core software objects,
such as the Application Manager and the Sequencer which run in the background, are not
operated by users.
page 6 of 102
Version 1.8
DaTABANK™ User Manual
2. Powering up the system
To power up a DaTABANK™ system, turn the Main Switch at the bottom of the
DaTAHUB back wall from 0 to 1. Switch on the power supply inside the DaTASTATION,
and then power up the driveCubes™ with the switches on the MSB. First tip the switch
upwards (Up) to manually power up the driveCube™, then switch back to Auto (Centre) to
enable power control via USB and the software.
When a driveCube™ is powered up, firstly it copies its operating system and then a
program for drive control and deriving data from the host computer (DCS Host).
Indication on the driveCube™ LED bar STATUS during start up:
Red
Yellow
Green
Copy operating system from DCS Host to driveCube™
Start up the operating system
Copy and start up the program
The program can be reset or restarted at any time by pressing all 3 keys on the
driveCube™ simultaneously.
page 7 of 102
Version 1.8
DaTABANK™ User Manual
3. Installing the DaTAVIEW™ application
The DaTAVIEW™ application has been designed to run under the Windows XP and
Windows 2000 operating systems. The screen resolution must be set to 1280 x 1024 or
higher.
Automatic Installation setup is available (see chapter 11.Update of DaTAVIEW).
4. Software directory structure
Files that are used by the DaTAVIEW™ application and its serving objects can be found
under C:\DATARIUS\.
page 8 of 102
Version 1.8
DaTABANK™ User Manual
5. The DaTAVIEW™ application
DaTAVIEW™, the user interface of DaTABANK™, runs on the host computer (DCS
Host) in the DaTAHUB Measurements and archiving are controlled and the results are
observed with DaTAVIEW™.
Hint! To simulate a right-mouse click on the touch screen displays,
→ first click on the software tool
→ or hold down the menu-key
to switch to right-click mode,
while clicking with the left mouse-button →
Starting DaTAVIEW™
Double-click the Windows desktop icons
to start the DaTAVIEW™
application. (1st AppAst Server icon then 2nd DaTAVIEW icon)
A Login window will appear.
Enter a valid Username and Password and click OK.
The default is “administrator” for username and “dataview” for password.
Clicking Shut Down will close the application again.
note: It is also possible to run a 2nd GUI (General User Interface) on another PC (eg..
within the Mastering department to observe the DaTABANK measurements from the
page 9 of 102
Version 1.8
DaTABANK™ User Manual
production system. If there is a need for this, please contact our hotline who will offer
further support (+43 5672 206 206). Our customer support will send the relevant manual
(DaTAVIEW monitoring).
DaTAVIEW™ starts communicating with the DaTASTATION and shows all the
connected driveCubes™ in the Main Information area.
2
page 10 of 102
Version 1.8
DaTABANK™ User Manual
6. DaTAVIEW™ operational elements and menu
6.1. Toolbar
Functional and navigational keys are located in the toolbar of the DaTAVIEW™ window.
Previous/Next
These buttons change the view of results to the previous or next layout in the list.
Load/Save
You can Load/save a file with measurement results from/into the archive.
Results can be saved at any time, even when the measurement is still running.
Print
You can print the measurement results at any time. Please refer to chapter
8.2.2. Print measurement results for more information.
SysView
This element brings up the main page with a DaTASTATION overview.
All driveCubes™ in the DaTASTATION will be visible in this view.
Views
The displayed elements contain different view layouts for the measurement results.
Please refer to chapter 7.2. Configuration of views - there you find out how to change the
arrangement of these elements.
Configuration
This element switches DaTAVIEW™ into configuration mode.
First press this button, then the area or element that needs to be configured.
Help
It has not yet been installed in this software version.. Helpdesk hotline:
(Europe) +43 5672 206 206 (Asia) +852 2561 8078 (USA) +1 866 383 8378
page 11 of 102
Version 1.8
DaTABANK™ User Manual
6.2. Parameter Display
All information about the Test, Status, the tested Medium and the testing Device are
displayed in this area. Use the tabs at the top to switch between the four sections. Testname and some lines of documentation (Docus) can be edited by the user. All entered
information can be edited afterwards, even after restoring the measurement.
Performs verification between an image file and, for instance, a stamper or
replica. This is carried out during a normal measurement. The results are evaluated on an
external PC with a corresponding decoder.
Clicking the button
on the bottom of the Test display will bring up the test
options window. This function can be used to alter some of the settings while a test is
running. It can also be used to find out how a test was done after restoring it from the
archive.
Reads the media content (control data) without starting a test.
Clicking the button
on the bottom of the Medium display will bring up an
additional window with all information that can be retrieved from the disc (Control Data,
Stamper information, etc.).
page 12 of 102
Version 1.8
DaTABANK™ User Manual
6.3. Menu Test
Run
Opens the macro Sequence selection window. From this window all test-macros can be
started by selecting the test sequence and the respective device (cube/CS5). In case it is
necessary to start a test which is not currently assigned to one of the two available start
buttons, the macro has to be started from here. Please refer to chapter 8.1. Starting
measurements for more information.
page 13 of 102
Version 1.8
DaTABANK™ User Manual
Static Test sequences
Through the static test sequences, different sequences can be
cube-independent predefined.
‘Multiselect’ is for selecting more analyzers when carrying out a
split measurement.
note: Only the matching sequences can be selected eg. a
stamper checker can not use a Drive cube or a CS5 sequence.
Load from Archive
Opens a window to load/restore any measurement results that have been saved to one of
the configured archives. Please refer to chapter 8.2.3. Save and load measurement results
for more information.
2
page 14 of 102
Version 1.8
DaTABANK™ User Manual
Load from File
Opens a window to load measurements directly from a specified path where DaTAVIEW
measurements were stored/exported.
Please refer to chapter 8.2.3. Save and load measurement results for more information.
Save
Any measurement results visible in DaTAVIEW™ can be saved into one of the configured
archives at any time. Please refer to chapter 8.2.3. Save and load measurement results for
more information.
page 15 of 102
Version 1.8
DaTABANK™ User Manual
Report
Prints out measurement results at any time. Please refer to chapter 8.2.2. Print
measurement results for more information.
Clear
Removes the measurement results that are currently displayed/active from the
DaTAVIEW™ window. (an old test will be ‘cleared’ while a running test will be aborted,
see window above)
Clear all
Removes all measurements which are not currently running from the DaTAVIEW™
window.
page 16 of 102
Version 1.8
DaTABANK™ User Manual
Delete
Use this function to delete measurement results from an archive. Select the Archive from
the pull-down menu and wait until DaTAVIEW™ has connected to it. An animation will
be running next to the pull-down menu until the connection has been established. Once
connected, a tick (as in the image above) will be displayed.
Enter some descriptions of the stored test to speed up the search process. This can be done
in the left half of the Load/Delete Test window.
Click Search to list all matching tests from the archive in the right half of the Test
Selection window.
Select the test from this list (use cursor + CTRL or SHIFT for multiple selections) and
click Delete to remove it from the archive or click Details first to view all information
related to the test.
page 17 of 102
Version 1.8
DaTABANK™ User Manual
Print Screen
Starts an external application which is called Printkey (exe
C:\windows). This
application allows users to capture screenshots and save them to image files. The Printkey
window will always open after pressing Print on the keyboard. Print will capture the whole
screen, ALT + Print will capture only the active window.
Logout
Displays a window to confirm that the user wants to log out.
Exit
To exit from the DaTAVIEW™ application.
GUI only →
Closes the DaTAVIEW™ application only (user interface).
Power →
Shuts down all units, including the computers.
Applications → Closes all running applications, but not the operating system.
page 18 of 102
Version 1.8
DaTABANK™ User Manual
6.4. Menu View
SysView - Brings up the main page with a DaTASTATION overview. All driveCubes™ in
the DaTASTATION will be visible in this view.
Bit to Bit - Performs verification between an image file and, for instance, a stamper or
replica. This is carried out during a normal measurement and the results are evaluated on
an external PC with a corresponding decoder. This is an additional feature and needs to be
installed (additional hardware & software required).
Next - Jumps to the next view layout in the list (one to the right in the toolbar).
Previous - Jumps to the previous view layout in the list (one to the left in the toolbar).
page 19 of 102
Version 1.8
DaTABANK™ User Manual
Configure
Opens a window/tool for arranging elements in the toolbar area of DaTAVIEW™. Please
refer to chapter 7.2. Configuration of views for more information.
page 20 of 102
Version 1.8
DaTABANK™ User Manual
6.5. Menu Archive
New
Opens a tool for creating an archive database which manages the storing of measurement
data. Please refer to chapter 7.7. Configuration of archives for more information.
page 21 of 102
Version 1.8
DaTABANK™ User Manual
Administrate
This tool is used to edit the settings of existing archives. Please refer to chapter 7.7.
Configuration of archives for more information.
Import
Using the Import File tool, measurement results that have been previously exported to a
data file (.bin) can be re-imported into the DaTAVIEW™ software. Please refer to chapter
8.2.4. Export and Import of measurement results for more information.
page 22 of 102
Version 1.8
DaTABANK™ User Manual
Export
Single or multiple sets of measurement results/data can be exported from the archive and
stored into a data file (.bin) from this window. Please refer to chapter 8.2.4. Export and
Import of measurement results for more information.
page 23 of 102
Version 1.8
DaTABANK™ User Manual
Export statistics
Statistical measurement data from single or multiple tests can be exported to Excel (.xls)
or .txt file from this window. Please refer to chapter 8.2.4. Export and Import of
measurement results for more information.
Export configuration
Configurations for the export of measurement data to Excel (.xls) or .csv files (Archive/
Export from the menu) can be done in this window. Please refer to chapter 7.5.
Configuration for data export for more information.
page 24 of 102
Version 1.8
DaTABANK™ User Manual
Trend charts
This tool offers the ability to view the trend of certain signals over a number of selected
measurements. Please refer to chapter 8.3.5. Trend Charts for more information.
Key data search
This tool offers the ability to search a selected number of recent tests for certain aspects of
one of the signals. Please refer to chapter 8.3.6. Key data search for more information.
page 25 of 102
Version 1.8
DaTABANK™ User Manual
6.6. Menu Device
Reset
Selecting this item will restart the program of the driveCube™ which has previously been
selected in the SysView (driveCube™ overview window). Pressing all three buttons on the
driveCube™ at once has the same function.
Calibration ► Run
Calibrations can be started from this window by selecting a device, a reference-set and
clicking OK. For more information, please refer to chapter 9.1. Calibrating the
driveCubes™.
Calibration ► Status
page 26 of 102
Version 1.8
DaTABANK™ User Manual
Through the calibration status it is visible which calibration was carried out for which cube.
In addition, the expiry date for the calibration can be set here. After this date a message
will pop up to remind you to perform a calibration. With the tick in the ‘Preselect Print
after calibration finished’ checkbox it can be set that after a calibration when the window
pops up the print option is already selected.
Calibration ► Result
To view the current calibration parameters, select the driveCube™ in the SysView window
and choose System/Calibration Results from the subsequent menu. This will open the
window Calibration Results which lists all calibrated signals. Please refer to chapter 9.2.
Calibration Result for more information.
page 27 of 102
Version 1.8
DaTABANK™ User Manual
Calibration ► Report
This displays a Calibration Report for the driveCube™ selected in the SysView
(driveCube™ overview window) of DaTABANK™. It is also possible to obtain the report
by entering the 4-digit DeviceID and clicking Get Calibration after opening this window.
Please refer to chapter 9.3. Calibration Report for more information.
Calibration ► History
The Calibration History window shows a chronological list of calibrations for a single
signal. It is possible to deactivate the calibration or to switch to one of the previous
calibrations in the list. Please refer to chapter 9.4. Calibration History for more information.
page 28 of 102
Version 1.8
DaTABANK™ User Manual
Firmware download
This tool is used to download software programs from the hub computer to the various
driveCube™ or CS5 analyzer components. Please refer to chapter 10.1. Firmware
download for more information.
page 29 of 102
Version 1.8
DaTABANK™ User Manual
Device Administration
In the window tab CS5 Analyzers it is possible to connect to the CS5 analyzers which are
attached to the system computer. All analyzers recognized by the DaTAVIEW™ software
are visible in the list of CS5 Analyzers.
If new analyzers have been attached and are not yet listed, use the button Scan IPs to
perform an automatic search. The analyzers can also be addressed individually by entering
the IP address into the field Start IP-Address. DaTAVIEW™ will start to address (ping)
the entered IP address and also a number of similar IP addresses by counting upwards on
the least significant digits. To define how many of these similar IP addresses should be
scanned, enter the number in the field IPs to check.
Double-clicking an analyzer in the CS5 Analyzers list or clicking the Details button after
selecting an analyzer will bring up the CS5 Analyzer Details window.
page 30 of 102
Version 1.8
DaTABANK™ User Manual
This window shows the IP address of the analyzer, the type of the analyzer and its serial
number. In the field Grid Position, the analyzer can be assigned to a position in the
SysView display (overview of all connected devices) of DaTAVIEW™.
In the tab ‘other Analyzers’ all driveCubes™ and/or USC (Universal Stamper Checker) are
listed with their individual IP-address, Serial-number, Grid-Position, driveCube™ Type
and the assigned Ingrid. The Grid Position and the assigned Ingrid can be changed under
Details. Generally all DaTAVIEW valid hardware (driveCube™ & USC), which was
detected by the system, is shown here. In this example the first five units were not assigned
to the Ingrid, unlike the last two.
page 31 of 102
Version 1.8
DaTABANK™ User Manual
In case of BD- or HD-Analyzers additional equipment is necessary
BD-driveCube™: - Yokogawa-unit (digital Jitter Meter)
- PITORESC-PC
HD-driveCube™: - Yokogawa-unit (digital Jitter Meter)
After connecting the hardware to the system the additional equipment has to be entered
once within DaTAVIEW in order to use it. Therefore enter the Device ID of the
driveCube™ which is using the additional equipment, in the Attribute column the
corresponding IP address of the additional Hardware has to be entered, finally choose the
type of the equipment (TA220 = digital Jitter Meter; Yokogawa or PITORESC hardware in
case of BD-driveCube™)
page 32 of 102
Version 1.8
DaTABANK™ User Manual
In this window all driveCubes™ are shown which are currently online.
page 33 of 102
Version 1.8
DaTABANK™ User Manual
By pressing Read log button the DHCP log file will be shown.
Reset commands
This option is used mainly for the service technician to enter the reset command for a
Drive cube or a CS5 analyzer. This option is enabled at the Administrator level but we
recommend using this if the DaTARIUS customer support team advises it.
Send command
This option is also reserved for service technician access. This option is enabled at the
Administrator level but we recommend using this if the DaTARIUS customer support team
advises it.
page 34 of 102
Version 1.8
DaTABANK™ User Manual
6.7. Menu Settings
System
Under the General tab basic system information like SystemID / Hardwarekey* / System
Name is listed. On the right sight the enabled System Options are marked.
Through Split Master Detection it can be defined which Analyzer should perform the
Compensation during the split measurement.
Computer to shutdown is for the ‘Power’ option when the user is shutting down the whole
system.
(* The hardware key file (DaTAVIEW LIC file) can be found under C:\DaTARIUS\App )
page 35 of 102
Version 1.8
DaTABANK™ User Manual
Standard paths for sequence / download / DCA comparison can be defined here but
DaTARIUS recommends leaving these settings as they are.
Factory defaults
Various settings can be reset to default (as it was when the system was shipped by
DaTARIUS). This can be used if were wrong settings have been made and the user has
doubts about the current settings.
page 36 of 102
Version 1.8
DaTABANK™ User Manual
Sequence
Overview of the predefined standard sequences and those created by the user. Further new
user sequences can be created through this DaTAVIEW™ menu
option.
User
page 37 of 102
Version 1.8
DaTABANK™ User Manual
Displays the User administration window where Users and Groups of users can be set up
or edited. This tool is used to administer user rights or restrictions. Please refer to chapter
7.8. Configuration of users and user-groups for more information.
Limit (Configuration)
Thresholds for PASS/WARNING/FAIL judgements for all signals can be set with this tool.
Please refer to chapter 7.6. Configuration of limits for more information.
Signal (Configuration)
page 38 of 102
Version 1.8
DaTABANK™ User Manual
All settings and information related to each signal can be made/viewed in this window.
Please refer to chapter 7.4. Configuration of the signals for more information.
Filter
This option from the DaTAVIEW™ menu can be opened only by DaTARIUS staff.
There is no need for access by the administrator/customer.
6.8. Menu System
Hardware information
The driveCube™ status display and active switches for the power supply of each
driveCube™ are located in the Device information window.
Airflow system information shows the status of all fans in the DaTABANK™ system.
General information contains status information about the boards and a list of the installed
firmware versions.
page 39 of 102
Version 1.8
DaTABANK™ User Manual
Application Manager
This tool is used by service engineers and the developers of DaTABANK™. It runs the
Application Manager, which offers the ability to view and set up options for the software
applications and objects.
Event Log Viewer
Chronological list of all events on the DaTABANK™ system.
Event Message Editor
This option from the DaTAVIEW™ menu can be accessed only by DaTARIUS staff.
Again, there is no need for access by the administrator/customer.
page 40 of 102
Version 1.8
DaTABANK™ User Manual
6.9. Menu Tools
Radius-Address
page 41 of 102
Version 1.8
DaTABANK™ User Manual
Check System
After pressing the Run Diagnostic button a self check of the system will be carried out.
Calibration Editor
This tool is used only by service engineers and developers of DaTABANK™.
page 42 of 102
Version 1.8
DaTABANK™ User Manual
Basket
Displays a tool used by fully trained customers and DaTARIUS service engineers. It
should help to simplify working with the configurations database. It is possible to load the
current configuration (view, reports, etc.) and to export single views or report
configurations (Database->File). Additionally, it is also possible to import single views,
reports or a whole basket-cfg (File->Database). Please contact the DaTARIUS Hotline so
that they can guide you through this procedure.
note: Wrong handling can delete the basket configuration!
page 43 of 102
Version 1.8
DaTABANK™ User Manual
Hierarchy manager
This tool is used only by service engineers and developers of DaTABANK™.
Macro Editor
This tool is used only by service engineers and developers of DaTABANK™.
Web Interface
This tool is used only by service engineers and developers of DaTABANK™.
TelNet
This tool is used only by service engineers and developers of DaTABANK™.
SQL Browser
This tool is used only by service engineers and developers of DaTABANK™.
Reload Sequences
This feature is used when test sequences are copied onto the system to enable the software
to recognize them. It is unnecessary to restart the software in order to enable the new test
sequences.
page 44 of 102
Version 1.8
DaTABANK™ User Manual
6.10. Menu Help
Documentation
To load Release notes or DaTABANK – User Manual
page 45 of 102
Version 1.8
DaTABANK™ User Manual
About
In the About window it is possible to find information regarding the DaTABANK™
system and about DaTARIUS (service hotline).
page 46 of 102
Version 1.8
DaTABANK™ User Manual
7. DaTAVIEW™ Configuration
Firstly, click the configuration symbol
in the top right corner of the DaTAVIEW™
window and then click on the area to be configured.
7.1. Configuration of start buttons
→
Before clicking the configuration button,
, select the driveCube™ required.
In the Testsequence selection window it is possible to assign certain test sequences to the
start buttons in DaTAVIEW™. These sequences will be assigned to the two start buttons
on the driveCube™ at the same time. The sequences are defined in macro files (*.mac). All
further options, eg. spot and measurement speed selection, limit check, save and print
switches, etc. will then be available when starting the test.
page 47 of 102
Version 1.8
DaTABANK™ User Manual
7.2. Configuration of views
→
In this window, the arrangement of view elements in the toolbar can be configured.
Each element in the list All Views represents a certain one-page layout which displays
measurement results. Click New to access all available elements defined in one of the
macro files.
Add or remove elements to/from the list Active Views by clicking the arrow buttons → or
← in the centre. All elements in Active Views will be present in the toolbar after the
configuration of views is complete. Change the position of the elements with Move up or
Move down. Signals contained in the selected elements (Active Views) can still be edited
subsequently (see next chapter).
In the centre, individual letters for items in the Active Views can be assigned to
distinguish the views in the toolbar.
Select a category (DVD ROM, DVD REC, CS5) to display the selected item only during
measurements on the specified system or media.
The view configuration is stored together with the user settings. When switching to a
different user, the views in the toolbar will also change.
page 48 of 102
Version 1.8
DaTABANK™ User Manual
7.3. Configuration of results display
→ Click the item to be configured in the result display.
When displaying results of DVD Recordable measurements, select Blank or Recorded
from the Area pull-down menu in the configuration window. This will add the letters b
(before recording) or a (after recording) to the relevant signal names.
Table
Use the arrow buttons → or ← to add or remove signals to or from the table. Use Move up
and Move down to change the signal’s position in the table. Use the Header Configuration
on the right side to define the columns of the table.
Graph
Use the arrow buttons → or ← to add or remove signals to/from the graph. Use Move up
and Move down to change the signal’s position in the list. The two boxes Auto Scale X and
Auto Scale Y can be ticked to normalize the highest measurement values of the X and Y
axis to the Xmax (left) and Ymax (top) borders of the graph. To manually set the range of an
page 49 of 102
Version 1.8
DaTABANK™ User Manual
axis, click on a unit and change the number. The pull-down box below the X axis is used to
switch X-units between Radius [mm] and Address.
Surface Diagram
A surface diagram only displays results from one signal. Choose the signal from the list All
Signals and press the arrow button → to display it in the diagram. Tick the Auto Scale Z
box to use the full colour range for the obtained measurement results. To manually set the
range, click on a unit and change the number.
QualityWeb
page 50 of 102
Version 1.8
DaTABANK™ User Manual
Use the two arrows → or ← to add or remove signals to/from the QualityWeb. Use Move
→ and ← Move to change the signal’s position on the web. Rotate the whole web with
Rotate → and ← Rotate.
Select a signal in the web to display and edit the details in the right section of the window.
The fields Lower scale and Upper scale make it possible to manually set the values
represented by the inner and outer red circle in the web. For these defined values to be used
as limits, Method min and Method max have to be set to fix. Set Method min/Method max
to rMin or rMax to use the red limits or to yMin or yMax to use the yellow limits [which
are set in the quality classes].
Snapshot
Select the type of data to be displayed from the pull-down menu in the top right corner.
Possible selections are HF Snapshot, HF Eyepattern, TPP Snapshot, LPP Eyepattern, WO
Spectrum, TC Graph, FO Graph, SL Graph, CS Graph, JC Histogram, JF Histogram, or JR
Histogram. Results will only be displayed for all Fix Positions which were selected in the
Positions tab during the test start.
page 51 of 102
Version 1.8
DaTABANK™ User Manual
7.4. Configuration of signals
Select System/Signal configuration from the menu to individually configure every signal
that is measured on DaTABANK™. The name of the signal on the display and in reports
can be changed by editing the field ID. The display colour can be changed by clicking the
box in the top right corner of the window. (note: The ‘signal used by’ boxes can not be
clicked!)
7.5. Configuration for data export
Selecting Archive/Export configuration from the menu displays a tool for editing the
configurations for the export of statistical measurement data. All configurations set with
this tool can be selected later, when exporting statistical data to .xls or .csv files using
Archive/Export statistic from the menu.
page 52 of 102
Version 1.8
DaTABANK™ User Manual
First select an Archive from the pull-down menu. To create an export configuration, enter
its name in the box Configuration Name and the name of the export table in the box
Results Tablename.
To change the settings of an Existing Export Configuration, select it from the pull-down
menu.
Activate Save on Test Create to immediately save the Excel file after data export. Usually
the file opens and the user has to save the data manually.
With the buttons Export Configurations and Import Configurations, it is possible to
store/load the configurations for the export of statistical measurement data into/from a file.
Use the area in the centre to define the columns to be present in the exported test data file.
Use the buttons on the right (Add Test Information, Add Test Statistics, etc.) to define
which items/information should be exported to the file.
Press the button Set Custom Column Name to select the column in which the items of the
exported data should be placed.
page 53 of 102
Version 1.8
DaTABANK™ User Manual
7.6. Configuration of limits
Select Configuration/Limit editor from the DaTAVIEW™ menu to display the limit
configuration tool. Lists of the Quality Classes and all included Disc Types are located in
the left section of the window. Settings are made in the list on the right.
Click Change Quality Class Settings to add a new or modify an existing quality class. To
add a new class, first select a parent class from the list, then enter the name for the class in
the New Class Name field and finally click New. The new class will be contained within
the selected parent class. Click OK to return to the limit editor and set the thresholds for
the signals.
It is also possible to import or export quality class from one system to the other by using
the Import/Export buttons.
On the right sight the limits for the different signals are visible; above they can be
switched between Stamper/Replica and Graphic/Surface.
page 54 of 102
Version 1.8
DaTABANK™ User Manual
Events
On the Events tab it is possible for the user to enter event text for different codes. For
example, in the case of a complete failed compensation it can be set so that the limit status
turns to Warning.
By default, the limits set in the parent class will be used for judging the measurement. Only
if the parent class contains a sub-class which was specified for a certain type of media (eg.
DVD9 OTP), will the limits set in this sub-class override the settings from the parent class.
page 55 of 102
Version 1.8
DaTABANK™ User Manual
Click New in the ViewLimits window to add a new signal/line to the list. Firstly select the
signal to be configured from the Limit pull-down box. Select further options (layers,
limitation of measurement area, calculation method), from the pull-down boxes just below.
Enter the limits for RMin, RMax (red min/max) YMin and YMax (yellow min/max).
Activate the Dependency tickbox to make the limit-check dependent on other signals.
Choose eg. Address or Radius to narrow down the radial range (between LValue and
RValue) for limit-check. Finally, click New to add the entry to
the list of thresholds.
→ Dependency settings
(see ‘note’)
Click Details/Properties in the ViewLimits window to change the settings for the selected
signal/line. After the changes have been made, click the New button to apply the changes
before clicking OK.
Click Delete in the ViewLimits window to remove the selected signal/line.
Switch to the next / previous signal in the list with the « Navigate » arrows on top.
note: There is also the possibility for radius or signal dependant limit configuration
(Dependency settings: Signal/Layer/left & right margin) but this is for advanced
users only. If required, please contact our hotline for further support.
page 56 of 102
Version 1.8
DaTABANK™ User Manual
7.7. Configuration of archives
When saving the results into an archive after the measurement has finished, the complete
measurement data is stored in binary files. These binary files are managed by an archive
database. The database itself only contains the header of each item stored, which includes
the name of the test, Test-ID, Username, Macro, Start and Endtime, Limit status, Disc ID,
Disc Type, Medium, Docus and Devices.
To set up a new archive database, select Archive/New archive to open the Create
Archive Database window.
Script settings
Database name → Name of the database in the SQL Server.
SQL Server → Selection of SQL Server.
Database path → Path of the archive database.
Main script file → Path to the script file, which is used to generate the database contents.
Basket configuration
Identify the source for importing measurement data.
Datasource → ODBC datasource which is linked to the archive database.
Archivename → Name of the archive, visible for the user in DaTAVIEW™.
Object template → Used objects. No changes have to be made here.
page 57 of 102
Version 1.8
DaTABANK™ User Manual
Database configuration
Limit file size → Limits the size of the binary data files. As soon as a file gets bigger than
the set limit, a new file will be generated/started.
Data Path → Path of the binary data files, which are administrated by the archive database.
Filename → Name of the binary data file.
After the settings have been made and verified, click the Create button to finally create the
new archive.
Note! The process of creating the database will take about one minute. If the database
already exists, it will be replaced. The process cannot be cancelled.
To administer existing archives, select Archive/Admin archives from the DaTAVIEW™
menu. This tool is used to edit the settings of existing archives.
The button New is used to empty all text fields in the Administrate Archives window.
Add/Update is used to modify existing archives. Select an archive from the configured
Archives list. Details of the selected archive are displayed in the left half of the window.
Modify the details and click Add/Update to apply the changes and update the existing
archive.
Clicking Delete will delete/remove the selected archive from the list.
SQL Server → Selection of SQL Server.
Archivename → Name of the archive, visible for the user in DaTAVIEW™.
Database → Name of the database in the SQL Server.
Datasourcename → ODBC datasource, which is linked to the archive database.
page 58 of 102
Version 1.8
DaTABANK™ User Manual
Object → Used objects. No changes have to be made here.
Limit file size → Limits the size of the binary data files. As soon as a file gets bigger than
the set limit, a new file will be generated/started.
Reorganize file size → Limits the size of unusable data inside the binary files.
When repeatedly transferring measurement data into and out of the binary files, remnant
blocks of memory are left in the file. As soon as the amount of unused data reaches the
number of bytes entered, the file will be reorganized.
7.8. Configuration of users and user-groups
DaTAVIEW™ offers the option to configure different groups of users and apply rights or
restrictions to each group individually. Registered users therefore only have the rights of
the group to which they are assigned.
Select System/Security manager from the DaTAVIEW™ menu to open the User
administration window.
Selecting an entry and clicking on Delete will bring up a window that asks for
confirmation “Do you really want to delete user name?”. Administrator can not be deleted
from the lists.
page 59 of 102
Version 1.8
DaTABANK™ User Manual
User section
The User Properties window will appear after selecting a user and clicking Alter or New in
the top half of the User administration window. Username, Description and Password can
be entered/edited in here. The user is a member of the group selected in the Member of
section. All rights and restrictions set for the group will also apply to this user. Use the
buttons Add and Remove to list more/fewer groups in the Member of section.
Groups section
The Group Properties window will appear after
selecting a group and clicking Alter or New in the lower
half of the User administration window. Group name
and Description can be entered/edited in here. Use the
buttons Add and Remove to edit the contained
Functions list, which shows all enabled functions for
this group of users.
2
page 60 of 102
Version 1.8
DaTABANK™ User Manual
Function
Change config from other owner
Save test sequences permanent
Administer archives
Basket
Bit to Bit comparison
Configuration
Send command to device
Device administration
Delete measurements
Event log viewer
Export statistic to csv. file
Export configuration
Factory defaults
Firmware download
Key data search
Limit editor
Create archive
Sequence settings
Run a test sequence
Run calibration
Reload sequences
Reset Device
Reset commands
Save measurements
Security Manager
Hardware information
Signal configuration
Trend charts
Power down
page 61 of 102
Version 1.8
DaTABANK™ User Manual
7.9. Configuration of Grid assignment
→ Click the driveCube™/Analyzer grid in the SysView (System overview).
The Grid configuration window will open up and allow the user to assign the device
numbers to any position in the grid of devices.
For CS5 systems, for example, it makes sense to assign the device numbers 1-4 in the top
row, and 5-8 in the bottom row.
page 62 of 102
Version 1.8
DaTABANK™ User Manual
8. Measurements
Measurements by DaTABANK™ are always real-time, independent from the selected
measurement speed. Instead of delivering raw data and having the main application do all
calculations, the results are immediately calculated by the measurement electronics and
sent to the DaTAVIEW™ software on request.
As the system is able to deliver a FBAS video signal., it is possible to observe the visual
contents of the measured discs on a screen, EFM and EFM+ data streams are also available,
making it easy to attach a Signal Verification System for disc-format checks to the
DaTABANK™.
8.1. Starting measurements
№1►
Either press Eject on the driveCube™ or click the Eject command button in
DaTAVIEW™ to open and close the driveCube™ lid for loading a disc.
№2►
Press one of the two available Start buttons on the driveCube™ to
initiate an assigned measurement sequence.
To start from DaTAVIEW™, firstly select a driveCube™ and click one of the Start
command buttons or select one of the Static Test sequences.
DaTAVIEW™ starts communicating with the DaTASTATION and shows all the
connected driveCubes™ in the Main Information area. To start a single test not assigned to
one of the Start buttons, select Test/Run from the menu.
page 63 of 102
Version 1.8
DaTABANK™ User Manual
Select one of the available test macros and the corresponding device and click OK to
initiate the test.
№3► When starting a measurement, the macro file (*.mac) assigned to the start command
button is run. Both start buttons in DaTAVIEW™ and on the driveCube™ can be assigned
to an available macro file.
All further start-up settings and the measurement sequence depend on the contents of the
macro file. This file needs to be edited in order to change the start-up sequence.
page 64 of 102
Version 1.8
DaTABANK™ User Manual
Under the General tab of the StartUp window, it is possible to enter the Testname and
Docus. You can also define the archiving and printing of a Report, as well as all
Measurement Settings eg. Speed, Compensation, Doublecheck, etc.
Note: by selecting ‘Show all’ at the top, all tabs will be visible (red marker).
page 65 of 102
Version 1.8
DaTABANK™ User Manual
Activate the TestEnd Dialog tickbox to bring up another window with options for printing
and saving the completed measurement. Further it can be configured through Clear on end
if a completed measurement should be kept in the ‘Test Selection Bar’.
Select Open if the Drive cube cover should be opened when a test is started.
Keep data is in case of a spot measurement regarding a previous test to keep the remaining
data, just the re-measured data will be updated.
The Export function is currently disabled .
Read Control Data is to view the TOC of the medium. If this is deselected, the settings
from the General tab (default disc type) will be used. Therefore under Details/Area
information the recorded and blank area can be manually entered.
Read Data Area Bounds is for measuring the mechanical parameters like IDDA and
ODDA (Inner Diameter and Outer Diameter of Data Area)
Rest measurement is to perform a complete measurement. If not selected, only the entered
positions are measured.
Double check will re-measure critical areas on the disc where
the limit is out of range and a double-check value is entered
under the menu Settings/Limit (see excerpt of limit settings)
page 66 of 102
Version 1.8
DaTABANK™ User Manual
Open Loop Scan is for measuring all Open Loop related signals eg. TCS, DPDAmp.
Through Area detection the analyzer detects the (pre)recorded and the blank areas on the
disc. This information is then displayed under Medium/Details/Area information.
Note: This is important in case a particular recorded (eg. rec/blank/rec/blank
intensity step disc) disc has to be measured.
Use Calibration – determines whether the calibration should be applied or not. If
deselected, raw values will be displayed.
If the Compensation box is ticked, the compensation will be carried out in accordance with
the compensation tab settings
(Tilt/Focus/Slice/JCDiff) note: S-curve is just for CS5 applications)
Limitcheck is for verifying measurement results according to the limits.
If disabled, the measurement will not be evaluated.
page 67 of 102
Version 1.8
DaTABANK™ User Manual
Click on the Positions tab to set the positions where all measurements, including open loop
or off-track and compensated jitter measurements, should be made.
To carry out a spot measurement, enter the spot area (From – To) and select Closed or
Open Loop measurement, the medium type and speed. (Reference speed is strongly
recommended.) The keep data option from the Details tab should be taken into
consideration when performing a spot measurement.
Finally, if the compensation was activated under the Details tab, switch to the
Compensation tab to define which kind of compensation should be done on each spot.
page 68 of 102
Version 1.8
DaTABANK™ User Manual
Tilt/Focus/Slice is fully implemented for driveCubes™ and CS5 analyzers.
(S-Curve is only for CS5 applications)
Note: To skip high-speed Jitter Measurement explanation (click here)
8.2 High-speed Jitter Measurements (JCHS/JCDiff)
Sample measurement on a disc with intensity-steps
page 69 of 102
Version 1.8
DaTABANK™ User Manual
8.2.1 Introduction
DaTARIUS has developed a new solution for optimizing DVD Jitter measurements at
higher measurement speeds. This new technique will allow the testing of DVDs at multispeed and at the same time generating Jitter results as if they were measured at
reference speed.
DaTARIUS sees this as an important new feature
to help replicators measure Jitter at multi-speeds.
At the start of the measurement process, the analyzer takes Jitter measurements at
reference speed and at the multi-speed setting on three spots across the disc. At each spot,
the difference between Jitter measured at reference-speed and Jitter measured at multispeed is determined. This data is used during the multi-speed measurement to recreate the
reference speed Jitter results.
► The CS4 High-speed Jitter feature has been implemented with the release of
DaTAVIEW software version 1.4b07.
A new signal called JCHS has been added in the DaTAVIEW software, which represents
the Jitter results measured at multi-speed. The meaning of the signal JC (Jitter measured at
reference-speed) remains unchanged.
► This process gives a good correlation to reference speed Jitter performance. However,
on critical discs, or where the Jitter results are close to the specified limits, DaTARIUS
recommends performing the measurements at reference speed.
page 70 of 102
Version 1.8
DaTABANK™ User Manual
8.2.2 Calibration
All DaTARIUS reference files for DaTAVIEW DVD calibration have been modified in
order to support the new signal JCHS and the related calibration links.
8.2.3 Measurements
There are no changes to the way the measurement process is started – measurements are
started the same way as before.
► The screen/display and the printed reports should be configured in order to show the
new JCHS signal.
Sample measurement on a disc with intensity-steps
page 71 of 102
Version 1.8
DaTABANK™ User Manual
8.2.4 Measurements at reference speed
The reference-speed measurement sequence has not changed and is not affected by the
introduction of Jitter High-speed measurements. The raw signals for this measurement are
delivered by the 1X Jitter measure electronic.
► JC and JCHS are measured using the Jitter (JC) calibration.
► The signal JCHS will not be measured.
8.2.5 Measurements at multi-speed
The raw signals for this measurement are delivered by the multi-speed Jitter measurement
electronics.
(i)
► When JCDiff is selected on the compensation tab, the compensation points (as
entered) will be carried out. This means on each (selectable) point the difference
between JC (1X) and JCHS (4X) will be determined.
(ii) ► Through these differences, the 1X Jitter can be re-calculated when measuring in
4x (Interpolated between the compensation points)
(iii) ► The DaTAVIEW software finally shows JC and JCHS on the screen.
Sample measurement on a disc with intensity-steps
page 72 of 102
2
Version 1.8
DaTABANK™ User Manual
№4► Click Start after all settings have been made to initiate the measurement. If the
Permanent tickbox was activated, the current settings in the TestEnd window will be saved
as default settings for the next time the macro file shown in the bottom left text box is
used. Changing the name of the macro in this text box will create a new macro.
№5► Whilst a test is running, the command buttons have different functions.
Stop is used to abort the running test, whilst Pause will interrupt the test until the same
Pause button is pressed again.
Appearance of the Pause button when a test is interrupted.
Also, whilst a test is running, pressing the button
at the bottom of the Test page in
the Parameter Display area (on the left side) will allow changes of some of the test settings
from the startup dialogue.
№6► If the TestEnd Dialog option is activated in the StartUp window and a measurement
is finished, the TestEnd window will show up.
Edit Testname and Docus if necessary and select if the results should be Saved or Printed.
If the Permanent tickbox was activated, the current settings in the TestEnd window will be
saved as default settings for the next time the macro file shown in the bottom left text box
is used. Changing the name of the macro in this text box will create a new macro.
Split Measurement
By selecting more driveCubes™, a measurement can be apportioned. To divide a
measurement over two ore more driveCubes™, more units have to be selected when
starting a measurement.
Click on the Multiselect box and select more driveCubes™
or CS5 analyzer.
Another possibility is to select the units manually by
holding the CTRL-key and selecting the cubes.
page 73 of 102
Version 1.8
DaTABANK™ User Manual
Menu → Settings → System
Split Master Detection - in case of a split measurement this can define which
analyzer should be the master analyzer:
- lowest Grid (the analyzer with the lowest Grid number will be master)
- lowest Speed (the analyzer with the lowest speed will be used as master)
- highest Grid (the analyzer with the highest Grid number will be master)
- highest Speed (the analyzer with the highest speed will be used as master)
page 74 of 102
Version 1.8
DaTABANK™ User Manual
8.3. Measurement results
Main status and a fast overview are displayed directly on the driveCube™. The lids
covering the drive units in the DaTASTATION are illuminated with the familiar colours,
Green (Pass), if all signals are within the limits
Yellow (Warn), if at least one signal is close to a limit (has reached the yellow limit) or
Red (Fail), if at least one signal is outside a limit.
The LED bar Status roughly displays the radial location of any limit issue. Again, the
LEDs turn green, yellow or red.
The LED at the bottom of the Status bar represents the Begin of Program and the top LED
represents the Begin of Lead Out location. For DVD9 measurements, the bar is split into
two halves.
The bottom half represents L0, and the top half L1.
When the measurement is finished, all status indicators on the driveCube™ start to flash.
The test-progress can be observed on a progress bar below the driveCube™ in
DaTAVIEW™ (SysView).
The test-status will be displayed in the test selection bar at the bottom of DaTAVIEW™.
☺
All results are within the limits.
At least one signal is close to a limit.
At least one signal is outside a limit.
Test is currently running.
Test was aborted and has not yet been saved.
Test has been saved in an archive.
page 75 of 102
Version 1.8
DaTABANK™ User Manual
8.3.1. Display of measurement results
Use the view-bar on top of the DaTAVIEW™ window to switch between different pages
of measurement results.
Tables
Switch between layers with the tabs at the top.
Graphs
Either an individual graph is displayed for each layer or layers can be switched using the
tabs at the top.
Three buttons
can be found at the side of any graph. They are used to
customise the display range and scale.
Click the first button, a magnifying glass, to bring up more options for settings, display,
range and zoom.
Click the second button, a + symbol, to reset appearance of the mouse-cursor to default.
Click the third button, a hand, to manually drag the graph content with the mouse-pointer.
page 76 of 102
Version 1.8
DaTABANK™ User Manual
Surface diagrams
Surface diagrams display the distribution of the results over the disc. The range of
measurement results is linked to a colour spectrum in order to make distribution patterns
visible. (2D and 3D graph possible)
Quality Web
The Quality Web instantly shows which signal has reached/exceeded a critical limit. The
red circles represent the maximum and/or minimum limits for each signal individually. It is
easy for experienced users to recognise pattern changes and link them to changes in the
manufacturing process.
Snapshot
This graph displays the configured data (see 7.3. Configuration of results display/Snapshot)
for all Fix Positions selected in the Positions tab at the test start. Use the arrows below the
graph to switch between the single results on the Fix Positions.
page 77 of 102
Version 1.8
DaTABANK™ User Manual
8.3.2. Print measurement results
Before printing the report, please mark the loaded or finished stamper measurement. To
print the measurement results, tick the box Print (print options: yes/no/on fail) in the
StartUp or TestEnd window or click the printer symbol
in the toolbar or select
File/Print report from the menu at any time. A Report Preview window will come up and
offer the option to set up the report.
page 78 of 102
Version 1.8
DaTABANK™ User Manual
First, click the button Load Report to select the type or style of report to be printed.
After loading the selected report from the ‘Reports’ list, the following report will appear.
page 79 of 102
Version 1.8
DaTABANK™ User Manual
Now the report is ready to be printed by clicking the Print button.
The layout of the selected report is defined in a macro file. To change the layout, this file
has to be modified.
For further editing, such as changing the contents or scaling of graphs, tables, etc., click
the button Edit report on the bottom. This will change the Edit mode indication box at the
top to green, meaning that the contents can now be edited.
Click on the items (graphs, tables, etc.) in the report preview to access the options available.
(For more information please refer to chapter 7.3. Configuration of results display.)
Clicking the Edit report button again will bring the report back to view mode. To make the
changes visible in the preview, click the Refresh button.
The headline information can be changed to the company’s name using the menu
setting/system ¤ System Name.
page 80 of 102
Version 1.8
DaTABANK™ User Manual
8.3.3. Save and load measurement results
The measurement data is stored in files managed by the archive database.
At start-up, each test is internally labelled with a specific Test-ID. Therefore similar names
can be used for discs from different orders.
Save test
Usually the decision whether results should be saved or not is made during the StartUp or
TestEnd dialogues. Measurement results can also be saved into the archive manually at any
time.
Click the symbol
in the toolbar or select File/Save test from the menu to display the
SaveTestWithOptions window. Select the Archive from the pull-down menu, edit
TestName and Documentations if necessary, and click OK to save the test.
page 81 of 102
Version 1.8
DaTABANK™ User Manual
Load test
Click the symbol
in the toolbar or select File/Load test from the menu to display the
Test Selection window.
Select the Archive from the pull-down menu and wait until DaTAVIEW™ has connected
to it. An animation will be running next to the pull-down menu until the connection has
been established. Once connected, a tick (as on the image above) will be displayed.
Enter a description of the stored test to speed up the search process. This can be done in the
left half of the Load/Delete Test window.
Click Search to list all matching tests from the archive in the right half of the Test
Selection window.
Select the test from this list and click Load to bring it up in DaTAVIEW™, or click Details
to view all information related to the test.
page 82 of 102
Version 1.8
DaTABANK™ User Manual
8.3.4. Export and Import of measurement results
In order to transfer (store, copy, e-mail, etc.) single or multiple sets of measurement
results/data instead of the whole archive database, the functions Export and Import from
the DaTAVIEW™ menu Archive can be used. The designated measurement data will be
stored into an external data file (.bin).
To get a statistical survey of any number of measurements in the archive database, use the
function Archive/Export statistic from the menu. This will export the data to an Excel (.xls)
or .csv file.
The measurement has first to be stored in an archive to be able to perform such a data
export.
Export
Export measurement data from an archive by selecting Archive/Export from the menu.
Select the Archive from the pull-down menu and wait until DaTAVIEW™ has connected
to it. An animation will be running next to the pull-down menu until the connection has
been established. Once connected, a tick (as on the image above) will be displayed.
Enter a description of the stored tests to speed up the search process. This can be done in
the left half of the window.
Click Search to list all matching tests from the archive in the right half of the Load Test
window.
Select all measurements to be exported (use cursor + CTRL or SHIFT for multiple
selections) and click the button Export.
page 83 of 102
Version 1.8
DaTABANK™ User Manual
The Save File dialogue, known from any other Windows application, will display and
prompt the user for the name and location of the exported file.
page 84 of 102
Version 1.8
DaTABANK™ User Manual
Import test
The exported measurement data can be imported again by selecting Archive/Import from
the menu. After importing, the measurement results can be viewed or printed out, or the
data can be re-attached to any of the available archives.
Use the folder icon in the top right hand corner of the window to browse for the file (.bin)
to be imported. After opening the file, all measurement results contained in that file will be
listed. Select the desired measurement results or click import all on the bottom, and finally
click OK.
page 85 of 102
Version 1.8
DaTABANK™ User Manual
Export of statistical test data
To export a statistical survey of measurements in the archive database, use the function
Archive/Export statistic from the menu.
Select an Archive from the pull-down menu, enter the search parameters and click the
Search button. Select all measurements that need to be exported at once (use cursor +
CTRL or SHIFT for multiple selections) and click Export Statistic to export the data to an
Excel (.xls) or .txt file.
Select a Export configuration (under Archive/Export configuration; including the selection
of exported items) from the pull-down menu and specify the output file format using the
tickboxes.
Exporting data to an Excel (.xls) file is possible only if MS Excel is installed on the System.
page 86 of 102
Version 1.8
DaTABANK™ User Manual
8.3.5. Trend charts
Select Archive/Trend charts from the menu to view the trend of certain signals over a
number of selected measurements.
Select the Archive containing the data from the pull-down menu. Set the Y-Axis Values by
clicking the Add button and defining the item of interest. If required, also set up the XAxis Value individually. Click the button Select Tests for Reporting to manually select all
tests which should be taken into consideration. Finally press Generate Trend Chart to bring
up the graph(s). Use the Save button if you want to save a Trend chart signal configuration.
In addition, you can save the settings by entering a configuration name and pressing the
save button. This means different Trend Chart configurations can be saved and directly
selected for the next evaluation.
8.3.6. Key data search
Select Archive/Key data search from the menu to search a selected number of recent tests
for certain aspects of one of the signals.
page 87 of 102
Version 1.8
DaTABANK™ User Manual
Select the Archive that contains the data from the pull-down menu. Select the Signal,
Position and the type of Value from the pull-down menus. Enter the search aspect - the
Limit value. Finally enter the number of recent tests to be taken into consideration and
click Search Tests to generate a table/graphical result. From the list it is also possible to
load a test directly (Load Test button) or show measurement details of a selected test
(Show Details button). The generated list can also be saved (Save List Data button).
Show Chart button:
A graph with recent results of the configured signal will be generated. The limit entered is
visible as horizontal line, which helps to easily judge the single results and the trend of the
signal. The Chart Data can also be saved.
8.3.7. Measurement data
All data is stored on the computer until the measurement is finished. After it is finished, or
every time a test is selected in DaTAVIEW™, the DCS Host copies all collected data.
The results will remain on the screen until the next test is started on the same driveCube™
or until File/Clear Test was selected from the menu.
page 88 of 102
Version 1.8
DaTABANK™ User Manual
8.4 Copy Protection
The current version of DaTAVIEW supports the following copy protection system:
► Rip Guard (Macrovision)
► ARccOS (Sony DADC)
To enable a system to measure copy protected discs, DaTARIUS has to be contacted to
obtain the corresponding license.
For Rip Guard there is a requirement for an additional separate licence file from
Macrovision.
Subsequently, DaTARIUS will provide a test sequence (for driveCubes™ and/or CS5
analyzers) to be used when measuring copy protected discs.
How to select copy protection within the start up dialogue:
A message will appear if there is/is no copy protection detected.
page 89 of 102
Version 1.8
DaTABANK™ User Manual
An example of a measurement with and without copy protection settings:
► Copy protection deactivated
► Copy protection activated
page 90 of 102
Version 1.8
DaTABANK™ User Manual
9. Calibration
DaTARIUS suggests running a calibration for each driveCube™ every second week.
Calibration needs to be done once in a while to keep the measurement results as accurate as
possible. The electrical signals are not perfectly constant over a longer period of time. In
order to compensate for the fluctuations, the raw electrical signals are compared to
reference values on a calibration disc, and factors and offsets for a calibration table are
calculated.
DaTARIUS has implemented the option to calibrate selected signals only, in order to avoid
time wasted on an unnecessary complete calibration.
page 91 of 102
Version 1.8
DaTABANK™ User Manual
Currently, the following reference-sets are available in DaTAVIEW™ version 1.8
Calibration Macro :
Calibration
discs :
Remarks :
DaTACube DVD5
Radius
D03R
for all media and
all driveCubes™
DaTACube Servo
D03R
for pre- and recorded media and
all Drive cubes (servo signals:
Radial1/Radial2)
DaTACube DVD5
D03R
for DVD5 in DVD ROM Cubes
DaTACube DVD9
DP02R
for DVD9 in DVD ROM Cubes
DaTACube DVD5 Philips SLSD
Philips SLSD
for DVD5 in DVD ROM Cubes
DaTACube DVD9 Philips DLSD
Philips DLSD
for DVD9 in DVD ROM Cubes
CS5 Radius
D03R
for all media and all CS5
analyzers
CS5 DVD5
D03R
for DVD5 in CS5 (1x/2x)
CS5 DVD9
DP02R
for DVD9 in CS5 (1x/2x)
CS5 DVD5 4x
D03R
for DVD5 in CS5 (4x)
CS5 DVD9 4x
DP02R
for DVD9 in CS5 (4x)
DaTACube DVD+R
D03R
for DVD5 in DVD REC Cubes
DaTACube DVD-R
D03R
for DVD5 in DVD REC Cubes
DaTACube DVD+R blank
Philips Signal
Test Disc
for DVD+R blank in DVD REC
Cubes
DaTACube DVD-R blank
DaTARIUS MRBxx Disc
for DVD-R blank in DVD REC
Cubes
page 92 of 102
Version 1.8
DaTABANK™ User Manual
9.1. Calibrating the driveCubes™
№1► Load the calibration disc into the driveCube™ to be calibrated.
№2► Wait until the driveCube™ has read the control data from the disc. The control data
will be visible under the tab Medium on the left side of the DaTAVIEW™ window as soon
as the driveCube™ is ready.
№3► Select Device/Calibration/Run from the DaTAVIEW™ menu.
(Example for ROM driveCube™ calibration)
Note: Depending on the selected device, only the corresponding cal files will be shown.
(So in case of a ROM driveCube™ calibration, no REC cal files will be visible)
(Example for REC driveCube™ calibration)
page 93 of 102
Version 1.8
DaTABANK™ User Manual
(Example for CS5 anaylzer calibration)
№4► Select the device to be calibrated from the list, select a Sequence list (reference set)
from the pull-down menu and click OK to start calibrating.
№5► When the Calibration Configuration window appears, select which signals need to
be calibrated in this process. This offers the option to calibrate single signals only.
page 94 of 102
Version 1.8
DaTABANK™ User Manual
9.2. Calibration Results
After the calibration is finished, the window Calibration Results will appear.
To view the current calibration parameters at any time, select the driveCube™ in the
SysView window and choose System/Calibration Results from the subsequent menu. This
will open the window Calibration Results which lists all calibrated signals.
The list at the top shows all signals where raw calibration data is available. The
information in the lower section is valid for the signal selected in this list.
To save the raw calibration data to a file (.cal) press Save Raw data and enter path and
filename. The file can be restored later, making it possible to switch back to a previous
calibration at any time. Press Load Raw data to restore raw calibration data from older
calibrations.
To use the calibration currently displayed in the Calibration Results window for measuring
on the driveCube™, press Save Cal Results.
By selecting Print, a Calibration Report will automatically be printed out.
page 95 of 102
Version 1.8
DaTABANK™ User Manual
9.3. Calibration Report
Select Device/Calibration/Report from the menu to open the Calibration Report window.
This displays a Calibration Report for the driveCube™ selected in the SysView
(driveCube™ overview window) of DaTABANK™. It is also possible to obtain the report
by entering the 4-digit DeviceID and clicking Get Calibration after opening this window.
The button Delete Calibration will delete the whole calibration table for this driveCube™.
Each signal that was calibrated on the selected driveCube™ will be listed in this
Calibration Report. Lines with the entry nil in the column Mode define that this signal
must be calibrated on this driveCube™, otherwise the message not calibrated will be
displayed during measurements. If signals are present more than once, individual
calibrations for different types of media are available. The column DiscType will indicate
the type of media.
Calibrations are always valid for the stated type of media and all sub-branches in the
hierarchy of media. The hierarchy can be found in the Limit editor, when selecting
Configuration/Limit editor from the DaTAVIEW™ menu. Of course, the most specific
calibration available will be used for measuring. If no specific calibration is available for
the measured type of media, calibration for the next available parent-class in the hierarchy
will be used.
page 96 of 102
Version 1.8
DaTABANK™ User Manual
9.4. Calibration History
To open the Calibration History window, select a driveCube™ in the SysView window
and choose Device/Calibration/History from the menu.
Calibration History shows a chronological list of calibrations for a single signal. Select the
Device/driveCube™ and the signal that should be listed. The current calibration and
previous calibrations for the signal will be shown. All calibrations which are currently in
used are marked by a tick ( ). It is possible to deactivate the calibration or to switch to one
of the previous calibrations in the list. Use the button Delete to delete the selected
calibration (will finally be deleted after clicking OK).
If the whole calibration (all signals) needs to be switched back to a previous version, use
the function Calibration Results which is mentioned in chapter 9.2. Calibration Results.
page 97 of 102
Version 1.8
DaTABANK™ User Manual
10. Download
DaTABANK™ is a modular system. It is essential that each component of DaTABANK™
can execute its designated tasks, independent from the other components. For this reason, it
is necessary to run individual software programs on each component.
“Download” means copying/installing software from the system hub computer onto one of
these components. The software of the components should always be synchronized after
installing a new version of DaTAVIEW™.
10.1. Firmware download
This type of download is used for driveCubeS™ and CS5 analyzers.
Select Device/Firmware download from the menu to open the necessary tool.
After some time, the software versions of all detected driveCubes™ and components will
be listed in this window. Press Download to automatically synchronize the software on the
components with the software running on the hub computer.
If certain software has to be copied to one of the components and it does not match the
current version of DaTAVIEW™, click on the lock symbol
at the bottom and on the
designated board to bring up a manual selection window.
page 98 of 102
Version 1.8
DaTABANK™ User Manual
Current versions
DaTAVIEW
1.7
DQ401D-2ES2
DQ401D-2ES3
DQ401R-1ES1
Cont45d (CS5)
Cont25d (CS5)
Digi4d (CS5)
Digi2d (CS5)
Ana21d
Ana2d
Tbe2d
Boot2d
D076
D102
D102
251.003
245.003
225.075
158.001
212.004
170.033
219.008
26
11. Update of DaTAVIEW
For DaTAVIEW updates, DaTARIUS provides access to a Server where the latest Version
can be downloaded (http://62.218.123.171/dataview/)
To get a valid username and password please contact our customer support
(hotline: +43 5672 206 206)
► Release Notes can be found under C:\DaTARIUS\Release.txt
page 99 of 102
Version 1.8
DaTABANK™ User Manual
Appendix - A. List of measured signals
DVD-ROM
Signal
PIE
PISum8
PIF
POF
ASY
DPDAmp
DPDAsy
FE
FO
HF-SNAP
I3H
I3L
I3M
I14H
I14Hmax
I14Hmin
I14Hdv
I14Hdvf
I14Hlv
I14Hlvf
I14Hrv
I14L
I14Lmax
I14Lmin
I14M
LongLand
LongPit
RES
TC
TCS
TPP
TPP-SNAP
TRP
RADIAL1
RADIAL2
RPP
RRO
RROraw
SL
SVY
ODDA
IDDA
Address
page 100 of 102
Description
Parity Inner Error
Parity Inner Error sum 8
Parity Inner Failure
Parity Outer Failure
Asymmetry
Differential Phase Tracking
Differential Phase Asymmetry
Focus Error
Focus Offset
HF Snapshot
I3 High
I3 Low
I3 Modulation
I14H
I14H max per Block
I14H min per Block
I14H variation per disc
I14H filtered variation per disc
I14H variation per layer
I14H filtered variation per layer
I14H variation per revolution
I14 Low
I14 Low max per Block
I14 Low min per Block
I14 Modulation
Long Land
Long Pit
Resolution
Tilt Compensation
Track Crossing Signal
Tangential Push Pull
TPP Snapshot
Track Pitch
Radial Error
Radial Noise
Radial Push Pull
Radial Run Out
Radial Run Out raw
Slicing Level
Scanning Velocity
End Diameter of Data Area
Start Diameter of Data Area
Sector address
Disc type
DVD
DVD
DVD
DVD
Disc
DVD
DVD
Disc
DVD
Disc
Disc
Disc
DVD
DVD
DVD
DVD
DVD
DVD
DVD
DVD
DVD
DVD
DVD
DVD
DVD
Disc
Disc
Disc
DVD
DVD
DVD
DVD
Disc
Disc
Disc
DVD
Disc
Disc
DVD
Disc
Disc
Disc
DVD
Method
closed
closed
closed
closed
closed
open
open
closed
comp
closed
closed
closed
closed
closed
closed
closed
closed
closed
closed
closed
closed
closed
closed
closed
closed
closed
closed
closed
comp
open
closed
closed
closed
closed
closed
open
closed
closed
comp
closed
closed
closed
closed
Version 1.8
Radius
Rotation
Rot Time
Sourceinfo
JC
JCHS
JC-HIST
JF
JF-HIST
JR
JR-HIST
DaTABANK™ User Manual
Radius
Rotations per Clock
Time per Rotation
Source Information
Jitter combined
Jitter Highspeed (4x)combined
Jitter combined histogram
Jitter falling
Jitter falling histogram
Jitter rising
Jitter rising histogram
Only available for CS5 Analyzers
HFDO
HF Dropout
Hflow
HF Low
Disc
Disc
Disc
Disc
DVD
DVD
DVD
DVD
DVD
DVD
DVD
closed
closed
closed
closed
closed
closed
closed
closed
closed
closed
closed
Disc
Disc
closed
closed
DVD±R(W)
Signal
ADER
AR
LBLER
BLEC
LPP-SNAP
LPP
NWO
PP
PPmax
PPmin
PPdv
PWP
RG
RGmax
RGmin
RGrv
RL
RPS
WCNR
WSNR
WO
WobbBeat
WOFFT
Description
ADIP Block Error Rate
Aperture Ratio
LPP Block Error Rate
LPP Block Error Count
LPP Snapshot
Land Pre Pit Signal
Normalized Wobble Signal
Push-Pull
Push-Pull maximum
Push-Pull minimum
Push-Pull disc variation
Phase between wobble and land pre-pit
Reflectivity Grove
Reflectivity Grove maximum
Reflectivity Grove minimum
Reflectivity Grove variation per revolution
Reflectivity Land
Radial Push-Pull amplitude
Carrier to Noise Ratio of Wobble
Signal to Noise Ratio of Wobble
Wobble Amplitude
Wobble Beat
Spectrum of Wobble Signal
Disc type
DVD+R(W)
DVD-R(W)
DVD-R(W)
DVD-R(W)
DVD-R(W)
DVD-R(W)
DVD Recordable
DVD Recordable
DVD Recordable
DVD Recordable
DVD Recordable
DVD-R(W)
DVD Recordable
DVD Recordable
DVD Recordable
DVD
DVD Recordable
DVD-R(W)
DVD-R(W)
DVD+R(W)
DVD Recordable
DVD Recordable
DVD Recordable
Method
closed
closed
closed
closed
closed
closed
closed
open
open
open
open
closed
open
open
open
closed
open
open
closed
closed
closed
closed
closed
page 101 of 102
Version 1.8
DaTABANK™ User Manual
Appendix - B. Glossary of terms
DaTAHUB
Control unit in the DaTABANK™ system
DaTASTATION
Measurement unit in the DaTABANK™ system
driveCube™
Module containing the drive unit with pickup head
DCS Host
DaTARIUS Computer System - Host computer
DCS Slave
DaTARIUS Computer System - Slave computer
LAN
Local Area Network
page 102 of 102