Download Performance Sentry User Manual

Transcript
Performance Sentry
User Manual
VERSION 4.0
Use with
Windows Server 2003, 2008 and newer
Windows XP, windows 7 and newer
Copyright Information
This document constitutes a proprietary development and a valuable work
product in the form of trade secrets, know-how, and confidential information
which is the exclusive property of DEMAND TECHNOLOGY
SOFTWARE, INC. The user shall prevent the disclosure of or access to the
contents thereof by agents, employees, or representatives of the user to any
parties outside the user’s organization. It shall be given the same protection
which the user gives his own confidential material at all times.
This document was prepared to assist users of NTSMF and Performance
Sentry, products of DEMAND TECHNOLOGY SOFTWARE, INC. The
contents of this document may not be used for any other purpose without
written permission. The material contained herein is supplied without
representation or warranty of any kind. DEMAND TECHNOLOGY
SOFTWARE, INC., therefore assumes no responsibility and shall have no
liability of any kind arising from the supply or use of this document or the
material contained herein.
This document is an unpublished work fully protected by the United States
copyright laws and is considered a trade secret belonging to the copyright holder,
DEMAND TECHNOLOGY SOFTWARE, INC.
All rights reserved. This document, in whole or in part, may not be reproduced
or transmitted in any form or by any means without the express prior written
consent of DEMAND TECHNOLOGY SOFTWARE, INC.
NTSMF™ and Performance Sentry are registered trademarks of DEMAND
TECHNOLOGY SOFTWARE, INC.
All other brand and product names are trademarks or registered trademarks of
their respective companies.
© 2001-2012 DEMAND TECHNOLOGY SOFTWARE, INC. Printed in
the United States of America.
Table of Contents
INTRODUCTION .............................................................. 1
Prerequisites ................................................................................. 2
Performance Sentry Overview......................................................... 3
The Performance Sentry Data Collection Service ................................................... 3
Unattended Operations ....................................................................................... 4
Detailed and Summarized Data .......................................................................... 4
Filtering ............................................................................................................... 5
Alerting................................................................................................................ 5
The Performance Sentry Automation Interface ...................................................... 5
The Performance Sentry Data Summarization Utility ............................................ 6
Sentry Administration.............................................................................................. 6
Windows Server Performance Monitoring ....................................... 7
Performance Monitoring Overhead......................................................................... 8
Instrumentation Overhead .................................................................................. 8
Data Collection Overhead................................................................................... 8
Post-Processing Overhead................................................................................... 9
Collection Interval ............................................................................................. 10
Filters................................................................................................................. 10
Threads.............................................................................................................. 10
“Costly” Objects................................................................................................. 11
Processes ............................................................................................................ 11
INSTALLATION AND OPERATION .............................. 13
Installation Procedures ................................................................ 14
Run the Setup Executable...................................................................................... 15
Upgrading from an Older Version ......................................................................... 15
Manually Installing the Collection Service ............................................................ 17
Collection Service Initialization ................................................... 20
Locating the Data Collection Set Definition......................................................... 21
Validating the DCS Definition ............................................................................. 22
Security Considerations ......................................................................................... 22
Collection Service Operation ....................................................... 23
Discovery................................................................................................................ 24
Interval Data Collection......................................................................................... 24
Collection Cycles ................................................................................................... 25
Automating Collection Cycle End Processing ...................................................... 26
Processing Multiple Files................................................................................... 27
Using FTP ......................................................................................................... 27
Summarization Utility............................................................................................ 28
Stopping Data Collection ...................................................................................... 30
iv
Performance Sentry User Manual
Contents
Automation Interface............................................................................................. 31
Collection Service Files.......................................................................................... 32
Using SMS for Installation ........................................................... 33
PERFORMANCE SENTRY ADMINISTRATION ............ 34
Data Collection Sets .................................................................... 36
DCS Configuration Panel ..................................................................................... 37
DCS List Panel...................................................................................................... 38
Default Collection Set ....................................................................................... 38
Activating a DCS .............................................................................................. 38
Creating a new DCS ......................................................................................... 39
DCS Information Panel......................................................................................... 39
Object Definition................................................................................................... 40
Counter Definition ................................................................................................ 41
Filter Definition..................................................................................................... 42
Filter Templates................................................................................................. 42
Filter Editing ..................................................................................................... 43
Alerts...................................................................................................................... 43
Alert Definition ................................................................................................. 44
Alert Transition ................................................................................................. 44
Alert Recipients ................................................................................................. 45
SMTP Configuration ............................................................................................ 46
DCS Properties...................................................................................................... 47
DCS Exporting and Importing.............................................................................. 48
Machine Management ........................................................................................... 48
Activating a Collection Set................................................................................ 49
Deactivating a Collect Set ................................................................................. 49
Suspending & then Resuming Performance Sentry Collection Service ............ 49
Collection Service Status ................................................................................... 49
Refreshing the Machine List ............................................................................. 49
Master Collection Set .................................................................. 50
Master Data Set Objects........................................................................................ 50
Adding Objects to the Master Collection Set........................................................ 50
Pattern Objects ...................................................................................................... 51
SQL Server Performance Objects.......................................................................... 51
Adding a Pattern Object to the Master Data Collection Set................................. 51
Removing Objects from the Master Data Collection Set...................................... 52
Demand Technology Updates ............................................................................... 52
Data Migration ........................................................................... 52
Converting Exported Data Collection Sets ........................................................... 52
Running DCSMigrationTool............................................................................ 53
Command Line Parameters ................................................................................... 53
Retiring Objects ..................................................................................................... 53
RUNTIME PARAMETERS REFERENCE ........................ 54
Current Parameter Values ............................................................ 55
v
Performance Sentry User Manual
Contents
Startup Parameter Values ............................................................. 56
Collection Cycle..................................................................................................... 56
Cycle Hour (default 3)....................................................................................... 56
Cycle Duration (default 24)............................................................................... 56
Cycle End Command........................................................................................ 56
Run Command only at Cycle Hour? (default Yes)............................................ 60
Cycle End Command Launch (default Immediately) ....................................... 60
Collection Service Error Command .................................................................. 60
Collection Interval Length (MM SS) (default 1 minute).................................. 60
Start Marker Seconds (default 0)....................................................................... 60
Wait for Perflib DLLs to Initialize (default 60 seconds) .................................. 61
Scheduling .................................................................................. 62
Next DCS.......................................................................................................... 63
Collection Period............................................................................................... 64
Interval Priority Boost (default High Priority) .................................................. 64
File Contents .............................................................................. 65
Write Discovery Records? (default Yes) ................................................................ 66
Discovery Record Type (default 5,6) ..................................................................... 67
Discovery Objects (default Existing) ..................................................................... 67
Configuration Records........................................................................................... 67
Include Active Filter Description Records (default Yes)................................... 67
Include Disk Configuration Records (default Yes) ........................................... 67
Include Registry Key Values .............................................................................. 68
Data Records.......................................................................................................... 69
Header Format (default Compressed) ............................................................... 69
Data File Delimiter (default Comma)............................................................... 69
Truncate CPU Utilization at 100% for Systems with Multiple CPUs (default
No)..................................................................................................................... 69
Suppress Writing Total Records? (default Yes)................................................. 69
Collect data for New Objects? (default No) ...................................................... 70
Write Windows NT 4.0 compatible fields? (default Yes) ................................. 70
Write Denominator Counters? (default Yes) .................................................... 70
File Management ........................................................................ 71
Folder Where SMF Files are Stored (default “Data”) ........................................... 71
Free Space Threshold (Disk Limit Checking) ...................................................... 72
Data File Sharing (default Shared) ........................................................................ 73
PKZIP Compression ............................................................................................. 73
Data File Name...................................................................................................... 74
File Name Qualifier Separator (default Period) ................................................ 74
Data File Year Indicator (default Four Digit Year)........................................... 74
Data File Custom Qualifier (default Null) ........................................................ 74
Automatic File Management (default Hierarchical )............................................. 74
Hierarchical file management............................................................................ 75
Messaging................................................................................... 75
Message Reporting Level (default Information and Warning) ............................. 76
Event Logging (default Yes).............................................................................. 77
Log File Attributes ................................................................................................ 77
Create an NTSMF.log (ASCII) message file? (default Yes)............................. 77
Log File Size Limit (default 256 KB)................................................................ 77
vi
Performance Sentry User Manual
Contents
Log File Age Limit (default 7 days) .................................................................. 78
What To Do When You Encounter New Objects and Counters ....... 78
Adding Objects to the Master Collection Set........................................................ 78
Pattern Objects ...................................................................................................... 79
SQL Server Performance Objects.......................................................................... 79
Adding a Pattern Object to the Master Data Collection Set................................. 80
Removing Objects from the Master Data Collection Set...................................... 81
Demand Technology Updates ............................................................................... 81
FILTERS .......................................................................... 82
Filtering Output Records ............................................................. 84
Process Filters ........................................................................................................ 84
Process Busy Threshold..................................................................................... 84
Process Working Set Threshold........................................................................ 84
Private Bytes Threshold..................................................................................... 84
Process Availability Override............................................................................. 85
Module Filter ......................................................................................................... 86
Module Filters ................................................................................................... 87
Thread Filters......................................................................................................... 89
Thread State Ready ........................................................................................... 89
Thread Wait State Reason ................................................................................ 89
Process Busy Threshold Threads....................................................................... 90
Disk Filters............................................................................................................. 91
Logical Disk Transfer Threshold ...................................................................... 91
Physical Disk Transfer Threshold ..................................................................... 91
SQL Server Filters ................................................................................................. 91
SQL Database Transactions Threshold ............................................................ 91
SQL Statistics Threshold .................................................................................. 91
SQL Buffer Manager Threshold ....................................................................... 91
SQL Cache Manager Threshold ....................................................................... 92
SQL Locks Threshold....................................................................................... 92
SQL Buffer Partition Threshold ....................................................................... 92
SQL User Settable Threshold ........................................................................... 92
Web Filters ............................................................................................................ 92
Web Service Get Request Threshold ................................................................ 92
Web Service Bytes Received Threshold ............................................................ 92
Other Filters........................................................................................................... 92
Print Queue Bytes Printed Threshold ............................................................... 92
Network Interface Total Bytes Threshold......................................................... 93
Built-In Filters ....................................................................................................... 93
Suppress Idle Process......................................................................................... 93
Total Instance .................................................................................................... 93
ALERTS ........................................................................... 94
Alert Definition ..................................................................................................... 95
Alert Severity ..................................................................................................... 95
Alert Transition ..................................................................................................... 95
State Transition Types........................................................................................... 96
Rearm Limits ......................................................................................................... 96
Alert Recipients ..................................................................................................... 96
vii
Performance Sentry User Manual
Contents
SMTP Configuration ............................................................................................ 98
UTILITIES ....................................................................... 99
Cycle End Command Processing................................................... 99
Scripts................................................................................................................... 100
Testing Cycle End Command Scripts ................................................................. 100
File Management............................................................................................. 102
Processing Multiple Files................................................................................. 103
Cycle End Command Syntax............................................................................... 103
Keyword Variables in Cycle End Commands and Scripts................................... 104
Cycle End Command Examples ..................................................................... 105
Cycle End Command Usage Notes................................................................. 106
Performance Sentry Data Summarization Utility .......................... 107
How Counter Data is Summarized ..................................................................... 108
Data Smoothing .............................................................................................. 108
Peak Values for Peak Counters........................................................................ 111
Summarizing During Cycle End Processing ....................................................... 112
Historical Roll-up Files........................................................................................ 113
Processing Multiple Files................................................................................. 113
Daily, Weekly, Monthly Historical Roll-up Example (CycleEnd.bat) ........... 114
Cycle End Summarization Example ............................................................... 116
Usage Notes..................................................................................................... 117
Command Syntax ............................................................................................ 117
Data Folder Usage ........................................................................................... 118
Automation Interface................................................................. 119
Networking Support ............................................................................................ 119
Assign or Refresh a DCS Definition ................................................................... 120
Assign or Update User Account/Password .......................................................... 120
Command Syntax ............................................................................................ 120
Switch DCS Definition Files .......................................................................... 121
Suspend/Resume Data Collection................................................................... 122
Status Command ............................................................................................. 122
Error Messages ................................................................................................ 123
Return Codes ....................................................................................................... 124
Return Codes................................................................................................... 124
Extended Return Codes .................................................................................. 125
Example........................................................................................................... 125
APPENDIX A - RECORD FORMAT ...............................126
Record Types ............................................................................ 126
Discovery Records................................................................................................ 127
Data Records........................................................................................................ 127
Alert Event Records............................................................................................. 128
Alert Discovery Record ................................................................................... 128
Alert Data Record ........................................................................................... 128
Configuration Records......................................................................................... 128
Computer Configuration Record......................................................................... 128
Active Filter Records ........................................................................................... 129
viii
Performance Sentry User Manual
Contents
Alert Recipient Configuration Records ............................................................... 130
Discovery Record............................................................................................. 130
Disk Configuration Records ................................................................................ 130
Registry Value Records ........................................................................................ 130
Interval Records ................................................................................................... 131
Performance Counter Types ....................................................... 131
Raw or Instantaneous Counters........................................................................... 132
Difference Counters............................................................................................. 133
Time Difference Counters ................................................................................... 133
Time Difference Inverse Counters....................................................................... 134
Disk Service Time, Response Time, and Utilization........................................... 134
Compound Counter Types .................................................................................. 136
Processing the Performance Sentry Record Header....................... 136
Original Header Format ...................................................................................... 137
Compressed Header Format................................................................................ 137
Object Instances................................................................................................... 138
How Performance Sentry Tells Time........................................... 141
Interval Data Records ................................................................ 142
APPENDIX B - COLLECTION SETS ..............................143
Master Collection Set ................................................................ 143
Default Collection Set ............................................................... 143
Exchange Server Starter Set ........................................................ 144
File Server Starter Set ................................................................ 144
IIS and ASP Starter Set.............................................................. 144
PDC with Active Directory ........................................................ 144
SQL Server Starter Set............................................................... 144
TCP/IP v6 Starter Set................................................................ 145
Terminal Service Server Starter Set ............................................. 145
VMware Collection Set .............................................................. 145
ix
1
Introduction
tm
Thank you for your interest in Performance Sentry , the Windows Server performance data
collector designed for professionals. Your support and assistance is greatly appreciated.
Performance Sentry is a Windows Server performance data collector designed to work with a
variety of performance reporting tools, including Demand Technology’s Performance Sentry
Portal, SAS-based Merrills eXpanded Guide (MXG), available from Merrill Consultants and IT
Resource Management (ITRM), available from SAS Institute. For users of SAS-based reporting
tm
tools, Performance Sentry is also known as NTSMF and was originally marketed as
“Mainframe-like” SMF data from Windows NT.
Performance Sentry collects a variety of Windows Server performance objects and their
associated counters using standard API calls. It calculates counter values based on the counter
type and writes them on a periodic basis to an ASCII format, comma delimited data file that can
be processed by reporting systems like Performance Sentry Portal, MXG, and IT Resource
Management. Appendix A of this document describes the format of the Performance Sentry data
files. The information in Appendix A will be of interest to anyone who needs to process
Performance Sentry collection data directly outside of the packages referenced above.
Performance Sentry consists of two main components:
tm
1. the Performance Sentry Collection Service, which runs on the Windows servers you wish to
monitor, and
tm
2. the Performance Sentry Administration component, a Windows compliant .NET program
which is used to define, assign, and activate the set of collection parameters that the
Collection Service uses.
Two additional components are the Automation Interface, a program that can be used to query
and control the Collection Service, and the Performance Sentry data Summarization Utility.
1
Performance Sentry User Manual
Introduction
The Performance Sentry Collection Service is intended to execute continuously on any Windows
Server you wish to monitor. It runs as a service, and, by default, is set to run from system start-up
to shutdown. Every aspect of the operation of the Performance Sentry Collection Service is
designed to be automated so that you can use the program to monitor a large number of
machines easily and effectively. You will find that it is easy to set up the Performance Sentry
Collection Service to monitor even the largest and most complicated environments. Using an
intelligent filtering mechanism, which you control, you can monitor the performance of a
Windows Server with a great level of detail and precision. Because Performance Sentry is always
running, when problems occur, you can be assured that you have the information necessary to
resolve them.
By design, individual copies of the Performance Sentry Collection Service run independently,
both of each other, and of the Sentry Administration program. This distributed processing
architecture provides superior scalability, allowing you to manage even the largest Windows
Server networks effectively. Administration of a large number of collectors is normally performed
using scripts that utilize the Automation Interface.
Throughout this document we will refer to a machine where the Collection Service is running as
a managed node. The Sentry Administration program is used to communicate with the Collection
Services that are installed and running on the managed nodes in your environment. Because
managed nodes are autonomous, each individual machine that is running the Performance Sentry
Collection Service can be administered separately. Changes that you make using the Sentry
Administration program to modify the data collection parameters that are in effect on any
managed node across your network are not passed to the Collection Service until you explicitly
notify the service itself. You can use the Notify function of the Sentry Administration program to
modify the collection parameters on any managed node individually at any time. You also can
make a change in the collection parameters in effect across a large number of managed nodes
with a script that calls the Automation Interface’s Notify function.
Chapter 2 of this manual describes Performance Sentry installation and operating procedures. It
also documents the Automation Interface and the data Summarization Utility. Chapter 2 also
discusses facilities used to deploy Performance Sentry effectively across a large network of
Windows Servers. Chapter 3 describes the operation of the Sentry Administration program.
Chapter 4 serves as a reference manual that describes each of the runtime parameters that
controls the operation of the Performance Sentry Collection Service. Chapter 5 describes the
filtering options which are designed to reduce the volume of information written to the collection
files. Chapter 6 documents the steps to configure Alerts and how to customize Alert warning
messages. Chapter 7 documents the utility programs associated with Performance Sentry — the
Automation Interface and the Summarization Utility.
Prerequisites
The Performance Sentry Collection Service will operate on all servers running Windows 2000
Server with Service Pack (SP) 4 and Windows Server 2003 and above, and also on computers
running Windows 7. It functions identically on machines running Windows Server and
Windows 7. Performance Sentry Administration runs on Windows Server or Windows 7.
2
Performance Sentry User Manual
Introduction
Performance Sentry Overview
Performance Sentry is designed for ease of administration across large networks of Windows
Servers. Using Performance Sentry, you can monitor the performance of computers running both
Windows Server and Windows 7.
Performance Sentry consists of several executable programs, including DMPerfss.exe,
DmCmd.exe, DMSumSMF.exe, and Sentry Administration.exe, plus a number of
additional files. Respectively, these executables represent the Performance Sentry Collection
Service, the Automation Interface, the Summarization Utility and the Administration program’s
user interface for controlling the operation of the Collection Service across your network.
Performance Sentry is a distributed application where each Collection Service running on a
managed node is autonomous. Each Collection Service operates independently based on
instructions in an assigned Data Collection Set or DCS. When you need to change the status of
the Collection Service, the Sentry Administration program can communicate with the Collection
Service in real time using standard Microsoft networking protocols. Normally, this
communication only occurs when you specifically make a request using the built-in Network
Browser to assign a new DCS. Unless you specifically assign a new set of data collection
instructions using the Network Browser or the Automation Interface, the Collection Service
continues to operate on its current set of assigned run-time parameters.
The performance data that Performance Sentry collects on an interval basis is derived from the
same data collection interfaces that the Microsoft Windows Server System Monitor (Sysmon,
also known as Perfmon) uses. The data elements are also largely identical to Sysmon, except for
specific improvements that are made to make it easier to process this data using third party
products like SAS and MXG. In addition to collecting standard performance metrics on an
interval basis, Performance Sentry creates separate Configuration records which describe the
computer environment. The information provided in the Configuration records is derived
primarily from the Windows Server Registry.
Performance Sentry runs unattended as a service, creates a comma-delimited ASCII log file that
can be processed by other reporting programs, automatically spins off log files at regularly
scheduled intervals, and collects only the Windows Server performance objects and counters you
specify. This makes it suitable for monitoring large scale servers, along with individual desktops
and workstations running the Windows operating system. Performance Sentry allows you to
collect and process fine-grained Windows performance data with a minimum of overhead. The
Performance Sentry data collection file format was also designed to make it possible to
consolidate data from many different computers into a single data file for post-processing.
The Performance Sentry Data Collection Service
The executable module DMPerfss.exe is the Collection engine. Throughout this manual it is
referred to as the Collection Service. It runs unattended as the Performance Sentry service on the
computer being monitored and has no user interface. Like any other well-behaved Windows
service, you can start and stop Performance Sentry using the Service Control Manager. (The
most familiar Service Control Manager interface is the Services application under the
Administrative Tools menu in Windows Server.) You can also use the net start Performance
Sentry and net stop Performance Sentry commands to start and stop the Collection
Service.
3
Performance Sentry User Manual
Introduction
The Performance Sentry Collection Service gathers performance counter data from the Windows
Server operating system and writes it to the Performance Sentry collection file. In a production
environment, Performance Sentry is designed to start automatically and run unattended. The
Performance Sentry Collection Service will operate on servers running Windows 2000 Server
with Service Pack (SP) 4 and above, and also on computers running Windows 7.
The Collection Service collects data for just the performance objects and counters you specify at
regularly scheduled intervals. Following installation, the Performance Sentry Collection Service
starts automatically and collects data continuously in unattended mode.
The Collection Service creates data collection files automatically, generating unique names of the
form systemname.yyyymmddhhmmcustomqualifier.smf. At regular intervals, the Collection Service
closes the current data collection file and opens a new one. The older data collection file becomes
immediately available for processing. This process is repeated at the end of each collection cycle.
You specify when a collection cycle begins and the duration of each cycle. You also specify the
processing you want performed (such as transferring the collection file to a shared folder for
consolidation and further processing) at each collection cycle end. The Collection Service also
manages all local copies of the collection files it generates in a hierarchical folder structure, aging
the files according to the file management parameters you specify.
At the end of each collection cycle, you will typically summarize and copy the .smf data
collection file to some other location where it is consolidated with other collection files and
processed to update a performance database. After it has been created, the Collection Service’s
file management capabilities automatically age the collection files stored on the local system and
ultimately delete them, all according to your specifications. The Collection Service can share the
active collection file with other applications that want to process data from the current collection
interval. For best results, we recommend you make a copy of the active collection file before
processing it outside your normal nightly performance database update using a reporting
application like the Performance Sentry Portal and SAS.
Unattended Operations
The Performance Sentry Collection Service is designed to operate unattended. For more effective
deployment across your Windows Server network, the Performance Sentry Collection Service
includes built-in scheduling facilities. Using the built-in scheduling facilities of the Collection
Service, you set up automated collection cycles that control what data is collected and how
frequently it is collected. It also supports an Automation Interface that makes it possible to fully
control the operation of the service using a Command line interface, a .bat command file, PERL
script or a program written in any other scripting language. Using Performance Sentry’s built-in
scheduling component, you can adjust collection parameters based on the time of day and/or the
day of the week. You can further automate the operation of the Performance Sentry Collection
Service based on the time of day or other events by using it in conjunction with a scheduling
facility like the built-in Windows Server Scheduling service. In addition, Performance Sentry
generates Server Application Event Log entries, which can be passed to standard third party
automated operations packages like the Microsoft’s System Center Operations Manager.
Detailed and Summarized Data
For enhanced data management, the Performance Sentry Collection Service also provides a data
Summarization Utility that is used to summarize detailed collection data files prior to
transmitting them for further processing by third-party packages like MXG and SAS ITRM.
4
Performance Sentry User Manual
Introduction
Fine-grained data collection intervals of one minute or less support detailed problem diagnosis
and resolution. Such a fine-grained view of system and network activity is not necessary to
support capacity planning, which works with aggregated measurements captured over longer
intervals of weeks, months, and years. The Summarization Utility allows Performance Sentry to
produce measurement data that supports both detailed problem analysis and longer term capacity
planning without compromising either objective. The Summarization Utility is designed to be
invoked during normal collection Cycle End processing. It can be used to reduce significantly the
amount of performance data that is transmitted back across the network and processed for daily
insertion in a centralized repository of performance data.
Another useful data management facility is a built-in option to compress data files using PKZip
prior to transmission.
Filtering
The Performance Sentry Collection Service is an intelligent service that runs unattended on the
machines you want to measure and monitor. There is a substantial amount of performance
measurement data that is potentially available on typical Windows servers and workstations. It is
not desirable to collect all the data that is available all the time. Collection sets tailored to your
environment can be defined and assigned to the Collection Service. An intelligent filtering
mechanism is also provided that restricts the quantity of data records in the data collection file
according to filtering criteria that you specify. This flexible filtering mechanism enables you to
collect Windows Process and Thread level detailed data, for example, without causing the
collection file to swell up with largely superfluous or insignificant measurement data. The
reduced file size means less transfer time across the network and less processing time at its final
destination.
Alerting
The Performance Sentry Collection Service has a built-in alerting mechanism which allows
administrator to monitor events on Windows servers and workstations. A default set of alerts is
installed with the Collection Service for significant events based upon common performance
counter ranges. Alerts become triggered if an event occurs for a specified amount of time or a
specified number of intervals. Alert recipients receive notifications of alert events once an alert
has become triggered. Both the Windows event log and/or an email address can be set up as alert
recipients. Once an event occurs for a specified number of times within a specific time window,
the alert notification is automatically suppressed. When the specified time window elapses, the
alert is rearmed and the alert will cycle again. The re-arm limit is used to prevent excessive alert
notifications. The parameters that control the alert notification cycle are set using Performance
Sentry Administration for each data collection set.
The Performance Sentry Automation Interface
The DmCmd.exe program provides an external Automation Interface to the Performance
Sentry Collection Service. The Automation Interface allows you to change the parameters the
Collection Service uses based on time of day or any other event using a command, command file,
or script. Using automation, you can change the amount of information you want to collect and
how often you want to collect it. You can also suspend data collection at a specified time and
then resume collecting data when you are ready.
5
Performance Sentry User Manual
Introduction
The Performance Sentry Data Summarization Utility
Summarization reduces file size and means less transfer time across the network and less
processing time at the collection file’s final destination.
The Performance Sentry data Summarization Utility is a utility program named
DMSumSMF.exe. The DMSumSMF.exe utility program is designed to be executed during
Cycle End processing, either directly or as part of a Cycle End command script. It can also be
run from a batch or script file launched using a separate scheduling facility. DMSumSMF.exe is
designed to consolidate collection files prior to processing by a third party package. You can
collect, for instance, detailed performance measurements every minute, but then invoke
DMSumSMF.exe to create a summarized file with fifteen, thirty or sixty minute intervals for
data transfer and processing by a third party package. DMSumSMF.exe correctly and accurately
summarizes those counter types that measure activity rates, which are the most common form of
measurement data available.
The summarized file created uses the detail file name with the token .sum placed just before the
.smf extension (systemname.yyyymmddhhmmcustomqualifier.sum.smf). The summarized file has
exactly the same record format as the detail file, and may be processed using the same reporting
systems. Both the detail and summarized files are aged through the \data folder hierarchy using
the same file management parameters as the detail file. Summarization further reduces file size
and means even less transfer time across the network and even less processing time at its final
destination.
Sentry Administration
The Sentry Administration program is the user interface that allows you to specify the
parameters the Performance Sentry data Collection Service uses. These parameters:
•
define what data, i.e., the Windows Server objects and counters, you want to
collect,
• specify how frequently you want to collect the data, along with other run-time
parameters,
specify the filters that are used to manage the volume of information written to the data
files, and
configure and create alerts to monitor system events and notify alert recipients.
Collectively, these specifications are known as a Data Collection Set or DCS. The Data
Collection Set specifications are stored in an XML file format with an extension of DCSX. The
DCSX files can be delivered to many machines using a distribution facility like Microsoft’s
System Management Server. Techniques for rolling out the Collection Service to a large number
of machines are discussed in Chapter 2 of this manual.
The Sentry Administration program is used to define, edit, and update Data Collection Set
(DCS) definitions. The core function provided by the Sentry Administration is also known as the
DCS Administration. A second component of Sentry Administration is Machine
Management, which is similar in style and function to the Microsoft My Network Places
application. The Machine Management component allows you to explore the Microsoft
Windows Network, find the Windows Servers and workstations that are connected to it,
communicate to the Performance Sentry Collection Service running on those machines, and
control the operation of the service. The Administration component allows the user to create
subsets of the Master Collection Set that contains performance counter definitions for all known
6
Performance Sentry User Manual
Introduction
Windows performance counters. This performance data definition facility, known as the DCS
Editor, is used to tell the Collection Service what performance data to gather regularly.
The Machine Management capabilities of the Sentry Administration program allow you to
monitor and change the status of performance data collection running on computers in your
network. You can communicate directly with machines where the Collection Service is installed
and running. When managing a network of Performance Sentry Collection Services, it is
important to realize that the Sentry Administration program runs independently of the
Collection Service. You can send messages to the Collection Service and retrieve the status of
data collection, but the Sentry Administration program is not in continuous communication with
the Collection Service. When you make a change to a Data Collection Set using the DCS
Editor, for example, this change is not automatically propagated to the Performance Sentry
Collection Services that are running with that DCS definition. You must explicitly update the
DCS definition assigned to each individual copy of the Collection Service and notify the
Collection Service that a change has occurred in order to activate the changes you have specified.
The Administration capabilities of the Sentry Administration program allow you to browse the
network for machines to discover new objects to extend the Master Collection Set. Once the
newly discovered objects and counters are added to the Master Collection Set, they can be added
to other Data Collection Sets using the DCS Editor.
Windows Server Performance Monitoring
Windows Server is extensively instrumented. It is designed to automatically count events of
interest in performance monitoring. The Windows Server performance data is structured as a
series of objects (records) and counters (fields). These objects and counters are then made
available to performance monitoring applications like System Monitor and Performance Sentry
through standard Windows API calls.
All machines running Windows operating systems are capable of providing detailed performance
data that is useful in understanding how they are functioning. Hardware interfaces to the CPU,
the disks, and memory are instrumented in Windows Server to supply feedback on how these
hardware resources are utilized. Windows Server performance instrumentation includes
information on resource utilization at the system level or at a more detailed level for individual
Processes and Threads running on the machine.
This performance information is organized into logically-related aggregates called objects, which
themselves contain numerical fields called counters. Many counters are based on instrumentation
embedded into the Windows Server operating system that count important events — for
example, the number of times a disk is accessed, or the number of virtual memory page faults —
as they occur. The Windows API interface to the Windows Server performance data allows
applications like the Performance Sentry Collection Service to access this measurement data. The
Windows performance monitoring interface is extensible, allowing additional Windows Server
components such as MS SQL Server, MS Exchange Server, MS Internet Information Server,
and .Net framework applications to add a wide variety of application-specific performance
objects. This is especially useful because application-oriented measurements taken by Web
services applications, SQL Server, and Exchange are synchronized with the operating system’s
view of system activity. The objects and counters installed and available on every Windows Server
machine are known as the base counters. Objects and counters installed by other Server
components and subsystems are known as extended counters. The Performance Sentry
Collection Service can be used to gather information from both base Windows Server system and
networking counters and extended application-oriented counters.
7
Performance Sentry User Manual
Introduction
Appendix A documents the performance data collection file format, including a more complete
description of how various Windows Server performance data objects and counters are
implemented. For the current, up-to-date information about the objects and counters available
for collection, you should always access our web site at www.demandtech.com. Appendix B of
this manual describes the pre-defined collection sets distributed with Performance Sentry.
Performance Monitoring Overhead
Performance monitoring designed to diagnose problems should not contribute to the problems
by using resources in high demand. Consequently, the overhead of performance monitoring is an
important concern. Understanding how much resource usage is associated with Windows Server
performance monitoring is not a simple question. It is best answered by breaking overhead
considerations into three separate areas. The three overhead categories are the following: (1) the
overhead of instrumentation, (2) the overhead of collection, and (3) the overhead of processing
the data collected.
Instrumentation Overhead
The overhead of instrumentation refers to the system resources used in collecting Server
performance measurements as they occur. The overhead of collecting both base and extended
counters is generally built into Windows Server. This overhead occurs whether or not there is a
performance monitoring application like Performance Sentry that requests the collected
information. For example, Windows Server provides instrumentation that continuously keeps
track of which processes are using the CPU and for how long. This instrumentation is integral to
the operating system. It cannot be turned off. Consequently, the overhead involved in making
these measurements cannot be avoided.
The developers of Microsoft Windows Server are concerned with these inherent overhead issues
and have taken steps to allow you some degree of control over the amount of overhead that
measurement consumes automatically. In particular, instrumentation in the network drivers to
collect measurement data is optional because there can be relatively high overhead associated with
collecting the measurement data.
Data Collection Overhead
While there is normally very little that can be done about the overhead associated with Windows
Server’s performance instrumentation, you do have broad latitude using Performance Sentry to
determine how much overhead is consumed in collecting and processing Windows Server
performance counters. Performance Sentry is designed so that you can manage Windows Server
performance data collection and processing very efficiently and effectively. For example,
Performance Sentry’s Collection Service runs unattended and has very little overhead associated
with it. Unlike System Monitor, for example, there is no GUI, which saves on resources.
Moreover, the Performance Sentry Collection Service has been engineered to ensure that you can
gather the data you need to manage a Windows Server production system at an acceptable
overhead level. Collecting performance data at one minute intervals — the default collection
interval — you can expect that the Performance Sentry Collection Service will consume less than
1% overall CPU busy of a single processor engine.
8
Performance Sentry User Manual
Introduction
Naturally, there is some overhead associated with the Windows Server services that are invoked
to perform the actual data collection. There is a specific internal Perflib DLL program associated
with each specific performance data object. Each performance data object requires a separate call
to its associated Perflib program. You can minimize the amount of collection overhead by
limiting the number of objects you collect. The exception to this rule is for objects which are
collected together with a single call to the appropriate Perflib program. For example, data
collection for Thread data automatically collects information on all Process objects at the same
time.
There is more overhead associated with collecting some data objects than others. Detailed
Thread level data, for example, requires more processing than collecting simple high-level System
information. Keep in mind that because Thread objects are in a parent-child relationship with
the Process objects, collecting information on Processes involves collecting Thread data
automatically at the same time. If you are really concerned about measurement overhead, do not
collect any Process or Thread data. The problem with doing this, however, is if there is a
performance problem, you will not have collected any information about what applications were
running at the time.
As a compromise, you probably will want to collect Process and Thread object statistics, but
probably not as frequently as you would like in an ideal world. Collecting more frequent
performance samples increases the load on the system. Performance Sentry allows you to collect
performance samples as frequently as once per second, but be aware that increasing the rate of
collection has a direct impact on overhead.
For more information on Windows Server performance monitoring, see the Windows Server
Resource Kit volume named “Performance Guide.”
Post-Processing Overhead
Performance Sentry was designed to support enterprise capacity planning that would scale
effectively across large numbers of Windows Server machines. In order to do this, Performance
Sentry makes it possible to control the amount of overhead involved in post-processing the
collected Windows Server performance data. By default, Performance Sentry logs performance
data to a local disk file. To enhance scalability, each computer logs data to its own separate disk
file. The intention is for Performance Sentry data collection files to be gathered up during off
peak hours for processing by the Performance Sentry Portal and SAS performance database
packages like Merrill’s MXG or the SAS Institute’s IT Resource Management. Processing
the gathered data in off peak hours will have less impact on system performance. However, if you
do not want to collect data locally, you can direct Performance Sentry data logging to any
network file resource.
It is easy to set up Data Collection Sets that are tailored for your environment. Using the Sentry
Administration tailoring facility, you can activate a collection set that records data for only the
objects and counters you need to know about. This makes it possible to monitor many different
computers efficiently and effectively.
Performance Sentry uses a Master Collection Set which defines the properties of all the
performance objects and counters that we know about. If one of the computers you want to
monitor has additional objects, use the Administration component of Sentry Administration to
add these objects to the Master Collection Set. You can define as many Data Collection Sets as
you like using the Sentry Administration program. Performance Sentry also includes several
predefined Collection Sets that you can use or modify.
9
Performance Sentry User Manual
Introduction
Collection Interval
The Sentry Administration program also allows you to set other data collection options,
including the duration of the collection interval. We recommend using a regular data collection
interval of one, two, or five minutes. Small collection intervals mean that you will be able to
construct a more detailed view of system performance later when you analyze the data collected.
Collecting performance data over longer fifteen, thirty, or sixty minute periods tends to smooth
out peak loads, making it harder to spot problems. By using shorter intervals, there is a higher
likelihood that the data collected will capture these performance peaks and valleys.
With Performance Sentry installed on all your important Windows Servers, it is not necessary to
rely on anecdotal accounts of what happened when problems occur. Instead, you will have access
to precise information on what happened and why.
On the other hand, using shorter collection intervals means that you must use greater care in
selecting the performance objects and counters that you want Performance Sentry to log. The
Performance Sentry Summarization Utility gives you the flexibility to collect information detailed
enough for problem determination, which can then be summarized at longer intervals for
transmission and processing for capacity planning and trending.
Filters
Filters defined on the Process, Thread and other bulky objects allow you to use shorter collection
intervals without causing the collection file to swell in size. Filters define threshold tests that are
used to output instances of a bulky object only if there is sufficient activity. For example, all the
predefined Collection Sets that we provide rely on Process and Thread filter settings to keep the
size of the collection files within manageable limits. Using filters means that significantly fewer
records are written to the data file. Having fewer records translates to fewer bytes transferred
across the network at collection cycle end for post-processing by your reporting package.
Filters can be set manually to limit the number of Logical Disk or Physical Disk instances
collected, which are especially effective when your Windows Server is one of several machines
attached to a shared disk storage array. In SQL Server, you can filter out idle database instances,
for example, based on the interval transaction rate.
Threads
In our experience, capturing instances of the Process and Thread objects usually has the most
impact on the size of the collection data file. Without filtering, recording Thread data typically
increases the size of collection files by 100% or more. Moreover, most Thread instances recorded
have little value to anyone other than the program’s software developer who may be able to tell
which Threads are responsible for which internal program activity. On the other hand,
experience shows that there are a few Thread instances which provide very useful diagnostic
information. Thread filters eliminate the great volume of Thread instances which contain
insignificant information for capacity planning and performance management, while retaining
instances containing useful Thread performance data.
Due to volume considerations, we do not recommend collecting Thread data without turning on
the Thread filters. Enabling the Thread filters normally means writing only a handful of Thread
instances to the data collection file each collection cycle. Without using the filters that are
supplied, hundreds of thread records will be written each collection interval.
10
Performance Sentry User Manual
Introduction
“Costly” Objects
The Master Collection Set includes three “costly” objects which are not available using Perfmon,
but can be collected on Windows Server using Performance Sentry. These three objects are (1)
Process Address Space, (2) Image, and (3) Thread Details. It is safe to assume that these objects
were not included in Perfmon due to overhead considerations. These objects are primarily useful
to application developers. We decided to include them in the Master Collection Set. However,
there are no predefined collection sets that use these objects. Be especially careful about collecting
the Image and Thread Details objects. Image returns a record describing the virtual storage used
by each program image file (dll, OCX, etc.) loaded per Process. The Thread Details object
records the location of the Program counter for each Thread. Under normal circumstances, the
Thread and Thread Details performance objects contain detailed information which is not
required in continuous performance monitoring. On the other hand, collecting several intervals
worth of Process Address Space and Image object instances can be very helpful in diagnosing the
source of a memory leak, for example. Performance Sentry can collect Module instances, which
corresponds to the data available with the Image object in Windows Server. The synthetic
Module object should also be considered a “costly” object — use caution when you collect
Module identification information.
The information collected associated with Module object instances is designed to help identify
the specific application DLLs being executed inside container processes like dllhost.exe, and
svchost.exe. Be aware that collecting Module information without appropriate filter
definitions that specify the application DLLs you want to identify will increase the overhead
associated with running the Collection Service significantly. Without proper filter definitions, the
Module data will also dramatically increase the size of your data collection files. Please do not
collect Module information without an appropriate set of Module filter specifications. See
Chapter 5 for more detail on the Module filter options.
Processes
By default, the Performance Sentry predefined collection sets include the Process object. If you
decide to let Performance Sentry collect Process information, it will write one record every
interval for every Process that is active. The Process object instances should be collected whenever
it is important to understand which Server processes are responsible for consuming CPU and
memory resources. Performance statistics for only those Processes that are active at the time of the
collection interval are collected. Windows Server has no mechanism to determine precisely when
processes begin and end, unless you undertake recording these events in the Windows Server
Event Log. Whenever a process terminates, the counters that keep track of the resources
consumed by the Process are deleted. When the next Performance Sentry collection interval
occurs, there is no evidence that the terminated Process ever existed!
However, the resources consumed by a process that terminated during an interval are captured in
higher-level System, Processor, Memory, and Cache object instances. When you need to figure
out which processes used what resources during an interval, collect Process object instances and
use smaller collection intervals of 1, 2, or 5 minutes. Using a fine-grained collection interval is
especially important if the system being monitored runs many short-lived processes. Most
Windows Application Servers run a very stable set of processes that are active over long
durations, so these considerations usually do not apply to many environments.
11
Performance Sentry User Manual
Introduction
It is also possible to filter Process instances so that only records for active processes are written to
the collection file. You can set the threshold of CPU activity or real and virtual memory usage
(working set pages) to determine a process’s eligibility for being written to the collection file. You
can also set up a list of processes that are always reported on each interval, whether or not they
show any signs or activity. See Chapter 5, “Filters”, for more information on these Process level
filters.
Filtering on active processes has side effects that you should understand. Some processes are
active during some intervals and dormant during others. If you need to collect performance data
to inventory all the processes running on your systems or that are using memory resources, using
the Process filter will limit your ability to do this.
Having processes that are inactive one interval and are active the next affects the logic that SASbased performance database products use to create daily, weekly, and monthly, summarized
activity files. SAS Institute recommends not using the CPU and Memory usage-based Process
filter because it affects the interpretation of summarized Process data. With filtering, the
summarized counters represent rates averaged over the period in which the Process was active,
which is far different from the full duration of the summarization interval. To ensure that specific
processes summarize correctly in SAS, include those processes in the list of names for the Process
Availability filter. This will ensure that a Process instance record is created for each interval that
these specific processes are executing, regardless of activity.
The Performance Sentry Summarization Utility calculates activity rate counters correctly whether
or not inactive processes are subject to filtering rules.
12
2
Installation and Operation
Performance Sentry is packaged in a single installation executable. To get started, simply execute
the Setup program. The Setup program is used to install the Performance Sentry components. A
separate installation routine called CSSetup is available that only installs the Collection Service.
It is also possible to install the Collection Service without using the Setup program. The section
entitled “Installing the Collection Service” gives detailed instructions for deploying the Collection
Service throughout your organization.
Figure 2.1 Welcome screen for the Performance Sentry setup routine.
13
Performance Sentry User Manual
Installation and Operation
Installation Procedures
To install Performance Sentry, use the following steps:
(1)
Prepare the machine you want to use to administer Performance Sentry.
Sentry Administration is used to define and activate performance Data Collection
Sets on the local machine and any remote computers that you want to monitor. For best
results, run the Sentry Administration program on a Windows Server (Windows
2000 or higher).
Run the Setup program contained on the installation executable to install the Sentry
Administration program on the Windows machine that you intend to use to
administer Performance Sentry.
(2)
Prepare the machines that you want to monitor with the Collection Service.
Install the DMPerfss.exe collection engine as a service on any Windows Server or
Windows XP computer that you wish to collect performance information about, and
start the program. The Performance Sentry Collection Service collects the performance
data you specify on the Windows computer on which it is installed. You can install as
many copies of the Performance Sentry Collection Service as you are licensed to run.
By default, DMPerfss.exe writes an NTSMF format data file to a \data subfolder of
the installation folder on the monitored system’s local hard drive. You can change the
\data folder to point anywhere you want, even to point to a remote hard disk although
this is not recommended.
(3)
Automate the process for consolidating Performance Sentry collection files for
processing by SAS ITRM, MXG, Performance Sentry Portal, or other performance
reporting packages.
Once installed, the Collection Service runs automatically from the time your Windows
Server starts up until it shuts down. At the end of a Collection Cycle, the Collection
Service closes the current .smf data logging file to free it up for processing. It
immediately opens a new collection file so no collection intervals are lost. At this time
you can schedule a process to copy the older collection file to a central location for
consolidation and processing. This may involve presummarizing the detail level
collection file using the Summarization Utility, setting up a connection to a remote
drive on a machine you designate as a central collection file consolidation point, and
using the built-in scheduling facilities of the Collection Service to move the old
collection files to that machine at regularly designated times.
14
Performance Sentry User Manual
Installation and Operation
Run the Setup Executable
To install Performance Sentry, run the setup executable. You will be prompted for the
components that you wish to install to the machine on which you are running setup.
Simply deselect the components that you do not wish to install.
Figure 2.2 Select Features screen for the Performance Sentry setup routine.
Upgrading from an Older Version
Running the setup program will automatically upgrade installed components. Simply follow the
on-screen instructions.
You can also upgrade the Collection Service using the CSSetup program, which is packaged
with Performance Sentry Administration and can be found in the target directory after installing
that component. CSSetup must be copied to the target machine (or to a drive mapped from
that machine) and executed there. It cannot be run remotely. If you cannot map a logical disk to
your machine, it may be necessary to install the Collection Service manually.
Alternatively, you can use the remote automation facilities of the Microsoft System Management
Server (SMS), or some similar program, to install the Collection Service automatically on one or
more remote machines.
If you are currently running an older version of the Performance Sentry service and you are
upgrading manually from the older version, the service must first be stopped and then removed,
as described in the following procedure:
15
Performance Sentry User Manual
Installation and Operation
1. Stop the Service
Stop the service using the Administrative Tools, Services applet. See Figure 2.3 below:
Or from a Command Prompt, run:
net stop dmperfss
Figure 2.3 Stop the Performance Sentry Collection Service using the Services applet prior to upgrading it to a new version.
2. Remove the Service
Once the service is stopped, you can remove the Performance Sentry service at any time by
executing at the Command Prompt:
dmperfss -remove
Be sure to execute the dmperfss -remove command from the same folder where the
Collection Service was originally installed. You can verify the active folder from the ImagePath
parameter stored in the HKLM\System\CurrentControlSet\Service\DMPerfss\ImagePath Registry Key.
Now you are ready to continue with the Collection Service installation procedure.
The procedure for stopping, removing, installing and starting the DMPerfss Collection Service
is illustrated in Figure 2.4 below. The Collection Service installation program CSSetup
performs these functions automatically. If you run CSSetup in silent mode using the “/s”
option, it performs these functions automatically in the background without prompting for user
input.
16
Performance Sentry User Manual
Installation and Operation
Figure 2.4 Stopping, Removing, Installing and Starting the Collection Service.
Manually Installing the Collection Service
Use the following procedure to install the Performance Sentry collection engine manually:
(1)
Create a folder called C:\Program Files\NTSMF40 on the target machine.
(2)
Copy the following files from the folder where you installed the Collection Service to
the NTSMF40 folder you just created:
DbgHelp.dll
DmCmd.exe
DmCmd.pdb
DMPerfss.exe
DMPerfss.pdb
Dmperfss.cfg
DMSumMsg.dll
DMSumSMF.exe
DTSFnd.dll
DTSFnd.pdb
DTS1.cer
LicenseManagerClient.dll
LicenseManagerClient.pdb
PSSMsg.dll
PKZIP25.exe (optional)
Trial.lic
Subfolder ...\NTSMF40\Microsoft.VC80.CRT:
Microsoft.VC80.CRT.manifest
msvcm80.dll
msvcm80.i386.pdb
msvcp80.dll
msvcp80.i386.pdb
msvcr80.dll
msvcr80.i386.pdb
17
Performance Sentry User Manual
Installation and Operation
The files listed above are installed to the following folder as part of installing the
Performance Sentry Administration component:
C:\Program Files\Performance Sentry Administration\Collection Service files
The folder listed above contains corresponding sub-folders for x86 and x64
architectures. Simply copy all of the files and sub-folders from the corresponding
architecture folder to the NTSMF40 folder created above.
(3)
Install the service by executing the following command at the Windows Command
Prompt:
C:\Program Files\NTSMF40\dmperfss -install
Optionally, you can schedule an exported DCS definition file to run at service
initialization by using the -f option during installation, as illustrated below:
C:\Program Files\NTSMF40\dmperfss -install -f MyDCS.dcsx
which assigns the MyDCS.dcsx specification file to the Collection Service. Remember
that this file, represented by MyDCS.dcsx, must exist in the folder where
DMPerfss.exe resides.
Additionally, you can choose to install the service so that it starts in the suspended state.
When started in the suspended state, the service communicates with external programs,
but will not collect data.
C:\Program Files\NTSMF40\dmperfss -install -f MyDCS.dcsx
-suspend
You can also install the service so that it runs under a specific User Account:
C:\Program Files\NTSMF40\dmperfss -install -f MyDCS.dcsx
-account DomainName\myAccount -password xxxxxxx
For more information on this option, see the section on “Security Considerations” later
in this chapter.
Following successful installation, start the service using the Administrative Tools,
Services applet. The service name in the Services administrator is Performance Sentry.
The executable name is DMPerfss.exe, which can be viewed in the Task Manager.
Or, start the service from a Command Prompt by running:
net start dmperfss
The service is set to start automatically. You can change this using the Services, Startup
type property. See Figure 2.5 below. Automatic is the recommended setting.
18
Performance Sentry User Manual
Installation and Operation
Figure 2.5 Setting the Collection Service to run automatically at system start-up using the Administrative Tools, Services
applet. This is the default setting when you install the DMPerfss Collection Service.
Congratulations! You have now installed the Performance Sentry Collection Service and are
beginning to collect Windows Server performance data at regular intervals. Continue reading to
learn how to configure the Collection Service to collect only the data you want and how to
automate the data collection process, including copying collections files to a central collection
point for processing.
Example 2.1 below is a sample install script that is designed to distribute the Collection Service
installation on a single CD-ROM. It illustrates the logical sequence of events that must take
place during installation.
19
Performance Sentry User Manual
Installation and Operation
Example 2.1 A sample installation procedure for the DMPerfss Collection Service
rem d: in the script below is the logical drive letter of
rem the CD-ROM drive
Mkdir “C:\Program Files\NTSMF40”
cd “C:\Program Files\NTSMF40”
copy d:\DbgHelp.dll
copy d:\DmCmd.exe
copy d:\DmCmd.pdb
copy d:\DMPerfss.exe
copy d:\copy d:\DMPerfss.pdb
copy d:\Dmperfss.cfg
copy d:\DMSumMsg.dll
copy d:\DMSumSMF.exe
copy d:\DTSFnd.dll
copy d:\DTSFnd.pdb
copy d:\DTS1.cer
copy d:\LicenseManagerClient.dll
copy d:\LicenseManagerClient.pdb
copy d:\PSSMsg.dll
copy d:\PKZIP25.exe (optional)
copy d:\Trial.lic
copy d:\*.dcs
mkdir Microsoft.VC80.CRT
cd Microsoft.VC.CRT
copy d:\Microsoft.VC80.CRT\Microsoft.VC80.CRT.manifest
copy d:\Microsoft.VC80.CRT\msvcm80.dll
copy d:\Microsoft.VC80.CRT\msvcm80.i386.pdb
copy d:\Microsoft.VC80.CRT\msvcp80.dll
copy d:\Microsoft.VC80.CRT\msvcp80.i386.pdb
copy d:\Microsoft.VC80.CRT\msvcr80.dll
copy d:\Microsoft.VC80.CRT\msvcr80.i386.pdb
dmperfss -install -fMyDCS.dcsx
net start dmperfss
Collection Service Initialization
Performance Sentry will begin logging performance data immediately based on default parameter
values, unless the -suspend flag was used to install it. If -suspend was used on installation, the
service will wait for a resume command to be issued (using DMCmd or Sentry
Administration) or net continue dmperfss command before it will collect data.
The parameter values that determine what data elements to collect and how frequently to collect
them comprise a Data Collection Set (DCS) definition, which is discussed in more detail in
Chapter 3. During initialization, the Collection Service DMPerfss.exe performs the following
sequence of actions:
20
Performance Sentry User Manual
Installation and Operation
•
Attempts to locate a DCS definition.
•
Validates the DCS definition start-up parameters.
•
Opens the NTSMF.log file where subsequent information and error messages are
written.
•
Validates the DCS data definition parameters that determine which objects and
counters to collect.
•
Opens a new data collection file. Unique data collection data file names are
automatically generated of the form
systemname.yyyymmddhhmmCustomQualifier.smf
where yyyymmddhhmm is a date/time stamp identifying when the file was created.
•
Initializes Interval data collection by calling the Windows performance monitoring API
to establish baseline values for all interval delta counters.
•
If the WriteDiscovery option is enabled, Discovery or Format records are immediately
written to the collection file.
•
Accesses the Windows Server Registry and writes Performance Sentry configuration
records to the collection file.
At this point, initialization is complete. Following initialization, the service calculates the amount
of time until the next scheduled data collection interval, sets a timer to expire at that precise
moment, and then puts itself to sleep. The duration of the first collection interval is determined
by the StartMarker parameter. Thereafter, the duration between collection intervals is
determined by the Interval Length (MM SS) parameter.
Locating the Data Collection Set Definition
At initialization, the Collection Service begins to search for a Data Collection Set (DCS)
definition to use.
The Collection Service attempts to use the first DCS definition it finds based on a rigid search
order defined as follows:
•
If the service is scheduled to run a DCS file, it attempts to open a DCS specification file
of that name in its root folder. A DCS file is created using the DCS Editor in
Performance Sentry Administration. The DCS definition specified in the assigned
DCS file takes precedence over every other method for specifying a DCS.
A DCS file is assigned for collection in one of the following three ways:
1.
A DCS specification can be assigned using the -f option during installation, as follows:
DMPerfss -install -f MyDCS.dcsx
This instructs the Collection Service to use start-up parameters from the MyDCS.dcsx
exported DCS file located in the Performance Sentry startup folder.
2.
An exported DCS can be assigned using the Network Browser in Performance Sentry
Administration by right clicking on a computer in the tree and selecting the DCS…
menu option.
3.
A DCS file can be assigned using the DmCmd Automation Interface as follows:
21
Performance Sentry User Manual
Installation and Operation
DmCmd -f MyDCS.dcsx -s MyComputer
•
Finally, if the Collection Service is not able to find a DCS specification, it reverts to
default values that are equivalent to the Default Collection Set DCS definition that is
originally installed with the Sentry Administration program.
Validating the DCS Definition
When the Collection Service finds a DCS definition, it first attempts to validate it. During
validation, the start-up collection parameters that determine where the NTSMF.log file is to be
written are checked first. If the start-up parameters are valid, the Collection Service opens the
NTSMF.log file. An Event ID 102 Initialization Application Event Log message is written that
identifies the Collection Service start-up parameters that are in effect for this Collection Cycle.
If the start-up parameters under the CollectionParameters key are invalid, the Collection
Service substitutes default values and attempts to continue. A Warning message is written to the
Application Event Log, if that option is enabled.
If the start-up parameters are valid, the Collection Service then accesses the Data Collection Set
data definition, which determines the performance data objects and counters that are collected
and written each interval.
If a performance object is defined in the DCS data definition but does not exist on the local
system, the Collection Service simply ignores that part of the data definition and writes an Event
ID 2200 Warning message to the Application Event Log.
Security Considerations
The Performance Sentry Collection Service is designed to run under the SYSTEM (or
LocalSystem in Windows 2000 Server) account. The SYSTEM account, which is used by many
services in Windows Server, is a built-in account with an extraordinary set of User Rights and
privileges internal to the local machine, some of which cannot be granted to regular User
Accounts. On the other hand, SYSTEM is granted no Permissions by default for accessing
Network resources like files or folders – you normally need to use a Domain User account instead
to access them. For example, the SYSTEM account may not be authorized to write to the disk
on the system where the collection service is installed. If the service stops at initialization before it
is able to allocate and write the NTSMF.log file, it is necessary to assign an authorized User
Account to the Performance Sentry Collection Service during installation. During installation,
you can define a Domain User account for the Performance Sentry Collection Service to use
whenever it needs to access protected network resources like files or folders.
To assign a User Account during installation, specify the -account and -password keywords
as follows:
dmperfss -install -account DomainName\myAccount -password xxxxxxx
If the Domain name is not present, a local Account is assumed.
For example, issue the following commands (from within the NTSMF40 folder) to assign a User
Account:
net stop dmperfss
dmcmd -account MyDomain\myAccount -password foo
net start dmperfss
22
Performance Sentry User Manual
Installation and Operation
This sequence of commands stops the Collection Service, then, assigns a Domain Account and
password. The Collection Service will then use the Domain account MyAccount to access
protected network resources when necessary.
When a User Account is assigned, the Collection Service still continues to run under the
standard SYSTEM account that most services use for most functions. However, whenever the
Collection Service needs to access a file or folder that can be protected, it impersonates the User
Account that is assigned. Impersonation refers to a standard security function that allows a server
application like the Performance Sentry Collection Service to execute certain functions under the
security context of one of its clients. The client security context the Collection Service
impersonates is the User Account you specify. Simply grant the User Account you specify the file
and folder permissions the Collection Service requires to function in your secure environment.
When a User Account is assigned, the Collection Service will impersonate the User Account
whenever it is performing either (1) file operations – normally, to the \data\Current folder, or
(2) during Cycle End processing when it launches the Cycle End command. If the SYSTEM
account is not authorized to access the \data\Current folder, the Performance Sentry Collection
Service will fail during its initial attempt to allocate its NTSMF.log file in the \data\Current
folder. If Performance Sentry fails to initialize and there is no <computername>.NTSMF.log
Message file generated, it is usually because the \data\Current folder is a protected resource on
the local machine. Assign a User Account that the Collection Service can impersonate in order to
access the \data\Current folder.
The security context of the Performance Sentry Collection Service is propagated automatically to
any program or script that is launched by the Cycle End command. If your Cycle End command
script needs access to a protected folder somewhere on the network, assign an authorized User
Account that the Performance Sentry Collection Service will impersonate when it launches the
Cycle End command. When a User Account is assigned, the Cycle End command or script will
execute under the authorized User Account you specified, not SYSTEM.
Alternatively, if you have implemented Active Directory, it is possible to grant the SYSTEM (or
LocalSystem) Account the folder permissions required to access protected network resources.
The SYSTEM (or LocalSystem) Account corresponds to the named computer in Active
Directory. If granting the named Computer Network file permissions, is not consistent with
Windows Server security administration policies at your site, assign an authorized User Account
instead, as discussed above.
Collection Service Operation
After validating the DCS definition, the Collection Service begins collecting the Windows
Server performance data you specified. At the beginning of each Collection Cycle, the Collection
Service inventories the performance objects and counters that are available for collection on the
machine and compares that to the DCS data definition. This is known as the Discovery phase of
operation.
Following the Discovery phase, the Collection Service begins to perform Interval data collection.
At each collection interval, the service wakes up, uses the Windows performance monitoring API
to access current values of all counters specified in the DCS definition, calculates individual
counter values based on the counter type, and writes Interval data records to the collection file.
The service performs Interval data collection continuously until it terminates.
23
Performance Sentry User Manual
Installation and Operation
The Collection Service is designed to operate unattended from system start-up to system
shutdown. Should it ever be necessary to reconstruct what happened during Collection Service
operation, a complete audit log is maintained in the NTSMF.log file, as well as the Application
Event Log, when that option is enabled.
Discovery
During Discovery, the Collection Service inventories the performance objects and counters that
are available for collection on the local machine. Discovery is performed by traversing the
Registry at the HKLM\SYSTEM\CurrentControlSet\Services key and looking for services
with a \Performance subkey defined. \Performance subkeys identify the Performance
Library modules (Perflib DLLs) specifically responsible for performance data collection.
An example of a \Performance subkey is illustrated in Figure 2.6. In this example, the
parameter values at HKLM\SYSTEM\CurrentControlSet\Services\PerfDisk\Performance identify the
perfdisk.dll Performance Library module that the Collection Service must load. It also shows
the three entry points in perfdisk.dll that the Collection Service calls to Open data collection,
Collect data, and Close data collection. Perfdisk.dll is the Microsoft-supplied Perflib DLL that
is responsible for gathering disk performance statistics (via the diskperf disk performance
driver).
Figure 2.6 An example of the \Performance subkey parameter values stored in Services Registry entries.
During Discovery, the Collection Service inventories the Performance Library modules that are
defined to the machine and attempts to call the Open routine for each Perflib DLL found. A
unique Collection Service program thread is spawned to communicate with each Perflib
discovered. If the Open call is successful, the Collection Service discovers which objects and
counters the Performance Library module supplies. If the Performance Library module is missing
or the call to Open the Performance Library module fails, then the Collection Service will skip
calling that Perflib DLL for the duration of the current Collection Cycle. The Collection Service
records any anomalies it discovers about Performance Library modules with appropriate
Application Event Log entries.
Interval Data Collection
After inventorying the Performance Library modules available for collection and comparing them
to the DCS definition that you specified, the Collection Service enters its normal Interval data
collection phase. During Interval data collection, the Collection Service calls the Collect routine
of each active Perflib DLL. After retrieving a current data buffer from a Perflib DLL, the
Collection Service applies the filtering specifications you have defined to calculate all the counter
values that are then written to the data collection file each interval.
24
Performance Sentry User Manual
Installation and Operation
If the call to Collect data from the Performance Library module fails, the Collection Service flags
the Perflib DLL that failed and ignores it for the remainder of the Collection Cycle. The
Collection Service does not set the Disable Performance Counters \Performance registry
subkey value that the Windows Server System Monitor sets whenever it encounters an error
condition when it calls a Perflib DLL. Nor does the Collection Service honor the Disable
Performance Counters \Performance Registry subkey value that the Windows Server
System Monitor sets. In our experience, the Collection Service is able to recover automatically
from many of the errors that would cause the Disable Performance Counters
\Performance subkey value to be set. As part of its normal recovery procedure, the Collection
Service reloads and retries each Perflib DLL at the beginning of a Collection Cycle. You can
initiate a retry of the Perflib DLL manually by issuing the Notify command that forces an
immediate end to the current Collection Cycle and initiates a new cycle. See Chapter 3 for a full
discussion of the Notify command.
The Collection Service inventories and loads all the Performance Library modules (Perflib
DLLs) that it discovers at the beginning of each Collection Cycle. Perflib DLLs are then
unloaded at cycle end in preparation for the next round of Discovery and Interval data collection.
Since Perflib DLLs remained loaded by the Collection Service for the duration of a Collection
Cycle, you cannot replace a damaged Perflib DLL or apply any maintenance that refreshes a
currently loaded Performance Library module while the Collection Service is active. Whenever
you need to refresh a currently loaded Performance Library module, Suspend the operation of the
Collection Service. Suspend forces a Collection Cycle End, but does not initiate a new Collection
Cycle. Or stop the Collection completely. After you have loaded a new, improved version of the
Performance Library module, Resume normal Collection Service operations or restart the
Collection Service.
Collection Cycles
The Cycle Hour and Cycle Duration runtime parameters define a Collection Cycle. At the end
of a Collection Cycle, the Collection Service closes the current collection file to make it available
for processing and opens a new one. The last set of interval performance data counter values
written to the previous collection file are used to establish baseline values for the first Interval
data record written to the new collection data file. This ensures that data collection is performed
continuously with no gaps in its recording of system activity.
During normal operation, the DCS definition established at initialization and used during the
previous Collection Cycle remains in effect for the current cycle. Only when the service is
stopped and restarted is the initialization sequence repeated, causing the DCS definition
parameters to be refreshed.
However, it is possible to refresh the DCS definition using the Sentry Administration program.
When you assign a new or modified DCS definition using the Sentry Administration program,
you will be prompted to notify the Collection Service to indicate whether you want to activate
the DCS definition immediately or at the end of the next regular Collection Cycle. If the
Collection Service is notified that the DCS definition change is to be activated immediately, it
terminates the current Collection Cycle, performs the initialization sequence that identifies and
validates the DCS definition, and begins a new Collection Cycle. If activation is deferred, the
Collection Service performs the initialization sequence at the beginning of the next regularly
scheduled cycle.
25
Performance Sentry User Manual
Installation and Operation
Scheduling functions. The Collection Service supports calendar features that allow you to
schedule DCS changes involving, for example, collecting a different set of performance objects
and counters at different sampling intervals with different runtime parameters. Typical uses of
the Collection Service scheduling functions include:
•
Collecting very detailed data at a rapid rate for a short interval (typically 1 or 2 hours)
during an expected peak period of activity
•
Reducing the amount of measurement data collected during known off-peak periods
•
Suspending data collection entirely during weekends.
A simple calendar function allows you to specify days of the week and hours of each day that data
collection is active. Data collection can be suspended for the days of the week and the specific
hours you select.
It is also possible for one DCS to schedule changing to a new DCS at a specified time of day.
The new DCS activated might feature a change to the collection interval, the performance
objects and counters being collected, or both. The second DCS can also schedule its next DCS,
and so on. Conceptually, DCS A activates DCS B, which activates DCS C, which finally returns
to DCS A, forming an unbroken chain that will cycle continuously. Operationally, any number
of DCS Definitions can be used to build a chain.
Automation interface. It is also possible to suspend and resume data collection and refresh the
DCS definition using the Automation Interface. The Automation Interface is invoked by
executing the DmCmd.exe program from a .bat file or script. DmCmd.exe is also designed to be
used in conjunction with the Windows Server Scheduling service. The Automation Interface is
documented in Chapter 7.
Automating Collection Cycle End Processing
At the end of each Collection Cycle, the Collection Service closes the current collection file to
make it available for processing. The end of a cycle normally is used to initiate processing of the
collection files by other programs. Cycle End processing normally consists of scheduling a
process to consolidate Performance Sentry data files at a central location. This section discusses
automating Cycle End processing.
The Collection Service stores data collection logs in the \data subfolder under the C:\Program
Files\NTSMF40 program folder by default. The location of the data folder can also be changed
using the Sentry Administration program by modifying the folder where SMF files are stored
start-up parameter.
Hierarchical file management sets up Current, Previous and Archive folders under the \data
folder and manages collection files according to the criteria you specify. The hierarchical file
management option is specifically designed to simplify your cycle end procedures. By default, old
collection files are moved immediately from the Current folder to the Previous folder. After
the number of days you specify, they are then migrated to the Archive folder. Files are kept in
the Archive folder for an additional period of time and then deleted automatically according to
your specifications. Because all automatic file management is performed prior to issuing the
Cycle End command, the Cycle End procedure you execute can be as simple as a COPY *.*
command pointing to the Previous folder.
26
Performance Sentry User Manual
Installation and Operation
Unique collection data log file names are automatically generated of the form
systemname.yyyymmddhhmmCustomQualifier.smf
where yyyymmddhhmm is a date/time stamp identifying when the file was created. During the
Collection Cycle, the Collection Service can lock the current data file so that no other application
can access it. Or the current data file can be shared so that it can be processed by other Windows
Server programs or commands while collection is occurring and the file is open. The collection
file is closed at cycle end and is available for processing.
The Collection Service automatically launches the Cycle End command you specify after all file
management actions have been completed. You can specify a command directly or execute a .bat
file script, PERL script, or other command processing program. By default, the Cycle End
command is launched immediately. Or you can specify that the Cycle End command be
launched at a random time within a defined processing window (up to 60 minutes in duration)
following the cycle end. Defining a Cycle End command processing window allows you to
stagger the execution of the Cycle End processing scripts you devise so that you can easily avoid a
logjam on your network.
Processing Multiple Files
If the Collection Service was restarted (due to a re-boot, for example) during the last Collection
Cycle, there will be multiple .smf collection files in the \data\Previous folder at the time the
Cycle End command you specified is launched. Consequently, the Cycle End processing you
perform should allow for the fact that multiple collection files may be available for processing. A
wildcard in your filespec normally accomplishes this.
For ease of processing in MXG, you will normally consolidate collection files representing many
different machines into one file. Use the COPY command available in Windows Server with the
/B option to consolidate multiple Performance Sentry collection data files into one large file for
processing:
COPY /B “C:\Program Files\NTSMF40\data\Previous\*.SMF” “C:\Program
Files\NTSMF40\Daily\Daily.SMF”
The /B option of the COPY command concatenates multiple files without terminating each file
with a x’3F’ end of file character. In the above example the file named Daily.SMF is associated
with the MXG NTSMF input file name, for example. To process this data file in MXG, you
would code a SAS language FILENAME NTSMF specification that references C:\Program
Files\NTSMF40\Daily\NTDaily.SMF if you are running SAS under Windows Server.
Using FTP
If you need to send daily .smf files to a non-Windows host machine for processing or the
machine you need to transfer the files to, is separated by a firewall, you may need to use the ftp
utility to copy the files. Here is an example of a simple .bat command file that utilizes ftp:
27
Performance Sentry User Manual
Installation and Operation
COPY /B “C:\Program Files\NTSMF40\data\Previous\*.SMF” “C:\Program
Files\NTSMF40\data\Consolidated\Consolidated.SMF”
ftp -v -i -s:Transfer.ftp
exit
The following example script connects to a remote server and uses a valid Username and
Password to log into the remote system. Once logged into the remote system, the program
changes folder (CD) to the remote folder C:\Consolidated and sends the file from the
originating folder
C:\Program FilesNTSMF40\data\Consolidated\Consolidated.smf
to the remote file Consolidated.smf on the remote server. Both origination and remote servers
have to have FTP enabled (requires installation of IIS, the Microsoft Internet Information
Server, in Windows Server), with common Usernames and Passwords defined. In the sample
script, replace the keywords Remote, Username, and Password with parameters that are valid for
your environment.
open Remote
Username
Password
cd C:\Consolidated
send “C:\Program Files\NTSMF40\data\Consolidated\Consolidated.SMF”
Consolidated.SMF
Bye
You can also use ftp wild cards to transfer multiple files in a single command execution stream.
The easiest way to do this to create an ftp script that uses the mput subcommand to send
multiple .smf files contained in the \Previous folder.
CD “C:\Program Files\NTSMF40\data\Previous”
ftp -v -i -s:C:\FTPROCESS\transfersmf.txt
exit
where transfersmf.txt is a text file containing the following ftp script:
Rem Transfersmf.ftp sends multiple files to a remote central server
open Remote
Username
Password
prompt
mput *
Bye
The prompt subcommand turns off ftp interactive mode. The “*” wildcard filespec means that all
data files located in the \Previous folder will be transferred.
Chapter 7 provides complete documentation on the Cycle End command processing facility,
including a discussion of the parameters that the Performance Sentry Collection Service can pass
to a Cycle End script for additional flexibility and control.
Summarization Utility
In cases where detail data is collected, for example, at one minute intervals, but it is desirable to
transfer only summarized data back to a central location for processing and storage, the data
Summarization Utility can be invoked at cycle end.
28
Performance Sentry User Manual
Installation and Operation
The Summarization Utility, DMSumSMF.exe, is used to create summarized .smf collection
files from raw collection files. Summarized files created by the Summarization Utility are
identical in format to the original input data file except that the data intervals represent longer
intervals of time. The summarized file created uses the same computername.datetimestamp
filename format as the original, except with a suffix and extension sum.smf. Summarized .smf
files can be processed by any third party package that accepts Performance Sentry detail collection
files.
The logic used to summarize performance counters is based on the counter type. (Both Type 5
Counter Name and Type 6 Counter Type Format records must be available in the file to be
summarized.) See Appendix A for a more complete explanation of the Windows Server counter
types. For the great majority of counters that report an activity rate over some interval (i.e., Page
faults/sec or Process\% Processor Time), the Summarization Utility merely recalculates
an average value over a longer interval.
For instantaneous or raw counters like Processor Queue Length, the Summarization Utility
automatically calculates the arithmetic mean or the average value of the counter over the
summarization interval selected.
For a specific set of instantaneous or raw counters that by default report either a Minimum,
Maximum, or Peak value, calculated as the minimum or maximum raw counter observed since
system start-up, the Summarization Utility refers to the Peak counter's underlying raw counter
and calculates the minimum or maximum value observed during the summarization interval. For
instance, the Process Working Set Peak counter is normally calculated as the highest value
of the Working Set counter observed since the specific process started. The Summarization
Utility automatically reports the Process Working Set Peak as the highest value of the
Working Set counter observed during the summarization interval.
The Summarization Utility is designed to be executed during Cycle End processing, before you
transmit collection files to a central site for processing. By using the Summarization Utility
against the detail level file, you can significantly reduce the amount of performance data that
needs to be transferred across the network. It also reduces storage usage and processing time at its
final destination.
You can invoke the DMSumSMF.exe Summarization Utility directly from a command line or
in a batch file or script. Naturally, you are responsible for managing the summarized files created
if you decide to run the Summarization Utility outside the Cycle End command environment.
For example, the Summarization Utility can be run automatically at cycle end by coding the
following Cycle End command:
DMSumSMF.exe -f@LastDataFile:F -H"@StartupDir"
Note: if you are launching the Summarization Utility during Cycle End command processing,
you must specify the -H option with the @StartupDir parameter so that the DMSumSMF
program can find the Collection Service home folder. If there are any spaces in the full path
name, the @StartupDir keyword must be enclosed in quotes, as illustrated.
Because you might want to summarize the detail collection file before transmitting it, the
Summarization Utility is normally invoked within a command batch file. For example, you might
code the following Cycle End command to invoke the Summarization Utility and transmit the
summarized file created back to a central location for further processing:
29
Performance Sentry User Manual
Installation and Operation
Summarize.bat @LastDataFile:F "@StartupDir" 30
where Summarize.bat is coded as follows:
rem Usage: Summarize.bat @LastDataFile:F "@StartupDir" 30
rem
rem Notes:
rem
1. the file name to summarize is required (%1).
rem
2. the full path (%2) to the program is required.
rem
3. the default summary interval is 15 minutes if the third
rem
argument is not specified
rem first cd to the home folder
cd %2
rem Check for a valid summary interval
if %3 GEQ 0 goto nodefault
rem now execute the summarization program
dmsumsmf.exe -f%1 -h%2
goto docopy
:nodefault
dmsumsmf.exe –f%1 -h%2 -s%3
:docopy
copy “C:\Program Files\NTSMF40\data\Previous\*.sum.smf \\Server\NTSMFDaily\*.*
Please refer to Chapter 7 for complete documentation on the use of the Summarization Utility,
along with several additional examples.
Both detail and summarized files are aged through the \data folder hierarchy using a common
set of automatic file management parameters. Once you create a summarized file, it is subject to
the same rules for automatic migration, archival and, ultimately, deletion on the local system disk
where it was created. The summarized file created during Cycle End command processing is
stored in the default \data\Previous\ folder. Once you create a sum.smf collection file, the
Collection Service automatically manages it according to the same aging criteria used for detail
level collection files.
You can run the Summarization Utility against any .smf detail or summarized file, and you are
not limited to running the utility during Cycle End processing. The default summary interval is
15 minutes, but you may select any summarization interval that is an integer multiple of the
source file's collection interval using the -S command line switch.
Stopping Data Collection
Under normal circumstances, the Collection Service executes continuously until system shutdown
when the service is terminated by the Service Control Manager. When the Collection Service is
notified by the Service Control Manager to stop, the service creates a set of final Interval data
records to record system activity up to the point of termination and writes them to the current
data file, closes the file, and then terminates. System activity data up to the point of termination
is recorded in the collection file.
Execution of the Collection Service can be stopped using the Administrative Tools, Services
applet. You can also use the net commands to stop and restart the service:
net stop dmperfss
net start dmperfss
30
Performance Sentry User Manual
Installation and Operation
In addition, to stopping and restarting the Collection Service, you can use the Automation
Interface (described in detail in Chapter 7) to Suspend and Resume collection at any time
using specified commands.
Alternatively, you can Suspend and Resume data collection by defining a Collection Period.
Defining a Collection Period allows you to control when data collection is active by time of
day and/or day of the week.
Automation Interface
The Automation Interface allows you to write scripts that control the operation of the Collection
Service. Whenever you must make a change to the operational procedures in effect across many
machines on your network, consider using the Automation Interface to simplify the change
process. The Automation Interface is implemented using the DmCmd.exe utility program.
DmCmd provides a command line interface that allows you to send commands to the Collection
Service so that you control the operation of the Collection Service using a script. Using the
Automation Interface, you can Suspend data collection, Resume data collection, Switch
between DCSX definition files, and check the Status of the service.
If you need to add new Performance objects and counters to the current set you are collecting or
you need to change runtime parameters like the data collection interval or the Cycle Hour,
consider using the Automation Interface to apply your change in a consistent and uniform
manner across your network. The first step is to revise your existing DCS definition or create a
new one that incorporates all the changes that you wish to make. Using a script, copy the revised
DCSX definition file to all the machines that you wish to change. Then execute the DmCmd
utility to invoke the Automation Interface to Notify the Collection Service that you want the
change to occur. Typically, you will instruct the Collection Service to pick up the changed DCS
beginning with the next regularly scheduled Collection Cycle. This allows you to apply a change
uniformly and consistently across a large number of machines. For example, to Switch to a new
DCS at the next scheduled cycle end, issue the following command:
DmCmd -fMyDCS.dcsx -cc -scomputername
This assigns a new DCS definition file and notifies the Collection Service that you have made
the change. To switch immediately to a new DCS, issue the following command:
DmCmd -fMyDCS.dcsx -cc –scomputername
If you replaced the current active DCS definition file with a newer version, you can drop the -f
file Switch parameter and simply issue the Notify command:
DmCmd -cc -scomputername
Note: if you update the currently assigned DCS definition file, but neglect to Notify the
Collection Service that you want the change to occur, the revised DCS definition file will only
take effect the next time the Collection Service initialization occurs and the assigned DCSX
definition is located.
You can also use the Automation Interface to determine the Status of the Collection Service by
issuing the following command:
DmCmd -ct0 -scomputername
31
Performance Sentry User Manual
Installation and Operation
The Status command returns an acknowledgment, followed by the current machine
environment: the OS version, the OS maintenance level, the service status, the suspend reason,
the Performance Sentry Collection Service version, the scheduled DCS name, the DCS location,
and the DCS file name, if applicable. For example:
DmCmd -ct0 -sfoo
returns the Status of the Collection Service running on a machine named foo.
DmCmd communicates with the target system across a named pipe interface. If the Collection
Service is running on a machine protected by a firewall, DmCmd running outside the firewall
cannot access this machine. In that case, you must execute DmCmd on a machine inside the
firewall. If you do not supply an -scomputername parameter, DmCmd will communicate with the
Collection Service executing on the local machine.
Complete documentation on the Automation Interface’s DmCmd utility program is provided in
Chapter 7.
Collection Service Files
The Collection Service uses a number of different files, and it is important to understand how
each is used during normal operations. The following files are used by the Collection Service:
DMPerfss.exe -This is the program executable image file. It cannot be modified while the
service is running. It is located in the \NTSMF root folder. The standard image file that is
installed includes Debug symbols which are used to create a diagnostic report which is written to
the NTSMF.log file if a fatal error occurs.
DTSFnd.dll -This program provides runtime services for the DMPerfss program. It cannot be
modified while the service is running. It is located in the NTSMF root folder.
PSSMsg.dll -This is the message services file program used by the DMPerfss program. It
cannot be modified while the service is running and is located in the NTSMF root folder.
DmCmd.exe -This program supports the Automation Interface. It is used to control the
operation of the Collection Service via a command line interface.
DMSumSMF.exe -This program summarizes the .SMF data logs. The summarized files that
the program produces are identical to the format of the NTSMF collection data file, but with
longer intervals.
PKZIP25.exe -The PKZIP utility is optionally used to compress .smf data logs at the
conclusion of each Collection Cycle. For more information on this option, see Chapter 4, “File
Management, PKZIP Compression”.
namedDCS.dcsx - These are DCS definition files which you have created using the
Performance Sentry Administration DCS Editor. They contain parameter settings that override
any other DCS specification, once assigned and activated. Exported DCS files are optional. They
must be located in the \NTSMF root folder. Only one DCS file at a time can be assigned to the
Collection Service and activated, although you can keep multiple DCS definition files in the
\NTSMF root folder. Following initialization, the DCSX definition file is closed so that changes
to it can be made while the service is running. Changes are activated the next time the
initialization sequence is executed, either following service start-up, or as a result of a notification
either from the Sentry Administration program or the DmCmd Automation Interface. You can
automatically switch from one named DCSX file to another at a predetermined time using the
32
Performance Sentry User Manual
Installation and Operation
DCS chain scheduling feature, or use the Switch command of the Automation Interface. You
can also deactivate a named DCSX files using automation.
systemname.yyyymmddhhmmCustomQualifer.smf - The collection data file is written continuously
by the Collection Service. The Collection Service stores data collection logs in the \data
subfolder under the C:\Program Files\NTSMF40 program folder by default, but the location
of the data folder can be changed using the Sentry Administration program by modifying the
folder where SMF files are stored start-up parameter. Hierarchical file management creates three
subfolders of the \data folder and moves collection files between the \Current, \Previous, and
\Archive subdirectories according to the file migration rules you specify. Using the Shared file
option, the active collection file can be accessed by other applications while it is in use. The
format of the data collection file is documented in Appendix A.
systemname.yyyymmddhhmmCustomQualifer.sum.smf – A summarized data file is written by
DMSumSMF.exe, usually as part of Cycle End processing. The record format is identical to the
detail data file, except the intervals are summarized. The summarized file is stored in the same
folder as the detail file and migrated through the hierarchy of folders subject to the same aging
rules as the detail file.
systemname.NTSMF.log - A message log maintained by the Collection Service. The message
log file is created in the same folder as the current data collection file. During normal operation
of the service, the message log file can be read by applications like Wordpad or MS Word. The
message log is allocated as a fixed size file, and is managed according to your specifications.
When the Collection Service reaches the end of the file, it renames the old log file to
systemname.NTSMF.OLD.LOG
and
begins
recording
messages
in
a
new
systemname.NTSMF.LOG file.
systemname.NTSMF.sum.log - A message log maintained by the Summarization Utility. The
Summarization message log file is created in the same folder as the current data collection file.
Using SMS for Installation
Microsoft’s Systems Management Server (SMS) or another similar package can be used to
simplify multiple installations of the Performance Sentry Collection Service across your network.
As instructions for installing the Collection Service using SMS on your individual network are
beyond the scope of this manual, we suggest that you build an SMS package based on the manual
installation instructions listed above. Contact [email protected] if you have any
questions regarding the files necessary for installing the Collection Service.
33
3
Performance Sentry
Administration
The Performance Sentry Collection Service runs unattended, using runtime parameters that are
stored in an external file. These parameters are all associated with a Data Collection Set. A
Data Collection Set (DCS) specification defines the performance objects and counters that are
collected, the data filters that are active, the collection interval, the location of the data files, the
file duration, and the time of day the data file is closed and a new file opened. The Sentry
Administration program is used to define, edit, assign, activate, and monitor Data Collection
Sets.
This chapter of the manual describes the operation of the Sentry Administration program and its
component parts: the DCS Editor, Network Browser, and Administration. Please note
that changes you make to Data Collection Sets using the Sentry Administration DCS Editor are
not applied to any copies of the Collection Service that are running until you explicitly Activate
them.
The Sentry Administration program provides an intuitive, graphical user interface for managing
the Collection Service running across your network. This interface allows you to see the
Windows Servers running on your network, determine the current status of Performance Sentry
data collection on those machines, and change the data collection parameters on the fly. This is
liable to become tedious if you have to administer data collection across dozens of machines or
more. The Automation Interface allows you to script Collection Service management procedures
that scale to the enterprise level. The direct manipulation facilities of the Sentry Administration
program can then be used to augment these automated procedures.
When you install the Performance Sentry performance data Collection Service, as described in
Chapter 2, it uses the Default Collection Set by default. You do not have to assign a Collection
Set to run Performance Sentry data collection. It is only when you want to change the collection
parameters that you must use Sentry Administration. As a practical matter, you probably will
define Collection Sets that are tailored to your environment, and then use Sentry Administration
to set up and administer Performance Sentry data collection.
34
Performance Sentry User Manual
Performance Sentry Administration
In general, Performance Sentry data collection administration involves:
•
Defining Collection Sets and their parameters,
•
Assigning Collection Sets to Windows computers that you want to monitor, and
•
Monitoring the status of the machines that are collecting Performance Sentry
performance data across your Microsoft Network.
By default, the Setup program installs PerfSentryAdmin.exe in the installation folder. To
start the program, execute the Performance Sentry program from the Start Menu or run the
Windows Explorer and double click on the program. When you run Sentry Administration for
the first time, you will see a window like the one shown in Figure 3.1.
Figure 3.1 Main Window of Sentry Administration showing the Data Collection Set item selected with the Default Collection
Set in context.
35
Performance Sentry User Manual
Performance Sentry Administration
Data Collection Sets
As illustrated, the main Performance Sentry DCS Administration window shows the Available
Data Collection Sets that are defined. When the user selects the data collection set on the left
side of the windows, the appropriate context is loaded in the right side of the application
window.
A Data Collection Set has four components:
•
The data definition of the objects and counters in the set, which determines the
content of the Performance Sentry data log file. This is known as the DCS data
definition.
•
The collection parameters for the Collection Set that determine the measurement
data interval duration, cycle time, and other parameter values that are accessed by the
data collection service at start-up. These are known as the DCS start-up
parameters. Chapter 4 of this document contains a complete description of the DCS
start-up parameter values and what they do.
•
The collection filters that modify the default behavior of the Collection Service based
on data values observed at the time of collection. Chapter 5 of this document describes
filters and how they work.
•
The collection alerts and alert recipients that allow the administrator to specify
recipients to be notified of system events. Chapter 6 of this document describes alerts
and how they work.
The Sentry Administration program reads the Master Collection Set, which contains all
known performance objects and counters. The Master Collection Set is used to define proper
subsets of objects and counters which you can name, and use. You cannot delete this Collection
Set. You also cannot permanently delete objects and counters from this Collection Set.
There are also a number of predefined Collection Sets. These are discussed in more detail in
Appendix B. You can modify and/or delete these Collection Sets. They contain suggested object
and counter definitions and parameter values that we believe work well in designated
environments. You can use them as the basis for creating customized Data Collection Sets that
fit your environment.
The following illustration shows the layout to view and modify the Data Collection Sets. The
DCS List Panel displays the list of DCSX files in the application’s input directory. The
information panel shows the DCS information for the selected DCS. The DCS configuration
panel allows the user to configure the data collection set. The DCS startup parameters can be
modified through the property window which is shown by pressing the Show Properties link.
The user can save or cancel any changes using the links in the upper right corner.
36
Performance Sentry User Manual
Performance Sentry Administration
Figure 3.2 The Performance Sentry Administration application with major panels annotated.
DCS Configuration Panel
The DCS configuration panel has four tabs (Objects, Counters, Filters, Alerts) to configure the
Data Collection Set. The user can configure the objects and counters to be collected through the
objects and counters tab. The user can also configure the filters and alerts on the DCS
configuration panel. When changes are made in the configuration panel, they are not saved to the
DCS until the Apply link is selected. To rollback the changes, select the Cancel link.
37
Performance Sentry User Manual
Performance Sentry Administration
DCS List Panel
The DCS list panel contains the list of data collection sets available in the application folder.
Right-click a panel item to show the context menu.
Figure 3.3 The DCS List panel context menu.
Default Collection Set
The Default Collection Set contains the default list of suggested objects for data collection. It
can be modified but this will not affect collection sets previously created from the Default
Collection Set before it was changed. Collection sets are not linked to the Default Collection Set
once created.
Activating a DCS
The DCS List Pane provides one way to activate a DCS on a particular machine by right
clicking on the DCS. See Figure 3.3 above. A DCS can also be activated through Machine
Management.
38
Performance Sentry User Manual
Performance Sentry Administration
Creating a new DCS
To create a new DCS, the user selects the new operation. This will create a new DCS with a
default name and the same settings as the Default Collection Set. The user will then utilize the
Rename option to rename the DCS. See figure 3.4 below.
Figure 3.4 The DCS List panel after renaming a new DCS.
Note: To cancel renaming a DCS, press the Escape key on the keyboard.
New collection sets also can be created with settings from another collection set by using the
Copy and Paste function.
DCS Information Panel
Once a DCS is selected in the DCS List Panel, the DCS information is updated in the DCS
Information Panel at the top of the Performance Sentry Admin screen.
Figure 3.5 DCS Information Panel with deployed machines list expanded.
The information panel displays the data collection set name, creation date, and last modified by
and date. There is also a deployed machine list that can be expanded with the expander button.
By right-clicking the machine name, the DCS can be deactivated automatically.
39
Performance Sentry User Manual
Performance Sentry Administration
Object Definition
The selected objects are on the left part of the screen and available objects from the Master
Collection Set are on the right part of the screen. To select objects for the Data Collection Set,
utilize the arrow buttons to place objects in and out of the Data Collection Set.
Note: There is also a Find: box on the available objects list to facilitate locating available objects
if the list of available objects becomes unmanageable.
Figure 3.6 DCS Configuration Panel object definition tab.
40
Performance Sentry User Manual
Performance Sentry Administration
Counter Definition
The Counter Definition tab allows the user to select available counters for a particular object in
the data collection set. All of the objects in the data collection set are in the counter definition
drop down. Use the arrow buttons to add or remove counters from a particular object in the Data
Collection Set.
Note: If no counters are specified for the object, then all the counters for the object will be
collected by default.
Figure 3.7 DCS Configuration Panel Counters tab.
41
Performance Sentry User Manual
Performance Sentry Administration
Filter Definition
The Filters tab displays the list of available filters and whether a filter is enabled. To enable or
disable a filter, toggle the Enabled filter check box in the filter column. The filter information for
the currently selected filter is shown in the right pane. The user can select the filter template for
the filter and enter the template parameters to customize the filter.
Figure 3.8 The DCS Configuration Panel Filters tab.
Filter Templates
A filter template contains the definition for a particular filter. The templates are predefined and
stored in the data collection set’s DCSX file along with the list of filters. As this time, the
templates cannot be edited in the Performance Sentry Administration application. The filter
definition is displayed as read-only on the filter definition tab.
To modify the behavior of the filter, enter a variable in the variable text box separated by a
comma for each parameter in the filter definition such as %1 or %2. The predefined filters
already have default parameters specified so there is no need to modify them unless different filter
behavior is desired. The filter parameters are stored with the filter in the DCSX file separately
from the filter template. This is done because the same template can be utilized among multiple
filters.
Figure 3.9 The DCS Configuration Panel Alerts tab.
42
Performance Sentry User Manual
Performance Sentry Administration
Filter Editing
Filters can be created, copied, or deleted by right clicking on the filter and selecting the desired
action from the context menu.
Note: When a new filter is created, select the filter template from the filter template drop down.
Alerts
The Alerts tab contains a list of alerts for the data collection set. To enable an alert, check the
Enabled alert box. Once an alert is selected, the alert will display the definition and transitions
tab to the right. These tabs define the alert behavior.
Figure 3.10 The DCS Configuration Panel Alerts tab.
43
Performance Sentry User Manual
Performance Sentry Administration
Alert Definition
Alerts are defined by their selected template. The same definition language is used for the filter
templates and alert templates. Like the filter templates, the alert templates cannot be modified at
this time through the Performance Sentry Administration. The severity of the alert can be set on
this tab.
Figure 3.11 The Alert Definition tab.
Alert Transition
Events are fired based upon the alert definition. The Alert Transitions tab allows the user to
specify how the alert will transition to the next state. The user can also specify a limit on the
maximum number of time an alert can be re-armed in a cycle.
Figure 3.12 The Alert Transitions tab.
44
Performance Sentry User Manual
Performance Sentry Administration
Alert Recipients
When an alert event fires and the alert is in a triggered state, Alert Recipients assigned to the
severity level of the alert are notified. Performance Sentry 4.0 currently supports two types of
alert recipients. The Event Log type allows administrators to use event log scraping to find alert
information on each machine where the collector is running. SMTP recipient type is used to
have Performance Sentry send an SMTP message with the alert information using the specified
SMTP configuration. Recipients have to be associated to the alert by severity by the
administrator. There is a default Event Log recipient created at installation time to log all Fatal,
Error, and Warning severity alerts.
Figure 3.13 Alert Recipient screen.
The Alert Recipient screen shows the default installed EventLog recipient and a hypothetical
selected SMTP alert recipient configured to receive all Fatal, Error, and Warning alerts. If the
All Alerts check box is unchecked, then the selected and available alerts will be enabled. This will
allow the user to create a recipient for a specific alert or alerts.
45
Performance Sentry User Manual
Performance Sentry Administration
SMTP Configuration
The specified SMTP configuration is used for all alert recipients with the SMTP recipient type.
The “From Address” is the email address that identifies who is sent the alert information. If a
password is required for SMTP, use the Set Password link. The password is then encrypted and
stored in the DCSX file.
Figure 3.14 SMTP Configuration panel.
46
Performance Sentry User Manual
Performance Sentry Administration
DCS Properties
When the user presses the ‘Show Properties’ link, the Properties panel expands. This interface
allows the user to modify properties in the data collection set. The properties are the same
properties from Performance Sentry 3.0 but arranged in these groups with expanders. The five
property categories are Cycle, Scheduling, File Contents, File Management, and Messaging.
When a property is changed, the ‘Apply Changes’ link will become enabled. The user can then
save the changes to the DCSX file with the ‘Apply Changes’ link or cancel the changes with the
‘Cancel’ link.
Figure 3.15 The DCS Properties list with Cycle parameters expanded.
47
Performance Sentry User Manual
Performance Sentry Administration
DCS Exporting and Importing
Since the Data Collection Sets are DCSX files, there is no need to import or export a Data
Collection Set. To import a Data Collection Set for editing copy the DCSX file to the
Performance Sentry Administration directory. The DCSX files are already in the file system so
they don’t need to be exported.
Machine Management
The Machine Management item is used to manage the data collection of specific machines. The
panel includes a Network Browser which can be filtered by unmanaged or managed machines.
Managed machines are machines which have Performance Sentry installed. Selecting a managed
machine causes the status information to be updated in the right section of the screen.
Figure 3.16 The Machine Management item selected showing Performance Sentry Status for the machine ‘Venice’.
48
Performance Sentry User Manual
Performance Sentry Administration
Activating a Collection Set
A collection set can be activated on a machine by right clicking the machine name and selecting
Activate DCS. Once the Activate DCS option is selected, the user will be prompted to select the
DCS to activate. The collection cycle is restarted after this command is issued. This machine is
then stored in the list of Managed machines.
Deactivating a Collect Set
This command causes the service to stop using the specified DCS and begin using the Default
Collection Set.
Suspending & then Resuming Performance Sentry Collection Service
The Performance Sentry Collection Service can be suspended or resumed with the context menu
Suspend or Resume options.
Figure 3.17 The machine management with the ‘Active DCS…’ operation being selected and both managed and
unmanaged machine visible.
Collection Service Status
The status can be retrieved with the Get Service Status option.
Refreshing the Machine List
The machine list can be refreshed through the Refresh command on the context menu.
49
Performance Sentry User Manual
Performance Sentry Administration
Master Collection Set
The Master Collection Set is a collection of all counters and objects known to Performance
Sentry Administration. It is stored in the same format as a regular Data Collection Set in a
DCSX file. The name of the DCSX file is Master Collection Set.dcsx. The difference is that the
Master Collection Set only has objects and counters and does not have data collection
parameters, filter, or alert information.
Master Data Set Objects
Only objects in the Master Collection Set can be added to a Data Collection Set. These objects
are shown on the right side of the Object Definiton screen in the available objects list. When the
administrator needs to add objects from a new machine or operating system to a Data Collection
Set, the desired objects may not be available in the Master Collection Set. The solution is for the
administrator to go through the Object Discovery process and add the objects to the Master
Collection Set.
Adding Objects to the Master Collection Set
To add objects to the Master Collection Set, select the Administration item in the application.
Once selected, the Object Discovery panel will be displayed. Through this mechanism, the
administrator can discover and add new objects to the Master Collection Set. The adminstrator
will browse to a machine which contains the new objects by pressing the ‘…’ button on the right
side of the screen. Once the machine is selected, Performance Sentry Admin will attempt to
retrieve the list of performance objects on the machine. Objects from the machine which are not
in the Master Collection Set are added to the available objects list.
Figure 3.18 The Master Collection Set Object Discovery screen shows the retrieved objects from the machine VENICE
which are not in the Master Collection Set.
Objects can be added to the Master Collection Set with the ‘ < ’ button. Changes to the Master
Collection Set can be saved or cancelled through the Apply Changes or ‘Cancel’ link. When the
user presses the Apply Changes link, Performance Sentry Administration saves the changes to
the Master Collection Set DCSX file.
50
Performance Sentry User Manual
Performance Sentry Administration
Note: In order to retrieve the list of performance objects, the user running Performance Sentry
Administration will need to have accesss rights to the performance counters of the remote
machine.
Pattern Objects
Due to performance library implementation or operation system evolution, it may be necessary to
collect a set of objects specified by a wildcard pattern. The primary example of this is the
Microsoft implementation of the SQL Server performance objects.
SQL Server Performance Objects
The instanced SQL Server performance objects have the instance name of the database in their
counter name. In order to collect all the SQL Server objects for the enterprise using a generic
Data Collection Set for all machines, all of the instance specific counter names would have to be
specified. This is difficult to maintain if not impossible without the creation of a pattern object.
Figure 3.19 PerfMon showing the SQLAgent$ instanced object with the database instance names.
Adding a Pattern Object to the Master Data Collection Set
To add a pattern object to the Master Collection Set, select on the object that is the ‘base’ object
for the pattern objects that you would like to make a pattern object. On the bottom of the list of
available objects on the network machine, there is a section of the screen for adding pattern
objects. The name of the selected object is shown in the Object Name: text box.
Figure 3.20 The Pattern Object interface with the SQL$LAUDERDALE:Alerts object selected.
51
Performance Sentry User Manual
Performance Sentry Administration
A ‘*’ can replace the specific instance name in the object name to make a pattern object. When
the ‘<’ button is pressed, the pattern object name is then added to the Master Collection Set. The
pattern object will then appear in the list of objects in the Master Collection Set so that it can be
added to any data collection set using the Object Definition function.
Figure 3.21 The Pattern Object interface with the SQL instance database name replaced with ‘*’.
Note: All counters from the selected object will be added to the data collection set.
Note: Pattern object IP* can be used to ensure all versions of the IP objects, such as IPv6 or IPv4,
are collected for the different Windows operating systems. A TCP* object can also be specified.
Removing Objects from the Master Data Collection Set
There is no facility in the Performance Sentry Administration application to remove an object
from the Master Collection Set. If an object is removed from the Master Collection Set without
first removing it from all Data Collection Sets, then Data Collection Sets could have orphaned
objects which are not in the Master Collection Set and may cause errors in Sentry
Administration. Leaving objects in the Master Collection Set even if they are not used in any
data collection sets will not have an impact on data collection. If it becomes necessary to remove
objects from the Master Collection Set please contact [email protected].
Demand Technology Updates
When the Master Collection Set is edited, the user will be prompted to send the new Master
Collection Set.dcsx file to Demand Technology. When this file is changed, it should be sent to
[email protected] so that Demand Technology can continue to provide support for the
newly discovery objects and counters.
Data Migration
Since the new Data Collection Sets are stored in DCSX files, existing installations will require
that previous Data Collection Sets be migrated into this format. The DCS MigrationTool was
created to export all of the Data Collection Sets from the Performance Sentry.mdb access
database into DCSX files. The conversion to the new DCSX is performed on each Data
Collection Set in the database. The resulting DCSX file is then stored in the output directory.
This process typically will be done automatically during the Performance Sentry Administration
installation.
Converting Exported Data Collection Sets
If a Data Collection Set is not in the Performance Sentry.mdb but it has been exported to
another machine to a .dcs file, it will not be converted by the installation program. To do the
conversion of this DCS file, it will have to be imported using Performance Sentry Admin 3.x.
Once the DCS has been imported, the DCSMigrationTool can be run again and the resulting
DCSX file can be copied to the Performance Sentry Collection Service directory.
52
Performance Sentry User Manual
Performance Sentry Administration
Running DCSMigrationTool
If you attempt to run the DCSMigrationTool to the same directory where it was already run, it
will not migrate the Performance Sentry.mdb again unless the Performance Sentry.sdf SQL
Server Compact database file is deleted. If the file is deleted, then the DCSMigrationTool will
overwrite all of the DCSX files in the directory. For this reason, it may be helpful to use the
provided command line parameters for input and output paths to the tool.
Command Line Parameters
The DCS Migration Tool has several command line parameters which can be used to customize
its behavior.
Parameter
Description
-InputPath
Specifies where the Data Migration Tool will find the Performance Sentry.mdb
-OutputPath
Specifies where the DCSX files will be saved after the import.
-AddAlerts
If this parameter is not specified, then the default alerts will not be added to the
Data Collection Sets. This is useful if the administrator does not want to
activate the alert functionality.
Retiring Objects
The Data Migration Tool has the ability to remove retired objects from the Performance
Sentry.mdb during the migration process. If the file RetiredObjects.xml exists in the directory of
the Data Migration Tool, then it will be loaded and parsed. The objects listed in the file will not
be added to the resulting Data Collection Sets. Objects are added to this file manually.
53
4
Runtime Parameters Reference
The Performance Sentry Collection Service runs unattended, using runtime parameters that are
stored in the Data Collection Set DCSX xml file. A Data Collection Set (DCS) defines the
performance objects and counters that are collected, the collection interval, the location of the
data files, the file duration, the time of day the data file is closed and a new file opened, and many
other runtime parameters. This section of the manual describes each of the runtime parameters
that are used to control the operation of the Performance Sentry Collection Service.
When you install the Performance Sentry performance data Collection Service, as described in
Chapter 2, the service automatically uses the parameters defined in the Default Collection Set
collection set. When you activate a Data Collection Set using the Performance Sentry
Administration application or the DmCmd Automation Interface, the Performance Sentry
Collection Service uses the parameter values you specify. When activating a Data Collection Set
using the Performance Sentry Administration, it will always assign the Data Collection Set and
then restart the collection cycle with the new parameters. The DmCmd automation interface
provides the flexibility to perform these two steps separately.
For convenience when you are editing a DCS using the Sentry Administration program, data
collection service parameters are organized into the following groups:
•
Cycle – parameters that determine the collection interval, the cycle time, cycle duration,
and actions taken at cycle end.
•
Scheduling — parameters that control the next DCS or collection period activation.
•
File Contents — parameters that control the content of the data collected.
•
File Management — parameters that determine the location and management of the
Performance Sentry collection files.
•
Messaging — parameters that control the error and information messages that the
service produces.
Some of the parameters have no defaults and must be specified in order to use the function.
54
Performance Sentry User Manual
Runtime Parameters Reference
Current Parameter Values
The current start-up parameter values that the Performance Sentry Collection Service uses are
based on the Data Collection Set assigned. Several mechanisms are available to help you keep
track of the start-up parameters that are in effect on specific machines.
The Performance Sentry Collection Service reports the current values of all runtime parameters
as an Information message in the Windows Server Event Application Log, as illustrated in
Figure 4.1. The Event Category is Initialization and the source of the message is DMPerfss. The
same information is also recorded on the NTSMF.log logfile, if that facility is being maintained.
The next section of this chapter describes each of the parameters, their valid settings, and what
they do.
Figure 4.1 DMPerfss Event Log Entry at Initialization documents the current start-up parameter settings.
55
Performance Sentry User Manual
Runtime Parameters Reference
Startup Parameter Values
The Collection Service start-up collection parameters and their acceptable values are as follows:
Collection Cycle
The Collection Cycle parameters are used to set the interval duration used for data collection and
to define the period of time you expect each data collection file to represent. Together, the Cycle
Hour Start and Cycle Duration parameters define the length of a data Collection Cycle. At the
end of a cycle, the current data collection file is closed and a new collection file is created. The
Collection Service can also issue a command, execute a script, or launch a program at the end of
each Collection Cycle. It can schedule the command you specify immediately when the cycle
ends, or a specified number of minutes after the cycle ends. Or the Collection Service can launch
the command a random number of minutes within a specified command processing window.
Cycle Hour (default 3)
Cycle Hour determines the hour of the day that a new Collection Cycle starts. It represents the
hour of the day, in 24-hour notation, that the current data collection log file will be closed and a
new file created and opened. Set Cycle Hour to 0 to cycle at midnight.
Each Collection Cycle starts on the Cycle Hour (except, possibly, the initial cycle) and lasts for
Cycle Duration hours.
Cycle Duration (default 24)
Cycle Duration specifies the length of time in hours, that data will be written into the current
file. The data file will be closed and a new file opened at the end of this period (also see Cycle
Hour).
When you specify a value less than 24 hours for Cycle Duration, the Collection Service always
cycles the file on the Cycle Hour. Each cycle starts on the Cycle Hour (except, possibly, the
initial cycle) and spans a Cycle Duration number of hours. The following examples illustrate how
these values are used:
Example 1: Suppose you set the Cycle Hour to 18 and the Cycle Duration to 12.
Performance Sentry collection files will cycle daily at hour 6 and hour 18.
Example 2: Suppose you set the Cycle Hour to 18 and the Cycle Duration to 4.
Performance Sentry collection files will cycle daily at hours 2, 6, 10, 14, 18 and 22.
Cycle End Command
Specify the program, script, or command file to be executed at cycle end. The Cycle End
command parameter is optional and has no default value.
The Cycle End command you specify is launched as a separate process by the DMPerfss
Collection Service using a call to CreateProcess(). The first word in the Cycle End command
string is passed to CreateProcess as the Process Image file. You must code both the file name and
extension of the program or script you want to execute. The remainder of the Cycle End command
string is passed as arguments to the program being executed. Following launch, the Cycle End
command program executes independently of the DMPerfss Collection Service.
56
Performance Sentry User Manual
Runtime Parameters Reference
For example, to execute a .bat command file called SampleCommand, type the following Cycle
End command string:
SampleCommand.bat @DFMType @OutputDir @LastDataFile
SampleCommand will then be launched as a separate process, with the arguments you specified
passed to that program. Process image files that can be launched in this fashion include .exe, .bat,
and .com files.
The Cycle End command can reference a program or a script, as illustrated in the following
example which executes the Performance Sentry data Summarization Utility:
DMSumSMF.exe @LastDataFile:F @StartupDir
To execute an internal Windows Server command, such as copy, you must invoke cmd.exe /c
followed by the copy command string, as illustrated below:
cmd.exe /c copy @LastDataFile MYSERVER\\C:\ntsmf\*.*
Note: The Network Browser Notify command causes Cycle End processing to take place
immediately. This feature is very handy when you are debugging a Cycle End command script.
You can reference a fully qualified name for the image file or a partial path and allow
CreateProcess to search for it. The Windows CreateProcess routine searches for the specified
image file in the following places, in sequence:
1.
2.
3.
4.
5.
The root folder where DMPerfss.exe is located.
The output folder where the .smf files are written.
The 32-bit Windows Server system folder, %root\system32.
The Windows Server root folder.
The folders that are listed in the PATH environment variable. Note that the PATH
used depends on the Account context. By default, DMPerfss and any processes it
spawns run under the System Account, which normally has no PATH environment
variable initialized.
When the Cycle End command script you specify is executed, it runs in the device context of the
DMPerfss service, which by default does not interact with the desktop. The effect of this is that
the script cannot generate any output that you can see. However, you can modify this behavior by
redirecting the output of the script to a file, as illustrated below:
SampleCommand.bat @DFMType @OutputDir @LastDataFile >output.txt
57
Performance Sentry User Manual
Runtime Parameters Reference
Figure 4.2 When coding the Cycle End command parameter, specify the full file name, including the extension that you
want the Collection Service to launch at cycle end.
If the fully qualified file name and path contains spaces, enclose the entire pathname in double
quotes (“”). In addition, if any of the arguments contain spaces, they also should be enclosed in
double quotes.
Keyword variables. You can pass parameters to your Cycle End command script using keyword
text variables that allow you to customize the commands being issued. These keywords, among
other functions, allow you to reference the actual file name being processed, for example. All
valid keywords start with the “@” character. The command line is parsed, and each recognized
keyword variable is replaced by an appropriate character string before the actual call to
CreateProcess is issued. Figure 4.3 illustrates the Event Log entry that DMPerfss makes during
Cycle End command processing after the string substitution has been performed. This
information message can be useful when you need to debug a Cycle End command script or
program.
58
Performance Sentry User Manual
Runtime Parameters Reference
Figure 4.3 Application Event Log entry showing the Cycle End command that the Collection Service DMPerfss issued after
keyword text substitution has occurred.
Chapter 7, “Utilities” documents Cycle End command processing and includes several examples
that illustrate different ways you can use the Cycle End command processing facility to automate
.smf data file processing. A script that you test and debug under your desktop’s login authority
can fail when DMPerfss submits it because it does not have the same authority to access a
network drive or other resource as your desktop login Account. You may need to assign an
Account with the appropriate privileges to for the collection to impersonate to allow your Cycle
End command script to run. To set up the Performance Sentry Collection Service to impersonate
an authorized User Account during Cycle End command processing, specify the -account and password keywords at installation as follows:
dmperfss -install -account DomainName\myAccount -password
xxxxxxx
If the Collection Service is already installed, you can also use the Automation Interface to set up
or change impersonation for Cycle End command processing by issuing the following command:
dmcmd -account DomainName\myAccount -password xxxxxxx
For more information on security considerations running the Collection Service, see Chapter 2,
“Installation and Operation.”
59
Performance Sentry User Manual
Runtime Parameters Reference
Run Command only at Cycle Hour? (default Yes)
The Cycle End command that you define is issued at every cycle end event where an old
collection file is closed and a new one is created. This includes cycle end events initiated by
switching DCS file definitions or issuing a Notify command to the Collection Service using the
Network Browser. Code a value of Yes to run the Cycle End command only on the Cycle Hour.
This is the parameter setting normally used in production. During development and testing of
your Cycle End command scripts, check the box marked No so that the command is launched at
the end of each Collection Cycle end. Then issue a Notify command to the Collection Service
using the Network Browser to invoke Cycle End and immediately launch the Cycle End
Command you specified.
Cycle End Command Launch (default Immediately)
By default, the Cycle End command is launched immediately. To avoid network congestion,
there are two scheduling options available to help you stagger the times when the Cycle End
command is issued. You can set the Cycle End command to be launched at a precise number of
minutes after Cycle End processing.
Or you can define a Cycle End command processing window and instruct the Collection Service
to launch the Cycle End command a random number of minutes into the Cycle End command
processing window you have defined. This option allows you to stagger Cycle End command
processing automatically for a large number of machines using a common DCS specification.
Collection Service Error Command
When the Performance Sentry Collection Service encounters an unrecoverable error condition
that results in either suspension or termination of the Collection Service, the specified Collection
Service Error command will be executed before the Suspended state is entered. All the rules of a
normal Cycle End command apply, except that the command will be executed immediately.
Keyword substitution and syntax are also the same as for Cycle End commands.
Collection Interval Length (MM SS) (default 1 minute)
Collection Interval is the amount of time, in minutes and seconds, between each data sample.
These are typically set at 1, 5, 10, 15, 30 or 60 minutes. Performance Sentry will synchronize data
collection to the time interval set. For example, if the parameter is set at 1 minute and execution
begins at 9:07:26, the first sample will cover the period from initialization until 9:08. Thereafter,
each sample will be taken at 1 minute intervals. The actual duration of the sample, to millisecond
precision, is recorded in the Configuration record written at the beginning of every collection
interval. See the section entitled “How Performance Sentry Tells Time” in Appendix A for more
details.
Start Marker Seconds (default 0)
This parameter governs the writing of a start marker record. If this parameter is zero, no start
marker will be written. Otherwise, a start marker record will be written the specified number of
seconds after the collection data file is opened. Generally, a Start Marker is useful in testing
whenever you do not want to wait Interval Seconds amount of time until the first data record is
written. The default option is to not write a Start Marker record.
60
Performance Sentry User Manual
Runtime Parameters Reference
Wait for Perflib DLLs to Initialize (default 60 seconds)
When monitoring Windows, the Collection Service waits for Perflib DLLs to initialize prior to
writing the first data records to the collection file. This parameter determines the maximum
duration of this initial delay. Performance data associated with any Perflib DLLs that do not
respond during this initialization period will not be collected for the duration of the Collection
Cycle. Normally, this parameter does not need to be adjusted upwards or downwards from its
default value. During development and testing of your Cycle End command scripts, however,
you might consider eliminating this delay so that the collections completes initialization quicker
and you get quicker turnaround in testing.
Following a reboot, the Performance Sentry Collection Service often initializes prior to some of
the Perflib DLLs that are resident on the system. Perflib DLLs are the third party modules that
are responsible for gathering specific performance data. The Collection Service opens these
modules during its initial Discovery phase at the start of each Collection Cycle. Some Perflib
modules respond only after a short delay. During Collection Service initialization, the service
automatically retries periodically any Perflib DLLs that fail to respond to a call to its Open
routine. This parameter governs the maximum amount of time (in seconds) that the Collection
Service will wait while it retries any Perflib DLLs that fail to initialize.
After the retry interval expires, the Collection Service will begin writing the collection file for the
performance objects that it has located successfully. Performance objects associated with Perflib
DLL modules that could not be opened are identified in an Event ID 2200 Information
message, as illustrated below:
Figure 4.4 Application Event Log entry showing the Information message that a Perflib module could not be opened to
return data for the requested object.
61
Performance Sentry User Manual
Runtime Parameters Reference
Scheduling
Normally, the Collection Service runs continuously, collecting the Windows Server performance
objects and counters you specify and spinning off a current data file every Collection Cycle.
When you run the Collection Service continuously with the same set of collection parameters,
you may find that you are gathering too much detail about periods of low system activity and not
enough detail for periods of intense activity, which is when performance problems often surface.
The scheduling parameters allow you to vary data collection based on the Time of Day or Day of
the Week.
For example, you may want to suspend data collection overnight and resume data collection
during office hours. You can accomplish this by defining a Collection Period. Or you might want
to monitor certain machines closely during peak periods of activity (say, 10:00 AM to noon
daily), while collecting data less intensely the rest of the time. You can accomplish this using
DCS Chain Scheduling. With DCS Chain Scheduling, you can set up a rotating schedule which
allows you to collect measurement data using a set of parameters appropriate for a peak load
period, a normal load period, and a relatively idle period overnight.
There are several ways you can tailor Performance Sentry data collection by Time of Day or Day
of the Week. You can implement a series of scheduling rules that communicate to the Collection
Service using the Automation Interface (discussed in Chapter 7) to suspend and resume data
collection or switch between exported DCS definition files at designated times. Or you can also
accomplish similar results using the internal scheduling facilities of the Collection Service. This
allows you to control the Collection Service without having to interface to a 3rd party scheduling
tool like the Windows Server Scheduled Tasks applet.
The built-in scheduling facility in Performance Sentry allows you to set up a weekly Collection
Period that determines when to collect performance data and when data collection should be
suspended. When you define a Collection Period, you simply indicate which days of the week
and hours of the day that you would like data collection to be active.
Use the DCS Chain Scheduling feature if you need even more control over the Collection
Service. With DCS Chain Scheduling, you can control the value of any DCS parameter by Time
of Day, including what objects and counters are collected, active filter definitions, and the data
collection interval.
While it is extremely flexible, DCS Chain Scheduling does have some restrictions. You cannot
use DCS Chain Scheduling and define a Collection Period at the same time. They are mutually
exclusive options. The DCS files referenced must reside in the root folder where the Collection
Service is installed. Finally, the chain of Data Collection Sets must form a complete circle. If the
chain is broken, the Collection Service parameters will remain at the point where the broken link
was discovered.
62
Performance Sentry User Manual
Runtime Parameters Reference
Figure 4.5 Scheduling parameters showing Collection Period scheduling.
Next DCS
To set up DCS Chain Scheduling, point the Next DCS parameter to the next link in the DCS
chain. Type in the file name of the DCS definition file you want to switch to, including the .dcsx
file extension, or use the convenient Browse button to locate the DCS file. Then select the Time
of Day that you want the switch to the Next DCS to take place. At the designated time, the
Collection Service will close the current collection file, switch to the Next DCS file, and open a
new collection file based on the new definition, parameter settings and filters.
The Next DCS file that you point to should also contain a Next DCS specification, and so on,
eventually pointing back to the original DCS and completing the chain. Note that the DCS
Editor is not able to verify that you have specified a valid DCS chain. If the Collection Service
encounters an invalid pointer to the Next DCS, the current DCS specification is retained. The
Collection Service must be able to locate the file Next DCS specification you point to in its root
folder in order to switch to the new DCS. The DMPerfss Collection Service issues a Warning to
the Application Event Log with an Event ID = 301 when the Next DCS file specified cannot be
located.
63
Performance Sentry User Manual
Runtime Parameters Reference
When set up correctly, DCS Chain Scheduling creates a new collection file for each DCS
specified in the chain. Verify that the Cycle End command processing you have set up allows for
multiple collection files in the \data\Previous\ folder. Although not required, it is a good practice
to ensure that the Cycle Hour and Cycle Duration parameters (found on the Collection Cycle
tab) are consistent across all Data Collection Sets in the chain. In any case, the current active
DCS specification always determines when cycle end occurs and what Cycle End processing is
performed. Note: the Collection Service cannot switch to the Next DCS if it is suspended at the
time the switch is supposed to occur.
Example. Suppose you wanted one set of collection parameters in place during Prime shift, a
relaxed set of parameters for overnight processing, and a special collection set to monitor peak
load activity from 10:00 to noon daily. You would define four DCS definition files: Morning
Prime collection set.DCS, Peak Load collection set.DCS, Afternoon Prime collection set.DCS,
and the Overnight collection set.DCS with the following Next DCS parameters:
Current DCS
Next DCS
Time to Switch
Morning Prime
Peak Load
10:00
Peak Load
Afternoon Prime
12:00
Afternoon Prime
Overnight
20:00
Overnight
Morning Prime
8:00
Table 4.1 DCS Chain Scheduling example.
Collection Period
A Collection Period defines the hours of the day and the days of the week that data collection is
either active or suspended. Note that the Collection Service will continue to honor the Cycle
Hour you have set even if it is during an hour when the Collection Service is suspended. During
any hours and days that collection is suspended, the Collection Service will continue to respond
to all Sentry Administration and Automation Interface commands. The Collection Service will
then automatically resume data collection at the next appointed hour and day.
Defining a Collection Period is mutually exclusive with DCS Chain Scheduling.
Interval Priority Boost (default High Priority)
The Collection Service threads responsible for data collection can be set to run at either High or
Normal dispatching priority. Best results are usually obtained when High dispatching priority is
used. When Normal priority is selected, the Collection Service threads responsible for data
collection can be delayed by higher priority threads. The validity of many important
instantaneous measurement values can be affected.
When High dispatching priority is used, the priority boost is effective only during time-critical
data collection operations. The Collection Service boosts the priority of its collection threads just
prior to performing data collection. After performance data collection functions are completed,
Performance Sentry reduces the priority of its main thread to Normal for the balance of its
processing, which includes calculation of all counter values and the creation of the Performance
Sentry data records.
64
Performance Sentry User Manual
Runtime Parameters Reference
File Contents
The File Contents parameters control what information is placed in the .smf data collection files
besides Configuration and Interval data collection records. Format or Discovery records are
added to the beginning of the file for the benefit of third party reporting packages. There are also
file contents options that are designed to improve the usability of the .smf collection files with
third party performance data base software like SAS IT Resource Management and Merrill
Associates’ MXG. Figure 4.6 displays the file contents options.
Figure 4.6 File Contents parameters.
65
Performance Sentry User Manual
Runtime Parameters Reference
Write Discovery Records? (default Yes)
A Yes|No flag that controls the writing of Discovery records in the data files. When
WriteDiscovery is turned on, the first series of records in each .smf file describe the object and
counter names found on the monitored system. These format description records are only written
once.
Besides documenting the format of the data file for the benefit of reporting programs like the
Performance Sentry Portal and SAS IT Resource Management, this option is also designed to
help us “discover” new objects for inclusion in reporting and other performance database tools. A
Yes value in this field will trigger writing these records. Refer to the section entitled “What To
Do When You Encounter New Objects and Counters” later in this chapter to find out what to
do if you need to collect data for new objects and counters that are not yet defined in the Master
Collection Set.
Note that not all versions of a reporting or database application are able to handle these records.
Other reporting packages may require them. Ensure that the reporting or database system you
use can process these records before experimenting with this option.
Three Format records are written to describe each performance object completely.
•
Type 5 Format record contains the object name and the counter names for all the
performance counters that are defined in that object. These are required for processing
Performance Sentry data in the Performance Sentry Portal and SAS IT Resource
Management.
•
Type 6 Format record documents the counter type of each counter defined in the
corresponding object. The counter type determines the form of the specific counter field
and controls how Performance Sentry processes it. They are required when you use the
Summarization Utility, which is documented in Chapter 7 and the Performance Sentry
Portal
•
Type 7 record indicates the “level of expertise” (ranging from “Novice” to “Wizard”)
presumably needed to interpret the measurement data in the counter field.
Write Discovery Format records serve three purposes:
(1)
The Type 5 Format records document the format of the data file records, which vary
dynamically according to the Windows Server version and maintenance level. Reporting
programs like Performance Sentry Portal and SAS IT Resource Management require
that Type 5 records be collected to understand the format of the data records that follow
in the file. If you turn off the Type 5 Write Discovery records, you will not be able to
use those reporting packages.
(2)
The Type 6 Format records document the counter type, which determines the logic
used to summarize the counter value. Type 6 Format records are required in order to
use the Summarization Utility, which is documented in Chapter 7. For more
information on the counter types that the Windows Performance API supports, see
Appendix A.
(3)
The default values for the Write Discovery parameters create Type 5 and Type 6
Format records for all performance objects written to the collection file. The Type 5
Format records document the format of the data records that follow and are required for
certain reporting programs. The Type 6 records define the counter type, and are
required for some of the report systems and summarization.
66
Performance Sentry User Manual
Runtime Parameters Reference
See Appendix A for more details on the format of the WriteDiscovery records.
Discovery Record Type (default 5,6)
The Discovery Record Types subparameter determines which Format records are written to the
collection file. There are three types of Format records. Type 5 Format records document the
object name and the counter names for all the performance counters that are defined in that
object. The Type 6 Format records document the counter type of each counter defined in the
corresponding object. The Type 7 Format records indicate the suggested “level of expertise”
needed to be able to interpret the measurement data in the counter field.
Reporting programs that rely on the Format records to determine the format of the data records
that follow only use the Type 5 records.
Discovery Objects (default Existing)
The Discovery Objects subparameter determines which performance Data Object Format
records are written. You can collect Write Discovery Format records for New objects only,
Existing objects only, or All objects. Since Format records are written just once to the beginning
of the file at the start of each Collection Cycle, the default action is to collect Format records for
Existing objects. The New or All setting are used when an application is present or newly
installed which has a performance library and objects that have not been previously captured and
entered into the Master Collection Set.
Configuration Records
By default, the collection file contains configuration data describing the hardware (processor
speed, amount of RAM) and software environment (operating system version and maintenance
level). These Configuration records and the fields they contain are described fully in Appendix A.
Three optional Configuration records may be included in the .smf data file. You can instruct the
Collection Service to include Active Filter Description records, document the Windows Server
Disk Configuration parameters, and include any additional configuration data you desire from
the Windows Server Registry.
Include Active Filter Description Records (default Yes)
When this parameter is checked, a record of the active filters in the DCS is written at the
beginning of each data file. There is one record per active filter and may be used by reporters to
interpret data. This parameter is independent of the actual filter definition. The filter will be
active if it is defined in the DCS, even if this parameter is set to No.
Include Disk Configuration Records (default Yes)
On systems with Windows Server RAID configurations HKLM\SYSTEM\DISK, a registry
key, contains information about the logical and physical disk mapping. When this parameter is
set, records are written at the beginning of the data file which contains this information. On
systems where no RAID configuration exists, the key is not present and no information is
available. The DISK configuration information is not maintained in Windows Server. When this
parameter is set and no information is available, a warning message is written to the Event Log,
but no other action is taken.
67
Performance Sentry User Manual
Runtime Parameters Reference
Include Registry Key Values
The Windows Server Registry is a repository of configuration information. Settings associated
with the users of the computer and the software installed on a Windows Server are stored in the
Registry. You can collect information about any configuration value entries stored in the
Registry.
The Registry is structured as a tree, with unique leaf nodes known as Keys. A Registry Key can
be null or have value entries associated with it. Registry Key values are fields that contain specific
configuration information. For more information about the Registry, see the Help file that
accompanies the Registry Editor program, regedt32.exe.
Click the ‘ … ’ button alongside the Include Registry Key Values checkbox to select the Registry
Key values that you want to collect. The Registry Key Selection dialog box, illustrated in Figure
4.7, will appear.
Figure 4.7 The Add/Remove Selected Registry Key Values dialog box for specifying Registry Key values that you want to
collect.
Use this panel to specify the Registry Key fields that you want to collect. You must specify both
the Key name and Value Entry name individually for each Registry field that you want to collect.
For example to collect the value of the LargeSystemCache parameter that determines the system
working set size maximum, you must specify the Registry Key name and Value Entry name
precisely, as in
HKEY_LOCAL_MACHINE\SYSTEM\CurrentControlSet\Control\Session
Manager\Memory Management\LargeSystemCache
To avoid typing errors, use the Copy Key Name function in the regedt32.exe Registry Editor and
a CTRL+V keystroke sequence to Paste the Key Name into the edit control of the Registry Key
Selection dialog box. After you have copied and pasted the Key name, you must then type the
Value Entry name, as illustrated above. The Registry Editor does not allow you to copy the value
entry name, which must be typed precisely to match the Registry value.
The Collection Service writes a Type 10 Configuration record for each Registry Key field
specified (assuming the field exists) with the body of record containing the Registry Key value
name followed by the current value. Registry Key values are written just once at the beginning of
each data collection file.
68
Performance Sentry User Manual
Runtime Parameters Reference
Data Records
There are a number of options that control the content of the Data Records written to the .smf
data collection file. The default value for these options should be correct for most installations.
Header Format (default Compressed)
You may choose either the original or a compressed header format. The Performance Sentry
record header contains identifying information. The original record header format identifies the
Windows Server operating system level, computer, the Domain, and the Greenwich Mean Time
offset. Beginning in version 2.1, these static fields are written to the Configuration record each
interval. In the compressed header format, these static fields are eliminated from the record
header. The compressed header helps reduce the size of the Performance Sentry data collection
file. Ensure that the reporting or database system you use can process compressed header records
before experimenting with this option.
Data File Delimiter (default Comma)
By default, the .smf data collection file is an ASCII text file with fields separated by commas.
Optionally, you can choose to create text files with Tab characters separating each field.
Truncate CPU Utilization at 100% for Systems with Multiple CPUs
(default No)
The Percent Capping parameter overrides the default behavior of the Microsoft Windows Server
Performance Monitor application which will never report.
Process\% Processor Time > 100%. Since the Thread is the dispatchable unit under Windows
Server, not the Process, it is certainly conceivable that a busy multi-threaded Process running on
a system with multiple processors can accumulate more that 100% Process\% Processor Time
during a measurement interval. The default value of this Percent Capping parameter allows
Performance Sentry to report the correct value of the Process\% Processor Time counter on
multiprocessor configurations.
This is an option where Performance Sentry does not try to maintain strict compatibility with the
Windows Server System Monitor. In fact, Performance Sentry’s default behavior is the opposite of
Perfmon’s. Setting Percent Capping to YES matches the default behavior of the Microsoft
Performance Monitor.
Note: Windows Server System Monitor application can be modified to change its default
behavior and report Process\% Processor Time counter values greater than 100%. To change
Perfmon’s
default
behavior,
change
the
Registry
parameter
setting
HKEY_CURRENT_USER\Software\Microsoft\ PerfMon\CapPercentsAt100 to zero. The
Performance Sentry Collection Service does not check this Registry key, relying instead on the
Percent Capping DCS parameter.
Suppress Writing Total Records? (default Yes)
A Yes|No flag that controls the writing of _Total instance records. Beginning in Windows NT
4.0, Microsoft introduced the _Total instance for many instanced objects. The _Total instance
totals all the individual instance counters to create an additional observation each interval for such
instanced objects as Process, Thread or Processor. These are very useful in an application like
Windows Server’s Performance Monitor which cannot perform any calculations. However, they
gum up the works in Performance Sentry Portal, MXG, and SAS IT Resource Management
69
Performance Sentry User Manual
Runtime Parameters Reference
because all instanced objects with associated _Total instances are double-counted.
The default setting suppresses the writing of all _Total instance records.
Collect data for New Objects? (default No)
This parameter has been deprecated as of version 4.0.0.10 of the collection service. If you find
objects that are not in the Master Collection Set and you wish to collect them, then you will need
to first add them to the Master Collection Set then add them to your Data Collection Set. See
the section titled “What To Do When You Encounter New Objects and Counters” below.
Write Windows NT 4.0 compatible fields? (default Yes)
This Windows NT backward compatibility option eliminates the need for your reporting
programs to check the OS version to determine if certain popular fields are present in the data. In
Windows Server, five counters reporting overall processor utilization were removed from the
System object and replaced by an _Total instance of the Processor object. (This _Total instance
is normally suppressed because it causes error during summarization. See the Suppress Writing
Total Records? option documented above.) The counters that were removed from the System
object were % Total DPC Time, % Total Interrupt Time, % Total Privileged Time, % Total
Processor Time, and % Total User Time. Please do not be misled by the name of these counters
in Windows Server. These counters actually report the overall average value of the Processor
object % Processor Time fields.
These CPU Busy % counters are commonly used in management reporting. When this option is
selected, the Collection Service continues to supply these counters, placing them in the System
object.
Write Denominator Counters? (default Yes)
Some compound counters contain a Denominator value that is used in calculating the current
counter value. A good example is the Logical Disk % Free Space counter, which is a
PERF_RAW_FRACTION counter type. The counter type defines a compound structure,
supplying numerator (the number of bytes allocated) and denominator (the total number of bytes
in the file system) values. The Collection Service is responsible for calculating the fraction, which
is the value reported for the counter each interval. The Write Denominator Counters option
instructs the Collection Service to supply the denominator value used in the calculation, too,
which is otherwise a null value. In this case, the denominator value is a useful metric to collect
because it supplies the capacity of the Logical Disk in bytes.
The Summarization Utility makes use of the associated Denominator counters to summarize
several Hit % counters in the Cache object correctly over the summarization interval. If
denominator values for these PERF_SAMPLE_FRACTION counters are present, the
Summarization Utility correctly produces the weighted average Hit % for the interval. If
denominator values are not present, the Summarization Utility calculates the simple arithmetic
mean, which is subject to error.
Denominator counters are identified by a unique counter name, constructed by appending the
characters “Base” to the counter name. The counter named % Free Space Base is the
denominator counter associated with the % Free Space counter.
70
Performance Sentry User Manual
Runtime Parameters Reference
File Management
The File Management parameters determine where the collection file is stored and how older
collection files on the local system are managed. The File Management parameters in the
Properties Panel is illustrated in Figure 4.8. When it is enabled, file management is performed
during Cycle End processing, prior to executing the Cycle End command. Two forms of file
management are available. The (deprecated) basic “flat” file management scheme automatically
deletes older collection files after a specified number of days. Hierarchical file management
moves data files automatically at cycle end from the \Current folder to the \Previous folder and
ultimately to an \Archive folder, where they are eventually deleted — all under the control of the
parameters you specify.
Hierarchical file management is designed to make creating scripts to move collection files from
managed systems to a central collection point as easy as possible. A simple command like
copy c:\ntsmf24\data\Previous\*.smf \\SharedFolder\ntsmf\today\*.*
to copy the contents of the \Previous folder once per day is often all that is necessary to automate
Cycle End processing.
Folder Where SMF Files are Stored (default “Data”)
This must be a valid path specification. The path specifies the file system location where the
Performance Sentry log file and data files are written. Valid path specifiers and conventions are
recognized. These include \dirname to place a folder at the root level of the current drive and
drive:\dirname to place a folder on a different drive. The default value, data creates a subfolder
named \data in the root folder where the Collection Service executable DMPerfss.exe resides.
The Collection Service, which by default runs under the System Account, must have Write
permission for the path specified. A network disk Browse button for locating the folder is
provided. Logging data directly to a remote disk is supported, but you may need to assign an
authorized User Account with the appropriate security credentials. See the section on “Security
Considerations” in Chapter 2 for a more detailed discussion on assigning a User Account that the
Collection Service impersonates for use during all file operations. Logging data to a network
drive is not recommended, unless you understand the network impact of interval data collection.
Note: Hierarchical file management establishes a structured set of subfolders beneath the \data
folder with the names of Current, Previous, Archive, and Work.
71
Performance Sentry User Manual
Runtime Parameters Reference
Figure 4.8 File Management parameters showing Hierarchical File Management.
Free Space Threshold (Disk Limit Checking)
The Performance Sentry Collection Service checks available disk space on the drive where data is
being written against this limit before attempting to write a record. When this limit is exceeded,
data collection will stop and the Collection Service will enter Suspend mode. An entry in the
Event Log with an Event ID = 96 is made when this action is taken. After you have resolved the
disk space problem, you can issue the Resume command to begin data collection again. The
Resume command can be issued using either the Network Browser in Sentry Administration or
the DmCmd Automation Interface.
72
Performance Sentry User Manual
Runtime Parameters Reference
Specify either of the following disk space limits:
•
Disk Limit (Percent Full) (default 95)
A percentage of “disk space in use” that will cause data collection to be Suspended.
•
Disk Limit (Megabytes Free) (default 100 MB)
A “disk space free limit ” that will cause data collection to be Suspended when it is
exceeded.
NTFS with compression: There is a known problem with Disk Limit checking when you are
running NTFS with compression on Windows Server. With compression, Windows Server
returns disk usage statistics that are misleading because they are based on the uncompressed size
of files. Disk Limit checking will suspend data collection because it appears the disk is full when
actually disk space is plentiful. Unfortunately, there is no easy way to determine the amount of
free space that is actually available after compression. Under these circumstances, it is often best
to disable Disk Limit checking.
Disable Disk Limit checking. To disable Disk Limit checking, code a Percent Full value of either
“0” or “100”.
Data File Sharing (default Shared)
Data File Sharing sets the file Share attribute for the data collection file while it is open. The data
file can be Shared or non-Shared. If the collection data file is opened with the Share attribute,
another application can read the current collection file without interrupting the Collection
Service. If you ever want to create reports from a current collection file without forcing a cycle
end, set the file open attribute to Shared. This will allow you to execute an ftp or a copy
command against the currently active data collection file.
If you do not want to permit any other application to access the active collection file, set Data
File Sharing to non-Shared.
PKZIP Compression
At cycle end the data file may be compressed automatically using a shareware version of PKZIP
that is shipped with Performance Sentry. When using PKZIP compression, you may select the
Windows-compatible, self-extracting file format (.exe) or the normal .zip format that requires a
PKZIP-compatible utility to expand. You also have the option of deleting the original data file
after compression. Compression is performed prior to executing any Cycle End command. Once
created, the .zip (or .exe) compressed file is then aged through the data file hierarchy according to
the automatic file management parameters defined (see below).
73
Performance Sentry User Manual
Runtime Parameters Reference
Data File Name
The following values allow you to specify details about how the data file is named.
File Name Qualifier Separator (default Period)
Sets the character used to separate the computer name and date field in the name generated for
the collection file. The default value is a period. Multiple periods in the file name is invalid in
some ftp software. Set the delimiter field in the file name to either the dash or the underscore
character instead. You also have the choice of none, which produces no file separator, or MVS
Compatible. When MVS Compatible is selected, you have the opportunity to add a High Level
Qualifier (HLQ) in the ‘Add Custom Qualifier’ frame below the selection frame.
Data File Year Indicator (default Four Digit Year)
Sets the Year field of the data collection file name to use either two or four digits.
If the Data File Year indicator is set to use a four-digit year, file names of the form:
systemname.yyyymmddhhmm.smf
are generated. If the Data File Year indicator is set to use a two-digit year, file names of the form:
systemname.yymmddhhmm.smf
are generated instead.
Data File Custom Qualifier (default Null)
Adds a custom qualifier to the file name that is generated automatically for the collection data file
of the form:
systemname.yyyymmddhhmm.customqualifier.smf
The filename Custom Qualifier can be any valid string of 30 characters. When you enable the
DCS Description check box, the full text of the DCS name is appended to the filename. You are
free to edit this suggested filename Custom Qualifier in any way you see fit, subject to Windows
file-naming conventions.
Automatic File Management (default Hierarchical )
Two forms of automatic file management are available to age and delete older data collection files
stored on the local system — flat and hierarchical. “Flat” and “Hierarchical” refer to the different
folder structures that are set up in each form of file management.
Flat file management (deprecated). Flat file management creates only the \data folder where the
.smf files are stored, deleting aged files that are stored there according to the criteria you specify.
Set the Data File Retention subparameter to the number of days that you want to retain older
collection data files on the local system disk. Files older than that number of days are deleted
during Cycle End processing before the Cycle End command is issued. The number of days is
calculated based on the current date during Cycle End processing and the date the file was last
modified, based on the file properties. The default value of the Data File Retention subparameter
is 3 days.
74
Performance Sentry User Manual
Runtime Parameters Reference
Hierarchical file management
When hierarchical file management is enabled, four subfolders of the \data folder are created.
These subfolders are called Current, Previous, Archive, and Work (see Figure 4.8). You specify
the number of days that you want collection files to remain in each folder before they are finally
deleted from the Archive folder. The Data File Retention subparameter is used to determine how
many days’ files are retained in the various folders before they are moved or deleted. The Current
subfolder contains the active collection file and active message log file. You have the option to
move collection files automatically from the Current subfolder to the Previous folder immediately
(zero days) or after some number of days. You then specify the number of days collection files
should remain in the Previous folder before being migrated to the Archive folder. Finally,
collection files are deleted from the Archive folder after an additional specified number of days.
The aim of hierarchical file management is to simplify your daily file management procedures.
The default value of the Data File Retention subparameter is 0, 1, 5. Using these settings, active
files are moved immediately to the Previous folder, where they reside for one day. They are then
migrated to the Archive folder where they reside for 5 additional days before they are finally
deleted. A hierarchical file management Data File Retention subparameter setting of 0, 0, 1
moves active files immediately to the Archive folder, where they reside for one day before they
are deleted.
Hierarchical file management is performed as part of Cycle End processing. The optional Cycle
End command is issued after all hierarchical file management migration and deletion actions
have been taken.
Warning: Changes to hierarchical file management parameters are not retroactive. Please note
that changes to the hierarchical file management parameters may lead to inconsistencies in the
way current files are being managed. We do not attempt to apply hierarchical file management
parameters retroactively. For instance, if you increase the Data File Retention time for files in the
Previous folder, Cycle End file management will not move any files from the Archive folder back
to the Previous folder. Conversely, if you reduce the Data File Retention time for files in the
Previous folder, Cycle End file management may delete files from the Archive folder.
Messaging
Normally, the default parameters are quite adequate and do not need to be modified. The
Messaging parameters control the level and destination for various error diagnostic, warning, and
information messages that the Performance Sentry Collection Service produces.
First, there are parameter settings that control the quantity of messages the DMPerfss records.
Messages can be written to the Windows Server Application Event Log, the stand-alone
Performance Sentry message log file, or both. The Collection Service messages in the Windows
Server Event Log can be viewed using the Event Viewer application, which is launched from the
Administrative Tools (Common) Start Menu. Select the Application Log to view any DMPerfss
messages.
75
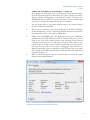
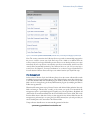
Performance Sentry User Manual
Runtime Parameters Reference
Alternatively, you browse the NTSMF.log ASCII text file with Wordpad or Notepad. The
NTSMF.log file is set up automatically as a file of a predetermined length. Once messages reach
the end of the file, Performance Sentry closes the log file, renames it to .old.log file and starts
writing messages to a new log file. The default parameter settings limit the size of the
NTSMF.log file to 256 KB. For convenience, we recommend writing messages to both the
Windows Server Event Log and the NTSMF.log file. However, by design the Collection Service
contains detailed messages designed to support automation procedures and to play an important
role in diagnosing problems. If your System Administrators are trained to react to every message
that appears in the Event Log, you can safely rely on the NTSMF.log file alone for diagnostic
purposes. Turn off writing to the Windows Server Event Log if your systems administrators
complain about the quantity of messages. Alternatively, to reduce the quantity of messages to
both the event log and the NTSMF.log file, you can suppress writing Information and Warning
messages
Message Reporting Level (default Information and Warning)
This parameter controls the reporting of optional Information and Warning messages. By
default, both Information and Warning messages are issued. You can choose to collect only
Warning level messages. Mandatory error diagnostic messages are always issued.
Error messages are issued for events that impact data collection, like suspending the service
because the Disk Limit parameter was exceeded. Warning messages are issued for events, which
are not critical to operations, but may impact it. For example, the Collection Service issues
Warning messages for performance data objects it is instructed to collect, but are not installed on
the local system. Even though Warning messages are generated for these conditions, this does
not impact data collection of objects listed in the Data Collection Set that are installed on the
local system.
76
Performance Sentry User Manual
Runtime Parameters Reference
Figure 4.9 Messaging Options.
Information messages are generated for routine events at initialization, cycle end, and other status
changes. They are primarily useful for understanding and documenting data collection
operations.
Event Logging (default Yes)
Controls whether the Performance Sentry Collection Service writes messages to the Windows
Server Event Log. The default action is to write messages to the Event Log. Performance Sentry
messages can be viewed in the Event Application Log using the Event Viewer Administrative
Tool applet.
Log File Attributes
Create an NTSMF.log (ASCII) message file? (default Yes)
Create Log File controls whether messages that are written to a dedicated application messaging
file called NTSMF.log, stored in the \data folder where .smf files are created. This message file is
an ASCII text file, which can be viewed using Notepad or Wordpad. The Collection Service
limits the size of the NTSMF.log file using the Size and Age subparameters.
Log File Size Limit (default 256 KB)
A subparameter of the Create Log File parameter that limits the size of the data Collection
Service NTSMF.log message file. When the Collection Service reaches the end of the specified
log file, it renames the old log file and allocates a new one. The default value of 256 KB is usually
ample space to keep a week’s worth of message text.
77
Performance Sentry User Manual
Runtime Parameters Reference
Log File Age Limit (default 7 days)
A subparameter of the Create Log File parameter that limits the age of the messages the data
Collection Service keeps in the NTSMF.log message file. When the Collection Service sees
messages in the log file older than the specified age, it renames the old log file and allocates a new
one. The default value of 7 days normally fits well within the default message Log File Size of
256 KB.
What To Do When You Encounter New
Objects and Counters
Only objects in the Master Collection Set can be added to a Data Collection Set. The Master
Collection Set is a collection of all counters and objects known to Performance Sentry
Administration. It is stored in the same format as a regular Data Collection Set in a DCSX file.
The name of the DCSX file is Master Collection Set.dcsx. The difference is that the Master
Collection Set only has objects and counters and does not have data collection parameters, filter,
or alert information. When the administrator needs to add objects from a new machine or
operating system to a Data Collection Set, the desired objects may not be available in the Master
Collection Set. The solution is for the administrator to go through the Object Discovery process
and add the objects to the Master Collection Set.
Adding Objects to the Master Collection Set
To add objects to the Master Collection Set, select the Administration item in the far left pane
of the Sentry Administration application. Once selected, the Object Discovery panel will be
displayed. Through this mechanism, the administrator can discover and add new objects to the
Master Collection Set. The administrator will browse to a machine which contains the new
objects by pressing the ‘ … ’ button on the right side of the screen. Once the machine is selected,
the Performance Sentry Admin will attempt to retrieve the list of performance objects on the
machine. Objects from the machine which are not in the Master Collection Set are added to the
available objects list.
78
Performance Sentry User Manual
Runtime Parameters Reference
Figure 4.10 The Master Collection Set Object Discovery screen shows the retrieved objects from the machine VENICE
which are not in the Master Collection Set.
Objects can be added to the Master Collection Set with the ‘<’ button. Changes to the Master
Collection Set can be saved or cancelled through the Apply Changes or Cancel link. When the
user presses the Apply Changes link, Performance Sentry Administration saves the changes to
the Master Collection Set DCSX file.
Note: In order to retrieve the list of performance objects, the user running Performance Sentry
Administration most likely will need access rights to the performance metrics of the remote
machine.
Pattern Objects
Due to performance library implementation or operating system evolution, it may be necessary to
collect a set of objects specified by a wildcard pattern. The primary example of this is the
Microsoft implementation of the SQL Server performance objects.
SQL Server Performance Objects
The instanced SQL Server performance objects have the SQL Server instance name in each of
its performance objects.
In order to collect all the SQL Server objects for the enterprise using a generic Data Collection
Set for all machines, all of the instance specific object names would have to be specified.
This is difficult to maintain if not impossible without the creating of a pattern object using a
wildcard.
79
Performance Sentry User Manual
Runtime Parameters Reference
Figure 4.11 PerfMon showing the SQLAgent$ instanced object with the database instance names.
Adding a Pattern Object to the Master Data Collection Set
To add a pattern object to the Master Collection Set, click on the object that is the ‘base’ object
for the pattern objects that you would like to make a pattern object. On the bottom of the list of
available objects on the network machine, there is a section of the screen for adding pattern
objects. The name of the selected object is shown in the Object Name: text box.
Figure 4.12 The Pattern Object interface with the SQL$LAUDERDALE:Alerts object selected.
A ‘*’ can be added to the object name to make a pattern object. When the ‘ < ’ button is pressed,
the pattern object name is then added to the Master Collection Set. The pattern object will then
appear in the list of objects in the Master Collection Set so that it can be added to any data
collection set using the Object Definition function.
Figure 4.13 The Pattern Object interface with the SQL instance database name replaced with ‘*’.
Note: The counters from whichever object is selected will be added to the data collection set.
Note: Pattern object IP* can be used to ensure all versions of the IP objects, such as IPv6 or
IPv4, will be collected for the different Windows operating systems. A TCP* object can also be
specified for the various TCP protocols in the different Windows operating systems.
80
Performance Sentry User Manual
Runtime Parameters Reference
Removing Objects from the Master Data Collection Set
There is no facility in the Performance Sentry Administration application to remove an object
from the Master Collection Set. If an object is removed from the Master Collection Set without
first removing it from all Data Collection Sets, then Data Collection Sets could have objects
which are not in the Master Collection Set. As result, an automatic mechanism which removes
objects from the Master Collection Set could be problematic. Leaving objects in the Master
Collection Set even if they are not used in any data collection sets will not have an impact on data
collection. Therefore delete functionality is not provided. If it is still desirable to remove objects
from the Master Collection Set please contact [email protected].
Demand Technology Updates
When the Master Collection Set is edited, the user will be prompted to send the new Master
Collection Set.dcsx file to Demand Technology. When this file is changed, it should be sent to
[email protected] so that Demand Technology can continue to provide support for the
newly discovery objects and counters.
81
5
Filters
Filters are flexible rules that change the default behavior of the Performance Sentry Collection
Service based on the measurement data being recorded. This section documents the filter rules
that are available for you to use. Filters enable you to reduce the volume of measurement data
that Windows Server produces. Using Filters, you can control the quantity of Disk, Process,
Thread, Module, and SQL Server records that are written to the .smf data files. By setting
reasonable filtering thresholds for triggering data collection, you can reduce the size of the data
collection file, increase the rate of data collection, or some combination of both. Filters enable
you to keep the size of the .smf data collection files from growing to an unmanageable size, while
ensuring that events of significance are always captured.
Whether you are measuring the performance of Windows Servers or workstations, multiple
instances of Process and Thread objects are the main factor influencing the size of the
Performance Sentry data collection files. Filtering out Process instances to eliminate inactive
background tasks and recording only “interesting” Thread instances significantly reduces the
volume of information collected without sacrificing the information content of the data collected.
On Servers running Microsoft SQL Server, multiple databases that are defined can also lead to
an excessive number of detail records being created for inactive databases. On Servers attached to
enterprise-class storage controllers, numerous Logical and/or Physical Disks may be defined but
never accessed. The SQL Server and Disk filters provide a simple mechanism to eliminate excess
data records for inactive object instances.
Filters work at the performance object level. Before an object instance subject to a filtering rule is
written to the collection file, it is compared to the rule. An instance is only written to the data file
if it satisfies an active filtering rule. Each filtering rule is a separate test. The object instance need
only satisfy a single rule in order to be selected for output (Logical OR processing).
Filtering logic is only exercised when the object subject to the filtering rule is among the objects
included in the Data Collection Set data definition. Filters are defined using the DCS Editor,
and the definitions you set are stored in a Data Collection Set definition. Inside the DCS Editor,
the contents of the Associated Filters window shows the Filters defined in that DCS, as
illustrated in Figure 5.1.
82
Performance Sentry User Manual
Filters
Figure 5.1 Available Filters for a Data Collection Set are shown in the DCS Configuration Panel Filters tab. Enabled filters
have the Enabled box checked.
The Collection Service also implements a number of built-in filters that automatically suppress
output of inactive instances of several specific objects. These built-in filters are discussed at the
conclusion of this chapter. They work automatically, and there are no parameters available that
you can use to disable them.
Filters are configured using Performance Sentry Administration as described in Chapter 3 of this
document.
83
Performance Sentry User Manual
Filters
Filtering Output Records
The filter options you specify help you reduce the size of the collection file without reducing the
information content of the data written to the file. The filter works by checking a specific counter
value for each instance of an object before writing that specific object instance to the file. To set
the filtering options, click the check box that enables the filter. Optionally, for most filters you
also adjust the threshold value that is tested before the record is output.
The individual filters you can enable for Process, Module, Thread, Disk SQL Server, and Web
are discussed below in the sections that follow.
Process Filters
The following sections describe the filtering options available for process information. Note that
if any of the following Process filters are active, an instance of the Process object is written to the
output file when the value of any of the process’s counters exceeds specified threshold value in the
active filter.
Process Busy Threshold
This filter establishes a threshold test against the % Processor Time counter of the Process object
before writing an instance to the .smf data file. The threshold test can be any value between 0
and 100. A value of 5 means that only Process instances that utilize more than 5% of a processor
during the measurement interval are written to the data file.
The default threshold value is 1. Using the default value of one typically results in a reduction in
the number of Process records output by 50-80%. The precision used in calculating the
% Processor Time counter is to four decimal places. A process which is less than 0.0001 % busy
during the interval is considered 0% busy. A process accumulates % Processor Time in Server
timer units that are 100 nanoseconds (.0000001 seconds) long. Any process that accumulates less
than 100 microseconds of Processor time per second during execution is considered 0% busy.
Process Working Set Threshold
This filter establishes a threshold test against the Working Set counter of the Process object
before writing an instance to the .smf data file. The Working Set of a process measures the
amount of process virtual memory that is currently resident in RAM. The threshold test can be
any value greater than 1 MB. A value of 10 means that only Process instances that currently use
10 or more MB of RAM are written to the data file. The Process Working Set counter is an
instantaneous counter, not an average value computed over the collection interval.
Private Bytes Threshold
This filter establishes a threshold test against the Private Bytes counter of the Process object
before writing an instance to the .smf data file. The Private Bytes counter of a process measures
the amount of real memory (RAM) that cannot be shared with other processes. The threshold
test can be any value greater than 1 MB. A value of 40 means that only Process instances that
currently use 40 or more MB of RAM are written to the data file. The Private Bytes counter is
an instantaneous counter, not an average value computed over the collection interval.
84
Performance Sentry User Manual
Filters
Process Availability Override
There are certain Process object instances that you might like to be recorded every data collection
interval, regardless of whether or not they satisfy specific filtering criteria. This is particularly
desirable if you would like to report on application availability using the process Elapsed Time
counter.
The Process Availability override allows you to specify a list of process names that are collected, if
they exist, every collection interval. Suppose you are interested in reporting on the availability of
an application like SQL Server or IIS on a production server. You set the Process Availability
override to always write instances of sqlservr or inetinfo to the collection file whenever they are
currently executing on the system. If a Process object instance is not recorded in a measurement
interval then you can safely assume the processes was not executing in that measurement interval.
To assist you in automating availability reporting, you can also choose to collect Active Filter
Description Configuration records that document the filter settings in effect during the collection
period. See Chapter 4, “Runtime Parameters Reference, File Contents” for information about
collecting Active Filter Description Configuration records. See Appendix A for help in
processing those records.
To specify the process information for the Process Availability override, select the Process
Include filter.
Figure 5.2 The Filter list with the Process Include filter selected showing the list of processes to always include.
The list box labeled Always record data for these process instance names: shows the current list of
process names that are always collected. You can add a process name to the list by typing it in and
pressing the Add button, or you can select from a list of processes executing on any one of the
systems where the Collection Service is currently running.
The Process instance name specified in the list must match the instance name in the
Performance Sentry process instance record. Typically, these instance names do not have the
extension (for example, .exe) which may be visible in Task Manager. Upper and lower case
accuracy is not required. You can enter multiple Process instance names at the same time by
separating them with a comma.
85
Performance Sentry User Manual
Filters
You can add an instance name from the list box on the right to save you from typing errors. A
drop down list allows you to select process names from different computers. In addition, it
contains a network browser button (which displays the ellipsis symbol …) to the right of the
computer name list of visible systems. The network browser button allows you to point to a
system where the application you are interested in and its process(es) are running.
Clicking on the Browse button (displaying the ellipsis symbol …) opens the Browse for
Computer dialog box as shown in Figure 5.3.
Figure 5.3 The Browse for Computer dialog box.
Module Filter
A performance data object called Module is created internally, when you include the Module
object in your Data Collection Set data definition. Each instance of the Module object shows a
load module name, usually a DLL (dynamically linked library module) that is loaded within the
specific process. The Module object also has a parent instance, which is the name of the process
that loaded the module.
The Module data is for identification purposes. The only counters available for each Module are
the process ID, which is used to identify the parent process uniquely, and the Load Address of
the Module within the parent process virtual address space. The Module data is intended to
assist in identifying the application being executed within a container process, which is
something that occurs frequently in Windows Server. There are at least three container processes
that you are likely to collect Module object information about: dllhost.exe in Windows 2000 and
Windows Server, jvm.exe for JavaBeans components, and svchost.exe in XP and Windows
Server. The function of these container processes is described below:
86
Performance Sentry User Manual
Filters
dllhost.exe is the process that executes COM+ components. When COM+ program DLLs are
loaded as server components and execute out-of-process, the components are executed inside the
dllhost.exe container process. dllhost.exe is also used to execute Active Server Pages application
scripts in IIS 5.0 in separate container processes, when Medium or High Application Protection
is specified. Medium Application Protection, the default setting in IIS 5.0, leads to all ASP script
running inside a single copy of dllhost.exe. When a High Level of Application Protection is
chosen, each ASP script executes in an isolated instance of dllhost.exe in IIS 5.0. ASP script
execution can be identified by looking for the presence of the wam.dll COM+ component inside
dllhost.exe.
jvm.exe is the Java Virtual Machine runtime container process that hosts JavaBeans (J2EE) server
applications. Functionally, jvm.exe is quite similar to the Microsoft flavored dllhost.exe container
process.
svchost.exe is used in Windows XP and Windows Server to host system services like Browser,
Redirector, and Server. In Windows XP and Windows Server, all those system services that used
to execute within a single services.exe container process in earlier versions of Windows Server,
execute inside multiple instances of the svchost process. Each executes under a different security
profile, either SYSTEM, LOCAL SERVICE, or NETWORK SERVICE.
If you are experiencing application-related performance problems and notice lots of jvm.exe, or
dllhost.exe processes executing, use the Module function to identify which applications are
running inside each container process. During reporting, join the Module instance with the
parent process, using the ID Process field common to both object instances, and replace the
generic process name with the Module instance name.
Unless you are prepared to deal with much larger Performance Sentry data files than usual, you
should use filters when you collect Module data. Collecting the Module information is costly,
and the average Windows Server executable routinely loads 50-100 assorted DLLs. Please be
careful with this function and implement a Module filter for all container processes that you need
to resolve, as described below.
Module Filters
The Module filters are used to limit the amount of Module identification data that is collected
about container processes that you would like to associate with a specific application name. Not
only can you restrict the collection of Module identification data to specific processes, you can
also restrict the Module identification data to specific application component modules that are
loaded in-process. There are two filters to implement this functionality. One filter is the Process
Module Activity filter. This filter will write all of the module information for specific processes
that you would like to collect Module information about. The Process Module Activity By
Name filter allows you to list specific Module names that you want to see so you can limit the
Module information collected to specific modules that identify the application running inside a
generic container process.
There are no default Module filters in the list of filters for the data collection sets after
installation. These filters have to be created as a new filter by the administrator with either of the
two module filter templates.
87
Performance Sentry User Manual
Filters
To create a new filter, right click on the filter list and select New. Then select the filter template
from the filter template drop down. When a module filter template is selected it will show the
user interface to select which processes should be selected to collect information about their
Modules. To list the processes, the administrator will use the ‘…’ button to the right of the text
box under Process Instance names from to navigate to the machine and retrieve process names.
For the Process Module Activity By Name filter, the administrator can also right click on the
process to add specific module information that will be collected.
Figure 5.4 Depicts a new Process Module Activity By Name filter being created for the svchost. Right clicking on process
shows the ‘Add Module’ menu. When clicked, the menu brings up a dialog box to navigate to the modules to be included in
the filter.
This filter definition instructs the collector to report Module instances only for the dllhost.exe
and svchost.exe processes. In addition, only the specific Module instances named will be
collected, which is the information needed to identify the application running inside these
container processes.
On a typical Windows XP or Windows Server machine, you will notice several instances of the
svchost container processor executing. Svchost is a container process that hosts various system
services. Different services run in different copies of svchost depending on their security
requirements. They can be distinguished in Task Manager because they have different values in
the User Name column. System services that do not need network access will execute inside a
copy of svchost that executes under the security profile associated with LOCAL SERVICE.
Other copies of svchost run under the SYSTEM or NETWORK SERVICE. In order to figure
out which services are running inside which copy of svchost, use this Module filter definition to
identify modules that are unique to a specific instance of svchost. Similarly, for dllhost.exe,
filtering on wam.dll will allow you to identify specific instances of dllhost that are executing ASP
script code.
COM modules executing inside the dllhost.exe container processes can be identified, too, by
building a filter list of component application DLLs. To populate the Module filter list, click the
‘ … ’ button to point to a folder where these component application DLLs reside in your site.
88
Performance Sentry User Manual
Filters
Thread Filters
Because even small Windows Servers run applications with many, many threads, we strongly
recommend that you activate the Thread filters provided if you do decide to collect any Thread
data. These filters are activated in the default collection set, for example. The Thread filters
suppress collection of all but a few “interesting” thread records that are useful in diagnosing
specific performance problems. Generally, the Thread data available is mainly of interest to
developers who know what specific tasks threads are performing.
The following sections describe the Thread filter options that are available.
Thread State Ready
This filter is used to create a synthetic counter called Ready Threads that appears in any instance
of the Process object for any processes that have one or more threads currently delayed in the
processor Dispatcher Ready Queue. The Process:Ready Threads counter records the number of
threads associated with that process that are delayed. When the filter is enabled, any process
instances with one or more Ready Threads is written to the output data file.
The Thread State Ready filter establishes a threshold test against the Thread State counter of the
Thread object before writing a Process instance to the .smf data file. The Thread State counter is
a coded numeric value that indicates the execution state of the Thread. The threshold test is hard
coded to match a value of 1, which corresponds to a Thread which is Ready to run, but is waiting
in the processor Dispatcher Queue for a free processor.
When the Thread State Ready filter is enabled, any instances of Threads delayed waiting in the
Server Dispatcher Ready Queue at the end of the measurement interval are recorded. The
Processor Queue Length counter of the System object reports how many Threads are waiting.
This filter outputs those specific processes that have Ready Threads so you can see which
applications are being impacted by a CPU capacity constraint.
Thread Wait State Reason
This filter establishes a threshold test against the Thread Wait Reason counter of the Thread
object before writing an instance to the .smf data file. The Thread Wait Reason counter is a
coded numeric value that indicates the reason why a Thread entered the Wait state.
The Thread Wait Reason applies only to those Threads that are currently in a Wait state
(Thread State counter value of 5). The Wait reason tells why the thread is waiting. Threads in
the Wait state are often waiting on a component of the NT Executive (reason code = 7). These
include threads waiting for an I/O to complete, waiting for a timer, or otherwise waiting for
some other synchronization event.
The filter’s threshold test is hard coded to match a Wait Reason value of 1, 2, 3, 8, 9, 10, 18, 19
or 30. These correspond to threads which are delayed waiting on action by the Virtual Memory
Manager (reason codes 1, 2, 8, 9, 18, and 19), or waiting for free space in the system-managed
memory pools (reason codes 3 and 10).
89
Performance Sentry User Manual
Filters
Code
Wait State Reason
1
Waiting for a page to be freed
2
Waiting for a page to be mapped or copied
3
Waiting for a space to be allocated in the page or non-paged pool
8
Waiting for a page to be freed
9
Waiting for a page to be mapped or copied
10
Waiting for a space to be allocated in the page or non-paged pool
18
Waiting for virtual memory to be allocated
19
Waiting for page out
30
Waiting due to quantum (time slice) end
Table 5.1 “Interesting” Wait State reason codes that are used to trigger outputting Thread instances with the Thread Wait
State Reason filter.
Threads waiting for these reasons are delayed by system memory housekeeping functions. The
number of threads delayed is more significant than which threads are actually experiencing the
delay. An increase in the number of threads the Collection Service detects in these Wait
conditions is a telltale sign of increased memory contention.
When the Thread Wait State Reason filter is enabled, all instances of Threads detected waiting
for these specific reasons at the end of the measurement interval are written to the .smf data file.
Process Busy Threshold Threads
This filter establishes a threshold test against the % Processor Time counter of the Process object
before writing instances of the Thread objects associated with that Process to the .smf data file.
The threshold test can be any value between 0 and 100. The default threshold value is 100. A
value of 5, for example, means that only Threads associated with Processes that utilize more than
5% of a processor during the measurement interval are written to the data file.
This filter is deactivated by default. Activate this filter if you need to examine the Thread
instances for very active processes. We recommend that you use this filter cautiously, however.
Active processes in Windows Server often have large numbers of threads that perform their
work. Activating this filter can result in large quantities of Thread instances being written to the
collection file.
Using the default value of 100 suppresses the output of all Thread instances, except for those that
specifically satisfy the Thread Wait State Reason filtering rules.
90
Performance Sentry User Manual
Filters
Disk Filters
The Disk filters are used to eliminate instances of the Logical and/or Physical Disk objects that
are defined, but are inactive, from the collection file. You may see extraneous instances of the
Logical and/or Physical Disk objects when your servers are connected to storage controllers
which export numerous virtual LUNs. The virtual devices appear connected to the machine even
though no I/O operations can be performed using these devices. The Disk filters are used to
eliminate these extraneous observations of idle devices. Both filters establish a threshold test
against the Disk transfers/sec counter.
Logical Disk Transfer Threshold
This filter establishes a threshold test against the Logical Disk Disk transfers/sec counter, a
measure of disk activity. If you activate the filter and set a threshold value of “0,” all idle instances
of the Logical Disk object are suppressed. You can set higher threshold values if want to suppress
reporting of lightly loaded devices, too.
Physical Disk Transfer Threshold
This filter establishes a threshold test against the Physical Disk Disk transfers/sec counter, a
measure of disk activity. If you activate the filter and set a threshold value of “0,” all idle instances
of the Physical Disk object are suppressed. You can set higher threshold values if want to
suppress reporting of lightly loaded devices, too.
SQL Server Filters
Microsoft introduced the idea of database server ‘instances’ with SQL Server 2000. The
availability of instances allows a database administrator to spread databases across these separate
instances. This allows for better control and workload isolation. However, this also means that all
SQL objects and counters are replicated for each instance of SQL Server. The result of this
replication is that there may be instances defined which are not being actively used, yet
performance data is still being reported. This result is a lot of meaningless data. The SQL Server
filters are used to record only meaningful data coming from the active SQL Server instances.
SQL Database Transactions Threshold
This filter establishes a threshold test against the SQL Server Transactions/sec counter in the
SQL Server Databases object. An instance of this object is normally created for every database
defined to SQL Server. Activate this filter to eliminate object instances associated with inactive
databases.
SQL Statistics Threshold
This filter establishes a threshold test against the SQL Server SQL Compilations/sec counter in
the SQL Server:SQL Statistics object. SQL Compilations/sec records the number of times the
compile code path is entered. Activate this filter to eliminate SQL Statistics object instances
associated with inactive databases.
SQL Buffer Manager Threshold
This filter establishes a threshold test against several of the counters in the SQL Buffer Manager
object. Any time the value in Page lookups/sec, Page Reads/sec, or Page Writes/sec, exceeds the
threshold, then the SQLServer: Buffer Manager object will be written to the .smf performance
data file.
91
Performance Sentry User Manual
Filters
SQL Cache Manager Threshold
This filter establishes a threshold test against the SQL Server Cache Use Counts/sec counter in
the SQL Server:Cache Manager object. Activate this filter to eliminate SQL Cache Manager
object instances associated with inactive databases.
SQL Locks Threshold
This filter establishes a threshold test against the SQL Locks Requests/sec counter in the SQL
Server:SQL Locks object. Locks Requests/sec records the number of new locks and lock
conversions requested from the lock manager. Activate this filter to only write SQL Locks
performance data for instances that exceed the threshold.
SQL Buffer Partition Threshold
This filter establishes a threshold test against the SQL Free list requests/sec counter in the SQL
Buffer Partition object. Activate this filter to eliminate SQL Buffer Partition object instances
associated with inactive SQL Server instances.
SQL User Settable Threshold
This filter establishes a threshold test against the Query counter in the SQL Server:User Settable
object. The instance values in the Query counter are propagated from within SQL using stored
procedures. A good use for the User Settable object is to designate one of the user settable
instances to contain the SQL Instance’s Process ID. This will help to map the SQL instance to
the sqlservr process in which the instance is running. Use this filter to eliminate writing the ‘User
Settable’ object records for inactive database instances.
Web Filters
The Web filters are used to eliminate instances of the Web Service objects for idle websites.
Web Service Get Request Threshold
This filter establishes a threshold test against the Web Service Get Requests/sec counter in the
Web Service object. Get requests are used for basic file retrievals or image maps. Activate this
filter to eliminate reporting on web sites that are idle.
Web Service Bytes Received Threshold
This filter establishes a threshold test against the Web Service Bytes Received/sec counter in the
Web Service object. Bytes Received/sec is the rate that data bytes are received by the Web
service. Enable this filter to report only websites that are active.
Other Filters
Other filters is a catch-all category in the Collection filter window used to set filter definitions for
unrelated objects. Currently there are filters for the Print Queue and Network Interface objects.
Print Queue Bytes Printed Threshold
This filter establishes a threshold test against the Print Queue Bytes Printed/sec counter, a
measure of print jobs in the queue for a print server. If you activate the filter and set a threshold
value of “0,” all idle instances of the Print Queue object are suppressed.
92
Performance Sentry User Manual
Filters
Network Interface Total Bytes Threshold
This filter establishes a threshold test against the Network Interface Total Bytes/sec counter, a
measure of network adapter activity. Network Interface object instances exist for all physical and
virtual network adapters. Therefore, if there are virtual adapters defined for applications which
are not active on the machine, then these virtual adapters will have no activity. If you activate the
filter and set a threshold value of “0,” all of these idle instances of the Network Interface object
are suppressed.
Built-In Filters
Built-in filters automatically suppress output of inactive instances of several specific objects.
These filters have no user-settable thresholds and are automatically enabled by the Collection
Service.
Suppress Idle Process
This filter is active by default. The filter suppresses writing an instance of the Idle Process to the
.smf data file each and every interval. The Idle Process is a Hardware Access Layer (HAL)
bookkeeping function, rather than an actual Process. An Idle Thread is dispatched when the
Windows Server Scheduler has no Ready threads to dispatch. It is used to accumulate idle CPU
time in order to calculate the % Processor Time counter in the Processor object, as discussed in
Appendix A.
If you choose not to suppress the Idle Process record, the sum of all Process % Processor Time
counters will equal 100%.
Total Instance
As mentioned in chapter 4, the _Total instance totals the individual instance counters to create
an additional observation each interval for such instanced objects as Process, PhysicalDisk,
LogicalDisk, or Processor. These are very useful in an application like Windows Server’s
Performance Monitor which cannot perform any calculations. However, this creates a problem
for programs that do their own calculations because all instanced objects with associated _Total
instances are double-counted. The _Total instance filter is enabled (meaning the counter value
will not be written to the .smf data file) by default and is controlled in the Parameter
Administration window when editing the Data Collection Set.
93
6
Alerts
Alerts are logical expressions that are created to notify an administrator when an event occurs on
a particular machine. The administrator can set up alert recipients to be notified of events
generated by particular alerts. Alerts are only activated when they are enabled in the Data
Collection Set using Performance Sentry Administration. When installing Performance Sentry,
the administrator has the option of whether to install the default alerts. These alerts were created
to fulfill the needs of most administrators but they can be modified as needed. Some of the more
common alerts are used to monitor machine Memory, Network Bandwidth, Processor, and Disk
Usage. The full list of alerts that ships with Performance Sentry with specified parameters and
severities is shown below.
Alert Name
Parameter
Severity
ASP Requests Queued
>5
Error
ASP.NET Requests Queued
>5
Error
Memory Available Bytes Error
< 0.02 * Physical RAM
Error
Memory Available Bytes Warning
< 0.1 times Physical RAM
Warning
Memory Committed Bytes Error
< 1.5 times Physical RAM
Error
Memory Committed Bytes Warning
< 1.0 time Physical RAM
Warning
Memory Free System Page Table
Entries
< 100
Error
Memory Pages/Sec
>50 / Number of Paging Disks
Error
Network Bandwidth
> 0.9 * Current Bandwidth
Error
Physical Disk Current Disk Queue
Length
>5
Error
Phyiscal Disk Idle Time
< 20%
Error
Process Level CPU
> 99%
Error
94
Performance Sentry User Manual
Alerts
Processor Queue Length Error
> 10 * Physical CPUs
Error
Processor Queue Length Warning
> 5 8 Physical CPUs
Warning
Processor Utilization Error
>99%
Error
Processor Utilization Warning
>80%
Warning
Server Pool Paged Failures
>0
Error
Server Work Item Shortage
<>0
Error
Server Work Queues Available
Threads
=0
Error
Server Work Queues Queue Length
Error
>10
Error
Server Work Queues Queue Length
Warning
>5
Warning
Table 6.1 Parameter values and severities for the default alerts.
The administrator can enable these alerts or modify the alert behavior by utilizing the alerts DCS
configuration tab in Performance Sentry Administration. The left side of the tab shows the list of
alerts in the data collection set while the right side of the tab shows two more tabs containing the
alert definition and transitions specifications.
Alert Definition
Alerts are defined by their selected template. The same definition language is used for the filter
templates and alert templates. Like the filter templates, the alert templates cannot be modified at
this time through Performance Sentry Administration. The severity of the alert can be set on
this tab.
Alert Severity
The alert severities are set to model the Windows Crimson event logging. The predefined alerts
do not have any severity higher than warning to ensure that the administrator is not generating
event log error when not expecting to do so.
Alert Transition
Events are fired based upon the alert definition. The Alert Transitions tab allows the user to
specify how the alert will transition to the next state. The user can also specify a limit on the
maximum number of time an alert can be re-armed in a cycle.
Alerts start in an armed state. Recipients will be notified of events only when the alert is in the
triggered state. Once triggered, applicable recipients will continue to be notified of events until
the alert is released. After the alert is released, it will be re-armed based upon the alert’s rearm
parameters.
95
Performance Sentry User Manual
Alerts
The following table shows the 3 states an alert can be in and transition between states.
Name
Description
Next State
Armed
This is the initial state. Applicable alert recipients will not be
notified until the alert state is Triggered.
Triggered
Triggered
Applicable alert recipients are notified until the alert state
transitions to Released
Released
Released
Applicable alert recipients will not be notified and the alert is
not in the Armed state.
Armed
Table 6.2 Alert States.
State Transition Types
The following table defines the currently implemented alert transition types. The transition type
of an alert determines how the transition is made from one state to the next.
Transition Type
Description
By Event Count
Once this number of events occurs, the alert will transition to the next state.
By Duration
If events occur continuously at every interval for the specified time, then the
alert will transition to the next state after exceeeding the duration.
For the release and re-arm transitions this type will be considered an absolute
time regardless of events.
Table 6.3 Alert Transition Types.
Rearm Limits
Each alert has a rearm limit specified in the alarm definition. The rearm limit is used to prevent
the alert from being rearmed excessively and sending too many notifications in the case of a
recurring problem.
Note: To allow unlimited rearming of the alert, the rearm limit can be specified as -1.
Alert Recipients
When an alert event fires and the alert is in a triggered state, Alert Recipients assigned to the
severity level of the alert are notified. Performance Sentry 4.0 currently supports two types of
alert recipients. The Event Log type allows administrators to use event log scraping to find alert
information on each machine where the collector is running. The Simple Mail Transfer Protocol
(SMTP) recipient type receives email notification of an alert. In order to receive alert
notifications, recipients must be associated to an alert by severity by utilizing Sentry
Administration. There is a default Event Log recipient created at Sentry Administration
installation to log all Fatal, Error, and Warning severity alerts.
96
Performance Sentry User Manual
Alerts
Alert recipients are customized through the Alert Recipients tab of the Alerts tab when editing a
DCS. By default, the Event Log is specified as a recipient for all Alerts. To add an email address,
right click on an alert recipient in the left-hand column and choose New.
The email address is added by clicking on the Email button in the center pane. There is no
validation of the email address.
Figure 6.1 Alert Recipients after a new email recipient has been added.
The alert recipient entry name can be changed by clicking on the text and entering a new name.
By default, all alerts are enabled for a recipient, but specific alerts may be enabled by un-checking
the All Alerts checkbox and selecting the alerts from the Available Alerts: list and adding them
to the Selected Alerts: column. See Figure 6.1 above.
97
Performance Sentry User Manual
Alerts
SMTP Configuration
To utilize SMTP alert recipients, the SMTP information must be configured by clicking on the
SMTP Configuration tab.
Figure 6.2 SMTP Configuration tab.
SMTP Server refers to the server through which email will be sent. By default, port 25, the
default SMTP port, is specified. It can be changed if necessary.
From Address: refers to the address that will appear in the Reply To field of the alert email.
User Name: is the name with which to authenticate to the SMTP server. If a password is
required, it can be entered by clicking on Set Password in the upper right-hand corner. A pop-up
dialog box will appear in which to enter the password. Once entered, the password is encrypted
and saved as a parameter in the DCSX XML file.
98
7
Utilities
Performance Sentry has a number of utility programs that are normally installed along with the
Collection Service and the Performance Sentry Administrator program. These include two
Command line interface utility programs that are designed to be executed from scripts that you
build to automate Performance Sentry file processing. These Command line utilities are
•
•
a summary program called DMSumSMF.exe that rolls up detailed .smf format data files
into summarized files, and
an Automation Interface called DMCmd.exe that allows you to control the operation of
the Collection Service from a script or a remote console.
This chapter documents the use of these utility programs. The Summarization Utility and the
DmCmd Automation Interface are often used in conjunction with scripts that are automatically
launched at the end of a Collection Cycle. This chapter also documents the Cycle End command
processing facility. It provides sample code that illustrates the use of all these facilities.
Cycle End Command Processing
The Performance Sentry Collection Service provides facilities to allow you to automate data
collection during Cycle End processing. A scheduling facility allows you to launch a designated
command or script at the end of each Collection Cycle. Cycle End commands are used to copy
the .smf data file from the local machine to a consolidation file server somewhere else on the
network.
A Cycle End command can be as simple as a COPY command to copy the .smf data files from
the local machine to a Shared Folder. Be sure to use the COPY command with the /B option to
consolidate multiple Performance Sentry collection data files into one large file for processing:
cmd.exe “COPY /B C:\Program Files\NTSMF40\data\Previous\*.SMF
G:\NTSMF\Daily\NTDaily.SMF”
The /B option of the COPY command concatenates multiple files without terminating each
individual file with a x’3F’ end of file character.
99
Performance Sentry User Manual
Utilities
Scripts
The Cycle End command that is launched can also be a script. Use a script if you want to
perform additional processing over and above merely copying the .smf data file. When the
Collection Service launches your script, it can also pass runtime parameters to it. These runtime
parameters give your script access to the current .smf data file name, the path where the
Collection Service is installed, etc.
Cycle End scripts typically perform some or all of the following processing steps:
•
•
•
•
Execute the DMSumSMF.exe Summarization Utility to reduce the amount of
processing that needs to be performed upstream.
Call PKZIP compression to further reduce the network load associated with bulk data
transfers since Performance Sentry-format text files typically compress 10:1. PKZIP
compression is an option that is normally performed automatically at cycle end.
However, the DMSumSMF.exe Summarization Utility only works on uncompressed
files. If you decide you want to compress your data files after summarization, call
PKZIP in your Cycle End script. A licensed version of the PKZIP program is installed
for this purpose when you install the collection agent using the supplied Setup routine.
Copy the summarized (and compressed) .sum.smf data file to a remote consolidation
server, or
Execute the ftp utility to transmit .smf or .sum.smf data files to a remote consolidation
server.
Testing Cycle End Command Scripts
Like any program, Cycle End scripts may require testing and debugging. During development
and testing of your Cycle End scripts, there are several features you should take advantage of that
are designed to assist you when you are debugging a Cycle End script. We recommend you make
these minor changes to the normal Collection Service runtime parameters in the Data Collection
Set for testing. When you are debugging a Cycle End script,
1.
Edit the Data Collection Set (DCS) which you intend to run on the target machine and
expand the ‘Properties’ item in the upper right-hand corner of the window. Expand the
‘Cycle’ item.
2.
Uncheck the Cycle End Command Inhibit parameter. Unchecking this runtime
parameter launches the Cycle End command at the end of each Collection Cycle. This
allows you to perform more frequent testing than if you use the default setting which
launches the Cycle End command only on the Cycle Hour.
3.
Set the value of the Cycle Data Ready Delay parameter (which defaults to 60 seconds)
to zero (0). The Collection Service waits for Perflib DLLs to initialize prior to writing
the first data records to the collection file. This parameter determines the maximum
duration of this initial delay. During development and testing of your Cycle End
command scripts, consider eliminating this delay so that the Collection Service
completes initialization quicker and you get quicker turnaround in testing.
4.
Use redirection to route output from your script specified in the Cycle End Command
parameter to a file for viewing. For example, redirect the output from the script,
summary.bat, to a file by coding the following:
100
Performance Sentry User Manual
Utilities
summary.bat @LastDataFile:p @StartupDir > output.txt
In this example, the summary.bat script text is redirected to the file output.txt. Because
the Cycle End command processor that launches your script is pointing to the Output
Directory (reference @OutputDir), you will find that output.txt is created in the
NTSMF40\data\Current folder. To view the output from any of the commands your
script executes, you might also redirect that output to an external file.
5.
Press the Assign button to assign these parameter values to the Collection Service
running on that machine Right Now.
6.
Then, to test the command or script you have developed, issue the Notify command in
the Network Browser (or use the corresponding DmCmd automation command from
the command line) to force a cycle end to occur Right Now.
7.
Finally, check the NTSMF.log file or the Application Event Log for a DMPerfssgenerated entry with an ID of 1400 that echoes the command string exactly as it was
issued by the Cycle End command processor after performing all text keyword
substitutions you requested. If your script utilizes the text substitution feature to pass
parameters, there is no other easy way to determine exactly what text is being passed to
your Cycle End script. This is the one aspect of debugging a script that cannot be
duplicated interactively. Figure 7.1 illustrates the Cycle End Event Log entry created
when a Notify command was issued with the Cycle End command string specified that
is illustrated in Figure 7.2.
8.
When you finish testing your script, we recommend that you restore the original
Collection Cycle runtime parameters.
Figure 7.1. The Collection Service generates an Application Event Log entry with an ID of 1400 that echoes the command
string exactly as it was issued by the Cycle End command processor.
101
Performance Sentry User Manual
Utilities
Figure 7.2 Uncheck the Cycle End Command Inhibit parameter when you are testing and debugging Cycle End scripts.
Note: The security context that the Collection Service runs under is automatically propagated to
the process created to execute your Cycle End script. This is liable to be different from the
security context of your foreground desktop session that you use to develop and tests your scripts
interactively. If your script executes correctly when you execute it interactively, but does not work
correctly when automatically launched by the Collection Service at cycle end, you may have a
security issue. See Chapter 2, “Security Considerations” to see how to assign an authorized User
Account that the Collection Service will impersonate when it launches your Cycle End script.
File Management
At the end of a Collection Cycle, the Collection Service closes the current collection file to make
it available for processing and opens a new one. The Collection Service stores data collection logs
in the \data subfolder under the NTSMF40 program folder by default. The location of the data
folder can also be changed using the Sentry Administration program by modifying the Write to
Folder start-up parameter.
Hierarchical file management sets up Current, Previous and Archive folders under the \data subfolder and manages collection files according to the criteria you specify. The hierarchical file
management option is specifically designed to simplify your cycle end procedures. By default, old
collection files are moved immediately from the Current folder to the Previous folder. Files in the
Previous folder that are older than one day are then migrated to the Archive folder. Because file
management is performed prior to issuing the Cycle End command, the cycle end procedure you
execute should point to the current files in the Previous folder.
Unique collection data file names are automatically generated of the form
systemname.yyyymmddhhmmCustomQualifier.smf
102
Performance Sentry User Manual
Utilities
where yyyymmddhhmm is a date/time stamp identifying when the file was created. You can pass
the data file name and path name to your Cycle End script as parameters using the text
substitution facility described below.
Processing Multiple Files
Your Cycle End command or script should allow for multiple .smf data files residing in the
\data\Previous folder. If the Collection Service was restarted (due to a re-boot, for example)
during the last Collection Cycle, there will be multiple .smf collection files in the \data\Previous
folder at the time the Cycle End command you specified is launched. Consequently, the cycle
end processing you perform should allow for the fact that multiple collection files may be
available for processing. A wildcard in your filespec normally accomplishes this.
If you need to send daily .smf files to a non-Windows host machine for processing or the
machine you need to transfer the files to is protected by a firewall, you may need to use the ftp
utility to copy the files. Chapter 2 contains several examples of simple scripts that utilizes ftp.
Again, your ftp script should allow for the fact that multiple files may need to be transferred at
the Cycle Hour.
Cycle End Command Syntax
The Cycle End command you specify is launched as a separate process by the DMPerfss
Collection Service using a call to CreateProcess(). The first word in the Cycle End command
string is passed to CreateProcess as the Process Image file. You must code both the file name and
extension of the program or script you want to execute. The remainder of the Cycle End command
string is passed as arguments to the program being executed. Following launch, the Cycle End
command program you specified executes independently of the DMPerfss Collection Service.
For example, to execute a .bat command file called SampleCommand, type the following Cycle
End command string:
SampleCommand.bat @DFMType @OutputDir @LastDataFile
SampleCommand will then be launched as a separate process, with the arguments you specified
passed to that program. Process image files that can be launched in this fashion include .exe, .bat,
and .com files.
The Cycle End command can reference a program or a script, as illustrated in the following
example which executes the Performance Sentry data Summarization Utility:
DMSumSMF.exe @LastDataFile:F @StartupDir
To execute an internal Windows Server command, such as copy, you must invoke cmd.exe /c
followed by the copy command string, as illustrated below:
cmd.exe /c copy @LastDataFile MYSERVER\\C:\ntsmf\*.*
You can reference a fully qualified name for the image file or a partial path and allow
CreateProcess to search for it. The Win32 CreateProcess routine searches for the specified image
file in the following places, in sequence:
1.
The root folder where DMPerfss.exe is located.
2.
The output folder where the .smf files are written.
3.
The 32-bit Windows NT system folder, %root\system32.
4.
The Windows root folder.
103
Performance Sentry User Manual
Utilities
5.
The folders that are listed in the PATH environment variable. Note that the PATH
used depends on the Account context. By default, DMPerfss and any processes it
spawns run under the LocalSystem Account, which normally has no PATH
environment variable initialized.
When the Cycle End command script you specify is executed, it runs in the display device
context (DC) of the DMPerfss service, which by default does not interact with the desktop. The
effect of this is that the script cannot generate any output that you can see. However, you can
change this default behavior by allowing the service to interact with the desktop using the
Services applet from the Administrative Tools menu.
If the fully qualified file name and path contains spaces, enclose the entire pathname in double
quotes (“”). In addition, if any of the arguments contain spaces, they also should be enclosed in
double quotes.
Keyword Variables in Cycle End Commands and Scripts
Cycle End command processing supports several keyword text variables that allow you to
customize the commands being issued. The command line is parsed, and each recognized
keyword variable is replaced by an appropriate character string before the actual call to
CreateProcess is issued. These keywords, among other functions, allow you to reference the
actual file name being processed, for example, Figure 7.1 illustrates the Application Event ID
1400 log entry that DMPerfss makes during Cycle End command processing after the string
substitution has been performed. This information message can be useful when you need to
debug a Cycle End command script or program.
The following keyword variables are supported:
Keyword
Text Substitution
@OutputDir
The fully qualified pathname of the output folder.
@StartupDir
The fully qualified pathname of the startup folder.
@LastDataFile
@DFMType
The fully qualified name of the last data file processed (i.e., the one that
was just closed).
The File Management option in effect. Either, “F” for the flat folder
structure, or “H”, for the hierarchical file management folder structure with
Current, Previous, and Archive folders.
@CurrentRetention
The number of days files are retained in the Current folder.
@PreviousRetention
The number of days files are retained in the Previous folder.
@AtchiveRetention
The number of days files are retained in the Archive folder.
@DiskLimit%,
@DiskLimitMB
The Disk Limit defined in the DCS. Performance Sentry is using one of
these parameters. Both these parameters are available as macros at the
same time to allow for determining which one Performance Sentry is
using. Performance Sentry uses @DiskLimitMB if it is not zero. If
@DiskLimitMB is zero, it uses @DiskLimit%.
104
Performance Sentry User Manual
Utilities
@CycleEndType
A single character as follows:
R (egular) – regular cycle. E.G. Every n hours when Cycle Duration = n.
S (hort) – a short cycle that was interrupted by an error or manual control.
H (our) – a regular cycle that occurs at the Cycle Hour.
Table 7.1 Keyword variables used in cycle end command processing
Syntax. All valid keywords start with the “@” character. Case is ignored when searching for a
keyword match. Any string that starts with a “@” that is not a valid keyword is simply ignored
when DMPerfss parses the Cycle End command string you specify. If you need the command
string to contain an “@” character, code two @’s (“@@”), which will be converted to a single @
character when the Command and its arguments are passed to CreateProcess().
Note:
For the @CurrentRetention, @PreviousRetention, and @ArchiveRetention keyword
variables, text substitution is performed only if @DFMType = “H”. In addition, the
following substring functions are supported:
:F
Returns the file name portion of a fully qualified pathname. Valid with @LastDataFile.
:P
Returns the path portion of a fully qualified pathname (pathname minus filename)
without a terminal slash. Valid with @LastDataFile.
:V
Returns the volume portion of a fully qualified pathname (drive or share) without a
terminal slash. Valid with @LastDataFile, @OutputDir and @StartupDir.
Cycle End Command Examples
The following examples illustrate Cycle End command usage.
Keyword substitution. The following examples represent typical string substitutions that will
occur for the specified keyword variables when, for example, hierarchical file management is
enabled.
@OutputDir = “d:\NTSMF\data\current”
@OutputDir:v = “d:”
@LastDataFile = “c:\NTSMF\data\previous\SQLSERVER01.200708161523.SMF”
@LastDataFile:f = “SQLSERVER01.200708161523.SMF”
@LastDataFile:p = “d:\NTSMF\data\previous”
Cycle End commands. Remember to code the executable program or command file name and
the file name extension, as the following examples illustrate:
pkzip.exe @LastDataFile.zip @LastDataFile
pkzip.exe @LastDataFile.zip @LastDataFile:f
SampleCommand.bat @DMFType @OutputDir @LastDataFile:f
105
Performance Sentry User Manual
Utilities
Putting it all together. The following example shows the Batch command file,
SampleCommand.bat:
REM this zips up the latest file in the \Previous folder
REM and copies it to a central location
if “%1” == “F” goto error
cd %2\..\Previous
pkzip %3.zip *.*
copy %3.zip WMACHINE\\ntsmfdaily\*.*
goto :end
:error
echo Error, DMFType not hierarchical
:end
Note that if @OutputDir, in the batch file example above, were to contain a pathname with
embedded spaces, the Cycle End command line needs to be coded as follows:
SampleCommand.bat @DMFType “@OutputDir” @LastDataFile:f
Cycle End Command Usage Notes
1.
The specified command is executed after the Collection Service performs file
management.
2.
The command specified is executed with the security privileges of the DMPerfss
Collection Service, which is NT AUTHORITY/SYSTEM. This is also known as the
LocalSystem Account. This is a built-in account with access to all internal Windows
resources, but no automatic access privileges to the Windows desktop or networked
resources such as shared drives, etc.
3.
When the Collection Service launches the specified Cycle End command, the working
folder is set to the data folder (e.g. <ntsmf dir>\data\Current). The keyword variable
@StartupDir is used to correctly establish the path environment for execution when a
program (rather than an internal command) is executed from cycle end launch.
A script that you test and debug under your desktop’s login authority can fail when DMPerfss
submits it because it does not have the same authority to access a network drive or other resource
as your desktop login Account. If you need to assign an Account with the appropriate privileges
to allow your Cycle End command script to run, specify the -account and -password keywords
when you install the Collection Service as follows:
DMPerfss -install -account DomainName\myAccount -password xxxxxxx
or with the Automation Interface command ‘dmcmd’ as follows:
net stop DMPerfss
dmcmd -account MyDomain\myAccount -password xxxxxxx
net start DMPerfss
106
Performance Sentry User Manual
Utilities
Performance Sentry Data Summarization
Utility
The Summarization Utility, DMSumSMF.exe, is used to create summarized Performance
Sentry collections files from .smf collection files. Except for the fact that the interval data records
they contain represent longer intervals of time, summarized files created by the Summarization
Utility are identical in format to the original input data file. Summarized .smf files can be
processed by any third party package that already accepts detail Performance Sentry collection
files. The summarized file that the Summarization Utility creates uses the same format
computername.datetimestamp filename format as the original, except with a suffix and extension
sum.smf.
The Summarization Utility is designed to run at cycle end as part of a Cycle End command
script. The file aging parameters that are defined are also applied to any inactive summarized files
you created during Cycle End processing that reside in the \data\Current, Previous, or Archive
folders. If you run the Summarization Utility at cycle end, there is a required Home Folder
parameter that you must pass to your script using the text substitution feature of the Cycle End
command processor. The Summarization Utility can also run in a stand-alone environment, in
which case it is not necessary to specify the Home Folder parameter. You can invoke the
DMSumSMF.exe Summarization Utility directly from a Command line or in a batch file or
script. You must, however, perform your own file aging when you run the Summarization Utility
outside the cycle end context.
The default summary interval is 15 minutes, but you may select any summarization interval that
is an integer multiple of the source file's collection interval using the -S command line switch.
The longest summarization interval that is supported is 1440 minutes, or a full 24 hour period. In
the summarized file that is created, intervals start on a summary interval boundary. For example,
if you select a 60 minute summarization interval, the sum.smf file will contain intervals that start
at 1:00, 2:00, etc., with the exception of the first and last intervals, which are liable to be
abbreviated.
You can take advantage of a roll-up feature of the Summarization Utility that allows you to
maintain an historical file that can be used to create standard reports spanning a constant number
of consecutive days. To use the roll-up feature, you simply create a concatenated input data file
with the current collection file appended to the previous historical roll-up file. Then run the
Summarization Utility utility specifying the number of consecutive days worth of data that you
want to keep. Any data in the concatenated input data file older than the specified number of
days is dropped from the summarized output version. Using the Summarization Utility you can
maintain one or more historical roll-up files that can simplify and streamline your reporting
procedures. You can create and maintain as many historical data files as you want.
See the sample script below for an example of how to use the Summarization Utility in this
fashion.
107
Performance Sentry User Manual
Utilities
How Counter Data is Summarized
Except that the interval data records they contain represent longer intervals of time, summarized
files created by the Summarization Utility are virtually identical in format to the .smf data files
originally created by the Collection Service. Two additional fields appended to the end of the
Performance Sentry Configuration record (the second record in the file, see Appendix A for
details) identify the version of the Summarization Utility that created the summarized file and
the summarization interval selected. Programs like SAS IT Resource Management and Lund
Performance Gallery can process summarized files without modification.
The logic used to summarize performance counters is based on the counter type.
Both Type 5 Counter Name and Type 6 Counter Type Format records must be available in the file
to be summarized. (See Appendix A for a fuller explanation of the Windows Server Counter
Types.) For the great majority of counters that report an average activity rate over the interval
(like Page Faults/sec or % Processor Time), the Summarization Utility merely recalculates the
counter as an average value (usually a rate per second) over a longer time interval.
Data Smoothing
For accumulated counters, when you summarize them you can expect that some data smoothing
will occur when you report on summarized Performance Sentry data. The summarized counter
values reflect a mean (or average) value over the summary interval you select. This will smooth
out some of the peaks and valleys that are evident in the original detail file. For example, Figure
7.3 displays the System % Total Processor Time, which, despite the name, is an average value
over all processors, not a total, at one minute intervals.
108
Performance Sentry User Manual
Utilities
Figure 7.3 System % Total Processor Time at one minute intervals
Figure 7.4 shows the value of the same counter over the same measurement duration after the
counter was summarized to 10 minute intervals. The spikes in % Total Processor Time evident at
the detail level are no longer visible at this summarization level. There are no longer any intervals
when the average System % Total Processor Time exceeds 70% for the duration of a 10 minute
interval. In capacity planning, both the one-minute Peak and the ten-minute average are
potentially useful values. Many capacity planners, for example, recommend computing the
Peak:Average ratio as an indicator of how much variability in load must be planned for.
109
Performance Sentry User Manual
Utilities
Figure 7.4 System % Total Processor Time at ten minute intervals.
For instantaneous or raw counters like Processor Queue Length, the Summarization Utility
automatically calculates the arithmetic mean or average value of the counter over the
summarization interval selected. Each raw counter value available at the detail level is properly
viewed as a sample value that is used to derive an average value by the Summary program.
Following summarization, raw counters are no longer restricted to integer values. Figure 7.5
charts the raw counter Processor Queue Length from a summarized file. The fractional data
reflects the average of the observed Processor Queue Length measurements over the
summarization interval.
110
Performance Sentry User Manual
Utilities
Figure 7.5 Processor Queue Length average over ten minute intervals.
For several Hit % counters in the Cache object, the Summarization Utility uses their associated
denominator counter values to summarize them correctly over the summarization interval. The
specific Cache object Hit % counters that require the denominator values are defined as Sample
Fraction counter types. If denominator values for these counters are available, the Summarization
Utility correctly produces the weighted average Hit % for the interval. See Chapter 4, “Runtime
Parameters Reference, File Contents” for more information about the denominator counter value
option. If denominator values are not present, the Summarization Utility calculates a simple
arithmetic mean instead, which is subject to gross error.
In order to summarize process level data correctly, the ID Process counter must be present in the
input files. The process ID is unique in Windows, the process name is not necessarily unique.
Several process instances named svchost.exe are normally found running concurrently in
Windows Server, for example. The Summarization Utility discards instances of the Thread
object. No summarization is performed on any Thread counters collected. Any Thread records
encountered during summarization are discarded.
Peak Values for Peak Counters
A specific set of instantaneous or raw counters shown below in Table 7.2 all report a maximum
or peak value at the detail level that is calculated as the maximum raw counter observed since
system start-up. These maximum or peak counters would be far more useful if they represented
interval maximums, instead of reflecting a global time range. The Summarization Utility can
calculate interval maximum or peak values for a specific set of counters.
111
Performance Sentry User Manual
Utilities
The Summarization Utility refers to the Peak counter’s underlying raw counter and calculates the
maximum value observed during the summarization interval. For instance, the Process Working
Set Peak counter is normally calculated as the highest value of the Working Set counter observed
since the specific process started. The Summarization Utility automatically reports the Process
Working Set Peak as the highest value of the Working Set counter observed during the
summarization interval.
Table 7.2 documents the specific peak counters for which the Summarization Utility will
calculate interval maximum values. The value reported for the peak counter is the maximum
observed value of the corresponding base counter during the summarization interval.
Object
Peak Counter
Corresponding Base Counter
Memory
Cash Bytes Peak
Cache Bytes
Virtual Bytes Peak
Virtual Bytes
Working Set Peak
Working Set
Page File Bytes Peak
Page File Bytes
Pool Nonpaged Bytes Peak
Pool Nonpaged Bytes
Pool Paged Bytes Peak
Pool Paged Bytes
MSExchangeIS Private,
MSExchangeISPublic
Peak Client Logons
Client Logons
MSExchangeIS
RPC Requests Peak
RPC Requests
MSExchange Internet
Protocols
Peak Connections
Active Connections
Process, Job object, Details,
User, Session, Terminal
Server Session, Winstation
Server
Table 7.2 For these peak counters, the Summarization Utility calculates the maximum value observed during the
summarization interval based on the underlying Base counter.
Summarizing During Cycle End Processing
The Summarization Utility is designed to be executed during Cycle End processing, although it
can also be executed in a stand-alone environment. By running the Summarization Utility against
the detail level file before you transmit collection files to a central site for processing, you can
reduce significantly the amount of performance data that needs to be transferred across the
network. Sending smaller files also reduces storage usage and processing time at its final
destination.
112
Performance Sentry User Manual
Utilities
Running the Summarization Utility at cycle end, the input file is assumed to reside in the
\data\Previous folder, which is also the folder where the output sum.smf file is created. The
<computername>.sum.log log file which contains the messages documenting the summarization
run is created in the data\Current folder. Once you create a summarized file, it is subject to the
same rules for automatic file migration, archival and, ultimately, deletion on the local system disk
where it was created. Both detail and summarized files are aged through the \data folder
hierarchy using a common set of automatic file management parameters.
Inactive summarized file that reside in the \data\Previous, \Current, or \Archive folders are
subject to automatic file management. Note that automatic file migration is based on the file’s
Last Modified Date, so only inactive files are subject to automatic migration, archival, and
deletion. In the case of a continuously updated historical roll-up file, your daily processing cycle
will update the Last Modified Date and ensure that the summarized file is never migrated or
deleted. A summarized file that is created in the \data\Previous folder during Cycle End
command processing has a Last Modified Date that will keep it in the \Previous folder for one
additional day before it is migrated. If you keep historical roll-up files in the \Previous folder and
update them continuously, the Last Modified Date will reflect the time that the history file was
created during Cycle End processing. The Last Modified Date of the historical roll-up files
generated in this fashion will prevent them ever being migrated from the \Previous folder.
Historical Roll-up Files
The roll-up feature of the Summarization Utility allows you to create and maintain an historical
file spanning a constant number of consecutive days. To streamline your reporting, you might,
for example, use the roll-up feature to create
•
•
•
a Daily history file spanning the last two weeks,
a Weekly trending file spanning the last 26 weeks, and
a Monthly capacity planning file that spans the last 2 or 3 years.
The roll-up feature is used to drop any data in the summarized file older than the specified
number of days.
To use the roll-up feature, you must first create a concatenated input data file with the current
collection file appended to the previous historical roll-up file. Note: the concatenated input file
specified using the -F parameter may contain data from more than one machine. See the section
“Processing Multiple Files” below for more details. Then run the Summarization Utility
specifying the -K Keep parameter that tells the utility the number of consecutive days worth of
data that you want to keep. Any data in the concatenated input data file older than the specified
number of days is dropped from the summarized output version.
The sample script below illustrates a Cycle End command procedure that creates and maintains
Daily, Weekly, and Monthly history roll-up files. This scripting example assumes you have
created additional \History and \Work folders under your primary \NTSMF\data folder.
Processing Multiple Files
The Summarization Utility can process input files from multiple machines and multiple days in a
single execution run. It creates a single summarized output file per machine. The files you want
to process must first be concatenated using the Copy command with the /B option. For example,
if the detail files are in the \data\Archive folder, the command
113
Performance Sentry User Manual
Utilities
copy /B *.smf allweek.smf
will copy all of the .smf files into a new file named allweek.smf. The /B switch drops end-of-file
characters. If the input file contains data from more than one computer.
This is a simple example of a batch command file to summarize a week's worth of data to one
hour intervals:
copy /b *.smf allweek.smf
DMSumSMF.exe -fallweek.smf -s60
copy *.allweek.sum.smf c:\ntsmf\summary\*.*
delete *.allweek.smf
The
summarized
output
files
created
in
this
example
are
named
<computername>.allweek.sum.smf. One <computername>.allweek.sum.smf summarized output
file is created for each machine present in the consolidated input file.
Daily, Weekly, Monthly Historical Roll-up Example (CycleEnd.bat)
rem **********************************************************************************
rem Cycle End command: CycleEnd.bat
@LastDataFile:p
rem
@StartupDir 15
%1
%2
> CycleEnd.log
%3
rem %1 is the full path name including file name
rem %2 is the startup or home folder for DMDumSMF.exe-required when launched from DMPerfss.exe
rem %3 is the summarization interval in minutes
rem Note: The default summarization interval is 15 minutes. If a sumarization interval rem other than
15 minutes is wanted for the daily and 14 day file, modify the command:
rem *********************************************************************************
rem Maintains daily, weekly, and monthly history files
rem Daily roll-up file: keeps 14 days of history, summarized to 10 minute intervals
rem Weekly roll-up file: keeps 26 weeks of history, summarized to 1 hour intervals
rem Monthly roll-up file: keeps 24 months of history, summarized to 4 hour intervals
rem *********************************************************************************
rem Utilizes the following Folder structure:
rem <NTSMF root>\data\
rem - \Archive -- Hierarchical File System Folder
rem - \Backup -- contains backups of History Files
rem - \Current--Hierarchical File System Folder - current data collection file and logs
rem - \History -- History roll-up files
rem - \Previous--Hierarchical File System Folder- previous days' collection files
rem - \Work -- temporary folder for file consolidation and summarization
rem
rem **************** Prepare folders *************************************************
rem check for the existence of Work, History, and Backup folders.
rem If they don't exist, create them:
if not exist %2\data\backup mkdir %2\data\Backup
if not exist %2\data\history mkdir %2\data\History
if not exist %2\data\work mkdir %2\data\Work
rem combine all of the .smf files from \previous into a combined file in the 'Work' folder
copy /B %1\*.smf %2\data\Work\%COMPUTERNAME%.combined.smf
rem summarize the resulting combined.smf data file...
rem %3 parameter can override default
114
Performance Sentry User Manual
Utilities
if "%3"=="" (%2\dmsumsmf.exe -f%2\data\Work\%COMPUTERNAME%.combined.smf -k2 -H"%2" -s15) else
(%2\dmsumsmf.exe -f%2\data\Work\%COMPUTERNAME%.combined.smf -k2 -H"%2" -s%3)
rem Delete old backups
del %2\data\Backup\*.old.sum.smf
rem Backup files in the 'History' folder to the 'Backup' folder by
rem first renaming the files in the backup folder...
ren %2\data\Backup\%COMPUTERNAME%.daily.sum.smf %COMPUTERNAME%.daily.old.sum.smf
ren %2\data\Backup\%COMPUTERNAME%.weekly.sum.smf %COMPUTERNAME%.weekly.old.sum.smf
ren %2\data\Backup\%COMPUTERNAME%.monthly.sum.smf %COMPUTERNAME%.monthly.old.sum.smf
rem Then copy from \History to \Backup..
copy %2\data\History\*.smf %2\data\Backup\
rem **************** Keep 14 days worth of Daily Data ********************************
rem
rem Step 1: move the Daily summary file to \Work
move %2\data\History\%COMPUTERNAME%.daily.sum.smf %2\data\Work\
rem Step 2: Concatenate yesterday's data with the current Daily history roll-up
rem
if we have a daily summary file then concatenate the new file to it,
rem
otherwise, just copy the combined file to the \History folder and rename it...
if exist %2\data\Work\%COMPUTERNAME%.daily.sum.smf (copy /B
%2\data\Work\%COMPUTERNAME%.daily.sum.smf+%2\data\Work\%COMPUTERNAME%.combined.sum.smf
%2\data\History\%COMPUTERNAME%.daily.smf) else (copy %2\data\Work\%COMPUTERNAME%.combined.sum.smf
%2\data\History\%COMPUTERNAME%.daily.smf)
rem Step 3: Run the Summarization Utility on the combined file
if "%3"=="" (%2\dmsumsmf.exe -f%2\data\History\%COMPUTERNAME%.daily.smf -k14 -H%2 -s15) else
(%2\dmsumsmf.exe -f%2\data\History\%COMPUTERNAME%.daily.smf -k14 -H%2 -s%3)
rem ***************** Keep 26 weeks worth of Weekly data on 60 minute intervals*******
rem
rem Step 1: move the Weekly summary file to \Work
move %2\data\History\%COMPUTERNAME%.weekly.sum.smf %2\data\Work\
rem Step 2: Concatenate yesterday's data with the current Weekly history roll-up
rem
if we have a weekly summary file then concatenate the new file to it,
rem
otherwise, just copy the combined file to the \History folder and rename it...
if exist %2\data\Work\%COMPUTERNAME%.weekly.sum.smf (copy /B
%2\data\Work\%COMPUTERNAME%.weekly.sum.smf+%2\data\Work\%COMPUTERNAME%.combined.sum.smf
%2\data\History\%COMPUTERNAME%.weekly.smf) else (copy %2\data\Work\%COMPUTERNAME%.combined.sum.smf
%2\data\History\%COMPUTERNAME%.weekly.smf) rem Step 3: Run the summary program %2\dmsumsmf.exe f%2\data\History\%COMPUTERNAME%.weekly.smf -k182 -H%2 -s60
rem ***************** Keep 24 months worth of Monthly data on 4 Hour intervals********
rem
rem Step 1: move the Monthly summary file to \Work
move %2\data\History\%COMPUTERNAME%.monthly.sum.smf %2\data\Work\
rem Step 2: Concatenate yesterday's data with the current Monthly history roll-up
rem
if we have a monthly summary file then concatenate the new file to it,
rem
otherwise, just copy the combined file to the \History folder and rename it...
if exist %2\data\Work\%COMPUTERNAME%.monthly.sum.smf (copy /B
%2\data\Work\%COMPUTERNAME%.monthly.sum.smf+%2\data\Work\%COMPUTERNAME%.combined.sum.smf
%2\data\History\%COMPUTERNAME%.monthly.smf) else copy %2\data\Work\%COMPUTERNAME%.combined.sum.smf
%2\data\History\%COMPUTERNAME%.monthly.smf
rem Step 3: Run the summary program to produce the monthly summary
115
Performance Sentry User Manual
Utilities
%2\dmsumsmf.exe -f%2\data\History\%COMPUTERNAME%.monthly.smf -k730 -H%2 -s240
rem
rem Clean up Work & History folders del %2\data\Work\*.smf
del %2\data\History\%COMPUTERNAME%.daily.smf
del %2\data\History\%COMPUTERNAME%.weekly.smf
del %2\data\History\%COMPUTERNAME%.monthly.smf
Cycle End Summarization Example
This section illustrates the use of the Summarization Utility during Cycle End processing. The
Summarization Utility can be run automatically at cycle end by coding the following Cycle End
command:
DMSumSMF.exe -f@LastDataFile:F -H"@StartupDir"
Note:
If you are launching the Summarization Utility during Cycle End command processing,
you must specify the -H option with the @StartupDir parameter so that the
DMSumSMF program can find the Performance Sentry Home Folder. If there are any
spaces in the full Performance Sentry path name, the @StartupDir keyword must be
enclosed in quotes.
Because you normally need to summarize the detail collection file and then transmit it, the
Summarization Utility is normally invoked within a command batch file. For example, you might
code the following Cycle End command to invoke the Summarization Utility and transmit the
summarized file created back to a central location for further processing:
Summarize.bat @LastDataFile:F "@StartupDir" 30
where Summarize.bat is coded as follows:
rem ------------------------------------------------------------------rem Summarize.bat
rem
rem Example batch file to execute the summarization program launched
rem from the Cycle End command parameter by the Performance Sentry
rem Collection Service, DMPerfss.exe
rem
rem sample command
rem Summarize.bat @LastDataFile:F “@StartupDir”
30
rem
rem Notes:
rem 1. the file name to summarize is required (%1).
rem 2. the full path (%2) to the program is required.
rem 3. the default summary interval is 15 minutes if the third
rem argument is not specified
rem
rem
rem first cd to the home folder
cd %2
rem Check for a valid summary interval
if %3 GEQ 0 goto nodefault
rem now execute the summarization program
dmsumsmf.exe -f%1 -h%2
goto docopy
116
Performance Sentry User Manual
Utilities
:nodefault
dmsumsmf.exe -f%1 -h%2 -s%3
:docopy
copy %2\data\Previous\*.sum.smf \\Server\NTSMF-Daily\*.*
Usage Notes
1.
The <computername>.*.sum.smf summarized output files are created in the same
folder as the input file (specified using the required -F parameter), where
<computername> reflects the name of the machine that the data applies to. A single
<computername>.ntsmf.sum.log message file is created where <computername>
reflects the name of the machine where the Summary program was executed.
2.
When the -H Home Folder parameter is specified, if the input file resides in the
standard \data\Previous\ folder, then the ntsmf.sum.log message log file is written
to the \data\Current\ folder (where the NTSMF.log file also resides). Otherwise,
the ntsmf.sum.log message log file is written to the same folder as the input file.
3.
The Summarization Utility works only with .smf files that use the compressed file
format. Compressed file format is the default setting for all predefined Data
Collection Sets, including the Collection Service internal defaults that are used
when no DCS is assigned.
4.
Both Type 5 (Counter Names) and Type 6 (Counter Definitions) Discovery
records are required. The summarization logic used for all counters is based on the
designated counter type. Both Type 5 Counter Names and Type 6 Counter Type
Format records are written by default for all predefined Data Collection Sets,
including the Collection Service internal defaults.
5.
The ID Process counter (a unique process identifier) must be present to summarize
Process objects. The ID Process counter is written by default for all predefined
Data Collection Sets, including the Collection Service internal defaults.
6.
Denominator values must be collected to summarize the Cache object Hit %
counters of the Sample Fraction counter type correctly. Denominator values are
written by default for all predefined Data Collection Sets, including the Collection
Service internal defaults.
7.
Thread data is not summarized. Any Thread object records encountered in the
input file are discarded.
Command Syntax
DMSumSMF.exe
Switch
-F{filename} [-S{minutes}] [-K{days}] [-H-]
[-E-] [-L-] [-D] [-R|-RM]\{n} [-P-]
Parameter
-F
File name of source
-S
Summary interval (in
minutes)
Default
Value
[none]
15
Usage Notes
***Required Field***
Maximum summary interval is 1440
minutes (24 hours)
117
Performance Sentry User Manual
Utilities
-K
Keep accumulated data for n
days
-H
Performance Sentry Home
Folder
Reference @StartupDir for Cycle End
command processing
-E-
Do not write Windows
Server Events
Use the Application Event Log
-L-
Do not write log file
messages
-D
Write debug messages
-R
Disk space limit (%)
99
Disk space limit (MB)
99
-RM
-P-
30
Data older than n days is deleted
Do not create
<computername>.ntsmf.sum.log file
Calculate arithmetic mean
of Peak Value counters
Processing halts if disk space limit is
exceeded
Report observed interval peak values by
default
Table 7.3 Command line switches with explanation and usage notes
All command line switches and arguments are case insensitive. Only -F filename parameter is
required. All other parameters are optional.
Data Folder Usage
The -F file name parameter is required. The default assumed folder tree is the
\data\Current
\Previous
\Archive
folder structure that exists when hierarchical data file management is in place. The summarized
data file is placed in the data\Previous\ folder and the log file (computername.ntsmf.sum.log) is
placed in the data\Current\ folder.
For other folder trees, the UNC conventions are followed. In those cases, both the summarized
file and the log file are placed in the same folder as the input file that is referenced in the -F
command. For example, the command:
DMSumSMF.exe -fdata\cougar.20000720000.smf
writes both the summarized file cougar.20000720000.sum.smf and the message log file
cougar.ntsmf.sum.log to the \data\ folder.
To run DMSumSMF.exe from the Cycle End command processor, the -H Home Folder option
is required. Specify the Cycle End command keyword text substitution parameter @StartupDir
as the Home Folder, as illustrated below. Note that if there are any spaces in the full path, the
keyword text substitution parameter must be enclosed in quotes.
DMSumSMF.exe -f@LastDataFile -H"@StartupDir"
When running the Summarization Utility in a stand-alone environment, a batch command or
command line execution, omit the Home Folder argument, -H.
118
Performance Sentry User Manual
Utilities
Automation Interface
The DmCmd.exe program provides a command line interface that allows you to control the
operation of the Collection Service. The utility is designed to be used after you have deployed the
Collection Service and you need to script a change in the collection parameters affecting multiple
machines. Using the Automation Interface, you can execute a script from your desktop machine
that will change the collection parameters in effect across a large number of machines in your
network and coordinate the change so that all the machines affected adopt their new collection
parameters in a coordinated fashion.
Common Collection Service maintenance tasks that you can use the Automation Interface to
perform include:
•
•
•
Assigning or refreshing a DCS definition (files)
Switching between one DCS definition and another
Assigning or Updating a User Account and Password that the collection impersonates
In general, any of the actions you can perform interactively using the Network Browser
component of Sentry Administration can also be automated using the DmCmd Automation
Interface and DCSX definition files. In addition, the Automation Interface provides Return
Codes that your script can test so that you can build robust automation procedures. Your script
can test the DmCmd Return Codes by accessing the built-in environment variable
ERRORLEVEL following DmCmd command execution.
Networking Support
You can execute the DmCmd program so that it operates on the local system or point it to a
remote system to communicate across the network. To execute any valid Automation Interface
command remotely, append -s computername to the command. For example:
DmCmd -ct0 -s portable
returns the status of the Collection Service running on a machine named “portable.”
DmCmd communicates with the target system across a named pipe interface when the -s
parameter is used. Similar to the Network Browser component of Sentry Administration, if the
machine you are trying to communicate with is protected behind a firewall, DmCmd is unable to
communicate with it either. Execute your script from a machine within the firewall in order to
communicate with isolated resources.
If no remote system argument is provided, DmCmd communicates to the Collection Service on
the local machine and attempts to execute the specified command or function there.
The DmCmd you issue to a remote machine has a default time out period so that your script
does not get hung up indefinitely due to a networking communication problem,. The default
time-out when communicating with the Collection Agent is 10 seconds, but you can override
that by specifying a time out value using the -to option. To change this value to 30 seconds, for
example, code:
119
Performance Sentry User Manual
Utilities
DmCmd -to 30
Assign or Refresh a DCS Definition
The most commonly used function of the DmCmd program is to assign and activate a new or
changed exported DCS definition file. In a typical script, you will first copy the exported DCS
file to the machine affected. Then, you invoke DmCmd and issue a file switch and Notify
command sequence, as follows:
DmCmd -cc -cf MyNewDCS.dcsx -s MyRemoteServer
This command assigns the specified DCS to the Collection Service running on the remote
machine and notifies the Collection Service to activate the new DCS definition beginning with
the next Collection Cycle.
If you are updating the currently assigned DCS, simply copy the new file over the old one and
then issue the following command to notify the Collection Service to refresh the DCS definition
at the beginning of the next Collection Cycle:
DmCmd -cc -s MyRemoteServer
Assign or Update User Account/Password
Using the Automation Interface, you can change the User Account and that the Collection
Service impersonates during Cycle End command processing. Specify the Account and Password
(which is encrypted before being transmitted across the network), as follows:
DmCmd -cc -account MyDomain\NTSMFagent password -password
xxxxxxx -logon -s MyRemoteServer
The logon option instructs the Collection Service to verify that the User Account and Password
specified is valid before making any changes. The Collection Service must be running to verify
the User Account and Password.
Command Syntax
Switch
Parameter
Function
Usage Notes
Multiple commands are processed
from left to right. The Collection
Service must be active on the target
machine.
Commands
Assign DCS file
Must reference an exported DCS
file in the /NTSMF root folder
-cf-
Deactivate current
DCS file
Reverts to Registry DCS, id
present, otherwise use service
internal defaults
-cb
Backup DCS file
Creates <dcs name>.old.dcs
-cn
Notify, Now
Ends current Collection Cycle:
DCS definition is refreshed
immediately
-cc
Notify, defer changes
DCS definition will be refreshed at
-cf
{filename.dcs}
120
Performance Sentry User Manual
Utilities
scheduled Collection
Cycle
-ct
0x
the next scheduled Collection Cycle
Status command
Sets ERRORLEVEL environment
variable
Assign User Account
If no Domain is specified, a local
Account is assumed
Specify Account
password
Password is encrypted if executed
remotely (-s option specified)
Authenticate the
account / Password
No change if the
Account/Password is invalid
Assign DCS file
Requires Registry authority
Deactivates current
DCS file
Reverts to Registry DCS, if present,
otherwise use service internal
defaults
Assign User Account/Password
-account
{domain}\{account}
-password
-logon
Options
-f
{filename.dcs}
-f-
-s
{computer name}
Execute Command
on target machine
Target machine must be visible in
Network Neighborhood
-to
{seconds}
Timeout command
execution after n
seconds
Default time out value is ten
seconds
Table 7.4 Command line switches with explanation and usage notes
To use the DmCmd program, you may specify either commands or security functions. You may
also specify execution options which determine the target machine. To execute commands, the
Collection Service on the target machine must be active. If multiple commands are specified,
they are executed in sequence from left to right.
Switch DCS Definition Files
To Switch to a different DCSX definition file, you must first specify when the change should
take effect (immediately or at the next scheduled cycle end), and then specify the DCSX file
name. This is equivalent to the Notify command using the Network Browser. You must Notify
the Collection Service that you want to change or refresh the DCS definition in use. Otherwise,
the Collection Service will continue to use the current DCS definition until the next time the
service is restarted, normally during system boot. As in the Network Browser, there are two
Notify options: Right Now or at the Next Scheduled Collection Cycle End. Right Now
terminates the current Collection Cycle, refreshes the DCS definition at the start of the next
Collection Cycle. The Notify, Next Scheduled Collection Cycle option allows you to make a
change in collection parameters and coordinate that change in an orderly fashion across your
network.
To switch immediately to a new DCS, issue the following command sequence:
121
Performance Sentry User Manual
Utilities
DmCmd -cf MyDCS.dcsx -cn -s MyMachine
The Collection Service must be active to process the file switch command.
If the Collection Service is not active, you can use the -f option to assign a DCSX file to be used
when the Collection Service is next restarted. The -f option writes the name of the DCSX file
assigned into the Registry of the target machine. This form of the command can be used to
assign a new DCSX even if the Performance Sentry Collection Service is not running.
The script security context must be authorized to update the Registry at
HKLM\SYSTEM\CurrentControlSet\Services\DMPerfss\Control for the file switch operation
using the -f option to execute successfully. If you do not have permission to access the registry,
you may use the -cf command instead, which uses the communication channel and requires that
Performance Sentry Collection Service is running.
To deactivate the current DCSX file immediately and fall back on the current Registry-based
parameters (or the default collection set, if no Registry entry exists), issue the following
command:
DmCmd -cn -f-
Alternatively, you may use the -cf- command, which also requires that the Collection Service be
active.
To deactivate the active DCS file at the next cycle end, issue the following command:
DmCmd -cc -f-
Alternatively, you may use the -cf-parameter as previously described.
Suspend/Resume Data Collection
To Suspend data collection, issue the following command:
DmCmd -cu
To Resume data collection, issue the following command:
DmCmd -cr
Status Command
To determine the Status of the Collection Service, issue the following command:
DmCmd -ct 0
The Status command returns a text string that contains an Acknowledgment, followed by the
current machine environment: the operating system version, the operating system maintenance
level, the service status, the suspend reason, the Performance Sentry Collection Service version,
the scheduled DCSX name, the DCSX location, and the DCSX file name, if applicable.
For example,
DmCmd -ct0 1,Status, GetMachineEnvironment, ACK, ANSI
4.0,Service Pack 6,2,0,2.2.1,MyDCS-1.DCSX,2,MyDCS-1.dcsx
The service status is interpreted as follows:
1 = initializing
2 = collecting
5 = suspended
122
Performance Sentry User Manual
Utilities
If the service is suspended, the suspend reason is any of
0 = suspended by command
1 = suspended on error
2 = suspended by DCS parameter (such as Collection Period)
3 = suspended due to a disk limit
The DCSX location is
2 = an external file
Error Messages
Error messages are written to Standard Error and may be redirected independently of the data
written to Standard Output. Error messages are generated when DmCmd cannot communicate
with the Collection Agent.
DMcmd.exe: Pipe operationfailed with error Error Number
where operation is Open, Close, Read, Write, or Transact.
Error Number Explanation
2
The Collection Agent was not found. The Collection agent is not running.
53
Bad network path. The -S argument is wrong or the computer is not visible on
the network
109
Connection Dropped. The Collection Agent disconnected because it stopped
running or got confused and disconnected DMcmd.
231
Busy Signal. The collection agent is hung or is processing a large interval and
cannot respond
232
Connection Dropped. The connection was closed before data could be
received. This is the same as 109.
DMcmd.exe: Timeout operation from Performance Sentry
This is the same as Error Level 231, above. The operations are Open, Close, Read, Write, or
Transact.
DMcmd.exe: error: could not <operation> Current Control Set. The
system error code was <Error Number>
where operation is Access, Remove Active DCS from, Remove Last Known Good DCS from,
Write Active DCS to.
Error Number Explanation
5
Access denied. The -f parameter is probably being used and you do not have
permission to access the Registry. Use the -cf parameter to have Performance
Sentry access it for you.
123
Performance Sentry User Manual
Utilities
Return Codes
The DmCmd Automation Interface provides return codes that can further assist you in
developing robust automated procedures. DmCmd sets ERRORLEVEL, a built-in
environment variable which your script can test following DmCmd execution. There are two
types of return codes: standard and extended. Extended return codes are returned only for the
-ct0x command and is mainly used to determine the reason the Collection Service is suspended.
Otherwise, standard return codes are returned for all other commands and functions. Both sets of
DmCmd return codes are documented below, along with a sample script that checks the
ERRORLEVEL variable after DmCmd execution.
Return Codes
Code
Explanation
0
Successful. Command or function specified was executed successfully.
1
Could not establish communication with the service. Check to ensure that the service is
running.
2
Service returned NAK. A NAK is a Negative Acknowledgement which means “I understand
what you are asking but you cannot have the answer.”
3
Internal error. A detailed error message is written to Standard Error.
4
Command line error. Unrecognized command or invalid syntax.
5
Windows Network error. The machine specified was not found, or the DCS file referenced in
the –f argument was not found.
6
Command Timeout. The collection agent at the target machine did not respond within the
specified time out limit.
Table 7.5 Return Codes
124
Performance Sentry User Manual
Utilities
Extended Return Codes
Extended Return Codes indicate service status and are available only when the -ct0x command is
issued. The service status is either operational, not operational, or suspended. If the service is
suspended, the Extended Return Code also indicates the suspend reason.
Code
0
Explanation
Successful command execution. The Collection Service is running and operational.
100
Could not establish communication with the service. Check to ensure that the service is
running.
500
The Collection Service is suspended following a DmCmd or net command.
501
The Collection Service is suspended due to an error other than Disk Limit exceeded.
502
The Collection Service is suspended in accordance with its Collection Scheduling
parameters.
503
The Collection Service is suspended because the Disk Limit was exceeded.
Table 7.6 Extended Return Codes.
Example.
The following example .BAT file illustrates using the Automation Interface in a batch command
file that checks return codes.
echo off DmCmd - ct0
rem write a period to get a Carriage Return
echo. if “%ERRORLEVEL%” == “0”
echo no error if “%ERRORLEVEL%” == “1”
echo couldn’t communicate with service if “%ERRORLEVEL%” == “2”
echo service returned NAK if “%ERRORLEVEL%” == “3”
echo internal error if “%ERRORLEVEL%” == “4”
echo command line error if “%ERRORLEVEL%” == “5”
echo net error if “%ERRORLEVEL%” == “6”
echo timeout
125
A
Appendix A - Record Format
The Performance Sentry Collection Service writes the information gathered from a Windows
Server computer to an ASCII, comma-delimited file. Performance Sentry data records are
variable length and the significance of a field is determined by its relative position in the record.
The file name of the Performance Sentry collection data file is in the form
system.datetimestamp.smf.
This section documents the Performance Sentry file format and is intended for use by those who
intend to develop reporting and data management software that directly incorporates the
Performance Sentry performance data.
Record Types
A Performance Sentry data collection file can contain two types of records — Discovery records
and Data records. The Discovery (or Format) records describe the layout of the data records and
are included in the file by default, but their inclusion is optional. Discovery records appear only
once, at the beginning of the file. There are two types of Data records: static Configuration Data
records, which are written once at the beginning of the file; and Interval Data records, which are
written continuously at the end of each data collection interval. The Interval Data records usually
constitute the bulk of a Performance Sentry data file.
Each record consists of a header portion, which contains identifying information, and a body.
Performance Sentry supports two header formats — the original header format or the compressed
header format, depending on the DCS option selected. All records in a single Performance
Sentry data log file use the same header format. The first field in the header identifies the header
format so that data log files from multiple computers can be combined into a single file for
processing.
126
Performance Sentry User Manual
Appendix A - Record Format
Discovery Records
Discovery records are used to document the format of the data records in the file. (In this manual,
the terms “Discovery records” and “Format records” are used interchangeably.)
Inclusion of discovery records in the data file is optional. They are only produced when the Write
Discovery parameter in the DCS definition is enabled. Discovery records document the
performance objects and counters that are available for collection on the system that the
Performance Sentry Collection Service is running on. Each Windows Server system supports a
common base set of performance data objects and counters. These objects and counters are
installed when you install the Windows Server operating system. But Windows Server
performance monitoring is extensible. Some of the programs and services that are installed add
their own objects and counters. These are known as extended counters and objects. Discovery
records document both the base objects and counters and the extended objects and counters.
Keeping track of all these different objects and counters so that you maintain a coherent database
of performance information across an enterprise is one of the major functions that Performance
Sentry provides. The Sentry Administration program keys off the Master Collection Set which is
stored as an XML file with a DCSX file extension.
Discovery records are designed to help us add support for new extended objects and counters
when they appear. For example, when Dr. Barry Merrill’s MXG SAS code encounters an
unknown Windows Server performance object, the program prints a diagnostic message:
NEW OBJECT HAS BEEN FOUND AND DELETED. CONTACT MERRILL
followed by a SAS Print Statement that outputs the object name and ID.
When you see this message, enable the WriteDiscovery flag, create a Performance Sentry data
file, and e-mail the file to [email protected], where we will make sure the information
gets to the SAS Institute and Merrill Associates. For complete information, see the section
entitled “What To Do When You Encounter New Objects and Counters,” in Chapter 3.
Discovery records also document the format of the data records that follow. There are three
Format records written for each performance object. Like the data records they refer to, Format
records are positional. The name of a counter that is in relative position 12 of the Format record
corresponds to the data field in relative position 12 of a Data record for that object. The Type 5
Format record contains the object name and the counter names for all the performance counters
that are defined in that object. The Type 6 Format record documents the counter type of each
counter defined in the corresponding object. As discussed below, the counter type determines the
form of the specific counter field and controls how Performance Sentry processes it. Finally, the
Type 7 record indicates the “level of expertise” presumably needed to interpret the measurement
data in the counter field. Collectively, the counter name, type and detail level represent the
properties of a counter field.
Data Records
Performance Sentry produces two types of Data records. Configuration Data records write static
information taken from the Registry. Interval Data records are written continuously at the end of
each data collection interval. One interval data collection record is written for each object
instance that exists at the end of each collection interval.
127
Performance Sentry User Manual
Appendix A - Record Format
Alert Event Records
Alert event records are written to the SMF file when alert events are fired. This information is
useful when it is parsed into the performance database. From the records, administrators can
determine when alert events were fired. These are written per interval as needed.
Alert Discovery Record
2.2.2,0,5,2011,9,20,12,14,45,600,0,DTS.AlertEvent,1,19,4,2,DTS.AlertEve
nt,DTS.Alert,Severity,Message,EventCount,TriggeredValues,
Alert Data Record
The example alert event shows a processor utilization information alert with the message that the
System % Total Processor Time was equal to 100%.
2.2.2,918600,DTS.AlertEvent,2011,9,21,19,14,0,1,33,60000,1,19,4,2,Proce
ssor Utilization Info,,400,Processor Utilization Info Alert Fired
System % Total Processor Time=100,100,100,
Configuration Records
Configuration Data records represent static information written only once at the beginning of a
file. An example of the configuration records written using the compressed header format is
provided below:
2.2.2,0,0,2000,6,13,13,33,10,203,0,0,0,4.0,Service Pack 5,PROD-DOMAIN,PRODSMP,4,267829248,
AT/AT COMPATIBLE,2,LanmanNT,IIS and ASP Starter Set,0,x86 Family 6 Model 1 Stepping9,
GenuineIntel,199,1,x86 Family 6 Model 1 Stepping 9,GenuineIntel,199,
2.2.2,0,1,2000,6,13,13,33,10,203,0,0,0,2.4.0,Registry DCS,IIS and ASP Starter Set
Two configuration records are always written. The first record documents the computer
configuration and contains valuable information about the operating environment. It is the first
record written for each collection interval and contains the interval duration. The second is a
Performance Sentry Configuration record that documents the Performance Sentry operating
environment and is written only once at the start of the collection file. It is intended primarily for
problem diagnosis.
The Performance Sentry configuration record data fields (using the version 2.2.2 compressed
header format) begin at Field 14, which corresponds in the example to “2.4.0.” This field is the
Performance Sentry version that is running. The next field in the record indicates the source of
the DCS definitions that Performance Sentry is using. Performance Sentry can take its
definitions from a named DCS file, a primary.DCS file, a secondary.DCS file, or take the
predefined defaults if no DCS is defined. The last field is the DCS Name identifier.
Computer Configuration Record
The Computer Configuration Data record provides information about the computer being
monitored, including the clock speed of the processor and number of bytes of memory installed.
The sequence of the data fields recorded in the Computer Configuration record is as follows:
Windows Version (e.g., “5.0” for Windows 2000, “5.2” for Windows Server 2003, “6.0” for
Windows 2008, “6.1” for Windows 2008 R2).
128
Performance Sentry User Manual
Appendix A - Record Format
Windows maintenance level (e.g., “Service Pack 5”). Performance Sentry gathers the operating
system characteristics from the \Software\Microsoft\Windows NT\CurrentVersion key in the
Windows Registry under HKEY_LOCAL_MACHINE.
Domain. The Windows Server security Domain the computer is currently running under.
Computer Name. Performance Sentry gathers the computer name and domain from the
\Software\Microsoft\Windows NT\CurrentVersion\Winlogon key in the Windows Registry
under HKEY_LOCAL_MACHINE.
Time zone (local offset from GMT).
Memory bytes installed. Remember that a million bytes of memory is not the same as a
Megabyte (MB) of memory, which actually represents 1,048,576 bytes. The example shows a
system with 256 MBs installed.
Processor Identifier (e.g., “AT/AT COMPATIBLE”). The processor identifier is obtained from
the Hardware\Description\System key in the Registry under HKEY_LOCAL_MACHINE.
The number of CPUs or processors installed.
Product Type (e.g., “WinNT” for Windows NT and newer OS) Performance Sentry obtains the
Product Type field from the System\CurrentControlSet\Control\ProductOptions key in the
Windows Registry under HKEY_LOCAL_MACHINE.
DCS Name of the Collection Set used to create this file. This is the active DCS. This
information is also provided in the Performance Sentry configuration record.
Processor characteristics. Performance Sentry gathers the number of processors and their
characteristics from the Hardware\Description\System\CentralProcessor key in the Windows
Registry under HKEY_LOCAL_MACHINE. There are four processor characteristics that
Performance Sentry records, and there is one set of processor characteristics fields for each CPU
installed in the system. The characteristics of each installed CPU are represented in four
consecutive fields, as follows:
processor number (0,1,...).
processor family (e.g., “x86 Family 6 Model 1 Stepping 7”). The Intel Family of x86 processors
includes the 386, 486, 586 or Pentium, and 686 or Pentium Pro. These are indicated as Family 3,
4, 5, and 6, respectively.
manufacturer (e.g., “GenuineIntel”).
processor speed, in megahertz (e.g., 198). An Intel processor’s speed is an even multiple of either
25 or 33 MHz. A 198 or 199 MHz processor is widely advertised as a Pentium (or Pentium Pro)
200.
For additonal Operating System information (architecture and virtual system identifier), look for
the DTS.OS discovery and data records. For additional processor information (cores and
processors), look for the DTS.CPU discovery and data records.
Active Filter Records
Active filter records are optionally placed in the data to describe the filters that are in effect in the
DCS that produced the data file. There is one descriptive record per filter. The data fields
following the standard header are the filter name and the filter definition. The filter definition
consists of the filter expression and the action taken.
129
Performance Sentry User Manual
Appendix A - Record Format
2.2.2,0,8,2000,6,13,13,33,10,203,0,0,0,Process Busy Threshold,(230:6 > 0) OUT(230:6),
In the example record, the filter name is Process Busy Threshold. The filter expression
“(230:6>0)” identifies the object and counter pair tested and the threshold test applied. The filter
action “OUT(230:6)” indicates that the Process record will be written to the Performance Sentry
data file if the threshold indicated is exceeded. There will be an active filter record for each alert
that is enabled. This is because an alert is a specialized type of filter that when activated triggers
an alert instead of triggering the writing of an object to the SMF.
In the example record shown below, the alert name is Processor Utilization Warning. The filter
expression triggers the alert event with severity warning, “EVENT(Processor Utilization
Warning 3)”, when the systems % processor time counter is greater than 99%, “(2:240 > 99)”.
2.2.2,0,8,2011,9,16,0,24,31,949,0,0,1,17,2,0,Processor Utilization Warning,(2:240 > 99) EVENT(Processor Utilization
Warning 3),
Alert Recipient Configuration Records
Alert Recipient records are records that are written one time so that the administrator can look
back at which recipients should have been notified about a particular alert. These are written
only at the beginning of the collection cycle.
Discovery Record
2.2.2,0,5,2011,9,20,12,14,45,600,0,DTS.AlertRecipient,1,18,4,1,DTS.AlertRecipient,Type,Info,Alert Name,Severity,
Data Record. This record shows an SMTP type alert recipient for all alerts of fatal events,
severity 100. The DTS.AlertRecipient instance field has the format:
[RecipientName:AlertName:Severity]
2.2.2,918602,DTS.AlertRecipient,2011,9,21,18,42,0,0,1,26583,1,18,4,1,Demand Tech
Support:ALL:1,200,[email protected],ALL,100,
Disk Configuration Records
Disk configuration records are placed in the file (optionally) to describe the organization of the
physical and logical disks in fault tolerant disk configuration. Disk configuration information is
found (encoded) in the Registry Key HKLM\SYSTEM\DISK on NT 4.0 systems only.
2.2.2,0,9,2000,6,13,13,33,10,203,0,0,0,0,E:,FT-Group:11,FT Group Type:ParityStripe,FT-Member:0,FT-State:Healthy,
2.2.2,0,9,2000,6,13,13,33,10,203,0,0,0,1,E:,FT-Group:11,FT Group Type:ParityStripe,FT-Member:1,FT-State:Healthy,
2.2.2,0,9,2000,6,13,13,33,10,203,0,0,0,2,K:,FT-Group:1,FT Group Type:Mirror,FT-Member:0,FT-State:Healthy,
2.2.2,0,9,2000,6,13,13,33,10,203,0,0,0,3,K:,FT-Group:1,FT Group Type:Mirror,FT-Member:1,FT-State:Healthy,
2.2.2,0,9,2000,6,13,13,33,10,203,0,0,0,4,E:,FT-Group:11,FT Group Type:ParityStripe,FT-Member:2,FT-State:Healthy,
The data fields identify the Fault Tolerant group number, type, member number and state. The
logical disk letter provides a link to the Logical Disk object data.
Registry Value Records
Registry Value records provide the current value of specified Registry Key value entries. Both the
Registry Key and value entry name field and the current value from that entry are provided. Both
the Registry Key and the entry values are enclosed in quotations marks (“”) to simplify
identification and processing.
130
Performance Sentry User Manual
Appendix A - Record Format
2.2.2,0,10,2001,5,3,7,0,8,475,0,0,0,”HKEY_LOCAL_MACHINE\SYSTEM\CurrentControlSet\Control\Session
Manager\Memory Management\LargeSystemCache”,”0"
2.2.2,0,10,2001,5,3,7,0,8,475,0,0,0,”HKEY_LOCAL_MACHINE\SYSTEM\CurrentControlSet\Control\Session
Manager\Memory Management\PagingFiles”,”C:\pagefile.sys 384 768"
All value entries are translated into the appropriate text string. Two value entries from the
HKLM\SYSTEM\CurrentControlSet\Control\Session
Manager\Memory
Management\
Registry Key are illustrated above. The DWORD value for the LargeSystemCache entry is the
test string “0”, showing that the option has not been enabled. The STRING value of the Paging
Files entry is text showing the fully qualified paging file name, followed by the minimum and
maximum file size (in MB).
Interval Records
Interval Data records are created each interval. There is one Data record per interval written for
each object instance that was active at the end of the collection interval. For example, if you are
collecting Processor objects on a machine with two processors (i.e., an SMP), then two instances
of a Processor object record will be written each interval. (Objects and object instances is objectoriented programming or OOP terminology.) Windows Server automatically creates a _Total
instance of the object whenever there is more than one instance for an object.
An Object Data record contains the counter values (i.e., data fields) collected for that object
during the interval. Performance counters are generated in a variety of different formats,
including raw integer counters and compound counters. Raw integer counters occupy one
position in the object record. Compound counters occupy two positions, but the second position
is null, except if the Collect Denominator Counters parameter option is turned on. Compound
counters are computed values such as averages, percentages, and rates per second. Each
compound counter has a specific formula associated with it that must be used to compute the
counter value. The specific formula depends on the counter type. The calculation usually requires
that Performance Sentry keep track of the previous value of the counter and compute the
difference between the current value and the previous value. After the Performance Sentry
Collection Service makes the required calculation, it places the computed value in the first
position of the counter and it formats the second position as a null value, unless the Collect
Denominator Counters option is in effect.
Precision. Counters are invariably numeric values. Integer Counter values in the data file have an
implied precision of two decimal places. For example, the integer 3265 represents the fractional
number 32.65. The integer 2600 represents the fractional number 26.00, or the whole number
26. If a counter value requires more than two decimal digits, an explicit decimal point appears in
the coded field value. Values smaller than 0.000001 (or 0.0001%) are truncated to zero.
Performance Counter Types
There are about twenty different counter types that the Windows Server performance monitoring
interface supports. For more information about counter types, install the PerfTools in the
Windows Server Resource Kit and access Counters.hlp in the CntrTool subdirectory. This
document describes the different counter types and their derivation formulas. Readers are
encouraged to look in the resource kit for more detailed information. In this section we only
discuss the most frequently used counter types.
131
Performance Sentry User Manual
Appendix A - Record Format
The counter type specifies the form of the data fields that Performance Sentry retrieves across the
Windows Server performance monitoring API. It defines any calculations that must be
performed on these fields once they are retrieved. Performance Sentry performs all the required
calculations necessary so that your programs only need worry about data management and
reporting on these fields. For instance, Performance Sentry automatically makes the calculations
necessary to report the counters as rates per second, percent busy, etc., as appropriate. It is
important for reporting and data management programs to understand the counter type so that
fields can be summarized properly.
The specific API used to access the Windows Server performance data does not have an officially
sanctioned name. The API is well documented in the Windows Server SDK (Software
Development Kit). Unfortunately, there are many areas where the API documentation and
source code is incomplete or out of date. Where the “official” Microsoft documentation
contradicts what you read here, you may safely assume that our documentation is current.
Raw or Instantaneous Counters
The simplest type of counter available in Windows Server is a raw counter. A raw counter is the
value of some performance metric right now. No calculations need to be performed on this kind
of counter field. When you are looking at Explain Text, you can tell that it is a raw counter if you
see the following sentence, “This is an instantaneous count, not an average over the time
interval.” The Perfmon developers added this language to distinguish this type of counter from
the others.
Figure A.1 Performance Monitor showing the Processor Queue Length which is a PERF_COUNTER_RAW counter type.
An example of a raw counter is the Processor Queue Length counter in the System object. This
is the number of threads in the processor dispatching queue right now. If you are collecting
System objects once per minute, then once a minute you know the current value of the Processor
Queue Length. This does not provide any information about what happened during that minute.
All you can tell is that at the end of the minute, the value of the counter is such and such. A raw
counter gives you one observation about the state of the system per measurement interval.
132
Performance Sentry User Manual
Appendix A - Record Format
Figure A.1 shows an example of the Windows Server Performance Monitor tracking the
Processor Queue Length over a period of two minutes. This counter value is a
PERF_COUNTER_RAW, so it is the number of threads that are ready to run at the moment
in time that the data was collected — every second in the illustration above or every collection
interval in the Performance Sentry data. Notice that the value of the counter is always an integer.
As Performance Sentry accumulates raw counter measurements, they should be considered
sample values collected once per measurement interval.
Difference Counters
A second type of counter is a difference counter. For a difference counter, the counter value
reported in the Performance Sentry record is calculated automatically and reported as a rate per
second, with an implied precision of two decimal places. A difference counter is designated
PERF_COUNTER_COUNTER in the Performance Sentry data Collection Set Editor
Properties window.
A good example of a difference counter is Total Interrupts/second in the System or Processor
object. Windows Server keeps an internal counter which increments every time an interrupt
occurs on the system. At the end of a measurement interval, the current value of this internal
counter is reported. The Performance Sentry Collection Service compares the current value to
the previous value and calculates the difference. The difference is then divided by the length of
time between measurement intervals to create a rate. This is the value reported in the
corresponding Performance Sentry field, calculated to a precision of two decimal places:
(Counter+1 - Counter0)/Duration
Many of the Windows Server performance counters are difference counters. To accommodate
very large numbers, there is also an extra wide PERF_COUNTER_BULK_COUNTER. These
counters are processed identically to PERF_COUNTER_COUNTER fields. Examples of the
PERF_COUNTER_BULK_COUNTER fields include the Byte Count fields in the System
object and the Logical and Physical Disk objects that are all reported as Bytes/second rates.
Difference counters require a current value and a previous counter value that is subtracted from
the current in order to calculate the difference. On initialization, the Performance Sentry
Collection Service immediately generates an initial set of counter values that are used to calculate
difference counters for the first data collection interval.
Time Difference Counters
A third type of counter is a time difference counter. This is a minor variation on the basic interval
difference counter. These are used specifically to report CPU busy at a process or thread level.
For a time difference counter, the counter value reported in the Performance Sentry record is
calculated automatically and reported as a percentage busy, with an implied precision of two
decimal places. Windows Server timer units are 100 nanosecond units.
A good example is the % Processor Time counter in the Process and Thread objects. The
Windows Server Dispatcher gets the TimerTickCount at the beginning and end of each thread
execution interval. These timer counts are accumulated in internal data structures, which are
accessible using the GetProcessTimes and GetThreadTimes Windows Server API calls. Rather
than report CPU time in 100 nanosecond units, the Windows Server performance monitoring
interface prefers to present the information in the form of a % Busy.
133
Performance Sentry User Manual
Appendix A - Record Format
The formula for calculating % Busy is:
(Timer+1 - Timer0 ) / Duration * 100
where all the values are in 100 nanosecond units.
Of course, % Busy for a process or thread also depends on the speed of the processor. There is no
Windows Server performance counter which provides this information, which is available from
the Windows Server Registry. Performance Sentry reports the processor speed in the Computer
Configuration record written each interval.
With multiple processors, a multi-threaded application can easily accumulate more CPU time
than 100% busy on a single processor. For a dual processor, a process with two or more threads
can accumulate up to 200% Processor Time. On a quad processor, a process with four or more
threads can accumulate 400% Processor Time. For any process running on a Symmetric
MultiProcessor (SMP), if the process shows 100% busy, then it is necessary to look at the Thread
object instances for the process and sum up the % Processor Time Thread counters to determine
if the process actually used more than 100% busy time during an interval.
Time Difference Inverse Counters
A similar counter is a time difference inverse counter. These are used specifically to report CPU
busy at a processor or system level. For a time difference inverse counter, the counter value
reported in the Performance Sentry record is calculated automatically and reported as a
percentage busy, with an implied precision of two decimal places. Windows Server timer units
are reported in 100 nanosecond units.
A good example is the % Processor Time counter in the Processor object. Windows Server does
not measure processor busy directly. When a processor has no real work to do, Windows Server
dispatches an idle thread. Windows Server keeps track of how much CPU time the idle thread
consumes in the same fashion as any other thread. The Windows Server Dispatcher gets the
TimerTickCount at the beginning and end of each idle thread execution interval. These timer
counts are accumulated in internal data structures. At the end of a measurement interval,
Windows Server can calculate how busy the processor was by subtracting the number of timer
ticks the idle thread consumed from the total number of timer ticks in the interval. Rather than
report CPU time in 100 nanosecond units, the Windows Server performance monitoring
interface prefers to present the information in the form of % Busy. The formula for calculating %
Processor Time is:
(1-(Timer+1 - Timer0 ) / Duration) * 100
The inverse timer designation refers to the part of the formula where the idle time is subtracted
from 1. A PERF_100NSEC_TIMER_INV counter cannot be greater than 100% busy. The
% Total Processor Time counter in the System object is calculated as the average % Processor
Time over all the processors.
Disk Service Time, Response Time, and Utilization
A difference counter with a troublesome history is the PERF_COUNTER_TIMER counter
type used in the Logical and Physical Disk objects. This counter type is associated with several
related counters that are frequently misunderstood as measuring disk utilization. These are the %
Disk Read Time, % Disk Time and % Disk Write Time counters. According to the official
Explain Text, “% Disk Time is the percentage of elapsed time that the selected disk drive is busy
servicing read or write requests.” This explanation is misleading.
134
Performance Sentry User Manual
Appendix A - Record Format
Windows Server does not measure disk busy directly. The Diskperf command is used to insert a
filter driver into the I/O Manager stack to calculate disk performance statistics. Diskperf
maintains a time difference counter that records the duration of all disk I/O operations per
logical or physical disk and maintains a difference counter that records the I/O completion rate.
This allows Performance Sentry to calculate the following average disk response time counters:
Avg. Disk sec/Read, Avg. Disk sec/Transfer, Avg. Disk sec/Write using a difference counter
called a PERF_AVERAGE_TIMER.
The formula for calculating % Disk sec/Transfer is:
(IO Elapsed Time1 - IO Elapsed Time0) / (# IO Events1 - # IO Events0)
where the result is expressed in seconds (rather than timer units). Because the I/O Elapsed Time
that diskperf accumulates includes queue time in the disk driver and elsewhere, % Disk
sec/Transfer is a straightforward measure of response time.
The formula for calculating % Disk Time is:
(IO Elapsed Time1 - IO Elapsed Time0 ) / Duration
where the result is multiplied by 100 so that it is expressed as a percentage of the interval
duration. Calling this derived value % Disk Time is misleading. Because the accumulated I/O
Elapsed Time includes queue time, it is not unusual for it to be greater than duration. This leads
to a % Disk Time value that is greater than 100%. To eliminate this anomaly, the % Disk Time
counters are capped at 100%. Capping leads to further confusion because the % Disk Read Time
and % Disk Write Time counters may not add up to % Disk Time. For instance, a very busy disk
may report that % Disk Read Time, % Disk Write Time, and % Disk Time are all equal to 100%
busy!
The source of the confusion is that the % Disk Read Time, % Disk Write Time, and % Disk
Time counters are mislabeled. The Avg. Disk Queue Length counters introduced in Windows
NT 4.0 were designed to clear up this confusion. The Avg. Disk Queue Length counter is
calculated using a formula identical to % Disk Time, but without capping and not multiplied by
100 to create a percentage value. If you compare the counters, you easily see that they contain
identical values, except when % Disk Time exceeds 100% and it is subject to capping.
While the Avg. Disk Queue Length counters introduced in Windows NT 4.0 do eliminate some
of the confusion, they do not solve the problem that the % Disk Time counter does not measure
disk utilization. This is addressed in Windows Server with the addition of the % Idle Time
counter. The % Idle Time counter accumulates the amount of time during the measurement
interval that the disk was idle, essentially not servicing any I/O requests.
With the % Idle Time counter, it is possible to gather a complete set of disk performance
statistics for Windows Server machines. You can easily calculate:
% Disk Busy = 100% -% Idle Time
Disk service time = % Disk Busy / Disk Transfers/sec
Disk queue time = % Disk sec/Transfer - Disk service time
135
Performance Sentry User Manual
Appendix A - Record Format
Compound Counter Types
There are a number of additional, special purpose counter types for performance data that cannot
be expressed as a rate or % of the interval duration. These include compound counter types which
are used to express fractions like % Network Utilization in the Network Segment object, % Free
Space in the Logical Disk object, and the MDL Read Hits % in the Cache object. Where
normal difference counters use an implied duration or time value in the calculation to produce a
rate per second, for example, compound counters specify a denominator value explicitly. For
instance, the Logical Disk % Free Space counter is a PERF_RAW_FRACTION counter type.
Each interval it is calculated from a compound expression that contains the current number of
free (the numerator of the fraction) and the total number of bytes of available capacity (the
denominator). Except for the extra bit of data and the implied division operation, the
PERF_RAW_FRACTION counter type is similar to a PERF_RAW_COUNTER — each is a
single instance of a sample observation.
Compound
counter
types
such
as
PERF_RAW_FRACTION
and
PERF_SAMPLE_FRACTION occupy two positions in the corresponding Data record, one for
the derived counter value and one for the denominator value used in the derivation. If the Write
Denominator Counters option is turned on, the Collection Service supplies both the derived
counter value and the denominator value. The denominator value is identified in the Type 5
discovery record with the characters “Base” appended to the counter name. If the Write
Denominator Counters option is turned off, the denominator value is not present — its absence
is denoted by an empty (null) string.
Denominator values for some compound counters are intrinsically valuable. For example, the
denominator value for the % Network Utilization in the Network Segment object supplies the
bandwidth specification for the segment (i.e., 10 Mb/ sec for 10BaseT). Denominator values are
necessary to summarize the Hits % counters in the Cache object, which are
PERF_SAMPLE_FRACTION counter types. If the denominator values for
PERF_SAMPLE_FRACTION counters like MDL Read Hits % are available, the
Summarization Utility can calculate a correct weighted average over the summarization interval.
If the denominator values are not collected, it is only possible to calculate a simple arithmetic
mean, an average of average values that produces incorrect results.
Processing the Performance Sentry Record
Header
Each record has two parts — a standard header followed by a data portion. Performance Sentry
supports two different header formats: original and compressed. The first field in the record
headers indicates the version format. A value of “2.0.x” where “x” is the Performance Sentry
maintenance level, indicates the original header format. Later releases of Performance Sentry
write original Format records with a value of “2.2.1” in the first field.
The compressed format is identified by “2.1.0” in the first field if the file was written by an early
version, or “2.2.2” if the file was written by a later or current version of Performance Sentry. The
version of Performance Sentry is independent of the file version, and is found in the
configuration record, previously described.
136
Performance Sentry User Manual
Appendix A - Record Format
The Performance Sentry Record Header consists of two parts — an identification section with a
fixed number of fields size, and a section with a variable number of fields depending on the
object. The fixed portion contains identification data, a time stamp, and a sequence number to
ensure the internal consistency of the data being processed. The variable portion of the header
identifies specific object instances by name and parent name, if applicable.
Original Header Format
The original header consists of eighteen standard fields. Each field in the original header is
positional corresponding to the following sequence:
Performance Sentry header version identifier, Operating System version,
Operating System Maintenance Level, Object Index Number (OID), Object
Name, Domain Name, Computer Name, Year, Month, Day, Hour, Minute,
Second, Millisecond, Record Sequence Number, GMT (Greenwich Mean
Time) offset, Interval duration, Object Version
For instance, see the following Record Header example:
2.0.h,4.0,Service Pack 3,238,Processor,PROD-DOMAIN,PRODSMP,2001,6,21,23,46,2,500,45,4,59360,1,
In the above example, the Performance Sentry header version identifier is 2.0.h, which means the
header is in the original format. The NT level is 4.0 with Service Pack 3 applied, the Object
Index Number is 238, which the next fields tells us is the Processor object. The Processor
measurements are for the PRODSMP computer which is located on the PRODDOMAIN
Domain. The date of the measurement was June, 21, 2001.
The time the measurement was taken was 23:46:2.500, which is offset from Greenwich Mean
Time by 4 hours. This particular record is sequence number 45 and covers an interval which was
59.360 seconds long, or approximately one minute.
The Object Version field in position 18 contains the version number of the object according to
the Collection Service. The version number is incremented if there is an object with the same
object name found in a different performance library. This happens primarily with objects from
different versions of SQL Server.
Compressed Header Format
The compressed header format omits the following static information in fields 2, 3, 6, 7, and 16:
the Operating System version, Operating System Maintenance Level, Domain Name, Computer
Name, and GMT (Greenwich Mean Time) offset. The five omitted fields are all static fields that
are available in the Computer Configuration Data record. The order of all the remaining fields in
the compressed header is preserved as follows:
Performance Sentry header version identifier, Object Index Number (OID),
Object Name, Year, Month, Day, Hour, Minute, Second, Millisecond, Record
Sequence Number, Interval duration, Object Version
The following example illustrates a Processor record in the compressed Header format:
2.2.2,238,Processor,2000,6,13,13,35,0,218,1,109828,1,18,10,1,0,1015,260,754,12803,36,40,8491,00,00,2082,
In the example, the value of the Performance Sentry header version identifier is “2.2.2,” which
means the record uses the compressed data format. Reporting programs need to refer back to the
previous Computer Configuration record to determine the computer name and domain and to
account for the GMT offset.
137
Performance Sentry User Manual
Appendix A - Record Format
Object Instances
Following the Object Version field are a series of header fields, the number of which varies
depending on the type of object. These fields are used to indicate those objects that have
identifying instance data. To understand this structure of fields, it is necessary to discuss object
instances.
For some performance data objects, there is only one object record that is ever produced. For
example, there is only one System object Data record. It is simply identified by its unique object
ID and object name.
For other objects, there can be multiple occurrences of the Object Data record, depending on the
current state of the system. One or more instances of this type of performance data Object record
may be written, depending on the number of active object instances. The Processor object may
have one or more instances, each one corresponding to a physical or logical CPU engine. In a
workstation that has one CPU installed, there is only one instance of the Processor object written
per interval. However, if a server has multiple processors installed, or a single CPU is capable of
hyperthreading, multiple instances of the Processor object are written each interval. In general,
we say that an object that can have more than one instance is instanced.
Object instance identifiers. Each instance of an object is identified by a unique name or identifier.
This is important because each object instance is different and you need to be able to tell them
apart. A Processor ID uniquely identifies a Processor object instance. Processors are numbered 0,
1, 2, etc. Other objects which are instanced include the Process, Thread, Logical Disk and
Physical Disk objects. A Process ID uniquely identifies a process instance. Note: the process
image name cannot uniquely identify a process object instance because in many cases multiple
copies of the program can be loaded. You can have several copies of wordpad.exe loaded and each
runs the same image file. In those circumstances only the process ID is unique.
A Thread ID uniquely identifies a thread instance related to a specific process. You must be
careful using the Thread ID because some processes create and destroy threads regularly. Even
though you can match up a Thread ID from one interval to the next, there is no guarantee that
the statistics represent activity from the same physical thread.
A logical disk has a unique identifier which corresponds to a drive letter. A physical disk or CPU
is provided with a unique numeric identifier. The header of a Data record for an instanced object
always contains the object instance identifier.
Parent-child relationships. Some performance data objects are derived from other objects. A set
of object child instances is descended from a parent object. Consider an instance of a Thread
object. Each thread is associated with one and only one process. In fact, Thread IDs are unique
only within the context of the parent process instance. In order to be able to associate a Thread
object instance with its parent, the Thread object instance header record references its parent
Process object.
Besides the process and thread parent-child relationship, there is one other important
performance data object pair that has a parent-child relationship. A Logical Disk object instance
has a Physical Disk object instance as a parent. If you have a hard drive partitioned into three
logical disk partitions, C:, D:, and E:, then the relationship illustrated in Table A-1 holds.
138
Performance Sentry User Manual
Appendix A - Record Format
Parent
Child
Physical Disk
Logical Disk
0
C:
0
D:
0
E:
1
G:
2
H:
Table A.1 Showing a Parent Child Relationship between Physical Disk and Logical Disk
Each Object Data record header must contain the unique information that serves as the object
identifier. The header fields following the Object Version field contain the information that
uniquely identifies an object instance. To assist in processing, Field 14 (or Field 19 of an original
header record) contains a pointer to the first (nonheader) data field in the record. Field 15 in the
compressed header format indicates the number of data fields in the Object Data record. Field 16
in the compressed header format indicates whether the object record contains an object instance
parent name and/or an object instance name. Field 16 will contain a value of either 0, 1 or 2, as
explained further below.
Field 14 (or field #19 in the original header), the number of the First Data Field, points to one of
the following:
•
•
•
Field #17 for non-instanced data,
Field #18 for instanced data with no parent instance, or
Field #19 for instanced data with a parent instance.
Field 15 (or field #20 in the original header) contains the number of counter data fields in the
record.
Field 16 (or field #21 in the original header) contains the number of instance names, Values of
either 0, 1 or 2 are coded as follows:
0, if this is an ordinary object occurrence, not an instanced object. For example, see the
System object compressed header Data record below:
2.2.2,2,System,2000,6,13,13,35,0,0,1,109782,1,17,26,0,6311,3376,22006,1050115,553129,5217168,129050,
327171,755,191,564,24154,9688,216623100,00,00,0.0273,00,21,24,12114,00,00,3519,5390,5390,
The first data field pointer indicates the first data field is #17, there are twenty-six
positional data fields in the Object Data record, and there zero instance names.
1, if there are instance of this object, but no parent instance relationships. For example,
the Processor object is designed for instances (there can be multiple processors), but
there is no parent relationship:
139
Performance Sentry User Manual
Appendix A - Record Format
2.2.2,238,Processor,2000,6,13,13,35,0,218,1,109828,1,18,10,1,0,1015,260,754,12803,36,40,8491,00,00,2082,
2.2.2,238,Processor,2000,6,13,13,35,0,218,1,109828,1,18,10,1,1,500,131,368,11347,0.0569,0.0854,3618,00,00,3518,
The first data field pointer indicates field #18, there are ten positional data fields in the
Object Data record, and there is one instance name. The first instanced is identified as
Processor “0,” while the second is identified as Processor “1.”
Or 2, if there is a parent instance. The Thread object has instances (the threads
themselves) with a parent relationship pointing back to the Process object (so the
Process name is provided), as illustrated below:
2.2.2,232,Thread,2000,6,13,13,35,0,218,1,109828,1,19,12,2,csrss,1,4,00,4,114,136981300,1500,1300,161016268800,...
The first data field pointer indicates field #19, there are twelve positional data fields in
the Object Data record, and there are two instance names. This instance is identified as
Thread 1 within the csrss process.
If there are no instances, field 16 has a value of “0” and the data fields simply follow
field 21. If there are instances, the instance name(s) come next, and the data fields
follow.
Field 17 contains either (a) the first data field for non-instanced data, or (b) the instance name if
there is no parent instance, or (c) the parent instance name if there is a parent instance.
Field 18 contains either (a) the second data field for non-instanced data or (b) the first data field
if there is no parent instance, or (c) the instance name if there is a parent instance.
Example: The parent instance of a thread is a process name. Knowing the parent is important in
the case of threads or logical disks because you can usually map the measurement data from
children instances back to a parent. This works in theory, but not always in practice. Instead of
using CPU Busy from the Process object instance on a multiprocessor, when CPU Busy is
greater than 100% you should sum the Thread instances CPU Busy % and use that total instead.
Threads are transient. A thread that is active during one measurement interval may not exist in
the next. A thread might be created and destroyed inside a single measurement interval.
Example: The parent instance of a Logical Disk is the Physical Disk number (NT 4.0).
Because neither Logical and Physical Disk object instances are transient, you should always be
able to add up the counter values for Logical Disks C:, D:, and E: from Figure B.2 and calculate
the counter values for Physical Disk 0. The _Total instance always has a parent of _Total in the
Physical Disk objects. Unfortunately, you cannot easily map a logical disk that is a stripe set back
to its parents because only one Physical Disk parent is named. When the Logical Disk is actually
a Stripe Set, it spans multiple physical disks. But there is room for only the first physical disk
number in the stripe set, as illustrated below:
140
Performance Sentry User Manual
Appendix A - Record Format
2.2.2,234,PhysicalDisk,2000,6,13,13,35,0,171,1,109828,1,18,25,1,0,00,3463,35,1806,17,00,00,00,00,0.0222,0.0222,...
2.2.2,234,PhysicalDisk,2000,6,13,13,35,0,171,1,109828,1,18,25,1,1,00,1546,15,964,0.0964,582,0.0582,00,00,00,00,00,...
2.2.2,234,PhysicalDisk,2000,6,13,13,35,0,171,1,109828,1,18,25,1,2,00,00,00,00,00,00,00,00,00,00,00,00,00,00,00,00,00,.
..
2.2.2,234,PhysicalDisk,2000,6,13,13,35,0,171,1,109828,1,18,25,1,3,00,632,0.0632,0.0369,0.000369,628,0.0628,00,00,...
2.2.2,234,PhysicalDisk,2000,6,13,13,35,0,171,1,109828,1,18,25,1,4,00,615,0.0615,0.0215,0.000215,613,0.0613,0.0181,...
2.2.2,234,PhysicalDisk,2000,6,13,13,35,0,171,1,109828,1,18,25,1,5,00,1056,11,690,0.0690,366,0.0366,0.0115,0.0115,...
2.2.2,236,LogicalDisk,2000,6,13,13,35,0,203,1,109828,1,19,28,2,0,C:,1137,1137,11400,00,1914,19,785,0.0785,1129,11,...
2.2.2,236,LogicalDisk,2000,6,13,13,35,0,203,1,109828,1,19,28,2,0,E:,3338,3338,206300,00,1549,15,1021,10,528,...
2.2.2,236,LogicalDisk,2000,6,13,13,35,0,203,1,109828,1,19,28,2,1,F:,7161,7161,71900,00,332,0.0332,120,0.0120,...
2.2.2,236,LogicalDisk,2000,6,13,13,35,0,203,1,109828,1,19,28,2,3,K:,851,851,73800,00,632,0.0632,0.0369,0.000369,...
2.2.2,236,LogicalDisk,2000,6,13,13,35,0,203,1,109828,1,19,28,2,5,R:,9383,9383,523300,00,181,0.0181,113,0.0113,68,...
This data suggests the following logical disk:physical disk structure: Reviewing the Disk
Administrator application, however, you determine that Logical Disk E: is actually a stripe set
with parity, spanning physical disks 0, 1 and 2. The structure used to identify the parent-child
relationship only allows one physical disk name to be associated with the stripe set. In this case,
because the logical:physical disk mapping is not fully specified, it is not possible to derive the
Physical Disk object data fields from the associated Logical Disk Object Data records except by
using the Disk Configuration records.
How Performance Sentry Tells Time
The values for the header date and time fields (Year, Month, Day, Hour, Minute, Second &
Millisecond) are obtained from Windows Server using standard Windows Server timer services.
The current time is normalized based on Greenwich Mean Time. The GMT offset field in the
Computer Configuration record contains the difference in hours between Greenwich Mean
Time and the current local time.
To calculate the local date and time, subtract the GMT offset from the Hour field and handle
any overflow conditions. In the previous Record Header example illustrated above, Hour = 23
and the GMT offset = 4, so the current local time is 19:00 or 7 P.M.
The interval duration in the Computer Configuration record is the length of time, in
milliseconds, that the sample interval lasted. All counter values in Data records were gathered at
the end of the interval duration. The Performance Sentry collection parameter Interval Length
(MM SS) controls the duration of the collection interval. The default value is one minute. Using
the default value as an example, records are written to the Performance Sentry file at every one
minute mark: 00:00, 00:01,0 0:02, 00:03, etc. Interval Duration is the length of time between the
start of the collection sample and the next Interval Length (MM SS) mark.
Performance Sentry synchronizes data collection intervals to the time interval set. In the example,
when the Interval Length (MM SS) parameter is set to one minute and execution begins at
9:07:48, the first sample will cover the period from 9:07:48 to 9:08. Thereafter, each sample will
be taken at 1 minute intervals.
Correcting for drift. More accurately, the Collection Service corrects for drift so that each
measurement interval is synchronized to the time interval specified. The interval sampling
function runs off system events, and it is not uncommon for our Collection Service to be delayed
on busy systems. Performance Sentry automatically compensates for delays and resynchronizes
data collection each interval. Beware, though, synchronization is only supported for intervals of
one minute, or multiples of one minute.
141
Performance Sentry User Manual
Appendix A - Record Format
Each Object Interval Data record has a data field containing the duration of the sample, to
millisecond precision. In the example, the actual Interval Duration was 59360 milliseconds, or
59.360 seconds. Within a sample, the interval duration will vary slightly due to the fact that
objects are collected one at a time, with the exception of the Process:Thread and Logical
Disk:Physical Disk paired objects which are collected two at a time. The interval duration is
calculated as the amount of time between the current object data and the time stamp of the
previous collection data sample for that same object. Some minor variation in the duration of the
sample intervals within a collection is to be expected. As discussed in the section entitled
Windows Server counter types, the sample duration is used to calculate difference counters.
The Performance Sentry configuration record and the discovery records have a Duration value of
zero.
The first Object Data records usually have a value less than Interval Length (MM SS), and
subsequent records should all have Duration values within milliseconds of the value of Interval
Length (MM SS).
Interval Data Records
A Data record is produced each interval for each object instance which has been enabled for data
collection. There are two fields in the header of each record in a Performance Sentry file that
identify the type of object: the object index number (OID) and the object name. The values of
both the OID and the object name are unique. The data portion of each Object Instance record
contains the counters that are associated with that object.
Performance Sentry assigns object IDs according to the performance library id on the local
machine where the objects are collected..
Since an OID of zero is not a valid Windows Server performance object, Performance Sentry
uses an OID=0 to identify configuration and discovery records. When the OID header field
contains a zero, then the object name will contain a numeric value (rather than a name), which
identifies the type of configuration or discovery record.
142
B
Appendix B - Collection Sets
This version of Performance Sentry contains many predefined collection sets which are proper
subsets of the Master Collection Set. The Master Collection Set defines all the performance
objects and counters that Performance Sentry supports. A brief description of the Master
Collection Set follows as well as brief description of the other predefined collection sets listed in
alphabetical order.
These predefined collection sets may be used ‘out of the box’ as defined. However, it is
recommended that you customize them using Sentry Administration to meet your performance
reporting and capacity planning needs. This is especially true for collection sets that will be run
on Windows Servers assigned to multiple roles such as File Server and IIS Server.
Master Collection Set
The Master Collection Set includes standard system objects like Processor, Process, and Physical
Disk; so-called “costly” objects like Process Address Space and Image; network performance
information from network interfaces and TCP/IP; plus application-defined objects and counters
from MS SQL Server, MS Exchange, MS Internet Information Server, etc., and other
applications. The Master Collection Set is huge. It is recommended that the Master Collection
Set never be used to collect performance data for long periods of time due to the impact on the
performance of the system when collecting so much data. Collecting performance data using the
Master Collection Set also has the potential to create a large data file in a very short time.
Default Collection Set
This Collection Set is activated by default when the Collection Service is installed. An allpurpose workhorse, it includes the most commonly used objects and counters for monitoring
Windows Servers. At short intervals, it is useful for performance monitoring and problem
diagnosis. At longer collection intervals, it is useful for capacity planning. The default collection
interval for this set is one minute. It contains activated Process and Thread filters to limit the size
of the data files that are created.
The Default Collection Set includes the Network Interface, IP, and TCP objects by default. It is
suitable for machines running any version of the Windows operating system.
We recommend using the Default Collection Set as a template for any collection sets you choose
to create or modify.
143
Performance Sentry User Manual
Appendix B – Collection Sets
Exchange Server Starter Set
This Collection Set consists of objects and counters from the Default Collection Set, plus the
MS Exchange extensible counters. It is suitable for monitoring Windows Server machines
configured to run MS Exchange Server at one, two and five minutes intervals. The default
collection interval for this set is one minute. The most important performance statistics
Exchange Server produces are DB (Database), MTA (Message Transport), and MC (Message
Control) objects. Together, these objects provide indicators of message throughput rates and
associated resource utilization. The MSExchangeWEB object is useful for tracking the rate that
ingoing and outgoing Internet mail messages must be rendered in Exchange. The collection set
also includes TCP/IP objects.
File Server Starter Set
This Collection Set consists of objects and counters from the Default Collection Set, plus the
Browser and Server Work Queue objects to collect performance information from Windows
Servers in a File Server role.
IIS and ASP Starter Set
This Collection Set was designed as a template to use with Windows Server running Microsoft’s
Internet Information Server (IIS) with Active Server Pages creating dynamic web content. In
addition to IIS and ASP objects, the collection set contains the most commonly used SQL
Server objects and the Active Server Pages object.
PDC with Active Directory
This Collection Set was designed as a template to use with Windows Servers which function as
Domain Controllers. Sizing Domain Controllers so that users do not experience overlong delays
attempting to log on to the network first thing in the morning is an important planning
consideration. Domain Controllers contain the User Manager databases used in authenticating
network requests. Fewer Domain Controllers make it easier to administer Windows Server
security, but too few may cause a performance bottleneck. Monitor the Server Work Queues
object to ensure that adequate resources are available to manage authentication requests.
SQL Server Starter Set
This Collection Set consists of objects and counters from the Default Collection Set, plus the
most commonly used SQL Server objects. It is suitable for monitoring Windows Server
machines configured to run MS SQL Server at one, two and five minutes intervals. The default
collection interval for these sets is one minute. This set includes the most commonly used SQL
Server performance objects and counters: the SQL Server:Databases, SQL Server:Memory
Manager, SQL Server:Buffer Manager, SQL Server:Cache Manager, SQL Server:SQL
Statistics, and SQL Server:Locks. The SQL Server:Databases object provides overall statistics on
resource utilization, including and file I/O statistics. SQL Server allocates and manages its own
cache memory. It does not use the file cache built into Windows Server. The size and
effectiveness of the SQL Server cache is an important configuration and tuning option. The SQL
Server:Locks object can be very useful in tracking down application problems where database
locking is impacting down performance.
144
Performance Sentry User Manual
Appendix B – Collection Sets
Please note that object Names for instances of SQL Server are of the form
MSSQL$<instancename>:<objectname>. For consistency, in the Master Collection Set, these
names will simply appear as MSSQL:<objectname> to coincide with their
SQLServer<objectname> counterparts. Therefore, if SQL Server is configured with multiple
instances on a Windows Server, then you will need to include both SQLServer: and MSSQL:
objects in your Data Collection Set.
TCP/IP v6 Starter Set
This Collection Set was designed for use under Windows Server running both TCP/IP version 4
and version 6.
Terminal Service Server Starter Set
This Collection Set was designed for Windows Server Running as a Terminal Server. It includes
the two main Terminal Server performance objects Terminal Services and Terminal Services
Session.
VMware Collection Set
This Collection Set is designed for Windows Server running Demand Technology’s Performance
Sentry VM™ product which provides performance metrics for VMware’s ESXi Server in
Windows performance monitor format. This collection set will collect VMware performance
metrics for both the ESX host and all Guest virtual machines.
145