1
TAU Reference Guide
TAU Reference Guide
Updated Nov. 15, 2015, for use with version 2.25 or greater.
Copyright © 1997-2012 Department of Computer and Information Science, University of Oregon Advanced Computing Laboratory, LANL, NM Research Centre Julich, ZAM, Germany
Permission to use, copy, modify, and distribute this software and its documentation for any purpose and
without fee is hereby granted, provided that the above copyright notice appear in all copies and that both
that copyright notice and this permission notice appear in supporting documentation, and that the name
of University of Oregon (UO) Research Centre Julich, (ZAM) and Los Alamos National Laboratory
(LANL) not be used in advertising or publicity pertaining to distribution of the software without specific, written prior permission. The University of Oregon, ZAM and LANL make no representations about
the suitability of this software for any purpose. It is provided "as is" without express or implied warranty.
UO, ZAM AND LANL DISCLAIMS ALL WARRANTIES WITH REGARD TO THIS SOFTWARE,
INCLUDING ALL IMPLIED WARRANTIES OF MERCHANTABILITY AND FITNESS. IN NO
EVENT SHALL THE UNIVERSITY OF OREGON, ZAM OR LANL BE LIABLE FOR ANY SPECIAL, INDIRECT OR CONSEQUENTIAL DAMAGES OR ANY DAMAGES WHATSOEVER RESULTING FROM LOSS OF USE, DATA OR PROFITS, WHETHER IN AN ACTION OF CONTRACT, NEGLIGENCE OR OTHER TORTIOUS ACTION, ARISING OUT OF OR IN CONNECTION WITH THE USE OR PERFORMANCE OF THIS SOFTWARE.
TAU can be found on the web at: http://www.cs.uoregon.edu/research/tau
Table of Contents
1. Installation ............................................................................................................. 1
1.1. Installing TAU .............................................................................................. 1
1.1.1. Know what options you will need .......................................................... 1
1.1.2. Common configuration options ............................................................. 2
1.1.3. Configuring with external packages ........................................................ 3
1.1.4. More configuration options ................................................................... 4
1.1.5. tau_setup ........................................................................................... 9
1.1.6. installtau script ................................................................................... 9
1.1.7. upgradetau ....................................................................................... 10
1.1.8. tau_validate ..................................................................................... 10
1.2. Platforms Supported .................................................................................... 10
1.3. Software Requirements ................................................................................ 11
2. TAU Instrumentation Options .................................................................................. 13
2.1. Selective Instrumentation Options .................................................................. 13
2.2. Running an application using DynInstAPI ........................................................ 14
2.3. Rewriting Binaries ....................................................................................... 14
2.3.1. Using MAQAO ................................................................................ 15
2.3.2. Using PEBIL ................................................................................... 15
2.4. Profiling each call to a function ...................................................................... 15
2.5. Profiling with Hardware counters ................................................................... 15
2.6. Using Hardware Performance Counters ........................................................... 21
2.7. Profiling with PerfLib .................................................................................. 22
2.8. Running a Python application with TAU .......................................................... 22
2.9. pprof ......................................................................................................... 23
2.10. Running a JAVA application with TAU ......................................................... 24
2.11. Using a tau.conf File .................................................................................. 24
2.12. Using Score-P with TAU ............................................................................ 24
2.13. Using UPC with TAU ................................................................................ 25
3. Tracing ................................................................................................................ 26
3.1. How to configure tracing .............................................................................. 26
4. TAU Memory Profiling Tutorial ............................................................................... 29
4.1. TAU's memory API options .......................................................................... 29
4.2. Using tau_exec ........................................................................................... 29
4.3. Evaluating Memory Utilization ...................................................................... 29
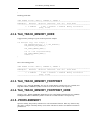
4.3.1. TAU_TRACK_MEMORY ................................................................. 29
4.3.2. TAU_TRACK_MEMORY_HERE ...................................................... 30
4.3.3. TAU_TRACK_MEMORY_FOOTPRINT ............................................. 30
4.3.4. TAU_TRACK_MEMORY_FOOTPRINT_HERE .................................. 30
4.3.5. -PROFILEMEMORY ........................................................................ 30
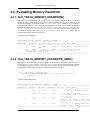
4.4. Evaluating Memory Headroom ...................................................................... 31
4.4.1. TAU_TRACK_MEMORY_HEADROOM() .......................................... 31
4.4.2. TAU_TRACK_MEMORY_HEADROOM_HERE() ............................... 31
4.4.3. -PROFILEHEADROOM ................................................................... 32
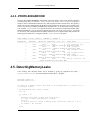
4.5. DetectingMemoryLeaks ............................................................................... 32
4.6. Memory Tracking In Fortran ......................................................................... 34
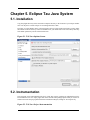
5. Eclipse Tau Java System ......................................................................................... 35
5.1. Installation ................................................................................................. 35
5.2. Instrumentation ........................................................................................... 35
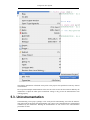
5.3. Uninstrumentation ....................................................................................... 36
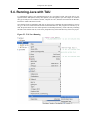
5.4. Running Java with TAU ............................................................................... 37
5.5. Options ..................................................................................................... 38
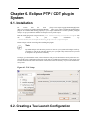
6. Eclipse PTP / CDT plug-in System ............................................................................ 39
6.1. Installation ................................................................................................. 39
iv
TAU Reference Guide
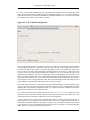
6.2. Creating a Tau Launch Configuration .............................................................. 39
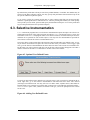
6.3. Selective Instrumentation .............................................................................. 41
6.4. Launching a Program and Collecting Data ....................................................... 42
7. Tools ................................................................................................................... 43
tau_compiler.sh ................................................................................................ 44
vtf2profile ....................................................................................................... 48
tau2vtf ............................................................................................................ 49
trace2profile ..................................................................................................... 50
tau2elg ............................................................................................................ 51
tau2slog2 ......................................................................................................... 52
tau2otf ............................................................................................................ 53
tau2otf2 ........................................................................................................... 54
perf2tau ........................................................................................................... 55
tau_merge ........................................................................................................ 56
tau_treemerge.pl ............................................................................................... 58
tau_convert ...................................................................................................... 59
tau_reduce ....................................................................................................... 61
tau_ompcheck .................................................................................................. 63
tau_poe ........................................................................................................... 64
tau_validate ..................................................................................................... 65
tauex .............................................................................................................. 66
tau_exec .......................................................................................................... 68
tau_timecorrect ................................................................................................. 70
tau_throttle.sh ................................................................................................... 71
tau_portal.py .................................................................................................... 72
taudb_configure ................................................................................................ 73
perfdmf_createapp ............................................................................................ 74
perfdmf_createexp ............................................................................................ 75
taudb_loadtrial ................................................................................................. 76
perfexplorer ..................................................................................................... 78
perfexplorer_configure ....................................................................................... 79
taucc ............................................................................................................... 80
tauupc ............................................................................................................. 81
taucxx ............................................................................................................. 82
tauf90 ............................................................................................................. 83
paraprof .......................................................................................................... 84
pprof .............................................................................................................. 85
tau_instrumentor ............................................................................................... 86
vtfconverter ..................................................................................................... 87
tau_setup ......................................................................................................... 88
tau_wrap ......................................................................................................... 89
tau_gen_wrapper ............................................................................................... 90
tau_pin ............................................................................................................ 91
tau_java .......................................................................................................... 92
tau_cupti_avail ................................................................................................. 93
tau_run ........................................................................................................... 94
tau_rewrite ...................................................................................................... 95
I. TAUdb ................................................................................................................. 96
8. Introduction .................................................................................................. 98
8.1. Prerequisites ....................................................................................... 98
8.2. Installation ......................................................................................... 98
9. Using TAUdb ............................................................................................. 101
9.1. perfdmf_createapp (deprecated - only supported for older PerfDMF databases) 101
9.2. perfdmf_createexp (deprecated - only supported for older PerfDMF databases) 101
9.3. taudb_loadtrial .................................................................................. 101
9.4. TAUdb Views .................................................................................. 103
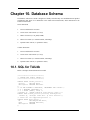
10. Database Schema ....................................................................................... 104
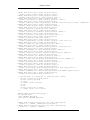
10.1. SQL for TAUdb .............................................................................. 104
v
TAU Reference Guide
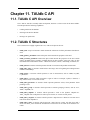
11. TAUdb C API ...........................................................................................
11.1. TAUdb C API Overview ...................................................................
11.2. TAUdb C Structures .........................................................................
11.3. TAUdb C API .................................................................................
11.4. TAUdb C API Examples ...................................................................
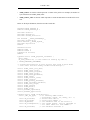
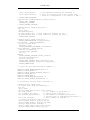
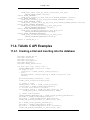
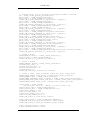
11.4.1. Creating a trial and inserting into the database ............................
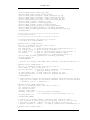
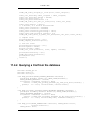
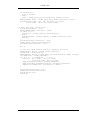
11.4.2. Querying a trial from the database ............................................
12. Windows ..........................................................................................................
12.1. TAU on Windows ....................................................................................
12.1.1. Installation ...................................................................................
12.1.2. Instrumenting an application with Visual Studio C/C++ ........................
12.1.3. Using MINGW with TAU ..............................................................
I. TAU Instrumentation API ......................................................................................
TAU_START .................................................................................................
TAU_STOP ...................................................................................................
TAU_PROFILE ..............................................................................................
TAU_DYNAMIC_PROFILE ............................................................................
TAU_PROFILE_CREATE_DYNAMIC .............................................................
TAU_CREATE_DYNAMIC_AUTO ..................................................................
TAU_PROFILE_DYNAMIC_ITER ...................................................................
TAU_PHASE_DYNAMIC_ITER ......................................................................
TAU_PROFILE_TIMER ..................................................................................
TAU_PROFILE_START .................................................................................
TAU_PROFILE_STOP ....................................................................................
TAU_STATIC_TIMER_START .......................................................................
TAU_STATIC_TIMER_STOP ..........................................................................
TAU_DYNAMIC_TIMER_START ...................................................................
TAU_DYNAMIC_TIMER_STOP .....................................................................
TAU_PROFILE_TIMER_DYNAMIC ................................................................
TAU_PROFILE_DECLARE_TIMER .................................................................
TAU_PROFILE_CREATE_TIMER ...................................................................
TAU_GLOBAL_TIMER ..................................................................................
TAU_GLOBAL_TIMER_EXTERNAL ..............................................................
TAU_GLOBAL_TIMER_START .....................................................................
TAU_GLOBAL_TIMER_STOP ........................................................................
TAU_PHASE .................................................................................................
TAU_DYNAMIC_PHASE ...............................................................................
TAU_PHASE_CREATE_DYNAMIC ................................................................
TAU_PHASE_CREATE_STATIC .....................................................................
TAU_PHASE_START ....................................................................................
TAU_PHASE_STOP .......................................................................................
TAU_DYNAMIC_PHASE_START ...................................................................
TAU_DYNAMIC_PHASE_STOP .....................................................................
TAU_STATIC_PHASE_START .......................................................................
TAU_STATIC_PHASE_STOP .........................................................................
TAU_GLOBAL_PHASE .................................................................................
TAU_GLOBAL_PHASE_EXTERNAL ..............................................................
TAU_GLOBAL_PHASE_START .....................................................................
TAU_GLOBAL_PHASE_STOP ........................................................................
TAU_PROFILE_EXIT ....................................................................................
TAU_REGISTER_THREAD ............................................................................
TAU_PROFILE_GET_NODE ...........................................................................
TAU_PROFILE_GET_CONTEXT ....................................................................
TAU_PROFILE_SET_THREAD .......................................................................
TAU_PROFILE_GET_THREAD ......................................................................
TAU_PROFILE_SET_NODE ...........................................................................
TAU_PROFILE_SET_CONTEXT .....................................................................
TAU_REGISTER_FORK .................................................................................
vi
114
114
114
120
126
126
128
130
130
130
130
130
132
135
136
137
138
139
141
142
143
144
146
147
148
149
150
151
152
154
155
156
157
158
159
160
161
163
165
167
168
169
170
171
172
173
174
175
176
177
178
179
180
181
183
184
186
188
TAU Reference Guide
TAU_REGISTER_EVENT ...............................................................................
TAU_PROFILER_REGISTER_EVENT .............................................................
TAU_EVENT ................................................................................................
TAU_EVENT ................................................................................................
TAU_EVENT ................................................................................................
TAU_EVENT_THREAD .................................................................................
TAU_REGISTER_CONTEXT_EVENT .............................................................
TAU_CONTEXT_EVENT ...............................................................................
TAU_TRIGGER_CONTEXT_EVENT ...............................................................
TAU_EVENT ................................................................................................
TAU_ENABLE_CONTEXT_EVENT ................................................................
TAU_DISABLE_CONTEXT_EVENT ...............................................................
TAU_EVENT_SET_NAME .............................................................................
TAU_EVENT_DISABLE_MAX .......................................................................
TAU_EVENT_DISABLE_MEAN .....................................................................
TAU_EVENT_DISABLE_MIN ........................................................................
TAU_EVENT_DISABLE_STDDEV ..................................................................
TAU_REPORT_STATISTICS ..........................................................................
TAU_REPORT_THREAD_STATISTICS ...........................................................
TAU_ENABLE_INSTRUMENTATION ............................................................
TAU_DISABLE_INSTRUMENTATION ............................................................
TAU_ENABLE_GROUP .................................................................................
TAU_DISABLE_GROUP ................................................................................
TAU_PROFILE_TIMER_SET_GROUP .............................................................
TAU_PROFILE_TIMER_SET_GROUP_NAME ..................................................
TAU_PROFILE_TIMER_SET_NAME ...............................................................
TAU_PROFILE_TIMER_SET_TYPE ................................................................
TAU_PROFILE_SET_GROUP_NAME ..............................................................
TAU_INIT ....................................................................................................
TAU_PROFILE_INIT .....................................................................................
TAU_GET_PROFILE_GROUP .........................................................................
TAU_ENABLE_GROUP_NAME ......................................................................
TAU_DISABLE_GROUP_NAME .....................................................................
TAU_ENABLE_ALL_GROUPS .......................................................................
TAU_DISABLE_ALL_GROUPS ......................................................................
TAU_GET_EVENT_NAMES ...........................................................................
TAU_GET_EVENT_VALS ..............................................................................
TAU_GET_COUNTER_NAMES ......................................................................
TAU_GET_FUNC_NAMES .............................................................................
TAU_GET_FUNC_VALS ................................................................................
TAU_ENABLE_TRACKING_MEMORY ..........................................................
TAU_DISABLE_TRACKING_MEMORY ..........................................................
TAU_TRACK_POWER ...................................................................................
TAU_TRACK_POWER_HERE ........................................................................
TAU_ENABLE_TRACKING_POWER ..............................................................
TAU_DISABLE_TRACKING_POWER .............................................................
TAU_TRACK_MEMORY ...............................................................................
TAU_TRACK_MEMORY_HERE .....................................................................
TAU_TRACK_MEMORY_FOOTPRINT ...........................................................
TAU_TRACK_MEMORY_FOOTPRINT_HERE .................................................
TAU_ENABLE_TRACKING_MEMORY_HEADROOM ......................................
TAU_DISABLE_TRACKING_MEMORY_HEADROOM .....................................
TAU_TRACK_MEMORY_HEADROOM ..........................................................
TAU_TRACK_MEMORY_HEADROOM_HERE ................................................
TAU_SET_INTERRUPT_INTERVAL ...............................................................
CT ...............................................................................................................
TAU_TYPE_STRING .....................................................................................
TAU_DB_DUMP ...........................................................................................
vii
189
190
191
192
193
194
195
197
199
201
202
203
204
205
206
207
208
209
210
211
213
215
216
217
218
219
220
221
222
223
224
225
227
228
229
230
231
233
234
235
237
238
239
240
242
243
244
245
247
248
249
250
251
253
254
255
256
258
TAU Reference Guide
TAU_DB_MERGED_DUMP ...........................................................................
TAU_DB_DUMP_INCR ..................................................................................
TAU_DB_DUMP_PREFIX ..............................................................................
TAU_DB_DUMP_PREFIX_TASK ....................................................................
TAU_DB_PURGE ..........................................................................................
TAU_DUMP_FUNC_NAMES ..........................................................................
TAU_DUMP_FUNC_VALS .............................................................................
TAU_DUMP_FUNC_VALS_INCR ...................................................................
TAU_PROFILE_STMT ...................................................................................
TAU_PROFILE_CALLSTACK ........................................................................
TAU_TRACE_RECVMSG ..............................................................................
TAU_TRACE_SENDMSG ...............................................................................
TAU_PROFILE_PARAM1L ............................................................................
TAU_PROFILE_SNAPSHOT ...........................................................................
TAU_PROFILE_SNAPSHOT_1L .....................................................................
TAU_PROFILER_CREATE .............................................................................
TAU_CREATE_TASK ....................................................................................
TAU_PROFILER_START ...............................................................................
TAU_PROFILER_START_TASK .....................................................................
TAU_PROFILER_STOP ..................................................................................
TAU_PROFILER_STOP_TASK .......................................................................
TAU_PROFILER_GET_CALLS .......................................................................
TAU_PROFILER_GET_CALLS_TASK .............................................................
TAU_PROFILER_GET_CHILD_CALLS ...........................................................
TAU_PROFILER_GET_CHILD_CALLS_TASK .................................................
TAU_PROFILER_GET_INCLUSIVE_VALUES .................................................
TAU_PROFILER_GET_INCLUSIVE_VALUES_TASK .......................................
TAU_PROFILER_GET_EXCLUSIVE_VALUES ................................................
TAU_PROFILER_GET_EXCLUSIVE_VALUES_TASK ......................................
TAU_PROFILER_GET_COUNTER_INFO ........................................................
TAU_PROFILER_GET_COUNTER_INFO_TASK ..............................................
TAU_QUERY_DECLARE_EVENT ..................................................................
TAU_QUERY_GET_CURRENT_EVENT ..........................................................
TAU_QUERY_GET_EVENT_NAME ...............................................................
TAU_QUERY_GET_PARENT_EVENT ............................................................
II. TAU Mapping API ..............................................................................................
TAU_MAPPING ............................................................................................
TAU_MAPPING_CREATE ..............................................................................
TAU_MAPPING_LINK ...................................................................................
TAU_MAPPING_OBJECT ..............................................................................
TAU_MAPPING_PROFILE .............................................................................
TAU_MAPPING_PROFILE_START .................................................................
TAU_MAPPING_PROFILE_STOP ...................................................................
TAU_MAPPING_PROFILE_TIMER .................................................................
A. Environment Variables .........................................................................................
viii
259
260
261
262
263
264
265
266
267
268
269
271
273
274
275
276
277
278
279
280
281
282
283
284
285
286
287
288
289
290
291
292
293
294
295
296
297
298
300
302
303
304
305
306
307
List of Figures
1.1. One sided communnication. .................................................................................... 7
5.1. TAUJava Options Screen ...................................................................................... 35
5.2. TAUJava Project Instrumentation ........................................................................... 35
5.3. TAUJava Running ............................................................................................... 37
6.1. TAU Setup ......................................................................................................... 39
6.2. TAU Launch Configuration ................................................................................... 40
6.3. Optional User Defined Events ................................................................................ 41
6.4. Adding User Defined Events ................................................................................. 41
ix
List of Tables
2.1. Events measured by setting the environment variable TAU_METRICS in TAU .............. 17
2.2. Events measured by setting the environment variable PCL_EVENT in TAU .................. 19
7.1. Selection Attributes ............................................................................................. 61
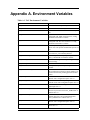
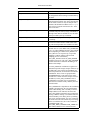
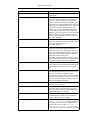
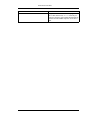
A.1. TAU Environment Variables .............................................................................. 307
x
Chapter 1. Installation
TAU (Tuning and Analysis Utilities) is a portable profiling and tracing toolkit for performance analysis
of parallel programs written in Fortran, C++, C, Java and Python. The model that TAU uses to profile
parallel, multi-threaded programs maintains performance data for each thread, context, and node in use
by an application. The profiling instrumentation needed to implement the model captures data for functions, methods, basic blocks, and statement execution at these levels. All C++ language features are supported in the TAU profiling instrumentation including templates and namespaces, which is available
through an API at the library or application level. The API also provides selection of profiling groups for
organizing and controlling instrumentation. The instrumentation can be inserted in the source code using
an automatic instrumentor tool based on the Program Database Toolkit (PDT), dynamically using DyninstAPI, at runtime in the Java virtual machine, or manually using the instrumentation API. TAU's profile visualization tool, paraprof, provides graphical displays of all the performance analysis results, in
aggregate and single node/context/thread forms. The user can quickly identify sources of performance
bottlenecks in the application using the graphical interface. In addition, TAU can generate event traces
that can be displayed with the Vampir or Paraver trace visualization tools. This chapter discusses installation of the TAU portable profiling package.
Some tau options allow external resources to be automatically downloaded and built when TAU is configured. To obtain these resources in a single package download http://tau.uoregon.edu/ext.tgz and unpack it in TAU's root directory. When you configure TAU with:
•
-bfd=download
•
-unwind=download
•
-ompt=download
these packages will be provided by the ext.tgz package and no additional network activity will be required.
1.1. Installing TAU
1.1.1. Know what options you will need
Each TAU configuration results in a single Makefile. These Makefiles denote the configuration
that produced it and is used by the user to select the TAU libraries/scripts associated with its configuration. (These makefiles are named after the configuration options, ie. TAU configured with MPI, PDT,
PGI compilers and the '-nocomm' option is named: Makefile.tau-nocomm-mpi-pdt-pgi). On
most machines several configuration of TAU will need to be built in order to take full advantage of the
many features of TAU. This section should help you decide on the smallest set of configuration you will
need to build.
The options used to configure TAU can be grouped into two categories:
•
External packages: TAU will use these when instrumenting or measuring an application. Configuring with these options does not force the user to use these packages, ie: configuring with PDT does
not force the user to use source code based instrumentation (they can use compiler based instrumentation instead). Similarly configuring with PAPI does not forces the user to select any PAPI counters
when profiling.
Note
1
Installation
The only exception is configuring with the epilog (scalasca) tracing package. This will
replace the TAU tracer with the epliog one, a single configuration cannot use both
tracers.
For this reason it is recommend that you configure with every external packages that the user might
be interested in using, letting them choose which packages to enable when they go to instrument or
measure their application.
•
Compiler and MPI options: these control the behavior of TAU when it compiles the instrumented
application. TAU provides compiler wrapper scripts, these options control which compiler TAU will
wrap, These options are determinative: select only options that are compatible. For example, when
configuring with MPI use a version of MPI compatible with the compiler you select.
Since multiple compiler/MPI libraries cannot be specified for a single configuration, each set of
compiler/MPI libraries that you want to use with TAU need to be configured separately.
Note
Configurations with different compilers are given separate Makefiles automatically,
however configurations with different MPI implementations are not. Use the -tag=
option to distinguish between different MPIs, ie: -tag=mvapich or tag=openmpi.
The configure shell script attempts to guess correct values for various system-dependent variables
used during compilation (compilers and system architecture), other options need to be specified on the
command line.
The following are the most important command-line options are available to configure:
1.1.2. Common configuration options
1.1.2.1. Select compiler
TAU defaults to using any compilers found in the environment. To use a specific compiler use these options:
•
-c++=<C++ compiler>
Specifies the name of the C++ compiler. Supported C++ compilers include KCC (from KAI/Intel),
CC (SGI, Sun), g++ (from GNU), FCC (from Fujitsu), xlC (from IBM), guidec++ (from KAI/Intel),
cxx (Tru64) and aCC (from HP), c++ (from Apple), icpc and ecpc (from Intel) and pgCC (from
PGI).
•
-cc=<C Compiler>
Specifies the name of the C compiler. Supported C compilers include cc, gcc (from GNU), pgcc
(from PGI), fcc (from Fujitsu), xlc (from IBM), and KCC (from KAI/ Intel), icc and ecc (from Intel).
•
-fortran=<Fortran Compiler>
Specifies the name of the Fortran90 compiler. Valid options are: gnu, sgi, ibm, ibm64, intel, cray,
pgi, absoft, fujitsu, sun, kai, nec, hitachi, compaq, nagware, g95 and hp.
2
Installation
1.1.2.2. Using MPI
To profile a program that use MPI configure TAU with these options:
•
-mpi
With this option, TAU will try to guess the location of the MPI libraries if the mpirun command is in
your path. This does not always work in which case use these more detailed options:
•
-mpiinc=<dir>
Specifies the directory where MPI header files reside (such as mpi.h and mpif.h). This option also
generates the TAU MPI wrapper library that instruments MPI routines using the MPI Profiling Interface. See the examples/NPB2.3/config/make.def file for its usage with Fortran and MPI programs.
MPI [http://www-unix.mcs.anl.gov/mpi/]
•
-mpilib=<dir>
Specifies the directory where MPI library files reside. This option should be used in conjunction
with the -mpiinc=<dir> option to generate the TAU MPI wrapper library.
•
-mpilibrary=<lib>
Specifies the use of a different MPI library. By default, TAU uses -lmpi or -lmpich as the MPI library. This option allows the user to specify another library. e.g., -mpilibrary=-lmpi_r for specifying a
thread-safe MPI library.
1.1.2.3. OpenMP
To profile programs using openmp use -openm and either OPARI option:
•
-openmp
Specifies OpenMP as the threads package to be used. Open MPI [http://www.open-mpi.org/]
•
-opari
The use of Opari2 source-to-source instrumentor in conjunction with TAU exposes OpenMP events
for instrumentation. See examples/opari directory. OPARI [ihttp://www.vi-hps.org/projects/score-p/]
•
-opari1
Use this option for the use of the original Opari. Only use this option if -opari fails. OPARI
[http://www.fz-juelich.de/zam/kojak/opari/]
1.1.3. Configuring with external packages
•
-pdt=<directory>
Specifies the location of the installed PDT (Program Database Toolkit) root directory. PDT is used
to build tau_instrumentor, a C++, C and F90 instrumentation program that automatically inserts
TAU annotations in the source code PDT [http://www.cs.uoregon.edu/research/pdt]. If PDT is configured with a subdirectory option (-compdir=<opt>) then TAU can be configured with the same op3
Installation
tion.
•
-pdt_c++=<C++ Compiler>
Specifies a different C++ compiler for PDT (tau_instrumentor). This is typically used when the library is compiled with a C++ compiler (specified with -c++) and the tau_instrumentor is compiled
with a different <pdt_c++> compiler. For e.g.,
-arch=craycnl -pdt=/usr/pdtoolkit-3.17 -pdt_c++=g++ ...
uses g++ to compile the tau_instrumentor, for example on CRAY XT5 systems use this option to
build TAU any of the backend compilers.
-arch=bgp -pdt=/usr/pdtoolkit-3.17 -pdt_c++=xlC -mpi
uses PDT, MPI for IBM BG/P and specifies the use of the front-end xlC compiler for building
tau_instrumentor.
•
-papi=<directory>
Specifies the location of the installed PAPI (Performance Data Standard and API) root directory.
PCL provides a common interface to access hardware performance counters and timers on modern
microprocessors. Most modern CPUs provide on-chip hardware performance counters that can record several events such as the number of instructions issued, floating point operations performed,
the number of primary and secondary data and instruction cache misses. To measure floating point
instructions, set the environment variable TAU_METRICS to PAPI_FP_INS (for example). This option (by default) specifies the use of hardware performance counters for profiling (instead of time).
PAPI [http://icl.cs.utk.edu/papi/]
•
-epilog=<dir>
Specifies
the
directory
where
the
EPILOG
tracing
package
EPILOG
[http://www.fz-juelich.de/zam/kojak/epilog/] is installed.This option should be used in conjunction
with the -TRACE option to generate binary EPILOG traces (instead of binary TAU traces). EPILOG
traces can then be used with other tools such as EXPERT. EPILOG comes with its own implementation of the MPI wrapper library and the POMP library used with Opari. Using option overrides
TAU's libraries for MPI, and OpenMP.
•
-otf=<directory>
Specifies the location of the OTF trace libraries generation package. TAU's binary traces can be converted to the OTF format using tau2otf, a tool that links with the OTF library.
•
-vtf=<directory>
Specifies the location of the VTF3 trace generation package. TAU's binary traces can be converted
to the VTF3 format using tau2vtf, a tool that links with the VTF3 library. The VTF3 format is read
by Intel trace analyzer, formerly known as vampir, a commercial trace visualization tool developed
by TU. Dresden, Germany.
1.1.4. More configuration options
•
-PROFILEPHASE
This option generates phase based profiles. It requires special instrumentation to mark phases in an
4
Installation
application (I/O, computation, etc.). Phases can be static or dynamic (different phases for each loop
iteration, for instance). See examples/phase/README for further information.
•
-prefix=<directory>
Specifies the destination directory where the header, library and binary files are copied. By default,
these are copied to subdirectories <arch>/bin and <arch>/lib in the TAU root directory.
•
-arch=<architecture>
Specifies the architecture. If the user does not specify this option, configure determines the architecture. For IBM BGL, the user should specify bgl as the architecture. For SGI, the user can specify
either of sgi32, sgin32 or sgi64 for 32, n32 or 64 bit compilation modes respectively. The files are
installed in the <architecture>/bin and <architecture>/lib directories. Cray options are xt3, craycnl or
crayxmt.
•
-tag=<Unique Name>
Specifies a tag in the name of the stub Makefile and TAU makefiles to uniquely identify the installation. This is useful when more than one MPI library may be used with different versions of compilers. e.g.,
% configure -c++=icpc -cc=icc -tag=intel71-vmi
-mpiinc=/vmi2/mpich/include
•
\
-scalasca=<dir>
Specifies the directory where the SCALASCA [http://www.sclasca.org] package is installed.
•
-pthread
Specifies pthread as the thread package to be used. In the default mode, no thread package is used.
•
-opari_region
Report performance data for only OpenMP regions and not constructs. By default, both regions and
constructs are profiled with Opari.
•
-opari_construct
Report performance data for only OpenMP constructs and not Regions. By default, both regions and
constructs are profiled with Opari.
•
-pdtarch=<architecture>
Specifies the architecture used to build pdt, default the tau architecture.
•
-papithreads
Same as papi, except uses threads to highlight how hardware performance counters may be used in a
multi-threaded application. When it is used with PAPI, TAU should be configured with -papi=<dir>
-pthread autoinstrument Shows the use of Program Database Toolkit (PDT) for automating the insertion of TAU macros in the source code. It requires configuring TAU with the -pdt=<dir> option. The
Makefile is modified to illustrate the use of a source to source translator (tau_instrumentor).
•
-jdk=<directory>
5
Installation
Specifies the location of the installed Java root directory. TAU can profile or trace Java applications
without any modifications to the source code, byte-code or the Java virtual machine. See
README.JAVA on instructions on using TAU with Java 2 applications. Also the refence guide has
more information on the new tau_java tool. This option should only be used for configuring TAU to
use JVMTI for profiling and tracing of Java applications. It should not be used for configuring
paraprof, which uses Java from the user's path.
•
-dyninst=<dir>
Specifies the directory where the DynInst dynamic instrumentation package is installed. Using DynInst, a user can invoke tau_run to instrument an executable program at runtime or prior to execution
by rewriting it. DyninstAPI [http://www.dyninst.org/]PARA-DYN [http://www.paradyn.org/].
•
-vampirtrace=<directory>
Specifies the location of the Vampir Trace package. With this option TAU will generate traces in
Open Trace Format (OTF). For more information, see Technische Universitat Dresden [ http://www.tu-dresden.de/zih/vampirtrace]
•
-scorep=<directory>
Specify location of Score-P package. Set the enviroment varible SCOREP_PROFILING_FORMAT
to TAU_SNAPHOT so that Score-P will output Tau Snapsot profiles.
•
-shmeminc=<dir>
Specifies the directory where shmem.h resides and specifies the use of the TAU SHMEM interface.
•
-shmemlib=<dir>
Specifies the directory where libsma.a resides and specifies the use of the TAU SHMEM interface.
•
-shmemlibrary=<lib>
By default, TAU uses -lsma as the shmem/pshmem library. This option allows the user to specify a
different shmem library.
•
-nocomm
Allows the user to turn off tracking of messages (synchronous/asynchronous) in TAU's MPI wrapper
interposition library. Entry and exit events for MPI routines are still tracked. Affects both profiling
and tracing.
•
-cuda=<dir>
Specifies the location of the top level CUDA SDK
•
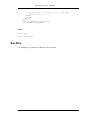
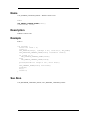
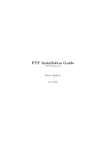
-gpi=<dir>
Specify use of TAU's GPI wrapper library.
It works well with PDT and compiler based instrumentation of the source code and there is a wrapper interposition library that is linked in to track the communication of GPI. It is important to specify
all TAU runtime options in the tau.conf file that must reside in the current working directory where
the executable is stored and launched from. This is important because the worker tasks are spawned
by the GPI daemon on remote nodes and do not inherit the user's working directory or the environment. So, options such as TAU_TRACE=1, and sampling must be specified in the tau.conf file.
6
Installation
Figure 1.1. One sided communnication.
•
-opencl=<dir>
Specifies the location of the OpenCL package
•
-armci=<dir>
Specifies the location of the ARMCI directory
•
-epiloglib=<dir>
Specifies the directory of where the Epilog library is to be found. Ex: if directory structure is: /
usr/local/epilog/fe/lib/ let the install options be: -epilog=/usr/local/epilog
-epiloglib=/usr/local/epilog/fe/lib.
•
-epilogbin=<dir>
Specifies the directory of where the Epilog binaries are to be found.
•
-epiloginc=<dir>
Specifies the directory of where the epilog's included sources headers are to be found.
•
-MPITRACE
Specifies the tracing option and generates event traces for MPI calls and routines that are ancestors
of MPI calls in the callstack. This option is useful for generating traces that are converted to the EPILOG trace format. KOJAK's Expert automatic diagnosis tool needs traces with events that call MPI
routines. Do not use this option with the -TRACE option.
•
-pythoninc=<dir>
Specifies the location of the Python include directory. This is the directory where Python.h header
file is located. This option enables python bindings to be generated. The user should set the environment variable PYTHONPATH to <TAUROOT>/<ARCH>/lib/bindings-<options> to use a specific
version of the TAU Python bindings. By importing package pytau, a user can manually instrument
the source code and use the TAU API. On the other hand, by importing tau and using
tau.run(`<func>'), TAU can automatically generate instrumentation. See examples/python directory
7
Installation
for further information.
•
-pythonlib=<dir>
Specifies the location of the Python lib directory. This is the directory where *.py and *.pyc files
(and config directory) are located. This option is mandatory for IBM when Python bindings are used.
For other systems, this option may not be specified (but -pythoninc=<dir> needs to be specified).
•
-PROFILEMEMORY
Specifies tracking heap memory utilization for each instrumented function. When any function entry
takes place, a sample of the heap memory used is taken. This data is stored as user-defined event
data in profiles/traces.
•
-PROFILECOMMUNICATORS
This option generates MPI information partitioned by communicators. TAU lists upto 8 ranks in
each communicator in the listing.
•
-PROFILEHEADROOM
Specifies tracking memory available in the heap (as opposed to memory utilization tracking in PROFILEMEMORY). When any function entry takes place, a sample of the memory available
(headroom to grow) is taken. This data is stored as user-defined event data in profiles/traces. Please
refer to the examples/headroom/README file for a full explanation of these headroom options and
the C++/C/F90 API for evaluating the headroom.
•
-COMPENSATE
Specifies online compensation of performance perturbation. When this option is used, TAU computes its overhead and subtracts it from the profiles. It can be only used when profiling is chosen.
This option works with MULTIPLECOUNTERS as well, but while it is relevant for removing perturbation with wallclock time, it cannot accurately account for perturbation with hardware performance counts (e.g., L1 Data cache misses). See TAU Publication [Europar04] for further information
on this option.
•
-PROFILECOUNTERS
Specifies use of hardware performance counters for profiling under IRIX using the SGI R10000 perfex counter access interface. The use of this option is deprecated in favor of the -pcl=<dir> and papi=<dir> options described above.
•
-noex
Specifies that no exceptions be used while compiling the library. This is relevant for C++.
•
-useropt=<options-list>
Specifies additional user options such as -g or -I. For multiple options, the options list should be enclosed in a single quote. For example
%./configure -useropt='-g -I/usr/local/stl'
•
-mrnet=<mrnet source root>
Base location of the MRnet package.
8
Installation
•
-mrnetlib=<mrnet libraries>
Path to the MRnet libraries.On some cluster systems the MRnet libraries need to available to the
runtime system (ie. on the lustre filesystem.)
•
-scorep=<scorep subsystem>
Path
to
the
Score-P
measurement
system.
Set
the
enviroment
varible
SCOREP_PROFILING_FORMAT to TAU_SNAPHOT so that Score-P will output Tau Snapsot
profiles.
•
-help
Lists all the available configure options and quits.
1.1.5. tau_setup
tau_setup is a GUI interface to the configure and installtau tools.
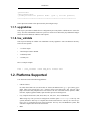
1.1.6. installtau script
To install multiple (typical) configurations of TAU at a site, you may use the script `installtau'. It takes
options similar to those described above. It invokes ./configure <opts>; make clean install; to create
multiple libraries that may be requested by the users at a site. The installtau script accepts the following
options:
% installtau -help
TAU Configuration Utility
***************************************************
Usage: installtau [OPTIONS]
where [OPTIONS] are:
-arch=<arch>
-fortran=<compiler>
-cc=<compiler>
-c++=<compiler>
-useropt=<options>
-pdt=<pdtdir>
-pdtcompdir=<compdir>
-pdt_c++=<C++ Compiler>
-papi=<papidir>
-vtf=<vtfdir>
-otf=<otfdir>
-dyninst=<dyninstdir>
-mpi
-mpiinc=<mpiincdir>
-mpilib=<mpilibdir>
-mpilibrary=<mpilibrary>
-perfinc=<dir>
-perflib=<dir>
-perflibrary=<library>
-mpi
-tag=<unique name>
-opari=<oparidir>
-epilog=<epilogdir>
-epiloginc=<absolute path to epilog include dir> (<epilog>/include default)
-epilogbin=<absolute path to epilog bin dir> (<epilog>/bin default)
-epiloglib=<absolute path to epilog lib dir> (<epilog>/lib default)
9
Installation
-prefix=<dir>
-exec-prefix=<dir>
-j=<num processes for parallel make>
(just -j for full parallel)
******************************************************************
These options are similar to the options used by the configure script.
1.1.7. upgradetau
This script is provided to rebuild all TAU configurations previously built in a different TAU source directory. Give this command the location of a previous version of tau followed by any additional configurations and it will rebuild tau with these same options.
1.1.8. tau_validate
This script will attempt to validate a tau installation. Its only argument is TAU's architecture directory.
These are some options:
•
-v Verbose output
•
--html Output results in HTML
•
--build Only build
•
--run Only run
Here is a simple example:
bash : ./tau_validate --html x86_64 &> results.html
tcsh : ./tau_validate --html x86_64 >& results.html
1.2. Platforms Supported
TAU has been tested on the following platforms:
•
LINUX Clusters
On Linux based Intel x86 (32 and 64 bit) PC clusters, KAI/Intel's KCC, g++, egcs (GNU), pgCC
(PGI) [http://www.pgroup.com], FCC (Fujitsu) [http://www.fujitsu.com] and icpc/ecpc Intel
[http://www.intel.com] compilers have been tested. TAU also runs under IA-64, Opteron, ARM,
PowerPC, Alpha, Apple PowerMac, Sparc and other processors running Linux.
•
Cray Compute Node Linux (XT5, XT6, XE6), X1, T3E, SV-1, XT3, and RedStorm
When using Cray CNL you need to configure tau with the option -arch=craycnlOn Cray T3E
systems, KAI KCC and Cray CC compilers have been tested with TAU. On Cray SV-1 and X1 systems, Cray CC compilers have been tested with TAU. On Cray XT3, and RedStorm systems, PGI
and GNU compilers have been tested with TAU.
•
IBM
10
Installation
On IBM BlueGene (L/P/Q) SP2 and AIX systems. On IBM BG: IBM xlC, blrts_xlC, blrts_xlf90,
blrts_xlc, and gnu compilers work with TAU. SP2 and AIX: vKAI KCC, KAP/Pro, IBM xlC, xlc,
xlf90 and g++ compilers work with TAU. On IBM pSeries Linux, xlC, xlc, xlf90 and gnu compilers
work with TAU.
•
Sun Solaris
Sun compilers (CC, F90), KAI KCC, KAP/Pro and GNU g++ work with TAU.
•
Apple OS X
On Apple OS X machines, c++ or g++ may be used to compile TAU. Also, IBM's xlf90, xlf and Absoft Fortran 90 compilers for G4/G5 may be used with TAU.
•
SGI
On IRIX 6.x based systems, including Indy, Power Challenge, Onyx, Onyx2 and Origin 200, 2000,
3000 Series, CC 7.2+, KAI [http://www.kai.com] KCC and g++ [http://www.gnu.org] compilers are
supported. On SGI Altix systems, Intel, and GNU compilers are supported.
•
Accelerators
TAU performance data can be retrived from ATI, Nvidia or Intel GPUs (through OpenCL, or
CUDA). Intel Many Intergrated Cores (MIC) is supported in native execution.
•
Intel
•
HP HP-UX
On HP PA-RISC systems, aCC and g++ can be used.
•
HP Alpha Tru64
On HP Alpha Tru64 machines, cxx and g++, and Guide compilers may be used with TAU.
•
NEC SX series vector machines
On NEC SX-5 systems, NEC c++ may be used with TAU.
•
On Hitachi machines, Hitachi KCC, g++ and Hitachi cc compilers may be used with TAU
•
Fujitsu PRIMEPOWER
On Fujitsu Power machines, Sun and Fujitsu compilers may be used with TAU.
•
Microsoft Window
On Windows, Microsoft Visual C++ 6.0 or higher and JDK 1.2+ compilers have been tested with
TAU
NOTE: TAU has been tested with JDK 1.2, 1.3, 1.4.x under Solaris, SGI, IBM, Linux, and MacOS X.
1.3. Software Requirements
•
1. Java v 1.5
11
Installation
TAU's GUI ParaProf and PerfExplorer require Java v1.4 or better in your path. If Java 1.4 is the only
version avaible, older version of ParaProf and PerfExplorer can be installed. To do so, simple run
either program with Java 1.4 in your path. You will guided through the installation process. ParaProf
does not require -jdk=<dir> option to be specified during configuration. (This option is used for configuring TAU for analyzing Java applications.)
12
Chapter 2. TAU Instrumentation
Options
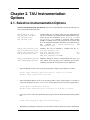
2.1. Selective Instrumentation Options
Selective Instrumentation File Specification. The selective instrumentation file has the following sections, each preceded and followed by:
BEGIN_EXCLUDE_LIST /
END_EXCLUDE_LIST or BEGIN_INCLUDE_LIST /
END_INCLUDE_LIST
exclude/include list of routines and/or files for instrumentation.
The list of routines to be excluded from instrumentation is specified, one per line, enclosed by BEGIN_EXCLUDE_LIST and
END_EXCLUDE_LIST. Instead of specifying which routines
should be excluded, the user can specify the list of routines that
are to be instrumented using the include list, one routine name per
line,
enclosed
by
BEGIN_INCLUDE_LIST
and
END_INCLUDE_LIST.
BEGIN_FILE_EXCLUDE_LIST /
END_FILE_EXCLUDE_LIST or
BEGIN_FILE_INCLUDE_LIST /
END_FILE_INCLUDE_LIST
Similarly, files can be included or excluded with the BEGIN_FILE_EXCLUDE_LIST,
END_FILE_EXCLUDE_LIST,
BEGIN_FILE_INCLUDE_LIST,
and
END_FILE_INCLUDE_LIST lines.
BEGIN_INSTRUMENT_SECTION
/ END_INSTRUMENT_SECTION
Manually editing the selective instrumentation file gives you
more options. These tags allow you to control the type of instrumentation performed in certain portions of your application.
•
Static and Dynamic timers can be set by specifying either a range of line numbers or a routine.
static timer name="foo_bar" file="foo.c" line=17 to line=18
dynamic timer routine="int foo1(int)
•
Static and Dynamic phases can be set by specifying either a range of line numbers or a routine. If
you do not configure TAU with -PROFILEPHASE these phases will be converted to regular timers.
static phase routine="int foo(int)
dynamic phase name="foo1_bar" file="foo.c" line=26 to line=27
•
Loops in the source code can be profiled by specifying a routine in which all loop should be profiled,
like:
loops file="loop_test.cpp" routine="multiply"
•
With Memory Profiling the following events are tracked: memory allocation, memory deallocation,
13
TAU Instrumentation Options
and memory leaks.
memory file="foo.f90" routine="INIT"
•
IO Events track the size, in bytes of read, write, and print statements.
io file="foo.f90" routine="RINB"
Both Memory and IO events are represented along with their call-stack; the length of which can be set
with environment variable TAU_CALLPATH_DEPTH.
Note
Due to the limitations of the some compilers (IBM xlf, PGI pgf90, GNU gfortran), the size
of the memory reported for a Fortran Array is not the number of bytes but rather the number of elements.
2.2. Running an application using DynInstAPI
TAU also allows you to dynamically instrument your application using the DynInst package. There are a
few limitation to DyInst: 1) only function level events will be captured and 2) your application must be
compiled with debugging symbols (-g).
To install the DynInstAPI package, configure TAU with -dyinst= option which will point TAU to where
dyninst is installed. Use the tau_run tool to instrument your application at runtime.
The command-line options accepted by tau_run are:
Usage: tau_run [-Xrun<Taulibrary> ][-v][-o outfile] \
[-f <instrumentation file> ] <application> [args]
By default, libTAU. so is loaded by tau_run. However, the user can override this and specify another
file using the -Xrun<Taulibrary>. In this case lib<Taulibrary>.so will be loaded using
LD_LIBRARY_PATH.
To use tau_run, TAU is configured with DyninstAPI as shown below:
%
%
%
%
%
%
configure -dyninst=/usr/local/packages/dyninstAPI
make install
cd tau/examples/dyninst
make install
tau_run klargest 2500 23
pprof; paraprof
2.3. Rewriting Binaries
14
TAU Instrumentation Options
2.3.1. Using MAQAO
TAU also allows you to rewrite your application using the MAQAO package included in PDToolkit
3.17 or above(http://tau.uoregon.edu/pdt.tgz).
Install PDToolkit 3.17+ and configure TAU with -pdt= option which will point TAU to where
PDToolkit is installed. Use the tau_rewrite tool to instrument your application. (If TAU is not configured with PDT 3.17+, then tau_rewrite defaults to tau_run.)
% configure -pdt=/usr/local/packages/pdtoolkit-3.17
% make install
% tau_rewrite -T scorep,pdt -loadlib=/tmp/libfoo.so ./a.out -o a.inst
2.3.2. Using PEBIL
TAU also allows you to rewrite your application using the PEBIL package included in PDToolkit 3.18.1
or above(http://tau.uoregon.edu/pdt.tgz).
Install PDToolkit 3.18.1 and configure TAU with -pdt= option which will point TAU to where
PDToolkit is installed. Use the tau_pebil_rewrite tool to instrument your application.
% tau_pebil_rewrite -T <commands> -f select.tau <exe> [-o] <output_exe>
The select.tau file supports outer-loop level instrumentation and exclude/include lists of functions just
like tau_instrumentor's select.tau (same format). Also, -T <options> are identical to tau_exec -T options.
2.4. Profiling each call to a function
By default TAU profiles the total time (inclusive/exclusive) spent on a given function. Profiling each
function call for an application that calls some function hundred of thousands of times, is impractical
since the profile data would grow enormously. But configuring TAU with the -PROFILEPARAM option
will have TAU profile select functions each time they are called. But TAU will also group some of these
function calls together according to the value of the parameter they are given. For example if a function
mpisend(int i) is called 2000 times 1000 times with 512 and 1000 times with 1024 then we will receive
two profile for mpisend() one we it is called with 512 and one when it is called with 1024. This reduces
the overhead since we are profiling mpisend() two times not 2000 times.
2.5. Profiling with Hardware counters
LIST OF COUNTERS:
Set the TAU_METRICS environment variable with a comma separated list of metrics or to use the old
method set the following values for the COUNTER<1-25> environment variables.
•
GET_TIME_OF_DAY - For the default profiling option using gettimeofday()
•
SGI_TIMERS - For -SGITIMERS configuration option under IRIX
•
CRAY_TIMERS - For -CRAYTIMERS configuration option under Cray X1.
•
LINUX_TIMERS - For -LINUXTIMERS configuration option under Linux
15
TAU Instrumentation Options
•
CPU_TIME - For user+system time from getrusage() call with -CPUTIME
•
P_WALL_CLOCK_TIME - For PAPI's WALLCLOCK time using -PAPIWALLCLOCK
•
P_VIRTUAL_TIME - For PAPI's process virtual time using -PAPIVIRTUAL
•
TAU_MUSE - For reading counts of Linux OS kernel level events when MAGNET/MUSE is installed
and
-muse
configuration
option
is
enabled.
MUSE
[http://public.lanl.gov/radiant/].TAU_MUSE_PACKAGE environment variable has to be set to package name (busy_time, count, etc.)
•
TAU_MPI_MESSAGE_SIZE - For tracking the cumulative message size for all MPI operations by a
node for each routine.
•
ENERGY - For tracking the power use of the application in joules. Requires an -arch=craycnl configuration.
•
ACCEL_ENERGY - For tracking the power use of the application on accelerators in joules. Requires
an -arch=craycnl configuration.
Note
When TAU is configured with -TRACE -MULTIPLECOUNTERS and -papi=<dir> options, the COUNTER1 environment variable must be set to GET_TIME_OF_DAY to allow TAU's tracing module to use a globally synchronized real-time clock for timestamping event records. When we use tracing with hardware performance counters, the
counters specified in environment variables COUNTER[2-25] are accessed at routine
transitions and logged in the trace file. Use tau2vtf tool to convert TAU traces to VTF3
traces that may be loaded in the Vampir trace visualization tool.
and PAPI/PCL options that can be found in Table 2.1, “Events measured by setting the environment
variable TAU_METRICS in TAU” and Table 2.2, “Events measured by setting the environment variable PCL_EVENT in TAU”. Example:
•
PCL_FP_INSTR - For floating point operations using PCL (-pcl=<dir>)
•
PAPI_FP_INS - For floating point operations using PAPI (-papi=<dir>)
•
PAPI_NATIVE_<event> - For native papi events using PAPI (-papi=<dir>)
NOTE: When -MULTIPLECOUNTERS is used with -TRACE option, the tracing library uses the wallclock time from the function specified in the COUNTER1 variable. This should typically point to wallclock time routines (such as GET_TIME_OF_DAY or SGI_TIMERS or LINUX_TIMERS).
Example:
% setenv COUNTER1
P_WALL_CLOCK_TIME
% setenv COUNTER2 PAPI_L1_DCM
% setenv COUNTER3 PAPI_FP_INS
will
produce
profile
files
in
directories
called
MULTI__PAPI_L1_DCM, and MULTI_PAPI_FP_INS.
16
MULT_P_WALL_CLOCK_TIME,
TAU Instrumentation Options
Table 2.1. Events measured by setting the environment variable TAU_METRICS
in TAU
TAU_METRICS
EVENT Measured
PAPI_L1_DCM
Level 1 data cache misses
PAPI_L1_ICM
Level 1 instruction cache misses
PAPI_L2_DCM
Level 2 data cache misses
PAPI_L2_ICM
Level 2 instruction cache misses
PAPI_L3_DCM
Level 3 data cache misses
PAPI_L3_ICM
Level 3 instruction cache misses
PAPI_L1_TCM
Level 1 total cache misses
PAPI_L2_TCM
Level 2 total cache misses
PAPI_L3_TCM
Level 3 total cache misses
PAPI_CA_SNP
Snoops
PAPI_CA_SHR
Request for access to shared cache line (SMP)
PAPI_CA_CLN
Request for access to clean cache line (SMP)
PAPI_CA_INV
Cache Line Invalidation (SMP)
PAPI_CA_ITV
Cache Line Intervention (SMP)
PAPI_L3_LDM
Level 3 load misses
PAPI_L3_STM
Level 3 store misses
PAPI_BRU_IDL
Cycles branch units are idle
PAPI_FXU_IDL
Cycles integer units are idle
PAPI_FPU_IDL
Cycles floating point units are idle
PAPI_LSU_IDL
Cycles load/store units are idle
PAPI_TLB_DM
Data translation lookaside buffer misses
PAPI_TLB_IM
Instruction translation lookaside buffer misses
PAPI_TLB_TL
Total translation lookaside buffer misses
PAPI_L1_LDM
Level 1 load misses
PAPI_L1_STM
Level 1 store misses
PAPI_L2_LDM
Level 2 load misses
PAPI_L2_STM
Level 2 store misses
PAPI_BTAC_M
BTAC miss
PAPI_PRF_DM
Prefetch data instruction caused a miss
PAPI_L3_DCH
Level 3 Data Cache Hit
PAPI_TLB_SD
Translation lookaside buffer shootdowns (SMP)
PAPI_CSR_FAL
Failed store conditional instructions
PAPI_CSR_SUC
Successful store conditional instructions
PAPI_CSR_TOT
Total store conditional instructions
PAPI_MEM_SCY
Cycles Stalled Waiting for Memory Access
PAPI_MEM_RCY
Cycles Stalled Waiting for Memory Read
PAPI_MEM_WCY
Cycles Stalled Waiting for Memory Write
PAPI_STL_ICY
Cycles with No Instruction Issue
17
TAU Instrumentation Options
TAU_METRICS
EVENT Measured
PAPI_FUL_ICY
Cycles with Maximum Instruction Issue
PAPI_STL_CCY
Cycles with No Instruction Completion
PAPI_FUL_CCY
Cycles with Maximum Instruction Completion
PAPI_HW_INT
Hardware interrupts
PAPI_BR_UCN
Unconditional branch instructions executed
PAPI_BR_CN
Conditional branch instructions executed
PAPI_BR_TKN
Conditional branch instructions taken
PAPI_BR_NTK
Conditional branch instructions not taken
PAPI_BR_MSP
Conditional branch instructions mispredicted
PAPI_BR_PRC
Conditional branch instructions correctly predicted
PAPI_FMA_INS
FMA instructions completed
PAPI_TOT_IIS
Total instructions issued
PAPI_TOT_INS
Total instructions executed
PAPI_INT_INS
Integer instructions executed
PAPI_FP_INS
Floating point instructions executed
PAPI_LD_INS
Load instructions executed
PAPI_SR_INS
Store instructions executed
PAPI_BR_INS
Total branch instructions executed
PAPI_VEC_INS
Vector/SIMD instructions executed
PAPI_FLOPS
Floating Point Instructions executed per second
PAPI_RES_STL
Cycles processor is stalled on resource
PAPI_FP_STAL
FP units are stalled
PAPI_TOT_CYC
Total cycles
PAPI_IPS
Instructions executed per second
PAPI_LST_INS
Total load/store instructions executed
PAPI_SYC_INS
Synchronization instructions executed
PAPI_L1_DCH
L1 D Cache Hit
PAPI_L2_DCH
L2 D Cache Hit
PAPI_L1_DCA
L1 D Cache Access
PAPI_L2_DCA
L2 D Cache Access
PAPI_L3_DCA
L3 D Cache Access
PAPI_L1_DCR
L1 D Cache Read
PAPI_L2_DCR
L2 D Cache Read
PAPI_L3_DCR
L3 D Cache Read
PAPI_L1_DCW
L1 D Cache Write
PAPI_L2_DCW
L2 D Cache Write
PAPI_L3_DCW
L3 D Cache Write
PAPI_L1_ICH
L1 instruction cache hits
PAPI_L2_ICH
L2 instruction cache hits
PAPI_L3_ICH
L3 instruction cache hits
PAPI_L1_ICA
L1 instruction cache accesses
18
TAU Instrumentation Options
TAU_METRICS
EVENT Measured
PAPI_L2_ICA
L2 instruction cache accesses
PAPI_L3_ICA
L3 instruction cache accesses
PAPI_L1_ICR
L1 instruction cache reads
PAPI_L2_ICR
L2 instruction cache reads
PAPI_L3_ICR
L3 instruction cache reads
PAPI_L1_ICW
L1 instruction cache writes
PAPI_L2_ICW
L2 instruction cache writes
PAPI_L3_ICW
L3 instruction cache writes
PAPI_L1_TCH
L1 total cache hits
PAPI_L2_TCH
L2 total cache hits
PAPI_L3_TCH
L3 total cache hits
PAPI_L1_TCA
L1 total cache accesses
PAPI_L2_TCA
L2 total cache accesses
PAPI_L3_TCA
L3 total cache accesses
PAPI_L1_TCR
L1 total cache reads
PAPI_L2_TCR
L2 total cache reads
PAPI_L3_TCR
L3 total cache reads
PAPI_L1_TCW
L1 total cache writes
PAPI_L2_TCW
L2 total cache writes
PAPI_L3_TCW
L3 total cache writes
PAPI_FML_INS
FM ins
PAPI_FAD_INS
FA ins
PAPI_FDV_INS
FD ins
PAPI_FSQ_INS
FSq ins
PAPI_FNV_INS
Finv ins
For example to measure the floating point operations in routines using PCL,
% ./configure -pcl=/usr/local/packages/pcl-1.2
% setenv PCL_EVENT PCL_FP_INSTR
% mpirun -np 8 application
Table 2.2. Events measured by setting the environment variable PCL_EVENT in
TAU
PCL_EVENT
EVENT Measured
PCL_L1CACHE_READ
L1 (Level one) cache reads
PCL_L1CACHE_WRITE
L1 cache writes
PCL_L1CACHE_READWRITE
L1 cache reads and writes
PCL_L1CACHE_HIT
L1 cache hits
PCL_L1CACHE_MISS
L1 cache misses
PCL_L1DCACHE_READ
L1 data cache reads
19
TAU Instrumentation Options
PCL_EVENT
EVENT Measured
PCL_L1DCACHE_WRITE
L1 data cache writes
PCL_L1DCACHE_READWRITE
L1 data cache reads and writes
PCL_L1DCACHE_HIT
L1 data cache hits
PCL_L1DCACHE_MISS
L1 data cache misses
PCL_L1ICACHE_READ
L1 instruction cache reads
PCL_L1ICACHE_WRITE
L1 instruction cache writes
PCL_L1ICACHE_READWRITE
L1 instruction cache reads and writes
PCL_L1ICACHE_HIT
L1 instruction cache hits
PCL_L1ICACHE_MISS
L1 instruction cache misses
PCL_L2CACHE_READ
L2 (Level two) cache reads
PCL_L2CACHE_WRITE
L2 cache writes
PCL_L2CACHE_READWRITE
L2 cache reads and writes
PCL_L2CACHE_HIT
L2 cache hits
PCL_L2CACHE_MISS
L2 cache misses
PCL_L2DCACHE_READ
L2 data cache reads
PCL_L2DCACHE_WRITE
L2 data cache writes
PCL_L2DCACHE_READWRITE
L2 data cache reads and writes
PCL_L2DCACHE_HIT
L2 data cache hits
PCL_L2DCACHE_MISS
L2 data cache misses
PCL_L2ICACHE_READ
L2 instruction cache reads
PCL_L2ICACHE_WRITE
L2 instruction cache writes
PCL_L2ICACHE_READWRITE
L2 instruction cache reads and writes
PCL_L2ICACHE_HIT
L2 instruction cache hits
PCL_L2ICACHE_MISS
L2 instruction cache misses
PCL_TLB_HIT
TLB (Translation Lookaside Buffer) hits
PCL_TLB_MISS
TLB misses
PCL_ITLB_HIT
Instruction TLB hits
PCL_ITLB_MISS
Instruction TLB misses
PCL_DTLB_HIT
Data TLB hits
PCL_DTLB_MISS
Data TLB misses
PCL_CYCLES
Cycles
PCL_ELAPSED_CYCLES
Cycles elapsed
PCL_INTEGER_INSTR
Integer instructions executed
PCL_FP_INSTR
Floating point (FP) instructions executed
PCL_LOAD_INSTR
Load instructions executed
PCL_STORE_INSTR
Store instructions executed
PCL_LOADSTORE_INSTR
Loads and stores executed
PCL_INSTR
Instructions executed
PCL_JUMP_SUCCESS
Successful jumps executed
PCL_JUMP_UNSUCCESS
Unsuccessful jumps executed
PCL_JUMP
Jumps executed
20
TAU Instrumentation Options
PCL_EVENT
EVENT Measured
PCL_ATOMIC_SUCCESS
Successful atomic instructions executed
PCL_ATOMIC_UNSUCCESS
Unsuccessful atomic instructions executed
PCL_ATOMIC
Atomic instructions executed
PCL_STALL_INTEGER
Integer stalls
PCL_STALL_FP
Floating point stalls
PCL_STALL_JUMP
Jump stalls
PCL_STALL_LOAD
Load stalls
PCL_STALL_STORE
Store Stalls
PCL_STALL
Stalls
PCL_MFLOPS
Millions of floating point operations/second
PCL_IPC
Instructions executed per cycle
PCL_L1DCACHE_MISSRATE
Level 1 data cache miss rate
PCL_L2DCACHE_MISSRATE
Level 2 data cache miss rate
PCL_MEM_FP_RATIO
Ratio of memory accesses to FP operations
2.6. Using Hardware Performance Counters
While running the application, set the environment variable PCL_EVENT or TAU_METRICS , to specify which hardware performance counter TAU should use while profiling the application.
Note
By default, only one counter is tracked at a time. To track more than one counter use MULTIPLECOUNTERS. See ??? for more details.
To select floating point instructions for profiling using PAPI, you would:
%
%
%
%
%
configure -papi=/usr/local/packages/papi-3.5.0
make clean install
cd examples/papi
setenv TAU_METRICS PAPI_FP_INS
a.out
In addition to the following events, you can use native events (see papi_native) on a given CPU by setting TAU_ to PAPI_NATIVE_<event>. For example:
% setenv PAPI_NATIVE PAPI_NATIVE_PM_BIQ_IDU_FULL_CYC
% a.out
By default PAPI will profile events in all domains (users space, kernel, hypervisor, etc). You can restrict the set of domains for papi event profiling by using the TAU_PAPI_DOMAIN environment variable with these values (in a colon separated list, if desired): PAPI_DOM_USER,
PAPI_DOM_KERNEL, PAPI_DOM_SUPERVISOR, and PAPI_DOM_OTHER like thus:
21
TAU Instrumentation Options
% setenv TAU_PAPI_DOMAIN PAPI_DOM_SUPERVISOR:PAPI_DOM_OTHER
2.7. Profiling with PerfLib
This profiling option is currently under development at LANL.
To configure TAU with PerfLib use the following arguments:
%> configure -perflib=[path_to_perflib lib directory]
-perfinc=[path_to_perflib inc directory]
-perflibrary=[argument send to the linker if different than default]
After tau is build a new Makefile will be generated with *-perflib-* in its name, use this Makefile when
profiling applications with perflib.
After configuration and installation, toggle these three environment variables before running the application:
%>
%>
%>
%>
%>
export
export
export
export
export
PERF_PROFILE=1
PERF_PROFILE_MPI=1
PERF_PROFILE_MEMORY=1
PERF_PROFILE_COUNTERS=1
PERF_DATA_DIRECTORY=<directory>
We also provide a perf2tau conversion utilities to convert the remaining perflib profiles to regular tau
profiles. To use perf2tau set the environment variable perf_data_directory to the type of the
profiling to be converted (the directory where the data is store will be called something like
perf_data.[type]/). Or you may execute perf2tau with the type as an argument:
%> perf2tau [type]
See also the man page for perf2tau, perf2tau.
2.8. Running a Python application with TAU
TAU can automatically instrument all Python routines when the tau python package is imported. Add
<TAUROOT>/<ARCH>/lib/bindings-<options> to the PYTHONPATH environment variable in order
to use the TAU module.
To execute the program, tau.run routine is invoked with the name of the top level Python code. For e.g.,
#!/usr/bin/env python
import tau
from time import sleep
def f2():
print "Inside f2: sleeping for 2 secs..."
sleep(2)
def f1():
print "Inside f1, calling f2..."
22
TAU Instrumentation Options
f2()
def OurMain():
f1()
tau.run('OurMain()')
instruments routines OurMain(), f1() and f2() although there are no instrumentation calls in
the routines. To use this feature, TAU must be configured with the -pythoninc=<dir> option (and pythonlib=<dir> if running under IBM). Before running the application, the environment variable PYTHONPATH and LD_LIBRARY_PATH should be set to include the TAU library directory (where tau.py
is stored). Manual instrumentation of Python sources is also possible using the Python API and the pytau package. For e.g.,
#!/usr/bin/env python
import pytau
from time import sleep
x = pytau.profileTimer("A Sleep for excl 5 secs")
y = pytau.profileTimer("B Sleep for excl 2 secs")
pytau.start(x)
print "Sleeping for 5 secs ..."
sleep(5)
pytau.start(y)
print "Sleeping for 2 secs ..."
sleep(2)
pytau.stop(y)
pytau.dbDump()
pytau.stop(x)
shows how two timers x and y are created and used. Note, multiple timers can be nested, but not overlapping. Overlapping timers are detected by TAU at runtime and flagged with a warning (as exclusive
time is not defined when timers overlap).
2.9. pprof
pprof sorts and displays profile data generated by TAU. To view the profile, merely execute pprof in the
directory where profile files are located (or set the PROFILEDIR environment variable).
% pprof
Its usage is explained below:
usage: pprof [-c|-b|-m|-t|-e|-i] [-r] [-s] [-n num] [-f filename] \
[-l] [node numbers]
-c : Sort by number of Calls
-b : Sort by number of suBroutines called by a function
-m : Sort by Milliseconds (exclusive time total)
-t : Sort by Total milliseconds (inclusive time total) (DEFAULT)
-e : Sort by Exclusive time per call (msec/call)
-i : Sort by Inclusive time per call (total msec/call)
-v : Sort by standard deViation (excl usec)
-r : Reverse sorting order
23
TAU Instrumentation Options
-s
-n
-f
-p
-l
-d
: print only Summary profile information
num : print only first num functions
filename : specify full path and Filename without node ids
: suPpress conversion to hh:mm:ss:mmm format
: List all functions and exit
: Dump output format (for Racy) [node numbers] : prints only info about
all contexts/threads of given node numbers
node numbers : prints information about all contexts/threads
for specified nodes
2.10. Running a JAVA application with TAU
Java applications are profiled/traced using tau_java as shown below:
% cd tau/examples/java/pi
% setenv LD_LIBRARY_PATH $LD_LIBRARY_PATH:<tauroot>/<arch>/lib
% tau_java Pi
More information about tau_java can be found in the Tools section of the Reference Guide.
Running the application generates profile files with names having the
file.<node>.<context>.<thread>. These files can be analyzed using pprof or paraprof.
form
pro-
2.11. Using a tau.conf File
If a tau.conf file is created, then code that uses that TAU lib will effected by the settings in tau.conf. For
example, if a directory tau-2.21/tau_system_defaults is created and a tau.conf file is placed in it, TAU
will read that file before doing the measurements. A user of that TAU libs can choose to override the
contents of that file by placing a tau.conf in their own directory. But by default, if the sysadmin chooses
to create this dir, all the users of the TAU libs will be globally affected by this tau.conf.
For example, tau.conf could be:
% cat tau.conf
TAU_LOG_PATH=/soft/apps/tau/logs
PROFILEDIR=$TAU_LOG_DIR
TAU_PROFILE_FORMAT=merged
TAU_SUMMARY=1
TAU_IBM_BG_HWP_COUNTERS=1
TAU_TRACK_MESSAGE=1
Then anyone using TAU from that directory will get TAU_IBM_BG_HWP_COUNTERS=1,
TAU_TRACK_MESSAGE=1, etc.
2.12. Using Score-P with TAU
TAU can be configured to use the Score-P measurement infrastructure (www.score-p.org). To use
Score-P, configure TAU with -scorep= option to point TAU to the Score-P installation. (Please use
Score-P version 1.0 beta or above.) You may then instrument and run your application with TAU in a
manor of your choosing.
Set the environment variable SCOREP_PROFILING_FORMAT to TAU_SNAPSHOT to produce TAU
24
TAU Instrumentation Options
Snapshot files, which will be found in scorep*/tau/. Also, the Score-P library must be found in
LD_LIBRARY_PATH.
2.13. Using UPC with TAU
Please see examples/upc for more details.
To instrument Berkeley UPC with GASP, configure TAU with -upcnetwork=<option> /where option is "mpi" or "udp". Then use a selective instrumentation file like the one shown below.
BEGIN_INSTRUMENT_SECTION
forall routine="#"
loops routine="#"
barrier routine="#"
fence routine="#"
notify routine="#"
END_INSTRUMENT_SECTION
Then tau_upc.sh can be used to build the application. If "udp" is used with -upcnetwork, then upcrun can
be used to run the application. For "mpi", mpirun or a similar mechanism can be used.
To instrument UPC with Cray CCE compilers, the following will produce a configuration that supports
Cray UPC and may be used with tau_upc.sh
module load PrgEnv-cray
./configure -arch=craycnl -pdt=<dir> -pdt_c++=g++
TAU can also build the DMAPP wrapper using Cray CCE compilers. When the -optDMAPP option is
used when building the application with TAU using TAU_OPTIONS, DMAPP events are automatically
instrumented with tau_upc.sh.
25
Chapter 3. Tracing
3.1. How to configure tracing
TAU must be configured with the -TRACE option to generate event traces. This can be used in conjunction with -PROFILE to generate both profiles and traces. The traces are stored in a directory specified
by the environment variable TRACEDIR, or the current directory, by default. The environment variables
TAU_TRACEFILE may be used to specify the name of Vampir trace file. When this variable is set,
trace files are automatically merged and the tau2vtf is invoked to convert the merged trace file to VTF3
trace format. This conversion takes place on node 0, thread 0. The intermediate trace files are deleted.
To retain the trace files, the user can set the environment variable TAU_KEEP_TRACEFILES to true.
When TAU_TRACEFILE is not specified, the user needs to merge and convert the traces as below. Example:
%
%
%
%
./configure -arch=sgi64 -TRACE -mpi -vtf=/usr/local/vtf3-1.34 -slog2
make clean; make install
setenv TRACEDIR /users/sameer/tracedata/experiment56
mpirun -np 4 matrix
This generates files named
tautrace.<node>.<context>.<thread>.trc and events.<node>.edf
When generating a Vampir Trace Format (otf or vtf) these environment variables maybe helpful:
•
VT_FILE_PREFIXPrefix used for trace filenames. Default is "a".
•
VT_COMPRESSIONWrite compressed trace files? Default is "yes"
Using the utility tau_treemerge.pl, these traces are then merged as shown below:
% tau_treemerge.pl
This generates tau.trc as the merged trace file and tau.edf as the merged event description file.
tau_treemerge.pl can take an optional argument (with -n <value>) to specify the maximum number of
trace files to merge in each invocation of tau_merge. If we need to merge 2000 trace files and if the
maximum number of open files specified by unix is 250, tau_treemerge.pl will incrementally merge the
trace files so as not to exceed the number of open file descriptors. This is important for the IBM BlueGene/L machine where such restrictions are present on the front-end node.
To convert merged or per-thread traces to another trace format, the utilities, tau2otf, tau_convert,
tau2vtf, or tau2slog2 are used as shown below:
Usage: tau2otf [ -n streams ] [ -nomessage ] [ -v ] [ -z ]
-n streams : Specifies the number of output streams (default is 1)
-nomessage : Suppresses printing of message information in the trace
26
Tracing
-v
: Verbose mode sends trace event descriptions to the standard output
as they are converted
-z
: Compressed output
Here is an example:
%> tau2otf tau.trc tau.edf out.otf
Converting to Vampir's VTF format:
% tau2vtf
Usage: tau2vtf <TAU trace> <edf file> <out file> [-a|-fa]
[-nomessage] [-v]
-a
: ASCII VTF3 file format
-fa
: FAST ASCII VTF3 file format
-nomessage : Suppress printing of message information in the trace
-v
: Verbose
Default trace format of <out file> is VTF3 binary
e.g.,
tau2vtf merged.trc tau.edf app.vpt.gz
% tau2vtf matrix.trc tau.edf matrix.vpt.gz
% vampir matrix.vpt.gz
To generate slog2 trace files that may be visualized using Jumpshot, we recommend using the slog2
SDK and Jumpshot bundled with TAU.
% configure -slog2 -TRACE ...
% tau2slog2
tau2slog2 converts a TAU formatted trace file to the SLOG2 format
for Jumpshot trace visualizer
Usage: tau2slog2 <tau_tracefile> <edf_file> -o <slog_tracefile>
For e.g.,
% tau2slog2 app.trc tau.edf -o app.slog2
To generate traces that may be visualized using Vampir, we recommend using tau2vtf over the older
tau_convert tool. tau2vtf can produce binary traces with user-defined events (hardware performance
counters from PAPI etc.) while tau_convert cannot do this. Binary traces load faster in Vampir.
% tau_convert
usage: tau_convert [-alog | -SDDF | -dump | -paraver [-t] | -pv |
-vampir [-longsymbolbugfix] [-compact] [-user|-class|-all]
[-nocomm]] inputtrc edffile [outputtrc]
Note: -vampir option assumes multiple threads/node
Note: -t option used in conjunction with -paraver option assumes
multiple threads/node
To view the dump of the trace in text form, use
% tau_convert -dump matrix.trc tau.edf
27
Tracing
tau_convert can also be used to convert traces to the Vampir [http://www.vampir-ng.de/] trace format.
For single-threaded applications (such as the MPI application above), the -pv option is used to generate
Vampir traces as follows:
% tau_convert -pv matrix.trc tau.edf matrix.pv
% vampir matrix.vpt.gz &
To convert TAU traces to SDDF or ALOG trace formats, -SDDF and -alog options may be used. When
multiple threads are used on a node (as with -jdk, -pthread or -tulipthread options during
configure), the -vampir option is used to convert the traces to the vampir trace format, as shown below:
% tau_convert -vampir smartsapp.trc tau.edf smartsapp.pv
% vampir smartsapp.pv &
To convert to the Paraver trace format, use the -paraver option for single threaded programs and paraver -t option for multi-threaded programs.
NOTE: To ensure that inter-process communication events are recorded in the traces, in addition to the
routine transitions, it is necessary to insert TAU_TRACE_SENDMSG and TAU_TRACE_RECVMSG
macro calls in the source code during instrumentation. This is not needed when the TAU MPI wrapper
library is used.
Vampir format traces may be converted to TAU profiles using the vtf2profile tool.
% vtf2profile -f matrix.vpt.gz -p profiledatadir
% vtf2profile
Usage: vtf2profile [options]
***************************HELP***************************
* '-h' display this help text.
*
* '-c' open command line interface.
*
* '-f' used as -f <VTF File> where
*
*
VTF File is the name of the trace file
*
*
to be converted to TAU profiles.
*
* '-p' used as -p <path> where 'path' is the relative *
*
path to the directory where profiles are to
*
*
stored.
*
* '-i' used as -i <from> <to> where 'from' and 'to' are*
*
integers to mark the desired profiling interval.*
**********************************************************
28
Chapter 4. TAU Memory Profiling
Tutorial
4.1. TAU's memory API options
TAU can evaluate the following memory events:
1.
Memory utilization options that examine how much heap memory is currently used, and
2.
Memory headroom evaluation options that examine how much a program can grow (or how much
headroom it has) before it runs out of free memory on the heap. During memory headroom evaluation TAU tries to call malloc with chunks that progressively increase in size, until all memory is
exhausted. Then it frees those chunks, keeping track of how much memory it successfully allocated.
3.
Memory leaks in C/C++ programs TAU will track malloc through the execuation issuing user event
when the program fails to the allocated memory.
4.2. Using tau_exec
The tau_exec command allow you to track these memory events with either an instrumented or uninstrumented binary. If you want to instead track memory usage in select locations in the source code consider
the TAU API calls below.
4.3. Evaluating Memory Utilization
4.3.1. TAU_TRACK_MEMORY
When TAU_TRACK_MEMORY is called an interrupt is generated every 10 seconds and the memory
event is triggered with the current value. This interrupt interval can be changed by calling
TAU_SET_INTERRUPT_INTERVAL(value). The tracking of memory events in both cases can be
explictly enabled or disabled by calling the macros TAU_ENABLE_TRACKING_MEMORY() or
TAU_DISABLE_TRACKING_MEMORY() respectively.
TAU_TRACK_MEMORY() can be inserted into the source code:
int main(int argc, char **argv)
{
TAU_PROFILE("main()", " ", TAU_DEFAULT);
TAU_PROFILE_SET_NODE(0);
TAU_TRACK_MEMORY();
sleep(12);
int *x = new int[5*1024*1024];
sleep(12);
return 0;
29
TAU Memory Profiling Tutorial
}
Resulting profile data:
USER EVENTS Profile :NODE 0, CONTEXT 0, THREAD 0
----------------------------------------------------------------------------------NumSamples
MaxValue
MinValue MeanValue Std. Dev. Event Name
----------------------------------------------------------------------------------2 2.049E+04
2.891 1.024E+04 1.024E+04 Memory Utilization
(heap, in KB)
-----------------------------------------------------------------------------------
4.3.2. TAU_TRACK_MEMORY_HERE
Triggers memory tracking at a given execution point. For example:
int main(int argc, char **argv) {
TAU_PROFILE("main()", " ", TAU_DEFAULT);
TAU_PROFILE_SET_NODE(0);
TAU_TRACK_MEMORY_HERE();
int *x = new int[5*1024*1024];
TAU_TRACK_MEMORY_HERE();
return 0;
}
Here is the resulting profile:
USER EVENTS Profile :NODE 0, CONTEXT 0, THREAD 0
----------------------------------------------------------------------------------NumSamples
MaxValue
MinValue MeanValue Std. Dev. Event Name
----------------------------------------------------------------------------------2 2.049E+04
2.891 1.024E+04 1.024E+04 Memory Utilization
(heap, in KB)
-----------------------------------------------------------------------------------
4.3.3. TAU_TRACK_MEMORY_FOOTPRINT
Similar to TAU_TRACK_MEMORY but uses the Virtual Memory Resident Set Size (VmRSS) and
High Water Mark (VmHWM) to produce an interval event and an atomic event respectively.
4.3.4. TAU_TRACK_MEMORY_FOOTPRINT_HERE
Similar to TAU_TRACK_MEMORY_HERE but uses the Virtual Memory Resident Set Size (VmRSS)
and High Water Mark (VmHWM) to produce an interval event and an atomic event respectively.
4.3.5. -PROFILEMEMORY
Specifies tracking heap memory utilization for each instrumented function. When any function entry
takes place, a sample of the heap memory used is taken. This data is stored as user-defined event data in
profiles/traces.
30
TAU Memory Profiling Tutorial
4.4. Evaluating Memory Headroom
4.4.1. TAU_TRACK_MEMORY_HEADROOM()
This call sets up a signal handler that is invoked every 10 seconds by an interrupt. Inside, it evaluates
how much memory it can allocate and associates it with the callstack. The user can vary the size of the
callstack by setting the environment variable TAU_CALLSTACK_DEPTH (default is 2). The examples/
headroom/track subdirectory has an example that illustrates the use of this call. To disable tracking this
headroom at runtime, the user may call: TAU_DISABLE_TRACKING_MEMORY_HEADROOM() and
call TAU_ENABLE_TRACKING_MEMORY_HEADROOM() to re-enable tracking of the headroom. To
set a different interrupt interval, call TAU_SET_INTERRUPT_INTERVAL(value) where value (in
seconds) represents the inter-interrupt interval.
A sample profile generated has:
USER EVENTS Profile :NODE 0, CONTEXT 0, THREAD 0
----------------------------------------------------------------------------------NumSamples
MaxValue
MinValue MeanValue Std. Dev. Event Name
----------------------------------------------------------------------------------3
4067
4061
4065
2.828 Memory Headroom Left (in
MB)
3
4067
4061
4065
2.828 Memory Headroom
Left (in MB) : void quicksort(int *, int, int)
=> void
quicksort(int *, int, int)
--------------------------------------------------------------------------------
4.4.2. TAU_TRACK_MEMORY_HEADROOM_HERE()
Sometimes it is useful to track the memory available at a certain point in the program, rather than rely on
an interrupt. TAU_TRACK_MEMORY_HEADROOM_HERE() allows us to examine the memory available
at a particular location in the source code and associate it with the currently executing callstack. The examples/headroom/here subdirectory has an example that illustrates this usage.
ary = new double [1024*1024*50];
TAU_TRACK_MEMORY_HEADROOM_HERE(); /* takes a sample here!
sleep(1);
*/
A sample profile looks like this:
USER EVENTS Profile :NODE 0, CONTEXT 0, THREAD 0
----------------------------------------------------------------------------------NumSamples
MaxValue
MinValue MeanValue Std. Dev. Event Name
----------------------------------------------------------------------------------3
3672
3672
3672
0 Memory Headroom Left (in
MB)
1
3672
3672
3672
0 Memory Headroom
Left (in MB) : main() (calls f1, f5
calls f2, f4)
1
3672
3672
3672
0 Memory
Headroom Left (in MB) : main() (cal
(sleeps 1 sec, calls f2, f4) => f4(
calls f2)
1
3672
3672
3672
0 Memory Headroom Le
(in MB) : main() (calls f1, f5) =>
----------------------------------------------------------------------------------31
TAU Memory Profiling Tutorial
4.4.3. -PROFILEHEADROOM
Similar to the -PROFILEMEMORY configuration option that takes a sample of the memory utilization
at each function entry, we now have -PROFILEHEADROOM. In this -PROFILEHEADROOM option, a
sample is taken at instrumented function's entry and associated with the function name. This option is
meant to be used as a debugging aid due the high cost associated with executing a series of malloc calls.
The cost was 106 microseconds on an IBM BG/L (700 MHz CPU). To use this option, simply configure
TAU with the -PROFILEHEADROOM option and choose any method for instrumentation (PDT, MPI,
hand instrumentation). You do not need to annotate the source code in any special way (as is required
for 2a and 2b). The examples/headroom/available subdirectory has a simple example that produces the
following profile when TAU is configured with the -PROFILEHEADROOM option.
USER EVENTS Profile :NODE 0, CONTEXT 0, THREAD 0
----------------------------------------------------------------------------------NumSamples
MaxValue
MinValue MeanValue Std. Dev. Event Name
----------------------------------------------------------------------------------1
4071
4071
4071
0 f1() (sleeps 1 sec,
calls f2, f4) - Memory Headroom Available (MB)
2
3671
3671
3671
0 f2() (sleeps 2
sec, calls f3) - Memory Headroom Available (MB)
2
3671
3671
3671
0 f3() (sleeps 3 sec) Memory Headroom Available (MB)
1
3671
3671
3671
0 f4() (sleeps 4 sec,
calls f2) - Memory Headroom Available (MB)
1
3671
3671
3671
0 f5() (sleeps 5 sec) Memory Headroom Available (MB)
1
4071
4071
4071
0 main() (calls f1, f5)
- Memory Headroom Available (MB)
-----------------------------------------------------------------------------------
4.5. DetectingMemoryLeaks
TAU's memory leak detection feature can be initiated by giving tau_compiler.sh the option optDetectMemoryLeaks. For a demonstration consider this C++ program:
#include <stdio.h>
#include <malloc.h>
/* there is a memory leak in bar when it is invoked with 5 < value <= 15 */
int bar(int value)
{
printf("Inside bar: %d\n", value);
int *x;
if (value > 5)
{
printf("looks like it came here from g!\n");
x = (int *) malloc(sizeof(int) * value);
x[2]= 2;
/* do not free it! create a memory leak, unless the value is > 15 */
if (value > 15) free(x);
}
else
32
TAU Memory Profiling Tutorial
{ /* value <=5 no leak */
printf("looks like it came here from foo!\n");
x = (int *) malloc(sizeof(int) * 45);
x[23]= 2;
free(x);
}
return 0;
}
int g(int value)
{
printf("Inside g: %d\n", value);
return bar(value);
}
int foo(int value)
{
printf("Inside f: %d\n", value);
if (value > 5) g(value);
else bar(value);
return 0;
}
int main(int argc, char **argv)
{
int *x;
int *y;
printf ("Inside main\n");
foo(12);
foo(20);
foo(2);
foo(13);
/*
/*
/*
/*
leak */
no leak */
no leak */
leak */
}
Notice that bar fails to free allocated memory on input between 5 and 15 and that foo will call g that
calls bar when the input to foo is greater than 5.
Now configuring TAU with -PROFILECALLPATH run the file by:
%> cd examples/memoryleakdetect/
%> make
%> ./simple
...
USER EVENTS Profile :NODE 0, CONTEXT 0, THREAD 0
----------------------------------------------------------------------------------NumSamples
MaxValue
MinValue MeanValue Std. Dev. Event Name
----------------------------------------------------------------------------------2
52
48
50
2 MEMORY LEAK! malloc size <f
1
80
80
80
0 free size <file=simple.inst
1
80
80
80
0 free size <file=simple.inst
1
180
180
180
0 free size <file=simple.inst
1
180
180
180
0 free size <file=simple.inst
3
80
48
60
14.24 malloc size <file=simple.in
3
80
48
60
14.24 malloc size <file=simple.in
1
180
180
180
0 malloc size <file=simple.in
1
180
180
180
0 malloc size <file=simple.in
----------------------------------------------------------------------------------Notice that the first row show the two Memory leaks along with the callpath tracing where the unalloc33
TAU Memory Profiling Tutorial
ated memory was requested.
4.6. Memory Tracking In Fortran
To profile memory usage in Fortran 90 use TAU's ability to selectively instrument a program. The option -optTauSelectFile=<file> for tau_compilier.sh let you specify a selective instrumentation
file which defines regions of the source code to instrument.
To begin memory profiling, state which file/routines to profile by typing:
BEGIN_INSTRUMENT_SECTION
memory file="memory.f90" routine="INIT"
END_INSTRUMENT_SECTION
Wildcard can be used to instrument multiple routines. For file names * character can be used to specify
any number of character, thus foo* matches foobar, foo2, etc. also for file names ? can match a single
charater, ie. foo? matches foo2, fooZ, but not foobar. You can use # as a wildcard for routines, ie. b#
matches bar, b2z etc.
Memory Profile in Fortran gives you these three metrics:
•
Total size of memory for each malloc and free in the source code.
•
The callpath for each occurrence of malloc or free.
•
A list of all variable that were not deallocated in the source code.
Note
Due to the limitations of the xlf compiler, The size of the memory reported for Fortran
Array (compilied with xlf) is not the number of bytes but the number of elements.
Here is the profile for the example/memoryleakdetect/f90/foo.f90 file.
%> pprof
..
----------------------------------------------------------------------------------NumSamples
MaxValue
MinValue MeanValue Std. Dev. Event Name
----------------------------------------------------------------------------------1
16
16
16
0 MEMORY LEAK! malloc size <f
2
52
48
50
2 MEMORY LEAK! malloc size <f
1
80
80
80
0 free size <file=foo.f90, va
1
80
80
80
0 free size <file=foo.f90, va
1
180
180
180
0 free size <file=foo.f90, va
1
180
180
180
0 free size <file=foo.f90, va
1
180
180
180
0 malloc size <file=foo.f90,
1
180
180
180
0 malloc size <file=foo.f90,
4
80
16
49
22.69 malloc size <file=foo.f90,
1
16
16
16
0 malloc size <file=foo.f90,
3
80
48
60
14.24 malloc size <file=foo.f90,
-----------------------------------------------------------------------------------
34
Chapter 5. Eclipse Tau Java System
5.1. Installation
Copy the plugins directory in the tau2/tools/src/taujava directory to the location of your eclipse installation. You may have to restart eclipse if it is running when this is done.
In eclipse go to the Window menu, select Preferences and go to the TauJava Preferences section. Enter
the location of the lib directory in the tau installation for your architecture in the Tau Library Directory
field. Other options may also be selected at this time.
Figure 5.1. TAUJava Options Screen
5.2. Instrumentation
Java programs can be instrumented at the level of full Java projects, packages or individual Java files.
From within the Java view simply right click on the element in the package explorer that you wish to instrument select the Tau pop up menu and click on Instrument Project, Package or Java respectively.
Figure 5.2. TAUJava Project Instrumentation
35
Eclipse Tau Java System
Note that the instrumenter will add the TAU.jar file to the project's class-path the first time any element
is instrumented.
Do not perform multiple instrumentations of the same Java file. Do not edit the comments added by the
instrumenter or adjust the white space around them. Doing so may prevent the uninstrumenter from
working properly.
5.3. Uninstrumentation
Uninstrumenting a Java project, package or file works just like instrumenting. Just select the uninstrument option instead. Note that the uninstrumenter only removes TAU instrumentation as formatted and
commented by the instrumenter. Running the uninstrumenter on code with no TAU instrumentation
present has no effect.
36
Eclipse Tau Java System
5.4. Running Java with TAU
To automatically analyze your instrumented project on a Unix-based system TAU must first be configured with the -JDK option, and any other options you want applied to your trace output. On windows
the type of analysis to be conducted, Profile, Call path or Trace, should be selected from the Window,
Preferences TauJava Preferences menu.
Once that has been accomplished, right click on the Java file containing the main method you want to
run, go to the TAU menu and click on Run Tau-Instrumented Java. The program will run and, by default, the profile and/or trace files will be placed in a timestamped directory, inside a directory indicating
the name of the file that was run, in the TAU_Output directory in the home directory of the Java project.
Figure 5.3. TAUJava Running
37
Eclipse Tau Java System
5.5. Options
The following options are accessible from the Window, Preferences TAUJava Preferences menu.
Use Alternative TAU Output Directory: Causes the TAU_Output directory to be placed in the location
specified in the associated field. The internal directory structure of the TAU_Output directory remains
unchanged.
Automatically run ParaProf on profile output?: Causes the TAU profile viewer, paraprof, to run on the
output of profile and call-path analysis output as soon as the trace files have been produced.
Enable selective instrumentation: Causes Java elements specified in the given selection file to be included or excluded from instrumentation. By default all packages files and methods are included. The
file should conform to the TAU file selection format described here.
# Any line beginning with a # is a comment and will be disregarded.
#
# If an entry is both included and excluded inclusion will take precedence.
#
# Entries in INCLUDE or EXCLUDE lists may use * as a wildcard character.
#
# If an EXCLUDE_LIST is specified, the methods in the list will not be
# instrumented.
#
BEGIN_EXCLUDE_LIST
*main*
END_EXCLUDE_LIST
#
# If an INCLUDE_LIST is specified, only the methods in the list will be
# instrumented.
#
BEGIN_INCLUDE_LIST
*get*
*set*
END_INCLUDE_LIST
#
# TAU also accepts FILE_INCLUDE/EXCLUDE lists. These may be specified with
# the wildcard character # to exclude/include multiple files.
# These options may be used in conjunction with the routine INCLUDE/EXCLUDE
# lists as shown above.
#
BEGIN_FILE_INCLUDE_LIST
foo.java
hello#.java
END_FILE_INCLUDE_LIST
#
BEGIN_FILE_EXCLUDE_LIST
bar.java
END_FILE_EXCLUDE_LIST
# Note that the order of the individual sections does not matter
# and not all of the sections need to be included. Each section
# must be closed.
38
Chapter 6. Eclipse PTP / CDT plug-in
System
6.1. Installation
Be
certain
that
the
PTP
[http://www.eclipse.org/ptp/downloads.php]/CDT
[http://www.eclipse.org/cdt/downloads.php]/Photran
[http://www.eclipse.org/photran/download.php]
plug-ins are installed and running properly in your eclipse installation. Use Tau's perfdmf_configure
utility to set up a performance database for Eclipse to store profile output.
Run the install_plug-ins.sh script located in [tau installation]/tools/src/eclipse with
the
location
of
your
eclipse
installation.
e.g:
~/tau2/tools/src/eclipse/install_plug-ins.sh /opt/eclipse
Restart eclipse with the -clean flag after installing the plugins.
Note
By default Eclipse will detect the presence of TAU on your system and configure itself appropriately so long as the TAU bin directory is in your path. Only if this fails will you need
to setup the TAU preferences manually.
In eclipse go to the Window menu, select Preferences and go to the Performance Tools preferences section and the Tool Configuration subsection. If the PTP is available the Performance Tools section will
be under the PTP menu. Enter the location of the desired TAU bin directory in your in the tau Bin Directory field.
Figure 6.1. TAU Setup
6.2. Creating a Tau Launch Configuration
39
Eclipse PTP / CDT plug-in System
To create a TAU launch configuration, click the profile button added near the run and debug buttons.
This will provide an interface for launching either a standard or parallel C, C++ or Fortran application,
similar to the interface provided by the standard run configuration dialog. You may select a pre-existing
run configuration or create a new one in the usual way.
Figure 6.2. TAU Launch Configuration
The run configuration options are equivalent to those of a standard run configuration, with the addition
of a performance analysis tab a parametric study tab and a TAU tab. To run an application with TAU
first make sure that the TAU option is selected in the drop down box on the performance analysis tab.
You may also specify that a Tau instrumented executable should not be run after it is built. This option
will leave a new TAU specific build configuration available for your use. It will have the name of the
original build configuration, with the tau configuration options used appended. The executables available in such build configurations can be run through the standard run and debug launch configurations.
This option can be useful if you need to launch Tau instrumented binaries outside of eclipse. There is
also an option to select existing performance data. This will upload data specified on the filesystem to a
selected database, rather than generating the data from a project in Eclipse.
On the TAU tab you must select a Tau makefile from the available makefiles in the Tau architecture directory you specified. You may select specific configuration options to narrow the list of makefiles in the
dropdown box. Only makefiles configured with the -pdt option will be listed. Additional Tau compiler
options are provided on the Tau Compiler sub-tab.
If you select a makefile with the PAPI counter library and -MULTIPLECOUNTERS enabled you may
specify the PAPI environment variables using the Select PAPI Counters button. The counters you select
will be placed in the environment variables list for your run configuration.
You may specify the use of TAU selective instrumentation either by selecting a pre-defined selective instrumentation file, by selecting the internal option to have Tau to use a file generated by the selective instrumentation commands available in the Eclipse workspace or by selecting the automatic option to have
eclipse generate a selective instrumentation file using TAU's tau_reduce utility. Note that the automatic
option will cause your project to be rebuilt and run twice.
40
Eclipse PTP / CDT plug-in System
By default TAU profile data will only be stored in a perfdmf database, if available. The database may be
selected on the Data Collection sub-tab. You may specify that performance data should be kept on the
file-system with the Keep Profiles option.
If you wish to collect the resulting profile data on TAU's online Portal [http://tau.nic.uoregon.edu],
check the "Upload profile data to TAU Portal" box. After the profiling has finished you will be prompted to provide your user name, password and specify the destination workspace. To view the profile data
log on to the portal and select the specified workspace.
6.3. Selective Instrumentation
C, C++ and Fortran programs have several selective instrumentation options in Eclipse. The selective instrumentation sub-menu of the right click menu provided by C/C++ and Fortran projects, source files
and routines in the C/C++ and program outline views allows inclusion, exclusion and loop level instrumentation to be specified for each of these objects. You may also clear instrumentation specified for
each of these levels from the selective instrumentation menu.
The source editor's context menu allows the insertion of interval and atomic user defined events. To specify an atomic user defined event, place the cursor on the line where you want the event to trigger, right
click, go to the Selective Instrumentation sub-menu and select Insert TAU Atomic User Defined Event.
Put the name you wish to associate with the event in the first context window that appears. Put either a
numeric constant or the name of a valid numeric variable in the second window.
Figure 6.3. Optional User Defined Events
To specify an interval based user defined event, select the source code you wish to be included in the interval, right click, go to the Selective Instrumentation sub-menu and select Insert TAU Interval
(start/stop) User Defined Event. You may select use of a Static Timer, Dynamic Timer, Static Phase or
Dynamic Phase event. Note that to get phase data you must select a Tau makefile configured with the PROFILEPHASE option. Once you have selected the event type you will be prompted to enter a name
for the event.
Figure 6.4. Adding User Defined Events
41
Eclipse PTP / CDT plug-in System
All selective instrumentation options are placed in the tau.selective file in your project's main directory.
This file is automatically employed when the Tau launch configuration has "internal" selective instrumentation selected. You may safely edit this file manually so long as it remains a valid Tau selective instrumentation file.
6.4. Launching a Program and Collecting Data
To launch your project with Tau either select the Profile button from the profile launch configuration
window, select your launch configuration from the dropdown menu of the profile button or, if your desired configuration is already selected, simply click on the profile button.
If a perfdmf database is configured and available, Tau profile data will be saved there. Trace data and
other performance data output will be stored in your project's top level directory. If a perfdmf database
is not available or you have selected to save profile data on the file system profile output will appear in a
Profiles directory in your project's top level directory. Profiles are organized in sub-directories by the
Tau configuration options used to generate them and the time-stamp of their creation.
42
Chapter 7. Tools
43
Tools
Name
tau_compiler.sh -- Instrumenting source files.
tau_compiler.sh [ -p profile ] [-optVerbose ] [-optMemDbg ] [optDetectMemoryLeaks ] [-optPdtDir=dir ] [-optPdtF95Opts=opts ] [-optPdtF95Reset=opts ] [-optPdtCOpts=opts ] [-optPdtCReset=opts ] [optPdtCxxOpts=opts ] [-optPdtCReset=opts ] [-optPdtF90Parser=parser ] [optPdtCxxParser=parser ] [-optGnuFortranParser ] [-optGnuCleanscapeParser ]
[-optPdtUser=opts ] [-optTauInstr=path ] [-optContinueBeforeOMP ] [optIncludeMemory ] [-optTrackUPCR ] [-optTrackDMAPP ] [-optTrackPthread ] [optNoTrackGOMP ] [-optTrackMPCThread ] [-optPreProcess ] [-optCPP=path ] [optCPPOpts=options
]
[-optFPP=path
]
[-optFPPOpts=options
]
[-optCPPReset=options ] [-optTauSelectFile=file ] [ -optPDBFile=file ] [ optTau=opts
]
[
-optCompile=opts
]
[
-optTauDefs=opts
]
[
-optTauIncludes=opts ] [ -optReset=opts ] [ -optLinking=opts ] [ optLinkReset=opts ] [ -optLinkPreserveLib=opts ] [ -optTauCC=cc ] [ optUseReturnFix ] [ -optLinkOnly ] [ -optOpariTool=path/opari ] [ optOpariDir=path ] [ -optOpariOpts=opts ] [ -optOpariReset=opts ] [ optOpariLibs=opts
]
[
-optOpari2Tool=path/opari2
]
[
-optOpari2ConfigTool=path/opari2_config ] [ -optOpari2Dir=path ] [ optOpari2Opts=opts ] [ -optOpari2Reset=opts ] [ -optOpariNoInit ] [ -optNoMpi
] [ -optMpi ] [ -optNoRevert ] [ -optRevert ] [ -optKeepFiles ] [-optAppC ] [optAppCXX ] [-optAppF90 ] [-optShared ] [-optCompInst ] [-optPDTInst ] [optDisableHeaderInst
]
{
compiler
}
[
compiler_options
]
[
-optTauWrapFile=filename ]
Description
The TAU Compiler provides a simple way to automatically instrument an entire project. The TAU Compiler can be used on C, C++, fixed form Fortran, and free form Fortran.
Options
-optVerbose Turn on verbose debugging messages.
-optMemDbg Enable TAU's runtime memory debugger.
-optDetectMemoryLeaks Instructs TAU to detect any memory leaks in C/C++ programs.TAU
then tracks the source location of the memory leak as wellas the place in the callstack where the memory
allocation wasmade.
-optPdtDir=<dir> The PDT architecture directory. Typically $(PDTDIR)/$(PDTARCHDIR).
-optPdtF95Opts=<opts> Options for Fortran parser in PDT (f95parse).
-optPdtF95Reset=<opts> Reset options to the Fortran parser to the given list.
-optPdtCOpts=<opts> Options for C parser in PDT (cparse). Typically $(TAU_MPI_INCLUDE)
$(TAU_INCLUDE) $(TAU_DEFS).
-optPdtCReset=<opts> Reset options to the C parser to the given list
-optPdtCxxOpts=<opts> Options for C++ parser in
$(TAU_MPI_INCLUDE) $(TAU_INCLUDE) $(TAU_DEFS).
PDT
(cxxparse).
-optPdtCxxReset=<opts> Reset options to the C++ parser to the given list
44
Typically
Tools
-optPdtF90Parser=<parser> Specify a different Fortran parser. For e.g., f90parse instead of
f95parse.
-optPdtCxxParser=<parser> Specify a different C++ parser. For e.g., cxxparse401 instead
of cxxparse.
-optGnuFortranParser=<parser> Specify the GNU gfortran Fortran parser gfparseinstead of f95parse
-optGnuCleanscapeParser Uses the Cleanscape Fortran parser f95parseinstead of GNU's
gfparse
-optPdtUser=<opts> Optional arguments for parsing source code.
-optTauInstr=<path>
Specify
location
of
tau_instrumentor.
$(TAUROOT)/$(CONFIG_ARCH)/bin/tau_instrumentor.
Typically
-optContinueBeforeOMP Insert a CONTINUE statement before !$OMP directives.
-optIncludeMemory Forinteral use only
-optTrackUPCR Adds tracking of the UPC runtime library.
-optTrackDMAPP Specify wrapping of Pthread library calls at link time.
-optTrackPthread Adds tracking of the UPC runtime library.
-optNoTrackGOMP Disable wrapping of GOMP library calls at link time
-optTrackMPCThread Specify wrapping of MPC Thread library calls at link time.
-optPreProcess Preprocess the source code before parsing. Uses /usr/bin/cpp-P by default.
-optCPP=<path> Specify an alternative preprocessor and pre-process the sources.
-optCPPOpts=<options> Specify additional options to the C pre-processor.
-optCPPReset=<options> ResetC preprocessor options to the specified list.
-optFPP=<path> Specify an alternative preprocessor and pre-process for Fortran sources.
-optFPPOpts=<options> Specify additional options to the Fortran pre-processor.
-optTauSelectFile=<file> Specify selective instrumentation file for tau_instrumentor
-optPDBFile=<file> Specify PDB file for tau_instrumentor. Skips parsing stage.
-optTau=<opts> Specify options for tau_instrumentor.
-optCompile=<opts> Options passed to the compiler. Typically $(TAU_MPI_INCLUDE)
$(TAU_INCLUDE) $(TAU_DEFS) .
-optTauDefs=<opts> Options passed to the compiler by TAU. Typically $(TAU_DEFS) .
-optTauIncludes=<opts> Options passed
$(TAU_MPI_INCLUDE) $(TAU_INCLUDE) .
to
the
compiler
by
TAU.
Typically
-optReset=<opts> Reset options to the compiler to the given list
-optLinking=<opts>
Options
passed
45
to
the
linker.
Typically
$(TAU_MPI_FLIBS)
Tools
$(TAU_LIBS) $(TAU_CXXLIBS) .
-optLinkReset=<opts> Reset options to the linker to the given list.
-optLinkPreserveLib=<opts> Libraries which TAU should preserve the order of on the link
line see "Moving these libraries to the end of the link line:". Default: none.
-optTauCC=<cc> Specifies the C compiler used by TAU.
-optUseReturnFix Specifies the use of a bug fix with ROSE parser using EDG v3.x
-optLinkOnly Disable instrumentation during compilation, do link in the TAU libs
-optOpariTool=<path/opari> Specifies the location of the Opari tool.
-optOpariDir=<path> Specifies the location of the Opari directory.
-optOpariOpts=<opts> Specifies optional arguments to the Opari tool.
-optOpariNoInit Do not initlize the POMP2 regions.
-optOpariReset=<opts> Resets options passed to the Opari tool.
-optOpariLibs=<> Specifies the libraries that have POMP2 regions. (Overrides optOpariNoInit).
-optOpari2Tool=<path to opari2> Specifies the location of the Opari tool.
-optOpari2ConfigTool=<path/opari2-config> Specifies the location of the Opari tool
configuration file
-optOpari2Opts=<opts> Specifies optional arguments to the Opari tool.
-optOpari2Reset=<opts> Resets options passed to the Opari tool.
-optOpari2Dirs=<opts> Specifies the location of the Opari directory
-optNoMpi Removes -l*mpi* libraries during linking (default).
-optMpi Does not remove -l*mpi* libraries during linking.
-optNoRevert Exit on error. THIS IS CRAZY Does not revert to the original compilation rule on error.
-optRevert Revert to the original compilation rule on error (default).
-optKeepFiles Does not remove intermediate .pdb and .inst.* files.
-optReuseFiles Reuses a pre-instrumented file and preserves them.
-optAppCC Sets the failsafe C compiler.
-optAppCXX Sets the failsafe C++ compiler.
-optAppF90 Sets the failsafe F90 compiler
-optShared Use shared library version of TAU
-optCompInst Use compiler-based instrumentation
-optNoCompInst Do not revert to compiler instrumentation if source instrumentation fails.
46
Tools
-optPDTInst Use PDT-based instrumentation
-optHeaderInst Enable instrumentation of headers
-optDisableHeaderInst Disable instrumentation of headers
-optTrackIO Specify wrapping of POSIX I/O calls at link time.
-optMICOffload Links code for Intel MIC offloading, requires both host and MIC TAU libraries
-optWrappersDir="" Specify the location of the link wrappers directory.
-optTauUseCXXForC Specifies the use of a C++ compiler for compiling C code
-optTauWrapFile=<filename> Specify path to the link_options.tau file generated by tau_wrap
-optFixHashIf
47
Tools
Name
vtf2profile -- Generate a TAU profile set from a vampir trace file
vtf2profile [ -p profile ] [ -i interval_start interval_end ] [ -c ] [ -h ] { -f
tracefile }
Description
vtf2profile is created when TAU is configured with the -vtf=<vtf_dir> option. This tool converts a VTF
trace file (*.vpt) to a tau profile set (profile.A.B.C where A, B and C are the node, context and thread
numbers respectively).
The vtf file to be read is specified in the command line by the -f flag followed by the file's location. The
VTF tracefile specified may be in gzipped form, eg app.vpt.gz. -p is similarly used to specify the relative
path to the directory where the profile files should be stored. If no output directory is specified the current directory will be used. A contiguous interval within the vtf file may be selected for conversion by
using the -i flag followed by two integers, representing the timestamp of the start and end of the desired
interval respectively. The entire vtf file is converted if no interval is given.
Options
-f tracefile -Specify the Vampir tracefile to be converted.
-p profile -Specify the location where the profile file(s) should be written.
-i interval_start interval_end -Limit the profile produced to the specified interval within
the vampir trace file.
-c -Opens a command line interface for the program.
-h -Displays a help message.
Examples
To convert a vampir tracefile, trace.vpt, to an equivalent TAU profile, use the following:
vtf2profile -f trace.vpt
To produce a TAU profile in the ./profiles directory representing only the events from the start of the
tracefile to timestamp 6000, use:
vtf2profile -f trace.vpt -p ./profiles -i 0 6000
See Also
tau2vtf, trace2profile
48
Tools
Name
tau2vtf -- convert TAU tracefiles to vampir tracefiles
tau2vtf [ -nomessage ] [ -v ] [[ -a ] | [ -fa ]] { tau_tracefile } { tau_eventfile } {
vtf_tracefile }
Description
This program is generated when TAU is configured with the -vtf=<vtf_dir> option.
The tau2vtf trace converter takes a single tau_tracefile (*.trc) and tau_eventfile (*.edf) and produces a
corresponding vtf_tracefile (*.vtf). The input files and output file must be specified in that order. Multifile TAU traces must be merged before conversion.
The default output file format is VTF3 binary. If the output filename is given as the .vpt.gz type, rather
than .vpt, the output file will be gzipped. There are two additional output format options. The command
line argument '-a' produces the vtf file output in ASCII VTF3 format. The command line argument '-fa'
produces the vtf file output in the FAST ASCII VTF3 format. Note that these arguments are mutually
exclusive.
Options
-nomessage Suppresses printing of message information in the trace.
-v Verbose mode sends trace event descriptions to the standard output as they are converted.
-a Print the vtf file output in the human-readable VTF3 ASCII format
-fa Print the vtf file in the simplified human-readable FAST ASCII VTF3 format
Examples
The program must be run with the tau trace, tau event and vtf output files specified in the command line
in that order. Any additional arguments follow. The following will produce a VTF, app.vpt, from the
TAU trace and event files merged.trc and tau.edf trace file:
tau2vtf merged.trc tau.edf app.vpt
The following will convert merged.trc and tau.edf to a gzipped FAST ASCII vampir tracefile app.vpt.gz,
with message events omitted:
tau2vtf merged.trc tau.edf app.vpt.gz -nomessage -fa
See Also
vtf2profile, trace2profile, tau_merge, tau_convert
49
Tools
Name
trace2profile -- convert TAU tracefiles to TAU profile files
tau2vprofile [ -d directory ] [ -s snapshot_interval ] { tau_tracefile } {
tau_eventfile }
Description
This program is generated when TAU is configured with the -TRACE option.
The trace2profile converter takes a single tau_tracefile (*.trc) and tau_eventfile (*.edf) and produces a
corresponding series of profile files. The input files must be specified in that order, with optinal parameters coming afterward. Multi-file TAU traces must be merged before conversion.
Options
-d Output profile files to the specified 'directory' rather than the current directory.
-s Output a profile snapshot showing the state of the profile data accumulated from the trace every
'snapshot_interval' time units. The snapshot profiles are placed sequentially in directories labled 'snapshot_n' where 'n' is an integer ranging from 0 to to the total number of snapshots -1.
Examples
The program must be run with the tau trace and tau event files specified in the command line in that order. Any additional arguments follow. The following will produce a profile file array, from the TAU
trace and event files merged.trc and tau.edf trace file:
trace2profile merged.trc tau.edf
The following will convert merged.trc and tau.edf to a series of profiles one directory higher. It will also
produce a profile snapshot every 250,000 time units:
trace2profile merged.trc tau.edf -d ./.. -s 250000
See Also
vtf2profile, tau2vtf, tau2otf, tau_merge, tau_convert
50
Tools
Name
tau2elg -- convert TAU tracefiles to Epilog tracefiles
tau2elg [ -nomessage ] [ -v ] { tau_tracefile } { tau_eventfile } {
elg_tracefile }
Description
This program is generated when TAU is configured with the -epilog=<epilog_dir> option.
The tau2elg trace converter takes a tau trace file (*.trc) and event definition file (*.edf) and produces a
corresponding epilog binary trace file (*.elg). Multi-file TAU traces must be merged before conversion.
Options
-nomessage Suppresses printing of message information in the trace.
-v Verbose mode sends trace event descriptions to the standard output as they are converted.
Examples
The program must be run with the tau trace, tau event and elg output files specified in the command line
in that order. Any additional arguments follow. The following would convert merged.trc and tau.edf to
the Epilog tracefile app.elg, with message events omitted:
./tau2vtf merged.trc tau.edf app.elg -nomessage
See Also
tau_merge
51
Tools
Name
tau2slog2 -- convert TAU tracefiles to SLOG2 tracefiles
tau2slog2 [ options ] { tau_tracefile } { tau_eventfile } { -o output.slog2 }
Description
This program is generated when TAU is configured with the -slog2 or -slog2=<slog2_dir> option.
The tau2slog2 trace converter takes a single tau trace file (*.trc) and event definition file (*.edf) and produces a corresponding slog2 binary trace file (*.slog2).
The tau2slog2 converter is called from the command line with the locations of the tau trace and event
files. These arguments must be followed by the -o flag and the name of the slog2 file to be written.
tau2slog 2 accepts no other arguments.
Options
[-h|--h|-help|--help] Display HELP message.
[-tc] Check increasing endtime order, exit when 1st violation occurs.
[-tcc] Check increasing endtime order,continue when violations occur.
[-nc number] Number of childern per node (default is 2)
[-ls number] Max byte size of leaf nodes (default is 65536)
[-o output.slog2] Output filename with slog2 suffix
Examples
A typical invocation of the converter, to create app.slog2, is as follows:
tau2slog2 app.trc tau.edf -o app.slog2
See Also
tau_merge, tau_convert
52
Tools
Name
tau2otf -- convert TAU tracefiles to OTF tracefiles for Vampir/VNG
tau2otf [ -n streams ] [ -nomessage ] [ -v ]
Description
This program is generated when TAU is configured with the -otf=<otf_dir> option. The tau2otf trace
converter takes a TAU formatted tracefile (*.trc) and a TAU event description file (*.edf) and produces
an output trace file in the Open Trace Format (OTF). The user may specify the number of output streams
for OTF. The input files and output file must be specified in that order. TAU traces should be merged
using tau_merge prior to conversion.
Options
-n streams Specifies the number of output streams (default is 1). -nomessage Suppresses printing of
message information in the trace. -v Verbose mode sends trace event descriptions to the standard output
as they are converted.
Examples
The program must be run with the tau trace, tau event and otf output files specified in the command line
in that order. Any additional arguments follow. The following will produced an OTF file, a pp.otf and
other related event and definition files, from the TAU trace and event files merged.trc and tau.edf trace
file:
tau2otf merged.trc tau.edf app.otf
See Also
tau2vtf(1), trace2profile(1), vtf2profile(1), tau_merge(1), tau_convert(1)
53
Tools
Name
tau2otf2 -- convert TAU tracefiles to OTF2 tracefiles for Vampir/VNG
tau2otf2 [ -n streams ] [ -nomessage ] [ -v ]
Description
This program is generated when TAU is configured with the -otf=<otf_dir> option. The tau2otf2 trace
converter takes a TAU formatted tracefile (*.trc) and a TAU event description file (*.edf) and produces
an output trace file in the Open Trace Format (OTF2). The user may specify the number of output
streams for OTF2. The input files and output file must be specified in that order. TAU traces should be
merged using tau_merge prior to conversion.
Options
-n streams Specifies the number of output streams (default is 1). -nomessage Suppresses printing of
message information in the trace. -v Verbose mode sends trace event descriptions to the standard output
as they are converted.
Examples
The program must be run with the tau trace, tau event and otf2 output files specified in the command
line in that order. Any additional arguments follow. The following will produced an OTF2 file, a pp.otf2
and other related event and definition files, from the TAU trace and event files merged.trc and tau.edf
trace file:
tau2otf2 merged.trc tau.edf app.otf2
See Also
tau2vtf(1), trace2profile(1), vtf2profile(1), tau_merge(1), tau_convert(1)
54
Tools
Name
perf2tau -- converts PerfLib profiles to TAU profile files
perf2tau { data_directory } [ -h ] [ -flat ]
Description
Converts perflib data to TAU format.
If an argument is not specified, it checks the perf_data_directory environment variable. Then opens
perf_data.timing directory to read perflib data If no args are specified, it tries to read
perf_data.<current_date> file.
Options
-h Display the help information.
-flat Suppresses callpath profiles, each callpath profile will be flattened to show only the function
profile.
Examples
%> perf2tau timing
See Also
vtf2profile, tau2vtf, tau2otf, tau_merge, tau_convert
55
Tools
Name
tau_merge -- combine multiple node and or thread TAU tracefiles into a merged tracefile
tau_merge [ -a ] [ -r ] [ -n ] [ -e eventfile_list ] [ -m output_eventfile ] { tracefile_list } [{ output_tracefile } | { - }]
Description
tau_merge is generated when TAU is configured with the -TRACE option.
This tool assembles a set of tau trace and event files from multiple multiple nodes or threads across a
program's execution into a single unified trace file. Many TAU trace file tools operate on merged trace
files.
Minimally, tau_merge must be invoked with a list of unmerged trace files followed by the desired name
of the merged trace file or the - flag to send the output to the standard out. Typically the list can be designated by giving the shared name of the trace files to be merged followed by desired range of thread or
node designators in brackets or the wild card character '*' to encompass variable thread and node designations in the filename (trace.A.B.C.trc where A, B and C are the node, context and thread numbers respectively). For example tautrace.*.trc would represent all tracefiles in a given directory while tautrace.[0-5].0.0.trc would represent the tracefiles of nodes 0 through 5 with context 0 and thread 0.
tau_merge will generate the specified merged trace file and an event definition file, tau.edf by default.
The event definition file can be given an alternative name by using the '-m' flag followed by the desired
filename. A list of event definition files to be merged can be designated explicitly by using the '-e' flag
followed by a list of unmerged .edf files, specified in the same manner as the trace file list.
If computational resources are insufficient to merge all trace and event files simultaneously the process
may be undertaken hierarchically. Corresponding subsets of the tracefiles and eventfiles may be merged
in sequence to produce a smaller set of files that can then be to merged into a singular fully merged
tracefile and eventfile. E.g. for a 100 node trace, trace sets 1-10, 11-20, ..., 91-100 could be merged into
traces 1a, 2a, ..., 10a. Then 1a-10a could be merged to create a fully merged tracefile.
Options
-e eventfile_list explicitly define the eventfiles to be merged
-m output_eventfile explicitly name the merged eventfile to be created
- send the merged tracefile to the standard out
-a adjust earliest timestamp time to zero
-r do not reassemble long events
-n do not block waiting for new events. By default tau_merge will block and wait for new events to be
appended if a tracefile is incomplete. This command allows offline merging of (potentially) incomplete
tracefiles.
Examples
To merge all TAU tracefiles into app.trc and produce a merged tau.edf eventfile:
tau_merge *.trc app.trc
56
Tools
To merge all eventfiles 0-255 into ev0_255merged.edf and TAU tracefiles for nodes 0-255 into the
standard out:
tau_merge -e events.[0-255].edf -m ev0_255merged.edf \
tautrace.[0-255].*.trc To merge eventfiles 0, 5 and seven info ev057.edf and tau tracefiles for nodes 0, 5 and 7 with context
and thread 0 into app.trc:
tau_merge -e events.0.edf events.5.edf events.7.edf -m ev057.edf \
tautrace.0.0.0.trc tautrace.5.0.0.trc tautrace.7.0.0.trc app.trc
See Also
tau_convert
trace2profile
tau2vtf
tau2elg
tau2slog2
57
Tools
Name
tau_treemerge.pl -- combine multiple node and or thread TAU tracefiles into a merged tracefile
tau_treemerge.pl [ -n break_amount ]
Description
tau_treemerge.pl is generated when TAU is configured with the -TRACE option.
This tool assembles a set of tau trace and event files from multiple multiple nodes or threads across a
program's execution into a single unified trace file. Many TAU trace file tools operate on merged trace
files.
tau_treemerge.pl will generate the specified merged trace file and an event definition file, tau.edf by default.
Options
-n break_amount set the maximum number of trace files to merge in each invocation of tau_merge. If
we need to merge 2000 trace files and if the maximum number of open files specified by unix is 250,
tau_treemerge.pl will incrementally merge the trace files so as not to exceed the number of open file
descriptors.
See Also
tau_merge
tau_convert
trace2profile
tau2vtf
tau2elg
tau2slog2
58
Tools
Name
tau_convert -- convert TAU tracefiles into various alternative trace formats
tau_convert [[ -alog ] | [ -SSDF ] | [ -dump ] | [ -paraver [-t] ] | [ -pv ] | [ -vampir [ longsymbolbugfix ] [ -compact ] [[ -user ] | [ -class ] | [ -all ]] [ -nocomm ] ]] [ outputtrc ] { inputtrc } { edffile }
Description
tau_convert is generated when TAU is configured with the -TRACE option.
This program requires specification of a TAU tracefile and eventfile. It will convert the given TAU
traces to the ASCII-based trace format specified in the first argument. The conversion type specification
may be followed by additional options specific to the conversion type. It defaults to the single threaded
vampir format if no other format is specified. tau_convert also accepts specification of an output file as
the last argument. If none is given it prints the converted data to the standard out.
Options
-alog convert TAU tracefile into the alog format (This format is deprecated. The SLOG2 format is recommended.)
-SDDF convert TAU tracefile into the SDDF format
-dump convert TAU tracefile into multi-column human readable text
-paraver convert TAU tracefile into paraver format
-t indicate conversion of multi threaded TAU trace into paraver format
-pv convert single threaded TAU tracefile into vampir format (all -vampir options apply) (default)
-vampir convert multi threaded TAU tracefile into vampir format
-longsymbolbugfix make the first characters of long, similar identifier strings unique to avoid a
bug in vampir
-compact abbreviate individual event entries
-all compact all entries (default)
-user compact user entries only
-class compact class entries only
-nocomm disregard communication events
[outputtrc] specify the name of the output tracefile to be produced
Examples
To print the contents of a TAU tracefile to the screen:
tau_convert -dump app.trc tau.edf
59
Tools
To convert a merged, threaded TAU tracefile to paraver format:
tau_convert -paraver -t app.trc tau.edf app.pv
See Also
tau_merge, tau2vtf, trace2profile, tau2slog2
60
Tools
Name
tau_reduce -- generates selective instrumentation rules based on profile data
tau_reduce { -f filename } [ -n ] [ -r filename ] [ -o filename ] [ -v ] [ -p ]
Description
tau_reduce is an application that will apply a set of user-defined rules to a pprof dump file (pprof -d) in
order to create a select file that will include an exclude list for selective implementation for TAU. The
user must specify the name of the pprof dump file that this application will use. This is done with the -f
filename flag. If no rule file is specified, then a single default rule will be applied to the file. This rule is:
numcalls > 1000000 & usecs/call < 2, which will exclude all routines that are called at least 1,000,000
times and average less then two microseconds per call. If a rule file is specified, then this rule is not applied. If no output file is specified, then the results will be printed out to the screen.
Rules
Users can specify a set of rules for tau_reduce to apply. The rules should be specified in a separate file,
one rule per line, and the file name should be specifed with the appropriate option on the command line.
The grammar for a rule is: [GROUPNAME:]FIELD OPERATOR NUMBER. The GROUPNAME followed by the colon (:) is optional. If included, the rule will only be applied to routines that are a member
of the group specified. Only one group name can be applied to each rule, and a rule must follow a groupname. If only a groupname is given, then an unrecognized field error will be returned. If the desired effect is to exclude all routines that belong to a certain group, then a trivial rule, such as GROUP:numcalls
> -1 may be applied. If a groupnameis given, but the data does not contain any groupname data, then
then an error message will be given, but the rule will still be applied to the date ignoring the groupname
specification. A FIELD is any of the routine attributes listed in the following table:
Table 7.1. Selection Attributes
ATTRIBUTE NAME
MEANING
numcalls
Number of times the routine is called
numsubrs
Number of subroutines that the routine contains
percent
Percent of total implementation time
usec
Exclusive routine running time, in microseconds
cumusec
Inclusive routine running time, in microseconds
count
Exclusive hardware count
totalcount
Inclusive hardware count
stddev
Standard deviation
usecs/call
Microseconds per call
counts/call
Hardware counts per call
Some FIELDS are only available for certain files. If hardware counters are used, then usec, cumusec,
usecs/per call are not applicable and a error is reported. The opposite is true if timing data is used rather
than hardware counters. Also, stddev is only available for certain files that contain that data.
An OPERATOR is any of the following: < (less than), > (greater than), or = (equals).
A NUMBER is any number.
61
Tools
A compound rule may be formed by using the & (and) symbol in between two simple rules. There is no
"OR" because there is an implied or between two separate simple rules, each on a separate line. (ie the
compound rule usec < 1000 OR numcalls = 1 is the same as the two simple rules "usec < 1000" and
"numcalls = 1").
Rule Examples
#exclude all routines that are members of TAU_USER and have less than
#1000 microseconds
TAU_USER:usec < 1000
#exclude all routines that have less than 1000 microseconds and are
#called only once.
usec < 1000 & numcalls = 1
#exclude all routines that have less than 1000 usecs per call OR have a percent
#less than 5
usecs/call < 1000
percent < 5
NOTE: Any line in the rule file that begins with a # is a comment line. For clarity, blank lines may be
inserted in between rules and will also be ignored.
Options
-f filename specify filename of pprof dump file
-p print out all functions with their attributes
-o filename specify filename for select file output (default: print to screen
-r filename specify filename for rule file
-v verbose mode (for each rule, print out rule and all functions that it excludes)
Examples
To print to the screen the selective instrumentation list for the paraprof dump file app.prf with default selection rules use:
tau_reduce -f app.prf
To create a selection file, app.sel, from the paraprof dump file app.prf using rules specified in foo.rlf
use:
tau_reduce -f app.prf -r foo.rlf -o app.sel
See Also
62
Tools
Name
tau_ompcheck -- Completes uncompleted do/for/parallel omp directives
tau_ompcheck { pdbfile } { sourcefile } [ -o outfile ] [ -v ] [ -d ]
Description
Finds uncompleted do/for omp directives and inserts closing directives for each one uncompleted. do/for
directives are expected immediately before a do/for loop. Closing directives are then placed immediately
following the same do/for loop.
Options
pdbfile A pdbfile generated from the source file you wish to check. This pdbfile must contain comments from which the omp directives are gathered. See pdbcomment for information on how to obtain
comment from a pdbfile.
sourcefile A fortran, C or C++ source file to analyzed.
-o write the output to the specified outfile.
-vverbose output, will say which directive where added.
-d debuging information, we suggest you pipe this unrestrained output to a file.
Examples
To check file: source.f90 do: (you will need pdtoolkit/<arch>/bin and tau/utils/ in your path).
%>f95parse source.f90
%>pdbcomment source.pdb > source.comment.pdb
%>tau_omp source.comment.pdb source.f90 -o source.chk.f90
See Also
f95parse pdbcomment
63
Tools
Name
tau_poe -- Instruments a MPI application while it is being executed with poe.
tau_poe [ -XrunTAUsh- tauOptions ] { applcation } [ poe options ]
Description
This tool dynamically instruments a mpi application by loading a specific mpi library file.
Options
tauOptions To instrument a mpi application a specific TAU library file is loaded when the application is executed. To select which library is loaded use this option. The library files are build according to
the options set when TAU is configured. The library file that have been build and thus available for use
are in the [TAU_HOME]/[arch]/lib directory. The file are listed as libTAUsh-*.so where * is the instrumentation options. For example to use the libTAUsh-pdt-openmp-opari.so file let the comman line option be -XrunTAUsh-pdt-openmp-opari.
Examples
Instrument a.out wit the currently configured options and then run it on four nodes:
%>tau_poe ./a.out -procs 4
Select the libTAUsh-mpi.so library to instrument a.out with:
%>tau_poe -XrunTAUsh-mpi ./a.out -procs 4
64
Tools
Name
tau_validate -- Validates a TAU installation by performing various tests on each TAU stub Makefile
tau_validate [ -v ] [ --html ] [ --build ] [ --run ] [ --tag ] { arch directory }
Description
tau_validate will attempt to validate a TAU installation by performing various tests on each TAU stub
Makefile. Some degree of logic exists to know where a given test applies to a given makefile, but it's not
perfect.
Options
v Verbose output
html Output results in HTML
build Only build
run Only run
tag Only check configurations containing the tag. ie. --tag papi checks only libraries with the papi in their name.
arch directory Specify an arch directory (e.g. rs6000), or the lib directory (rs6000/lib), or a specific makefile. Relative or absolute paths are ok.
Example
There is a few examples:
bash : ./tau_validate --html x86_64 &> results.html
tcsh : ./tau_validate --html x86_64 >& results.html
65
Tools
Name
tauex -- Allows you to choose a tau configuration at runtime
tauex [ OPTION ] [--] { executable } [ executable options ]
Description
Use this script to dynamically load a TAU profiling/tracing library or to select which papi events/domain to use during execuation of the application. At runtime tauex will set the LD_LIBRARY_PATH
and pass any other parameters (or papi events) to the program and execute it with the specified TAU
measurement options.
Options
-d
Enable debugging output, use repeatedly for more output.
-h
Print help message.
-i
Print information about the host machine.
-s
Dump the shell environment variables and exit.
-U
User mode counts
-K
Kernel mode counts
-S
Supervisor mode counts
-I
Interrupt mode counts
-l
List events
-L <event>
Describe event
-a
Count all native events (implies -m)
-n
Multiple runs (enough runs of exe to gather all events)
-e <event>
Specify PAPI preset or native event
-T <option>
Specify TAU option
-v
Debug/Verbose mode
-XrunTAU-<options>
specify TAU library directly
Notes
Defaults if unspecified: -U -T MPI,PROFILE -e P_WALL_CLOCK_TIME MPI is assumed unless
SERIAL is specified PROFILE is assumed unless one of TRACE, VAMPIRTRACE or EPILOG is specified P_WALL_CLOCK_TIME means count real time using fastest available timer
Example
66
Tools
mpirun -np 2 tauex -e PAPI_TOT_CYC -e PAPI_FP_OPS -T MPI,PROFILE -./ring
67
Tools
Name
tau_exec -- TAU execution wrapping script
tau_exec [ options ] [--] { exe } [ exe options ]
Description
Use this script to perform memory or IO tracking on either an instrumented or uninstrumented executable.
Options
-v
verbose mode
-qsub
BG/P qsub mode
-io
track io
-memory
track memory
-cuda
track GPU events via CUDA (Must be configured with -cuda=<dir>,
Preferred of CUDA 4.0 or earlier)
-cupti
track GPU events via Nvidia's CUPTI interface (Must be configured
with -cupti=<dir>, Preferred for CUDA 4.1 or later).
-um
in conjunction with -cupti adds support for the Unified Memory
GPUs. Requires CUDA 6.5 or later.
-opencl
track GPU events via OpenCL
-openacc
track openacc events. Supports TAU configurations with arch=craycnl or PGI compilers on x86_64 Linux
-armci
track ARMCI events via PARMCI (Must be configured with armci=<dir>)
-ebs
enable Event-based sampling. See README.sampling for more information
-numa
Activates hardware counters to measure remote DRAM accesses and
total node accesses. These counters must be available from PAPI in
the selected TAU configuration.
-ebs_period=<count >
sampling period (default 1000)
-ebs_source=<counter>
sets sampling metric (default "itimer")
-T<option>
: specify TAU option
-loadlib=<file.so >
: specify additional load library
-XrunTAU-<options>
specify TAU library directly
68
Tools
Notes
Defaults if unspecified: -T MPI. MPI is assumed unless SERIAL is specified
CUDA kernel tracking is included, if A CUDA SYNC call is made after each kernel launch and
cudaThreadExit() is called before the exit of each thread that uses CUDA.
OPENCL kernel tracking is included, if A OPENCL SYNC call is made after each kernel launch and
clReleaseContext() is called before the exit of each thread that uses CUDA.
Examples
mpirun -np 2 tau_exec -io ./ring
mpirun -np 8 tau_exec -ebs -ebs_period=1000000 -ebs_source=PAPI_FP_INS
./ring
tau_exec -T serial,cupti -cupti ./matmult (Preferred for CUDA 4.1 or
later)
tau_exec -T serial -cuda ./matmult (Preferred for CUDA 4.0 or earlier)
tau_exec -T serial -opencl (OPENCL)
69
Tools
Name
tau_timecorrect -- Corrects and reorders the records of tau trace files.
tau_timecorrect { trace input file } { EDF input file } { trace output file
} { EDF input file }
Description
This program takes in tau trace files, reorders and corrects the times of these records and then outputs
the records to new trace files. The time correction algorithm uses a logical clock algorithm with amortization. This is done by adjusting the times of events such that the product of an effect happens after the
cause of that effect.
Options
trace input file
EDF input file
trace output file
EDF output file
70
Tools
Name
tau_throttle.sh -- This tool generates a selective instrumentation file (called throttle.tau) from a program
output that has "Disabling" messages.
tau_throttle.sh
Description
This tools will auto-generates a selective instrumenation file basied on output from a program that has
the profiling of some its functions throttled.
71
Tools
Name
tau_portal.py -- This tool is design to interact with the TAU web portal (http://tau.nic.uoregon.edu).
There are commands for uploading or downloading packed profile files form the TAU portal.
tau_portal.py [-help] [--help] {command} {options} [argument]
Description
Each command will initate a transfer to profile data btween the TAU portal and either the filesytem (to
be stored as ppk file) or to a PerfDMF database. See tau_portal --help for more information.
72
Tools
Name
taudb_configure -- Configuration program for a PerfDMF database.
taudb_configure [-h,--help] [--create-default] [-g, --configFile configFile] [-c, --config configuration_name] [-t, --tauroot path]
Description
This configuration script will create a new TAUdb database.
Options
-h, --help show help
--create-default creates a H2 database with all the default values
-g, --configFile configFile specify the path to the file that defines the TAUdb configuration.
-c, --config configuration_name specify the name of the TAUdb configuration -c foo is
equalivent to -g <home>/.ParaProf/perfdmf.cfg.foo.
-t, --tauroot path Path to the root directory of tau.
73
Tools
Name
perfdmf_createapp -- Deprecated Command line tool to create a application in the perfdmf database.
(Deprecated)
perfdmf_createapp [-h, --help ] [-g, --configFile configFile] [-c, --config configuration_name] [-a, --applicationid applicationID] {-n, --name name}
Description
This script will create a new application in the perfdmf database.
Options
-g, --configFile configFile specify the path to the file that defines the perfdmf configuration.
-c, --config configuration_name specify the name of the perfdmf configuration -c foo is
equalivent to -g <home>/.ParaProf/perfdmf.cfg.foo.
-a, --applicationid applicationID specify the id number of the newly added application (default
uses auto-increment).
-n, --name name the name of the application.
74
Tools
Name
perfdmf_createexp -- Deprecated Command line tool to create a experiment in the perfdmf database.
(Deprecated)
perfdmf_createexp [-h, --help ] [-g, --configFile configFile] [-c, --config configuration_name] {-a, --applicationid applicationID} {-n, --name name}
Description
This script will create a new experiment in the perfdmf database.
Options
-g, --configFile configFile specify the path to the file that defines the perfdmf configuration.
-c, --config configuration_name specify the name of the perfdmf configuration -c foo is
equalivent to -g <home>/.ParaProf/perfdmf.cfg.foo.
-a, --applicationid applicationID specify the id number of the application to associate with the
new experiment.
-n, --name name the name of the application.
75
Tools
Name
taudb_loadtrial -- Command line tool to load a trial into the TAUdb database.
taudb_loadtrial {-a appName} {-x experimentName} {-n name} [options]
Description
This script will create a new trial in the TAUdb database.
Options
-n, --name name the name of the application.
-a, --applicationname name specify associated application name for this trial
-x, --experimentname experimentName specify the name of the experiment to associate with newly
uploaded trial.
-e, --experimentid experimentID specify the id number of the experiment to associate with the new
trial.
-g, --configFile configFile specify the path to the file that defines the TAUdb configuration.
(overrides -c)
-c, --config configuration_name specify the name of the TAUdb configuration -c foo is
equalivent to -g <.
-t, --trialid experimentID specify the id number of the newly uploaded trial.
-m, --metadata filename specify the filename of the XML metadata for this trial.
-f, --filetype filetype Specify type of performance data, options are: profiles (default), pprof, dynaprof, mpip, gprof, psrun, hpm, packed, cube, hpc, ompp, snap, perixml, gptl, paraver, ipm, google
-i, --fixnames Use the fixnames option for gprof
Notes
For the TAU profiles type, you can specify either a specific set of profile files on the commandline, or
you can specify a directory (by default the current directory). The specified directory will be searched
for profile.*.*.* files, or, in the case of multiple counters, directories named MULTI_* containing profile data.
Examples
taudb_loadtrial -e 12 -n "Batch 001"
This will load profile.* (or multiple counters directories MULTI_*) into experiment 12 and give the trial
the name "Batch 001"
taudb_loadtrial -e 12 -n "HPM data 01" -f hpm perfhpm*
This will load perfhpm* files of type HPMToolkit into experiment 12 and give the trial the name "HPM
data 01"
taudb_loadtrial -a "NPB2.3" -x "parametric" -n "64" par64.ppk
76
Tools
This will load packed profile par64.ppk into the experiment named "parametric" under the application
named "NPB2.3" and give the trial the name "64". The application and experiment will be created if not
found.
77
Tools
Name
perfexplorer -- Launches TAU's Performance Data Mining Analyzer.
perfexplorer [-n, --nogui] [-i, --script script]
Documentation
Complete documentation can be found at http://www.cs.uoregon.edu/research/tau/tau-usersguide.pdf
78
Tools
Name
perfexplorer_configure -- Configures a TAUdb database for use with perfexplorer, and installs necessary
JAR files.
perfexplorer_configure
Description
Configures a TAUdb database for use with perfexplorer, and installs necessary JAR files.
79
Tools
Name
taucc -- C compiler wrapper for TAU
taucc [options] ...
Options
-tau:help
Displays help
-tau:verbose
Enable verbose mode
-tau:keepfiles
Keep intermediate files
-tau:show
Do not invoke, just show what would be done
-tau:pdtinst
Use PDT instrumentation
-tau:compinst
Use compiler instrumentation
-tau:headerinst
Instrument headers
-tau:<options>
Specify measurement/instrumentation options. Sample options:
mpi,pthread,openmp,profile,callpath,trace,vampirtrace,epilog
-tau:makefile
tau_stub_makefile
Specify tau stub makefile
Notes
If the -tau:makefile option is not used, the TAU_MAKEFILE environment variable will be checked, if it
is not specified, then the -tau:<options> will be used to identify a binding.
Examples
taucc foo.c -o foo
taucc -tau:MPI,OPENMP,TRACE foo.c -o foo
taucc -tau:verbose -tau:PTHREAD foo.c -o foo
Documentation
Complete documentation can be found at http://www.cs.uoregon.edu/research/tau/tau-usersguide.pdf
80
Tools
Name
tauupc -- UPC wrapper for TAU
tauupc [options] ...
Options
-tau:help
Displays help
-tau:verbose
Enable verbose mode
-tau:keepfiles
Keep intermediate files
-tau:show
Do not invoke, just show what would be done
-tau:pdtinst
Use PDT instrumentation
-tau:compinst
Use compiler instrumentation
-tau:headerinst
Instrument headers
-tau:<options>
Specify measurement/instrumentation options. Sample options:
mpi,pthread,openmp,profile,callpath,trace,vampirtrace,epilog
-tau:makefile
tau_stub_makefile
Specify tau stub makefile
Notes
If the -tau:makefile option is not used, the TAU_MAKEFILE environment variable will be checked, if it
is not specified, then the -tau:<options> will be used to identify a binding.
Documentation
Complete documentation can be found at http://www.cs.uoregon.edu/research/tau/tau-usersguide.pdf
81
Tools
Name
taucxx -- C++ compiler wrapper for TAU
taucxx [options] ...
Options
-tau:help
Displays help
-tau:verbose
Enable verbose mode
-tau:keepfiles
Keep intermediate files
-tau:show
Do not invoke, just show what would be done
-tau:pdtinst
Use PDT instrumentation
-tau:compinst
Use compiler instrumentation
-tau:headerinst
Instrument headers
-tau:<options>
Specify measurement/instrumentation options. Sample options:
mpi,pthread,openmp,profile,callpath,trace,vampirtrace,epilog
-tau:makefile
tau_stub_makefile
Specify tau stub makefile
Notes
If the -tau:makefile option is not used, the TAU_MAKEFILE environment variable will be checked, if it
is not specified, then the -tau:<options> will be used to identify a binding.
Examples
taucxx foo.cpp -o foo
taucxx -tau:MPI,OPENMP,TRACE foo.cpp -o foo
taucxx -tau:verbose -tau:PTHREAD foo.cpp -o foo
Documentation
Complete documentation can be found at http://www.cs.uoregon.edu/research/tau/tau-usersguide.pdf
82
Tools
Name
tauf90 -- Fortran compiler wrapper for TAU
tauf90 [options] ...
Options
-tau:help
Displays help
-tau:verbose
Enable verbose mode
-tau:keepfiles
Keep intermediate files
-tau:show
Do not invoke, just show what would be done
-tau:pdtinst
Use PDT instrumentation
-tau:compinst
Use compiler instrumentation
-tau:headerinst
Instrument headers
-tau:<options>
Specify measurement/instrumentation options. Sample options:
mpi,pthread,openmp,profile,callpath,trace,vampirtrace,epilog
-tau:makefile
tau_stub_makefile
Specify tau stub makefile
Notes
If the -tau:makefile option is not used, the TAU_MAKEFILE environment variable will be checked, if it
is not specified, then the -tau:<options> will be used to identify a binding.
Examples
tauf90 foo.f90 -o foo
tauf90 -tau:MPI,OPENMP,TRACE foo.f90 -o foo
tauf90 -tau:verbose -tau:PTHREAD foo.f90 -o foo
Documentation
Complete documentation can be found at http://www.cs.uoregon.edu/research/tau/tau-usersguide.pdf
83
Tools
Name
paraprof -- Launches TAU's Java-based performance data viewer.
paraprof [-h, --help] [-f, --filetype filetype] [--pack file] [--dump] [-o, --oss] [-s, --summary]
Notes
For the TAU profiles type, you can specify either a specific set of profile files on the commandline, or
you can specify a directory (by default the current directory). The specified directory will be searched
for profile.*.*.* files, or, in the case of multiple counters, directories named MULTI_* containing profile data.
Options
-h
Display help
-f, --filetype filetype
Specify type of performance data. Options are: profiles (default),
pprof, dynaprof, mpip, gprof, psrun, hpm, packed, cube, hpc, ompp,
snap, perixml, gptl
--pack file
Pack the data into packed (.ppk) format (does not launch ParaProf
GUI)
--dump
Dump profile data to TAU profile format (does not launch ParaProf
GUI).
-o, --oss
Print profile data in OSS style text output
-s, --summary
Print only summary statistics (only applies to OSS output)
Documentation
Complete documentation can be found at http://www.cs.uoregon.edu/research/tau/tau-usersguide.pdf
84
Tools
Name
pprof -- Quickly diplays profile data.
pprof [-a] [-c] [-b] [-m] [-t] [-e] [-i] [-v] [-r] [-s] [-n num] [-f filename] [-p] [-l] [-d]
Description
Options
-a Show all location information available
-c Sort according to number of Calls
-b Sort according to number of suBroutines called by a function
-m Sort according to Milliseconds (exclusive time total)
-t Sort according to Total milliseconds (inclusive time total) (default)
-e Sort according to Exclusive time per call (msec/call)
-i Sort according to Inclusive time per call (total msec/call)
-v Sort according to Standard Deviation (excl usec)
-r Reverse sorting order
-s print only Summary profile information
-n num print only first num number of functions
-f filename specify full path and Filename without node ids
-p suPpress conversion to hhmmssmmm format
-l List all functions and exit
-d Dump output format (for tau_reduce) [node numbers] prints only info about all contexts/threads of
given node numbers
85
Tools
Name
tau_instrumentor -- automaticly instruments a source basied on information provided by pdt.
tau_instrumentor [--help] {pdbfile} {sourcefile} [-c] [-b] [-m] [-t] [-e] [-i] [-v] [-r] [-s]
[-n num] [-f filename] [-p] [-l] [-d]
Description
Options
-a Show all location information available
-c Sort according to number of Calls
-b Sort according to number of suBroutines called by a function
-m Sort according to Milliseconds (exclusive time total)
-t Sort according to Total milliseconds (inclusive time total) (default)
-e Sort according to Exclusive time per call (msec/call)
-i Sort according to Inclusive time per call (total msec/call)
-v Sort according to Standard Deviation (excl usec)
-r Reverse sorting order
-s print only Summary profile information
-n num print only first num number of functions
-f filename specify full path and Filename without node ids
-p suPpress conversion to hhmmssmmm format
-l List all functions and exit
-d Dump output format (for tau_reduce) [node numbers] prints only info about all contexts/threads of
given node numbers
Example
%> tau_instrumentor foo.pdb foo.cpp -o foo.inst.cpp -f select.tau
86
Tools
Name
vtfconverter -vtfconverter [-h] [-c] [-f file] [-p path] [-i from to]
Description
Converts VTF profile to TAU profiles and launches an interactive VTF prompt.
Options
-c Opens command line interface.
-f Converts trace [file] to TAU profiles.
-p Places the resulting profiles in the directory [path].
-i States that the interval [from],[to] should be profiled.
87
Tools
Name
tau_setup -- Launches GUI interface to configure TAU.
tau_setup
Options
-v Verbose output.
--html Output results in HTML.
--build Only build.
--run Only run.
88
Tools
Name
tau_wrap -- Instruments an external library with TAU without needing to recompile
tau_wrap {pdbfile} {sourcefile} [-o outputfile] [-g groupname] [-i headerfile] [-f
selectivefile]
Options
pdbfile
A pdb file generated by cparse, cxxparse, or f90parse; these commands are
found in the [PDT_HOME]/[arch]/bin directory.
sourcefile
The source file corresponding to the pdbfile.
-o outputfile
The filename of the resulting instrumented source file.
-g groupname
This associates all the functions profiled as belonging to the this group. Once
profiled you will be able to analysis these functions separately.
-i headerfile
By default tau_wrap will include Profile/Profile.h; use this option to specify a different header file.
-f selectivefile
You can specify a selective instrumentation file that defines how the source
file is to be instrumented.
Examples
%> tau_wrap hdf5.h.pdb hdf5.h -o hdf5.inst.c -f select.tau -g hdf5
This specifies the instrumented wrapper library source (hdf5.inst.c), the instrumentation specification
file (select.tau) and the group (hdf5). It creates the wrapper/ directory.
89
Tools
Name
tau_gen_wrapper -- Generates a wrapper library that can intercept at link time or at runtime routines specified in a header file
tau_gen_wrapper {headerfile} {library} [-w | -d | -r ]
Options
headerfile
Name of the headerfile to be wrapped
library
Name of the library to wrap
-w
(default) generates wrappers for re-linking the application
-d
generates wrappers by redefining routines during compilation in header files
-r
generates wrappers that may be pre-loaded using tau_exec at runtime
Examples
%>
tau_gen_wrapper hdf5.h /usr/lib/libhdf5.a
This generates a wrapper library that may
optTauWrapFile=<wrapperdir>/link_options.tau
be
linked
in
using
TAU_OPTIONS
Notes
tau_gen_wrapper reads the TAU_MAKEFILE environment variable to get PDT settings
90
-
Tools
Name
tau_pin -- Instruments application at run time using Intel's PIN library
tau_pin [-n proc_num] [-r rules] {--} [myapp] [myargs]
Options
-n proc_num
This argument enables multple instances of MPI applications launched with MPIEXEC. proc_num is the parameter indicating number of MPI process instances to be
launched. This argument is optional and one can profile MPI application even with
single process instance without this argument.
-r rule
This argument is specification rule for profiling the application. It allows selective
profiling by specifying the "rule". The rule is a wildcard expression token which will
indicate the area of profiling. It can be only the routine specification like "*" which
indicates it'll instrument all the routines in the EXE or MPI routines. One can further
specify the routines on a particular dll by the rule "somedll.dll!*". The dll name can
also be in regular expression. We treat the application exe and MPI routines as special cases and specifying only the routines is allowed.
myapp
It's the application exe. This application can be Windows or console application. Profiling large Windows applications might suffer from degraded performance and interactability. Specifying a limited number of interesting routines can help.
myargs
It's the command line arguments of the application.
Examples
To profile routines in mytest.exe with prefix "myf":
tau_pin -r myf.*
-- mytest.exe
To profile all routines in mpitest.exe ( no need to specify any rule for all ):
tau_pin
mpitest.exe
to profile only MPI routines in mpitest.exe by launching two instances:
tau_pin -n 2 -r _MPI_.* -- mpitest.exe
Wildcards
•
* for anything, for example *MPI* means any string having MPI in between any other characters.
•
? It's a placeholder wild card ?MPI* means any character followed by MPI and followed by any
string, example: ??Try could be __Try or MyTry or MeTry etc.
91
Tools
Name
tau_java -- Instruments java applications at runtime using JVMTI
tau_java [optionsjavaprogram] [ args]
Options
-help
Displays help information.
-verbose
Report the arguments of the script before it runs.
-tau:agentlib=<agentlib>
By default tau_java uses the most recently configured jdk, you
can specify a different one here.
-tau:java=<javapath>
Path to a java binary, by default uses the one corresponding to the
most recently configured jdk.
-tau:bootclasspath=
<bootclasspath>
To modify the bootclasspath to point to a different jar, not usually
necessary.
-tau:include=<item>
Only instrument these methods or classes. Separate multiple
classes and methods with semicolons
-tau:exclude=<item>
Exclude the listed classes and methods. Separate multiple classes
and methods with semicolons
args
the command line arguments of the java application.
92
Tools
Name
tau_cupti_avail -- Detects the available CUPTI counters on the a each GPU device.
tau_cupti_avail [-c counter names]
Options
-c counter names
Checks which of a colon seperated list of CUPTI counter names can be recorded.
93
Tools
Name
tau_run -- Instruments and executes binaries to generate performance data. (DyninstAPI based instrumentor)
Options
-v
optional verbose option
-o outfile
for binary rewriting
-T<option>
: specify TAU option
-loadlib=<file.so >
: specify additional load library
-XrunTAU-<options>
specify TAU library directly
94
Tools
Name
tau_rewrite -- Rewrites binaries using Maqao if Tau is configured using PDT 3.17+ at the routine level.
If it doesn't find the Maqao package from PDT 3.17, it reverts to tau_run (DyninstAPI based instrumentor).
Options
-o outfile
specify instrumented output file
-T
specify TAU option (CUPTI, DISABLE, MPI, OPENMP, PDT, PGI,
PROFILE, SCOREP, SERIAL)
-loadlib= file.so
specify additional load library
-s
dryrun without executing
-v
long verbose mode
-v1
short verbose mode
-XrunTAUsh- options
specify TAU library directly
Notes
Defaults if unspecified: -T MPI
MPI is assumed unless SERIAL is specified
Example
tau_rewrite -T papi,pdt a.out -o a.inst
mpirun -np 4 ./a.inst
95
Part I. TAUdb
Table of Contents
8. Introduction .......................................................................................................... 98
8.1. Prerequisites ....................................................................................... 98
8.2. Installation ......................................................................................... 98
9. Using TAUdb ..................................................................................................... 101
9.1. perfdmf_createapp (deprecated - only supported for older PerfDMF databases) 101
9.2. perfdmf_createexp (deprecated - only supported for older PerfDMF databases) 101
9.3. taudb_loadtrial .................................................................................. 101
9.4. TAUdb Views .................................................................................. 103
10. Database Schema ............................................................................................... 104
10.1. SQL for TAUdb .............................................................................. 104
11. TAUdb C API ................................................................................................... 114
11.1. TAUdb C API Overview ................................................................... 114
11.2. TAUdb C Structures ......................................................................... 114
11.3. TAUdb C API ................................................................................. 120
11.4. TAUdb C API Examples ................................................................... 126
11.4.1. Creating a trial and inserting into the database ............................ 126
11.4.2. Querying a trial from the database ............................................ 128
97
Chapter 8. Introduction
TAUdb (TAU Database), formerly known as PerfDMF (Performance Data Management Framework) is
a an API/Toolkit that sits atop a DBMS to manage and analyze performance data. The API is available
in its native Java form as well as C.
8.1. Prerequisites
1.
A supported Database Management System (DBMS). TAUdb currently supports PostgreSQL,
MySQL, Oracle, H2, and Derby. For use with the C API, only PostgreSQL is supported (SQLite
support is currently being evaluated). Because they are Java only, H2 and Derby can NO be accessed with the C API.
2.
Java 1.5.
3.
If the C API is desired, a working C compiler is required, along with the following libraries: libpq
(PostgreSQL libraries), libxml2, libz, libuuid. These libraries are all commonly installed by default
on *NIX systems.
8.2. Installation
The TAUdb utilities and applications are installed as part of the standard TAU release. Shell scripts are
installed in the TAU bin directory to configure and run the utilities. It is assumed that the user has installed TAU and run TAU's configure and 'make install'.
1.
(Optionally) Create a database. This step will depend on the user's chosen DBMS.
•
H2: Because it is an embedded, file-based DBMS, H2 does not require creating the database
before configuring TAUdb. TAUdb takes advantage of the "auto-server" capabilities in H2, so
multiple clients can connect to the same database at the same time. Users should use the H2
DBMS if they expect to maintain a small to moderate local repository of performance data, and
want the convenience of connecting to the database from multiple clients.
•
Derby: Because it is an embedded, file-based DBMS, Derby does not require creating the database before configuring TAUdb. Be advised that the Derby DBMS does not allow multiple clients to connect to the same database. For that reason, we suggest users use the H2 DBMS if a
file-based database is desired. Derby support is maintained for backwards compatability.
•
PostgreSQL:
$ createdb -O taudb taudb
Or, from psql
psql=# create database taudb with owner = taudb;
•
MySQL: From the MySQL prompt
mysql> create database taudb;
•
Oracle: It is recommended that you create a tablespace for taudb:
98
Introduction
create tablespace taudb
datafile '/path/to/somewhere' size 500m reuse;
Then, create a user that has this tablespace as default:
create user amorris identified by db;
grant create session to amorris;
grant create table to amorris;
grant create sequence to amorris;
grant create trigger to amorris;
alter user amorris quota unlimited on taudb;
alter user amorris default tablespace taudb;
TAUdb is set up to use the Oracle Thin Java driver. You will have to obtain this jar file for your
DBMS. In our case, it was ojdbc14.jar.
2.
Configure a TAUdb connection. To configure TAUdb, run the taudb_configure program from the
TAU bin directory.
The configuration program will prompt the user for several values. The default values will work for
most users. When configuration is complete, it will connect to the database and test the configuration. If the configuration is valid and the schema is not already found in the database (as will be the
case on initial configuration), the schema will be uploaded. Be sure to specify the correct version of
the schema for your DBMS.
An example session for configuring a database is below. The user is creating an H2 database, with
default settings including no username and no password (recommended for file-based databases
when security is not an issue).
$ taudb_configure
Configuration file NOT found...
a new configuration file will be created.
Welcome to the configuration program for PerfDMF.
This program will prompt you for some information necessary to
ensure the desired behavior for the PerfDMF tools.
You will now be prompted for new values, if desired. The current
or default values for each prompt are shown in parenthesis.
To accept the current/default value, just press Enter/Return.
Please enter the name of this configuration.
():documentation_example
Please enter the database vendor (oracle, postgresql, mysql, db2,
derby or h2).
(h2):
Please enter the JDBC jar file.
(/Users/khuck/src/tau2/apple/lib/h2.jar):
Please enter the JDBC Driver name.
(org.h2.Driver):
Please enter the path to the database directory.
(/Users/khuck/.ParaProf/documentation_example):
Please enter the database username.
():
Store the database password in CLEAR TEXT in your configuration
file? (y/n):y
Please enter the database password:
Please enter the PerfDMF schema file.
99
Introduction
(/Users/khuck/src/tau2/etc/taudb.sql):
Writing configuration file:
/Users/khuck/.ParaProf/perfdmf.cfg.documentation_example
Now testing your database connection.
Database created, command:
jdbc:h2:/Users/khuck/.ParaProf/documentation_example/perfdmf;AUTO_SERVER=TRUE;c
Uploading Schema: /Users/khuck/src/tau2/etc/taudb.sql
Found /Users/khuck/src/tau2/etc/taudb.sql ... Loading
Successfully uploaded schema
Database connection successful.
Configuration complete.
100
Chapter 9. Using TAUdb
The easiest way to interact with TAUdb is to use ParaProf which provides a GUI interface to all of the
database information. In addition, the following commandline utilities are provided.
9.1. perfdmf_createapp (deprecated - only supported for older PerfDMF databases)
This utility creates applications with a given name
$ perfdmf_createapp -n "New Application"
Created Application, ID: 24
9.2. perfdmf_createexp (deprecated - only supported for older PerfDMF databases)
This utility creates experiments with a given name, under a specified application
$ perfdmf_createexp -a 24 -n "New Experiment"
Created Experiment, ID: 38
9.3. taudb_loadtrial
This utility uploads a trial to the database with a given name, under a specified experiment
$ taudb_loadtrial -h
Usage: perfdmf_loadtrial -a <appName> -x <expName> -n <name>
[options] <files>
Required Arguments:
-n, --name <text>
Specify the name of the trial
-a, --applicationname <string> Specify associated application name
for this trial
-x, --experimentname <string> Specify associated experiment name
for this trial
...or...
-n, --name <text>
-e, --experimentid <number>
Specify the name of the trial
Specify associated experiment ID
for this trial
Optional Arguments:
-c, --config <name>
-g, --configFile <file>
Specify the name of the configuration to use
Specify the configuration file to use
(overrides -c)
-f, --filetype <filetype> Specify type of performance data, options
are: profiles (default), pprof, dynaprof,
mpip, gprof, psrun, hpm, packed, cube,
hpc, ompp, snap, perixml, gptl, paraver,
ipm, google
101
Using TAUdb
-t, --trialid <number>
-i, --fixnames
-z, --usenull
Specify trial ID
Use the fixnames option for gprof
Include NULL values as 0 for mean
calculation
-r, --reduce <percentage> Aggregate all timers less than percentage
as "other"
-m, --metadata <filename> XML metadata for the trial
Notes:
For the TAU profiles type, you can specify either a specific set
of profile files on the commandline, or you can specify a directory
(by default the current directory). The specified directory will be
searched for profile.*.*.* files, or, in the case of multiple counters,
directories named MULTI_* containing profile data.
Examples:
perfdmf_loadtrial -e 12 -n "Batch 001"
This will load profile.* (or multiple counters directories
MULTI_*) into experiment 12 and give the trial the name
"Batch 001"
perfdmf_loadtrial -e 12 -n "HPM data 01" -f hpm perfhpm*
This will load perfhpm* files of type HPMToolkit into experiment
12 and give the trial the name "HPM data 01"
perfdmf_loadtrial -a "NPB2.3" -x "parametric" -n "64" par64.ppk
This will load packed profile par64.ppk into the experiment named
"parametric" under the application named "NPB2.3" and give the
trial the name "64". The application and experiment will be
created if not found.
TAUdb supports a large number of parallel profile formats:
•
TAU Profiles (profiles) - Output from the TAU measurement library, these files generally take the
form of profile.X.X.X, one for each node/context/thread combination. When multiple counters
are used, each metric is located in a directory prefixed with "MULTI__". To launch ParaProf with all
the metrics, simply launch it from the root of the MULTI__ directories.
•
ParaProf Packed Format (ppk) - Export format supported by PerfDMF/ParaProf. Typically .ppk.
•
TAU Merged Profiles (snap) - Merged and snapshot profile format supported by TAU. Typically
tauprofile.xml.
•
TAU pprof (pprof) - Dump Output from TAU's pprof -d. Provided for backward compatibility
only.
•
DynaProf (dynaprof) - Output From DynaProf's wallclock and papi probes.
•
mpiP (mpip) - Output from mpiP.
•
gprof (gprof) - Output from gprof, see also the --fixnames option.
•
PerfSuite (psrun) - Output from PerfSuite psrun files.
•
HPM Toolkit (hpm) - Output from IBM's HPM Toolkit.
•
Cube (cube) - Output from Kojak Expert tool for use with Cube.
102
Using TAUdb
•
Cube3 (cube3) - Output from Kojak Expert tool for use with Cube3 and Cube4.
•
HPCToolkit (hpc) - XML data from hpcquick. Typically, the user runs hpcrun, then hpcquick on
the resulting binary file.
•
OpenMP Profiler (ompp) - CSV format from the ompP OpenMP
(http://www.ompp-tool.com). The user must use OMPP_OUTFORMAT=CVS.
•
PERI XML (perixml) - Output from the PERI data exchange format.
•
General Purpose Timing Library (gptl) - Output from the General Purpose Timing Library.
•
Paraver (paraver) - 2D output from the Paraver trace analysis tool from BSC.
•
IPM (ipm) - Integrated Performance Monitoring format, from NERSC.
•
Google (google) - Google Profiles.
Profiler
9.4. TAUdb Views
In order to provide flexible data management, the application / experiment / trial hierarchy was removed
in the conversion from PerfDMF to TAUdb. In addition, trial metadata was promoted from an XML
blob in PerfDMF to queryable tables. Users can now organize their data in arbitrary hierarchies using
Views and SubViews. Creating and using Views is outlined in the ParaProf User Manual, in Chapter 2.
103
Chapter 10. Database Schema
The database schema in TAUdb is designed to flexibly and efficiently store multidimensional parallel
performance data. There are 5 dimensions to the actual timer measurements, and 4 dimensions to the
counter measurements
Timer dimensions
1.
Process and thread of execution
2.
Timer source code location (i.e. foo())
3.
Metric of interest (i.e. FP_OPS, TIME)
4.
Phase of execution (i.e. iteration number, timestamp)
5.
Dynamic timer context (i.e. parameter values)
Counter dimensions
1.
Process and thread of execution
2.
Timer source code location (i.e. foo())
3.
Phase of execution (i.e. iteration number, timestamp)
4.
Dynamic timer context (i.e. parameter values)
10.1. SQL for TAUdb
Below is the SQL schema definition for TAUdb.
/****************************/
/* CREATE THE STATIC TABLES */
/****************************/
CREATE TABLE schema_version (
version
INT NOT NULL,
description VARCHAR NOT NULL
);
/* IF THE SCHEMA IS MODIFIED, INCREMENT THIS VALUE */
/* 0 = PERFDMF (ORIGINAL) */
/* 1 = TAUDB (APRIL, 2012) */
/*VALUES (1, 'TAUdb redesign from Spring, 2012');*/
INSERT INTO schema_version (version, description)
VALUES (2, 'Changes after Nov. 9, 2012 release');
/* These are
CREATE TABLE
id
name
description
);
our supported parsers. */
data_source (
INT UNIQUE NOT NULL,
VARCHAR NOT NULL,
VARCHAR
104
Database Schema
INSERT INTO data_source (name,id,description)
VALUES ('ppk',0,'TAU Packed profiles (TAU)');
INSERT INTO data_source (name,id,description)
VALUES ('TAU profiles',1,'TAU profiles (TAU)');
INSERT INTO data_source (name,id,description)
VALUES ('DynaProf',2,'PAPI DynaProf profiles (UTK)');
INSERT INTO data_source (name,id,description)
VALUES ('mpiP',3,'mpiP: Lightweight, Scalable MPI Profiling (Vetter, Chambreau)')
INSERT INTO data_source (name,id,description)
VALUES ('HPM',4,'HPM Toolkit profiles (IBM)');
INSERT INTO data_source (name,id,description)
VALUES ('gprof',5,'gprof profiles (GNU)');
INSERT INTO data_source (name,id,description)
VALUES ('psrun',6,'PerfSuite psrun profiles (NCSA)');
INSERT INTO data_source (name,id,description)
VALUES ('pprof',7,'TAU pprof.dat output (TAU)');
INSERT INTO data_source (name,id,description)
VALUES ('Cube',8,'Cube data (FZJ)');
INSERT INTO data_source (name,id,description)
VALUES ('HPCToolkit',9,'HPC Toolkit profiles (Rice Univ.)');
INSERT INTO data_source (name,id,description)
VALUES ('SNAP',10,'TAU Snapshot profiles (TAU)');
INSERT INTO data_source (name,id,description)
VALUES ('OMPP',11,'OpenMP Profiler profiles (Fuerlinger)');
INSERT INTO data_source (name,id,description)
VALUES ('PERIXML',12,'Data Exchange Format (PERI)');
INSERT INTO data_source (name,id,description)
VALUES ('GPTL',13,'General Purpose Timing Library (ORNL)');
INSERT INTO data_source (name,id,description)
VALUES ('Paraver',14,'Paraver profiles (BSC)');
INSERT INTO data_source (name,id,description)
VALUES ('IPM',15,'Integrated Performance Monitoring (NERSC)');
INSERT INTO data_source (name,id,description)
VALUES ('Google',16,'Google profiles (Google)');
INSERT INTO data_source (name,id,description)
VALUES ('Cube3',17,'Cube 3D profiles (FZJ)');
INSERT INTO data_source (name,id,description)
VALUES ('Gyro',100,'Self-timing profiles from Gyro application');
INSERT INTO data_source (name,id,description)
VALUES ('GAMESS',101,'Self-timing profiles from GAMESS application');
INSERT INTO data_source (name,id,description)
VALUES ('Other',999,'Other profiles');
/* threads make it convenient to identify timer values.
Special values for thread_index:
-1 mean (nulls ignored)
-2 total
-3 stddev (nulls ignored)
-4 min
-5 max
-6 mean (nulls are 0 value)
-7 stddev (nulls are 0 value)
*/
CREATE TABLE derived_thread_type (
id INT NOT NULL,
name VARCHAR NOT NULL,
description VARCHAR NOT NULL
);
INSERT INTO derived_thread_type (id, name, description)
VALUES (-1, 'MEAN', 'MEAN (nulls ignored)');
INSERT INTO derived_thread_type (id, name, description)
VALUES (-2, 'TOTAL', 'TOTAL');
105
Database Schema
INSERT INTO derived_thread_type (id, name, description)
VALUES (-3, 'STDDEV', 'STDDEV (nulls ignored)');
INSERT INTO derived_thread_type (id, name, description)
VALUES (-4, 'MIN', 'MIN');
INSERT INTO derived_thread_type (id, name, description)
VALUES (-5, 'MAX', 'MAX');
INSERT INTO derived_thread_type (id, name, description)
VALUES (-6, 'MEAN', 'MEAN (nulls are 0 value)');
INSERT INTO derived_thread_type (id, name, description)
VALUES (-7, 'STDDEV', 'STDDEV (nulls are 0 value)');
/**************************/
/* CREATE THE TRIAL TABLE */
/**************************/
/* trials are the top level table */
CREATE TABLE trial (
id
SERIAL NOT NULL PRIMARY KEY,
name
VARCHAR,
/* where did this data come from? */
data_source
INT,
/* number of processes */
node_count
INT,
/* legacy values - these are actually "max" values - i.e. not all nodes have
* this many threads */
contexts_per_node
INT,
/* how many threads per node? */
threads_per_context INT,
/* total number of threads */
total_threads
INT,
/* reference to the data source table. */
FOREIGN KEY(data_source) REFERENCES data_source(id)
ON DELETE NO ACTION ON UPDATE NO ACTION
);
/******************************/
/* CREATE THE DATA DIMENSIONS */
/******************************/
/* threads are the "location" dimension */
CREATE TABLE thread (
id
SERIAL NOT NULL PRIMARY KEY,
/* trial this thread belongs to */
trial
INT NOT NULL,
/* process rank, really */
node_rank
INT NOT NULL,
/* legacy value */
context_rank INT NOT NULL,
/* thread rank relative to the process */
thread_rank INT NOT NULL,
/* thread index from 0 to N-1 */
thread_index INT NOT NULL,
FOREIGN KEY(trial) REFERENCES trial(id) ON DELETE
NO ACTION ON UPDATE NO ACTION
);
/* metrics are things like num_calls, num_subroutines, TIME, PAPI
counters, and derived metrics. */
CREATE TABLE metric (
id
SERIAL NOT NULL PRIMARY KEY,
/* trial this value belongs to */
106
Database Schema
trial
INT NOT NULL,
/* name of the metric */
name
VARCHAR NOT NULL,
/* if this metric is derived by one of the tools */
derived BOOLEAN NOT NULL DEFAULT FALSE,
FOREIGN KEY(trial) REFERENCES trial(id)
ON DELETE NO ACTION ON UPDATE NO ACTION
);
/* timers are timers, capturing some interval value. For callpath or
phase profiles, the parent refers to the calling function or phase. */
CREATE TABLE timer (
id
SERIAL NOT NULL PRIMARY KEY,
/* trial this value belongs to */
trial
INT NOT NULL,
/* name of the timer */
name
VARCHAR NOT NULL,
/* short name of the timer - without source or parameter info */
short_name
VARCHAR NOT NULL,
/* filename */
source_file
VARCHAR,
/* line number of the start of the block of code */
line_number
INT,
/* line number of the end of the block of code */
line_number_end
INT,
/* column number of the start of the block of code */
column_number
INT,
/* column number of the end of the block of code */
column_number_end INT,
FOREIGN KEY(trial) REFERENCES trial(id)
ON DELETE NO ACTION ON UPDATE NO ACTION
);
/* timer index on the trial and name columns */
CREATE INDEX timer_trial_index on timer (trial, name);
/***********************************/
/* CREATE THE TIMER RELATED TABLES */
/***********************************/
/* timer groups are the groups such as TAU_DEFAULT,
MPI, OPENMP, TAU_PHASE, TAU_CALLPATH, TAU_PARAM, etc.
This mapping table allows for NxN mappings between timers
and groups */
CREATE TABLE timer_group (
timer INT,
group_name VARCHAR NOT NULL,
FOREIGN KEY(timer) REFERENCES timer(id)
ON DELETE NO ACTION ON UPDATE NO ACTION
);
/* index for faster queries into groups */
CREATE INDEX timer_group_index on timer_group (timer, group_name);
/*
*
*
*
*
timer parameters are parameter based profile values.
an example is foo (x,y) where x=4 and y=10. In that example,
timer would be the index of the timer with the
name 'foo (x,y) <x>=<4> <y>=<10>'. This table would have two
entries, one for the x value and one for the y value. */
CREATE TABLE timer_parameter (
timer
INT,
107
Database Schema
parameter_name VARCHAR NOT NULL,
parameter_value VARCHAR NOT NULL,
FOREIGN KEY(timer) REFERENCES timer(id)
ON DELETE NO ACTION ON UPDATE NO ACTION
);
/*
*
*
*
timer callpath have the information about the call graph in a trial.
If the profile is "flat", these will all have no parents. Otherwise,
the parent points to a node in the callgraph, the calling timer
(function). */
CREATE TABLE timer_callpath (
id
SERIAL NOT NULL PRIMARY KEY,
/* what timer is this? */
timer
INT NOT NULL,
/* what is the parent timer? */
parent
INT,
FOREIGN KEY(timer) REFERENCES timer(id)
ON DELETE NO ACTION ON UPDATE NO ACTION,
FOREIGN KEY(parent) REFERENCES timer_callpath(id)
ON DELETE NO ACTION ON UPDATE NO ACTION
);
/*
*
*
*
*
*
By definition, profiles have no time data. However, there are a few
examples where time ranges make sense, such as tracking call stacks
or associating metadata to a particular phase. The time_range table
is used to give other measurements a time context. The iteration
start and end can be used to indicate which loop iterations or
calls to a function are relevant for this time range. */
CREATE TABLE time_range (
id SERIAL NOT NULL PRIMARY KEY,
/* starting iteration */
iteration_start INT NOT NULL,
/* ending iteration. */
iteration_end INT,
/* starting timestamp */
time_start BIGINT NOT NULL,
/* ending timestamp. */
time_end BIGINT
);
/*
*
*
*
timer_call_data records have the dynamic information for when a node
in the callgraph is visited by a thread. If you are tracking dynamic
callstacks, you would use the time_range field. If you are storing
snapshot data, you would use the time_range field. */
CREATE TABLE timer_call_data (
id
SERIAL NOT NULL PRIMARY KEY,
/* what callgraph node is this? */
timer_callpath
INT NOT NULL,
/* what thread is this? */
thread
INT NOT NULL,
/* how many times this timer was called */
calls
INT,
/* how many subroutines this timer called */
subroutines INT,
/* what is the time_range? this is for supporting snapshots */
time_range INT,
FOREIGN KEY(timer_callpath) REFERENCES timer_callpath(id)
ON DELETE NO ACTION ON UPDATE NO ACTION,
FOREIGN KEY(thread) REFERENCES thread(id)
ON DELETE NO ACTION ON UPDATE NO ACTION,
FOREIGN KEY(time_range) REFERENCES time_range(id)
108
Database Schema
ON DELETE NO ACTION ON UPDATE NO ACTION
);
/* timer values have the timer of one timer
on one thread for one metric, at one location on the callgraph. */
CREATE TABLE timer_value (
/* what node in the callgraph and thread is this? */
timer_call_data
INT NOT NULL,
/* what metric is this? */
metric
INT NOT NULL,
/* The inclusive value for this timer */
inclusive_value
DOUBLE PRECISION,
/* The exclusive value for this timer */
exclusive_value
DOUBLE PRECISION,
/* The inclusive percent for this timer */
inclusive_percent
DOUBLE PRECISION,
/* The exclusive percent for this timer */
exclusive_percent
DOUBLE PRECISION,
/* The variance for this timer */
sum_exclusive_squared DOUBLE PRECISION,
FOREIGN KEY(timer_call_data) REFERENCES timer_call_data(id)
ON DELETE NO ACTION ON UPDATE NO ACTION,
FOREIGN KEY(metric) REFERENCES metric(id)
ON DELETE NO ACTION ON UPDATE NO ACTION
);
/* one metric, one thread, one timer */
CREATE INDEX timer_value_index on timer_value (timer_call_data, metric);
/*************************************/
/* CREATE THE COUNTER RELATED TABLES */
/*************************************/
/* counters measure some counted value. */
CREATE TABLE counter (
id
SERIAL
NOT NULL PRIMARY KEY,
trial
INT
NOT NULL,
name
VARCHAR
NOT NULL,
FOREIGN KEY(trial) REFERENCES trial(id)
ON DELETE NO ACTION ON UPDATE NO ACTION
);
/* counter index on the trial and name columns */
CREATE INDEX counter_trial_index on counter (trial, name);
CREATE TABLE counter_value (
/* what counter is this? */
counter
INT NOT NULL,
/* where in the callgraph? */
timer_callpath
INT,
/* what thread is this? */
thread
INT NOT NULL,
/* The total number of samples */
sample_count
INT,
/* The maximum value seen */
maximum_value
DOUBLE PRECISION,
/* The minimum value seen */
minimum_value
DOUBLE PRECISION,
/* The mean value seen */
mean_value
DOUBLE PRECISION,
/* The variance for this counter */
standard_deviation DOUBLE PRECISION,
109
Database Schema
FOREIGN KEY(counter) REFERENCES counter(id)
ON DELETE NO ACTION ON UPDATE NO ACTION,
FOREIGN KEY(timer_callpath) REFERENCES timer_callpath(id)
ON DELETE NO ACTION ON UPDATE NO ACTION,
FOREIGN KEY(thread) REFERENCES thread(id)
ON DELETE NO ACTION ON UPDATE NO ACTION
);
/* one thread, one counter */
CREATE INDEX counter_value_index on counter_value (counter, thread);
/**************************************/
/* CREATE THE METADATA RELATED TABLES */
/**************************************/
/* primary metadata is metadata that is not nested, does not
contain unique data for each thread. */
CREATE TABLE primary_metadata (
trial
INT NOT NULL,
name
VARCHAR NOT NULL,
value
VARCHAR,
FOREIGN KEY(trial) REFERENCES trial(id)
ON DELETE NO ACTION ON UPDATE NO ACTION
);
/* create an index for faster queries against the primary_metadata table */
CREATE INDEX primary_metadata_index on primary_metadata (trial, name);
/* secondary metadata is metadata that could be nested, could
contain unique data for each thread, and could be an array. */
CREATE TABLE secondary_metadata (
id
VARCHAR NOT NULL PRIMARY KEY,
/* trial this value belongs to */
trial
INT NOT NULL,
/* this metadata value could be associated with a thread */
thread
INT,
/* this metadata value could be associated with a timer that happened */
timer_callpath
INT,
/* which call to the context timer was this? */
time_range
INT,
/* this metadata value could be a nested structure */
parent
VARCHAR,
/* the name of the metadata field */
name
VARCHAR NOT NULL,
/* the value of the metadata field */
value
VARCHAR,
/* this metadata value could be an array - so tokenize it */
is_array BOOLEAN DEFAULT FALSE,
FOREIGN KEY(trial) REFERENCES trial(id)
ON DELETE NO ACTION ON UPDATE NO ACTION,
FOREIGN KEY(thread) REFERENCES thread(id)
ON DELETE NO ACTION ON UPDATE NO ACTION,
FOREIGN KEY(timer_callpath) REFERENCES timer_callpath(id)
ON DELETE NO ACTION ON UPDATE NO ACTION,
FOREIGN KEY(parent) REFERENCES secondary_metadata(id)
ON DELETE NO ACTION ON UPDATE NO ACTION,
FOREIGN KEY(time_range) REFERENCES time_range(id)
ON DELETE NO ACTION ON UPDATE NO ACTION
);
/* create an index for faster queries against the secondary_metadata table */
CREATE INDEX secondary_metadata_index on secondary_metadata
110
Database Schema
(trial, name, thread, parent);
/**************************************/
/* CREATE THE METADATA RELATED TABLES */
/**************************************/
/* this is the view table, which organizes and filters trials */
create table taudb_view (
id
SERIAL
NOT NULL
PRIMARY KEY,
/* views can be nested */
parent
INTEGER
NULL,
/* name of the view */
name
VARCHAR
NOT NULL,
/* view conjoin type for parameters */
conjoin
VARCHAR
NOT NULL,
FOREIGN KEY (parent) REFERENCES taudb_view(id)
ON DELETE CASCADE ON UPDATE CASCADE
);
create table taudb_view_parameter (
/* the view ID */
taudb_view
INTEGER
NOT NULL,
/* the table name for the where clause */
table_name
VARCHAR
NOT NULL,
/* the column name for the where clause.
If the table_name is one of the metadata tables, this is the
value of the "name" column */
column_name
VARCHAR
NOT NULL,
/* the operator for the where clause */
operator
VARCHAR
NOT NULL,
/* the value for the where clause */
value
VARCHAR
NOT NULL,
FOREIGN KEY (taudb_view) REFERENCES taudb_view(id)
ON DELETE CASCADE ON UPDATE CASCADE
);
/* simple view of all trials */
INSERT INTO taudb_view (parent, name, conjoin)
VALUES (NULL, 'All Trials', 'and');
/* must have a parameter or else the sub views for this view
do not work correctly*/
INSERT INTO taudb_view_parameter
(taudb_view, table_name, column_name, operator, value)
VALUES (1, 'trial', 'total_threads', '>', '-1');
/* the application and experiment columns are not used in the
latest schema, but keeping them makes the code in
PerfExplorer simpler. */
create table analysis_settings (
id
SERIAL
NOT NULL
PRIMARY KEY,
taudb_view
INTEGER
NULL,
application
INTEGER
NULL,
experiment
INTEGER
NULL,
trial
INTEGER
NULL,
metric
INTEGER
NULL,
method
VARCHAR(255)
NOT NULL,
dimension_reduction VARCHAR(255)
NOT NULL,
normalization
VARCHAR(255)
NOT NULL,
FOREIGN KEY (taudb_view) REFERENCES taudb_view(id)
ON DELETE CASCADE ON UPDATE CASCADE,
FOREIGN KEY (trial) REFERENCES trial(id)
ON DELETE CASCADE ON UPDATE CASCADE,
FOREIGN KEY (metric) REFERENCES metric(id)
ON DELETE CASCADE ON UPDATE CASCADE
111
Database Schema
);
create table analysis_result (
id
SERIAL
analysis_settings
INTEGER
description
VARCHAR(255)
thumbnail_size
INTEGER
image_size
INTEGER
thumbnail
BYTEA
image
BYTEA
result_type
INTEGER
);
NOT NULL
NOT NULL,
NOT NULL,
NULL,
NULL,
NULL,
NULL,
NOT NULL
PRIMARY KEY,
/* Performance indexes! */
create index trial_name_index on trial(name);
create index timer_name_index on timer(name);
CREATE INDEX timer_callpath_parent on timer_callpath(parent);
CREATE INDEX thread_trial on thread(trial);
CREATE INDEX timer_call_data_timer_callpath on
timer_call_data(timer_callpath);
CREATE INDEX counter_name_index on counter(name);
CREATE INDEX timer_call_data_thread on timer_call_data(thread);
/* SHORT TERM FIX! These views make sure that charts
(mostly) work... for now. */
DROP
DROP
DROP
DROP
DROP
DROP
DROP
DROP
DROP
DROP
VIEW
VIEW
VIEW
VIEW
VIEW
VIEW
VIEW
VIEW
VIEW
VIEW
IF
IF
IF
IF
IF
IF
IF
IF
IF
IF
EXISTS
EXISTS
EXISTS
EXISTS
EXISTS
EXISTS
EXISTS
EXISTS
EXISTS
EXISTS
interval_location_profile;
interval_mean_summary;
interval_total_summary;
interval_event_value;
interval_event;
atomic_location_profile;
atomic_mean_summary;
atomic_total_summary;
atomic_event_value;
atomic_event;
CREATE OR REPLACE VIEW interval_event
(id, trial, name, group_name, source_file, line_number, line_number_end)
AS
SELECT tcp.id, t.trial, t.name, tg.group_name,
t.source_file, t.line_number, t.line_number_end
FROM timer_callpath tcp
INNER JOIN timer t ON tcp.timer = t.id
INNER JOIN timer_group tg ON tg.timer = t.id;
CREATE OR REPLACE VIEW interval_event_value
(interval_event, node, context, thread, metric, inclusive_percentage,
inclusive, exclusive_percentage, exclusive, call, subroutines,
inclusive_per_call, sum_exclusive_squared)
AS SELECT tcd.timer_callpath, t.node_rank, t.context_rank,
t.thread_rank, tv.metric, tv.inclusive_percent,
tv.inclusive_value, tv.exclusive_percent, tv.exclusive_value, tcd.calls,
tcd.subroutines, tv.inclusive_value / tcd.calls, tv.sum_exclusive_squared
FROM timer_value tv
INNER JOIN timer_call_data tcd on tv.timer_call_data = tcd.id
INNER JOIN thread t on tcd.thread = t.id;
CREATE OR REPLACE VIEW interval_location_profile
AS SELECT * from interval_event_value WHERE thread >= 0;
CREATE OR REPLACE VIEW interval_total_summary
AS SELECT * from interval_event_value WHERE thread = -2;
112
Database Schema
CREATE OR REPLACE VIEW interval_mean_summary
AS SELECT * from interval_event_value WHERE thread = -1;
CREATE OR REPLACE VIEW atomic_event
(id, trial, name, group_name, source_file, line_number)
AS SELECT c.id, c.trial, c.name, NULL, NULL, NULL
FROM counter c;
CREATE OR REPLACE VIEW atomic_event_value
(atomic_event, node, context, thread, sample_count,
maximum_value, minimum_value, mean_value, standard_deviation)
AS SELECT cv.counter, t.node_rank, t.context_rank, t.thread_rank,
cv.sample_count, cv.maximum_value, cv.minimum_value, cv.mean_value,
cv.standard_deviation FROM counter_value cv
INNER JOIN thread t ON cv.thread = t.id;
CREATE OR REPLACE VIEW atomic_location_profile
AS SELECT * FROM atomic_event_value WHERE thread >= 0;
CREATE OR REPLACE VIEW atomic_total_summary
AS SELECT * FROM atomic_event_value WHERE thread = -2;
CREATE OR REPLACE VIEW atomic_mean_summary
AS SELECT * FROM atomic_event_value WHERE thread >= -1;
113
Chapter 11. TAUdb C API
11.1. TAUdb C API Overview
The C API for TAUdb is currently under development, but there is a beta version of the API available.
The API provides the following capabilities:
•
Loading trials from the database
•
Inserting trials into the database
•
Parsing TAU profile files
11.2. TAUdb C Structures
The C structures are roughly organized as a tree, with a trial object at the root.
•
taudb_trial: A top-level structure which contains the collections of all the performance data dimensions.
•
taudb_primary_metadata: Name/value pairs which describe the properties of the trial.
•
taudb_secondary_metadata: Name/value pairs which describe the properties of the trial. Unlike
primary_metadata values, secondary_metadata objects can have complex value types. They are also
associated with a measurement context - a thread of execution, a timer, a timestamp, an iteration, etc.
•
taudb_thread: A structure which represents a thread of execution in the parallel measurement.
•
taudb_time_range: A structure which holds a time-range value of beginning and ending iteration
numbers or timestamps.
•
taudb_metric: A structure which represents a unit of measurement, such as TIME, FP_OPS,
L1_DCM, etc.
•
taudb_timer: A structure which represents a region of code. For example, a phase, a function, a
loop, a basic block, or even a line of code.
•
taudb_timer_parameter: A structure which represents parameter values, when parameter based
profiling is used.
•
taudb_timer_group: A structure which represents a semantic grouping of timers, such as "I/O",
"MPI", "OpenMP", etc.
•
taudb_timer_callpath: A structure which represents a node in the dynamic callpath tree.
Timer_callpaths with a null parent are either top level timers, or a timers in a flat profile.
•
taudb_timer_call_data: A structure which represents a tuple between a thread of execution and a
node on the timer callpath tree.
•
taudb_timer_value: A structure which represents a tuple between a timer_call_data object and a
metric. The timer_value contains the measurement of one metric for one timer on one thread of execution.
114
TAUdb C API
•
taudb_counter: A structure which represents a counter in the profile. For example, the number of
bytes transferred on an MPI_Send() timer.
•
taudb_counter_value: A structure which represents a counter measurement on one thread of execution.
Below are the object definitions, from the TAUdb C header file.
#ifndef TAUDB_STRUCTS_H
#define TAUDB_STRUCTS_H 1
#include "time.h"
#include "uthash.h"
#include "taudb_structs.h"
#if defined __TAUDB_POSTGRESQL__
#include "libpq-fe.h"
#elif defined __TAUDB_SQLITE__
#include "sqlite3.h"
#endif
#ifndef
#define
#define
typedef
#endif
boolean
TRUE 1
FALSE 0
int boolean;
typedef struct taudb_prepared_statement {
char* name;
UT_hash_handle hh; /* hash index for hashing by name */
} TAUDB_PREPARED_STATEMENT;
/* forward declarations to ease objects that need to know about
* each other and have doubly-linked relationships */
struct
struct
struct
struct
struct
struct
struct
struct
struct
struct
struct
struct
struct
struct
struct
struct
taudb_timer_call_data;
taudb_timer_value;
taudb_timer_callpath;
taudb_timer_group;
taudb_timer_parameter;
taudb_timer;
taudb_counter_value;
taudb_counter;
taudb_primary_metadata;
taudb_secondary_metadata;
taudb_time_range;
taudb_thread;
taudb_metric;
taudb_trial;
perfdmf_experiment;
perfdmf_application;
typedef struct taudb_configuration {
char* jdbc_db_type;
/* to identify DBMS vendor.
* postgresql, mysql, h2, derby, etc. */
char* db_hostname;
/* server host name */
char* db_portnum;
/* server port number */
char* db_dbname;
/* the database name at the server */
char* db_schemaprefix; /* the schema prefix. This is appended to
* all table names for some DBMSs */
char* db_username;
/* the database username */
115
TAUdb C API
char* db_password;
char* db_schemafile;
/* the database password for username */
/* full or relative path to the schema file,
* used for configuration, not used in C API */
} TAUDB_CONFIGURATION;
typedef enum taudb_database_schema_version {
TAUDB_2005_SCHEMA,
TAUDB_2012_SCHEMA
} TAUDB_SCHEMA_VERSION;
typedef struct taudb_data_source {
int id;
char* name;
char*description;
UT_hash_handle hh1; /* hash index for hashing by id */
UT_hash_handle hh2; /* hash index for hashing by name */
} TAUDB_DATA_SOURCE;
typedef struct taudb_connection {
TAUDB_CONFIGURATION *configuration;
#if defined __TAUDB_POSTGRESQL__
PGconn *connection;
PGresult *res;
TAUDB_PREPARED_STATEMENT *statements;
#elif defined __TAUDB_SQLITE__
sqlite3 *connection;
sqlite3_stmt *ppStmt;
int rc;
#endif
TAUDB_SCHEMA_VERSION schema_version;
boolean inTransaction;
boolean inPortal;
TAUDB_DATA_SOURCE* data_sources_by_id;
TAUDB_DATA_SOURCE* data_sources_by_name;
} TAUDB_CONNECTION;
/* these are the derived thread indexes. */
#define
#define
#define
#define
#define
#define
#define
TAUDB_MEAN_WITHOUT_NULLS -1
TAUDB_TOTAL -2
TAUDB_STDDEV_WITHOUT_NULLS -3
TAUDB_MIN -4
TAUDB_MAX -5
TAUDB_MEAN_WITH_NULLS -6
TAUDB_STDDEV_WITH_NULLS -7
/* trials are the top level structure */
typedef struct taudb_trial {
/* actual data from the database */
int id;
char* name;
struct taudb_data_source* data_source;
int node_count;
/* i.e. number of processes. */
int contexts_per_node;
/* rarely used, usually 1. */
int threads_per_context;
/* max number of threads per process
* (can be less on individual processes) */
int total_threads;
/* total number of threads */
/* arrays of data for this trial */
struct taudb_metric* metrics_by_id;
struct taudb_metric* metrics_by_name;
struct taudb_thread* threads;
struct taudb_time_range* time_ranges;
struct taudb_timer* timers_by_id;
116
TAUdb C API
struct taudb_timer* timers_by_name;
struct taudb_timer_group* timer_groups;
struct taudb_timer_callpath* timer_callpaths_by_id;
struct taudb_timer_callpath* timer_callpaths_by_name;
struct taudb_timer_call_data* timer_call_data_by_id;
struct taudb_timer_call_data* timer_call_data_by_key;
struct taudb_counter* counters_by_id;
struct taudb_counter* counters_by_name;
struct taudb_counter_value* counter_values;
struct taudb_primary_metadata* primary_metadata;
struct taudb_secondary_metadata* secondary_metadata;
struct taudb_secondary_metadata* secondary_metadata_by_key;
} TAUDB_TRIAL;
/*********************************************/
/* data dimensions */
/*********************************************/
/* thread represents one physical & logical
* location for a measurement. */
typedef struct taudb_thread {
int id; /* database id, also key to hash */
struct taudb_trial* trial;
int node_rank;
/* which process does this thread belong to? */
int context_rank; /* which context? USUALLY 0 */
int thread_rank; /* what is this thread's rank in the process */
int index;
/* what is this threads OVERALL index?
* ranges from 0 to trial.thread_count-1 */
struct taudb_secondary_metadata* secondary_metadata;
UT_hash_handle hh;
} TAUDB_THREAD;
/* metrics are things like TIME, PAPI counters, and derived metrics. */
typedef struct taudb_metric {
int id; /* database value, also key to hash */
char* name; /* key to hash hh2 */
boolean derived; /* was this metric measured, or created by a
* post-processing tool? */
UT_hash_handle hh1; /* hash index for hashing by id */
UT_hash_handle hh2; /* hash index for hashing by name */
} TAUDB_METRIC;
/* Time ranges are ways to delimit the profile data within time ranges.
They are also useful for secondary metadata which is associated with
a specific call to a function. */
typedef struct taudb_time_range {
int id; /* database value, also key to hash */
int iteration_start;
int iteration_end;
uint64_t time_start;
uint64_t time_end; /* was this metric measured,
* or created by a post-processing tool? */
UT_hash_handle hh;
} TAUDB_TIME_RANGE;
/*
*
*
*
timers are interval timers, capturing some interval value.
For callpath or phase profiles, the parent refers to the calling
function or phase. Timers can also be sample locations, or
phases (dynamic or static), or sample aggregations (intermediate) */
typedef struct taudb_timer {
117
TAUdb C API
int id; /* database value, also key to hash */
struct taudb_trial* trial; /* pointer back to trial - NOTE: Necessary? */
char* name; /* the full timer name, can have file, line, etc. */
char* short_name; /* just the function name, for example */
char* source_file; /* what source file does this function live in? */
int line_number; /* what line does the timer start on? */
int line_number_end; /* what line does the timer end on? */
int column_number; /* what column number does the timer start on? */
int column_number_end; /* what column number does the timer end on? */
struct taudb_timer_group* groups; /* hash of groups,
* using group hash handle hh2 */
struct taudb_timer_parameter* parameters; /* array of parameters */
UT_hash_handle trial_hash_by_id; /* hash key for id lookup */
UT_hash_handle trial_hash_by_name; /* hash key for name lookup
* in temporary hash */
UT_hash_handle group_hash_by_name; /* hash key for name lookup
* in timer group */
} TAUDB_TIMER;
/*********************************************/
/* timer related structures */
/*********************************************/
/* timer groups are the groups such as tau_default,
mpi, openmp, tau_phase, tau_callpath, tau_param, etc.
this mapping table allows for nxn mappings between timers
and groups */
typedef struct taudb_timer_group {
char* name;
struct taudb_timer* timers;
/* hash of timers,
* using timer hash handle hh3 */
UT_hash_handle trial_hash_by_name; // hash handle for trial
UT_hash_handle timer_hash_by_name; // hash handle for timers
} TAUDB_TIMER_GROUP;
/* timer parameters are parameter based profile values.
an example is foo (x,y) where x=4 and y=10. in that example,
timer would be the index of the timer with the
name 'foo (x,y) <x>=<4> <y>=<10>'. this table would have two
entries, one for the x value and one for the y value.
The parameter can also be a phase / iteration index.
*/
typedef struct taudb_timer_parameter {
char* name;
char* value;
UT_hash_handle hh;
} TAUDB_TIMER_PARAMETER;
/* callpath objects contain the merged dynamic callgraph tree seen
* during execution */
typedef struct taudb_timer_callpath {
int id; /* link back to database, and hash key */
struct taudb_timer* timer; /* which timer is this? */
struct taudb_timer_callpath *parent; /* callgraph parent */
char* name; /* a string which has the aggregated callpath. */
UT_hash_handle hh1; /* hash key for hash by id */
UT_hash_handle hh2; /* hash key for name (a => b => c...) lookup */
} TAUDB_TIMER_CALLPATH;
/* timer_call_data objects are observations of a node of the callgraph
for one of the threads. */
118
TAUdb C API
typedef struct taudb_call_data_key {
struct taudb_timer_callpath *timer_callpath; /* link back to database */
struct taudb_thread *thread; /* link back to database, roundabout way */
char* timestamp; /* timestamp in case we are in a snapshot or something */
} TAUDB_TIMER_CALL_DATA_KEY;
typedef struct taudb_timer_call_data {
int id; /* link back to database */
TAUDB_TIMER_CALL_DATA_KEY key; /* hash table key */
int calls; /* number of times this timer was seen */
int subroutines; /* number of timers this timer calls */
struct taudb_timer_value* timer_values;
UT_hash_handle hh1;
UT_hash_handle hh2;
} TAUDB_TIMER_CALL_DATA;
/* finally, timer_values are specific measurements during one of the
observations of the node of the callgraph on a thread. */
typedef
struct
double
double
double
struct taudb_timer_value {
taudb_metric* metric;
/* which metric is this? */
inclusive;
/* the inclusive value of this metric */
exclusive;
/* the exclusive value of this metric */
inclusive_percentage;
/* the inclusive percentage of
* total time of the application */
double exclusive_percentage;
/* the exclusive percentage of
* total time of the application */
double sum_exclusive_squared; /* how much variance did we see
* every time we measured this timer? */
char *key; /* hash table key - metric name */
UT_hash_handle hh;
} TAUDB_TIMER_VALUE;
/*********************************************/
/* counter related structures */
/*********************************************/
/* counters measure some counted value. An example would be MPI message size
* for an MPI_Send. */
typedef struct taudb_counter {
int id; /* database reference */
struct taudb_trial* trial;
char* name;
UT_hash_handle hh1; /* hash key for hashing by id */
UT_hash_handle hh2; /* hash key for hashing by name */
} TAUDB_COUNTER;
/* counters are atomic counters, not just interval timers */
typedef struct taudb_counter_value_key {
struct taudb_counter* counter; /* the counter we are measuring */
struct taudb_thread* thread;
/* where this measurement is */
struct taudb_timer_callpath* context; /* the calling context (can be null) */
char* timestamp; /* timestamp in case we are in a snapshot or something */
} TAUDB_COUNTER_VALUE_KEY;
typedef struct taudb_counter_value {
TAUDB_COUNTER_VALUE_KEY key;
int sample_count;
/* how many
double maximum_value;
/* what was
double minimum_value;
/* what was
double mean_value;
/* what was
119
times did we see take this count? */
the max value we saw? */
the min value we saw? */
the average value we saw? */
TAUdb C API
double standard_deviation; /* how much variance was there? */
UT_hash_handle hh1; /* hash key for hashing by key */
} TAUDB_COUNTER_VALUE;
/*********************************************/
/* metadata related structures */
/*********************************************/
/* primary metadata is metadata that is not nested, does not
contain unique data for each thread. */
typedef struct taudb_primary_metadata {
char* name;
char* value;
UT_hash_handle hh; /* uses the name as the key */
} TAUDB_PRIMARY_METADATA;
/* primary metadata is metadata that could be nested, could
contain unique data for each thread, and could be an array. */
typedef struct taudb_secondary_metadata_key {
struct taudb_timer_callpath *timer_callpath; /* link back to database */
struct taudb_thread *thread; /* link back to database, roundabout way */
struct taudb_secondary_metadata* parent; /* self-referencing */
struct taudb_time_range* time_range;
char* name;
} TAUDB_SECONDARY_METADATA_KEY;
typedef struct taudb_secondary_metadata {
char* id; /* link back to database */
TAUDB_SECONDARY_METADATA_KEY key;
int num_values; /* can have arrays of data */
char** value;
int child_count;
struct taudb_secondary_metadata* children; /* self-referencing
UT_hash_handle hh; /* uses the id as a compound key */
UT_hash_handle hh2; /* uses the key as a compound key */
} TAUDB_SECONDARY_METADATA;
/* these are for supporting the older schema */
typedef struct perfdmf_experiment {
int id;
char* name;
struct taudb_primary_metadata* primary_metadata;
} PERFDMF_EXPERIMENT;
typedef struct perfdmf_application {
int id;
char* name;
struct taudb_primary_metadata* primary_metadata;
} PERFDMF_APPLICATION;
#endif /* TAUDB_STRUCTS_H */
11.3. TAUdb C API
#ifndef TAUDB_API_H
#define TAUDB_API_H 1
120
*/
TAUdb C API
#include "taudb_structs.h"
/* when a "get" function is called, this global has the number of
top-level objects that are returned. */
extern int taudb_numItems;
/* the database version */
extern enum taudb_database_schema_version taudb_version;
/* to connect to the database */
extern TAUDB_CONNECTION* taudb_connect_config(char* config_name);
extern TAUDB_CONNECTION* taudb_connect_config_file(char* config_file_name);
/* test the connection status */
extern int taudb_check_connection(TAUDB_CONNECTION* connection);
/* disconnect from the database */
extern int taudb_disconnect(TAUDB_CONNECTION* connection);
/************************************************/
/* query functions */
/************************************************/
/* functions to support the old database schema - avoid these if you can */
extern PERFDMF_APPLICATION*
perfdmf_query_applications(TAUDB_CONNECTION* connection);
extern PERFDMF_EXPERIMENT*
perfdmf_query_experiments(TAUDB_CONNECTION* connection,
PERFDMF_APPLICATION* application);
extern PERFDMF_APPLICATION*
perfdmf_query_application(TAUDB_CONNECTION* connection, char* name);
extern PERFDMF_EXPERIMENT*
perfdmf_query_experiment(TAUDB_CONNECTION* connection,
PERFDMF_APPLICATION* application, char* name);
extern TAUDB_TRIAL* perfdmf_query_trials(TAUDB_CONNECTION* connection,
PERFDMF_EXPERIMENT* experiment);
/* get the data sources */
extern TAUDB_DATA_SOURCE*
taudb_query_data_sources(TAUDB_CONNECTION* connection);
extern TAUDB_DATA_SOURCE*
taudb_get_data_source_by_id(TAUDB_DATA_SOURCE* data_sources,
const int id);
extern TAUDB_DATA_SOURCE*
taudb_get_data_source_by_name(TAUDB_DATA_SOURCE* data_sources,
const char* name);
/* using the properties set in the filter, find a set of trials */
extern TAUDB_TRIAL*
taudb_query_trials(TAUDB_CONNECTION* connection, boolean complete,
TAUDB_TRIAL* filter);
extern TAUDB_PRIMARY_METADATA*
taudb_query_primary_metadata(TAUDB_CONNECTION* connection,
TAUDB_TRIAL* filter);
extern TAUDB_PRIMARY_METADATA*
taudb_get_primary_metadata_by_name(TAUDB_PRIMARY_METADATA* primary_metadata,
const char* name);
extern TAUDB_SECONDARY_METADATA*
taudb_query_secondary_metadata(TAUDB_CONNECTION* connection,
TAUDB_TRIAL* filter);
/* get the threads for a trial */
extern TAUDB_THREAD*
taudb_query_threads(TAUDB_CONNECTION* connection, TAUDB_TRIAL* trial);
121
TAUdb C API
extern TAUDB_THREAD*
taudb_query_derived_threads(TAUDB_CONNECTION* connection,
TAUDB_TRIAL* trial);
extern TAUDB_THREAD*
taudb_get_thread(TAUDB_THREAD* threads, int thread_index);
extern int taudb_get_total_threads(TAUDB_THREAD* threads);
/* get the metrics for a trial */
extern TAUDB_METRIC*
taudb_query_metrics(TAUDB_CONNECTION* connection, TAUDB_TRIAL* trial);
extern TAUDB_METRIC*
taudb_get_metric_by_name(TAUDB_METRIC* metrics, const char* name);
extern TAUDB_METRIC*
taudb_get_metric_by_id(TAUDB_METRIC* metrics, const int id);
/* get the time_ranges for a trial */
extern TAUDB_TIME_RANGE*
taudb_query_time_range(TAUDB_CONNECTION* connection,
TAUDB_TRIAL* trial);
extern TAUDB_TIME_RANGE*
taudb_get_time_range(TAUDB_TIME_RANGE* time_ranges, const int id);
/* get the timers for a trial */
extern TAUDB_TIMER*
taudb_query_timers(TAUDB_CONNECTION* connection, TAUDB_TRIAL* trial);
extern TAUDB_TIMER*
taudb_get_timer_by_id(TAUDB_TIMER* timers, int id);
extern TAUDB_TIMER*
taudb_get_trial_timer_by_name(TAUDB_TIMER* timers, const char* id);
extern TAUDB_TIMER*
taudb_get_trial_timer_by_name(TAUDB_TIMER* timers, const char* id);
extern TAUDB_TIMER_GROUP*
taudb_query_timer_groups(TAUDB_CONNECTION* connection,
TAUDB_TRIAL* trial);
extern void
taudb_parse_timer_group_names(TAUDB_TRIAL* trial, TAUDB_TIMER* timer,
char* group_names);
extern TAUDB_TIMER_GROUP*
taudb_get_timer_group_from_trial_by_name(TAUDB_TIMER_GROUP* timers,
const char* name);
extern TAUDB_TIMER_GROUP*
taudb_get_timer_group_from_timer_by_name(TAUDB_TIMER_GROUP* timers,
const char* name);
extern TAUDB_TIMER_CALLPATH*
taudb_query_timer_callpaths(TAUDB_CONNECTION* connection,
TAUDB_TRIAL* trial, TAUDB_TIMER* timer);
extern TAUDB_TIMER_CALLPATH*
taudb_get_timer_callpath_by_id(TAUDB_TIMER_CALLPATH* timers, int id);
extern TAUDB_TIMER_CALLPATH*
taudb_get_timer_callpath_by_name(TAUDB_TIMER_CALLPATH* timers,
const char* id);
extern TAUDB_TIMER_CALLPATH*
taudb_query_all_timer_callpaths(TAUDB_CONNECTION* connection,
TAUDB_TRIAL* trial);
extern char* taudb_get_callpath_string(TAUDB_TIMER_CALLPATH* timer_callpath);
/* get the counters for a trial */
extern TAUDB_COUNTER*
taudb_query_counters(TAUDB_CONNECTION* connection, TAUDB_TRIAL* trial);
extern TAUDB_COUNTER*
taudb_get_counter_by_id(TAUDB_COUNTER* counters, int id);
extern TAUDB_COUNTER*
taudb_get_counter_by_name(TAUDB_COUNTER* counters, const char* id);
extern TAUDB_COUNTER_VALUE*
122
TAUdb C API
taudb_query_counter_values(TAUDB_CONNECTION* connection,
TAUDB_TRIAL* trial);
TAUDB_COUNTER_VALUE*
taudb_get_counter_value(TAUDB_COUNTER_VALUE* counter_values,
TAUDB_COUNTER* counter, TAUDB_THREAD* thread,
TAUDB_TIMER_CALLPATH* context, char* timestamp);
/* get the timer call data for a trial */
extern TAUDB_TIMER_CALL_DATA*
taudb_query_timer_call_data(TAUDB_CONNECTION* connection,
TAUDB_TRIAL* trial, TAUDB_TIMER_CALLPATH* timer_callpath,
TAUDB_THREAD* thread);
extern TAUDB_TIMER_CALL_DATA*
taudb_query_all_timer_call_data(TAUDB_CONNECTION* connection,
TAUDB_TRIAL* trial);
extern TAUDB_TIMER_CALL_DATA*
taudb_query_timer_call_data_stats(TAUDB_CONNECTION* connection,
TAUDB_TRIAL* trial, TAUDB_TIMER_CALLPATH* timer_callpath,
TAUDB_THREAD* thread);
extern TAUDB_TIMER_CALL_DATA*
taudb_query_all_timer_call_data_stats(TAUDB_CONNECTION* connection,
TAUDB_TRIAL* trial);
extern TAUDB_TIMER_CALL_DATA*
taudb_get_timer_call_data_by_id(TAUDB_TIMER_CALL_DATA* timer_call_data,
int id);
extern TAUDB_TIMER_CALL_DATA*
taudb_get_timer_call_data_by_key(TAUDB_TIMER_CALL_DATA* timer_call_data,
TAUDB_TIMER_CALLPATH* callpath, TAUDB_THREAD* thread, char* timestamp);
/* get the timer values for a trial */
extern TAUDB_TIMER_VALUE*
taudb_query_timer_values(TAUDB_CONNECTION* connection,
TAUDB_TRIAL* trial, TAUDB_TIMER_CALLPATH* timer_callpath,
TAUDB_THREAD* thread, TAUDB_METRIC* metric);
extern TAUDB_TIMER_VALUE*
taudb_query_timer_stats(TAUDB_CONNECTION* connection,
TAUDB_TRIAL* trial, TAUDB_TIMER_CALLPATH* timer_callpath,
TAUDB_THREAD* thread, TAUDB_METRIC* metric);
extern TAUDB_TIMER_VALUE*
taudb_query_all_timer_values(TAUDB_CONNECTION* connection,
TAUDB_TRIAL* trial);
extern TAUDB_TIMER_VALUE*
taudb_query_all_timer_stats(TAUDB_CONNECTION* connection,
TAUDB_TRIAL* trial);
extern TAUDB_TIMER_VALUE*
taudb_get_timer_value(TAUDB_TIMER_CALL_DATA* timer_call_data,
TAUDB_METRIC* metric);
/* find main */
extern TAUDB_TIMER*
taudb_query_main_timer(TAUDB_CONNECTION* connection, TAUDB_TRIAL* trial);
/* save everything */
extern void taudb_save_trial(TAUDB_CONNECTION* connection,
TAUDB_TRIAL* trial, boolean update, boolean cascade);
extern void taudb_save_threads(TAUDB_CONNECTION* connection,
TAUDB_TRIAL* trial, boolean update);
extern void taudb_save_metrics(TAUDB_CONNECTION* connection,
TAUDB_TRIAL* trial, boolean update);
extern void taudb_save_timers(TAUDB_CONNECTION* connection,
TAUDB_TRIAL* trial, boolean update);
extern void taudb_save_time_ranges(TAUDB_CONNECTION* connection,
TAUDB_TRIAL* trial, boolean update);
extern void taudb_save_timer_groups(TAUDB_CONNECTION* connection,
123
TAUdb C API
TAUDB_TRIAL* trial, boolean update);
extern void taudb_save_timer_parameters(TAUDB_CONNECTION* connection,
TAUDB_TRIAL* trial, boolean update);
extern void taudb_save_timer_callpaths(TAUDB_CONNECTION* connection,
TAUDB_TRIAL* trial, boolean update);
extern void taudb_save_timer_call_data(TAUDB_CONNECTION* connection,
TAUDB_TRIAL* trial, boolean update);
extern void taudb_save_timer_values(TAUDB_CONNECTION* connection,
TAUDB_TRIAL* trial, boolean update);
extern void taudb_save_counters(TAUDB_CONNECTION* connection,
TAUDB_TRIAL* trial, boolean update);
extern void taudb_save_counter_values(TAUDB_CONNECTION* connection,
TAUDB_TRIAL* trial, boolean update);
extern void taudb_save_primary_metadata(TAUDB_CONNECTION* connection,
TAUDB_TRIAL* trial, boolean update);
extern void taudb_save_secondary_metadata(TAUDB_CONNECTION* connection,
TAUDB_TRIAL* trial, boolean update);
/************************************************/
/* memory functions */
/************************************************/
extern char* taudb_strdup(const char* in_string);
extern TAUDB_TRIAL* taudb_create_trials(int count);
extern TAUDB_METRIC*
taudb_create_metrics(int count);
extern TAUDB_TIME_RANGE*
taudb_create_time_ranges(int count);
extern TAUDB_THREAD*
taudb_create_threads(int count);
extern TAUDB_SECONDARY_METADATA* taudb_create_secondary_metadata(int count);
extern TAUDB_PRIMARY_METADATA*
taudb_create_primary_metadata(int count);
extern TAUDB_PRIMARY_METADATA*
taudb_resize_primary_metadata(int count,
TAUDB_PRIMARY_METADATA* old_primary_metadata);
extern TAUDB_COUNTER*
taudb_create_counters(int count);
extern TAUDB_COUNTER_VALUE*
taudb_create_counter_values(int count);
extern TAUDB_TIMER*
taudb_create_timers(int count);
extern TAUDB_TIMER_PARAMETER*
taudb_create_timer_parameters(int count);
extern TAUDB_TIMER_GROUP*
taudb_create_timer_groups(int count);
extern TAUDB_TIMER_GROUP*
taudb_resize_timer_groups(int count,
TAUDB_TIMER_GROUP* old_groups);
extern TAUDB_TIMER_CALLPATH*
taudb_create_timer_callpaths(int count);
extern TAUDB_TIMER_CALL_DATA*
taudb_create_timer_call_data(int count);
extern TAUDB_TIMER_VALUE*
taudb_create_timer_values(int count);
extern void taudb_delete_trials(TAUDB_TRIAL* trials, int count);
/************************************************/
/* Adding objects to the hierarchy */
/************************************************/
extern void taudb_add_metric_to_trial(TAUDB_TRIAL* trial,
TAUDB_METRIC* metric);
extern void taudb_add_time_range_to_trial(TAUDB_TRIAL* trial,
TAUDB_TIME_RANGE* time_range);
extern void taudb_add_thread_to_trial(TAUDB_TRIAL* trial,
TAUDB_THREAD* thread);
extern void taudb_add_secondary_metadata_to_trial(TAUDB_TRIAL* trial,
TAUDB_SECONDARY_METADATA* secondary_metadata);
extern void taudb_add_secondary_metadata_to_secondary_metadata
(TAUDB_SECONDARY_METADATA* parent, TAUDB_SECONDARY_METADATA* child);
extern void taudb_add_primary_metadata_to_trial(TAUDB_TRIAL* trial,
TAUDB_PRIMARY_METADATA* primary_metadata);
extern void taudb_add_counter_to_trial(TAUDB_TRIAL* trial,
TAUDB_COUNTER* counter);
extern void taudb_add_counter_value_to_trial(TAUDB_TRIAL* trial,
TAUDB_COUNTER_VALUE* counter_value);
124
TAUdb C API
extern void taudb_add_timer_to_trial(TAUDB_TRIAL* trial,
TAUDB_TIMER* timer);
extern void taudb_add_timer_parameter_to_trial(TAUDB_TRIAL* trial,
TAUDB_TIMER_PARAMETER* timer_parameter);
extern void taudb_add_timer_group_to_trial(TAUDB_TRIAL* trial,
TAUDB_TIMER_GROUP* timer_group);
extern void taudb_add_timer_to_timer_group(TAUDB_TIMER_GROUP* timer_group,
TAUDB_TIMER* timer);
extern void taudb_add_timer_callpath_to_trial(TAUDB_TRIAL* trial,
TAUDB_TIMER_CALLPATH* timer_callpath);
extern void taudb_add_timer_call_data_to_trial(TAUDB_TRIAL* trial,
TAUDB_TIMER_CALL_DATA* timer_call_data);
extern void taudb_add_timer_value_to_timer_call_data
(TAUDB_TIMER_CALL_DATA* timer_call_data, TAUDB_TIMER_VALUE* timer_value);
/* Profile parsers */
extern TAUDB_TRIAL* taudb_parse_tau_profiles(const char* directory_name);
/* Analysis routines */
extern void taudb_compute_statistics(TAUDB_TRIAL* trial);
/* iterators */
extern TAUDB_DATA_SOURCE*
taudb_next_data_source_by_name_from_connection
(TAUDB_DATA_SOURCE* current);
extern TAUDB_DATA_SOURCE*
taudb_next_data_source_by_id_from_connection
(TAUDB_DATA_SOURCE* current);
extern TAUDB_THREAD*
taudb_next_thread_by_index_from_trial(TAUDB_THREAD* current);
extern TAUDB_METRIC*
taudb_next_metric_by_name_from_trial(TAUDB_METRIC* current);
extern TAUDB_METRIC*
taudb_next_metric_by_id_from_trial(TAUDB_METRIC* current);
extern TAUDB_TIME_RANGE*
taudb_next_time_range_by_id_from_trial(TAUDB_TIME_RANGE* current);
extern TAUDB_TIMER*
taudb_next_timer_by_name_from_trial(TAUDB_TIMER* current);
extern TAUDB_TIMER*
taudb_next_timer_by_id_from_trial(TAUDB_TIMER* current);
extern TAUDB_TIMER*
taudb_next_timer_by_name_from_group(TAUDB_TIMER* current);
extern TAUDB_TIMER_GROUP*
taudb_next_timer_group_by_name_from_trial
(TAUDB_TIMER_GROUP* current);
extern TAUDB_TIMER_GROUP*
taudb_next_timer_group_by_name_from_timer
(TAUDB_TIMER_GROUP* current);
extern TAUDB_TIMER_PARAMETER*
taudb_next_timer_parameter_by_name_from_timer
(TAUDB_TIMER_PARAMETER* current);
extern TAUDB_TIMER_CALLPATH*
taudb_next_timer_callpath_by_name_from_trial
(TAUDB_TIMER_CALLPATH* current);
extern TAUDB_TIMER_CALLPATH*
taudb_next_timer_callpath_by_id_from_trial
(TAUDB_TIMER_CALLPATH* current);
extern TAUDB_TIMER_CALL_DATA*
taudb_next_timer_call_data_by_key_from_trial
(TAUDB_TIMER_CALL_DATA* current);
extern TAUDB_TIMER_CALL_DATA*
taudb_next_timer_call_data_by_id_from_trial
(TAUDB_TIMER_CALL_DATA* current);
extern TAUDB_TIMER_VALUE*
125
TAUdb C API
taudb_next_timer_value_by_metric_from_timer_call_data
(TAUDB_TIMER_VALUE* current);
extern TAUDB_COUNTER*
taudb_next_counter_by_name_from_trial(TAUDB_COUNTER* current);
extern TAUDB_COUNTER*
taudb_next_counter_by_id_from_trial(TAUDB_COUNTER* current);
extern TAUDB_COUNTER_VALUE*
taudb_next_counter_value_by_key_from_trial(TAUDB_COUNTER_VALUE* current);
extern TAUDB_PRIMARY_METADATA*
taudb_next_primary_metadata_by_name_from_trial
(TAUDB_PRIMARY_METADATA* current);
extern TAUDB_SECONDARY_METADATA*
taudb_next_secondary_metadata_by_key_from_trial
(TAUDB_SECONDARY_METADATA* current);
extern TAUDB_SECONDARY_METADATA*
taudb_next_secondary_metadata_by_id_from_trial
(TAUDB_SECONDARY_METADATA* current);
#endif /* TAUDB_API_H */
11.4. TAUdb C API Examples
11.4.1. Creating a trial and inserting into the database
#include
#include
#include
#include
#include
#include
"taudb_api.h"
<stdio.h>
<string.h>
<sys/types.h>
<dirent.h>
"dump_functions.h"
int main (int argc, char** argv) {
TAUDB_CONNECTION* connection = NULL;
if (argc >= 2) {
connection = taudb_connect_config(argv[1]);
} else {
fprintf(stderr, "Please specify a TAUdb config file.\n");
exit(1);
}
printf("Checking connection...\n");
taudb_check_connection(connection);
// create a trial
TAUDB_TRIAL* trial = taudb_create_trials(1);
trial->name = taudb_strdup("TEST TRIAL");
// set the data source to "other"
trial->data_source = taudb_get_data_source_by_id(
taudb_query_data_sources(connection), 999);
// create some metadata
TAUDB_PRIMARY_METADATA* pm = taudb_create_primary_metadata(1);
pm->name = taudb_strdup("Application");
pm->value = taudb_strdup("Test Application");
taudb_add_primary_metadata_to_trial(trial, pm);
pm = taudb_create_primary_metadata(1);
pm->name = taudb_strdup("Start Time");
pm->value = taudb_strdup("2012-11-07 12:30:00");
taudb_add_primary_metadata_to_trial(trial, pm);
126
TAUdb C API
// alternatively, you can allocate the primary metadata in blocks
pm = taudb_create_primary_metadata(10);
pm[0].name = taudb_strdup("ClientID");
pm[0].value = taudb_strdup("joe_user");
taudb_add_primary_metadata_to_trial(trial, &(pm[0]));
pm[1].name = taudb_strdup("hostname");
pm[1].value = taudb_strdup("hopper04");
taudb_add_primary_metadata_to_trial(trial, &(pm[1]));
pm[2].name = taudb_strdup("Operating System");
pm[2].value = taudb_strdup("Linux");
taudb_add_primary_metadata_to_trial(trial, &(pm[2]));
pm[3].name = taudb_strdup("Release");
pm[3].value = taudb_strdup("2.6.32.36-0.5-default");
taudb_add_primary_metadata_to_trial(trial, &(pm[3]));
pm[4].name = taudb_strdup("Machine");
pm[4].value = taudb_strdup("Hopper.nersc.gov");
taudb_add_primary_metadata_to_trial(trial, &(pm[4]));
pm[5].name = taudb_strdup("CPU Cache Size");
pm[5].value = taudb_strdup("512 KB");
taudb_add_primary_metadata_to_trial(trial, &(pm[5]));
pm[6].name = taudb_strdup("CPU Clock Frequency");
pm[6].value = taudb_strdup("800.000 MHz");
taudb_add_primary_metadata_to_trial(trial, &(pm[6]));
pm[7].name = taudb_strdup("CPU Model");
pm[7].value = taudb_strdup("Quad-Core AMD Opteron(tm) Processor 8378");
taudb_add_primary_metadata_to_trial(trial, &(pm[7]));
// create a metric
TAUDB_METRIC* metric = taudb_create_metrics(1);
metric->name = taudb_strdup("TIME");
taudb_add_metric_to_trial(trial, metric);
// create a thread
TAUDB_THREAD* thread = taudb_create_threads(1);
thread->node_rank = 1;
thread->context_rank = 1;
thread->thread_rank = 1;
thread->index = 1;
taudb_add_thread_to_trial(trial, thread);
// create a timer, timer_callpath, timer_call_data, timer_value
TAUDB_TIMER_GROUP* timer_group = taudb_create_timer_groups(1);
TAUDB_TIMER* timer = taudb_create_timers(1);
TAUDB_TIMER_CALLPATH* timer_callpath = taudb_create_timer_callpaths(1);
TAUDB_TIMER_CALL_DATA* timer_call_data = taudb_create_timer_call_data(1);
TAUDB_TIMER_VALUE* timer_value = taudb_create_timer_values(1);
timer->name = taudb_strdup(
"int main(int, char **) [{kernel.c} {134,1}-{207,1}]");
timer->short_name = taudb_strdup("main");
timer->source_file = taudb_strdup("kernel.c");
timer->line_number = 134;
timer->column_number = 1;
timer->line_number_end = 207;
timer->column_number_end = 1;
taudb_add_timer_to_trial(trial, timer);
timer_group->name = taudb_strdup("TAU_DEFAULT");
taudb_add_timer_group_to_trial(trial, timer_group);
taudb_add_timer_to_timer_group(timer_group, timer);
timer_callpath->timer = timer;
timer_callpath->parent = NULL;
127
TAUdb C API
taudb_add_timer_callpath_to_trial(trial, timer_callpath);
timer_call_data->key.timer_callpath = timer_callpath;
timer_call_data->key.thread = thread;
timer_call_data->calls = 1;
timer_call_data->subroutines = 0;
taudb_add_timer_call_data_to_trial(trial, timer_call_data);
timer_value->metric = metric;
// 5 seconds, or 5 million microseconds
timer_value->inclusive = 5000000;
timer_value->exclusive = 5000000;
timer_value->inclusive_percentage = 100.0;
timer_value->exclusive_percentage = 100.0;
timer_value->sum_exclusive_squared = 0.0;
taudb_add_timer_value_to_timer_call_data(timer_call_data, timer_value);
// compute stats
printf("Computing Stats...\n");
taudb_compute_statistics(trial);
// save the trial!
printf("Testing inserts...\n");
boolean update = FALSE;
boolean cascade = TRUE;
taudb_save_trial(connection, trial, update, cascade);
printf("Disconnecting...\n");
taudb_disconnect(connection);
printf("Done.\n");
return 0;
}
11.4.2. Querying a trial from the database
#include "taudb_api.h"
#include <stdio.h>
#include <string.h>
void dump_metadata(TAUDB_PRIMARY_METADATA *metadata) {
printf("%d metadata fields:\n", HASH_COUNT(metadata));
TAUDB_PRIMARY_METADATA * current;
for(current = metadata; current != NULL;
current = taudb_next_primary_metadata_by_name_from_trial(current)) {
printf(" %s = %s\n", current->name, current->value);
}
}
void dump_secondary_metadata(TAUDB_SECONDARY_METADATA *metadata) {
printf("%d secondary metadata fields:\n", HASH_COUNT(metadata));
TAUDB_SECONDARY_METADATA * current;
for(current = metadata; current != NULL;
current = taudb_next_secondary_metadata_by_key_from_trial(current)) {
printf(" %s = %s\n", current->key.name, current->value[0]);
}
}
void dump_trial(TAUDB_CONNECTION* connection, TAUDB_TRIAL* filter,
boolean haveTrial) {
TAUDB_TRIAL* trial;
128
TAUdb C API
if (haveTrial) {
trial = filter;
} else {
trial = taudb_query_trials(connection, FALSE, filter);
}
TAUDB_TIMER* timer = taudb_query_main_timer(connection, trial);
printf("Trial name: '%s', id: %d, main: '%s'\n\n",
trial->name, trial->id, timer->name);
}
int main (int argc, char** argv) {
printf("Connecting...\n");
TAUDB_CONNECTION* connection = NULL;
if (argc >= 2) {
connection = taudb_connect_config(argv[1]);
} else {
fprintf(stderr, "Please specify a TAUdb config file.\n");
exit(1);
}
printf("Checking connection...\n");
taudb_check_connection(connection);
printf("Testing queries...\n");
int t;
// test the "find trials" method to populate the trial
TAUDB_TRIAL* filter = taudb_create_trials(1);
filter->id = atoi(argv[2]);
TAUDB_TRIAL* trials = taudb_query_trials(connection, TRUE, filter);
int numTrials = taudb_numItems;
for (t = 0 ; t < numTrials ; t = t+1) {
printf(" Trial name: '%s', id: %d\n",
trials[t].name, trials[t].id);
dump_metadata(trials[t].primary_metadata);
dump_secondary_metadata(trials[t].secondary_metadata);
dump_trial(connection, &(trials[t]), TRUE);
}
printf("Disconnecting...\n");
taudb_disconnect(connection);
printf("Done.\n");
return 0;
}
129
Chapter 12. Windows
12.1. TAU on Windows
12.1.1. Installation
We
provide
a
binary
release
build
for
Windows
on
the
download
page
[http://www.cs.uoregon.edu/research/tau/downloads.php]. TAU can also be built form source using
Makefile.win32.
12.1.2. Instrumenting an application with Visual Studio
C/C++
Here is a step by step guide for retrieving a standard profile from a threaded program.
1.
Download TAU (see previous section)
2.
Open [TAU-HOME]/examples/threads/threads.sln in VC 7 or greater.
3.
Open testTau.cpp source file.
4.
Uncomment the pragma element at the top of the file so that it reads:
#define PROFILING_ON 1
#pragma comment(lib, "tau-profile-static-mt.lib")
5.
Edit these properties of this project:
a.
Add the ..\..\lib\vc7\ directory to the Linker's Additional Library Directories.
b.
Set the Runtime Library to Multi-threaded DLL (MD)in the C/C++ Code Generation
section.
6.
Build and run the application.
7.
Launch
Visual
Studio's
command
line
prompt
Move
to
the
[TAU-HOME]/examples/threads/directory/ this is where the profile files where written. Type:
%> [TAU-HOME]/bin/paraprof
To view these profiles in pararprof
12.1.3. Using MINGW with TAU
Building TAU with the MinGW cross-compilers for 32- or 64-bit Windows
Requirements:
130
Windows
MinGW compilers must be in your path.
* x86_64-w64-mingw32-gcc
* x86_64-w64-mingw32-g++
* x86_64-w64-mingw32-ar
* x86_64-w64-mingw32-ld
* x86_64-w64-mingw32-ranlib
Limitations:
* No signal processing
* No event-based sampling (EBS)
Instructions:
See ./configure -help.
131
For example (64-bit):
TAU Instrumentation API
Introduction
•
C++
The C++ API is a set of macros that can be inserted in the C++ source code. An extension of the
same API is available to instrument C and Fortran sources.
At the beginning of each instrumented source file, include the following header
#include <TAU.h>
•
C
The API for instrumenting C source code is similar to the C++ API. The primary difference is that
the TAU_PROFILE() macro is not available for identifying an entire block of code or function. Instead, routine transitions are explicitly specified using TAU_PROFILE_TIMER() macro with
TAU_PROFILE_START() and TAU_PROFILE_STOP() macros to indicate the entry and exit
from a routine. Note that, TAU_TYPE_STRING() and CT() macros are not applicable for C. It is
important to declare the TAU_PROFILE_TIMER() macro after all the variables have been declared in the function and before the execution of the first C statement.
Example:
#include <TAU.h>
int main (int argc, char **argv) {
int ret;
pthread_attr_t attr;
pthread_t
tid;
TAU_PROFILE_TIMER(tautimer,"main()", "int (int, char **)",
TAU_DEFAULT);
TAU_PROFILE_START(tautimer);
TAU_PROFILE_INIT(argc, argv);
TAU_PROFILE_SET_NODE(0);
pthread_attr_init(&attr);
printf("Started Main...\n");
// other statements
TAU_PROFILE_STOP(tautimer);
return 0;
}
•
Fortran 77/90/95
The Fortran90 TAU API allows source code written in Fortran to be instrumented for TAU. This
API is comprised of Fortran routines. As explained in Chapter 2, the instrumentation can be disabled
in the program by using the TAU stub makefile variable TAU_DISABLE on the link command line.
This points to a library that contains empty TAU instrumentation routines.
132
TAU Instrumentation API
Timers
•
Static timers
These are commonly used in most profilers where all invocations of a routine are recorded. The
name and group registration takes place when the timer is created (typically the first time a routine is
entered). A given timer is started and stopped at routine entry and exit points. A user defined timer
can also measure the time spent in a group of statements. Timers may be nested but they may not
overlap. The performance data generated can typically answer questions such as: what is the total
time spent in MPI_Send() across all invocations?
•
Dynamic timers
To record the execution of each invocation of a routine, TAU provides dynamic timers where a
unique name may be constructed for a dynamic timer for each iteration by embedding the iteration
count in it. It uses the start/stop calls around the code to be examined, similar to static timers. The
performance data generated can typically answer questions such as:what is the time spent in the
routine foo() in iterations 24, 25, and 40?
•
Static phases
An application typically goes through several phases in its execution. To track the performance of
the application based on phases, TAU provides static and dynamic phase profiling. A profile based
on phases highlights the context in which a routine is called. An application has a default phase within which other routines and phases are invoked. A phase based profile shows the time spent in a
routine when it was in a given phase. So, if a set of instrumented routines are called directly or indirectly by a phase, we'd see the time spent in each of those routines under the given phase. Since
phases may be nested, a routine may belong to only one phase. When more than one phase is active
for a given routine, the closest ancestor phase of a routine along its callstack is its phase for that invocation. The performance data generated can answer questions such as: what is the total time spent
in MPI_Send() when it was invoked in all invocations of the IO (IO => MPI_Send()) phase?
•
Dynamic phases
Dynamic phases borrow from dynamic timers and static phases to create performance data for all
routines that are invoked in a given invocation of a phase. If we instrument a routine as a dynamic
phase, creating a unique name for each of its invocations (by embedding the invocation count in the
name), we can examine the time spent in all routines and child phases invoked directly or indirectly
from the given phase. The performance data generated can typically answer questions such as: what
is the total time spent in MPI_Send() when it was invoked directly or indirectly in iteration 24? Dynamic phases are useful for tracking per-iteration profiles for an adaptive computation where iterations may differ in their execution times.
•
Callpaths
In phase-based profiles, we see the relationship between routines and parent phases. Phase profiles
do not show the calling structure between different routines as is represented in a callgraph. To do
so, TAU provides callpath profiling capabilities where the time spent in a routine along an edge of a
callgraph is captured. Callpath profiles present the full flat profiles of routines (or nodes in the
callgraph), as well as routines along a callpath. A callpath is represented syntactically as a list of
routines separated by a delimiter. The maximum depth of a callpath is controlled by an environment
variable.
•
User-defined Events
Besides timers and phases that measure the time spent between a pair of start and stop calls in the
code, TAU also provides support for user-defined atomic events. After an event is registered with a
133
TAU Instrumentation API
name, it may be triggered with a value at a given point in the source code. At the application level,
we can use user-defined events to track the progress of the simulation by keeping track of application specific parameters that explain program dynamics, for example, the number of iterations required for convergence of a solver at each time step, or the number of cells in each iteration of an adaptive mesh refinement application.
134
Name
TAU_START -- Starts a timer.
C/C++:
TAU_START(name);
char* name;
Fortran:
TAU_START(name);
character name(2);
Description
Starts the timer given by name
Example
C/C++ :
int foo(int a) {
TAU_START("t1");
...
TAU_STOP("t2");
return a;
}
Fortran :
subroutine F1()
character(13) cvar
write (cvar,'(a9,i2)') 'Iteration', val
call TAU_START(cvar)
...
call TAU_STOP(cvar)
end
See Also
TAU_PROFILE, TAU_STOP
135
Name
TAU_STOP -- Stops a timer.
C/C++:
TAU_STOP(name);
char* name;
Fortran:
TAU_STOP(name);
character name(2);
Description
Stops the timer given by timer. It is important to note that timers can be nested, but not overlapping.
TAU detects programming errors that lead to such overlaps at runtime, and prints a warning message.
Example
C/C++ :
int foo(int a) {
TAU_START("t1");
...
TAU_STOP("t2");
return a;
}
Fortran :
subroutine F1()
character(13) cvar
write (cvar,'(a9,i2)') 'Iteration', val
call TAU_START(cvar)
...
call TAU_STOP(cvar)
end
See Also
TAU_PROFILE, TAU_START
136
Name
TAU_PROFILE -- Profile a C++ function
TAU_PROFILE(function_name, type, group);
char* or string& function_name;
char* or string& type;
TauGroup_t group;
Description
TAU_PROFILE profiles a function. This macro defines the function and takes care of the timer start and
stop as well. The timer will stop when the macro goes out of scope (as in C++ destruction).
Example
int foo(char *str) {
TAU_PROFILE(foo","int (char *)",TAU_DEFAULT);
...
}
See Also
TAU_PROFILE_TIMER
137
Name
TAU_DYNAMIC_PROFILE -- dynamic_profile a c++ function
TAU_DYNAMIC_PROFILE(function_name, type, group);
char* or string& function_name;
char* or string& type;
taugroup_t group;
description
TAU_DYNAMIC_PROFILE profiles a function dynamically creating a separate profile for each time the
function is called. this macro defines the function and takes care of the timer start and stop as well. the
timer will stop when the macro goes out of scope (as in c++ destruction).
example
int foo(char *str) {
tau_dynamic_profile("foo","int (char *)",tau_default);
...
}
138
Name
TAU_PROFILE_CREATE_DYNAMIC -- Creates a dynamic timer
C/C++:
TAU_PROFILE_CREATE_DYNAMIC(timer, function_name, type, group);
Timer timer;
char* or string& function_name;
char* or string& type;
taugroup_t group;
Fortran:
TAU_PROFILE_CREATE_DYNAMIC(timer, name);
integer timer(2);
character name(size);
description
TAU_PROFILE_CREATE_DYNAMIC creates a dynamic timer the name of the timer should be different
for each execution.
example
>C/C++:
int main(int argc, char **argv) {
int i;
TAU_PROFILE_TIMER(t,"main()", "", TAU_DEFAULT);
TAU_PROFILE_SET_NODE(0);
TAU_PROFILE_START(t);
for (i=0; i&5; i++) {
char buf[32];
sprintf(buf, "Iteration %d", i);
TAU_PROFILE_CREATE_DYNAMIC(timer, buf, "", TAU_USER);
TAU_PROFILE_START(timer);
printf("Iteration %d\n", i);
f1();
TAU_PROFILE_STOP(timer);
}
return 0;
}
>Fortran:
subroutine ITERATION(val)
integer val
character(13) cvar
integer profiler(2) / 0, 0 /
save profiler
139
TAU_PROFILE_CREATE_DYNAMIC
print *, "Iteration ", val
write (cvar,'(a9,i2)') 'Iteration', val
call TAU_PROFILE_CREATE_DYNAMIC(profiler, cvar)
call TAU_PROFILE_START(profiler)
call F1()
call TAU_PROFILE_STOP(profiler)
return
end
see also
TAU_DYNAMIC_TIMER_START
TAU_DYNAMIC_TIMER_STOP
140
Name
TAU_CREATE_DYNAMIC_AUTO -- Creates a dynamic timer for C/C++
TAU_CREATE_DYNAMIC_AUTO(timer, function_name, type, group);
Timer timer;
char* or string& function_name;
char* or string& type;
taugroup_t group;
description
TAU_CREATE_DYNAMIC_AUTO creates a dynamic timer automatically incrementing the name each
time the timer is executed.
example
int tau_ret_val;
TAU_PROFILE_CREATE_DYNAMIC_AUTO(tautimer, "int foo1(int) C [{foo.c} {22,1}-{29,1}]"
TAU_PROFILE_START(tautimer);
{
printf("inside foo1: calling bar: x = %d\n", x);
printf("before calling bar in foo1\n");
bar(x-1); /* 26 */
printf("after calling bar in foo1\n");
{ tau_ret_val = x; TAU_PROFILE_STOP(tautimer); return (tau_ret_val); }
see also
TAU_PROFILE_CREATE_DYNAMIC
TAU_DYNAMIC_TIMER_START
TAU_DYNAMIC_TIMER_STOP
141
Name
TAU_PROFILE_DYNAMIC_ITER -- Creates a dynamic timer in Fortran.
TAU_PROFILE_DYNAMIC_ITER(iterator, timer, name);
integer iterator;
integer timer(2);
character name(size);
description
TAU_PROFILE_DYNAMIC_ITER creates a dynamic timer the name of the timer is appended by the
iterator.
example
integer tau_iter / 0 /
save tau_iter
tau_iter = tau_iter + 1
call TAU_PROFILE_DYNAMIC_ITER(tau_iter, profiler, '
&FOO1 [{foo.f90} {16,18}]')
call TAU_PROFILE_START(profiler)
print *, "inside foo1: calling bar, x = ", x
call bar(x-1)
print *, "after calling bar"
call TAU_PROFILE_STOP(profiler)
see also
TAU_DYNAMIC_TIMER_START
TAU_DYNAMIC_TIMER_STOP
142
&
Name
TAU_PHASE_DYNAMIC_ITER -- Creates a dynamic phase in Fortran.
TAU_PHASE_DYNAMIC_ITER(iterator, timer, name);
integer iterator;
integer timer(2);
character name(size);
description
TAU_PHASE_DYNAMIC_ITER creates a dynamic phase the name of which is appended by the iterator.
example
integer tau_iter / 0 /
save tau_iter
tau_iter = tau_iter + 1
call TAU_PHASE_DYNAMIC_ITER(tau_iter, profiler, '
&FOO1 [{foo.f90} {16,18}]')
call TAU_PHASE_START(profiler)
print *, "inside foo1: calling bar, x = ", x
call bar(x-1)
print *, "after calling bar"
call TAU_PROFILE_STOP(profiler)
see also
TAU_DYNAMIC_TIMER_START
TAU_DYNAMIC_TIMER_STOP
143
&
Name
TAU_PROFILE_TIMER -- Defines a static timer.
C/C++:
TAU_PROFILE_TIMER(timer, function_name, type, group);
Profiler timer;
char* or string& function_name;
char* or string& type;
TauGroup_t group;
Fortran:
TAU_PROFILE_TIMER(profiler, name);
integer profiler(2);
character name(size);
Description
C/C++ :
With TAU_PROFILE_TIMER, a group of one or more statements is profiled. This macro has a timer
variable as its first argument, and then strings for name and type, as described earlier. It associates the
timer to the profile group specified in the last parameter.
Fortran :
To profile a block of Fortran code, such as a function, subroutine, loop etc., the user must first declare a
profiler, which is an integer array of two elements (pointer) with the save attribute, and pass it as the
first parameter to the TAU_PROFILE_TIMER subroutine. The second parameter must contain the name
of the routine, which is enclosed in a single quote. TAU_PROFILE_TIMER declares the profiler that
must be used to profile a block of code. The profiler is used to profile the statements using
TAU_PROFILE_START and TAU_PROFILE_STOP as explained later.
Example
C/C++ :
template< class T, unsigned Dim >
void BareField<T,Dim>::fillGuardCells(bool reallyFill)
{y
// profiling macros
TAU_TYPE_STRING(taustr, CT(*this) + " void (bool)" );
TAU_PROFILE("BareField::fillGuardCells()", taustr, TAU_FIELD);
TAU_PROFILE_TIMER(sendtimer, "fillGuardCells-send",
taustr, TAU_FIELD);
TAU_PROFILE_TIMER(localstimer, "fillGuardCells-locals",
taustr, TAU_FIELD);
...
}
Fortran :
144
TAU_PROFILE_TIMER
subroutine bcast_inputs
implicit none
integer profiler(2)
save profiler
include 'mpinpb.h'
include 'applu.incl'
interger IERR
call TAU_PROFILE_TIMER(profiler, 'bcast_inputs')
See Also
TAU_PROFILE_TIMER_DYNAMIC, TAU_PROFILE_START, TAU_PROFILE_STOP
145
Name
TAU_PROFILE_START -- Starts a timer.
C/C++:
TAU_PROFILE_START(timer);
Profiler timer;
Fortran:
TAU_PROFILE_START(profiler);
integer profiler(2);
Description
Starts the timer given by timer
Example
C/C++ :
int foo(int a) {
TAU_PROFILE_TIMER(timer, "foo", "int (int)", TAU_USER);
TAU_PROFILE_START(timer);
...
TAU_PROFILE_STOP(timer);
return a;
}
Fortran :
subroutine F1()
integer profiler(2) / 0, 0 /
save
profiler
call TAU_PROFILE_TIMER(profiler,'f1()')
call TAU_PROFILE_START(profiler)
...
call TAU_PROFILE_STOP(profiler)
end
See Also
TAU_PROFILE_TIMER, TAU_PROFILE_STOP
146
Name
TAU_PROFILE_STOP -- Stops a timer.
C/C++:
TAU_PROFILE_STOP(timer);
Profiler timer;
Fortran:
TAU_PROFILE_STOP(profiler);
integer profiler(2);
Description
Stops the timer given by timer. It is important to note that timers can be nested, but not overlapping.
TAU detects programming errors that lead to such overlaps at runtime, and prints a warning message.
Example
C/C++ :
int foo(int a) {
TAU_PROFILE_TIMER(timer, "foo", "int (int)", TAU_USER);
TAU_PROFILE_START(timer);
...
TAU_PROFILE_STOP(timer);
return a;
}
Fortran :
subroutine F1()
integer profiler(2) / 0, 0 /
save
profiler
call TAU_PROFILE_TIMER(profiler,'f1()')
call TAU_PROFILE_START(profiler)
...
call TAU_PROFILE_STOP(profiler)
end
See Also
TAU_PROFILE_TIMER, TAU_PROFILE_START
147
Name
TAU_STATIC_TIMER_START -- Starts a timer.
C/C++:
TAU_STATIC_TIMER_START(timer);
Profiler timer;
Fortran:
TAU_STATIC_TIMER_START(profiler);
integer profiler(2);
Description
Starts a static timer defined by TAU_PROFILE.
Example
C/C++ :
TAU_PROFILE("int foo(int) [{foo.cpp} {13,1}-{20,1}]", " ", TAU_USER);
printf("inside foo: calling bar: x = %d\n", x);
printf("before calling bar in foo\n");
TAU_STATIC_TIMER_START("foo_bar");
bar(x-1); /* 17 */
printf("after calling bar in foo\n");
TAU_STATIC_TIMER_STOP("foo_bar");
Fortran :
call TAU_PROFILE_TIMER(profiler, 'FOO [{foo.f90} {8,18}]')
call TAU_PROFILE_START(profiler)
print *, "inside foo: calling bar, x = ", x
call TAU_STATIC_TIMER_START("foo_bar");
call bar(x-1)
print *, "after calling bar"
call TAU_STATIC_TIMER_STOP("foo_bar");
call TAU_PROFILE_STOP(profiler)
See Also
TAU_PROFILE, TAU_STATIC_PHASE_START, TAU_STATIC_PHASE_STOP
148
Name
TAU_STATIC_TIMER_STOP -- Starts a timer.
C/C++:
TAU_STATIC_TIMER_STOP(timer);
Profiler timer;
Fortran:
TAU_STATIC_TIMER_STOP(profiler);
integer profiler(2);
Description
Starts a static timer defined by TAU_PROFILE.
Example
C/C++ :
TAU_PROFILE("int foo(int) [{foo.cpp} {13,1}-{20,1}]", " ", TAU_USER);
printf("inside foo: calling bar: x = %d\n", x);
printf("before calling bar in foo\n");
TAU_STATIC_TIMER_START("foo_bar");
bar(x-1); /* 17 */
printf("after calling bar in foo\n");
TAU_STATIC_TIMER_STOP("foo_bar");
Fortran :
call TAU_PROFILE_TIMER(profiler, 'FOO [{foo.f90} {8,18}]')
call TAU_PROFILE_START(profiler)
print *, "inside foo: calling bar, x = ", x
call TAU_STATIC_TIMER_START("foo_bar");
call bar(x-1)
print *, "after calling bar"
call TAU_STATIC_TIMER_STOP("foo_bar");
call TAU_PROFILE_STOP(profiler)
See Also
TAU_PROFILE, TAU_STATIC_PHASE_START, TAU_STATIC_PHASE_STOP
149
Name
TAU_DYNAMIC_TIMER_START -- Starts a dynamic timer.
C/C++:
TAU_DYNAMIC_TIMER_START(name);
String name;
Fortran:
TAU_DYNAMIC_TIMER_START(iteration, name);
integer iteration;
char name(size);
Description
Starts a new dynamic timer concating the iterator to the end of the name.
Example
C/C++ :
int foo(int a) {
TAU_PROFILE_TIMER(timer, "foo", "int (int)", TAU_USER);
TAU_DYNAMIC_TIMER_START(timer);
...
TAU_PROFILE_STOP(timer);
return a;
}
Fortran :
integer tau_iteration / 0 /
save tau_iteration
call TAU_PROFILE_TIMER(profiler, 'FOO1 [{foo.f90} {16,18}]')
call TAU_PROFILE_START(profiler)
print *, "inside foo1: calling bar, x = ", x
tau_iteration = tau_iteration + 1
call TAU_DYNAMIC_TIMER_START(tau_iteration,"foo1_bar");
call bar(x-1)
print *, "after calling bar"
call TAU_DYNAMIC_TIMER_STOP(tau_iteration,"foo1_bar");
call TAU_PROFILE_STOP(profiler)
See Also
TAU_PROFILE_TIMER, TAU_PROFILE_STOP
150
Name
TAU_DYNAMIC_TIMER_STOP -- Starts a dynamic timer.
C/C++:
TAU_DYNAMIC_TIMER_STOP(name);
String name;
Fortran:
TAU_DYNAMIC_TIMER_STOP(iteration, name);
integer iteration;
char name(size);
Description
Stops a new dynamic timer concating the iterator to the end of the name.timer
Example
C/C++ :
int foo(int a) {
TAU_PROFILE_TIMER(timer, "foo", "int (int)", TAU_USER);
TAU_DYNAMIC_TIMER_START(timer);
...
TAU_PROFILE_STOP(timer);
return a;
}
Fortran :
integer tau_iteration / 0 /
save tau_iteration
call TAU_PROFILE_TIMER(profiler, 'FOO1 [{foo.f90} {16,18}]')
call TAU_PROFILE_START(profiler)
print *, "inside foo1: calling bar, x = ", x
tau_iteration = tau_iteration + 1
call TAU_DYNAMIC_TIMER_START(tau_iteration,"foo1_bar");
call bar(x-1)
print *, "after calling bar"
call TAU_DYNAMIC_TIMER_STOP(tau_iteration,"foo1_bar");
call TAU_PROFILE_STOP(profiler)
See Also
TAU_PROFILE_TIMER, TAU_PROFILE_STOP
151
Name
TAU_PROFILE_TIMER_DYNAMIC -- Defines a dynamic timer.
C/C++:
TAU_PROFILE_TIMER_DYNAMIC(timer, function_name, type, group);
Profiler timer;
char* or string& function_name;
char* or string& type;
TauGroup_t group;
Fortran:
TAU_PROFILE_TIMER_DYNAMIC(profiler, name);
integer profiler(2);
character name(size);
Description
TAU_PROFILE_TIMER_DYNAMIC operates similar to TAU_PROFILE_TIMER except that the timer
is created each time the statement is invoked. This way, the name of the timer can be different for each
execution.
Example
C/C++ :
int main(int argc, char **argv) {
int i;
TAU_PROFILE_TIMER(t,"main()", "", TAU_DEFAULT);
TAU_PROFILE_SET_NODE(0);
TAU_PROFILE_START(t);
for (i=0; i&5; i++) {
char buf[32];
sprintf(buf, "Iteration %d", i);
TAU_PROFILE_TIMER_DYNAMIC(timer, buf, "", TAU_USER);
TAU_PROFILE_START(timer);
printf("Iteration %d\n", i);
f1();
TAU_PROFILE_STOP(timer);
}
return 0;
}
Fortran :
subroutine ITERATION(val)
integer val
character(13) cvar
integer profiler(2) / 0, 0 /
152
TAU_PROFILE_TIMER_DYNAMIC
save profiler
print *, "Iteration ", val
write (cvar,'(a9,i2)') 'Iteration', val
call TAU_PROFILE_TIMER_DYNAMIC(profiler, cvar)
call TAU_PROFILE_START(profiler)
call F1()
call TAU_PROFILE_STOP(profiler)
return
end
See Also
TAU_PROFILE_TIMER, TAU_PROFILE_START, TAU_PROFILE_STOP
153
Name
TAU_PROFILE_DECLARE_TIMER -- Declares a timer for C
C:
TAU_PROFILE_DECLARE_TIMER(timer);
Profiler timer;
Description
Because C89 does not allow mixed code and declarations, TAU_PROFILE_TIMER can only be used
once in a function. To declare two timers in a C function, use TAU_PROFILE_DECLARE_TIMER and
TAU_PROFILE_CREATE_TIMER.
Example
C:
int f1(void) {
TAU_PROFILE_DECLARE_TIMER(t1);
TAU_PROFILE_DECLARE_TIMER(t2);
TAU_PROFILE_CREATE_TIMER(t1, "timer1", "", TAU_USER);
TAU_PROFILE_CREATE_TIMER(t2, "timer2", "", TAU_USER);
TAU_PROFILE_START(t1);
...
TAU_PROFILE_START(t2);
...
TAU_PROFILE_STOP(t2);
TAU_PROFILE_STOP(t1);
return 0;
}
See Also
TAU_PROFILE_CREATE_TIMER
154
Name
TAU_PROFILE_CREATE_TIMER -- Creates a timer for C
C:
TAU_PROFILE_CREATE_TIMER(timer);
Profiler timer;
Description
Because C89 does not allow mixed code and declarations, TAU_PROFILE_TIMER can only be used
once in a function. To declare two timers in a C function, use TAU_PROFILE_DECLARE_TIMER and
TAU_PROFILE_CREATE_TIMER.
Example
C:
int f1(void) {
TAU_PROFILE_DECLARE_TIMER(t1);
TAU_PROFILE_DECLARE_TIMER(t2);
TAU_PROFILE_CREATE_TIMER(t1, "timer1", "", TAU_USER);
TAU_PROFILE_CREATE_TIMER(t2, "timer2", "", TAU_USER);
TAU_PROFILE_START(t1);
...
TAU_PROFILE_START(t2);
...
TAU_PROFILE_STOP(t2);
TAU_PROFILE_STOP(t1);
return 0;
}
See Also
TAU_PROFILE_DECLARE_TIMER, TAU_PROFILE_START, TAU_PROFILE_STOP
155
Name
TAU_GLOBAL_TIMER -- Declares a global timer
C/C++:
TAU_GLOBAL_TIMER(timer, function_name, type, group);
Profiler timer;
char* or string& function_name;
char* or string& type;
TauGroup_t group;
Description
As TAU_PROFILE_TIMER is used within the scope of a block (typically a routine),
TAU_GLOBAL_TIMER can be used across different routines.
Example
C/C++ :
/* f1.c */
TAU_GLOBAL_TIMER(globalTimer, "global timer", "", TAU_USER);
/* f2.c */
TAU_GLOBAL_TIMER_EXTERNAL(globalTimer);
int foo(void) {
TAU_GLOBAL_TIMER_START(globalTimer);
/* ... */
TAU_GLOBAL_TIMER_STOP();
}
See Also
TAU_GLOBAL_TIMER_EXTERNAL,
TAU_GLOBAL_TIMER_STOP
TAU_GLOBAL_TIMER_START,
156
Name
TAU_GLOBAL_TIMER_EXTERNAL -- Declares a global timer from an external compilation unit
C/C++:
TAU_GLOBAL_TIMER_EXTERNAL(timer);
Profiler timer;
Description
TAU_GLOBAL_TIMER_EXTERNAL allows you to access a timer defined in another compilation unit.
Example
C/C++ :
/* f1.c */
TAU_GLOBAL_TIMER(globalTimer, "global timer", "", TAU_USER);
/* f2.c */
TAU_GLOBAL_TIMER_EXTERNAL(globalTimer);
int foo(void) {
TAU_GLOBAL_TIMER_START(globalTimer);
/* ... */
TAU_GLOBAL_TIMER_STOP();
}
See Also
TAU_GLOBAL_TIMER, TAU_GLOBAL_TIMER_START, TAU_GLOBAL_TIMER_STOP
157
Name
TAU_GLOBAL_TIMER_START -- Starts a global timer
C/C++:
TAU_GLOBAL_TIMER_START(timer);
Profiler timer;
Description
TAU_GLOBAL_TIMER_START starts a global timer.
Example
C/C++ :
/* f1.c */
TAU_GLOBAL_TIMER(globalTimer, "global timer", "", TAU_USER);
/* f2.c */
TAU_GLOBAL_TIMER_EXTERNAL(globalTimer);
int foo(void) {
TAU_GLOBAL_TIMER_START(globalTimer);
/* ... */
TAU_GLOBAL_TIMER_STOP();
}
See Also
TAU_GLOBAL_TIMER, TAU_GLOBAL_TIMER_EXTERNAL, TAU_GLOBAL_TIMER_STOP
158
Name
TAU_GLOBAL_TIMER_STOP -- Stops a global timer
C/C++:
TAU_GLOBAL_TIMER_STOP();
Description
TAU_GLOBAL_TIMER_STOP stops a global timer.
Example
C/C++ :
/* f1.c */
TAU_GLOBAL_TIMER(globalTimer, "global timer", "", TAU_USER);
/* f2.c */
TAU_GLOBAL_TIMER_EXTERNAL(globalTimer);
int foo(void) {
TAU_GLOBAL_TIMER_START(globalTimer);
/* ... */
TAU_GLOBAL_TIMER_STOP();
}
See Also
TAU_GLOBAL_TIMER, TAU_GLOBAL_TIMER_EXTERNAL, TAU_GLOBAL_TIMER_START
159
Name
TAU_PHASE -- Profile a C++ function as a phase
TAU_PHASE(function_name, type, group);
char* or string& function_name;
char* or string& type;
TauGroup_t group;
Description
TAU_PHASE profiles a function as a phase. This macro defines the function and takes care of the timer
start and stop as well. The timer will stop when the macro goes out of scope (as in C++ destruction).
Example
int foo(char *str) {
TAU_PHASE(foo","int (char *)",TAU_DEFAULT);
...
}
See Also
TAU_PHASE_CREATE_DYNAMIC, TAU_PHASE_CREATE_STATIC
160
Name
TAU_DYNAMIC_PHASE -- Defines a dynamic phase.
C/C++:
TAU_DYNAMIC_PHASE(phase, function_name, type, group);
Phase phase;
char* or string& function_name;
char* or string& type;
TauGroup_t group;
Fortran:
TAU_DYNAMIC_PHASE(phase, name);
integer phase(2);
character name(size);
Description
TAU_DYNAMIC_PHASE creates a dynamic phase. The name of the timer can be different for each execution.
Example
C/C++ :
int main(int argc, char **argv) {
int i;
TAU_PROFILE_TIMER(t,"main()", "", TAU_DEFAULT);
TAU_PROFILE_SET_NODE(0);
TAU_PROFILE_START(t);
for (i=0; i&5; i++) {
char buf[32];
sprintf(buf, "Iteration %d", i);
TAU_DYNAMIC_PHASE(timer, buf, "", TAU_USER);
TAU_PHASE_START(timer);
printf("Iteration %d\n", i);
f1();
TAU_PHASE_STOP(timer);
}
return 0;
}
Fortran :
subroutine ITERATION(val)
integer val
character(13) cvar
integer profiler(2) / 0, 0 /
save profiler
161
TAU_DYNAMIC_PHASE
print *, "Iteration ", val
write (cvar,'(a9,i2)') 'Iteration', val
call TAU_DYNAMIC_PHASE(profiler, cvar)
call TAU_PHASE_START(profiler)
call F1()
call TAU_PHASE_STOP(profiler)
return
end
See Also
TAU_PHASE_CREATE_DYNAMIC,
TAU_DYNAMIC_PHASE_STOP
TAU_DYNAMIC_PHASE_START,
162
Name
TAU_PHASE_CREATE_DYNAMIC -- Defines a dynamic phase.
C/C++:
TAU_PHASE_CREATE_DYNAMIC(phase, function_name, type, group);
Phase phase;
char* or string& function_name;
char* or string& type;
TauGroup_t group;
Fortran:
TAU_PHASE_CREATE_DYNAMIC(phase, name);
integer phase(2);
character name(size);
Description
TAU_PHASE_CREATE_DYNAMIC creates a dynamic phase. The name of the timer can be different for
each execution.
Example
C/C++ :
int main(int argc, char **argv) {
int i;
TAU_PROFILE_TIMER(t,"main()", "", TAU_DEFAULT);
TAU_PROFILE_SET_NODE(0);
TAU_PROFILE_START(t);
for (i=0; i&5; i++) {
char buf[32];
sprintf(buf, "Iteration %d", i);
TAU_PHASE_CREATE_DYNAMIC(timer, buf, "", TAU_USER);
TAU_PHASE_START(timer);
printf("Iteration %d\n", i);
f1();
TAU_PHASE_STOP(timer);
}
return 0;
}
Fortran :
subroutine ITERATION(val)
integer val
character(13) cvar
integer profiler(2) / 0, 0 /
save profiler
163
TAU_PHASE_CREATE_DYNAMIC
print *, "Iteration ", val
write (cvar,'(a9,i2)') 'Iteration', val
call TAU_PHASE_CREATE_DYNAMIC(profiler, cvar)
call TAU_PHASE_START(profiler)
call F1()
call TAU_PHASE_STOP(profiler)
return
end
See Also
TAU_PHASE_CREATE_STATIC, TAU_PHASE_START, TAU_PHASE_STOP
164
Name
TAU_PHASE_CREATE_STATIC -- Defines a static phase.
C/C++:
TAU_PHASE_CREATE_STATIC(phase, function_name, type, group);
Phase phase;
char* or string& function_name;
char* or string& type;
TauGroup_t group;
Fortran:
TAU_PHASE_CREATE_STATIC(phase, name);
integer phase(2);
character name(size);
Description
TAU_PHASE_CREATE_STATIC creates a static phase. Static phases (and timers) are more efficient
than dynamic ones because the function registration only takes place once.
Example
C/C++ :
int f2(void)
{
TAU_PHASE_CREATE_STATIC(t2,"IO Phase", "", TAU_USER);
TAU_PHASE_START(t2);
input();
output();
TAU_PHASE_STOP(t2);
return 0;
}
Fortran :
subroutine F2()
integer phase(2) / 0, 0 /
save
phase
call TAU_PHASE_CREATE_STATIC(phase,'IO Phase')
call TAU_PHASE_START(phase)
call INPUT()
call OUTPUT()
call TAU_PHASE_STOP(phase)
end
>Python:
165
TAU_PHASE_CREATE_STATIC
import pytau
ptr = pytau.phase("foo")
pytau.start(ptr)
foo(2)
pytau.stop(ptr)
See Also
TAU_PHASE_CREATE_DYNAMIC, TAU_PHASE_START, TAU_PHASE_STOP
166
Name
TAU_PHASE_START -- Enters a phase.
C/C++:
TAU_PHASE_START(phase);
Phase phase;
Fortran:
TAU_PHASE_START(phase);
integer phase(2);
Description
TAU_PHASE_START enters a phase. Phases can be nested, but not overlapped.
Example
C/C++ :
int f2(void)
{
TAU_PHASE_CREATE_STATIC(t2,"IO Phase", "", TAU_USER);
TAU_PHASE_START(t2);
input();
output();
TAU_PHASE_STOP(t2);
return 0;
}
Fortran :
subroutine F2()
integer phase(2) / 0, 0 /
save
phase
call TAU_PHASE_CREATE_STATIC(phase,'IO Phase')
call TAU_PHASE_START(phase)
call INPUT()
call OUTPUT()
call TAU_PHASE_STOP(phase)
end
See Also
TAU_PHASE_CREATE_STATIC, TAU_PHASE_CREATE_DYNAMIC, TAU_PHASE_STOP
167
Name
TAU_PHASE_STOP -- Exits a phase.
C/C++:
TAU_PHASE_STOP(phase);
Phase phase;
Fortran:
TAU_PHASE_STOP(phase);
integer phase(2);
Description
TAU_PHASE_STOP exits a phase. Phases can be nested, but not overlapped.
Example
C/C++ :
int f2(void)
{
TAU_PHASE_CREATE_STATIC(t2,"IO Phase", "", TAU_USER);
TAU_PHASE_START(t2);
input();
output();
TAU_PHASE_STOP(t2);
return 0;
}
Fortran :
subroutine F2()
integer phase(2) / 0, 0 /
save
phase
call TAU_PHASE_CREATE_STATIC(phase,'IO Phase')
call TAU_PHASE_START(phase)
call INPUT()
call OUTPUT()
call TAU_PHASE_STOP(phase)
end
See Also
TAU_PHASE_CREATE_STATIC, TAU_PHASE_CREATE_DYNAMIC, TAU_PHASE_START
168
Name
TAU_DYNAMIC_PHASE_START -- Enters a DYNAMIC_PHASE.
C/C++:
TAU_DYNAMIC_PHASE_START(name);
string name;
Fortran:
TAU_DYNAMIC_PHASE_START(name);
char name(size);
Description
TAU_DYNAMIC_PHASE_START enters a DYNAMIC phase. Phases can be nested, but not overlapped.
Example
C/C++ :
TAU_PROFILE("int foo(int) [{foo.cpp} {13,1}-{20,1}]", " ", TAU_USER);
printf("inside foo: calling bar: x = %d\n", x);
printf("before calling bar in foo\n");
TAU_DYNAMIC_PHASE_START("foo_bar");
bar(x-1); /* 17 */
printf("after calling bar in foo\n");
TAU_DYNAMIC_PHASE_STOP("foo_bar");
return x;
Fortran :
call TAU_PROFILE_TIMER(profiler, 'FOO [{foo.f90} {8,18}]')
call TAU_PROFILE_START(profiler)
print *, "inside foo: calling bar, x = ", x
call TAU_DYNAMIC_PHASE_START("foo_bar");
call bar(x-1)
print *, "after calling bar"
call TAU_DYNAMIC_PHASE_STOP("foo_bar");
call TAU_PROFILE_STOP(profiler)
See Also
TAU_PHASE_CREATE_DYNAMIC, TAU_PHASE_CREATE_STATIC, TAU_PHASE_STOP
169
Name
TAU_DYNAMIC_PHASE_STOP -- Enters a DYNAMIC_PHASE.
C/C++:
TAU_DYNAMIC_PHASE_STOP(name);
string name;
Fortran:
TAU_DYNAMIC_PHASE_STOP(name);
char name(size);
Description
TAU_DYNAMIC_PHASE_STOP leaves a DYNAMIC phase. Phases can be nested, but not overlapped.
Example
C/C++ :
TAU_PROFILE("int foo(int) [{foo.cpp} {13,1}-{20,1}]", " ", TAU_USER);
printf("inside foo: calling bar: x = %d\n", x);
printf("before calling bar in foo\n");
TAU_DYNAMIC_PHASE_START("foo_bar");
bar(x-1); /* 17 */
printf("after calling bar in foo\n");
TAU_DYNAMIC_PHASE_STOP("foo_bar");
return x;
Fortran :
call TAU_PROFILE_TIMER(profiler, 'FOO [{foo.f90} {8,18}]')
call TAU_PROFILE_START(profiler)
print *, "inside foo: calling bar, x = ", x
call TAU_DYNAMIC_PHASE_START("foo_bar");
call bar(x-1)
print *, "after calling bar"
call TAU_DYNAMIC_PHASE_STOP("foo_bar");
call TAU_PROFILE_STOP(profiler)
See Also
TAU_PHASE_CREATE_STATIC, TAU_PHASE_CREATE_DYNAMIC, TAU_PHASE_STOP
170
Name
TAU_STATIC_PHASE_START -- Enters a STATIC_PHASE.
C/C++:
TAU_STATIC_PHASE_START(name);
string name;
Fortran:
TAU_STATIC_PHASE_START(name);
char name(size);
Description
TAU_STATIC_PHASE_START enters a static phase. Phases can be nested, but not overlapped.
Example
C/C++ :
TAU_PROFILE("int foo(int) [{foo.cpp} {13,1}-{20,1}]", " ", TAU_USER);
printf("inside foo: calling bar: x = %d\n", x);
printf("before calling bar in foo\n");
TAU_STATIC_PHASE_START("foo_bar");
bar(x-1); /* 17 */
printf("after calling bar in foo\n");
TAU_STATIC_PHASE_STOP("foo_bar");
return x;
Fortran :
call TAU_PROFILE_TIMER(profiler, 'FOO [{foo.f90} {8,18}]')
call TAU_PROFILE_START(profiler)
print *, "inside foo: calling bar, x = ", x
call TAU_STATIC_PHASE_START("foo_bar");
call bar(x-1)
print *, "after calling bar"
call TAU_STATIC_PHASE_STOP("foo_bar");
call TAU_PROFILE_STOP(profiler)
See Also
TAU_PHASE_CREATE_STATIC, TAU_PHASE_CREATE_DYNAMIC, TAU_PHASE_STOP
171
Name
TAU_STATIC_PHASE_STOP -- Enters a STATIC_PHASE.
C/C++:
TAU_STATIC_PHASE_STOP(name);
string name;
Fortran:
TAU_STATIC_PHASE_STOP(name);
char name(size);
Description
TAU_STATIC_PHASE_STOP leaves a static phase. Phases can be nested, but not overlapped.
Example
C/C++ :
TAU_PROFILE("int foo(int) [{foo.cpp} {13,1}-{20,1}]", " ", TAU_USER);
printf("inside foo: calling bar: x = %d\n", x);
printf("before calling bar in foo\n");
TAU_STATIC_PHASE_START("foo_bar");
bar(x-1); /* 17 */
printf("after calling bar in foo\n");
TAU_STATIC_PHASE_STOP("foo_bar");
return x;
Fortran :
call TAU_PROFILE_TIMER(profiler, 'FOO [{foo.f90} {8,18}]')
call TAU_PROFILE_START(profiler)
print *, "inside foo: calling bar, x = ", x
call TAU_STATIC_PHASE_START("foo_bar");
call bar(x-1)
print *, "after calling bar"
call TAU_STATIC_PHASE_STOP("foo_bar");
call TAU_PROFILE_STOP(profiler)
See Also
TAU_PHASE_CREATE_STATIC, TAU_PHASE_CREATE_DYNAMIC, TAU_PHASE_STOP
172
Name
TAU_GLOBAL_PHASE -- Declares a global phase
C/C++:
TAU_GLOBAL_PHASE(phase, function_name, type, group);
Phase phase;
char* or string& function_name;
char* or string& type;
TauGroup_t group;
Description
Declares a global phase to be used in multiple compilation units.
Example
C/C++ :
/* f1.c */
TAU_GLOBAL_PHASE(globalPhase, "global phase", "", TAU_USER);
/* f2.c */
int bar(void) {
TAU_GLOBAL_PHASE_START(globalPhase);
/* ... */
TAU_GLOBAL_PHASE_STOP(globalPhase);
}
See Also
TAU_GLOBAL_PHASE_EXTERNAL,
TAU_GLOBAL_PHASE_STOP
TAU_GLOBAL_PHASE_START,
173
Name
TAU_GLOBAL_PHASE_EXTERNAL -- Declares a global phase from an external compilation unit
C/C++:
TAU_GLOBAL_PHASE_EXTERNAL(timer);
Profiler timer;
Description
TAU_GLOBAL_PHASE_EXTERNAL allows you to access a phase defined in another compilation unit.
Example
C/C++ :
/* f1.c */
TAU_GLOBAL_PHASE(globalPhase, "global phase", "", TAU_USER);
/* f2.c */
int bar(void) {
TAU_GLOBAL_PHASE_START(globalPhase);
/* ... */
TAU_GLOBAL_PHASE_STOP(globalPhase);
}
See Also
TAU_GLOBAL_PHASE, TAU_GLOBAL_PHASE_START, TAU_GLOBAL_PHASE_STOP
174
Name
TAU_GLOBAL_PHASE_START -- Starts a global phase
C/C++:
TAU_GLOBAL_PHASE_START(phase);
Phase phase;
Description
TAU_GLOBAL_PHASE_START starts a global phase.
Example
C/C++ :
/* f1.c */
TAU_GLOBAL_PHASE(globalPhase, "global phase", "", TAU_USER);
/* f2.c */
int bar(void) {
TAU_GLOBAL_PHASE_START(globalPhase);
/* ... */
TAU_GLOBAL_PHASE_STOP(globalPhase);
}
See Also
TAU_GLOBAL_PHASE, TAU_GLOBAL_PHASE_EXTERNAL, TAU_GLOBAL_PHASE_STOP
175
Name
TAU_GLOBAL_PHASE_STOP -- Stops a global phase
C/C++:
TAU_GLOBAL_PHASE_STOP(phase);
Phase phase;
Description
TAU_GLOBAL_PHASE_STOP stops a global phase.
Example
C/C++ :
/* f1.c */
TAU_GLOBAL_PHASE(globalPhase, "global phase", "", TAU_USER);
/* f2.c */
int bar(void) {
TAU_GLOBAL_PHASE_STOP(globalPhase);
/* ... */
TAU_GLOBAL_PHASE_STOP(globalPhase);
}
See Also
TAU_GLOBAL_PHASE, TAU_GLOBAL_PHASE_EXTERNAL, TAU_GLOBAL_PHASE_START
176
Name
TAU_PROFILE_EXIT -- Alerts the profiling system to an exit call
C/C++:
TAU_PROFILE_EXIT(message);
const char * message;
Fortran:
TAU_PROFILE_EXIT(message);
character message(size);
Description
TAU_PROFILE_EXIT should be called prior to an error exit from the program so that any profiles or
event traces can be dumped to disk before quitting.
Example
C/C++ :
if ((ret = open(...)) < 0) {
TAU_PROFILE_EXIT("ERROR in opening a file");
perror("open() failed");
exit(1);
}
Fortran :
call TAU_PROFILE_EXIT('abort called')
See Also
TAU_DB_DUMP
177
Name
TAU_REGISTER_THREAD -- Register a thread with the profiling system
C/C++:
TAU_REGISTER_THREAD();
Fortran:
TAU_REGISTER_THREAD();
Description
To register a thread with the profiling system, invoke the TAU_REGISTER_THREAD macro in the run
method of the thread prior to executing any other TAU macro. This sets up thread identifiers that are
later used by the instrumentation system.
Example
C/C++ :
void * threaded_func(void *data) {
TAU_REGISTER_THREAD();
{ /**** NOTE WE START ANOTHER BLOCK IN THREAD */
TAU_PROFILE_TIMER(tautimer, "threaded_func()", "int ()",
TAU_DEFAULT);
TAU_PROFILE_START(tautimer);
work(); /* work done by this thread */
TAU_PROFILE_STOP(tautimer);
}
return NULL;
}
Fortran :
call TAU_REGISTER_THREAD()
Caveat
PDT based tau_instrumentor does not insert TAU_REGISTER_THREAD calls, they must be inserted
manually
178
Name
TAU_PROFILE_GET_NODE -- Returns the measurement system's node id
C/C++:
TAU_PROFILE_GET_NODE(node);
int node;
Fortran:
TAU_PROFILE_GET_NODE(node);
integer node;
Description
TAU_PROFILE_GET_NODE gives the node id for the processes in which it is called. When using MPI
node id is the same as MPI rank.
Example
C/C++ :
int main (int argc, char **argv) {
int nodeid;
TAU_PROFILE_GET_NODE(nodeid);
return 0;
}
Fortran :
PROGRAM SUM_OF_CUBES
INTEGER :: N
call TAU_PROFILE_GET_NODE(N)
END PROGRAM SUM_OF_CUBES
Python:
import pytau
pytau.setNode(0)
See Also
TAU_PROFILE_GET_CONTEXT
179
Name
TAU_PROFILE_GET_CONTEXT -- Gives the measurement system's context id
C/C++:
TAU_PROFILE_GET_CONTEXT(context);
int context;
Fortran:
TAU_PROFILE_GET_CONTEXT(context);
integer context;
Description
TAU_PROFILE_GET_CONTEXT gives the context id for the processes in which it is called.
Example
C/C++ :
int main (int argc, char **argv) {
int i;
TAU_PROFILE_GET_CONTEXT(i);
return 0;
}
Fortran :
PROGRAM SUM_OF_CUBES
INTEGER :: C
call TAU_PROFILE_GET_CONTEXT(C)
END PROGRAM SUM_OF_CUBES
See Also
TAU_PROFILE_SET_CONTEXT
180
Name
TAU_PROFILE_SET_THREAD -- Informs the measurement system of the THREAD id
C/C++:
TAU_PROFILE_SET_THREAD(THREAD);
int THREAD;
Fortran:
TAU_PROFILE_SET_THREAD(THREAD);
integer THREAD;
Description
The TAU_PROFILE_SET_THREAD macro sets the thread identifier of the executing task for profiling
and tracing. Tasks are identified using node, context and thread ids. The profile data files generated will
accordingly be named profile.<THREAD>.<context>.<thread>. Note that it is not necessary to call
TAU_PROFILE_SET_THREAD when you configued with a threading package (including OpenMP).
Example
C/C++ :
int main (int argc, char **argv) {
int ret, i;
pthread_attr_t attr;
pthread_t
tid;
TAU_PROFILE_TIMER(tautimer,"main()", "int (int, char **)",
TAU_DEFAULT);
TAU_PROFILE_START(tautimer);
TAU_PROFILE_INIT(argc, argv);
TAU_PROFILE_SET_THREAD(0);
/* ... */
TAU_PROFILE_STOP(tautimer);
return 0;
}
Fortran :
PROGRAM SUM_OF_CUBES
integer profiler(2) / 0, 0 /
save profiler
INTEGER :: H, T, U
call TAU_PROFILE_INIT()
call TAU_PROFILE_TIMER(profiler, 'PROGRAM SUM_OF_CUBES')
call TAU_PROFILE_START(profiler)
call TAU_PROFILE_SET_THREAD(0)
! This program prints all 3-digit numbers that
! equal the sum of the cubes of their digits.
DO H = 1, 9
DO T = 0, 9
DO U = 0, 9
181
TAU_PROFILE_SET_THREAD
IF (100*H + 10*T + U == H**3 + T**3 + U**3) THEN
PRINT "(3I1)", H, T, U
ENDIF
END DO
END DO
END DO
call TAU_PROFILE_STOP(profiler)
END PROGRAM SUM_OF_CUBES
Python:
import pytau
pytau.setThread(0)
See Also
TAU_PROFILE_SET_NODE TAU_PROFILE_SET_CONTEXT
182
Name
TAU_PROFILE_GET_THREAD -- Gives the measurement system's thread id
C/C++:
TAU_PROFILE_GET_THREAD(thread);
int thread;
Fortran:
TAU_PROFILE_GET_THREAD(THREAD);
integer THREAD;
Description
TAU_PROFILE_GET_THREAD gives the thread id for the processes in which it is called.
Example
C/C++ :
int main (int argc, char **argv) {
int i;
TAU_PROFILE_GET_THREAD(i);
return 0;
}
Fortran :
PROGRAM SUM_OF_CUBES
INTEGER :: T
call TAU_PROFILE_GET_THREAD(T)
! This program prints all 3-digit numbers that
! equal the sum of the cubes of their digits.
END PROGRAM SUM_OF_CUBES
Python:
import pytau
pytau.getThread(i)
See Also
TAU_PROFILE_GET_NODE TAU_PROFILE_GET_CONTEXT
183
Name
TAU_PROFILE_SET_NODE -- Informs the measurement system of the node id
C/C++:
TAU_PROFILE_SET_NODE(node);
int node;
Fortran:
TAU_PROFILE_SET_NODE(node);
integer node;
Description
The TAU_PROFILE_SET_NODE macro sets the node identifier of the executing task for profiling and
tracing. Tasks are identified using node, context and thread ids. The profile data files generated will accordingly be named profile.<node>.<context>.<thread>. Note that it is not necessary to call
TAU_PROFILE_SET_NODE when using the TAU MPI wrapper library.
Example
C/C++ :
int main (int argc, char **argv) {
int ret, i;
pthread_attr_t attr;
pthread_t
tid;
TAU_PROFILE_TIMER(tautimer,"main()", "int (int, char **)",
TAU_DEFAULT);
TAU_PROFILE_START(tautimer);
TAU_PROFILE_INIT(argc, argv);
TAU_PROFILE_SET_NODE(0);
/* ... */
TAU_PROFILE_STOP(tautimer);
return 0;
}
Fortran :
PROGRAM SUM_OF_CUBES
integer profiler(2) / 0, 0 /
save profiler
INTEGER :: H, T, U
call TAU_PROFILE_INIT()
call TAU_PROFILE_TIMER(profiler, 'PROGRAM SUM_OF_CUBES')
call TAU_PROFILE_START(profiler)
call TAU_PROFILE_SET_NODE(0)
! This program prints all 3-digit numbers that
! equal the sum of the cubes of their digits.
DO H = 1, 9
DO T = 0, 9
DO U = 0, 9
184
TAU_PROFILE_SET_NODE
IF (100*H + 10*T + U == H**3 + T**3 + U**3) THEN
PRINT "(3I1)", H, T, U
ENDIF
END DO
END DO
END DO
call TAU_PROFILE_STOP(profiler)
END PROGRAM SUM_OF_CUBES
Python:
import pytau
pytau.setNode(0)
See Also
TAU_PROFILE_SET_CONTEXT
185
Name
TAU_PROFILE_SET_CONTEXT -- Informs the measurement system of the context id
C/C++:
TAU_PROFILE_SET_CONTEXT(context);
int context;
Fortran:
TAU_PROFILE_SET_CONTEXT(context);
integer context;
Description
The TAU_PROFILE_SET_CONTEXT macro sets the context identifier of the executing task for profiling and tracing. Tasks are identified using context, context and thread ids. The profile data files generated will accordingly be named profile.<context>.<context>.<thread>. Note that it is not necessary to
call TAU_PROFILE_SET_CONTEXT when using the TAU MPI wrapper library.
Example
C/C++ :
int main (int argc, char **argv) {
int ret, i;
pthread_attr_t attr;
pthread_t
tid;
TAU_PROFILE_TIMER(tautimer,"main()", "int (int, char **)",
TAU_DEFAULT);
TAU_PROFILE_START(tautimer);
TAU_PROFILE_INIT(argc, argv);
TAU_PROFILE_SET_NODE(0);
TAU_PROFILE_SET_CONTEXT(1);
/* ... */
TAU_PROFILE_STOP(tautimer);
return 0;
}
Fortran :
PROGRAM SUM_OF_CUBES
integer profiler(2) / 0, 0 /
save profiler
INTEGER :: H, T, U
call TAU_PROFILE_INIT()
call TAU_PROFILE_TIMER(profiler, 'PROGRAM SUM_OF_CUBES')
call TAU_PROFILE_START(profiler)
call TAU_PROFILE_SET_NODE(0)
call TAU_PROFILE_SET_CONTEXT(1)
! This program prints all 3-digit numbers that
! equal the sum of the cubes of their digits.
DO H = 1, 9
186
TAU_PROFILE_SET_CONTEXT
DO T = 0, 9
DO U = 0, 9
IF (100*H + 10*T + U == H**3 + T**3 + U**3) THEN
PRINT "(3I1)", H, T, U
ENDIF
END DO
END DO
END DO
call TAU_PROFILE_STOP(profiler)
END PROGRAM SUM_OF_CUBES
See Also
TAU_PROFILE_SET_NODE
187
Name
TAU_REGISTER_FORK -- Informs the measurement system that a fork has taken place
C/C++:
TAU_REGISTER_FORK(pid, option);
int pid;
enum TauFork_t option;
Description
To register a child process obtained from the fork() syscall, invoke the TAU_REGISTER_FORK macro.
It takes two parameters, the first is the node id of the child process (typically the process id returned by
the fork call or any 0..N-1 range integer). The second parameter specifies whether the performance data
for the child process should be derived from the parent at the time of fork (
TAU_INCLUDE_PARENT_DATA ) or should be independent of its parent at the time of fork (
TAU_EXCLUDE_PARENT_DATA ). If the process id is used as the node id, before any analysis is done,
all profile files should be converted to contiguous node numbers (from 0..N-1). It is highly recommended to use flat contiguous node numbers in this call for profiling and tracing.
Example
C/C++ :
pID = fork();
if (pID == 0) {
printf("Parent : pid returned %d\n", pID)
} else {
// If we'd used the TAU_INCLUDE_PARENT_DATA, we get
// the performance data from the parent in this process
// as well.
TAU_REGISTER_FORK(pID, TAU_EXCLUDE_PARENT_DATA);
printf("Child : pid = %d", pID);
}
188
Name
TAU_REGISTER_EVENT -- Registers a user event
C/C++:
TAU_REGISTER_EVENT(variable, event_name);
TauUserEvent variable;
char *event_name;
Fortran:
TAU_REGISTER_EVENT(variable, event_name);
int variable(2);
character event_name(size);
Description
TAU can profile user-defined events using TAU_REGISTER_EVENT. The meaning of the event is determined by the user. The first argument to TAU_REGISTER_EVENT is the pointer to an integer array.
This array is declared with a save attribute as shown below.
Example
C/C++ :
int user_square(int count) {
TAU_REGISTER_EVENT(ue1, "UserSquare Event");
TAU_EVENT(ue1, count * count);
return 0;
}
Fortran :
integer eventid(2)
save eventid
call TAU_REGISTER_EVENT(eventid, 'Error in Iteration')
call TAU_EVENT(eventid, count)
See Also
TAU_EVENT,
TAU_REGISTER_CONTEXT_EVENT,
TAU_REPORT_STATISTICS,
TAU_REPORT_THREAD_STATISTICS, TAU_GET_EVENT_NAMES, TAU_GET_EVENT_VALS
189
Name
TAU_PROFILER_REGISTER_EVENT -- Registers a user event
C/C++:
TAU_PROFILER_REGISTER_EVENT(variable, event, event_name);
TauUserEvent variable;
void *event;
char *event_name;
Fortran:
TAU_PROFILER_REGISTER_EVENT(integer , event_name);
int integer (2);
character event_name(size);
Description
TAU can profile user-defined events using TAU_PROFILER_REGISTER_EVENT. The meaning of the
event is determined by the user. The first argument to TAU_PROFILER_REGISTER_EVENT is the
pointer to an integer array. This array is declared with a save attribute as shown below.
Example
C/C++ :
int user_square(int count) {
void *ue1;
TAU_PROFILER_REGISTER_EVENT(ue1, "UserSquare Event");
TAU_EVENT(ue1, count * count);
return 0;
}
Fortran :
integer eventid(2)
save eventid
call TAU_PROFILER_REGISTER_EVENT(eventid, 'Error in Iteration')
call TAU_EVENT(eventid, count)
See Also
TAU_EVENT,
TAU_REGISTER_CONTEXT_EVENT,
TAU_REPORT_STATISTICS,
TAU_REPORT_THREAD_STATISTICS, TAU_GET_EVENT_NAMES, TAU_GET_EVENT_VALS
190
Name
TAU_EVENT -- Triggers a user event
C/C++:
TAU_TRIGGER_EVENT(name, value);
const char * name;
double value;
Fortran:
TAU_TRIGGER_EVENT(integer , event_name);
int integer (2);
character event_name(size);
Description
Triggers an named event with the given value
Example
C/C++ :
int user_square(int count) {
TAU_TRIGGER_EVENT("Error in Iteration", count * count);
return 0;
}
Fortran :
call TAU_EVENT(count, 'Error in Iteration')
191
Name
TAU_EVENT -- Triggers a user event
C/C++:
TAU_TRIGGER_EVENT_THREAD(name, value, thread);
const char * name;
double value;
int thread;
Fortran:
TAU_TRIGGER_EVENT_THREAD(integer , integer , event_name);
int integer (2);
int integer (2);
character event_name(size);
Description
Triggers an named event with the given value on a given thead or task.
Example
C/C++ :
int user_square(int count) {
TAU_TRIGGER_EVENT("Error in Iteration", count * count, workTask);
return 0;
}
Fortran :
call TAU_EVENT(count, workTask, 'Error in Iteration')
192
Name
TAU_EVENT -- Triggers a user event
C/C++:
TAU_EVENT(variable, value);
TauUserEvent variable;
double value;
Fortran:
TAU_EVENT(variable, value);
integer variable(2);
real value;
Description
Triggers an event that was registered with TAU_REGISTER_EVENT.
Example
C/C++ :
int user_square(int count) {
TAU_REGISTER_EVENT(ue1, "UserSquare Event");
TAU_EVENT(ue1, count * count);
return 0;
}
Fortran :
integer eventid(2)
save eventid
call TAU_REGISTER_EVENT(eventid, 'Error in Iteration')
call TAU_EVENT(eventid, count)
See Also
TAU_REGISTER_EVENT
193
Name
TAU_EVENT_THREAD -- Triggers a user event on a given thread
C/C++:
TAU_EVENT_THREAD(variable, value, thread id);
TauUserEVENT_THREAD variable;
double value;
int thread id;
Fortran:
TAU_EVENT_THREAD(variable, value, thread id);
integer variable(2);
real value;
integer thread id;
Description
Triggers an event that was registered with TAU_REGISTER_EVENT on a given thread.
Example
C/C++ :
int user_square(int count) {
TAU_REGISTER_EVENT(ue1, "UserSquare Event");
TAU_EVENT_THREAD(ue1, count * count, threadid);
return 0;
}
Fortran :
integer eventid(2)
save eventid
call TAU_REGISTER_EVENT(eventid, 'Error in Iteration')
call TAU_EVENT_THREAD(eventid, count, threadid)
See Also
TAU_REGISTER_EVENT
194
Name
TAU_REGISTER_CONTEXT_EVENT -- Registers a context event
C/C++:
TAU_REGISTER_CONTEXT_EVENT(variable, event_name);
TauUserEvent variable;
char *event_name;
Fortran:
TAU_REGISTER_CONTEXT_EVENT(variable, event_name);
int variable(2);
character event_name(size);
Description
Creates a context event with name. A context event appends the names of routines executing on the callstack to the name specified by the user. Whenver a context event is triggered, the callstack is examined
to determine the context of execution. Starting from the parent function where the event is triggered,
TAU walks up the callstack to a depth specified by the user in the environment variable
TAU_CALLPATH_DEPTH . If this environment variable is not specified, TAU uses 2 as the default
depth. For e.g., if the user registers a context event with the name "memory used" and specifies 3 as the
callpath depth, and if the event is triggered in two locations (in routine a, when it was called by b, when
it was called by c, and in routine h, when it was called by g, when it was called by i), then, we'd see the
user defined event information for "memory used: c() => b() => a()" and "memory used: i() => g() =>
h()".
Example
C/C++ :
int f2(void)
{
static int count = 0;
count ++;
TAU_PROFILE("f2()", "(sleeps 2 sec, calls f3)", TAU_USER);
TAU_REGISTER_CONTEXT_EVENT(event, "Iteration count");
/*
if (count == 2)
TAU_DISABLE_CONTEXT_EVENT(event);
*/
printf("Inside f2: sleeps 2 sec, calls f3\n");
TAU_CONTEXT_EVENT(event, 232+count);
sleep(2);
f3();
return 0;
}
Fortran :
195
TAU_REGISTER_CONTEXT_EVENT
subroutine foo(id)
integer id
integer profiler(2) / 0, 0 /
integer maev(2) / 0, 0 /
integer mdev(2) / 0, 0 /
save profiler, maev, mdev
integer :: ierr
integer :: h, t, u
INTEGER, ALLOCATABLE :: STORAGEARY(:)
DOUBLEPRECISION
edata
call TAU_PROFILE_TIMER(profiler, 'FOO')
call TAU_PROFILE_START(profiler)
call TAU_PROFILE_SET_NODE(0)
call TAU_REGISTER_CONTEXT_EVENT(maev, "STORAGEARY Alloc [cubes.f:20]")
call TAU_REGISTER_CONTEXT_EVENT(mdev, "STORAGEARY Dealloc [cubes.f:37]")
allocate(STORAGEARY(1:999), STAT=IERR)
edata = SIZE(STORAGEARY)*sizeof(INTEGER)
call TAU_CONTEXT_EVENT(maev, edata)
...
deallocate(STORAGEARY)
edata = SIZE(STORAGEARY)*sizeof(INTEGER)
call TAU_CONTEXT_EVENT(mdev, edata)
call TAU_PROFILE_STOP(profiler)
end subroutine foo
See Also
TAU_CONTEXT_EVENT,
TAU_ENABLE_CONTEXT_EVENT,
TAU_DISABLE_CONTEXT_EVENT, TAU_REGISTER_EVENT, TAU_REPORT_STATISTICS,
TAU_REPORT_THREAD_STATISTICS, TAU_GET_EVENT_NAMES, TAU_GET_EVENT_VALS
196
Name
TAU_CONTEXT_EVENT -- Triggers a context event
C/C++:
TAU_CONTEXT_EVENT(variable, value);
TauUserEvent variable;
double value;
Fortran:
TAU_CONTEXT_EVENT(variable, value);
integer variable(2);
real value;
Description
Triggers a context event. A context event associates the name with the list of routines along the callstack. A context event tracks information like a user defined event and TAU records the maxima, minima, mean, std. deviation and the number of samples for each context event. A context event helps distinguish the data supplied by the user based on the location where an event occurs and the sequence of
actions (routine/timer invocations) that preceeded the event. The depth of the the callstack embedded in
the context event's name is specified by the user in the environment variable TAU_CALLPATH_DEPTH.
If this variable is not specified, TAU uses a default depth of 2.
Example
C/C++ :
int f2(void)
{
static int count = 0;
count ++;
TAU_PROFILE("f2()", "(sleeps 2 sec, calls f3)", TAU_USER);
TAU_REGISTER_CONTEXT_EVENT(event, "Iteration count");
/*
if (count == 2)
TAU_DISABLE_CONTEXT_EVENT(event);
*/
printf("Inside f2: sleeps 2 sec, calls f3\n");
TAU_CONTEXT_EVENT(event, 232+count);
sleep(2);
f3();
return 0;
}
Fortran :
integer memevent(2) / 0, 0 /
save memevent
call TAU_REGISTER_CONTEXT_EVENT(memevent, "STORAGEARY mem allocated')
197
TAU_CONTEXT_EVENT
call TAU_CONTEXT_EVENT(memevent, SIZEOF(STORAGEARY)*sizeof(INTEGER))
See Also
TAU_REGISTER_CONTEXT_EVENT
198
Name
TAU_TRIGGER_CONTEXT_EVENT -- Triggers a context event
C/C++:
TAU_TRIGGER_CONTEXT_EVENT(name, value);
const char * name;
double value;
Fortran:
TAU_TRIGGER_CONTEXT_EVENT(value, event_name);
real value;
character event_name(size);
Description
Triggers an event with a name and the list of routines along the callstack. A context event tracks information like a user defined event and TAU records the maxima, minima, mean, std. deviation and the number of samples for each context event. A context event helps distinguish the data supplied by the user
based on the location where an event occurs and the sequence of actions (routine/timer invocations) that
preceeded the event. The depth of the the callstack embedded in the context event's name is specified by
the user in the environment variable TAU_CALLPATH_DEPTH. If this variable is not specified, TAU
uses a default depth of 2.
Example
C/C++ :
int f2(void)
{
static int count = 0;
count ++;
TAU_PROFILE("f2()", "(sleeps 2 sec, calls f3)", TAU_USER);
/*
if (count == 2)
TAU_DISABLE_CONTEXT_EVENT(event);
*/
printf("Inside f2: sleeps 2 sec, calls f3\n");
TAU_TRIGGER_CONTEXT_EVENT("Iteration count", 232+count);
sleep(2);
f3();
return 0;
}
Fortran :
integer memevent(2) / 0, 0 /
save memevent
call TAU_TRIGGER_CONTEXT_EVENT(memevent, SIZEOF(STORAGEARY)*sizeof(INTEGER), "STORA
199
TAU_TRIGGER_CONTEXT_EVENT
See Also
TAU_REGISTER_CONTEXT_EVENT
200
Name
TAU_EVENT -- Triggers a context user event
C/C++:
TAU_TRIGGER_CONTEXT_EVENT_THREAD(name, value, thread);
const char * name;
double value;
int thread;
Fortran:
TAU_TRIGGER_CONTEXT_EVENT_THREAD(integer , integer , event_name);
int integer (2);
int integer (2);
character event_name(size);
Description
Triggers an event with a name and the list of routines along the callstack. A context event tracks information like a user defined event and TAU records the maxima, minima, mean, std. deviation and the number of samples for each context event. A context event helps distinguish the data supplied by the user
based on the location where an event occurs and the sequence of actions (routine/timer invocations) that
preceeded the event. The depth of the the callstack embedded in the context event's name is specified by
the user in the environment variable TAU_CALLPATH_DEPTH. If this variable is not specified, TAU
uses a default depth of 2.
Example
C/C++ :
int user_square(int count) {
TAU_TRIGGER_CONTEXT_EVENT_THREAD("Error in Iteration", count * count, workTask);
return 0;
}
Fortran :
call TAU_TRIGGER_CONTEXT_EVENT_THREAD(count, workTask, 'Error in Iteration')
201
Name
TAU_ENABLE_CONTEXT_EVENT -- Enable a context event
C/C++:
TAU_ENABLE_CONTEXT_EVENT(event);
TauUserEvent event;
Description
Enables a context event.
Example
C/C++ :
int f2(void) {
static int count = 0;
count ++;
TAU_PROFILE("f2()", "(sleeps 2 sec, calls f3)", TAU_USER);
TAU_REGISTER_CONTEXT_EVENT(event, "Iteration count");
if (count == 2)
TAU_DISABLE_CONTEXT_EVENT(event);
else
TAU_ENABLE_CONTEXT_EVENT(event);
printf("Inside f2: sleeps 2 sec, calls f3\n");
TAU_CONTEXT_EVENT(event, 232+count);
sleep(2);
f3();
return 0;
}
See Also
TAU_REGISTER_CONTEXT_EVENT, TAU_DISABLE_CONTEXT_EVENT
202
Name
TAU_DISABLE_CONTEXT_EVENT -- Disable a context event
C/C++:
TAU_DISABLE_CONTEXT_EVENT(event);
TauUserEvent event;
Description
Disables a context event.
Example
C/C++ :
int f2(void) {
static int count = 0;
count ++;
TAU_PROFILE("f2()", "(sleeps 2 sec, calls f3)", TAU_USER);
TAU_REGISTER_CONTEXT_EVENT(event, "Iteration count");
if (count == 2)
TAU_DISABLE_CONTEXT_EVENT(event);
else
TAU_ENABLE_CONTEXT_EVENT(event);
printf("Inside f2: sleeps 2 sec, calls f3\n");
TAU_CONTEXT_EVENT(event, 232+count);
sleep(2);
f3();
return 0;
}
See Also
TAU_REGISTER_CONTEXT_EVENT, TAU_ENABLE_CONTEXT_EVENT
203
Name
TAU_EVENT_SET_NAME -- Sets the name of an event
C/C++:
TAU_EVENT_SET_NAME(event, name);
TauUserEvent event;
const char *name;
Description
Changes the name of an event.
Example
C/C++ :
TAU_EVENT_SET_NAME(event, "new name");
See Also
TAU_REGISTER_EVENT
204
Name
TAU_EVENT_DISABLE_MAX -- Disables tracking of maximum statistic for a given event
C/C++:
TAU_EVENT_DISABLE_MAX(event);
TauUserEvent event;
Description
Disables tracking of maximum statistic for a given event
Example
C/C++ :
TAU_EVENT_DISABLE_MAX(event);
See Also
TAU_REGISTER_EVENT
205
Name
TAU_EVENT_DISABLE_MEAN -- Disables tracking of mean statistic for a given event
C/C++:
TAU_EVENT_DISABLE_MEAN(event);
TauUserEvent event;
Description
Disables tracking of mean statistic for a given event
Example
C/C++ :
TAU_EVENT_DISABLE_MEAN(event);
See Also
TAU_REGISTER_EVENT
206
Name
TAU_EVENT_DISABLE_MIN -- Disables tracking of minimum statistic for a given event
C/C++:
TAU_EVENT_DISABLE_MIN(event);
TauUserEvent event;
Description
Disables tracking of minimum statistic for a given event
Example
C/C++ :
TAU_EVENT_DISABLE_MIN(event);
See Also
TAU_REGISTER_EVENT
207
Name
TAU_EVENT_DISABLE_STDDEV -- Disables tracking of standard deviation statistic for a given
event
C/C++:
TAU_EVENT_DISABLE_STDDEV(event);
TauUserEvent event;
Description
Disables tracking of standard deviation statistic for a given event
Example
C/C++ :
TAU_EVENT_DISABLE_STDDEV(event);
See Also
TAU_REGISTER_EVENT
208
Name
TAU_REPORT_STATISTICS -- Outputs statistics
C/C++:
TAU_REPORT_STATISTICS();
Fortran:
TAU_REPORT_STATISTICS();
Description
TAU_REPORT_STATISTICS prints the aggregate statistics of user events across all threads in each
node. Typically, this should be called just before the main thread exits.
Example
C/C++ :
TAU_REPORT_STATISTICS();
Fortran :
call TAU_REPORT_STATISTICS()
See Also
TAU_REGISTER_EVENT,
TAU_REPORT_THREAD_STATISTICS
TAU_REGISTER_CONTEXT_EVENT,
209
Name
TAU_REPORT_THREAD_STATISTICS -- Outputs statistics, plus thread statistics
C/C++:
TAU_REPORT_THREAD_STATISTICS();
Fortran:
TAU_REPORT_THREAD_STATISTICS();
Description
TAU_REPORT_THREAD_STATISTICS prints the aggregate, as well as per thread user event statistics.
Typically, this should be called just before the main thread exits.
Example
C/C++ :
TAU_REPORT_THREAD_STATISTICS();
Fortran :
call TAU_REPORT_THREAD_STATISTICS()
See Also
TAU_REGISTER_EVENT, TAU_REGISTER_CONTEXT_EVENT, TAU_REPORT_STATISTICS
210
Name
TAU_ENABLE_INSTRUMENTATION -- Enables instrumentation
C/C++:
TAU_ENABLE_INSTRUMENTATION();
Fortran:
TAU_ENABLE_INSTRUMENTATION();
Description
TAU_ENABLE_INSTRUMENTATION macro re-enables all TAU instrumentation. All instances of functions and statements that occur between the disable/enable section are ignored by TAU. This allows a
user to limit the trace size, if the macros are used to disable recording of a set of iterations that have the
same characteristics as, for example, the first recorded instance.
Example
C/C++ :
int main(int argc, char **argv) {
foo();
TAU_DISABLE_INSTRUMENTATION();
for (int i =0; i < N; i++) {
bar(); // not recorded
}
TAU_ENABLE_INSTRUMENTATION();
bar(); // recorded
}
Fortran :
call TAU_DISABLE_INSTRUMENTATION()
...
call TAU_ENABLE_INSTRUMENTATION()
Python:
import pytau
pytau.enableInstrumentation()
...
pytau.disableInstrumentation()
See Also
211
TAU_ENABLE_INSTRUMENTATION
TAU_DISABLE_INSTRUMENTATION,
TAU_INIT, TAU_PROFILE_INIT
TAU_ENABLE_GROUP,
212
TAU_DISABLE_GROUP,
Name
TAU_DISABLE_INSTRUMENTATION -- Disables instrumentation
C/C++:
TAU_DISABLE_INSTRUMENTATION();
Fortran:
TAU_DISABLE_INSTRUMENTATION();
Description
TAU_DISABLE_INSTRUMENTATION macro disables all entry/exit instrumentation within all threads
of a context. This allows the user to selectively enable and disable instrumentation in parts of his/her
code. It is important to re-enable the instrumentation within the same basic block and scope.
Example
C/C++ :
int main(int argc, char **argv) {
foo();
TAU_DISABLE_INSTRUMENTATION();
for (int i =0; i < N; i++) {
bar(); // not recorded
}
TAU_DISABLE_INSTRUMENTATION();
bar(); // recorded
}
Fortran :
call TAU_DISABLE_INSTRUMENTATION()
...
call TAU_DISABLE_INSTRUMENTATION()
Python:
import pytau
pytau.enableInstrumentation()
...
pytau.disableInstrumentation()
See Also
213
TAU_DISABLE_INSTRUMENTATION
TAU_ENABLE_INSTRUMENTATION,
TAU_INIT, TAU_PROFILE_INIT
TAU_ENABLE_GROUP,
214
TAU_DISABLE_GROUP,
Name
TAU_ENABLE_GROUP -- Enables tracking of a given group
C/C++:
TAU_ENABLE_GROUP(group);
TauGroup_t group;
Fortran:
TAU_ENABLE_GROUP(group);
integer group;
Description
Enables the instrumentation for a given group. By default, it is already on.
Example
C/C++ :
void foo() {
TAU_PROFILE("foo()", " ", TAU_USER);
...
TAU_ENABLE_GROUP(TAU_USER);
}
Fortran :
include 'Profile/TauFAPI.h'
call TAU_ENABLE_GROUP(TAU_USER)
Python:
import pytau
pytau.enableGroup(TAU_USER)
See Also
TAU_ENABLE_INSTRUMENTATION,
TAU_DISABLE_INSTRUMENTATION,
TAU_DISABLE_GROUP, TAU_INIT, TAU_PROFILE_INIT
215
Name
TAU_DISABLE_GROUP -- Disables tracking of a given group
C/C++:
TAU_DISABLE_GROUP(group);
TauGroup_t group;
Fortran:
TAU_DISABLE_GROUP(group);
integer group;
Description
Disables the instrumentation for a given group. By default, it is on.
Example
C/C++ :
void foo() {
TAU_PROFILE("foo()", " ", TAU_USER);
...
TAU_DISABLE_GROUP(TAU_USER);
}
Fortran :
include 'Profile/TauFAPI.h'
call TAU_DISABLE_GROUP(TAU_USER)
Python:
import pytau
pytau.disableGroup(TAU_USER)
See Also
TAU_ENABLE_INSTRUMENTATION,
TAU_DISABLE_INSTRUMENTATION,
TAU_ENABLE_GROUP, TAU_INIT, TAU_PROFILE_INIT
216
Name
TAU_PROFILE_TIMER_SET_GROUP -- Change the group of a timer
C/C++:
TAU_PROFILE_TIMER_SET_GROUP(timer, group);
Profiler timer;
TauGroup_t group;
Description
TAU_PROFILE_TIMER_SET_GROUP changes the group associated with a timer.
Example
C/C++ :
void foo() {
TAU_PROFILE_TIMER(t, "foo loop timer", " ", TAU_USER1);
...
TAU_PROFILE_TIMER_SET_GROUP(t, TAU_USER3);
}
See Also
TAU_PROFILE_TIMER, TAU_PROFILE_TIMER_SET_GROUP_NAME
217
Name
TAU_PROFILE_TIMER_SET_GROUP_NAME -- Changes the group name for a timer
C/C++:
TAU_PROFILE_TIMER_SET_GROUP_NAME(timer, groupname);
Profiler timer;
char *groupname;
Description
TAU_PROFILE_TIMER_SET_GROUP_NAME changes the group name associated with a given timer.
Example
C/C++ :
void foo() {
TAU_PROFILE_TIMER(looptimer, "foo: loop1", " ", TAU_USER);
TAU_PROFILE_START(looptimer);
for (int i = 0; i < N; i++) { /* do something */ }
TAU_PROFILE_STOP(looptimer);
TAU_PROFILE_TIMER_SET_GROUP_NAME("Field");
}
See Also
TAU_PROFILE_TIMER, TAU_PROFILE_TIMER_SET_GROUP
218
Name
TAU_PROFILE_TIMER_SET_NAME -- Changes the name of a timer
C/C++:
TAU_PROFILE_TIMER_SET_NAME(timer, newname);
Profiler timer;
string newname;
Description
TAU_PROFILE_TIMER_SET_NAME macro changes the name associated with a timer to the newname
argument.
Example
C/C++ :
void foo() {
TAU_PROFILE_TIMER(timer1, "foo:loop1", " ", TAU_USER);
...
TAU_PROFILE_TIMER_SET_NAME(timer1, "foo:lines 21-34");
}
See Also
TAU_PROFILE_TIMER
219
Name
TAU_PROFILE_TIMER_SET_TYPE -- Changes the type of a timer
C/C++:
TAU_PROFILE_TIMER_SET_TYPE(timer, newname);
Profiler timer;
string newname;
Description
TAU_PROFILE_TIMER_SET_TYPE macro changes the type associated with a timer to the newname
argument.
Example
C/C++ :
void foo() {
TAU_PROFILE_TIMER(timer1, "foo", "int", TAU_USER);
...
TAU_PROFILE_TIMER_SET_TYPE(timer1, "long");
}
See Also
TAU_PROFILE_TIMER
220
Name
TAU_PROFILE_SET_GROUP_NAME -- Changes the group name of a profiled section
C/C++:
TAU_PROFILE_SET_GROUP_NAME(groupname);
char *groupname;
Description
TAU_PROFILE_SET_GROUP_NAME macro allows the user to change the group name associated with
the instrumented routine. This macro must be called within the instrumented routine.
Example
C/C++ :
void foo() {
TAU_PROFILE("foo()", "void ()", TAU_USER);
TAU_PROFILE_SET_GROUP_NAME("Particle");
/* gives a more meaningful group name */
}
See Also
TAU_PROFILE
221
Name
TAU_INIT -- Processes command-line arguments for selective instrumentation
C/C++:
TAU_INIT(argc, argv);
int *argc;
char ***argv;
Description
TAU_INIT parses and removes the command-line arguments for the names of profile groups that are to
be selectively enabled for instrumentation. By default, if this macro is not used, functions belonging to
all profile groups are enabled. TAU_INIT differs from TAU_PROFILE_INIT only in the argument
types.
Example
C/C++ :
int main(int argc, char **argv) {
TAU_PROFILE("main()", "int (int, char **)", TAU_GROUP_12);
TAU_INIT(&argc, &argv);
...
}
% ./a.out --profile 12+14
See Also
TAU_PROFILE_INIT
222
Name
TAU_PROFILE_INIT -- Processes command-line arguments for selective instrumentation
C/C++:
TAU_PROFILE_INIT(argc, argv);
int argc;
char **argv;
Fortran:
TAU_PROFILE_INIT();
Description
TAU_PROFILE_INIT parses the command-line arguments for the names of profile groups that are to
be selectively enabled for instrumentation. By default, if this macro is not used, functions belonging to
all profile groups are enabled. TAU_INIT differs from TAU_PROFILE_INIT only in the argument
types.
Example
C/C++ :
int main(int argc, char **argv) {
TAU_PROFILE("main()", "int (int, char **)", TAU_DEFAULT);
TAU_PROFILE_INIT(argc, argv);
...
}
% ./a.out --profile 12+14
Fortran :
PROGRAM SUM_OF_CUBES
integer profiler(2)
save profiler
call TAU_PROFILE_INIT()
...
See Also
TAU_INIT
223
Name
TAU_GET_PROFILE_GROUP -- Creates groups based on names
C/C++:
TAU_GET_PROFILE_GROUP(groupname);
char *groupname;
Description
TAU_GET_PROFILE_GROUP allows the user to dynamically create groups based on strings, rather
than use predefined, statically assigned groups such as TAU_USER1, TAU_USER2 etc. This allows
names to be associated in creating unique groups that are more meaningful, using names of files or directories for instance.
Example
C/C++ :
#define PARTICLES TAU_GET_PROFILE_GROUP("PARTICLES")
void foo() {
TAU_PROFILE("foo()", " ", PARTICLES);
}
void bar() {
TAU_PROFILE("bar()", " ", PARTICLES);
}
Python:
import pytau
pytau.getProfileGroup("PARTICLES")
See Also
TAU_ENABLE_GROUP_NAME,
TAU_DISABLE_GROUP_NAME,
TAU_ENABLE_ALL_GROUPS, TAU_DISABLE_ALL_GROUPS
224
Name
TAU_ENABLE_GROUP_NAME -- Enables a group based on name
C/C++:
TAU_ENABLE_GROUP_NAME(groupname);
char *groupname;
Fortran:
TAU_ENABLE_GROUP_NAME(groupname);
character groupname(size);
Description
TAU_ENABLE_GROUP_NAME macro can turn on the instrumentation associated with routines based on
a dynamic group assigned to them. It is important to note that this and the
TAU_DISABLE_GROUP_NAME macros apply to groups created dynamically using
TAU_GET_PROFILE_GROUP.
Example
C/C++ :
/* tau_instrumentor was invoked with -g DTM for a set of files */
TAU_DISABLE_GROUP_NAME("DTM");
dtm_routines();
/* disable and then re-enable the group with the name DTM */
TAU_ENABLE_GROUP_NAME("DTM");
Fortran :
! tau_instrumentor was invoked with -g DTM for this file
call TAU_PROFILE_TIMER(profiler, "ITERATE>DTM")
call TAU_DISABLE_GROUP_NAME("DTM")
! Disable, then re-enable DTM group
call TAU_ENABLE_GROUP_NAME("DTM")
Python:
import pytau
pytau.enableGroupName("DTM")
See Also
225
TAU_ENABLE_GROUP_NAME
TAU_GET_PROFILE_GROUP, TAU_DISABLE_GROUP_NAME, TAU_ENABLE_ALL_GROUPS,
TAU_DISABLE_ALL_GROUPS
226
Name
TAU_DISABLE_GROUP_NAME -- Disables a group based on name
C/C++:
TAU_DISABLE_GROUP_NAME(groupname);
char *groupname;
Fortran:
TAU_DISABLE_GROUP_NAME(groupname);
character groupname(size);
Description
Similar to TAU_ENABLE_GROUP_NAME , this macro turns off the instrumentation in all routines associated with the dynamic group created using the tau_instrumentor -g <group_name> argument.
Example
C/C++ :
/* tau_instrumentor was invoked with -g DTM for a set of files */
TAU_DISABLE_GROUP_NAME("DTM");
dtm_routines();
/* disable and then re-enable the group with the name DTM */
TAU_ENABLE_GROUP_NAME("DTM");
Fortran :
! tau_instrumentor was invoked with -g DTM for this file
call TAU_PROFILE_TIMER(profiler, "ITERATE>DTM")
call TAU_DISABLE_GROUP_NAME("DTM")
! Disable, then re-enable DTM group
call TAU_ENABLE_GROUP_NAME("DTM")
Python:
import pytau
pytau.disableGroupName("DTM")
See Also
TAU_GET_PROFILE_GROUP, TAU_ENABLE_GROUP_NAME, TAU_ENABLE_ALL_GROUPS,
TAU_DISABLE_ALL_GROUPS
227
Name
TAU_ENABLE_ALL_GROUPS -- Enables instrumentation in all groups
C/C++:
TAU_ENABLE_ALL_GROUPS();
Fortran:
TAU_ENABLE_ALL_GROUPS();
Description
This macro turns on instrumentation in all groups
Example
C/C++ :
TAU_ENABLE_ALL_GROUPS();
Fortran :
call TAU_ENABLE_ALL_GROUPS();
Python:
import pytau
pytau.enableAllGroups()
See Also
TAU_GET_PROFILE_GROUP,
TAU_ENABLE_GROUP_NAME,
TAU_DISABLE_GROUP_NAME, TAU_DISABLE_ALL_GROUPS
228
Name
TAU_DISABLE_ALL_GROUPS -- Disables instrumentation in all groups
C/C++:
TAU_DISABLE_ALL_GROUPS();
Fortran:
TAU_DISABLE_ALL_GROUPS();
Description
This macro turns off instrumentation in all groups.
Example
C/C++ :
void foo() {
TAU_DISABLE_ALL_GROUPS();
TAU_ENABLE_GROUP_NAME("PARTICLES");
}
Fortran :
call TAU_DISABLE_ALL_GROUPS();
Python:
import pytau
pytau.disableAllGroups()
See Also
TAU_GET_PROFILE_GROUP,
TAU_ENABLE_GROUP_NAME,
TAU_DISABLE_GROUP_NAME, TAU_ENABLE_ALL_GROUPS
229
Name
TAU_GET_EVENT_NAMES -- Gets the registered user events.
C/C++:
TAU_GET_EVENT_NAMES(eventList, numEvents);
const char ***eventList;
int *numEvents;
Description
Retrieves user event names for all user-defined events
Example
C/C++ :
const char **eventList;
int numEvents;
TAU_GET_EVENT_NAMES(eventList, numEvents);
cout << "numEvents: " << numEvents << endl;
See Also
TAU_REGISTER_EVENT, TAU_REGISTER_CONTEXT_EVENT, TAU_GET_EVENT_VALS
230
Name
TAU_GET_EVENT_VALS -- Gets user event data for given user events.
C/C++:
TAU_GET_EVENT_VALS(inUserEvents, numUserEvents, numEvents, max, min,
mean, sumSqe);
const char **inUserEvents;
int numUserEvents;
int **numEvents;
double **max;
double **min;
double **mean;
double **sumSqe;
Description
Retrieves user defined event data for the specified user defined events. The list of events are specified by
the first parameter (eventList) and the user specifies the number of events in the second parameter
(numUserEvents). TAU returns the number of times the event was invoked in the numUserEvents. The
max, min, mean values are returned in the following parameters. TAU computes the sum of squares of
the given event and returns this value in the next argument (sumSqe).
Example
C/C++ :
const char **eventList;
int numEvents;
TAU_GET_EVENT_NAMES(eventList, numEvents);
cout << "numEvents: " << numEvents << endl;
if (numEvents > 0) {
int *numSamples;
double *max;
double *min;
double *mean;
double *sumSqr;
TAU_GET_EVENT_VALS(eventList, numEvents, numSamples,
max, min, mean, sumSqr);
for (int i=0; i<numEvents; i++) {
cout << "-------------------\n";
cout << "User Event:
" << eventList[i] << endl;
cout << "Number of Samples: " << numSamples[i] << endl;
cout << "Maximum Value:
" << max[i] << endl;
cout << "Minimum Value:
" << min[i] << endl;
cout << "Mean Value:
" << mean[i] << endl;
cout << "Sum Squared:
" << sumSqr[i] << endl;
}
}
}
231
TAU_GET_EVENT_VALS
See Also
TAU_REGISTER_EVENT, TAU_REGISTER_CONTEXT_EVENT, TAU_GET_EVENT_NAMES
232
Name
TAU_GET_COUNTER_NAMES -- Gets the counter names
C/C++:
TAU_GET_COUNTER_NAMES(counterList, numCounters);
char **counterList;
int numCounters;
Description
TAU_GET_COUNTER_NAMES returns the list of counter names and the number of counters used for
measurement. When wallclock time is used, the counter name of "default" is returned.
Example
C/C++ :
int numOfCounters;
const char ** counterList;
TAU_GET_COUNTER_NAMES(counterList, numOfCounters);
for(int j=0;j<numOfCounters;j++){
cout << "The counter names so far are: " << counterList[j] << endl;
}
Python:
import pytau
pytau.getCounterNames(counterList, numOfCounters);
See Also
TAU_GET_FUNC_NAMES, TAU_GET_FUNC_VALS
233
Name
TAU_GET_FUNC_NAMES -- Gets the function names
C/C++:
TAU_GET_FUNC_NAMES(functionList, numFuncs);
char **functionList;
int numFuncs;
Description
This macro fills the funcList argument with the list of timer and routine names. It also records the number of routines active in the numFuncs argument.
Example
C/C++ :
const char ** functionList;
int numOfFunctions;
TAU_GET_FUNC_NAMES(functionList, numOfFunctions);
for(int i=0;i<numOfFunctions;i++){
cout << "This function names so far are: " << functionList[i] << endl;
}
Python:
import pytau
pytau.getFuncNames(functionList, numOfFunctions)
See Also
TAU_GET_COUNTER_NAMES,
TAU_DUMP_FUNC_VALS
TAU_GET_FUNC_VALS,
234
TAU_DUMP_FUNC_NAMES,
Name
TAU_GET_FUNC_VALS -- Gets detailed performance data for given functions
C/C++:
TAU_GET_FUNC_VALS(inFuncs, numOfFuncs, counterExclusiveValues, counterInclusiveValues, numOfCalls, numOfSubRoutines, counterNames, numOfCounters, tid);
const char **inFuncs;
int numOfFuncs;
double ***counterExclusiveValues;
double ***counterInclusiveValues;
int **numOfCalls;
int **numOfSubRoutines;
const char ***counterNames;
int *numOfCounters;
int tid;
Description
It gets detailed performance data for the list of routines. The user specifies inFuncs and the number of
routines; TAU then returns the other arguments with the performance data. counterExclusiveValues and
counterInclusiveValues are two dimensional arrays: the first dimension is the routine id and the second
is counter id. The value is indexed by these two dimensions. numCalls and numSubrs (or child routines)
are one dimensional arrays.
Example
C/C++ :
const char **inFuncs;
/* The first dimension is functions, and the
second dimension is counters */
double **counterExclusiveValues;
double **counterInclusiveValues;
int *numOfCalls;
int *numOfSubRoutines;
const char **counterNames;
int numOfCouns;
TAU_GET_FUNC_NAMES(functionList, numOfFunctions);
/* We are only interested in the first two routines
that are executing in this context. So, we allocate
space for two routine names and get the performance
data for these two routines at runtime. */
if (numOfFunctions >=2 ) {
inFuncs = (const char **) malloc(sizeof(const char *) * 2);
inFuncs[0] = functionList[0];
inFuncs[1] = functionList[1];
//Just to show consistency.
TAU_DB_DUMP();
TAU_GET_FUNC_VALS(inFuncs, 2,
counterExclusiveValues,
235
TAU_GET_FUNC_VALS
counterInclusiveValues,
numOfCalls,
numOfSubRoutines,
counterNames,
numOfCouns);
TAU_DUMP_FUNC_VALS_INCR(inFuncs, 2);
cout << "@@@@@@@@@@@@@@@" << endl;
cout << "The number of counters is: " << numOfCouns << endl;
cout << "The first counter is: " << counterNames[0] << endl;
cout << "The Exclusive value of: " << inFuncs[0]
<< " is: " << counterExclusiveValues[0][0] << endl;
cout << "The numOfSubRoutines of: " << inFuncs[0]
<< " is: " << numOfSubRoutines[0]
<< endl;
cout << "The Inclusive value of: " << inFuncs[1]
<< " is: " << counterInclusiveValues[1][0]
<< endl;
cout << "The numOfCalls of: " << inFuncs[1]
<< " is: " << numOfCalls[1]
<< endl;
cout << "@@@@@@@@@@@@@@@" << endl;
}
TAU_DB_DUMP_INCR();
Python:
import pytau
pytau.dumpFuncVals("foo", "bar", "bar2")
See Also
TAU_GET_COUNTER_NAMES,
TAU_DUMP_FUNC_VALS
TAU_GET_FUNC_NAMES,
236
TAU_DUMP_FUNC_NAMES,
Name
TAU_ENABLE_TRACKING_MEMORY -- Enables memory tracking
C/C++:
TAU_ENABLE_TRACKING_MEMORY();
Fortran:
TAU_ENABLE_TRACKING_MEMORY();
Description
Enables tracking of the heap memory utilization in the program. TAU takes a sample of the heap
memory utilized (as reported by the mallinfo system call) and associates it with a single global user
defined event. An interrupt is generated every 10 seconds and the value of the heap memory used is recorded in the user defined event. The inter-interrupt interval (default of 10 seconds) may be set by the
user using the call TAU_SET_INTERRUPT_INTERVAL.
Example
C/C++ :
TAU_ENABLE_TRACKING_MEMORY();
Fortran :
call TAU_ENABLE_TRACKING_MEMORY()
Python:
import pytau
pytau.enableTrackingMemory()
See Also
TAU_DISABLE_TRACKING_MEMORY,
TAU_SET_INTERRUPT_INTERVAL,
TAU_TRACK_MEMORY, TAU_TRACK_MEMORY_HERE
237
Name
TAU_DISABLE_TRACKING_MEMORY -- Disables memory tracking
C/C++:
TAU_DISABLE_TRACKING_MEMORY();
Fortran:
TAU_DISABLE_TRACKING_MEMORY();
Description
Disables tracking of heap memory utilization. This call may be used in sections of code where TAU
should not interrupt the execution to periodically track the heap memory utilization.
Example
C/C++ :
TAU_DISABLE_TRACKING_MEMORY();
Fortran :
call TAU_DISABLE_TRACKING_MEMORY()
Python:
import pytau
pytau.disableTrackingMemory()
See Also
TAU_ENABLE_TRACKING_MEMORY,
TAU_SET_INTERRUPT_INTERVAL,
TAU_TRACK_MEMORY, TAU_TRACK_MEMORY_HERE
238
Name
TAU_TRACK_POWER -- Initializes POWER tracking system
C/C++:
TAU_TRACK_POWER();
Fortran:
TAU_TRACK_POWER();
Description
For power profiling, there are two modes of operation: 1) the user explicitly inserts
TAU_TRACK_POWER_HERE() calls in the source code and the power event is triggered at those locations, and 2) the user enables tracking POWER by calling TAU_TRACK_POWER() and an interrupt is
generated every 10 seconds and the POWER event is triggered with the current value. Also, this interrupt interval can be changed by calling TAU_SET_INTERRUPT_INTERVAL(value). The tracking of
power events in both cases can be explictly enabled or disabled by calling the macros
TAU_ENABLE_TRACKING_POWER() or TAU_DISABLE_TRACKING_() respectively.
Example
C/C++ :
TAU_TRACK_POWER();
Fortran :
call TAU_TRACK_POWER()
Python:
import pytau
pytau.trackPower()
See Also
TAU_ENABLE_TRACKING_POWER,
TAU_DISABLE_TRACKING_POWER,
TAU_SET_INTERRUPT_INTERVAL, TAU_TRACK_POWER_HERE, TAU_TRACK_POWER
239
Name
TAU_TRACK_POWER_HERE -- Triggers power tracking at a given execution point
C/C++:
TAU_TRACK_POWER_HERE();
Fortran:
TAU_TRACK_POWER_HERE();
Description
Triggers power tracking at a given execution point
Example
C/C++ :
int main(int argc, char **argv) {
TAU_PROFILE("main()", " ", TAU_DEFAULT);
TAU_PROFILE_SET_NODE(0);
TAU_TRACK_POWER_HERE();
int *x = new int[5*1024*1024];
TAU_TRACK_POWER_HERE();
return 0;
}
Fortran :
INTEGER, ALLOCATABLE :: STORAGEARY(:)
allocate(STORAGEARY(1:999), STAT=IERR)
! if we wish to record a sample of the heap POWER
! utilization at this point, invoke the following call:
call TAU_TRACK_POWER_HERE()
Python:
import pytau
pytau.trackPowerHere()
See Also
240
TAU_TRACK_POWER_HERE
TAU_TRACK_POWER
241
Name
TAU_ENABLE_TRACKING_POWER -- Enables power headroom tracking
C/C++:
TAU_ENABLE_TRACKING_POWER();
Fortran:
TAU_ENABLE_TRACKING_POWER();
Description
enables
TAU_ENABLE_TRACKING_POWER()
TAU_DISABLE_TRACKING_POWER().
power
tracking
after
a
Example
C/C++ :
TAU_DISABLE_TRACKING_POWER();
/* do some work */
...
/* re-enable tracking POWER */
TAU_ENABLE_TRACKING_POWER();
Fortran :
call TAU_ENABLE_TRACKING_POWER();
Fortran :
import pytau
pytau.enableTrackingPowerHeadroom()
See Also
TAU_TRACK_POWER, TAU_DISABLE_TRACKING_POWER, TAU_TRACK_POWER_HERE,
TAU_SET_INTERRUPT_INTERVAL
242
Name
TAU_DISABLE_TRACKING_POWER -- Disables power headroom tracking
C/C++:
TAU_DISABLE_TRACKING_POWER();
Fortran:
TAU_DISABLE_TRACKING_POWER();
Description
TAU_DISABLE_TRACKING_POWER() disables power tracking.
Example
C/C++ :
TAU_DISABLE_TRACKING_POWER();
Fortran :
call TAU_DISABLE_TRACKING_POWER()
Python:
import pytau
pytau.disableTrackingPowerHeadroom()
See Also
TAU_TRACK_POWER, TAU_ENABLE_TRACKING_POWER,
TAU_SET_INTERRUPT_INTERVAL
243
TAU_TRACK_POWER_HERE,
Name
TAU_TRACK_MEMORY -- Initializes memory tracking system
C/C++:
TAU_TRACK_MEMORY();
Fortran:
TAU_TRACK_MEMORY();
Description
For memory profiling, there are two modes of operation: 1) the user explicitly inserts
TAU_TRACK_MEMORY_HERE() calls in the source code and the memory event is triggered at those
locations, and 2) the user enables tracking memory by calling TAU_TRACK_MEMORY() and an interrupt is generated every 10 seconds and the memory event is triggered with the current value. Also, this
interrupt interval can be changed by calling TAU_SET_INTERRUPT_INTERVAL(value). The tracking
of memory events in both cases can be explictly enabled or disabled by calling the macros
TAU_ENABLE_TRACKING_MEMORY() or TAU_DISABLE_TRACKING_MEMORY() respectively.
Example
C/C++ :
TAU_TRACK_MEMORY();
Fortran :
call TAU_TRACK_MEMORY()
Python:
import pytau
pytau.trackMemory()
See Also
TAU_ENABLE_TRACKING_MEMORY,
TAU_SET_INTERRUPT_INTERVAL,
TAU_TRACK_MEMORY_HEADROOM
TAU_DISABLE_TRACKING_MEMORY,
TAU_TRACK_MEMORY_HERE,
244
Name
TAU_TRACK_MEMORY_HERE -- Triggers memory tracking at a given execution point
C/C++:
TAU_TRACK_MEMORY_HERE();
Fortran:
TAU_TRACK_MEMORY_HERE();
Description
Triggers memory tracking at a given execution point
Example
C/C++ :
int main(int argc, char **argv) {
TAU_PROFILE("main()", " ", TAU_DEFAULT);
TAU_PROFILE_SET_NODE(0);
TAU_TRACK_MEMORY_HERE();
int *x = new int[5*1024*1024];
TAU_TRACK_MEMORY_HERE();
return 0;
}
Fortran :
INTEGER, ALLOCATABLE :: STORAGEARY(:)
allocate(STORAGEARY(1:999), STAT=IERR)
! if we wish to record a sample of the heap memory
! utilization at this point, invoke the following call:
call TAU_TRACK_MEMORY_HERE()
Python:
import pytau
pytau.trackMemoryHere()
See Also
245
TAU_TRACK_MEMORY_HERE
TAU_TRACK_MEMORY
246
Name
TAU_TRACK_MEMORY_FOOTPRINT -- Initializes memory footprint tracking system
C/C++:
TAU_TRACK_MEMORY_FOOTPRINT();
Fortran:
TAU_TRACK_MEMORY_FOOTPRINT();
Description
Similar to TAU_TRACK_MEMORY but uses the Virtual Memory Resident Set Size (VmRSS) and
High Water Mark (VmHWM) to produce an interval event and an atomic event respectively.
Example
C/C++ :
TAU_TRACK_MEMORY_FOOTPRINT();
Fortran :
call TAU_TRACK_MEMORY_FOOTPRINT()
See Also
TAU_ENABLE_TRACKING_MEMORY,
TAU_SET_INTERRUPT_INTERVAL,
TAU_TRACK_MEMORY,
TAU_TRACK_MEMORY_HEADROOM
TAU_DISABLE_TRACKING_MEMORY,
TAU_TRACK_MEMORY_HERE,
TAU_TRACK_MEMORY_FOOTPRINT_HERE,
247
Name
TAU_TRACK_MEMORY_FOOTPRINT_HERE -- Triggers memory footprint tracking at a given execution point
C/C++:
TAU_TRACK_MEMORY_FOOTPRINT_HERE();
Fortran:
TAU_TRACK_MEMORY_FOOTPRINT_HERE();
Description
Similar to TAU_TRACK_MEMORY_HERE but uses the Virtual Memory Resident Set Size (VmRSS)
and High Water Mark (VmHWM) to produce an interval event and an atomic event respectively.
Example
C/C++ :
int main(int argc, char **argv) {
TAU_PROFILE("main()", " ", TAU_DEFAULT);
TAU_PROFILE_SET_NODE(0);
TAU_TRACK_MEMORY_FOOTPRINT_HERE();
int *x = new int[5*1024*1024];
TAU_TRACK_MEMORY_FOOTPRINT_HERE();
return 0;
}
Fortran :
INTEGER, ALLOCATABLE :: STORAGEARY(:)
allocate(STORAGEARY(1:999), STAT=IERR)
call TAU_TRACK_MEMORY_FOOTPRINT_HERE()
See Also
TAU_TRACK_MEMORY_FOOTPRINT
248
Name
TAU_ENABLE_TRACKING_MEMORY_HEADROOM -- Enables memory headroom tracking
C/C++:
TAU_ENABLE_TRACKING_MEMORY_HEADROOM();
Fortran:
TAU_ENABLE_TRACKING_MEMORY_HEADROOM();
Description
TAU_ENABLE_TRACKING_MEMORY_HEADROOM() enables memory headroom tracking after a
TAU_DISABLE_TRACKING_MEMORY_HEADROOM().
Example
C/C++ :
TAU_DISABLE_TRACKING_MEMORY_HEADROOM();
/* do some work */
...
/* re-enable tracking memory headroom */
TAU_ENABLE_TRACKING_MEMORY_HEADROOM();
Fortran :
call TAU_ENABLE_TRACKING_MEMORY_HEADROOM();
Fortran :
import pytau
pytau.enableTrackingMemoryHeadroom()
See Also
TAU_TRACK_MEMORY_HEADROOM, TAU_DISABLE_TRACKING_MEMORY_HEADROOM,
TAU_TRACK_MEMORY_HEADROOM_HERE, TAU_SET_INTERRUPT_INTERVAL
249
Name
TAU_DISABLE_TRACKING_MEMORY_HEADROOM -- Disables memory headroom tracking
C/C++:
TAU_DISABLE_TRACKING_MEMORY_HEADROOM();
Fortran:
TAU_DISABLE_TRACKING_MEMORY_HEADROOM();
Description
TAU_DISABLE_TRACKING_MEMORY_HEADROOM() disables memory headroom tracking.
Example
C/C++ :
TAU_DISABLE_TRACKING_MEMORY_HEADROOM();
Fortran :
call TAU_DISABLE_TRACKING_MEMORY_HEADROOM()
Python:
import pytau
pytau.disableTrackingMemoryHeadroom()
See Also
TAU_TRACK_MEMORY_HEADROOM, TAU_ENABLE_TRACKING_MEMORY_HEADROOM,
TAU_TRACK_MEMORY_HEADROOM_HERE, TAU_SET_INTERRUPT_INTERVAL
250
Name
TAU_TRACK_MEMORY_HEADROOM -- Track the headroom (amount of memory for a process to
grow) by periodically interrupting the program
C/C++:
TAU_TRACK_MEMORY_HEADROOM();
Fortran:
TAU_TRACK_MEMORY_HEADROOM();
Description
Tracks the amount of memory available for the process before it runs out of free memory on the heap.
This call sets up a signal handler that is invoked every 10 seconds by an interrupt (this interval may be
altered by using the TAU_SET_INTERRUPT_INTERVAL call). Inside the interrupt handler, TAU evaluates how much memory it can allocate and associates it with the callstack using the TAU context
events (See TAU_REGISTER_CONTEXT_EVENT). The user can vary the size of the callstack by setting the environment variable TAU_CALLPATH_DEPTH (default is 2). This call is useful on machines
like IBM BG/L where no virtual memory (or paging using the swap space) is present. The amount of
heap memory available to the program is limited by the amount of available physical memory. TAU executes a series of malloc calls with a granularity of 1MB and determines the amount of memory available for the program to grow.
Example
C/C++ :
TAU_TRACK_MEMORY_HEADROOM();
Fortran :
call TAU_TRACK_MEMORY_HEADROOM()
Python:
import pytau
pytau.trackMemoryHeadroom()
See Also
TAU_TRACK_MEMORY,
TAU_ENABLE_TRACKING_MEMORY_HEADROOM,
TAU_DISABLE_TRACKING_MEMORY_HEADROOM,
251
TAU_SET_INTERRUPT_INTERVAL,
TAU_TRACK_MEMORY_HEADROOM
TAU_TRACK_MEMORY_HEADROOM_HERE
252
Name
TAU_TRACK_MEMORY_HEADROOM_HERE -- Takes a sample of the amount of memory available
at a given point.
C/C++:
TAU_TRACK_MEMORY_HEADROOM_HERE();
Fortran:
TAU_TRACK_MEMORY_HEADROOM_HERE();
Description
Instead of relying on a periodic interrupt to track the amount of memory available to grow, this call may
be used to take a sample at a given location in the source code. Context events are used to track the
amount of memory headroom.
Example
C/C++ :
ary = new double [1024*1024*50];
TAU_TRACK_MEMORY_HEADROOM_HERE();
Fortran :
INTEGER, ALLOCATABLE :: STORAGEARY(:)
allocate(STORAGEARY(1:999), STAT=IERR)
TAU_TRACK_MEMORY_HEADROOM_HERE();
Python:
import pytau
pytau.trackMemoryHeadroomHere()
See Also
TAU_TRACK_MEMORY_HEADROOM
253
Name
TAU_SET_INTERRUPT_INTERVAL -- Change the inter-interrupt interval for tracking memory and
headroom
C/C++:
TAU_SET_INTERRUPT_INTERVAL(value);
int value;
Fortran:
TAU_SET_INTERRUPT_INTERVAL(value);
integer value;
Description
Set the interrupt interval for tracking memory and headroom (See TAU_TRACK_MEMORY and
TAU_TRACK_MEMORY_HEADROOM). By default an inter-interrupt interval of 10 seconds is used
in TAU. This call allows the user to set it to a different value specified by the argument value.
Example
C/C++ :
TAU_SET_INTERRUPT_INTERVAL(2)
/* invokes the interrupt handler for memory every 2s */
Fortran :
call TAU_SET_INTERRUPT_INTERVAL(2)
Python:
import pytau
pytau.setInterruptTnterval(2)
See Also
TAU_TRACK_MEMORY, TAU_TRACK_MEMORY_HEADROOM
254
Name
CT -- Returns the type information for a variable
C/C++:
CT(variable);
<type> variable;
Description
The CT macro returns the runtime type information string of a variable. This is useful in constructing the
type parameter of the TAU_PROFILE macro. For templates, the type information can be constructed using the type of the return and the type of each of the arguments (parameters) of the template. The example in the following macro will clarify this.
Example
C/C++ :
TAU_PROFILE("foo::memberfunc()", CT(*this), TAU_DEFAULT);
See Also
TAU_PROFILE, TAU_PROFILE_TIMER, TAU_TYPE_STRING
255
Name
TAU_TYPE_STRING -- Creates a type string
C++:
TAU_TYPE_STRING(variable, type_string);
string &variable;
string &type_string;
Description
This macro assigns the string constructed in type_string to the variable. The + operator and the CT
macro can be used to construct the type string of an object. This is useful in identifying templates
uniquely, as shown below.
Example
C++ :
template<class PLayout>
ostream& operator<<(ostream& out, const ParticleBase<PLayout>& P) {
TAU_TYPE_STRING(taustr, "ostream (ostream, " + CT(P) + " )");
TAU_PROFILE("operator<<()"taustr, TAU_PARTICLE | TAU_IO);
...
}
When PLayout is instantiated with " UniformCartesian<3U, double> ",this generates the
unique template name:
operator<<() ostream const
ParticleBase<UniformCartesian<3U, double> > )
The following example illustrates the usage of the CT macro to extract the name of the class associated
with the given object using CT(*this);
template<class PLayout>
unsigned ParticleBase<PLayout7>::GetMessage(Message& msg, int node) {
TAU_TYPE_STRING(taustr, CT(*this) + "unsigned (Message, int)");
TAU_PROFILE("ParticleBase::GetMessage()", taustr, TAU_PARTICLE);
...
}
When PLayout is instantiated with " UniformCartesian<3U, double> ",this generates the
unique template name:
ParticleBase::GetMessage() ParticleBase<UniformCartesian<3U,
double> > unsigned (Message, int)
256
TAU_TYPE_STRING
See Also
CT, TAU_PROFILE, TAU_PROFILE_TIMER
257
Name
TAU_DB_DUMP -- Dumps the profile database to disk
C/C++:
TAU_DB_DUMP();
Fortran:
TAU_DB_DUMP();
Description
Dumps the profile database to disk. The format of the files is the same as regular profiles, they are
simply prefixed with "dump" instead of "profile".
Example
C/C++ :
TAU_DB_DUMP();
Fortran :
call TAU_DB_DUMP()
See Also
TAU_DB_DUMP_PREFIX,
TAU_DUMP_FUNC_VALS,
TAU_PROFILE_EXIT
TAU_DB_DUMP_INCR,
TAU_DUMP_FUNC_NAMES,
TAU_DUMP_FUNC_VALS_INCR,
TAU_DB_PURGE,
258
Name
TAU_DB_MERGED_DUMP -- Dumps the profile database to disk
C/C++:
TAU_DB_MERGED_DUMP();
Fortran:
TAU_DB_MERGED_DUMP();
Description
Dumps the profile database to disk. The format of the files is the same as merged profiles: tauprofile.xml
Example
C/C++ :
TAU_DB_MERGED_DUMP();
Fortran :
call TAU_DB_MERGED_DUMP()
See Also
TAU_DB_DUMP_PREFIX,
TAU_DUMP_FUNC_VALS,
TAU_PROFILE_EXIT
TAU_DB_DUMP_INCR,
TAU_DUMP_FUNC_NAMES,
TAU_DUMP_FUNC_VALS_INCR,
TAU_DB_PURGE,
259
Name
TAU_DB_DUMP_INCR -- Dumps profile database into timestamped profiles on disk
C/C++:
TAU_DB_DUMP_INCR();
Description
This is similar to the TAU_DB_DUMP macro but it produces dump files that have a timestamp in their
names. This allows the user to record timestamped incremental dumps as the application executes.
Example
C/C++ :
TAU_DB_DUMP_INCR();
Python:
import pytau
pytau.dbDumpIncr("prefix")
See Also
TAU_DB_DUMP,
TAU_DB_DUMP_PREFIX,
TAU_DUMP_FUNC_NAMES,
TAU_DUMP_FUNC_VALS,
TAU_DUMP_FUNC_VALS_INCR,
TAU_DB_PURGE,
TAU_PROFILE_EXIT
260
Name
TAU_DB_DUMP_PREFIX -- Dumps the profile database into profile files with a given prefix
C/C++:
TAU_DB_DUMP_PREFIX(prefix);
char *prefix;
Fortran:
TAU_DB_DUMP_PREFIX(prefix);
character prefix(size);
Description
The TAU_DB_DUMP_PREFIX macro dumps all profile data to disk and records a checkpoint or a snapshot of the profile statistics at that instant. The dump files are named
<prefix>.<node>.<context>.<thread>. If prefix is "profile", the files are named profile.0.0.0, etc. and
may be read by paraprof/pprof tools as the application executes.
Example
C/C++ :
TAU_DB_DUMP_PREFIX("prefix");
Fortran :
call TAU_DB_DUMP_PREFIX("prefix")
Python :
import pytau
pytau.dbDump("prefix")
See Also
TAU_DB_DUMP
261
Name
TAU_DB_DUMP_PREFIX_TASK -- Dumps the profile database into profile files with a given task
C/C++:
TAU_DB_DUMP_PREFIX_TASK(PREFIX_TASK);
char *PREFIX_TASK;
Fortran:
TAU_DB_DUMP_PREFIX_TASK(prefix, task);
character prefix(size);
integer task(size);
Description
The TAU_DB_DUMP_PREFIX_TASK macro dumps all profile data to disk and records a checkpoint or
a snapshot of the profile statistics on a particular task at that instant. The dump files are named
<prefix>.<node>.<context>.<thread>. If prefix is "profile", the files are named profile.0.0.0, etc. and
may be read by paraprof/pprof tools as the application executes.
Example
C/C++ :
TAU_DB_DUMP_PREFIX_TASK("PREFIX", taskid);
Fortran :
call TAU_DB_DUMP_PREFIX_TASK("PREFIX", taskid)
Python :
import pytau
pytau.dbDump("PREFIX", taskid)
See Also
TAU_DB_DUMP_PREFIX
262
Name
TAU_DB_PURGE -- Purges the performance data.
C/C++:
TAU_DB_PURGE();
Description
Purges the performance data collected so far.
Example
C/C++ :
TAU_DB_PURGE();
See Also
TAU_DB_DUMP
263
Name
TAU_DUMP_FUNC_NAMES -- Dumps function names to disk
C/C++:
TAU_DUMP_FUNC_NAMES();
Description
This
macro
writes
the
names
dump_functionnames_<node>.<context>.
of
active
functions
to
a
Example
C/C++ :
TAU_DUMP_FUNC_NAMES();
Python:
import pytau
pytau.dumpFuncNames()
See Also
TAU_DB_DUMP, TAU_DUMP_FUNC_VALS, TAU_DUMP_FUNC_VALS_INCR
264
file
named
Name
TAU_DUMP_FUNC_VALS -- Dumps performance data for given functions to disk.
C/C++:
TAU_DUMP_FUNC_VALS(inFuncs, numFuncs);
char **inFuncs;
int numFuncs;
Description
TAU_DUMP_FUNC_VALS writes the data associated with the routines listed in inFuncs to disk. The
number of routines is specified by the user in numFuncs.
Example
C/C++ :
See Also
TAU_DB_DUMP, TAU_DUMP_FUNC_NAMES, TAU_DUMP_FUNC_VALS_INCR
265
Name
TAU_DUMP_FUNC_VALS_INCR -- Dumps function values with a timestamp
C/C++:
TAU_DUMP_FUNC_VALS_INCR(inFuncs, numFuncs);
char **inFuncs;
int numFuncs;
Description
Similar to TAU_DUMP_FUNC_VALS. This macro creates an incremental selective dump and dumps the
results with a date stamp to the filename such as sel_dump__Thu-Mar-28-16:30:48-2002__.0.0.0. In this
manner the previous TAU_DUMP_FUNC_VALS_INCR(...) are not overwritten (unless they occur
within a second).
Example
C/C++ :
const char **inFuncs;
/* The first dimension is functions, and the second dimension is counters */
double **counterExclusiveValues;
double **counterInclusiveValues;
int *numOfCalls;
int *numOfSubRoutines;
const char **counterNames;
int numOfCouns;
TAU_GET_FUNC_VALS(inFuncs, 2,
counterExclusiveValues,
counterInclusiveValues,
numOfCalls,
numOfSubRoutines,
counterNames,
numOfCouns);
TAU_DUMP_FUNC_VALS(inFuncs, 2);
Python:
import pytau
pytau.dumpFuncValsIncr("foo", "bar", "bar2")
See Also
TAU_DB_DUMP, TAU_DUMP_FUNC_NAMES, TAU_DUMP_FUNC_VALS
266
Name
TAU_PROFILE_STMT -- Executes a statement only when TAU is used.
C/C++:
TAU_PROFILE_STMT(statement);
statement statement;
Description
TAU_PROFILE_STMT executes a statement, or declares a variable that is used only during profiling or
for execution of a statement that takes place only when the instrumentation is active. When instrumentation is inactive (i.e., when profiling and tracing are turned off as described in Chapter 2), all macros are
defined as null.
Example
C/C++ :
TAU_PROFILE_STMT(T obj;); // T is a template parameter)
TAU_TYPE_STRING(str, "void () " + CT(obj) );
267
Name
TAU_PROFILE_CALLSTACK -- Generates a callstack trace at a given location.
C/C++:
TAU_PROFILE_CALLSTACK();
Description
When TAU is configured with -PROFILECALLSTACK configuration option, and this call is invoked, a
callpath trace is generated. A GUI for viewing this trace is included in TAU's utils/csUI directory. This
option is deprecated.
Example
C/C++ :
TAU_PROFILE_CALLSTACK();
268
Name
TAU_TRACE_RECVMSG -- Traces a receive operation
C/C++:
TAU_TRACE_RECVMSG(tag, source, length);
int tag;
int source;
int length;
Fortran:
TAU_TRACE_RECVMSG(tag, source, length);
integer tag;
integer source;
integer length;
Description
TAU_TRACE_RECVMSG traces a receive operation where tag represents the type of the message received from the source process.
NOTE: When TAU is configured to use MPI (-mpiinc=<dir> -mpilib=<dir>), the
TAU_TRACE_RECVMSG and TAU_TRACE_SENDMSG macros are not required. The wrapper interposition library in
$(TAU_MPI_LIBS)
uses these macros internally for logging messages.
Example
C/C++ :
if (pid == 0) {
TAU_TRACE_SENDMSG(currCol, sender, ncols * sizeof(T));
MPI_Send(vctr2, ncols * sizeof(T), MPI_BYTE, sender,
currCol, MPI_COMM_WORLD);
} else {
MPI_Recv(&ans, sizeof(T), MPI_BYTE, MPI_ANY_SOURCE,
MPI_ANY_TAG,MPI_COMM_WORLD, &stat);
MPI_Get_count(&stat, MPI_BYTE, &recvcount);
TAU_TRACE_RECVMSG(stat.MPI_TAG, stat.MPI_SOURCE, recvcount);
}
Fortran :
call TAU_TRACE_RECVMSG(tag, source, length)
call TAU_TRACE_SENDMSG(tag, destination, length)
269
TAU_TRACE_RECVMSG
See Also
TAU_TRACE_SENDMSG
270
Name
TAU_TRACE_SENDMSG -- Traces a receive operation
C/C++:
TAU_TRACE_SENDMSG(tag, source, length);
int tag;
int source;
int length;
Fortran:
TAU_TRACE_SENDMSG(tag, source, length);
integer tag;
integer source;
integer length;
Description
TAU_TRACE_SENDMSG traces an inter-process message communication when a tagged message is sent
to a destination process.
NOTE: When TAU is configured to use MPI (-mpiinc=<dir> -mpilib=<dir>), the
TAU_TRACE_SENDMSG and TAU_TRACE_SENDMSG macros are not required. The wrapper interposition library in
$(TAU_MPI_LIBS)
uses these macros internally for logging messages.
Example
C/C++ :
if (pid == 0) {
TAU_TRACE_SENDMSG(currCol, sender, ncols * sizeof(T));
MPI_Send(vctr2, ncols * sizeof(T), MPI_BYTE, sender,
currCol, MPI_COMM_WORLD);
} else {
MPI_Recv(&ans, sizeof(T), MPI_BYTE, MPI_ANY_SOURCE,
MPI_ANY_TAG,MPI_COMM_WORLD, &stat);
MPI_Get_count(&stat, MPI_BYTE, &recvcount);
TAU_TRACE_RECVMSG(stat.MPI_TAG, stat.MPI_SOURCE, recvcount);
}
Fortran :
call TAU_TRACE_RECVMSG(tag, source, length)
call TAU_TRACE_SENDMSG(tag, destination, length)
271
TAU_TRACE_SENDMSG
See Also
TAU_TRACE_RECVMSG
272
Name
TAU_PROFILE_PARAM1L -- Creates a snapshot of the current apllication profile
C/C++:
TAU_PROFILE_PARAM1L(number, name);
long number;
char* name;
Fortran:
TAU_PROFILE_PARAM1L(name, number, length);
char* name;
integer number;
integer length;
Description
Track the a given numerial parameter to a function and records each value as a seperate event. number
is the parameter to be tracked. name is the name of this event.
Example
C/C++:
int f1(int x)
{
TAU_PROFILE("f1()", "", TAU_USER);
TAU_PROFILE_PARAM1L((long) x, "x");
...
Fortran:
subroutine ITERATION(val)
integer val
integer profiler(2) / 0, 0 /
save profiler
call TAU_PROFILE_TIMER(profiler, 'INTERATION')
call TAU_PROFILE_START(profiler)
call TAU_PROFILE_PARAM1L('value', val, 4)
....
call TAU_PROFILE_STOP(profiler)
return
end
See Also
TAU_PROFILE_TIMER_DYNAMIC
273
Name
TAU_PROFILE_SNAPSHOT -- Creates a snapshot of the current apllication profile
C/C++:
TAU_PROFILE_SNAPSHOT(name);
char* name;
Fortran:
TAU_PROFILE_SNAPSHOT(name, length);
char* name;
integer length;
Description
TAU_PROFILE_SNAPSHOT writes a snapshot profile representing the program's execution up to this
point. These file are written the system as snapshot.[node].[context].[thread] format. They can be
merged by appending one to another. Uploading a snapshot to a PerfDMF database or packing them into
a PPK file will condense them to a single profile (the last one).
Examples
C/C++:
TAU_PROFILE_SNAPSHOT(name);
Fortran:
TAU_PROFILE_SNAPSHOT(name, length);
Python:
import pytau;
pytau.snapshot("name")
See Also
TAU_PROFILE_SNAPSHOT_1L
274
Name
TAU_PROFILE_SNAPSHOT_1L -- Creates a snapshot of the current apllication profile
C/C++:
TAU_PROFILE_SNAPSHOT_1L(name, number);
char* name;
int number;
Fortran:
TAU_PROFILE_SNAPSHOT_1L(name, number, length);
char* name;
integer number;
integer length;
Description
Calls TAU_PROFILE_SNAPSHOT giving it the as a name the name with a number appended.
See Also
TAU_PROFILE_SNAPSHOT
275
Name
TAU_PROFILER_CREATE -- Creates a profiler object referenced as a standard pointer
C/C++:
TAU_PROFILER_CREATE(timer, function_name, type, group);
Timer timer;
char* or string& function_name;
char* or string& type;
taugroup_t group;
description
TAU_PROFILER_CREATE creates a timer the that can be controlled by the Timer pointer object.
The TAU_PROFILER_* API is intended for applications to easily layer their legacy timing measurements APIs on top of TAU, Unlike other TAU API calls (TAU_PROFILE_TIMER) that are statically
expanded in the source code, these calls allocate TAU entities on the heap. So the pointer to the TAU
timer may be used as a handle to access the TAU performance data.
example
>C/C++:
void *ptr;
TAU_PROFILER_CREATE(ptr, "foo","", TAU_USER);
TAU_PROFILER_START(ptr);
foo(2);
TAU_PROFILER_STOP(ptr);
>Python:
import pytau
ptr = pytau.profileTimer("foo")
pytau.start(ptr)
foo(2)
pytau.stop(ptr)
See Also
TAU_PROFILER_START
TAU_PROFILER_STOP
TAU_PROFILER_GET_CALLS
TAU_PROFILER_GET_CHILD_CALLS
TAU_PROFILER_GET_INCLUSIVE_VALUES
TAU_PROFILER_GET_EXCLUSIVE_VALUES TAU_PROFILER_GET_COUNTER_INFO
276
Name
TAU_CREATE_TASK -- Creates a task id.
C/C++:
TAU_CREATE_TASK(taskid);
Integer taskid;
description
TAU_CREATE_TASK creates a task with id 'taskid' this task is an independent event stream for which
Profiler objects can be started and stop on. TAU will increment the taskids as needed an write out profiles and traces from the task as if they were thread.
example
>C/C++:
void *ptr;
int taskid;
TAU_PROFILER_CREATE(ptr, "foo","", TAU_USER);
TAU_CREATE_TASK(taskid);
TAU_PROFILER_START_TASK(ptr,taskid);
foo(2);
TAU_PROFILER_STOP_TASK(ptr,taskid);
See Also
TAU_PROFILER_START_TASK
TAU_PROFILER_STOP_TASK
TAU_PROFILER_GET_CALLS_TASK
TAU_PROFILER_GET_CHILD_CALLS_TASK
TAU_PROFILER_GET_INCLUSIVE_VALUES_TASK
TAU_PROFILER_GET_EXCLUSIVE_VALUES_TASK
TAU_PROFILER_GET_COUNTER_INFO_TASK
277
Name
TAU_PROFILER_START -- starts a profiler object created by TAU_PROFILER_CREATE
C/C++:
TAU_PROFILER_START(timer);
Timer timer;
description
TAU_PROFILER_STARTstarts
TAU_PROFILER_CREATE.
a
profiler
timer
by
passing
the
pointer
created
by
the
example
>C/C++:
void *ptr;
TAU_PROFILER_CREATE(ptr, "foo","", TAU_USER);
TAU_PROFILER_START(ptr);
foo(2);
TAU_PROFILER_STOP(ptr);
>Python:
import pytau
ptr = pytau.profileTimer("foo")
pytau.start(ptr)
foo(2)
pytau.stop(ptr)
See Also
TAU_PROFILER_CREATE
TAU_PROFILER_STOP
TAU_PROFILER_GET_CALLS
TAU_PROFILER_GET_CHILD_CALLS
TAU_PROFILER_GET_INCLUSIVE_VALUES
TAU_PROFILER_GET_EXCLUSIVE_VALUES TAU_PROFILER_GET_COUNTER_INFO
278
Name
TAU_PROFILER_START_TASK -- Starts a profiler object created by TAU_PROFILER_CREATE on
a given task.
C/C++:
TAU_PROFILER_START_TASK(timer);
Timer timer;
description
TAU_PROFILER_START_TASKstarts a profiler timer on a task by passing the pointer created by the
TAU_PROFILER_CREATE and a task created by TAU_CREATE_TASK on a given task.
example
>C/C++:
void *ptr;
int taskid;
TAU_PROFILER_CREATE(ptr, "foo","", TAU_USER);
TAU_CREATE_TASK(taskid);
TAU_PROFILER_START_TASK(ptr,taskid);
foo(2);
TAU_PROFILER_STOP_TASK(ptr,taskid);
See Also
TAU_PROFILER_CREATE
TAU_PROFILER_STOP
TAU_PROFILER_GET_CALLS
TAU_PROFILER_GET_CHILD_CALLS
TAU_PROFILER_GET_INCLUSIVE_VALUES
TAU_PROFILER_GET_EXCLUSIVE_VALUES TAU_PROFILER_GET_COUNTER_INFO
279
Name
TAU_PROFILER_STOP -- stops a profiler object created by TAU_PROFILER_CREATE
C/C++:
TAU_PROFILER_STOP(timer);
Timer timer;
description
TAU_PROFILER_STOPstops
TAU_PROFILER_CREATE.
a
profiler
timer
by
passing
the
pointer
created
by
the
example
>C/C++:
void *ptr;
TAU_PROFILER_CREATE(ptr, "foo","", TAU_USER);
TAU_PROFILER_START(ptr);
foo(2);
TAU_PROFILER_STOP(ptr);
>Python:
import pytau
ptr = pytau.profileTimer("foo")
pytau.start(ptr)
foo(2)
pytau.stop(ptr)
See Also
TAU_PROFILER_CREATE
TAU_PROFILER_START
TAU_PROFILER_GET_CALLS
TAU_PROFILER_GET_CHILD_CALLS
TAU_PROFILER_GET_INCLUSIVE_VALUES
TAU_PROFILER_GET_EXCLUSIVE_VALUES TAU_PROFILER_GET_COUNTER_INFO
280
Name
TAU_PROFILER_STOP_TASK -- Stops a profiler object on a task
C/C++:
TAU_PROFILER_STOP_TASK(timer);
Timer timer;
description
TAU_PROFILER_STOP_TASKSTOPs a profiler timer on a task by passing the pointer created by the
TAU_PROFILER_CREATE and a task created by TAU_CREATE_TASK.
example
>C/C++:
void *ptr;
int taskid;
TAU_PROFILER_CREATE(ptr, "foo","", TAU_USER);
TAU_CREATE_TASK(taskid);
TAU_PROFILER_START_TASK(ptr,taskid);
foo(2);
TAU_PROFILER_STOP_TASK(ptr,taskid);
See Also
TAU_PROFILER_CREATE
TAU_PROFILER_STOP
TAU_PROFILER_GET_CALLS
TAU_PROFILER_GET_CHILD_CALLS
TAU_PROFILER_GET_INCLUSIVE_VALUES
TAU_PROFILER_GET_EXCLUSIVE_VALUES TAU_PROFILER_GET_COUNTER_INFO
281
Name
TAU_PROFILER_GET_CALLS -- Gets
TAU_PROFILER_CREATE, is started.
the
number
of
times
this
timer,
created
by
C/C++:
TAU_PROFILER_GET_CALLS(timer, calls);
Timer timer;
long& calls;
description
TAU_PROFILER_GET_CALLS returns the number of times this timer is started (ie. The number of
times the section of code being profiled was executed).
example
>C/C++:
void *ptr;
TAU_PROFILER_CREATE(ptr, "foo","", TAU_USER);
TAU_PROFILER_START(ptr);
foo(2);
long calls;
TAU_PROFILER_GET_CALLS(ptr, &calls);
See Also
TAU_PROFILER_CREATE
TAU_PROFILER_START
TAU_PROFILER_STOP
TAU_PROFILER_GET_CHILD_CALLS
TAU_PROFILER_GET_INCLUSIVE_VALUES
TAU_PROFILER_GET_EXCLUSIVE_VALUES TAU_PROFILER_GET_COUNTER_INFO
282
Name
TAU_PROFILER_GET_CALLS_TASK -- Gets the number of times this timer, created by
TAU_PROFILER_CREATE, is started on a given task.
C/C++:
TAU_PROFILER_GET_CALLS_TASK(timer, calls, taskid);
Timer timer;
long& calls;
int taskid;
description
TAU_PROFILER_GET_CALLS_TASK returns the number of times this timer is started (ie. The number of times the section of code being profiled was executed) on a given task.
example
>C/C++:
void *ptr;
int taskid;
TAU_PROFILER_CREATE(ptr, "foo","", TAU_USER);
TAU_CREATE_TASK(taskid);
TAU_PROFILER_START_TASK(ptr, taskid);
foo(2);
long calls;
TAU_PROFILER_GET_CALLS_TASK(ptr, &calls, taskid);
See Also
TAU_CREATE_TASK
TAU_PROFILER_START_TASK
TAU_PROFILER_GET_CHILD_CALLS_TASK
TAU_PROFILER_GET_INCLUSIVE_VALUES_TASK
TAU_PROFILER_GET_EXCLUSIVE_VALUES_TASK
TAU_PROFILER_GET_COUNTER_INFO_TASK
283
TAU_PROFILER_STOP_TASK
Name
TAU_PROFILER_GET_CHILD_CALLS -- Gets the number of calls made while this timer was running
C/C++:
TAU_PROFILER_GET_CHILD_CALLS(timer, calls);
Timer timer;
long& calls;
description
TAU_PROFILER_GET_CHILD_CALLS Gets the number of timers started while timer was running.
This is non-recursive, only timers started directly count.
example
>C/C++:
void *ptr;
TAU_PROFILER_CREATE(ptr, "foo","", TAU_USER);
TAU_PROFILER_START(ptr);
foo(2);
TAU_PROFILER_STOP(ptr);
long calls;
TAU_PROFILER_GET_CHILD_CALLS(ptr, &calls);
See Also
TAU_PROFILER_CREATE
TAU_PROFILER_START
TAU_PROFILER_STOP
TAU_PROFILER_GET_CALLS
TAU_PROFILER_GET_INCLUSIVE_VALUES
TAU_PROFILER_GET_EXCLUSIVE_VALUES TAU_PROFILER_GET_COUNTER_INFO
284
Name
TAU_PROFILER_GET_CHILD_CALLS_TASK -- Gets the number of child call for this timer, created
by TAU_PROFILER_CREATE, is started on a task.
C/C++:
TAU_PROFILER_GET_CHILD_CALLS_TASK(timer, child_calls, taskid);
Timer timer;
long& child_calls;
int taskid;
description
TAU_PROFILER_GET_CHILD_CALLS_TASK returns the number of times this timer is started (ie.
The number of times the section of code being profiled was executed).
example
>C/C++:
void *ptr;
int taskid;
TAU_PROFILER_CREATE(ptr, "foo","", TAU_USER);
TAU_CREATE_TASK(taskid);
TAU_PROFILER_START_TASK(ptr, taskid);
foo(2);
long child_calls;
TAU_PROFILER_GET_CHILD_CALLS_TASK(ptr, &child_calls, taskid);
See Also
TAU_CREATE_TASK
TAU_PROFILER_START_TASK
TAU_PROFILER_STOP_TASK
TAU_PROFILER_GET_CALLS_TASK
TAU_PROFILER_GET_INCLUSIVE_VALUES_TASK
TAU_PROFILER_GET_EXCLUSIVE_VALUES_TASK
TAU_PROFILER_GET_COUNTER_INFO_TASK
285
Name
TAU_PROFILER_GET_INCLUSIVE_VALUES -- Returns the inclusive amount of a metric spend by
this timer.
C/C++:
TAU_PROFILER_GET_INCLUSIVE_VALUES(timer, incl);
Timer timer;
double& incl;
description
TAU_PROFILER_GET_INCLUSIVE_VALUES Returns the inclusive amount of a metric spend while
this timer was running (and any subsequent timers called from this timer.)
example
>C/C++:
void *ptr;
TAU_PROFILER_CREATE(ptr, "foo","", TAU_USER);
TAU_PROFILER_START(ptr);
foo(2);
TAU_PROFILER_STOP(ptr);
double incl[TAU_MAX_COUNTERS];
TAU_PROFILER_GET_INCLUSIVE_VALUES(ptr, &incl);
See Also
TAU_PROFILER_CREATE
TAU_PROFILER_START
TAU_PROFILER_STOP
TAU_PROFILER_GET_CALLS
TAU_PROFILER_GET_CHILD_CALLS
TAU_PROFILER_GET_EXCLUSIVE_VALUES TAU_PROFILER_GET_COUNTER_INFO
286
Name
TAU_PROFILER_GET_INCLUSIVE_VALUES_TASK -- Returns the inclusive amount of a metric
spend by this timer on a given task.
C/C++:
TAU_PROFILER_GET_INCLUSIVE_VALUES_TASK(timer, incl, taskid);
Timer timer;
double& incl;
int taskid;
description
TAU_PROFILER_GET_INCLUSIVE_VALUES_TASK Returns the inclusive amount of a metric spend
while this timer was running (and any subsequent timers called from this timer) on a given task.
example
>C/C++:
void *ptr;
int taskid;
TAU_PROFILER_CREATE(ptr, "foo","", TAU_USER);
TAU_CREATE_TASK(taskid);
TAU_PROFILER_START(ptr);
foo(2);
TAU_PROFILER_STOP(ptr);
double incl[TAU_MAX_COUNTERS];
TAU_PROFILER_GET_INCLUSIVE_VALUES_TASK(ptr, &incl, taskid);
See Also
TAU_CREATE_TASK
TAU_PROFILER_START_TASK
TAU_PROFILER_STOP_TASK
TAU_PROFILER_GET_CALLS_TASK
TAU_PROFILER_GET_CHILD_CALLS_TASK
TAU_PROFILER_GET_EXCLUSIVE_VALUES_TASK
TAU_PROFILER_GET_COUNTER_INFO_TASK
287
Name
TAU_PROFILER_GET_EXCLUSIVE_VALUES -- Returns the exclusive amount of a metric spend by
this timer.
C/C++:
TAU_PROFILER_GET_EXCLUSIVE_VALUES(timer, excl);
Timer timer;
double& excl;
description
TAU_PROFILER_GET_EXCLUSIVE_VALUES Returns the exclusive amount of the metric spend
while this timer was running (and while no other subsequent timers was running.)
example
>C/C++:
void *ptr;
TAU_PROFILER_CREATE(ptr, "foo","", TAU_USER);
TAU_PROFILER_START(ptr);
foo(2);
TAU_PROFILER_STOP(ptr);
double excl[TAU_MAX_COUNTERS];
TAU_PROFILER_GET_EXCLUSIVE_VALUES(ptr, &excl);
See Also
TAU_PROFILER_CREATE
TAU_PROFILER_START
TAU_PROFILER_STOP
TAU_PROFILER_GET_CALLS
TAU_PROFILER_GET_CHILD_CALLS
TAU_PROFILER_GET_INCLUSIVE_VALUES TAU_PROFILER_GET_COUNTER_INFO
288
Name
TAU_PROFILER_GET_EXCLUSIVE_VALUES_TASK -- Returns the exclusive amount of a metric
spend by this timer on a given task.
C/C++:
TAU_PROFILER_GET_EXCLUSIVE_VALUES_TASK(timer, excl, taskid);
Timer timer;
double& excl;
int taskid;
description
TAU_PROFILER_GET_EXCLUSIVE_VALUES_TASK Returns the exclusive amount of the metric
spend while this timer was running (and while no other subsequent timers was running) on a given task.
example
>C/C++:
void *ptr;
int taskid;
TAU_PROFILER_CREATE(ptr, "foo","", TAU_USER);
TAU_CREATE_TASK(taskid);
TAU_PROFILER_START(ptr);
foo(2);
TAU_PROFILER_STOP(ptr);
double excl[TAU_MAX_COUNTERS];
TAU_PROFILER_GET_EXCLUSIVE_VALUES_TASK(ptr, &excl, taskid);
See Also
TAU_PROFILER_CREATE
TAU_PROFILER_START
TAU_PROFILER_STOP
TAU_PROFILER_GET_CALLS
TAU_PROFILER_GET_CHILD_CALLS
TAU_PROFILER_GET_INCLUSIVE_VALUES TAU_PROFILER_GET_COUNTER_INFO
289
Name
TAU_PROFILER_GET_COUNTER_INFO -- Returns information about all the timers created.
C/C++:
TAU_PROFILER_GET_COUNTER_INFO(counters, num_counters);
const char * counters;
int &num_counters;
description
TAU_PROFILER_GET_COUNTER_INFO Gets the number of counters created and an array of the
counters containing information about the counters.
example
>C/C++:
void *ptr;
TAU_PROFILER_CREATE(ptr, "foo","", TAU_USER);
TAU_PROFILER_START(ptr);
foo(2);
TAU_PROFILER_STOP(ptr);
const char **counters;
int numcounters;
TAU_PROFILER_GET_COUNTER_INFO(&counters, &numcounters);
printf("numcounters = %d\n", numcounters);
for (j = 0; j < numcounters ; j++)
{
printf(">>>");
printf("counter [%d] = %s\n", j, counters[j]);
}
See Also
TAU_PROFILER_CREATE
TAU_PROFILER_START
TAU_PROFILER_STOP
TAU_PROFILER_GET_CALLS
TAU_PROFILER_GET_CHILD_CALLS
TAU_PROFILER_GET_INCLUSIVE_VALUES TAU_PROFILER_GET_EXCLUSIVE_VALUES
290
Name
TAU_PROFILER_GET_COUNTER_INFO_TASK -- Returns information about all the timers created
on a task.
C/C++:
TAU_PROFILER_GET_COUNTER_INFO_TASK(counters, num_counters, taskid);
const char * counters;
int &num_counters;
int taskid;
description
TAU_PROFILER_GET_COUNTER_INFO_TASK Gets the number of counters created and an array of
the counters containing information about the counters on a given task.
example
>C/C++:
void *ptr;
int taskid;
TAU_PROFILER_CREATE(ptr, "foo","", TAU_USER);
TAU_CREATE_TASK(taskid);
TAU_PROFILER_START_TASK(ptr, taskid);
foo(2);
TAU_PROFILER_STOP_TASK(ptr, taskid);
const char **counters;
int numcounters;
TAU_PROFILER_GET_COUNTER_INFO_TASK(&counters, &numcounters, taskid);
printf("numcounters = %d\n", numcounters);
for (j = 0; j < numcounters ; j++)
{
printf(">>>");
printf("counter [%d] = %s\n", j, counters[j]);
}
See Also
TAU_CREATE_TASK
TAU_PROFILER_START_TASK
TAU_PROFILER_STOP_TASK
TAU_PROFILER_GET_CALLS_TASK
TAU_PROFILER_GET_CHILD_CALLS_TASK
TAU_PROFILER_GET_INCLUSIVE_VALUES_TASK
TAU_PROFILER_GET_EXCLUSIVE_VALUES_TASK
291
Name
TAU_QUERY_DECLARE_EVENT -- Returns a event handle.
C/C++:
TAU_QUERY_DECLARE_EVENT(event);
void * event;
description
TAU_QUERY_DECLARE_EVENT Creates a event handle for querying TAU events.
example
>C/C++:
char[100] str;
TAU_QUERY_DECLARE_EVENT(event);
TAU_QUERY_GET_CURRENT_EVENT(event);
TAU_QUERY_GET_EVENT_NAME(event, str);
printf("current event is: %d.\n", str);
See Also
TAU_QUERY_DECLARE_EVENT
TAU_QUERY_GET_CURRENT_EVENT
TAU_QUERY_GET_EVENT_NAME TAU_QUERY_GET_PARENT_EVENT
292
Name
TAU_QUERY_GET_CURRENT_EVENT -- set event to be the current TAU event.
C/C++:
TAU_QUERY_GET_CURRENT_EVENT(event);
void * event;
description
TAU_QUERY_GET_CURRENT_EVENT Set event to be the current TAU event in the context in which
this call is made.
example
>C/C++:
char[100] str;
TAU_QUERY_DECLARE_EVENT(event);
TAU_QUERY_GET_CURRENT_EVENT(event);
TAU_QUERY_GET_EVENT_NAME(event, str);
printf("current event is: %d.\n", str);
See Also
TAU_QUERY_DECLARE_EVENT
TAU_QUERY_GET_CURRENT_EVENT
TAU_QUERY_GET_EVENT_NAME TAU_QUERY_GET_PARENT_EVENT
293
Name
TAU_QUERY_GET_EVENT_NAME -- Gets the name of a given event.
C/C++:
TAU_QUERY_GET_EVENT_NAME(event, str);
void * event;
char * str;
description
TAU_QUERY_GET_EVENT_NAME Set str to be the event name to the given event name.
example
>C/C++:
char[100] str;
TAU_QUERY_DECLARE_EVENT(event);
TAU_QUERY_GET_CURRENT_EVENT(event);
TAU_QUERY_GET_EVENT_NAME(event, str);
printf("current event is: %d.\n", str);
See Also
TAU_QUERY_DECLARE_EVENT
TAU_QUERY_GET_CURRENT_EVENT
TAU_QUERY_GET_EVENT_NAME TAU_QUERY_GET_PARENT_EVENT
294
Name
TAU_QUERY_GET_PARENT_EVENT -- gets the parent of the current event.
C/C++:
TAU_QUERY_GET_PARENT_EVENT(event);
void * event;
description
TAU_QUERY_GET_PARENT_EVENT Set event to be the parent event to the current event.
example
>C/C++:
char[100] str;
TAU_QUERY_DECLARE_EVENT(event);
TAU_QUERY_GET_PARENT_EVENT(event);
TAU_QUERY_GET_EVENT_NAME(event, str);
printf("parent event is: %d.\n", str);
See Also
TAU_QUERY_DECLARE_EVENT
TAU_QUERY_GET_CURRENT_EVENT
TAU_QUERY_GET_EVENT_NAME TAU_QUERY_GET_PARENT_EVENT
295
TAU Mapping API
Introduction
TAU allows the user to map performance data of entities from one layer to another in multi-layered software. Mapping is used in profiling (and tracing) both synchronous and asynchronous models of computation.
For mapping, the following macros are used. First locate and identify the higher-level statement using
the TAU_MAPPING macro. Then, associate a function identifier with it using the
TAU_MAPPING_OBJECT. Associate the high level statement to a FunctionInfo object that will be visible to lower level code, using TAU_MAPPING_LINK, and then profile entire blocks using
TAU_MAPPING_PROFILE. Independent sets of statements can be profiled using
TAU_MAPPING_PROFILE_TIMER,
TAU_MAPPING_PROFILE_START,
and
TAU_MAPPING_PROFILE_STOP macros using the FunctionInfo object.
The TAU examples/mapping directory has two examples (embedded and external) that illustrate
the use of this mapping API for generating object-oriented profiles.
296
Name
TAU_MAPPING -- Encapsulates a C++ statement for profiling
C/C++:
TAU_MAPPING(statement, key);
statement statement;
TauGroup_t key;
Description
TAU_MAPPING is used to encapsulate a C++ statement as a timer. A timer will be made, named by the
statment, and will profile the statement. The key given can be used with TAU_MAPPING_LINK to retrieve the timer.
Example
C/C++ :
int main(int argc, char **argv) {
Array <2> A(N, N), B(N, N), C(N,N), D(N, N);
// Original statement:
// A = B + C + D;
//Instrumented statement:
TAU_MAPPING(A = B + C + D; , TAU_USER);
...
}
See Also
TAU_MAPPING_CREATE, TAU_MAPPING_LINK
297
Name
TAU_MAPPING_CREATE -- Creates a mapping
C/C++:
TAU_MAPPING_CREATE(name, type, groupname, key, tid);
char *name;
char *type;
char *groupname;
unsigned long key;
int tid;
Description
TAU_MAPPING_CREATE creates a mapping and associates it with the key that is specified. Later, this
key may be used to retrieve the FunctionInfo object associated with this key for timing purposes. The
thread identifier is specified in the tid parameter.
Example
C/C++ :
class MyClass {
public:
MyClass() {
TAU_MAPPING_LINK(runtimer, TAU_USER);
}
~MyClass() {}
void Run(void) {
TAU_MAPPING_PROFILE(runtimer); // For one object
TAU_PROFILE("MyClass::Run()", " void (void)", TAU_USER1);
cout <<"Sleeping for 2 secs..."<<endl;
sleep(2);
}
private:
TAU_MAPPING_OBJECT(runtimer)
// EMBEDDED ASSOCIATION
};
int main(int argc, char **argv) {
TAU_PROFILE_INIT(argc, argv);
TAU_PROFILE("main()", "int (int, char **)", TAU_DEFAULT);
MyClass x, y, z;
TAU_MAPPING_CREATE("MyClass::Run() for object a", " " , TAU_USER,
"TAU_USER", 0);
MyClass a;
TAU_PROFILE_SET_NODE(0);
cout <<"Inside main"<<endl;
a.Run();
x.Run();
y.Run();
}
298
TAU_MAPPING_CREATE
See Also
TAU_MAPPING_LINK, TAU_MAPPING_OBJECT, TAU_MAPPING_PROFILE
299
Name
TAU_MAPPING_LINK -- Creates a mapping link
C/C++:
TAU_MAPPING_LINK(FuncIdVar, Key);
FunctionInfo FuncIdVar;
unsigned long Key;
Description
TAU_MAPPING_LINK creates a link between the object defined in TAU_MAPPING_OBJECT (that
identifies a statement) and the actual higher-level statement that is mapped with TAU_MAPPING. The
Key argument represents a profile group to which the statement belongs, as specified in the
TAU_MAPPING macro argument. For the example of array statements, this link should be created in the
constructor of the class that represents the expression. TAU_MAPPING_LINK should be executed before any measurement takes place. It assigns the identifier of the statement to the object to which FuncIdVar refers. For example
Example
C/C++ :
class MyClass {
public:
MyClass() { }
~MyClass() { }
void Run(void) {
TAU_MAPPING_OBJECT(runtimer)
TAU_MAPPING_LINK(runtimer, (unsigned long) this);
TAU_MAPPING_PROFILE(runtimer); // For one object
TAU_PROFILE("MyClass::Run()", " void (void)", TAU_USER1);
/* ... */
}
};
int main(int argc, char **argv) {
TAU_PROFILE_INIT(argc, argv);
TAU_PROFILE("main()", "int (int, char **)", TAU_DEFAULT);
MyClass x, y, z;
MyClass a;
TAU_MAPPING_CREATE("MyClass::Run() for object a", " " ,
(TauGroup_t) &a, "TAU_USER", 0);
TAU_MAPPING_CREATE("MyClass::Run() for object x", " " ,
(TauGroup_t) &x, "TAU_USER", 0);
TAU_PROFILE_SET_NODE(0);
cout <<"Inside main"<<endl;
a.Run();
x.Run();
y.Run();
300
TAU_MAPPING_LINK
See Also
TAU_MAPPING_CREATE, TAU_MAPPING_OBJECT, TAU_MAPPING_PROFILE
301
Name
TAU_MAPPING_OBJECT -- Declares a mapping object
C/C++:
TAU_MAPPING_OBJECT(FuncIdVar);
FunctionInfo FuncIdVar;
Description
To create storage for an identifier associated with a higher level statement that is mapped using
TAU_MAPPING, we use the TAU_MAPPING_OBJECT macro. For example, in the TAU_MAPPING example, the array expressions are created into objects of a class ExpressionKernel, and each statement is
an object that is an instance of this class. To embed the identity of the statement we store the mapping
object in a data field in this class. This is shown below:
Example
C/C++ :
template<class LHS,class Op,class RHS,class EvalTag>
class ExpressionKernel : public Pooma::Iterate_t {
public:
typedef ExpressionKernel<LHS,Op,RHS,EvalTag> This_t;
//
// Construct from an Expr.
// Build the kernel that will evaluate the expression on the
// given domain.
// Acquire locks on the data referred to by the expression.
//
ExpressionKernel(const LHS&,const Op&,const RHS&,
Pooma::Scheduler_t&);
virtual ~ExpressionKernel();
// Do the loop.
virtual void run();
private:
// The expression we will evaluate.
LHS lhs_m;
Op op_m;
RHS rhs_m;
TAU_MAPPING_OBJECT(TauMapFI)
};
See Also
TAU_MAPPING_CREATE, TAU_MAPPING_LINK, TAU_MAPPING_PROFILE
302
Name
TAU_MAPPING_PROFILE -- Profiles a block based on a mapping
C/C++:
TAU_MAPPING_PROFILE(FuncIdVar);
FunctionInfo *FuncIdVar;
Description
The TAU_MAPPING_PROFILE macro measures the time and attributes it to the statement mapped in
TAU_MAPPING macro. It takes as its argument the identifier of the higher level statement that is stored
using TAU_MAPPING_OBJECT and linked to the statement using TAU_MAPPING_LINK macros.
TAU_MAPPING_PROFILE measures the time spent in the entire block in which it is invoked. For example, if the time spent in the run method of the class does work that must be associated with the higher-level array expression, then, we can instrument it as follows:
Example
C/C++ :
// Evaluate the kernel
// Just tell an InlineEvaluator to do it.
template<class LHS,class Op,class RHS,class EvalTag>
void
ExpressionKernel<LHS,Op,RHS,EvalTag>::run() {
TAU_MAPPING_PROFILE(TauMapFI)
// Just evaluate the expression.
KernelEvaluator<EvalTag>().evalate(lhs_m,op_m,rhs_m);
// we could release the locks here or in dtor
}
See Also
TAU_MAPPING_CREATE, TAU_MAPPING_LINK, TAU_MAPPING_OBJECT
303
Name
TAU_MAPPING_PROFILE_START -- Starts a mapping timer
C/C++:
TAU_MAPPING_PROFILE_START(timer, tid);
Profiler timer;
int tid;
Description
TAU_MAPPING_PROFILE_START
starts
the
timer
that
is
created
using
TAU_MAPPING_PROFILE_TIMER. This will measure the elapsed time in groups of statements, instead of the entire block. A corresponding stop statement stops the timer as described next. The thread
identifier is specified in the tid parameter.
Example
C/C++ :
template<class LHS,class Op,class RHS,class EvalTag>
void
ExpressionKernel<LHS,Op,RHS,EvalTag>::run() {
TAU_MAPPING_PROFILE_TIMER(timer, TauMapFI);
printf("ExpressionKernel::run() this = 4854\n", this);
// Just evaluate the expression.
TAU_MAPPING_PROFILE_START(timer);
KernelEvaluator<EvalTag>().evaluate(lhs_m, op_m, rhs_m);
TAU_MAPPING_PROFILE_STOP();
// we could release the locks here instead of in the dtor.
}
See Also
TAU_MAPPING_PROFILE_TIMER, TAU_MAPPING_PROFILE_STOP
304
Name
TAU_MAPPING_PROFILE_STOP -- Stops a mapping timer
C/C++:
TAU_MAPPING_PROFILE_STOP(timer, tid);
Profiler timer;
int tid;
Description
TAU_MAPPING_PROFILE_STOP
stops
the
timer
that
is
created
using
TAU_MAPPING_PROFILE_TIMER. This will measure the elapsed time in groups of statements, instead of the entire block. A corresponding stop statement stops the timer as described next. The thread
identifier is specified in the tid parameter.
Example
C/C++ :
template<class LHS,class Op,class RHS,class EvalTag>
void
ExpressionKernel<LHS,Op,RHS,EvalTag>::run() {
TAU_MAPPING_PROFILE_TIMER(timer, TauMapFI);
printf("ExpressionKernel::run() this = 4854\n", this);
// Just evaluate the expression.
TAU_MAPPING_PROFILE_START(timer);
KernelEvaluator<EvalTag>().evaluate(lhs_m, op_m, rhs_m);
TAU_MAPPING_PROFILE_STOP();
// we could release the locks here instead of in the dtor.
}
See Also
TAU_MAPPING_PROFILE_TIMER, TAU_MAPPING_PROFILE_START
305
Name
TAU_MAPPING_PROFILE_TIMER -- Declares a mapping timer
C/C++:
TAU_MAPPING_PROFILE_TIMER(timer, FuncIdVar);
Profiler timer;
FunctionInfo *FuncIdVar;
Description
TAU_MAPPING_PROFILE_TIMER enables timing of individual statements, instead of complete
blocks. It will attribute the time to a higher-level statement. The second argument is the identifier of the
statement that is obtained after TAU_MAPPING_OBJECT and TAU_MAPPING_LINK have executed.
The timer argument in this macro is any variable that is used subsequently to start and stop the timer.
Example
C/C++ :
template<class LHS,class Op,class RHS,class EvalTag>
void
ExpressionKernel<LHS,Op,RHS,EvalTag>::run() {
TAU_MAPPING_PROFILE_TIMER(timer, TauMapFI);
printf("ExpressionKernel::run() this = 4854\n", this);
// Just evaluate the expression.
TAU_MAPPING_PROFILE_START(timer);
KernelEvaluator<EvalTag>().evaluate(lhs_m, op_m, rhs_m);
TAU_MAPPING_PROFILE_STOP();
// we could release the locks here instead of in the dtor.
}
See Also
TAU_MAPPING_LINK,
TAU_MAPPING_OBJECT,
TAU_MAPPING_PROFILE_STOP
306
TAU_MAPPING_PROFILE_START,
Appendix A. Environment Variables
Table A.1. TAU Environment Variables
VARIABLE NAME
DESCRIPTION
TAU_PROFILE
Set to 1 to have TAU profile your code
TAU_TRACE
Set to 1 to have TAU trace your code
TAU_METRICS
Colon delimited list of TAU/PAPI metrics to profile
PAPI_EVENT
Sets the hardware counter to use when TAU is
configured with -PAPI. See Section 2.6, “Using
Hardware Performance Counters”
PCL_EVENT
Sets the hardware counter to use when TAU is
configured with -PCL. See Section 2.6, “Using
Hardware Performance Counters”
PROFILEDIR
Selectively measure groups of routines and statements. Use with -profile command line option. See
???
TAU_CALLPATH
When set to 1 TAU will generate call-path data.
Use with TAU_CALLPATH_DEPTH.
TAU_CALLPATH_DEPTH
Sets the depth of the callpath profiling. Use with
TAU_CALLPATH environment variable.
TAU_TRACK_MESSAGE
Track MPI message statistics (profiling), messages
lines (tracing).
TAU_COMM_MATRIX
Generate MPI communication matrix data.
TAU_COMPENSATE
Attempt to compensate for profiling overhead in
profiles.
TAU_COMPENSATE_ITERATIONS
Set the number of iterations TAU uses to estimate
the measurement overhead. A larger number of iteration will increases profiling precision (default
1000).
TAU_KEEP_TRACEFILES
Retains the intermediate trace files. Use with TRACE TAU configuration option. See ???
TAU_MUSE_PACKAGE
Sets the MAGNET/MUSE package name. Use
with the -muse TAU configuration option. See ???
TAU_THROTTLE
Enables the runtime throttling of events that are
lightweight. See ???
TAU_THROTTLE_NUMCALLS
Set the maximum number of calls that will be profiled for any function when TAU_THROTTLE is
enabled. See ???
TAU_THROTTLE_PERCALL
Set the minimum inclusive time (in milliseconds) a
function has to have to be instrumented when
TAU_THROTTLE is enabled. See ???
TAU_TRACEFILE
Specifies the name of Vampir trace file. Use with TRACE TAU configuration option. See ???
TRACEDIR
Specifies the directory where trace file are to be
stored. See ???
307
Environment Variables
VARIABLE NAME
DESCRIPTION
TAU_VERBOSE
When set TAU will print out information about the
its configuration when running a instrumented application.
TAU_PROFILE_FORMAT
When set to snapshot TAU will generate condensed snapshot profiles (they merge together different metrics so there is only one file per node.)
Instead of the default kind. When set to merged,
TAU will pre-compute mean and std. dev. at the
end of execution.
TAU_TRACK_MEMORY_FOOTPRINT
When set TAU will track resident set size
(VmRSS) and peak memory usage (VmHWM) or
the high water mark of resident set size, the same
values provided by the 'top' command.
TAU_TRACK_POWER
Enables tracking of power consumption via periodic interrupt.
TAU_SYNCHRONIZE_CLOCKS
When set TAU will correct for any time discrepancies between nodes because of their CPU clock
lag. This should produce more reliable trace data.
TAU_SAMPLING
Default value is 0 (off). When TAU_SAMPLING
is set, we collect additional profile or trace information (depending on whether TAU_PROFILE or
TAU_TRACE is set respectively) via periodic
sampling at runtime. Metrics collected and
sampling period is controlled by
TAU_EBS_SOURCE and TAU_EBS_PERIOD
variables respectively. The TAU_EBS_UNWIND
variable determines if callstack unwinding is enabled at each sample.
For TAU_PROFILE, in addition to regular TAU
instrumented profile output, samples will show up
as additional events prefixed by [SAMPLE] for
each unique function, file and source line number
combination. These events are grouped under
[INTERMEDIATE] event nodes for the instrumented TAU context where the samples occured.
In addition, if TAU_EBS_UNWIND is active,
[UNWIND] event nodes may be generated for
each discovered callstack entry found by the callstack unwinder.
TAU_SAMPLING is dependent on the availability
of BFD as determined by the -bfd configuration
option when building TAU. Its ability to resolve
sample addresses into function, file name and
source line number information may be limited or
missing if BFD is missing or is installed with limited functionality. If in doubt, please try building
TAU with "-bfd=download". Any one of function,
file name and source line number may be missing.
In the event all three are, the event is marked as
"UNRESOLVED". The
TAU_EBS_KEEP_UNRESOLVED_ADDR variable enables addresses to be retained for unre308
Environment Variables
VARIABLE NAME
DESCRIPTION
solved results.
TAU_EBS_SOURCE
Default value is "itimer". This variable sets the
metric that determines the period of sampling. If
the value is "itimer" (default), it represents the
number of microseconds between samples (as determined by TAU_EBS_PERIOD). If the value is a
PAPI metric (eg. PAPI_FP_INS), then it represents
the number of counts of that metric between
samples (eg. every 10,000 floating-point instructions if PAPI_FP_INS is used). For "itimer", the
samples occur as a result of system timer interrupts
while for PAPI they occur in response to PAPI
counter overflow interrupts set to the value of the
TAU_EBS_PERIOD.
TAU_EBS_PERIOD
Default value is 1,000. This variable sets the period between samples. The semantics of this value is
discussed in the section above on
TAU_EBS_SOURCE.
TAU_EBS_UNWIND
Default value is 0 (off). This enables callstack unwinding for each sample using the callstack unwinder specified at TAU configuration time. As of
this writing, only the libunwind tool is supported.
Support for other callstack unwinders like StackwalkerAPI will be included. The
TAU_EBS_UNWIND_DEPTH variable is used to
control how many times the TAU sampling framework will be allowed to unwind the callstack.
TAU_EBS_UNWIND_DEPTH
Default value is 10. This controls how many layers
of the callstack TAU should unwind before attaching the result to the appropriate TAU event context.
TAU_EBS_KEEP_UNRESOLVED_ADDR
Default value is 0 (off). When set, this variable allows sample addresses that fail to be resolved by
BFD to be recorded as "UNRESOLVED
<modulename> ADDR <addr> instead of "UNRESOLVED <modulename>". This provides nominally more information than the default scenario in
light of missing BFD information.
TAU_TRACK_SIGNALS
Set this variables to 1 to capture callstack as
metadata at point of failure.
TAU_SUMMARY
Set this variables to 1 to generate just min/
max/stddev/mean statistics instead of per-node
data. Use paraprof -dumpsummary and then pprof
-f profile.Max/Min to see the data.
TAU_IBM_BG_HWP_COUNTERS
Set this variables to 1 to include IBM's UPC Hardware Performance counters in the metadata for
process 0. Requires the use of MPI.
TAU_CUPTI_API
Default: runtime, options:
runtime,driver,both. Controls which layer
of CUDA is tracked within the CUPTI measurement system. See for example: tau_exec -T
serial,cupti -cupti ./matmult. Option should be set basied on which layer the CUDA
309
Environment Variables
VARIABLE NAME
DESCRIPTION
program uses—runtime when the program uses
the CUDA runtime API, driver when the program uses the driver API. NOTE: Both the PGI accelerator and the HMPP compilers use the driver
API.
310