1
IT 14 016
Examensarbete 30 hp
Februari 2014
Non-intrusive Patient Simulator
for Medical Ventilator Software
Verification
Zhuo Yuzhen
Institutionen för informationsteknologi
Department of Information Technology
Dedicated to my beloved parents,
for their constant love and support
ii
Abstract
Non-intrusive Patient Simulator for Medical Ventilator
Software Verification
Zhuo Yuzhen
Teknisk- naturvetenskaplig fakultet
UTH-enheten
Besöksadress:
Ångströmlaboratoriet
Lägerhyddsvägen 1
Hus 4, Plan 0
Postadress:
Box 536
751 21 Uppsala
Telefon:
018 – 471 30 03
Telefax:
018 – 471 30 00
Hemsida:
http://www.teknat.uu.se/student
Testing distributed real-time systems has been pervasively proven a challenging task
within numerous industries. When the real-time nature of a system is combined with
safety critical medical systems, having a reliable test system is of major importance.
However, the hardware dependency makes it very difficult to test medical ventilator
software system in failure mode and requires manual manoeuvres, prohibiting test
automation for numerous features.
To achieve entire test automation, an embedded patient simulator is proposed in this
thesis. A simulator that simulates a human lung runs separately on embedded platform
and interacts with the ventilator so that all the hardware dependencies could be
removed. It is of non-intrusive implementation and all the real-time properties of the
ventilator software system could be tested on target. Software-implemented fault
injection is realized as well, which is a significant step to fault-tolerance testing for
safety critical system.
Handledare: Nikos Anastasiadis
Ämnesgranskare: Wang Yi
Examinator: Philipp Rümmer
IT 14 016
Sponsor: Maquet Critical Care AB
Tryckt av: Reprocentralen ITC
Acknowledgements
Foremost, I offer my sincerest gratitude to my supervisor, N ikosAnastasiadis, for his
patient guidance, enthusiastic encouragement and valuable critiques during this research
work. I would also like to thank T inaRykarv, P awelDef ee, Jessica and F redrik for
their support throughout the work at Maquet Critical Care.
I’d like to express my very great appreciation to my thesis reviewer, Professor W angY i
for the impressive discussions and constructive suggestions. I wish to thank my Master
Program coordinator and thesis examiner, P hilippRümmer, who provided great help
and academic guidance through my master study.
My special thanks are extended to Dr.AndersW all for the Anders Wall Foundation
Scholarship which enabled me to undertake Master Program of Embedded System at
Uppsala University.
iv
Contents
Abstract
iii
Acknowledgements
iv
Contents
v
List of Figures
vii
1 Introduction
1
2 Background
2.1 Respiratory Physiology . . . . . . . . . . . . . . . . . . . . . . . . . . . . .
2.2 Mechanical Ventilation . . . . . . . . . . . . . . . . . . . . . . . . . . . . .
2.3 Maquet Ventilator . . . . . . . . . . . . . . . . . . . . . . . . . . . . . . .
3
3
4
6
3 Platform Architecture
3.1 System Architecture . . . . . . . .
3.1.1 Software System Overview .
3.1.2 Breathing Subsystem . . . .
3.1.3 Monitoring Subsystem . . .
3.1.4 Panel Subsystem . . . . . .
3.2 Interaction and Communication . .
3.2.1 Serial Peripheral Interface .
3.2.2 Google Protocol Buffer . . .
.
.
.
.
.
.
.
.
.
.
.
.
.
.
.
.
.
.
.
.
.
.
.
.
.
.
.
.
.
.
.
.
.
.
.
.
.
.
.
.
.
.
.
.
.
.
.
.
.
.
.
.
.
.
.
.
.
.
.
.
.
.
.
.
.
.
.
.
.
.
.
.
.
.
.
.
.
.
.
.
.
.
.
.
.
.
.
.
.
.
.
.
.
.
.
.
.
.
.
.
.
.
.
.
.
.
.
.
.
.
.
.
.
.
.
.
.
.
.
.
.
.
.
.
.
.
.
.
.
.
.
.
.
.
.
.
.
.
.
.
.
.
.
.
.
.
.
.
.
.
.
.
.
.
.
.
.
.
.
.
.
.
.
.
.
.
.
.
.
.
.
.
.
.
.
.
11
11
11
13
14
16
17
17
17
4 Software Testing
19
4.1 Dependability and Fault tolerance . . . . . . . . . . . . . . . . . . . . . . 19
4.2 Formal Testing . . . . . . . . . . . . . . . . . . . . . . . . . . . . . . . . . 20
4.3 Challenges at Maquet . . . . . . . . . . . . . . . . . . . . . . . . . . . . . 22
5 Patient Simulator
5.1 Physical Lung Model . . . . . .
5.1.1 Physical Characteristics
5.1.2 Lung Model . . . . . . .
5.2 Software Patient Simulator . .
5.2.1 Theory . . . . . . . . .
.
.
.
.
.
.
.
.
.
.
v
.
.
.
.
.
.
.
.
.
.
.
.
.
.
.
.
.
.
.
.
.
.
.
.
.
.
.
.
.
.
.
.
.
.
.
.
.
.
.
.
.
.
.
.
.
.
.
.
.
.
.
.
.
.
.
.
.
.
.
.
.
.
.
.
.
.
.
.
.
.
.
.
.
.
.
.
.
.
.
.
.
.
.
.
.
.
.
.
.
.
.
.
.
.
.
.
.
.
.
.
.
.
.
.
.
.
.
.
.
.
25
25
25
28
29
29
Contents
5.2.2
vi
Limitations and Shortcomings . . . . . . . . . . . . . . . . . . . . . 30
6 Embedded Patient Simulator
6.1 System Overview . . . . . . . . . . . . . . . . . . . . .
6.2 Embedded Patient Simulator . . . . . . . . . . . . . .
6.2.1 Raspberry and Embedded Linux Development
6.2.2 System Design . . . . . . . . . . . . . . . . . .
6.3 Modification on Platform . . . . . . . . . . . . . . . .
6.3.1 Disconnect Hardware Dependencies . . . . . .
6.3.2 Implement Interface to Patient Simulator . . .
6.3.3 Simulation and Testing . . . . . . . . . . . . .
6.4 Software Implemented Fault Injection . . . . . . . . .
6.4.1 Client and Request Message . . . . . . . . . . .
6.4.2 Server . . . . . . . . . . . . . . . . . . . . . . .
6.5 Summary . . . . . . . . . . . . . . . . . . . . . . . . .
7 Experiment and Conclusion
7.1 Integrate with AVA . . . . . . . . . . . . . . .
7.2 Experiment Setup . . . . . . . . . . . . . . .
7.3 Experiment and Evaluation . . . . . . . . . .
7.3.1 Example Test Case . . . . . . . . . . .
7.3.2 Manual Testing vs Automated Testing
7.4 Comparison and Conclusion . . . . . . . . . .
.
.
.
.
.
.
.
.
.
.
.
.
.
.
.
.
.
.
.
.
.
.
.
.
.
.
.
.
.
.
.
.
.
.
.
.
.
.
.
.
.
.
.
.
.
.
.
.
.
.
.
.
.
.
.
.
.
.
.
.
.
.
.
.
.
.
.
.
.
.
.
.
.
.
.
.
.
.
.
.
.
.
.
.
.
.
.
.
.
.
.
.
.
.
.
.
.
.
.
.
.
.
.
.
.
.
.
.
.
.
.
.
.
.
.
.
.
.
.
.
.
.
.
.
.
.
.
.
.
.
.
.
.
.
.
.
.
.
.
.
.
.
.
.
.
.
.
.
.
.
.
.
.
.
.
.
.
.
.
.
.
.
.
.
.
.
.
.
.
.
.
.
.
.
.
.
.
.
.
.
.
.
.
.
.
.
.
.
.
.
.
.
.
.
.
.
.
.
.
.
.
.
.
.
.
.
.
.
.
.
.
.
.
.
.
.
.
.
.
.
.
.
33
33
34
34
36
38
39
39
39
40
40
42
43
.
.
.
.
.
.
45
45
45
46
46
46
48
8 Future Work
51
A Servo-i Diagram
53
B Example Test Case
55
Bibliography
57
List of Figures
2.1
2.2
2.3
Volume and Pressure Targeted Ventilation . . . . . . . . . . . . . . . . . .
MAQUET SERVO Ventilator . . . . . . . . . . . . . . . . . . . . . . . . .
MAQUET Ventilator Gas Chain . . . . . . . . . . . . . . . . . . . . . . .
3.1
3.2
3.3
3.4
Maquet Ventilator System Architecture
Sensor an I/O Data Acknowledge . . . .
Protection System Architecture . . . . .
Ventilate an Infant . . . . . . . . . . . .
4.1
Development and Testing Processes . . . . . . . . . . . . . . . . . . . . . . 21
5.1
5.2
5.3
5.4
5.5
5.6
Compliance . . . . .
Hysteresis . . . . . .
Simple RC Model . .
Extended RC model
Patient Simulator on
Ventilator vs PatSim
6.1
6.2
6.3
6.4
6.5
6.6
6.7
6.8
6.9
6.10
Patient Simulator on Raspberry .
Raspberry and SPI cable . . . . .
Software Real Time Scheduling .
SPI connection . . . . . . . . . .
SPI Message Format . . . . . . .
Testbench . . . . . . . . . . . . .
Fault Injection on Raspberry . .
Fault Injection Server . . . . . .
Embedded Patient Simulator v.s.
Patient Simulator and Ventilator
7.1
Experiment Setup . . . . . . . . . . . . . . . . . . . . . . . . . . . . . . . 46
. . . . .
. . . . .
. . . . .
. . . . .
Host . .
on Host
.
.
.
.
.
.
.
.
.
.
.
.
.
.
.
.
.
.
.
.
.
.
.
.
.
.
.
.
.
.
.
.
.
.
.
.
.
.
.
.
.
.
.
.
.
.
.
.
.
.
.
.
.
.
.
.
.
.
.
.
.
.
.
.
.
.
.
.
.
.
.
.
.
.
.
.
.
.
.
.
.
.
.
.
.
.
.
.
.
.
.
.
.
.
.
.
.
.
.
.
.
.
.
.
.
.
.
.
12
14
15
16
.
.
.
.
.
.
.
.
.
.
.
.
.
.
.
.
.
.
.
.
.
.
.
.
.
.
.
.
.
.
.
.
.
.
.
.
.
.
.
.
.
.
.
.
.
.
.
.
.
.
.
.
.
.
.
.
.
.
.
.
.
.
.
.
.
.
.
.
.
.
.
.
.
.
.
.
.
.
.
.
.
.
.
.
.
.
.
.
.
.
.
.
.
.
.
.
.
.
.
.
.
.
.
.
.
.
.
.
26
27
28
29
29
30
. . . . . .
. . . . . .
. . . . . .
. . . . . .
. . . . . .
. . . . . .
. . . . . .
. . . . . .
Ventilator
. . . . . .
.
.
.
.
.
.
.
.
.
.
.
.
.
.
.
.
.
.
.
.
.
.
.
.
.
.
.
.
.
.
.
.
.
.
.
.
.
.
.
.
.
.
.
.
.
.
.
.
.
.
.
.
.
.
.
.
.
.
.
.
.
.
.
.
.
.
.
.
.
.
.
.
.
.
.
.
.
.
.
.
.
.
.
.
.
.
.
.
.
.
.
.
.
.
.
.
.
.
.
.
.
.
.
.
.
.
.
.
.
.
.
.
.
.
.
.
.
.
.
.
.
.
.
.
.
.
.
.
.
.
.
.
.
.
.
.
.
.
.
.
.
.
.
.
.
.
.
.
.
.
.
.
.
.
.
.
.
.
.
.
.
.
.
.
.
.
.
.
.
.
34
35
36
37
38
40
41
42
43
44
vii
.
.
.
.
.
.
.
.
.
.
5
7
8
Chapter 1
Introduction
This thesis project is conducted at Maquet Critical Care AB, Getinge Group. Getinge
Group is a world leading medical technology company with operations in the areas of
surgery, intensive care, infection control, care ergonomics and wound care. The Group
is now organised in three business areas: Medical Systems, Extended Care and Infection
Controls. Maquet Critical Care AB is one of the subsidiaries with focus on intensive
care. They develop, manufacture and market medical devices, among which are the
medical ventilators.
Today, medical ventilator is a commonly used medical device, mostly equipped in the
Intensive Care Unit(ICU ). It is imperative in many forms of Acute Respiratory Failure
(ARF), which is associated with mortality rates of between 40% and 65% [1, 2]. As
Esteban and his team reported in a prospective study including 15757 patients from
20 countries, 33% (5183) of the admitted patients received mechanical ventilation for a
mean (SD) duration of 5.9 (7.2) days, while the mean (SD) length of stay in ICU was
11.2(13.7) days.[3]
As the prevalence of the mechanical ventilation, numerous international standards, such
as[4, 5], have been established to regulate the safe design and maintenance of medical
ventilators. Medical devices should be fault-tolerant to protect patients from unacceptable risks. Risk management and robustness verification has consumed tremendous time
and costs during the ventilator development.
Maquet ventilator system is a distributed real-time systems, which has been repeatedly
proven challenging to test in diverse industries. When the real-time nature of a system
is combined with safety critical medical systems, having a reliable test system, is of
major importance. This is to verify the software as well as ease and accelerate the
development process. The correctness of a real-time system does not depend only on
1
Chapter 1. Introduction
2
the output validity, but also on meeting the timing requirements. Therefore the testing
system shall also be able to verify the temporal validity of the system.
Maquet Critical Care produces ventilation systems with an advanced real-time computer
platform consisting of three separate subsystems. During development, subsystems are
built and tested on Linux hot computers. This testing methodology does not address
real-time issues. Real-time properties are always tested on target and this is highly
dependent on the gas chain. The gas chain, from the software perspective, is sensed as
a number of pressure, temperature and gas flow measurements sampled by FPGA. The
same Integrated Circuit(IC) is also used to control and regulates the valves and other
actuators on the system. The hardware dependency makes it very difficult to inject
faults and it requires manual manoeuvres, prohibiting test automation for numerous
features.
To realize automated software testing on target, a non-intrusive patient simulator is
proposed in this thesis. The patient simulator tries to simulate a real human lung model
and the gas chain of the ventilator. It works on a standalone embedded platform and is
connected to the ventilator via an SPI bus. All the sensors would be disconnected from
the ventilator and they are replaced by the simulated data which is exported from the
patient simulator. Meanwhile, simulator takes the actuator reference signals as input
signals for simulation step. Therefore, the hardware dependencies are removed from the
software system.
To test software reliability and fault-tolerance, fault injection is realised in a software
way. It works in server/slave mode and hardware fault could be simulated and injected
from the host side.
With no doubt, this will be a significant breakthrough for verification methodologies at
Maquet.
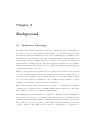
Chapter 2
Background
2.1
Respiratory Physiology
The metabolism of human beings is dependent on a continuous supply of oxygen (O2 ) and
the removal of carbon dioxide(CO2 ) from the human body. An extraordinary anatomic
arrangement of functional units(the alveoli) bordered epithelium and endothlium creates
the interfaces for gas exchange between blood and surroundings. The gas transport to
and from the cells is accomplished by the cooperation of two systems, the respiratory
system and the circulation system. Respiratory systems undertake the gas exchange
with the surroundings and oxygenate the blood, while the circulation systems transport
oxygen from the lungs to the cells.
Thus we could separate the respiration into two phases, the internal one and external
one. The external respiration is the gas exchange between the alveoli and the blood,
controlled by the respiration system, and the internal one is the gas exchange between
blood and cells, which is accomplished by the circulation system. Further on, when
talking about respiration, only the external one in intended.
Functionally, the lung could be divided into two regions: a conducting zone comprised
of airways and a respiratory zone containing smaller airways with alveoli. The chest
wall consists of the ribcage, abdomen and diaphragm.[6]
The diaphragm is the primary muscle of inspiration. During spontaneous inhalation,
air moves into the lung due to adomeshaped structure that forces abdominal contents
downward and forward with contraction resulting in an increase in volume of the thorax.
This results in a pressure drop in the pleurae which expands and lungs are stretched
together. As the pressure falls, air moves into the conducting zone. Contraction of
3
Chapter 2. Background
4
external intercostal muscles and accessory muscles would further expand the thoracic
volume, especially during forced inspiration, as when taking a deep breath.
In general, expiration is a passive process. During expiration the respiratory system
returns toward its resting volume and the lung relaxes and retakes its original shape
because of its natural elasticity and therefore carbon dioxide could be removed from
human body. However active or forced exhalation can be achieved by abdominal and
the internal intercostal muscles.
2.2
Mechanical Ventilation
According to the extent of patients’ dependence on the mechanical ventilation support,
we classify breathing into three types, respectively the controlled breathing, assisted
breathing and spontaneous breathing. As the name implies, spontaneous breathing
means that patients could breath spontaneously and need no mechanical ventilation
support, just as healthy adults do. Assisted breathing helps the patients’ own respiratory
attempts while during controlled breath respiration is only controlled by the ventilator.
Mechanical ventilation is commenced for the failure to ventilate or to oxygenate. It
is required when a patient is unable to achieve adequate ventilation and thereby gas
exchange. Mechanical ventilation can help relieve respiratory distress and improve pulmonary gas exchange. None of the ventilation mode can cure the disease process. However, it supports ventilation till you address the reversible primary problem.
Only two ways exist to mechanically ventilate a patient, using positive pressure or negative pressure. Some of the earliest ventilators were negative pressure chambers (iron
lungs). In the mid 1950s, iron lungs were presented to manually ventilate paralysis victims until restoration of neuromuscular activity occurred. Iron lungs mimicked the chest
cage’s activity in generating minute ventilation, but were of little value in diseases characterized by failure to oxygenate. The machines were bulky, expensive and somewhat
unhygienic.
Almost all modern ventilators employ intermittent positive pressure ventilation, which
means implement lung inflation by applying positive pressure to the airways. This makes
sense as the chest is a negative pressure ventilator. The first positive pressure ventilators
were pressure controlled. Volume controlled ventilators became ubiquitous in the 1960s
as this mechanism was perceived to be more reliable at delivering minute ventilation,
and thus normalizing blood gases.
Chapter 2. Background
5
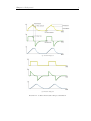
(a) Volume Targeted
(b) Pressure Targeted
Figure 2.1: Volume and Pressure Targeted Ventilation
Chapter 2. Background
6
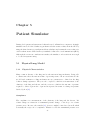
Today, the prevailing mechanical ventilation modes could be categories as volume targeted control and pressure targeted control. Figure 2.1 is the comparison between volume
targeted and pressure targeted ventilation. In pressure targeted ventilation, gas is supplied into the lung until a present airway pressure limit is reached. The oxygen delivered
varies with changing of the patients’ lung and airway characteristics, compliance and
resistance, which we would explain in details in Chapter 5. In volume targeted ventilation, gas flows into the patients lung until a preset volume of gas is delivered, even if
this entails a very high airway pressure.
Technology has played a large part in the development of modern ventilators. Physicians
are now demanding more control over gas flow than before - hence the development of
active exhalation valves, dynamic inspiration valves, rise time control, automatic tube
compensation and, of course, waveform analysis. Modern ventilators deliver enhanced
patient interactivity using better triggering sensors, and more comfortable spontaneous
breathing.
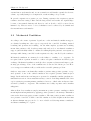
2.3
Maquet Ventilator
Maquet is a global leader in providing medical ventilator systems intended for treating
and monitoring patients ranging from neonates to adults with respiratory failure or
respiratory insufficiency. It meets the requirements of the most medically challenging
patients, even exceeds the expectations of their medical professionals.
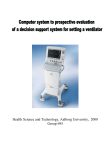
Here we would profile the Maquet ventilator system. Appendix A gives the main blocks
diagram of Maquet SERVO-i ventilator.[7] Roughly speaking, Maquet ventilator system
consists of three components[7, 8]:
• User Control Interface – for setting ventilation modes, displaying patient data and
indicating alarms and warnings
• Gas chain – Mix gases, deliver and exchange gas. It consists of the complicated
electronics and mechanics in the ventilator. Abundant sensors and actuators are
placed in the gas chain, which makes the mechanical ventilation observable and
controllable.
• Software System – control and regulate the mechanical ventilation at each breath
moment.
Among the above components, the ventilator gas chain is directly connected with the
patients’ respiratory system , which means gas chain would supply oxygen to the patients
Chapter 2. Background
7
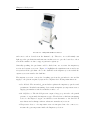
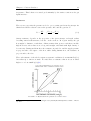
Figure 2.2: MAQUET SERVO Ventilator
and remove carbon dioxide from the human body. Therefore, we would mainly cast
light upon the gas chain internal structure in this section to give the basic idea of how
a medical ventilator works to support patients’ respiratory.
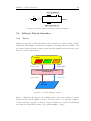
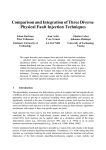
Generally speaking, the gas chain could be divided into two sections: the inspiratory
section and expiratory section. Figure 2.3 highlights the significant sensors and actuators/valves in the gas chain. Above the dash line is the inspiratory section while the
expiratory section is under the dash line.
The inspiratory section conveys the breathing gas from the gas inlets for air and O2
supply to the patient respiratory system. It comprises the following main functions:
• Gas Module: The air and O2 gas modules regulates the inspiratory gas flow and
gas mixture. It includes measuring devices such as inspiratory temperature sensor,
supply gas transducer and flow transducer and so on.
• O2 Cell/Sensor: The O2 Cell gives an output voltage proportional to the partial
pressure of oxygen inside the inspiratory pipe. The O2 Sensor, which is a measuring
device for the inspired oxygen concentration, is an alternative to the O2 Cell. It
uses ultrasound technique with two ultrasonic transducers/receivers.
• Temperature Sensor: A temperature sensor is integrated into the connector to
measure the gas temperature inside the Inspiratory Section.
Chapter 2. Background
8
Figure 2.3: MAQUET Ventilator Gas Chain
[P: Pressure Sensor; T: Temperature Sensor; ∆P: Gas Flow; FO 2: Oxygen
Concentration Sensor]
• Safety Valve: The safety valve is designed to protect patients from high inspiratory
pressure. It’s under control of software systems.
Expiratory section conveys the expiratory gas from the patient respiratory system to
the expiratory outlet. It comprises:
1. Flowmeter: Measurement of expiratory flow
2. Pressure Sensor: Measurement of expiratory pressure
3. Outlet Valve: Control for the regulation of expiratory gas
During inspiratory phase, oxygen and fresh air would be supplied to the gas modules.
The two gas modules regulate the inlet gas flow and mix the gas under the control
of the software system. Due to the rise of pressure in the gas chain, the mixed fresh
gas would be conveyed into patients’ respiratory system. Hopefully, adequate oxygen
should be delivered and oxygenate the blood. Worth mentioning, the safety valve in
inspiratory section is designed for safety consideration. It protects the patients from
excessive airway pressure.
When it is switched to expiration phase, the gas supply would be cut off and the outlet
valve is open. As the natural elasticity, patients’ lung relaxes and retakes its original
shape so that it will pump out the exchanged air.
Chapter 2. Background
9
It is a periodic process. The gas chain is continuously sensed as a group of pressure,
temperature, and gas flow, including the oxygen concentration, oxygen supply flow, air
supply flow, oxygen supply pressure, air supply pressure, expiratory flow and expiratory
pressure and so on. The difference between the actual measured value of a parameter and
the preset or calculated value feedback to the actuators and results in the adjustment
of gas delivery to achieve the target value.
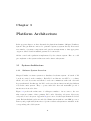
Chapter 3
Platform Architecture
In the previous chapter, we have discussed the physical mechanism of Maquet Ventilator
System. The gas chain is connected to patients’ respiratory system directly. It is sensed
as a number of pressure, temperature and gas flow measurements so that appropriate
oxygen is delivered and meanwhile patients feel comfortable.
All the control and regulation is implemented by the software system. Here we could
give emphasis on the system architecture and software subsystems.
3.1
3.1.1
System Architecture
Software System Overview
Maquet Ventilator software system is a distributed real-time system. A bunch of PC
boards are carried on the ventilator. Each PC board has its own CPU to coordinate
all the on-board electronics and all the boards can communicate with each other and
keep synchronized. In this way, the PC boards carry diverse functions and play different
roles in the entire system. They cooperate with each other and meanwhile get rid of
interferences from each other.
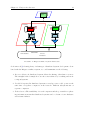
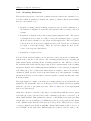
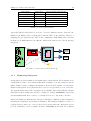
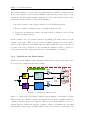
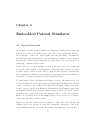
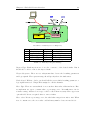
Figure 3.1 profiles the architecture of a Maquet ventilator. As we can see, the ventilator system consists of three primary PC boards: Breathing subsystem, Monitoring
subsystem, Panel subsystem. Appendix A gives a more detailed system main block diagram. Each individual card is an embedded Linux system with its own ARM processor,
memory and peripheral I/O interfaces. Specific software subsystems are installed on the
corresponding embedded system.
11
Chapter 3. Platform Architecture
12
Panel
Breathing
Monitoring
ARM
CPU
ARM
CPU
Control
Monitor
SPI
SPI
FPGA
FPGA
DAC
ADC
ADC
GAS CHAIN:
Valve Actuators
Sensors,
Transducers
Figure 3.1: Maquet Ventilator System Architecture
Coulouris et al.[9] identify plenty of advantages of distributed system development. Combined with the Maquet ventilator system, we could summarize as the following:
1. Resource Sharing A distributed system allows the sharing of hardware resources.
The straightforward example here are the sensors shared by breathing and monitoring subsystems.
2. Parallel Computing In distributed systems, several processes could operate at the
same time on separate computers on the network. Different subsystems run on
separate computers.
3. Fault tolerance The availability of several computers and the potential for replicating information means that distributed systems can be tolerant of some hardware
and software failures.
Chapter 3. Platform Architecture
3.1.2
13
Breathing Subsystem
The Breathing Subsystem controls the ventilation system, which is the ventilation control and regulation, inspiratory channel and expiratory channel. Electronics including
microprocessor handle of [7]:
1. Respiratory timing pattern including respiratory ratio as well as distribution of
the duration for inspiration, pause time and expiration time according to the front
settings.
2. Regulation of inspiratory flow and pressure during inspiration time. The desired
total inspiratory flow value according to front panel settings is used to generate
the flow reference signals for both oxygen and air supply flows. The level relation
between these two flow reference signals depends on the desired O2 concentration
according to front panel setting. These two reference signals are used for the
control of its respective Gas Module.
3. Regulation of expiratory flow.
If we model the medical ventilator as an embedded control system, the breathing subsystem is the controller of the system. The breathing subsystem keeps observing gas
chain characteristics, including all the breathing parameters. The difference between
the actual measured value and the target value would be taken as input of the breathing
subsystem. Besides, the breathing subsystem will listen on some system logic signals as
well, taking the power condition and alarm buzzer as examples. After some advanced
calculation, which depends on the front-panel setting mode and arguments, breathing
subsystem would export some actuator reference signals to regulate the inlet and outlet
flow and pressure.
The input signal set consists of 24 analogue breathing parameters and 24 system logic
signals in total. Meanwhile, there are 4 analogue reference signals and 24 logic signals
which are exported to gas chain electronics. Table 3.1 lists some of the input signals
that we are interested in.
As known to all, micro-controller could only process digital data while the sensors output
some analogue voltage. And it would be time-consuming for the micro-controller to poll
all the ADC channels. This explains the existence of the FPGA between the gas chain
and the microprocessors in Figure 3.1. FPGA is presented to bridge analogue and digital
world. FPGA, rather than the CPU directly, would poll the ADC(analogue-to-digital
converter) channels periodically at 2000 Hz. All the ADC siganls would be stored on
a block RAM. At the same time, FPGA applies the actuator reference value to the
Chapter 3. Platform Architecture
Signal Name
expiratory Pressure
Oxygen Flow
Barometer Pressure
Safety Valve
Buzzer
Disable Valve
Signal Type
ADC signal
ADC signal
ADC signal
Digital Input
Digital Input
Digital Input
14
Subsystem(Mon/Bre/Both)
Both
Both
Both
Both
Mon
Mon
Table 3.1: Sensors and Actuators
valves through the DAC(digital-to-analogue converter) channels. On the other side, the
FPGA block RAM would be synchronised with the CPU on the SPI bus. Instead of
sampling the gas chain directly, CPU would communicate with FPGA and read data
from the block RAM which is very efficient. And it is the same story for the monitoring
subsystem.
Figure 3.2: Sensor an I/O Data Acknowledge
3.1.3
Monitoring Subsystem
As discussed, medical ventilators are highly safety critical system. Even with the most
careful fault avoidance development, faults will eventually occur and result in a system
failure. Fault-tolerance techniques is mandatory in the medical ventilator development.
Fault-tolerant system development should be based on a dependable process. A dependable system architecture is also essential for dependability. Ian Sommerville[10] explains
that such a system architecture should be designed to include redundant components
and mechanisms that allow control to be switched from one component to another.
Laprie[11] classified redundancy into four types: hardware redundancy, time redundancy,
information redundancy and software redundancy. The simplest realization could be a
replicated servers, where two or more servers carry out the same task. Replicated servers
provide redundancy but not usually diversity. Diversity means that the redudant
Chapter 3. Platform Architecture
15
subsystems are of different types, different functionality, thus increaing the chances that
they will not fail in exactly the same fault.
System Enviroment
Sensors
Protection
System
Controller
System
Actuators
Controllled
System
Figure 3.3: Protection System Architecture
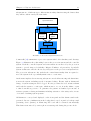
Sommerville [10] summarizes a protection system with both redundancy and diversity.
Figure 3.3 illustrates the relationship between the protection system and the controller
system. Both the controlled system and environment are monitored by the protection
system to provide improved reliability. Maquet Ventilator adopts such a dependable
system architecture and the Monitoring Subsystem is the protection subsystem here.
The protection subsystem only includes the critical functionality that is required to
move the system from a potentially unsafe state to a safe state.
As the name implies, the monitoring subsystem controls all monitoring and alarm functions in the system, including trends of measured values. Events, such as alarms and
change of system settings would be logged. If some problems detected, it issues alarms
and leads the system to a safe state, which means to recover from the failure or just
to shut down and stop service. To guarantee the patient one hundred percent safe, it
activates pressure reducing mechanisms, including activation of the safety valve, in case
of excessive breathing system pressure.
All alarms are conveyed and displayed on the front panel and the alarm sound is also
generated. In case of malfunction in the loudspeaker located on panel, a back-up sound
generating device (buzzer) on Monitoring PC board will be activated automatically.
This buzzer is monitored by a microphone at start-up and during the pre-use check.
Chapter 3. Platform Architecture
16
The buzzer on monitoring card generates the alarm signal in case of +5 V or +3.3
V power failure. The buzzer and +5/+3.3 V failure logic is powered by back-up capacitors in case of power failure.
3.1.4
Panel Subsystem
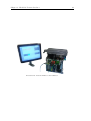
The panel subsystem implements all the user ventilator interaction, as well as software
updating to all subsystems via the PC card interface. User could configure patient
information and technical parameters on the touch screen.
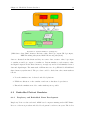
Figure 3.4: Ventilate an Infant
What’s more important, real time breathing parameters could also be displayed on the
panel. During ventilation, measured or calculated values of breathing parameters are
displayed. Besides the breathing parameters, some color-coded waveforms will be shown
on the user interface screen as well. By default, they are:
• Pressure vs Time
• Flow vs Time
• Volume vs Time
Thus, the user could have a straightforward knowledge of the patient’s respiratory condition. Foremost, the warning and alarms will be displayed on the user interface screen.
Chapter 3. Platform Architecture
3.2
17
Interaction and Communication
Distributed systems are more complex than systems that run on a single processor.
There are several important issues that have to be considered in distributed systems
engineering. One of the most significant things is Communication and Interaction. It
includes the inter-subsystem communication and the inner communication between different components in a single subsystem.
Today the principal techniques applied in Maquet ventilator are Serial Peripheral Interface(SPI) and Google Protocol Buffer(GPB).
3.2.1
Serial Peripheral Interface
As illustrated in Section 3.1.2, SPI bus is designed to exchange data between CPU
and FPGA block RAM in both breathing and monitoring subsystems. It is also utilized
between breathing and monitoring subsystems. The SPI bus is short for Serial Peripheral
Interface. It’s a four-wire serial bus and devices work in master/slave mode, where the
bus master always initiate the message transaction. The slaves are allowed by individual
chip select lines.
3.2.2
Google Protocol Buffer
Google protocol buffer is a Language neutral, platform neutral and extensible way of
serializing structured data. Protocol buffers are developed, used and well documented
by Google[12]. It is flexible, efficient and automated, like XML, but smaller, faster and
simpler. Another advantage of protocol buffer is that it supports multiple languages,
Java, C++ and python as well. Protocol buffers are now Google’s lingua franca for data.
They’re used both in Remote Procedure Call(RPC) systems and for persistent storage
of data in a variety of storage systems.
You can specify the your own data structure and details of the information being serialized. Each protocol buffer message is a small logical record of information, containing
a series of name-value pairs. Then you can use special generated source code to easily
write and read your structured data to and from a variety of data streams and using a
variety of languages. There are three steps to define a nice tidy protocol buffer message.
1. Specify Field Types Data in messages is hierarchically structured. Each message
has one or more uniquely numbered fields. Each field has its name and value. Google
protocol buffer supports various value types. It can be numbers, no matter integer
Chapter 3. Platform Architecture
18
or floating point. It can be boolean, strings and raw bytes. What’s more, you can
even encapsulate other protocol buffer message types, which makes it more flexible and
powerful.
2. Assign Unique Tag As mentioned, each field in the message definition has a unique
numbered tag. These tags are used to identify your fields in the message binary format,
and should not be changed once your message type is in use. Note that tags with values
in the range 1 through 15 take one byte to encode, including the identifying number
and the field’s type. Tags in the range 16 through 2047 take two bytes. So you should
reserve the tags 1 through 15 for very frequently occurring message elements. Remember
to leave some room for frequently occurring elements that might be added in the future.
3. Specify Field Rules All the message field should be specified as one of the following[12]:
• required a well-formed message must have exactly one of this field.
• optional a well-formed message can have zero or one of this field (but not more
than one).
• repeated this field can be repeated any number of times (including zero) in a
well-formed message. The order of the repeated values will be preserved.
Today, protocol buffers are applied in Maquet ventilator systems as well. Messages goes
through Ethernet and synchronise different subsystems.
Chapter 4
Software Testing
As a highly safety critical system, it is essential that the applied software is trustworthy.
The European Standard EN 60601-1:2006[13] has define the basic safety requirement
as freedom from unacceptable risk directly caused by physical hazards when medical
electrical equipment is used under normal condition and single fault condition.
The software should be available to provide service when required and should operate
correctly and without undesired risks and hazards[5].
4.1
Dependability and Fault tolerance
The term dependability was proposed by Laprie in 1985[11] to cover the related system
attributes of availability and reliability. As Laprie delivered in his article, achieving
a dependable computing system calls for the combined utilization of fault-avoidance,
fault-tolerance, error-removal, and error-forecasting, where fault-avoidance and
fault-tolerance may be seen as constituting dependability procurement. Fault-tolerance
tightly relates to safety critical systems that should include facilities to handle with
abnormal or anomalous conditions.
All the software system is designed to provide specified service. System dependability is the quality of the delivered service such that reliance can justifiably be placed on
this service. If the system stops delivering the intended service, we call this a failure.
We call the cause of failures fault. A fault causes an error in the internal state of the
system and the error eventually results in the system failure.
Faults can be hardware faults or software faults. Component defect is, of course, a hardware fault. For example, a pressure sensor in the gas chain fails to measure the pressure
correctly. Hardware fault could also be a circuit break. Software fault is commonly
19
Chapter 4. Software Testing
20
caused by code implementation. But a fault can also be the external environment and
disturbances like electromagnetic interference and operator mistakes.
The great diversity of faults makes the evaluation of a fault-tolerant system a definitely complex task. A great deal of studies, taking [14] as an example, have shown
the prominent efficiency of the fault tolerance algorithms and mechanisms(FTAM’s)
on the dependability of abundant systems and architectures. Among the possible approaches such as proving or analytical modelling, fault injection is proven to be more
attractive[15, 16, 17]
The main idea of fault injection is to speed up the occurrence of errors and failures. It
is a method for testing the FTAM’s with respect to their own specific faults, that they
are expected to stand. [18] points out that fault injection addresses both error removal
and error forecasting. With respect to the error removal objectives, fault injection is
explicitly target at reducing, by verification, the presence of faults.
4.2
Formal Testing
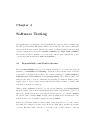
Software testing is, as Myers defines in his book[19], the process of executing a program
with the intent of finding errors. He divides testing before release into four main stages:
module(unit) testing, integration testing, function testing and system testing. Figure
4.1 illustrates the testing cycle structured to model the development cycle.
Testing is first focused on the small individual components of the whole system, starting
from module testing. After verifying the unit functional and interface specification,
developers move to integration testing. As the name implies, integration testing works
to expose the potential defects in the interaction of different modules. Progressively,
larger groups of modules and components could be integrated and tested until systems.
Both module and integration testing is conducted by developers during development
phase.
As indicated in Figure 4.1, function testing is a process of attempting to dig out the
deviations between the application and the external specification. An external specification is a precise description of the system’s behaviour from the point view of the end
user[19]. System testing is the most confusable process. It’s not a process of testing the
functions of the complete system. Instead, system testing is to compare the system to
its original objectives. It’s impossible if there is no set of written, measurable objectives
for the system.
According to Myers’ testing psychology[19],
Chapter 4. Software Testing
21
A programmer should avoid attempting to test his or her own
program.
Professional testers should take over the function and system testing instead of developers themselves. Usually, black-box testing is applied in this stage, because the internal
logic and structure is unconcerned, which means it’s input/output driven strartegy.
Figure 4.1: Development and Testing Processes
After an analysis 15 years of medical device recall data, Wallace points out in his
study[20] that some specific test strategies might have been useful in detecting the
potential faults before the system were released.
Chapter 4. Software Testing
4.3
22
Challenges at Maquet
Today at Maquet, we could classify software testing into two categories: normal condition testing and failure mode testing. Normal condition means condition in which all
means provided for protection against hazards are intact and operations according to
the instructions for use. All the normal mode formal testing has already been automated and it’s proven to be prominently efficient and trustworthy. However, it’s still
difficult to realize test automation under failure mode. Failure mode means that, for
some uncertain faults, the system fails eventually. The software system should somehow
recover from this abnormal and anomalous conditions and continue providing service or
just shut down and stop service, which is safety critical system supposed to do.
Bluntly, tremendous manual testing are ongoing at Maquet in failure mode testing even
today. We can first have a look at an example.
A barometric pressure too low alarm shall be triggered if the measured
barometric pressure is below (650±10) hPa(refer to Appendix B) and the
barometer pressure used internally in the Monitoring Subsystem shall be
limited to 650 hPa if a lower pressure is detected.
In this example, the error is the measured barometric pressure. This could result from
the barometer defect or maybe because of circuit break. As illustrated in Section 3.1,
software system read breathing parameters from the FPGA block RAM and FPGA
polls the sensors and updates the block RAM at a high frequency. Which means that
a single error would be flushed and overwritten in the next sampling cycle. The tight
relation between the software system and the hardware components makes it much more
challenging to inject the expected fault.
Before this thesis, manual job is mandatory to simulate and inject some barometer error.
Testers have to apply a certain voltage that corresponds to the barometric pressure to
the output pin of the barometer. This manual job counts up to 6 times in one single
test case.(refer to AppendixB). This is an obvious obstacle to test automation.
The importance to test automation has been recognised long ago and is undisputed
today. As Derk-Jan de Grood demonstrates in his book[21], manual testing is time
consuming and cost consuming from business concern. What’s worse, manual testing
is error prone. Manual job is always potential fault source and the testing quality
is not guaranteed. Rather than manual testing, automated testing has convinced to
be much more promising. Alongside noticeable efficiency, automated testing has more
controllability and reproducibility.
Chapter 4. Software Testing
23
To summarize, the vast quantity of hardware dependencies becomes the bottleneck of
automated software testing, especially in failure mode. Because manual fault injection
can not replaced by automated implementation today.
Chapter 5
Patient Simulator
During development, subsystems are built and tested on Linux host computers. A simple
simulation model for the ventilators gas-chain reads the actuator values from the CPU by
using the shared memory paradigm and then calculates and returns the sensor values for
each breath moment. Shared memory is utilized for Inter-Process Communication(IPC).
Although the enormous contributions it makes, the simulator on host is far from enough
to be used in system testing.
5.1
Physical Lung Model
5.1.1
Physical Characteristics
Many common diseases of the lung involve alterations in lung mechanics. Being able
to characterize these alterations is thus of great importance. Most research involve the
model based estimation of lung mechanics use two parameters to define how the lung
behaves during respiration. They are the compliance, which is a measurement of the
elasticity of the lung and thorax, and the resistance, which is the amount of pressure
required to deliver a given flow of gas and is expressed in terms of a change in pressure
divided by flow[22].
Compliance
The compliance is a measurement of the elasticity of the lung and the thorax. It’s
volume change as a function of transmural pressure change, or the slope of a volume
pressure curve. In some other articles[23], elastance might be introduced as well, which
is actually the reciprocal of compliance. Elastic recoil is the transmural pressure at a
25
Chapter 5. Patient Simulator
26
special volume. Elastic attractions in the lung strive to discrease the volume of the
lungs, while elastic attractions in the thorax tries to increase it. It’s defined as:
C =
∆V
∆Palv
[
ml
m5
] or [
]
Pa
N
(5.1)
A small compliance relates to stiff lungs and a big value corresponds to flexible lungs.
The compliance of the respiratory system is the compliance of the lung and the chest
together, according to the equation 5.1:
1
1
1
=
+
Ctot
Clung
Cthorax
(5.2)
Figure 5.1: Compliance of the lung and chest1
As shown in Figure 5.1, it’s the relationship between lung and chest compliance, which
is the same as defined in the equation 5.1. Usually, the compliance of the lungs and
the chest are approximately the same and a normal Ctot for adults is about 1 ml/P a.
Neonates have a compliance that is around 1/20 of adults, i.e. rough 0.05 ml/P a,[24] or
about 1 ml/cmH2 O per Kg of body weight.
One thing worth mentioning, as we know, compliance is the slope of the pressure-volume
curve. But when plotting lung-chest wall volume vs. pressure, the curve is not the same
during inflation and deflation. The dependence of a property on past history is termed
hysteresis. As shown in Figure 5.2, the inflation and deflation characteristics of the lung
are not identical. At a given volume the transmural pressure is higher during inflation
and lower during deflation. The faster the volume is changed the greater the difference
1
copyright@ http://www.acbrown.com/lung/Lectures/RsVntl/RsVntlCmpl.htm, available on February 2014
Chapter 5. Patient Simulator
27
in pressure. This behavior is caused predominantly by the surface tension at the gas
liquid interface.
Resistance
The resistance specifies the pressure needed to get a certain gas flow in the airways. As
Ohm’s law tells the relation between the pressure, ∆P , and the gas flow, V̇ :
R =
∆P
V̇
[
Pa · s
N ·s
] or[ 5 ]
l
m
(5.3)
Airway resistance depends on the properties of the given airways, as length, radius,
breaching amend wall structure, but also on the air flow. In a given airway, the gas
flow might be laminar or turbulent. Characteristics that promote turbulence include
high flow rates, tubes that are not long and straight, and fluids with high density or
low viscosity. During turbulent flow, the resistance is parabolic, and the supply pressure
is proportional to the square of the flow, while during laminar flow, the resistance is
proportional to the flow.
The total resistance of the whole respiratory system for adults is about 140-400 P a(l/s),
but values up to 840 are normal. Neonates have a resistance that is about 15 times
higher, i.e. about 6000P a(l/s)[24].
Figure 5.2: Hysteresis in the pressure vs. volume curse2
2
copyright@ http://www.acbrown.com/lung/Lectures/RsVntl/RsVntlCmpl.htm, available on February 2014
Chapter 5. Patient Simulator
5.1.2
28
Lung Model
The forces involved in respiration are mostly elastic and resistive. Depending on the utilization, different models are introduced to describe the human lung. However, a simple
first order RC model is enough for most cases. The model consists of a serial arrangement of a resistance, representing the total airway resistance, R, and resistive tissue
contributions and a compliance C, a measurement for the elasticity of the respiratory
system.[25]
In the first order RC-model, the pressure in the lung is modeled as a linear equation of
the sum the elastic properties of the lung and the resistance of the airway[26].
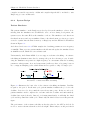
Figure 5.3: Simple RC Model
P = Pel + Pres
(5.4)
where, according to the compliance and resistance definition Equation 5.1, 5.3:
V
Pel =
V
C
⇒ P = R · V̇ +
C
Pres = V̇ · R
(5.5)
In the electrical circuit, the resistance could be compared to an electrical resistance and
the compliance to a capacity, which would be charged and discharged for each respiratory
cycle.
To have a better representation of the respiratory system, the simple RC-model could
be extended to take two lungs into considerations, which would look as shown in the
Figure 5.4. Usually the resistances RL and RR and the capacities CR and CL have the
same value.
The RC model could be extended very easily. For instance, we could extend the model
to a non-linear model to get a better lung behaviour description close to the reality.
A non-linear model can take into consideration that the flow is no more laminar, but
becomes turbulent at some flow speed.
Chapter 5. Patient Simulator
29
Figure 5.4: Extended RC model with two lungs and airways
5.2
5.2.1
Software Patient Simulator
Theory
During development, a simple RC lung model is designed to feasibly testing software
subsystems. The simulator, which tries to simulate a real lung and the gas chain, reads
the actuator values from the software system and then simulates and returns the sensor
values for each breath moment.
Ventilator
CON
MON
PAN
1. Actuator Data
4. Sensor Data
Shared Memory
2. Actuator Data
3. Sensor Data
Patient
Simulator
Figure 5.5: Patient Simulator on Host
Figure 5.5 illustrates the inter-process communication between the ventilation software
system and the patient simulator on host. It’s important to note that the ventilator
software system is compiled for the host computer architecture as well. We will discuss
later that it is a fatal shortcoming of the patient simulator on host.
Chapter 5. Patient Simulator
30
The patient simulator on host runs in parallel with the ventilator software system.
Between the ventilator and the patient simulator, shared memory is introduced to synchronize the gas chain characteristics, including the sensor data and the actuator data,
as introduced in the Chapter 2. The patient simulator
1. Read the actuator control signal calculated by the Breath Subsystem;
2. Execute respiratory simulation step as a simple RC lung model;
3. Update the gas chain sensor value to the shared memory, which is observed by the
ventilator software system.
On the ventilator side, the software system would think of the shared memory as the
ventilator gas chain. Thus, it keeps reading breathing parameters from the shared
memory periodically at a fixed high frequency, which is 2000 Hz, just as the same as
it works on the target. Then the pre-set mechanical ventilation would be executed to
control and monitor the virtual gas chain and controls simulator’s respiration.
5.2.2
Limitations and Shortcomings
Despite the patient simulator makes plentiful contributions in development phase, there
are several severe limitations and shortcomings.
Figure 5.6: Ventilator vs PatSim on Host
Figure 5.6 compares the real ventilator with the patient simulator. In ventilator system,
FPGA bridges the ventilator software system and the gas chain breathing parameters
, which is discussed in previous chapters. When we use patient simulator on host, a
software lung model interacts with the ventilator system. It simulates the gas chain
characteristics. In the place of FPGA, shared memory is presented to synchronize the
Chapter 5. Patient Simulator
31
simulator and the ventilator. Therefore the dash line drawn in Figure 5.6 covers all the
part which has been abstracted in the patient simulator on host.
Attention should be paid to breathing and monitoring subsystems. Part of the breathing
and monitoring is covered by the dash line as well. As mentioned, the ventilator software
system communicates with FPGA via an SPI bus while it reads the breathing parameters
from virtual shared memory on host. Therefore different software interfaces are utilized
for different builds on host and on target. In other words, it’s not the exact same software
code as the release software and the patient simulator is intrusive to the software system.
What’s worse, the critical real timing constraints of the application could not be fulfilled
on host. In host testing, the application code would be compiled for and executed on
host which is an x86 architecture. At the same time plentiful processes and services run
concurrently on host. Unfortunately, RedHat Enterprise Linux, which is the operating
system installed on host, does not support real time scheduling. In other words, there is
no guarantee that all the timing critical processes could be executed before the deadline
expires.
Nevertheless, the application on target would have a definitely different real time behaviour on target. The release application runs on a distributed real-time system and
each subsystem runs on an individual arm architecture system. Namely, breathing subsystem runs on the breathing PC board meanwhile monitoring subsystem runs on the
monitoring PC board. Embedded Linux with Real Time patch is installed on these PC
boards. In additional, the kernel and the root file system is designed and optimized for
the PC board.In other words, real-time properties should be tested on target.
There is one more shortcoming. As discussed in Chapter 4, we are trying to figure
out test automation to test the system fault tolerance. An efficient way is software
implemented fault injection. However, it’s still a nice vision today and it’s not realized.
To sum up, three severe problems confine the patient simulator on host to development
phase. They are:
1. Only partial software code could be tested on host, which means this is an intrusive
patient simulator.
2. It’s a different build of the application. Real timing constraints could not be
fulfilled on host and temporal validity is untestable.
3. Today it’s infeasible to inject faults to test system fault tolerance.
Chapter 6
Embedded Patient Simulator
6.1
System Overview
As discussed previously, Maquet ventilator is a distributed real-time system with tight
hardware dependencies. Real-time means to export the correct result in time. Thus two
aspects should be verified, the output validity and temporal validity. Unfortunately,
the tight relation with the hardware components makes it definitely tough for system
fault-tolerance evaluation and software system testing. This is due to the fact that it is
challenging to simulate hardware fault.
On the other side, a patient simulator on host is introduced based on a simple RC
model. The patient simulator, which simulates a human lung and ventilator gas chain,
reads the actuator values from the CPU by using the shared memory paradigm and
then calculates and returns the sensor values for each breath moment. Nevertheless, it
is infeasible to test all the real-time properties and fault-tolerance.
To put thoughts together, a straightforward solution comes up. The main idea is to port
the patient simulator to an embedded platform which works as a standalone module that
could be connected to the ventilator via a single SPI bus during testing. It reads the
actuator reference value from the FPGA block RAM and feedback simulated sensor data
through SPI communication. Such that, all the hardware dependencies could be removed
and instead, the software system uses the simulated data for control and regulation.
Further on, we can play tricks on the simulated data to invoke desired error so that we
could realize automated software testing.
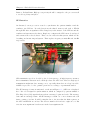
Figure 6.1 profiles the embedded patient simulator outline. The embedded platform
is Raspberry Pi. Two separate processes run concurrently on Raspberry. One is the
patient simulator and the other is the SPI interface. For simplicity, only four type of
33
Chapter 6. Embedded Patient Simulator
34
Figure 6.1: Patient Simulator on Raspberry
[ADC:Sensor data; DAC: Actuator Reference value; DO: logic output; DI: logic input;
BRE: Breathing subsystem; MON: Monitoring subsystem]
data are discussed in this thesis and they are sensor data, actuator value, logic input
of ventilators and logic output of ventilators. Patient simulator reads actuator value
and digital output from the shared memory on raspberry and feedback simulated sensor
data and digital input. The main task of SPI interface is to keep FPGA block RAM and
shared memory synchronized. The procedure could be divided into three main tasks as
follows:
1. Port the simulator into dedicated embedded platform.
2. FPGA modification on the ventilator and remove hardware dependencies
3. Extend the simulation model to make fault injection possible
6.2
6.2.1
Embedded Patient Simulator
Raspberry and Embedded Linux Development
Raspberry Pi is a credit-card sized, ARM based computer running under GNU Linux.
It is one of the most prevalent embedded development board in recent years. The SoC is
Chapter 6. Embedded Patient Simulator
35
a Broadcom BCM2835, containing a ARM6 microprocessor with floating point running
at 700 MHz. The Raspberry Pi is proposed for that considering:
• Numerous and well tested Linux ports
• Proven and open source tool GNU chain
• SPI controller and relevant drivers availability
• Open source, popular and inexpensive hardware
Figure 6.2: Raspberry and SPI cable
Diverse Linux distributions have given support to Raspberry Pi, among which is the Arch
Linux ARM[27]. Arch Linux ARM is a port of Arch Linux, which arms for simplicity
and full control to the end users. Arch Linux ARM provides targeted kernel and root
file systems for ARM based development platforms to use their full potential.
A cross compiler is essential to move the development process from the target platform
to the Linux x86 host. A cross compiler compiles code and produces binaries that run
on a different architecture than where the compiler ran. In Linux, the cross-compiler
is frequently referred to as a tool chain because it is a confederation of tools that work
together to produce an executable: the compiler, assembler, and linker[28]. The tool
chain used in this project is based on the GNU Compiler Collection(GCC) project.
Cross compiling is supported by CMake, which is a cross-platform, open-source make
system[29]. CMake generates native makefiles and workspaces that can be used in the
compiler environment. However, CMake cannot guess the target system itself, so some
CMake variables should be explicitly presented using a tool-chain file. Variables, including CMAKE SYSTEM NAME, CMAKE C COMPILER, CMAKE CXX COMPILER
are mandatory. The first variable is the name of the target system and ”Linux” and
”Windows” are the typical examples. The later two variables point to the C and C++
Chapter 6. Embedded Patient Simulator
36
compiler executable respectively. Additional compiler flags should be modified to suit
Raspberry processor architecture.
6.2.2
System Design
Patient Simulator
The patient simulator on the Raspberry is developed from the simulator on host. Considering that the simulation model shall also serve on host during development, the
system reserve the same IPC as the simulator on host. The simulator read data from
the shared memory and export simulated data to the shared memory. A new process is
created to synchronize the shared memory on Raspberry and the FPGA block RAM as
shown in Figure 6.1.
As delivered in Section 3.1.2, FPGA samples the breathing parameters at a frequency
of 2000 Hz. Thus, a precise patient simulator should run and update the simulated data
at 2000 Hz as well, which is a soft real-time task.
Unfortunately, Arch Linux ARM does not support real time scheduling. A software
scheduling mechanism is introduced to manage the periodic real time process. Considering the simulation step runs at a high frequency, we can assume that the breathing
parameter value(pressure, flow and temperature) will never have a big jump between
two contiguous sampling cycles, which means it is acceptable to skip one single cycle.
Figure 6.3: Software Real Time Scheduling
Figure 6.3 illustrates the basic idea of the software scheduling mechanism. Deadline
is equal to the period. In the first cycle, patient simulator finishes the job before the
deadline. It is forced to sleep until the next release time point. In the second cycle,
patient simulator itself compares the end time with the deadline and unfortunately,
deadline has expired already. Instead of releasing immediately, it will skip the third
cycle and sleep until the fourth cycle. That’s why the third release is at 1500 µs in the
figure.
The performance of the software scheduler is directly related to the CPU work load. It
is close to strict real time when the work load is light. This is why we would prefer Arch
Chapter 6. Embedded Patient Simulator
37
Linux to Debian Linux. High process priority should be assigned to the process as well
to avoid long delays and jitter.
SPI Interface
As discussed, a new process is created to synchronize the patient simulator and the
ventilator via SPI bus. It reads data from the shared memory and send to FPGA
through SPI after encapsulation. Here Raspberry is the master of the SPI bus and the
ventilator subsystems are the slaves. Raspberry configures the SPI bus mode and speed
and activates the selected slaves. There are two slaves in this system, which are the
breathing and monitoring subsystem. Their update frequency is 2000 Hz and 500 Hz
respectively.
Figure 6.4: SPI connection
SPI transmission speed is decided by the clock frequency. A high frequency means a
short transmission duration and could help release the CPU load. However, high speed
transmission might introduce message error, especially when there is a long bus cable.
12M Hz is proven to be the optimal option here according to experimental studies.
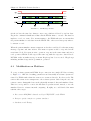
The SPI message format is uniformed, as shown in Figure 6.5. SCK is not displayed
here. It’s a clock signal for synchronization, which is configured by patient simulator.
The Chip Select (CS) signal indicates when a message begins and ends. The message
basic unit is a message frame. All SPI messages contain one or more frames and each
frame consists of 32 bits. It will be simplest due to the fact that the shift registers on
the CPU and FPGA are 32-bits. The bits are numbered from left to right 31 to 0. Bit
31 is the most significant bit whereas 0 is the least significant bit.
Chapter 6. Embedded Patient Simulator
38
Figure 6.5: SPI Message Format
Of the 32 bits, the first byte always comes a tag, which is followed by 24 bits data.
Tag is the command identification that tells the FPGA what to execute. The fisrt bit
implies to read or to write. Zero means writing to the FPGA whereas one means that
the patient simulator reads data from the FPGA. The other seven bits specify what to
be written or read.
When the patient simulator starts a transaction, the slave would feed back a time stamp
message, tag time and time tickers. The master requests would be responded in the
next frame block. If request is write operation, response is the same frame and if it’s
read operation, FPGA would respond the same tag with the respective data followed.
If FPGA sends an unknown tag, it means illegal tag has been received. Illegal tags
including undefined tags and no-permission operation.
6.3
Modification on Platform
To recap, software system and FPGA keeps connection via a single SPI bus, referring
to Figure 3.2. ALL the breathing parameters used internally in software system are
feasted by FPGA rather than the sensors nor actuators directly. In other words, The
sensors and actuators are transparent to the software system. Such being the case, the
software cannot distinguish between the physically measured data and simulated data.
Therefore, it is possible to remove the hardware dependencies and, instead, to use the
simulated data for software internal computing. Roughly, we could divided the main
task into three steps:
1. Disconnect ADC/DAC channels and logic PIN/POUT on the FPGA
2. Design a specific interface to patient simulator
3. Simulation and Testing
Chapter 6. Embedded Patient Simulator
6.3.1
39
Disconnect Hardware Dependencies
As designed, simulated breathing parameters will update the FPGA block RAM. The
ADC channels should be disconnected in case they overwrite the simulated data. Similarly, actuator should be disconnected as well and the patient simulator will observe the
actuator reference value and simulate the gas chain.
6.3.2
Implement Interface to Patient Simulator
The patient simulator would be ported to an embedded system(Section 6.2). It communicates with FPGA on an SPI bus and the simulator is the bus master. Thus, here on
the FPGA, we should design a SPI slave interface for both breathing and monitoring
subsystem. Alongside with the implementation of SPI slave, additional attention should
be paid to memory access permission and arbitrator mechanism.
Memory Access Permission: Massive data are stored in the same block RAM. Access
permission should be assigned to components to protect the memory from illegal operation. Permission can be classified as read or write. In this case, the new interface should
be able to write the breathing parameters and read the actuator reference value.
Memory Arbitrary Mechanism: Multiple access is always accompanied by the problem
of collision avoidance. Protocols, like CAN1 and CSMA/CA2 , are handling of such issues
with shared resources. A special arbitrator is introduced at Maquet to taking care of
the memory access. The arbitrator will deny the memory access request if the bus is
occupied.
6.3.3
Simulation and Testing
To ensure a reliable SPI interface, simulation and testing is mandatory and the most
important consideration is the design and creation of effective simulation system and
test cases.
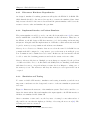
Figure 6.6 illustrates the structure of the simulation system. Test bench controller coordinate the functional modules and stimulates the input signals to the FPGA interfaces.
All these are simulated in Modelsim SE.
Given constraints on time and cost, the key issue of testing becomes what subset of
all possible test cases has the highest probability of detecting the most errors[19]. The
following test cases are executed:
1
2
Controller Area Network
Carrier Sense Multiple Access with Collision Avoidance
Chapter 6. Embedded Patient Simulator
40
Ctrl
TestBenchTestbench
Controller
SW system
SPI
Finctional
Module
RS485
functional
module
Altera FPGA
Patient Simulator
SPI
Finctional
Module
I2C
Functional
Module
Figure 6.6: Testbench
• Patient Simulator writes the ADC channels and software system reads the data
• Software system sets the DAC channels and the Patient Simulator reads data
• Illegal memory access permission testing
After simulation on Modelsim, it should be tested on target and connected to the Raspbery. A simple SPI testing application is designed to write or read arbitrary data through
SPI on the Raspberry side. Python Unit-test is applied to have full control on the test
cases.
6.4
Software Implemented Fault Injection
Fault injection is implemented in a server/client mode as shown in Figure 6.7. The
host Linux is the client computer. The client is a user friendly Python script and fault
injection request could be initiated by a single command line. The server runs on the
Raspberry and it is a thread of the patient simulator process so that the simulator on
host would be capable to inject fault as well. In-between is the Google protocol buffer
which carries the request message.
6.4.1
Client and Request Message
The client is a Python script on host. Fault injection request is encapsulated in a Google
protocol buffer message(Chapter 3.2.2. Table 6.1 lists all the fields of the protocol buffer.
Chapter 6. Embedded Patient Simulator
41
Figure 6.7: Fault Injection on Raspberry
Tag
1
2
3
4
5
Field
Request type
Target Subsystem
Fault Signal
Error Type
Error Value
Rules
Required
Required
Required
Optional
Optional
Options
Inject/Remove
Bre/Mon
Unique Channel Number
Constant/Percent error
Integer
Table 6.1: Fault Inject Request Message
Request Type: Fault injection is to force the occurrence of the desired faults. But it
should also be able to remove the injected fault.
Target Subsystems: There are two subsystems that observe the breathing parameters
and logic signals. The request message should specify where the fault arises.
Faults Signal : With no doubt, you should tell the server which breathing parameter or
logic signal is infected. Unique ID is assigned to all the channels.
Error Type: There are various kinds of error, such as offset value, additional noise. Here
we implement two types: constant value or percentage error. It is sufficient so far for
software testing. Advanced error type could be added when necessary. Error type is an
optional field. It is not required when to remove faults.
Error value: If it is a percentage error, the valid value ranges from -100 to 100. When
it is of constant error, the error value could arbitrary number between 0 and 65535.
Chapter 6. Embedded Patient Simulator
6.4.2
42
Server
The server is the fault injection manager. Four maps are created to manage the faults.
There is a error information map and a data address map for breathing subsystem and
the same for monitoring subsystem.
Error information maps are dynamic maps. They are empty after initiation and items
would be inserted/removed when request is received. The signal unique ID is the key
and it is mapped to a predefined structure including all the essential error information,
including target subsystem, error type and error value.
Data address maps are static maps. They are initiated at beginning. Same as the error
information maps, signal unique ID is the map key. The mapped value is the memory
address which corresponds to the signal.
Figure 6.8: Fault Injection Server
Figure 6.8 highlights the main processes in fault injection. Once a new request is received, the server would parse the message and insert/remove items to/from the error
information maps. In each simulation step cycle, the real handler would query the error
information maps to check if there is any fault injection request. If not, the simulated
data is copied to the shared memory. If yes, go to data address maps, find the corresponding memory address with the same key and modify the data value in the memory
space. This is how we inject faults.
Chapter 6. Embedded Patient Simulator
6.5
43
Summary
The embedded patient simulator consists of two significant processes. One is the simulation model that tries to simulate a human lung and the ventilator gas chain. The
simulator reads actuator value from the shared memory and feedback simulated sensor data. The faults are injected before the simulated data are exported to the shared
memory.
The other process is the SPI interface which synchronizes the shared memory and the
FPGA block RAM. Only four types of data are discussed in the thesis for simplicity. The
SPI interface process communicates with both breathing and monitoring subsystem.
Comparing the release ventilator and testing setup, as shown in Figure 6.9, the sole
difference is that the gas chain is replaced by the embedded patient simulator. As we
discussed, the gas chain is transparent to the software system so that we say this is nonintrusive patient simulator. The embedded patient simulator interacts with the software
system on target so that all the real-time properties could be tested. What’s more, fault
injection is implemented and all the simulated data could invoke error.
To sum up, the embedded patient simulator has removed the hardware dependencies
and all the hardware fault could be simulated and injected in a software way.
Figure 6.9: Embedded Patient Simulator v.s. Ventilator
Chapter 6. Embedded Patient Simulator
Figure 6.10: Patient Simulator and Ventilator
44
Chapter 7
Experiment and Conclusion
7.1
Integrate with AVA
AVA is a test framework that simplifies and unifies the procedure of writing advanced
system and subsystem tests. The purpose of AVA is to allow for automated regression
testing, reduce maintenance work, and to help test writers to understand each other’s
test code.
AVA is written in Python and runs primarily on Linux systems, mainly because the
original test targets (BRE/MON/PAN) are built as Linux ELF binaries. AVA uses the
Python unit-test framework for its test cases. The unit-test framework gives deep control
of the test flow, and provides functions for separating test methods, setup code before
each test method, tear-down code after each test method, pre-test setup code, etcetera.
A test case is a collection of test methods needed to test a specific requirement. The
test method setup is predefined in unit-test and is used to test various aspects of for
example a requirement. A test case may contain one or several test methods. When
a test case is executed, AVA will run all test methods defined in the test case, gather
statistics and present a result for the test case.
7.2
Experiment Setup
Figure 7.1 highlights the connections between different parts of the test system. The
host, the embedded patient simulator and the ventilator are all on the Ethernet. Meanwhile, the patient simulator can communicate with the breathing and monitoring subsystems via a single SPI bus. Testers could start test cases on the host and the AVA
system would take care of the test methods.
45
Chapter 7. Experiment and Conclusion
46
AVA Framework
& TestCases
Mon
LAN
PatSim
SPI
PAN
MemSPI
Bre
LAN
Figure 7.1: Experiment Setup
7.3
Experiment and Evaluation
Here we will compare the difference between manual testing and automated testing. The
example is to verify the barometric pressure alarm.
7.3.1
Example Test Case
To verify that a barometric pressure too low(BARO P RESS T OO LOW ) alarm shall
be triggered if the measured barometric pressure is below (650±10) hP a and that a
barometric pressure too high(BARO P RESS T OO HIGH) alarm shall be triggered
if the measured barometric pressure is higher than (1070±10) hP a and if the alarm is
activated, the barometer pressure used internally in the Monitoring Subsystem shall be
limited to 650/1070 hP a if a lower/higher pressure is detected. It also verifies that the
alarm has the correct error code.
7.3.2
Manual Testing vs Automated Testing
In conventional testing stage, manual manoeuvres is required due to the hardware dependencies. The test case of the BARO P RESS T OO LOW alarm is listed as follows:
1. Simulate a barometric pressure of 660 hP a(Apply a voltage that corresponds to a
barometric pressure of 660 hP a at a specified pin);
2. Verify that no error message is activated regarding barometric pressure;
Chapter 7. Experiment and Conclusion
47
3. Simulate a barometric pressure of 640 hP a and verify that a technical ”Barometric
sensor error” alarm with high priority and correct code is activated;
4. Verify that the barometer pressure used internally in the Monitoring Subsystem is
limited to 650 hP a if a lower pressure is detected;
5. Simulate a barometer pressure above 660 hP a and verify that the alarm is still
active.
6. Restart the system and verify that the alarm is deactivated.
As we can see, testers need to apply a certain voltage to simulate the barometer error
at Step 1 and 3. The manual job is of low efficiency and it is error prone.
The presence of embedded patient simulator resolves the hardware dependencies and it
could simulate gas chain. To test under failure mode, faults could be injected from the
host side. Here we will give the pseudo code instead of the entire Python unittest case.
{//AVA Setup Method
//Set up the Patient Simulator
StartPatientSimulator(); //SSH command
ConfigurePatientSimulator(); //Protocol Buffer Message
StartSPIInterface(); //SSH command
//StartVentilator
StartSoftwareSystem(); // SSH command
ConfigurePatientCategory(); // Squish
ConfigureVentilationMode(); // Squish
StartVentilation();
// Squish
}
{//Unit Test Case
//Play Magic Here
//Correspond to Step 1 and 2 in Manual Testing
InjectFault(Barometer,660hPa); // Protocol Buffer Message
assertfalse(BarometerError); // AVA_API
//Step 3 in Manual Testing
InjectFault(Barometer,640hPa);
assertTrue(BarometerError);
assertTrue(BarometerPressureTooLow);
//Step 4 in Manual Testing
CheckInternalBarometerValue(); //AVA API
Chapter 7. Experiment and Conclusion
48
//Step 5 in Manual Testing
InjectFault(Barometer,660hPa);
assertTrue(BarometerError);
assertTrue(BarometerPressureTooLow);
//Step 6 in Manual Testing
RebootVentilator(); // SSH command
assertfalse(BarometerError);
}
{//AVA teardown method
RemoveAllFaults(); //Protocol Buffer
}
7.4
Comparison and Conclusion
In conventional testing, manual manoeuvres is mandatory due to the tight hardware
dependencies. If there is only a small number of test cases, manual testing is acceptable.
It requires little time and expense to begin productive manual testing and short term
costs are reduced.
However, manual testing could be very time consuming when there are plentiful test
cases. Here we just give one single test case. However, it is only the tip of the iceberg and
there are a vast amount of test cases which require manual manoeuvres. Considering the
fact that you must rerun the same set of test cases for each single release, it is tiresome.
What’s worse, it is error prone. Taking the first step as an example, the integrated
circuit is of great complexity and the pins are intensively crowded together. Testers
might apply the voltage to a wrong pin. Various faults might be introduced by manual
job. Therefore, the quality of manual testing is not guaranteed.
The presence of the embedded patient simulator makes test automation possible, which
is a momentous step for verification methodologies at Maquet.
The embedded patient simulator works as a standalone module during software testing.
the gas chain dependency is removed and instead, the simulator is interfaced with the
ventilator. The simulator reads the actuator reference values and returns sensor value
for each breath moment. The ventilator software system runs on target which means
that all the real-time properties of the distributed real-time system could be tested.
Chapter 7. Experiment and Conclusion
49
Furthermore, hardware faults could be simulated and injected on the patient simulator,
which is transparent to the software system. Thus, it is of non-intrusive implementation.
Last but not the least, test scripts using the embedded patient simulator could be
integrated with AVA framework, which is aimed for automated regression testing. In
other words, it is promising to realise entirely automated testing in the near future.
Chapter 8
Future Work
As we conclude in Chapter 7, the embedded patient simulator, which is presented in
this thesis, resolves the tight hardware dependencies and realises software-implemented
fault injection. This is a non-intrusive patient simulator and all the real-time properties
could be tested on target. It is a significant step to test automation. However, there are
several aspects need further studies or to be improved in the future work.
• Advanced Lung Model and Patient Simulator The lung model used here is a simple
RC model. As discussed in Section 5.1, the simple RC model could be extended
to a non-linear model to get a better lung behaviour description to the reality.
What’s more, weak breathe attempts could be added as new features.
• High Performance Embedded Hardware Considering the fact that Arch Linux Arm
does not support real time scheduling, a software scheduling method is introduced.
However, the implementation is not strict real-time and the performance is affected
by the CPU work load. A more powerful embedded hardware is essential to satisfy
the timing constraints. If possible, real time patch is appreciated for the embedded
Linux.
• Test Scripts Design and Maintenance Proficiency is required to design and debug
the automated test scripts. If any error present in the test scripts, it may lead to
deadly consequences.
51
Appendix A
SERVO-i Diagram
See next page.1
1
Diagram Source: ref. [8] User Manual SERVO-i VENTILATOR SYSTEM V6
53
Appendix B
Example Test Case
Barometer Pressure too Low/High Alarm
Application Lifecycle Management Test ID:8601
Purpose
To verify that a Baro Press Too Low(with high priority, mutable and latchable) alarm
shall be triggered if the measured barometric pressure is below (650±10) hP a and that a
Baro Press Too High(with high priority, mutable and latchable) alarm shall be triggered
if the measured barometric pressure is higher than (1070±10) hP a and the barometer
pressure used internally in the Monitoring Subsystem shall be limited to 650/1070hP a
if a lower/higher pressure is detected. It also verifies that the alarm has the correct error
code.
Also to test that the Baro Press Too Low and Baro Press Too High alarm shall be deactivated at restart only and that the barometer pressure is updated every third second.
The purpose is also to test that the Barometric Pressure used for calibration or linearization shall not be outside the range (650-1070) mbar. If a value outside this range
is measured, the limit shall be used in calculations.
Test Design
For one optional patient category and ventilation mode do the following:
55
Chapter 8. Future Work
56
1. Simulate a barometric pressure of 660 hP a(Apply a voltage that corresponds to a
barometric pressure of 660 hP a between point R102/C44 and ground).
2. Verify that no error message is activated regarding low barometric pressure.
3. Simulate a barometric pressure above 660 hP a and verify that the barometer
pressure is updated at least every third second.
4. Simulate a barometric pressure of 640 hP a and verify that a Technical ”Barometric
sensor error” alarm with high priority and correct error code is activated.
5. Verify that the barometric pressure used internally in the monitoring system is
limited to 650 hP a if a lower pressure is detected.
6. Simulate a barometer above 660 hP a and verify that the alarm is still active.
7. Press mute button and verify that the alarm is mutable
8. Restart system and verify that the alarm is deactivated.
9. Simulate a barometric pressure of 1070 hP a and verify that no error message is
activated regarding high barometric pressure.
10. Simulate that a barometric pressure of 1070 hP a and verify that a technical
”Barometer sensor error” alarm with high priority and correct error code is activated.
11. Verify that the barometric pressure used internally in the Monitoring Subsystem
is limited to 1070 hP a if a higher pressure is detected.
12. Simulate a barometric pressure and verify that the alarm is still active.
13. Press mute button and verify that the alarm is mutable.
14. Restart the system and verify that the alarm is deactivated.
15. Start ventilating in adult patient category in VC mode(with high Tidal Volume)
16. Simulate a barometric pressure of 650 hP a and document the value of Inspiratory
Tidal Volume(V T i).
17. Adjust the voltage to simulate a barometer pressure below 650 hP a and verify
that the V T i is not changed(the same value as in step 16).
18. Restart the ventilator to deactivate the alarm.
19. Simulate a barometric pressure of 1070 hP a and document the value of V T i.
20. Adjust the voltage to simulate a barometer pressure above 1070 hP a and verify
that the V T i is not changed(the same value as in step 19).
Bibliography
[1] Yasser Sakr and Jean Louis Vincent. The importance of acute respiratory failure
in the icu. In Mechanical Ventilation, pages 3–10. Springer, 2005.
[2] Andres Esteban, Antonio Anzueto, Inmaculada Alia, Federico Gordo, Carlos
Apezteguia, Fernando Palizas, David Cide, Rosanne Goldwaser, Luis
Soto, Guillermo Bugedo, et al. How is mechanical ventilation employed in the intensive care unit? an international utilization review. American Journal of Respiratory
and Critical Care Medicine, 161(5):1450–1458, 2000.
[3] Andrés Esteban, Antonio Anzueto, Fernando Frutos, Inmaculada Alı́a,
Laurent Brochard, Thomas E Stewart, Salvador Benito, Scott K Epstein, Carlos
Apezteguı́a, Peter Nightingale, et al. Characteristics and outcomes in adult patients
receiving mechanical ventilation. JAMA: the journal of the American Medical Association, 287(3):345–355, 2002.
[4] Medical devices - quality management systems requirements for regulatory purposes
(iso13485:2003), May 2011.
[5] Medical devices – application of risk management to medical devices
(iso 14971:2007), November 2010.
[6] Michael Nurok and George P. Topulos. Respiratory physiology. In Philip M. Hartigan, editor, Practical Handbook of Thoracic Anesthesia, pages 17–40. Springer
Science Business Media, 2012.
[7] Servo-i Ventilator System Service Manual. Maquet Critical Care, Solna, Sweden,
2004.
[8] User Manual SERVO-i VENTILATOR SYSTEM V6. Maquet Critical Care, Solna,
Sweden, 2011.
[9] George F Coulouris. Distributed Systems: Concepts and Design, 4 Edition. Pearson
Education India, 2009.
[10] Ian Sommerville. Software Engineering 9th Edition. Addison Wesley.
57
Bibliography
58
[11] Jean-Claude Laprie.
Dependable computing and fault tolerance :
Concepts
and terminology. In Fault-Tolerant Computing, 1995, Highlights from TwentyFive Years., Twenty-Fifth International Symposium on, pages 2–, 1995.
doi:
10.1109/FTCSH.1995.532603.
[12] Google Developers. Developer Guide Protocol Buffers — Google Developers, January 2014.
URL https://developers.google.com/protocol-buffers/docs/
overview.
[13] International Electrotechnical Commission et al. Iec 60601-1: Medical electrical
equipment — part 1: General requirements for basic safety and essential performance, 2005.
[14] W. G. Bouricius, W. C. Carter, and P. R. Schneider. Reliability modeling techniques for self-repairing computer systems. In Proceedings of the 1969 24th National Conference, ACM ’69, pages 295–309, New York, NY, USA, 1969. ACM. doi:
10.1145/800195.805940. URL http://doi.acm.org/10.1145/800195.805940.
[15] U. Gunneflo, J. Karlsson, and J. Torin. Evaluation of error detection schemes using
fault injection by heavy-ion radiation. In Fault-Tolerant Computing, 1989. FTCS19. Digest of Papers., Nineteenth International Symposium on, pages 340–347, 1989.
doi: 10.1109/FTCS.1989.105590.
[16] D. Avresky, J. Arlat, J.-C. Laprie, and Y. Crouzet. Fault injection for the formal
testing of fault tolerance. In Fault-Tolerant Computing, 1992. FTCS-22. Digest of
Papers., Twenty-Second International Symposium on, pages 345–354, 1992. doi:
10.1109/FTCS.1992.243566.
[17] G.A. Kanawati, N.A. Kanawati, and J.A. Abraham. Ferrari: a tool for the validation of system dependability properties. In Fault-Tolerant Computing, 1992.
FTCS-22. Digest of Papers., Twenty-Second International Symposium on, pages
336–344, 1992. doi: 10.1109/FTCS.1992.243567.
[18] Jean Arlat, Alain Costes, Yves Crouzet, Jean-Claude Laprie, and David Powell.
Fault injection and dependability evaluation of fault-tolerant systems. Computers,
IEEE Transactions on, 42(8):913–923, 1993.
[19] Glenford J Myers, Corey Sandler, and Tom Badgett. The Art of Software Testing.
John Wiley & Sons, 2011.
[20] Dolores R Wallace and D Richard Kuhn. Failure modes in medical device software:
an analysis of 15 years of recall data. International Journal of Reliability, Quality
and Safety Engineering, 8(04):351–371, 2001.
Bibliography
59
[21] Derk-Jan de Grood. Test automation. In TestGoal, pages 277–292. Springer Berlin
Heidelberg, 2008. ISBN 978-3-540-78828-7. doi: 10.1007/978-3-540-78829-4 16.
URL http://dx.doi.org/10.1007/978-3-540-78829-4_16.
[22] ML Crosfill and JG Widdicombe. Physical characteristics of the chest and lungs and
the work of breathing in different mammalian species. The Journal of physiology,
158(1):1–14, 1961.
[23] Jason H. T. Bates. Lung Mechanics: An Inverse Modeling Approach. Cambridge
University Press, 2009.
[24] Andrew B. Lumb. Nunn’s Applied Respiratory Physiology. Butterworth Heinemann,
6th edition, 2005.
[25] C Schranz, C Knöbel, and K Möller. Parameter identification in models of respiratory mechanics–a hierarchical approach. In 5th European Conference of the
International Federation for Medical and Biological Engineering 14-18 September
2011, Budapest, Hungary, volume 5, pages 291–294. Springer, 2011.
[26] David Valas. A device for accurate tidal volume measurement. Master’s thesis,
Royal Institute of Technology, Stockholm, Sweden, 2007.
[27] Arch Linux for Raspberry Pi, Jan 2014.
URL http://archlinuxarm.org/
platforms/armv6/raspberry-pi.
[28] Gene Sally. Pro Linux Embedded Systems. Paul Manning, 2010.
[29] CMake Cross Compiling, February 2014.
CMake_Cross_Compiling.
URL http://www.cmake.org/Wiki/