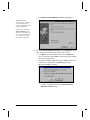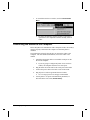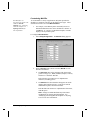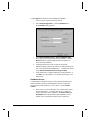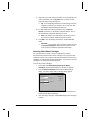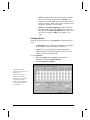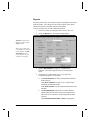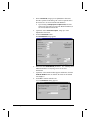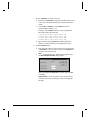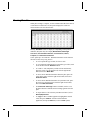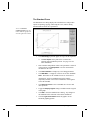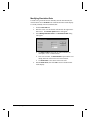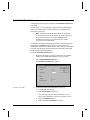
1
BIO-TEK ® KC junior User’s Guide User's Guide to KCjunior TM October 2002 Copyright 2002 PN 5271000 Revision E Bio-Tek Instruments, Inc. . Notices BIO-TEK INSTRUMENTS, INC. Highland Park, Box 998 Winooski, Vermont 05404-0998 USA Customer Service & Sales: Phone: Fax: E-Mail: Internet: (888) 451-5171 (toll free in the U.S.) (802) 655-4040 (outside the U.S.) (802) 655-7941 [email protected] http://www.biotek.com Service/Technical Assistance Center (TAC): Phone: Fax: E-Mail: (800) 242-4685 (toll free in the U.S.) (802) 655-4740 (outside the U.S.) (802) 655-3399 [email protected] European Coordination Center Bio-Tek® Instruments GmbH Kocherwaldstr. 34 D-74177 Bad Friedrichshall Germany Phone: Fax: E-Mail: All Rights Reserved +49 (0) 7136-9680 +49 (0) 7136-968-111 [email protected] Copyright © 2002, Bio-Tek® Instruments, Incorporated. This publication is protected by copyright and all rights are reserved. No part of this manual may be reproduced or transmitted in any form, or by any means electronic or mechanical, including photocopying and recording, for any purpose other than the purchaser’s personal use without written permission of Bio-Tek® Instruments, Inc. Printed in the United States of America. Bio-Tek Part Number 5271000. Trademarks Bio-Tek® is a registered trademark, and KCjunior™, KCJr™, and OMNI™, are trademarks of Bio-Tek Instruments, Inc. All other trademarks are the property of their respective holders. Restrictions and Liabilities Information in this document is subject to change, and does not represent a commitment by Bio-Tek Instruments, Inc. Changes made to the information in this document will be incorporated in new editions of the publication. No responsibility is assumed by Bio-Tek for the use or reliability of software or equipment that is not supplied by Bio-Tek, or its affiliated dealers. Limited Software Warranty Bio-Tek Instruments, Inc. (“Bio-Tek”) warrants, for a period of ninety (90) days after the date of delivery, that all software manufactured and sold by Bio-Tek (the “Software”) will conform, as to all substantial operational features, to Bio-Tek’s then current published specifications (meaning those specifications in effect as of the date of purchase) and will be free of defects which, in Bio-Tek’s sole judgment, substantially affect system performance. This Warranty is limited to the original purchaser (the “Purchaser”) and cannot be assigned or transferred. All claims under this Limited Warranty must be made in writing or fax to Bio-Tek attention: Service Department. The Purchaser must notify Bio-Tek in writing within ninety (90) days after the date of delivery of the Software to the Purchaser of any claim under this Limited Warranty. This 90 day period shall not be extended by the delivery or receipt of any subsequent modifications to the Software. Modifications to Software within a version (“Updates”) are expressly excluded from the terms of this Warranty. If the Software is found to be defective by Bio-Tek, Bio-Tek’s sole obligation under this Warranty is to use efforts consistent with Bio-Tek’s regular business practices to attempt to remedy such defect. In no event shall Bio-Tek’s liability under this warranty exceed the original purchase price of the Software. This is a limited warranty. This warranty contains the entire obligation of Bio-Tek. No other warranties, express, implied, or statutory, are given. The implied warranties of merchantability and of fitness for any particular purpose are expressly excluded and do not apply to the software. Under no circumstances shall Bio-Tek be liable to the purchaser or any other person for any direct, incidental, or consequential damages, whether arising out of breach of warranty or otherwise. This warranty shall not be changed or modified in any way without the express written permission of an officer of Bio-Tek Instruments, Inc. This Warranty shall be NULL AND VOID if any modifications are made to the Software by the Purchaser. Correction of difficulties or defects traceable to Purchaser’s errors or system changes shall be billed to Purchaser at Bio-Tek’s standard time and materials charge. Licensing Agreement LICENSE: Single Use: You have the non-exclusive right to use the enclosed programs. These programs can only be used by a single user. You may transfer the programs from one computer to another provided that the programs are used with only one computer at a time. You may not electronically transfer the programs from one computer to another. You may not distribute copies of the programs or documentation without the prior written consent of Bio-Tek Instruments, Inc., or as stipulated in a sub-licensing agreement. Network Use: You have the non-exclusive right to use the enclosed programs. These programs can only be used on a single file server. The number of concurrent users on the network at any time may not exceed the number of licensed copies of this software. You may transfer the programs from one server to another provided that the programs are used with only one server at a time. You may not distribute copies of the programs or documentation without the prior written consent of Bio-Tek Instruments, Inc., or as stipulated in a sub-licensing agreement. You may not use, copy, modify, loan, lease or transfer the programs or documentation, or any copy except as expressly provided in this Agreement. COPYRIGHT: The programs and the documentation are copyrighted. You may not copy any program or the documentation except as for loading the program into the computer/server as part of executing that program and for back-up purposes, respectively. You must reproduce and include the copyright notice on the back-up copy TERMS: This license is effective until terminated. You may terminate it by destroying the programs and documentation and all copies thereof. This license will also terminate if you fail to comply with any term or condition of this Agreement. You agree upon such termination to destroy all copies of the programs and documentation. Document Revision Rev / Date Changes A / April, 1998 First Issue. B / May, 1999 Updated Defining General Information to include precision and scientific notation. Updated System Requirements to include the Macintosh. Enhanced requirements for operating system and display resolution. Updated Defining Protocols, Read Method Parameters to include pathlength correction and spectral scanning. Updated Defining Protocols, Reports to include information on the new Curve Report. Updated Reading Plates to include collecting data from the EL301 reader. Added Appendix A, Sample Reports. C / December, 1999 Added support throughout for fluorescence/ luminescence readers. Updated Defining Protocols, Reports to discuss enhanced Matrix Reports. Added new sample reports to Appendix A. D / January, 2001 Updated Installing the Software to introduce a new method for password distribution and software registration. Updated Setting Up the System to introduce dualreader support and the option to pre-configure Filter Wheel Cartridges for the FLx800. Updated Defining Protocols to introduce new features including: partial plate reading, well monitoring, continuous shaking for kinetic reads, reader calibration for spectral scan reads, filter wheel cartridge selection, the DILution function, and some new reporting options. Updated Reading Plates to discuss the new Results ID, using the reader’s barcode scanner to retrieve the Plate ID, and selecting a filter wheel cartridge at run-time. Updated Interpreting Results to include selection of the Maximum Slope Unit of Measure. Added new sample reports to Appendix A. E / October, 2002 Updated Installing the Software with the correct website address for software registration. Updated Setting Up the System to include filter position requirements for Dispense / Read protocols. Updated Defining Protocols to introduce new Read Mode selections, as well as the new Dispense / Read method type for the FLx800. Updated Interpreting Results to describe Dispense / Read results. Updated Utilities to describe the new Dispenser Control Panel feature for the FLx800. Contents Introduction 1-1 KCjunior................................................................................................................................. 1-1 Technical Support .................................................................................................................. 1-3 Visiting Bio-Tek’s Website...................................................................................... 1-4 Installing the Software 2-1 Read Me!................................................................................................................................ 2-1 System Requirements ............................................................................................................. 2-2 Removing an Earlier Version of KCjunior ............................................................................. 2-3 To remove KCjunior:............................................................................................... 2-3 Software Installation............................................................................................................... 2-5 To Install KCjunior:................................................................................................. 2-5 To Start KCjunior: ................................................................................................. 2-12 Where to go from here ......................................................................................................... 2-15 Password Distribution and Software Registration ................................................................ 2-16 Obtaining a password and registering the software online ..................................... 2-17 Obtaining a password if you do not have Internet access....................................... 2-17 Registering the software if you do not have Internet access................................... 2-17 Getting Started 3-1 KCjunior’s Menu Structure .................................................................................................... 3-1 Toolbar..................................................................................................................... 3-2 Results Menu ........................................................................................................... 3-3 Protocol Menu.......................................................................................................... 3-4 Utilities Menu .......................................................................................................... 3-5 Setup Menu .............................................................................................................. 3-6 Current Reader Menu............................................................................................... 3-6 View Menu............................................................................................................... 3-7 Help Menu ............................................................................................................... 3-7 Essential Information ............................................................................................................. 3-9 Protocol Definition................................................................................................... 3-9 Plate Data Acquisition ............................................................................................. 3-9 Data Reduction and Analysis ................................................................................. 3-10 Quick Start ........................................................................................................................... 3-11 Guided Tour ......................................................................................................................... 3-12 User's Guide to KCjunior Contents • i Setting Up the System 4-1 Reader Support....................................................................................................................... 4-1 Dual-Reader Support................................................................................................ 4-1 Connecting the Reader to the Computer................................................................................. 4-2 Reader Setup .......................................................................................................................... 4-3 System Configuration ............................................................................................................. 4-5 Well Identifiers ........................................................................................................ 4-5 Reporting Options .................................................................................................... 4-7 General Default Information .................................................................................... 4-8 Pathnames ................................................................................................................ 4-9 Filter Wheel Cartridges .......................................................................................... 4-11 Defining Protocols 5-1 Overview ................................................................................................................................ 5-1 Working with Protocols.......................................................................................................... 5-2 Where are Protocols Stored?.................................................................................... 5-2 Opening an Existing Protocol .................................................................................. 5-2 Creating a New Protocol .......................................................................................... 5-3 Modifying Protocols................................................................................................. 5-4 Saving and Closing Protocols .................................................................................. 5-4 Copying Protocols.................................................................................................... 5-5 Sharing Protocols and Databases ............................................................................. 5-5 Importing Protocols.................................................................................................. 5-6 Defining Protocol Parameters................................................................................................. 5-8 Defining General Information .................................................................................. 5-8 Read Method Parameters ....................................................................................... 5-10 Templates............................................................................................................... 5-38 Curves .................................................................................................................... 5-55 Cutoffs.................................................................................................................... 5-58 Reports ................................................................................................................... 5-61 Reading Plates 6-1 Overview ................................................................................................................................ 6-1 Working With Plates and Results ........................................................................................... 6-2 Where is Plate Data Stored?..................................................................................... 6-2 Opening an Existing Results Record ........................................................................ 6-2 Generating a New Set of Plate Data ......................................................................... 6-3 Saving and Closing Results Records ........................................................................ 6-4 Copying an Existing Results Record ........................................................................ 6-4 Sharing Results Records and Databases................................................................... 6-5 Importing Results ..................................................................................................... 6-6 ii • Contents User's Guide to KCjunior Reading a Plate....................................................................................................................... 6-7 Reading a Plate Without a Protocol ......................................................................... 6-7 Reading a Plate With a Protocol ............................................................................ 6-10 Simulating a Plate Read ......................................................................................... 6-12 Reading Plate Data from a File .............................................................................. 6-13 Collecting Data from an EL301 Microstrip Reader ............................................... 6-14 Reader Runtime Errors........................................................................................... 6-16 Comments/Warnings.............................................................................................. 6-16 Selecting a Filter Wheel Cartridge ......................................................................... 6-17 Exporting Data ....................................................................................................... 6-18 Viewing Results ................................................................................................................... 6-24 Interpreting Results 7-1 Overview ................................................................................................................................ 7-1 Well Notations ....................................................................................................................... 7-2 Raw Data................................................................................................................................ 7-4 Raw Endpoint Read Data ......................................................................................... 7-4 Raw and Blanked Kinetic Read Data ....................................................................... 7-5 Raw and Blanked Spectral Data............................................................................... 7-9 Raw MultiWavelength Read Data.......................................................................... 7-13 Raw Dispense / Read Data..................................................................................... 7-14 Blanked Data........................................................................................................................ 7-16 Blanked Endpoint Read Data................................................................................. 7-16 Blanked MultiWavelength Data............................................................................. 7-17 Pathlength Correction........................................................................................................... 7-17 Transformation Results ........................................................................................................ 7-19 Concentrations...................................................................................................................... 7-20 The Standard Curve ............................................................................................... 7-21 Titer Curves ........................................................................................................... 7-22 Interacting with the Graph...................................................................................... 7-24 Printing and Copying the Graph............................................................................. 7-25 Editing the Standard Curve .................................................................................... 7-25 Storing the Standard Curve .................................................................................... 7-26 Labels ................................................................................................................................... 7-27 Template............................................................................................................................... 7-28 Plate Formula Results........................................................................................................... 7-29 Statistics ............................................................................................................................... 7-30 Auto Sensitivity Results ....................................................................................................... 7-32 Automatic Sensitivity Adjustment Process ............................................................ 7-33 Results Options .................................................................................................................... 7-34 Plate Information ................................................................................................... 7-34 Well Information.................................................................................................... 7-36 Masking Wells ....................................................................................................... 7-37 Modifying Simulation Data.................................................................................... 7-38 User's Guide to KCjunior Contents • iii Printing Reports 8-1 Reports ................................................................................................................................... 8-1 Print Preview............................................................................................................ 8-1 Print Results ............................................................................................................. 8-2 Print Setup................................................................................................................ 8-3 Utilities 9-1 Overview ................................................................................................................................ 9-1 Incubation Control.................................................................................................................. 9-2 Carrier Out/In ......................................................................................................................... 9-4 Dispenser Control Panel ......................................................................................................... 9-5 Initializing the Dispenser ......................................................................................... 9-5 Priming the Fluid Lines............................................................................................ 9-6 Purging the Fluid Lines ............................................................................................ 9-6 Setting the Injector Position ..................................................................................... 9-6 Syringe Setup ........................................................................................................... 9-7 Diagnostics ............................................................................................................................. 9-8 Reader System Test.................................................................................................. 9-8 Universal Plate Test ............................................................................................... 9-10 Database Maintenance.......................................................................................................... 9-14 A Note on Backup Procedures ............................................................................... 9-14 Creating Archive Databases ................................................................................... 9-15 Archiving Results Records and Protocols .............................................................. 9-15 Archiving Stored Curves ........................................................................................ 9-17 Archiving Test Results ........................................................................................... 9-18 Deleting Results Records and Protocols ................................................................ 9-19 Deleting Stored Curves .......................................................................................... 9-20 Deleting Stored Transformations ........................................................................... 9-21 Deleting Test Results ............................................................................................. 9-22 Troubleshooting 10-1 Overview .............................................................................................................................. 10-1 Reader Errors ....................................................................................................................... 10-2 Communication Errors ......................................................................................................... 10-2 Comments and Warnings...................................................................................................... 10-4 Appendix A, Sample Reports 11-1 Glossary 12-1 Index 13-1 iv • Contents User's Guide to KCjunior Introduction KCjunior KCjunior interacts with and performs data analysis for select microplate readers. With KCjunior you can: User's Guide to KCjunior • Configure the software to communicate with two Bio-Tek readers, and switch easily between them. • Retrieve optical density, fluorescence, or luminescence data from a wide variety of Bio-Tek’s microplate readers. • Perform Endpoint, Kinetic, MultiWavelength, and Spectral Scan reads, as well as Dispense/Read sequences. MultiWavelength, Spectral Scan, and Dispense/Read capabilities are readerdependent. • Perform Fluorescence and Luminescence reads with Bio-Tek’s FLx800. • Create protocols that contain instructions for the operation of the attached microplate reader, and for analyzing data retrieved from the reader. • Display, print, export, save, and archive results. • Export plate data to a file, or directly to a Microsoft Excel spreadsheet. • Share protocol and results databases among multiple KCjunior users. • Define two levels of formulas to manipulate raw or blanked data. • Collect data from Bio-Tek’s automated microplate readers in the standard 8x12 format, as well as in 2x3, 3x4, 4x6, 6x8, 6x10(T), 6x12(T), 8x12(T), 8x12(H), 8x12(M), and 16x24 formats (reader-dependent). • Correct the wells on a microplate by a constant value to effectively eliminate background absorbance. Introduction • 1-1 1-2 • Introduction • Normalize absorbances to 1 cm by using the Pathlength Correction feature. • Calculate the mean, standard deviation, and coefficient of variation of any group of wells on the plate. • Generate a linear, quadratic, cubic, point-to-point, 2P, 4P, or cubic-spline standard curve. • Calculate concentrations based on the curve generated using the present standards, or on a previously stored curve. • Generate a curve using the sample dilutions as standards. • Extend the abscissa range of a standard curve-fitting routine beyond the limits of the standard data points generated by the assay (“extrapolation”). • Edit standard outliers and recalculate the curve. • Run a Universal Plate Test on most readers and then view, print, and save the test results. • Run a System Test on most readers and then view, print, and save the test results. • Test communication between KCjunior and the reader before attempting to read a plate. • Set default communication parameters appropriate for the attached reader. • Control plate incubation (reader-dependent). User's Guide to KCjunior Technical Support If KCjunior fails to function successfully, try to solve the problem(s) with the assistance of the Reader Run-Time Errors, Comments and Warnings, and Troubleshooting sections of the User’s Guide or the Help system. If the software still does not function successfully: User's Guide to KCjunior 1. Select Help|About KCjunior from the KCjunior main screen. A dialog resembling the following appears: 2. Write down all of the version numbers and the serial number (“123456” in the example above). 3. Click the Reader Control Version button. A dialog resembling the following appears: 4. Write down the BTI Autoreader Control version. 5. Prepare a list of specific steps that can be used by Bio-Tek’s Technical Assistance Center (TAC) to reproduce the problem. Introduction • 1-3 6. Contact Bio-Tek Instruments. Be sure to provide a daytime phone or fax number, or email address where you can be reached. Written Communication Bio-Tek Instruments, Inc. Technical Assistance Center Highland Park, Box 998 Winooski, Vermont USA 05404-0998 Phone Support Bio-Tek Instruments’ Main Number: (802) 655-4040 Technical Assistance Center, 8:30 am to 5:30 pm EST: (800) 242-4685 Fax Support Technical Assistance Center: (802) 655-3399 Electronic Communication Email: [email protected] Internet Site: www.biotek.com Visiting Bio-Tek’s Website www.biotek.com If you have an Internet browser installed on your computer, you can visit Bio-Tek’s World Wide Website, at www.biotek.com. Here you can find information on hardware and software products, read application notes, and more. To visit the site from within KCjunior, select Help|Bio-Tek on the Web, then click on Bio-Tek Home Page. KCjunior automatically loads your browser and goes directly to the site. 1-4 • Introduction User's Guide to KCjunior Installing the Software Read Me! Complete the following to get KCjunior up and running: 1. Ensure that the computer on which KCjunior will be installed meets the minimum system requirements. 2. Remove the previous version of KCjunior from your computer, if one exists. 3. Install KCjunior. 4. Contact Bio-Tek to obtain a password to ensure continuous use of the software after the 30-day trial period. 5. Register your copy of KCjunior with Bio-Tek to record your warranty, and to receive information on upgrades and new products. 6. Connect your microplate reader(s) to the computer. 7. Configure the reader(s) and KCjunior so that they can communicate with each other. Installing the Software covers steps 1 through 5. See Chapter 4, Setting Up the System for information on connecting a reader to the computer, and configuring the reader and KCjunior. User's Guide to KCjunior Installing the Software • 2-1 System Requirements For KCjunior to run successfully, you will need the following: • Intel 486 processor / 33 MHz minimum (Pentium / 66 MHz or greater is recommended) • Microsoft Windows 95, 98, 2000, NT, or XP operating system • 8 MB of RAM minimum (16 MB or more is recommended) • 20 MB of available hard drive space for the program files • 1 MB for every set of 250 plates (96-well geometry) stored on the hard drive • 3 1/2" high density diskette drive (1.44 MB) or CD ROM drive • 16 color display / 640x480 (800x600 recommended) • Keyboard, mouse, and serial ports Important! • KCjunior is capable of running any protocol on a computer meeting the minimum requirements if KCjunior is the only executing software. If additional software including user programs, browsers, network connections, scanning software and/or utilities is processing concurrently with KCjunior, overall performance may be affected. 2-2 • Installing the Software User's Guide to KCjunior Removing an Earlier Version of KCjunior If you have an earlier version of KCjunior installed on your computer, you should remove it before installing the new version. For optimal performance, only one version of KCjunior should reside on your computer at any one time. Note: This process does NOT remove existing protocol or results databases from your computer. To remove KCjunior: For optimal performance, only one version of KCjunior should reside on your computer at any one time. 1. Start Windows. • Note: If you are prompted with the Windows password entry, enter a valid password. If you are not prompted with the Windows password entry, disregard this note. 2. Click the Windows Start button, then select Settings, Control Panel. User's Guide to KCjunior Installing the Software • 2-3 3. When the Control Panel folder opens, double-click on the Add/Remove Programs icon. 4. When the Add/Remove Programs Properties dialog opens, highlight KCjunior, then click Add/Remove. 5. Follow the instructions on the screen to complete the uninstall process. The uninstall process leaves your protocol and results databases in their original location(s) on your computer. 2-4 • Installing the Software User's Guide to KCjunior Software Installation To Install KCjunior: 1. Start Windows. • Note: If you are prompted with the Windows password entry, enter a valid password. This helps to ensure a complete installation. If you are not prompted with the Windows password entry, disregard this note. 2. Close any unnecessary Windows programs. 3. Place Disk 1 in a 3.5" diskette drive or the CD in the CD rom drive. 4. Click the Windows Start button and select Run. 5. When the Run dialog box appears, type <drive>:\setup.exe, where <drive> represents the letter corresponding to the diskette drive or CD rom drive. • User's Guide to KCjunior Alternatively, use the Browse function to access the drive, then click on setup.exe. 6. Click OK. After a brief pause, the Welcome dialog appears: 7. If you accept these terms, click Next. Otherwise click Cancel to discontinue the software installation. Installing the Software • 2-5 • 8. 9. If you click Next, the following question appears: If you were prompted for and entered a Windows password, or if you were not prompted for this password, click Yes. • If you were prompted for a Windows password but did not enter one, click No and go back to Step 1. • If you click Yes, the following warning may appear: Click Yes to continue with the installation, or No to cancel. • If you click Yes, the Software License Agreement appears: 10. Click Yes if you accept the terms. Otherwise, click No to discontinue the installation. 2-6 • Installing the Software User's Guide to KCjunior • If you click Yes, the Registration dialog appears: If you are running KCjunior in trial mode and do not have a serial number, enter any number in the Serial Number field. 11. Enter your name, company name, and the KCjunior serial number, then click Next. • The Registration Verification dialog appears: 12. Click Yes to confirm and continue, or click No to make any changes. User's Guide to KCjunior Installing the Software • 2-7 • The Choose Destination Location dialog appears: 13. The default location for the software is C:\KCjunior. Click Next to accept the default location, or click Browse to specify a different location. • If you click Next, an informational dialog appears: 14. Click OK to acknowledge the information. 2-8 • Installing the Software User's Guide to KCjunior • The Choose Protocol Database Location dialog appears: A protocol contains instructions for controlling an attached microplate reader and information for analyzing plate data. Protocols are stored in the Protocol Database. This database is typically stored on a computer's hard drive, or on a network to which the computer is attached. 15. The default Protocol Database Location is the \Database directory within the KCjunior directory that you specified in step 13. • Click Next to accept the default location, or click Browse to specify a different location. Note: This location can be changed later from within KCjunior. • If a protocol database named PROTOCOL.MDB already exists in this location, the database is renamed and an empty PROTOCOL.MDB is installed. ¾Click Yes to rename the existing protocol database and continue. Click No to return to the Choose Protocol Database Location dialog. User's Guide to KCjunior Installing the Software • 2-9 • After the protocol database location has been selected, another informational dialog appears: 16. Click OK to acknowledge the information. • The Choose Results Database Location dialog appears: Data for each plate is stored in a Results Record in the Results Database. This database is typically stored on a computer's hard drive, or on a network to which the computer is attached. 17. The default Results Database Location is the \Database directory within the KCjunior directory that you specified in step 13. 2-10 • Installing the Software • Click Next to accept the default location, or click Browse to specify a different location. Note: This location can be changed later from within KCjunior. • If a results database named RESULTS.MDB already exists in this location, the database is renamed and an empty RESULTS.MDB is installed. User's Guide to KCjunior • After the results database location is selected, the software installation begins. 18. Toward the end of the installation, the Select Groups dialog appears: 19. Click Next to accept the default program folder name, or type in a new one. 20. When Setup is complete, KCjunior instructs you to restart your computer. • KCjunior will automatically restart your computer (recommended), or you can choose to wait and restart it yourself. Choose an option, then click Finish. KCjunior is now installed on your computer. User's Guide to KCjunior Installing the Software • 2-11 To Start KCjunior: 1. From the Windows Start menu, access the Programs menu, then the KCjunior menu. Click on KCjunior. 2. If you have not yet entered your KCjunior password, the Registration Form dialog appears: To create a KCjunior shortcut icon for your Desktop: ¾ Open Windows Explorer. Make the window small so you can see the Desktop in the background. ¾ In the KCjunior folder, click and hold the right mouse button on KCJrWin.exe. Drag the item onto the Desktop and release the mouse button. ¾ Select Create Shortcut(s) Here. You have 30 days from the date of installation to use KCjunior without a password You have 30 days from the date of installation to use KCjunior without a password. See Password Distribution and Software Registration on page 2-16 for more information. 2-12 • Installing the Software User's Guide to KCjunior 3. Click Run KCjunior in Trial Mode if you have not yet obtained a password. The KCjunior product information dialog appears: 4. Click OK to continue. An initialization message appears, then after a few moments the KCjunior main screen appears: User's Guide to KCjunior Installing the Software • 2-13 5. The Reader Setup dialog automatically appears the first time KCjunior is started following software installation: The reader does not need to be connected to the computer to specify a Reader Type. If this dialog appears, select a Reader Type. Select the reader type “PowerWaveX” for any PowerWaveX reader model other than the PowerWave XS. • The Reader Type represents the name of the reader to be controlled by KCjunior. • Click to drop down the list, then click on the desired reader. Important notes: ¾Select the appropriate Reader Type before defining protocols, even if the reader is not actually connected to the computer. ¾Choose carefully -- it is important to select the correct model. For example, be sure to select “ELx808I, EL808I” for an 808 with the incubation option. ¾Select “PowerwaveX” for any PowerWaveX model other than the PowerWave XS. Do not select “PowerWave340” or “PowerWave340I” for a PowerWaveX 340 instrument. ¾KCjunior can be configured to communicate with any two Bio-Tek readers, if the computer has two serial ports. See “Reader Support” in Setting Up the System for more information. • Click OK to continue. If necessary, KCjunior will provide instructions for setting additional communication parameters. See “Reader Setup” in Setting Up the System for more information. 2-14 • Installing the Software User's Guide to KCjunior Where to go from here • See Password Distribution and Software Registration on page 2-16 to find out how to ensure continuous use of KCjunior after the 30-day trial period and how to register your software with Bio-Tek Instruments. • Review the next section, Getting Started, to: ¾Learn about KCjunior’s menu structure, and how to navigate around the Help system. ¾Review essential information – what you should know before using KCjunior. ¾Get started with the Quick Start. ¾Take a guided tour to learn how to create protocols, read plates, interpret results, and more. • Examine sample protocols and results records, and read the corresponding assay descriptions: ¾From the KCjunior main screen, select Help|Help Topics. ¾Double-click on Sample Protocols and Results Records, then double-click again on KCjunior Samples. ¾The KCjunior Samples help will appear; follow the directions provided. User's Guide to KCjunior Installing the Software • 2-15 Password Distribution and Software Registration You have 30 days from the date of installation to use KCjunior without a password. After 30 days, KCjunior will require you to enter a unique password in order to use the software. This password can only be obtained from Bio-Tek Instruments, Inc. If you are connected to the Internet, you can get your password online and register your copy of KCjunior at the same time. Registering your software with Bio-Tek records your warranty and ensures that you will receive information on upgrades and new products. Before you contact Bio-Tek, record the System ID from KCjunior’s opening screen. The System ID is an identifier that is unique to your computer. Bio-Tek will create a password for you based on this number. When you receive your password, enter it in the Password field shown above then click OK. 2-16 • Installing the Software • This password only needs to be entered once. KCjunior will not ask you for it again. • If you need to reinstall KCjunior on the same computer, this password will still be valid. • This password will only work with your computer. Contact BioTek with any questions. User's Guide to KCjunior Obtaining a password and registering the software online If KCjunior and your Internet browser are on the same computer, launch KCjunior and select Help|Bio-Tek on the Web, Register KCjunior / Get Password. KCjunior will launch your browser and go directly to Bio-Tek’s website. A Password Distribution / Software Registration form will appear. Follow the directions to fill out and submit the form. If your computer is not connected to the Internet, enter this address into your browser: http://www.biotek.com/labcore.htm. Click the Software Registration link to access the form. Obtaining a password if you do not have Internet access Call, fax, or email Bio-Tek’s Customer Service department. Tell them you wish to obtain a password for KCjunior, and give them your System ID. (888) 451-5171 To call from anywhere within the United States, except from Vermont. (802) 655-4040 To call from outside the United States, or from within Vermont. (802)655-7941 To fax from anywhere. [email protected] Email address. Registering the software if you do not have Internet access Be sure to register your copy of KCjunior with Bio-Tek to record your warranty, and to receive information on upgrades and new products. If you cannot register online, you can do so by filling out and mailing the postage-paid registration card attached to the Customer Assurance Plan included in your software package. User's Guide to KCjunior Installing the Software • 2-17 2-18 • Installing the Software User's Guide to KCjunior Getting Started KCjunior’s Menu Structure KCjunior’s functions are controlled through the main screen, shown below: User's Guide to KCjunior Getting Started • 3-1 Toolbar Use the icons on the left side of KCjunior’s toolbar when working with results records: • A results record contains the raw data retrieved from the microplate reader and related information such as Results ID, Plate ID, plate read time, status, and temperature. • Click • Click to read a new plate. • Click to save the current results record. • Click to close the current results record. to open a list of existing results records. Use the icons on the right side of the toolbar when working with protocols: 3-2 • Getting Started • A protocol contains instructions for operating the attached reader and for performing data reduction on the raw data retrieved from the reader. • Click • Click to modify the open protocol. • Click to create a new protocol. • Click to save the current protocol. • Click to close the current protocol. to open a list of existing protocols. User's Guide to KCjunior Results Menu The Results Menu contains functions for acquiring and processing microplate data. User's Guide to KCjunior Read New Plate Read a new plate. Open Results Open an existing results record. Close Results Close the open results record. If the record has not yet been saved, KCjunior provides the option to save before closing. Plate Information Open a dialog containing information about the plate, such as ID, description, status, and creation date and time. Save Results Save the results record. Save As Save the open results record under a new Results ID. Import Results Import results records from a stored Results Database into the one currently in use. Export Data Export plate data to a text file or directly into a Microsoft Excel spreadsheet. Print Results Print results according to reporting options specified in the Protocol. Print Preview See what the reports look like on the screen before printing. Getting Started • 3-3 Print Setup Change the printer, paper size or source, or page orientation. Exit Close KCjunior. If a results record is open and unsaved, KCjunior provides the option to save before exiting. Protocol Menu The Protocol Menu contains functions for creating, modifying, saving, and importing assay protocols. 3-4 • Getting Started New Protocol Create a new protocol. Open Protocol Open an existing protocol. Close Protocol Close the open protocol. If the protocol has not yet been saved, KCjunior provides the option to save before closing. Modify Protocol Modify the current open protocol. Save Protocol Save the open protocol. Save As Copy the current open protocol to a new protocol with a different name. Import Protocols Import protocols from a stored Protocol Database into the one currently in use. User's Guide to KCjunior Utilities Menu The Utilities Menu contains special tasks, including reader diagnostics and database maintenance. User's Guide to KCjunior Incubation Control If the attached reader supports incubation, turn the incubator on/off, and set an incubation duration. Carrier Out/In Open / close door or extend / retract carrier. Dispenser Control Panel Perform setup, prime, and purge tasks specific to the FLx800 with the fluid injection capability. Diagnostics Perform system and alignment/accuracy tests on the attached reader (reader-dependent). Database Maintenance Create Results and Protocol Databases for archiving. Archive or delete results, protocols, stored curves and reader test results. Getting Started • 3-5 Setup Menu The Setup Menu provides access to the reader setup and system configuration features. Reader 1 or 2 Define communication settings for the reader(s) attached to the computer. Configuration Define various default configuration parameters, including Well IDs, Reporting Options, Pathnames, and Filter Wheel Cartridges. Current Reader Menu If two readers are connected to the computer, use the Current Reader Menu to switch between them before working with protocols or reading plates. 3-6 • Getting Started (Reader 1) Designate the first reader as the Current Reader. (Reader 2) Designate the second reader as the Current Reader. Select Filter Wheel Cartridges This option is only available if a fluorescence/ luminescence reader (like the FLx800) is defined as Reader 1 or Reader 2. Use it to choose from a predefined set of filter wheel cartridges. Get Current Reader Status Retrieve the current status of the attached reader. For example, if the reader encounters an error, select Get Current Reader Status to retrieve the error code. User's Guide to KCjunior View Menu The View Menu provides options for controlling the amount of information displayed within the main screen. Toolbar Show or hide the toolbar at the top of the screen. The default is show. Status Bar Show or hide the status bar at the bottom of the screen. The default is show. Help Menu The Help Menu provides access to KCjunior’s help system and to Bio-Tek’s internet site. User's Guide to KCjunior Help Topics Access KCjunior’s help system (Contents, Index, and Find). Bio-Tek on the Web Go to Bio-Tek’s home page or register the software and get your password online. About KCjunior Retrieve software version information. This is useful if contacting Bio-Tek for support. Getting Started • 3-7 Navigating the Help System Most KCjunior dialogs contain a Help button that, when clicked, opens an informational Help dialog. In addition to this context-sensitive help, KCjunior provides access to the entire Help system. From the main screen, select Help|Help Topics: 3-8 • Getting Started • Double-click on a book to see a topic’s sub-topics. • Double-click on a page to view the text for a topic. • Highlight a topic then click Open to view the text for the topic. • Click the Index tab to perform a keyword search. • Click the Find tab to search the entire help system for a specific word or phrase. • Click Print to print the text for a topic. • Click Cancel to close the Help Topics dialog and return to KCjunior. User's Guide to KCjunior Essential Information KCjunior allows you to define instructions for acquiring microplate data and for reducing and analyzing that data. Protocol Definition The minimum required instructions for plate data acquisition are the read method parameters. These parameters can be combined with more detailed data reduction instructions within a protocol. In addition to storing read method parameters, a protocol stores templates, curve-fitting parameters, cutoff criteria, and reporting options. While a fully defined protocol is useful for controlling a microplate reader and for performing data analysis, it is not a requirement that a protocol be defined prior to plate reading. KCjunior can perform fast reads using just the basic, user-defined read method parameters. Plate Data Acquisition KCjunior provides three methods for acquiring plate data: retrieve results from a microplate reader, read data in from an existing file, or manually enter simulation data. Refer to the following sections under Reading a Plate starting on page 6-7 for more information: User's Guide to KCjunior • “Reading a Plate Without a Protocol” • “Reading a Plate With a Protocol” • “Reading Plate Data from a File” • “Simulating a Plate Read” • “Collecting Data from an EL301 Microstrip Reader” Getting Started • 3-9 Data Reduction and Analysis After data reduction is performed on microplate data, results are displayed in the Raw Data format. Depending on the protocol definition, Blanked Data, Pathlength Correction, Transformation Results, Concentrations, Cutoffs, Template, and/or Plate Formula Results may also be displayed: Results calculation is structured as follows: Raw Data Blanked Data Pathlength Correction Transformation Results Plate Formula Results Concentrations Cutoffs 3-10 • Getting Started • The basis for calculations begins with the Raw Data. • If blank subtraction is performed on the Raw Data, Blanked Data becomes the basis for calculating Transformation Results, Plate Formula Results, Concentrations, and Cutoffs. • If Pathlength Correction is enabled to normalize absorbances to 1 cm (MultiWavelength reads only), the corrected absorbances become the basis for calculating Transformation Results, Plate Formula Results, Concentrations, and Cutoffs. User's Guide to KCjunior • If Transformation Formulas are applied, Transformation Results become the basis for calculating Concentrations and Cutoffs. • If Concentrations are calculated, they become the basis for Cutoffs evaluation. • Notes: ¾For Kinetic protocols, the Maximum Slope is the basis for calculating transformations, for curve calculation (if there are no transformations), and for cutoff evaluation (if there are no transformations or concentrations). ¾For Dispense/Read protocols (FLx800), Raw Data is the only result. KCjunior does not support blank well subtraction, pathlength correction, transformations, curvefitting, or cutoffs for this read method type. Quick Start When using KCjunior, you will typically follow some version of the steps shown below: 1. Start KCjunior. 2. Connect a microplate reader to the computer. 3. Select Setup|Reader to define reader setup parameters. 4. Select Setup|Configuration to set default system parameters. 5. Select Protocol|New Protocol to create a new protocol, or Protocol|Open Protocol to open an existing one. ¾Define read method parameters, including read method type, wavelengths, and plate geometry. ¾Create a Well ID template. ¾Define Curve parameters and Cutoff criteria (if required). ¾Define Reporting options. 6. Select Plate|Read Plate to read a microplate. 7. Review results. 8. Select Plate|Print Results to print reports. 9. Select Plate|Save Results to save the information. 10. Select Utilities|Database Maintenance to archive protocol and plate data. User's Guide to KCjunior Getting Started • 3-11 Guided Tour Welcome to the Guided Tour to KCjunior. This tour takes approximately 20 minutes, and shows you how to do the following: • Prepare the microplate reader. • Define and test communication parameters. • Create a simple quantitative protocol. • Design Well ID, Dilution, Transformation, and Sample ID templates. Let KCjunior's Help system guide you on the tour. • Define curve-fitting parameters. • Define cutoff criteria. • Select reports. • Read a plate. • Interpret results. • Print reports and store results. Refer to the User’s Guide when taking the tour, or let the KCjunior Help system guide you. To access the guided tour in the help system: 1. Start KCjunior. 2. Select Help|Help Topics from the main screen. 3. Double-click on Getting Started. 4. Double-click on Guided Tour. 5. Double-click on Guided Tour, then follow the directions. If the Help window is in your way, you can move and resize it as you take the tour. It will stay “on top” of KCjunior. Prepare the Reader Refer to the reader’s user manual for assistance if necessary. 1. Connect the reader to the computer and turn it on. 2. Through the reader's front panel, find the Baud Rate, Data Bits, Stop Bits, and Parity information. 3. Note the current settings for each parameter. Make the following changes if necessary: ¾If the Baud Rate is currently set to 1200 bps, change it to at least 2400 bps. ¾If Data Bits is currently set to 7, change it to 8. 3-12 • Getting Started 4. Return the reader front panel display to the main menu. 5. Perform a reader system test if any changes were made. User's Guide to KCjunior Define and Test Communication Parameters It is important to set and test communication parameters before attempting to read a microplate. 1. Start KCjunior, if it is not already loaded. 2. In KCjunior, select Setup|Reader. 3. Select the appropriate Reader Type. 4. Select the appropriate Com Port setting. 5. Enter Baud Rate, Data Bits, Parity, and Stop Bits values to match those on the reader. 6. Click the Test Communications button. 7. If the test fails, follow the directions provided by KCjunior, then click Test Communications again. 8. If the test passes, click OK to save the settings and close the dialog. Create a Protocol A protocol contains instructions for controlling the reader and for analyzing data retrieved from the reader. 1. Click the New Protocol button in the main screen. 2. Enter a Protocol Name using up to 16 alphanumeric characters. 3. Set the Raw Data Limits Minimum and Maximum Values to -3.000 and 3.000, respectively. 4. Set the Blank Limits Minimum and Maximum Values to -1.000 and 1.000, respectively. 5. Leave all other parameters set to their default values. 6. Click the Read Method tab. Define Read Method Parameters The configuration of the Read Method parameters controls plate reading. User's Guide to KCjunior 1. Click the Get Reader Wavelengths button to retrieve wavelength settings from the reader. 2. Select a Read Method of Endpoint. 3. Select any Primary Wavelength. 4. Leave all other parameters set to their default values. 5. Click the Template tab. Getting Started • 3-13 Design Templates In each KCjunior protocol, four unique Templates can be designed to indicate location and related information for well and sample identifiers, dilution values, and transformations. Well IDs 1. Select “Blank” from the Well Type Selections list, then click on wells A1 and A2. Leave Blank Method set to Full. 2. Select “Standard” from the Well Type Selections list. 3. Set Replicates/Direction to 2 and Across, respectively. 4. Click and hold the cursor on well B1. Drag the cursor to well H2 and release. Seven groups of Standards should be assigned in duplicate. 5. Select “Sample” from the Well Type Selections list. 6. Set Replicates/Direction to 4 and Down, respectively. 7. Set Map Direction to Across. 8. Click and hold the cursor on well A3. Drag the cursor to well H12 and release. Twenty groups of Samples should be assigned in quadruplicate. The Well ID Template should look like this: ¾Clear any mistakes by selecting <Clear> from Well Type Selections and highlighting the well(s) that need to be changed. 9. 3-14 • Getting Started Click the Concentrations button. User's Guide to KCjunior Concentrations Concentrations can be assigned from within either the Well ID template or the Curve dialog. Here you will assign a concentration value to each standard group. 1. Set the starting Concentration to 1.000. 2. Click Factor, and set the Factor Value to 2. 3. Click the title cell of the CONC column. Concentrations should be assigned as 1, 2, 4, 8, 16, 32, and 64. 4. Click OK. 5. Click the Dilutions radio button. Dilutions In quantitative assays, calculated concentrations are multiplied by the dilution values to produce the final concentrations. Here you will assign dilutions for each sample group, increasing by a factor of 2. 1. The starting Dilution should be set to 1.000 by default. 2. Set the Replicates/Direction to 10 and Across, respectively. 3. Click Factor, and set the Factor Value to 10. 4. Set Map Direction to Down. 5. Click and hold the cursor on well A3. Drag the cursor to D12 and release. 6. Set the starting Dilution back to 1.000. 7. Click and hold the cursor on well E3. Drag the cursor to H12 and release. The Dilutions Template should look like the one shown on the next page. User's Guide to KCjunior Getting Started • 3-15 8. Click the Transformations radio button. Transformations Two types of transformations can be defined within one protocol: • A Transformation Formula is performed only on the well(s) to which it is assigned. • A Plate Formula is automatically applied to every well on the plate. Here you will apply Transformation Formulas to subtract the Blanked OD value from each well in column 4 from its corresponding well in column 3. Note: KCjunior automatically calculates formulas based on the Blanked Data if Blank wells are defined in the Well ID Template. If no Blank wells are defined, formulas are based on the Raw Data. 1. In the Transformation Formula field, enter X-[A$4]. X = current well - = subtraction A4 = contents of well A4 [ ] indicates a well reference $ retains the column number 4 when copying the formula 3-16 • Getting Started 2. Highlight well A3, then click the Apply button. The formula should appear under SMP01 in well A3. 3. With the cursor on A3, click the right mouse button. An editing menu should appear. 4. Select Copy from the editing menu. User's Guide to KCjunior 5. Click and hold the cursor (use the left mouse button) on well B3. Drag the cursor to well H3 and release. Wells B3 to H3 should now be highlighted. 6. Click the right mouse button to open the editing menu, then click Paste. Well B3 should contain X-[B$4], well C3 should contain X-[C$4], and so on to H3, X-[H$4]. 7. Click the Sample IDs radio button to continue. Sample IDs By default, KCjunior refers to sample groups as “SMP01”, “SMP02”, “SMP03”, and so on. Within the Sample ID template, you can assign custom identifiers to sample groups. 1. Click on any well in Sample group number 1. “SMP01” will appear in the Sample ID field. 2. Overwrite “SMP01” with any name in the Sample ID field, then click the Apply button. The ID will be assigned to every sample in group 1. 3. Repeat for several more samples. 4. Click the Curve tab. Define Curve Parameters KCjunior provides three methods for generating curves: • A standard curve can be generated based on the standard wells defined within the protocol. • A previously generated and stored curve can be referenced from within the protocol. • A titer curve can be generated using multiple dilutions of sample groups as concentrations. Here you will define parameters to generate a point-to-point standard curve. User's Guide to KCjunior 1. Select the Point-to-Point curve method. 2. Check Extrapolate to display extrapolated concentrations − unknown values on the Y axis which are outside the range of the standards. 3. Leave all other parameters set to their default values. 4. Click the Cutoffs tab. Getting Started • 3-17 Define Cutoffs User-defined Cutoffs are used to classify results. During data reduction, results are evaluated against the cutoff criteria and each well is assigned a user-defined Label. Here you will create three cutoff “zones”: 1. Enter “STD01” in the first Cutoff field. 2. Enter “STD04” in the second Cutoff field. 3. Enter “Neg” in the first Label field, “Eqv” in the second, and “Pos” in the third. 4. Click the Reports tab. Select Reports The Reports dialog is used to select and customize reports for this protocol. 1. Enter any text in the Report Banner field. 2. Check the Absorbance Report box and the accompanying Both radio button. 3. Check the Matrix Report box. 4. In the Options list, highlight Well IDs, then click Add. 5. In the Options list, highlight Calculated Concs, then click Add. 6. Check the Curve Report box. 7. Click OK to close the protocol. 8. Select Protocol|Save Protocol. Read a Plate 1. Click the Read Plate button. 2. Enter a Results ID, using up to 16 alphanumeric characters. 3. Click Read Plate. 4. Place a microplate on the reader. Note: For best results: ¾Wells A1 and A2 should be empty. ¾The contents of wells B1 and B2 should result in a low optical density value at the defined Primary Wavelength. ¾C1 and C2 should read slightly higher, and so on through H1 and H2 which should provide the highest OD. 5. 3-18 • Getting Started Click OK. User's Guide to KCjunior Interpret Results Following a successful plate read, Raw Data, Blanked Data, Transformation Results, Concentrations, Labels and Template information will be displayed. 1. Click on each of the six tabs to see results. 2. Under Concentrations, click Standard Curve to see the standard curve. 3. Under any tab, click Statistics to see statistical information for every Standard, Sample, and Blank group. Print Reports and Store Results 1. If a printer is connected to the computer, either directly or via a network, select Results|Print Results to print reports. 2. To save the results record, select Results|Save Results. The record will be stored under the Results ID in the Results Database. User's Guide to KCjunior Getting Started • 3-19 3-20 • Getting Started User's Guide to KCjunior Setting Up the System Reader Support KCjunior supports most of Bio-Tek’s automated microplate readers, including: EL301 ELx800 PowerWave 200 EL311 EL808 PowerWave 340 EL312 ELx808 PowerWaveX EL340 FLx800 PowerWaveX 340 EL800 µQuant PowerWaveX Select PowerWave XS Dual-Reader Support KCjunior can be configured to communicate with any two Bio-Tek readers, if the computer has two serial ports. This allows you to, for example, connect an absorbance reader and a fluorescence reader to one computer and switch easily between them from within KCjunior. Note: If you have a laptop computer, you may need to install a communications card. • To configure KCjunior’s communication parameters, start by selecting Reader 1 or Reader 2 from the Setup Menu, as shown below. ¾See “Reader Setup” on page 4-3 for further instructions. User's Guide to KCjunior Setting Up the System • 4-1 • To switch between the two readers, use the Current Reader Menu. ¾KCjunior automatically switches readers if a protocol is opened that is not compatible with the currently selected reader. Connecting the Reader to the Computer Before KCjunior can communicate with a microplate reader, the reader(s) must be properly connected to the computer on which KCjunior is installed. The following steps briefly describe how to connect the reader to the computer. For more detailed information, refer to the reader’s user manual. 1. Attach the appropriate cable to an available serial port on the back of the computer. ¾If you are going to configure KCjunior for use with two readers, the computer must have two serial ports. 2. Plug the other end of the cable to the serial port on the reader. 3. Connect the power cable to the back or side of the reader. 4. Plug all power cords into grounded electrical outlets. ¾Use of a surge protector is strongly recommended. 5. 4-2 • Setting Up the System Use KCjunior to set up the communication parameters, as described in the next section, Reader Setup. User's Guide to KCjunior Reader Setup Important! Set and test communication parameters before attempting to read a microplate. Follow these steps in order: For communication parameter changes to take effect on an EL311, the reader must be turned off/on after any changes are made. 1. Ensure that the microplate reader is connected to the computer on which KCjunior is loaded, as described in the previous section. 2. From the reader’s front panel (if the reader is equipped with one), find the Baud Rate, Data Bits, Stop Bits, and Parity information. Refer to the reader’s user manual for assistance if necessary. 3. Note the current settings for each parameter. Make the following changes if necessary: ¾If the Baud Rate is currently set to 1200, change it to at least 2400. ¾If Data Bits (or Char Bits) is currently set to 7, change it to 8. 4. Perform a reader system test if any changes were made above. 5. Important! Return the reader’s display to the main menu. 6. Start KCjunior. 7. Within KCjunior’s main screen, select Setup|Reader 1 or Reader 2. The Reader Setup dialog appears: 8. Select a Reader Type from the drop-down list. Select the appropriate Reader Type before defining protocols, even if the reader is not actually connected to the computer. Click Get Basecode Version to retrieve the attached reader’s basecode software part number and version number. ¾Choose carefully -- it is important to select the correct model. For example, be sure to select “ELx808I” for an ELx808 with the incubation option. ¾Select “PowerwaveX” for any PowerWaveX model other than the PowerWave XS. Do not select “PowerWave340” or “PowerWave340I” for a PowerWaveX 340 instrument. User's Guide to KCjunior Setting Up the System • 4-3 9. (Optional) Click the Get Comm Defaults button to set the communication parameters to the default values associated with the selected Reader Type. ¾If the current communication settings are acceptable, jump ahead to step 16. 10. Select a Com Port. The Com Port is the computer’s communication port that is used for data transmission between KCjunior and the reader. ¾Options include COM1, COM2, COM3, and COM4. 11. Select a Baud Rate. The Baud Rate is the transmission speed of data, in bits per second, between KCjunior and the reader. ¾Options include 1200 (slow), 2400, 4800, 9600, 19200, and 38400 (fast). Valid settings vary among readers. 12. Set the Data Bits value to 8. 13. Select a Parity setting. Parity is a method of checking for errors during data transmission. ¾Options include None, Odd, and Even. 14. Set the Stop Bits value to 2. 15. Specify an EOT Character. This represents the character sent by the reader to KCjunior to indicate the end of transmission of a plate of data. ¾The default setting is 26 (001A, ^Z). ¾For the EL311, EL312, and EL340 readers, the EOT Character may be changed. The setting in KCjunior must match that on the reader. ¾For the EL301 microstrip reader, the EOT Character has no significance. ¾The FLx800 does not require an EOT Character. ¾For all other readers, the EOT Character must be set to 26. If the EL301 is the current reader, clicking Test Communications only verifies the parameter settings. KCjunior will not attempt to communicate with the EL301. 16. When all parameters are set, click the Test Communications button to attempt to establish communication with the reader. ¾If the test is successful, the communication parameters are set correctly. ¾If the test is unsuccessful, appropriate instructions are provided for fixing the communication parameters. 17. Click OK to save the settings, close the Reader Setup dialog, and return to the KCjunior main screen. 4-4 • Setting Up the System User's Guide to KCjunior System Configuration Various system default parameters can be configured within the Setup|Configuration group of dialogs. Configurable parameters include well identifiers, several reporting options, results and protocol database pathnames, and well type colors. Well Identifiers KCjunior supports four different types of wells − Blank, Standard, Sample, and Control, and processes each type as follows: • The average of the Blank wells is automatically subtracted from every well on the plate. • The values in the Standard wells are used to generate a standard curve. • KCjunior recognizes individual Sample wells and sample groups (if multiple replicates are defined). The mean, standard deviation, and coefficient of variation are automatically calculated for each Sample group. If defined in the protocol, concentrations and cutoffs are calculated for each Sample replicate and group. If dilutions are defined, KCjunior generates a curve for each sample group. • Up to five unique sets of Control wells can be defined (see “Customizing Well IDs” on the next page). This well type can be used to represent a typical control category (e.g. positive control, negative control), or to fulfill a special requirement that the Blank, Standard, and Sample well types do not satisfy. For example, if an assay requires two unique Blank well identifiers, define two sets of Control wells as follows: Note: To perform blank subtraction for an assay using the Well IDs shown above, a transformation formula resembling X-BLK1 must be assigned to every well from which the BLK1 mean will be subtracted, and X-BLK2 must be assigned to every well from which the BLK2 mean will be subtracted. See “Working with Transformation Formulas” in Defining Protocols for more information. User's Guide to KCjunior Setting Up the System • 4-5 Customizing Well IDs Well Identifiers are assigned to microplate wells within the Well ID Template. See “Designing a Well ID Template” in Defining Protocols for more information. To accommodate a variety of applications, KCjunior provides the flexibility to customize references to the different well types. These customized references are called Well Identifiers. • For example, a well that KCjunior consistently treats as a Standard behind-the-scenes can be identified as “STD01” or “STDRD01” or “CAL03” in a Well ID Template, in results displays, and on printed reports. To configure Well Identifiers: 1. Select Setup|Configuration. The Well IDs dialog appears: 2. Enter a Selection name and its associated Well ID for each default well identifier. ¾The Selection name is the descriptive link between the generic well type (i.e., Blank, Standard, Sample, Control), and the 2 to 5 character Well ID. Each Selection can contain up to 16 alphanumeric characters, including spaces. ¾The Well ID is the short identifier that appears in results displays and on printed reports. It can also be used in transformation, plate, and cutoff formulas. Each Well ID can contain 2 to 5 alphanumeric characters, with no spaces. Note: Changes to default Well IDs may affect future modifications to existing Well ID templates. See “Modifying an Existing Well ID Template” in Defining Protocols for more information. 4-6 • Setting Up the System User's Guide to KCjunior ¾Usage example: If an assay requires the use of Calibrators to generate the standard curve, set the Selection name and Well ID for Standard wells to “Calibrator” and “CAL”, respectively, as shown below: With these settings, KCjunior generates the standard curve based on the ODs measured in the wells assigned as “Calibrator”. For more information, see “Designing Templates - Well ID Templates” in Defining Protocols. 3. Click another tab to configure additional system parameters, or click OK to save these settings, close the dialog, and return to the KCjunior main screen. Reporting Options KCjunior provides several configurable reporting options, including precision, reader temperature, and special graph options. To configure Reporting Options: 1. Select Setup|Configuration. Click the Reporting Options tab. The Reporting Options dialog appears: 2. Set the Displayed Decimal Places value. Values such as optical density measurements, transformation results, and concentrations are reported with the number of decimal places defined in this field. ¾The range is from 0 to 3 decimal places. User's Guide to KCjunior Setting Up the System • 4-7 3. If the reader supports incubation, select a Temperature Reporting option for printed reports: ¾Select Always report temperature information to report the reader temperature even if a plate is read with a protocol that does not specify incubation. ¾Select Report temperature if incubation requested to report the reader temperature only when a plate is read with a protocol that specifies incubation. ¾Select Never report temperature information to suppress all temperature information. 4. Specify Graph Options: ¾Check Display Curve Legend to include a legend on the curve display and report. ¾Check Graph Interpolation Result to plot the interpolation value on the curve display and report. 5. Click another tab to configure additional system parameters, or click OK to save the change, close the dialog and return to the KCjunior main screen. General Default Information KCjunior provides several configurable general system parameters, including Startup Protocol, Well Type Colors, and Use Reader’s Barcode Scanner for Plate ID. To configure General Default Information: 1. Select Setup|Configuration. Click the General tab. The General dialog appears: 4-8 • Setting Up the System User's Guide to KCjunior 2. Specify a Startup Protocol. Instruct KCjunior to automatically open the most recently opened protocol, a specific protocol, or no protocol every time the software is started. ¾If Specific Protocol is selected, choose a protocol from the drop-down list. 3. Change the Well Type Colors. To differentiate between the four well types, each can be set to a different color. ¾Available colors are Red, Blue, Green, Yellow, Magenta, Light Blue, Black, Light Gray, and Dark Gray. 4. If the attached reader has a barcode scanner, enable Use Reader’s Barcode Scanner for Plate ID to scan the barcode label on the plate before it is read. ¾If this option is enabled, KCjunior attempts to scan the barcode when the plate is pulled into the reader. If the read is unsuccessful, KCjunior then asks the operator to enter the Plate ID manually. ¾The scanned or manually entered Plate ID is available as a part of the report/export header information. ¾This option is supported for single and multi-plate reads. It is not supported for the empty plate(s) of a MultiWavelength read. ¾If the barcode returned from the reader is preceded by an unnecessary identification character, you can check Remove first character of barcode to have KCjunior remove it. 5. Click another tab to configure additional system parameters, or click OK to save the change, close the dialog and return to the KCjunior main screen. Pathnames Results records and protocols are stored in designated Results and Protocol Databases, respectively. When opening or closing results records and protocols, KCjunior automatically refers to the Results and Protocol Database Pathnames for retrieval and storage. • Important! If a database's location changes, the pathname must be reconfigured. User's Guide to KCjunior Select Setup|Configuration, Pathnames to see the current configurations. The default results and protocol databases are named RESULTS.MDB and PROTOCOL.MDB, respectively. These databases can be copied, moved, or renamed using any file management software. • For example, the protocol database may be moved to a network to be shared by multiple users and renamed as NTWRKPRT.MDB. Setting Up the System • 4-9 To reconfigure the Results or Protocol Database Pathname: 1. Close any open results records and protocols. 2. Select Setup|Configuration. Click the Pathnames tab. The Pathnames dialog appears: 3. In the Results Database Path or Protocol Database Path field, enter the new location and/or name manually, or use the Browse button to search through the directory structure to locate the desired database. 4. (Optional) KCjunior provides an option to present the Pathnames dialog each time the software is loaded, allowing the user to change the database pathname(s). To enable this option, check Allow Pathname Selection at Program Start. 5. Click another tab to configure additional system parameters, or click OK to save the changes, close the dialog and return to the main screen. Database Version A small number of KCjunior features, such as Spectral Scanning, userenabled Scientific Notation, and Pathlength Correction, require the protocol and/or results database to be at or above a certain version number. • 4-10 • Setting Up the System This is only a concern if databases were created with an earlier version of KCjunior. A software upgrade may contain new features that require newer databases. The User's Guide and Help System show the minimum required database version number next to each feature that has such a requirement. User's Guide to KCjunior • To see the version numbers of the currently configured protocol and results databases, select Help|About KCjunior. ¾Protocols and results records from an “older” database can be imported into a newer database with a higher version number. See “Importing Protocols” in Defining Protocols for more information. Filter Wheel Cartridges If one or both of the defined readers is the FLx800 (a fluorescence/ luminescence reader), Filter Wheel Cartridges is available within the Setup|Configuration set of tabs. The FLx800 has one slot for a removable Excitation filter wheel cartridge, and another for a removable Emission filter wheel cartridge. Each cartridge has four locations for filters or plugs. A location can also be left “open” (no filter or plug). For a FLx800 that is used for a variety of applications, multiple Excitation and/or Emission filter wheel cartridges may be prepared and installed as needed. It is important for KCjunior to know the exact values and positions of the filters/plugs/holes for the cartridge currently in use. To simplify the filter definition process when multiple Excitation and/or Emission filter wheel cartridges are used, the contents of each cartridge can be entered once into KCjunior and given a name such as “Cartridge Excitation 01”. When changing to a different cartridge, simply select its assigned name in KCjunior’s Current Reader Menu to prepare to create protocols and read plates. User's Guide to KCjunior Setting Up the System • 4-11 To add, modify, or delete a filter wheel cartridge configuration, select Setup|Configuration. Click the Filter Wheel Cartridges tab: • Click Add Cartridge to configure settings for a new filter wheel cartridge and add it to the list. • Select a cartridge name then click Modify Cartridge to modify settings for an existing filter wheel cartridge. • Select a cartridge name then click Delete Cartridge to permanently delete the cartridge from the list. • KCjunior can be configured to present a prompt just prior to a plate read, to allow the operator to specify which filter cartridges are installed on the instrument. When a new cartridge is selected, KCjunior updates the instrument with the new filter information. ¾Choose Prompt before every plate read to present the prompt before every FLx800 plate read. ¾Choose Prompt if current cartridge selections do not contain required filters to present the prompt only if there is a mismatch between the protocol and the instrument’s filter table. ¾Choose Never prompt to prevent the prompt from appearing. Note: If there is a mismatch between the protocol and the instrument’s filter table, KCjunior presents an appropriate message. 4-12 • Setting Up the System User's Guide to KCjunior Adding or Modifying a Filter Wheel Cartridge From within the Filter Wheel Cartridges tab, click Add Cartridge to configure a new cartridge, or select an existing cartridge name and click Modify Cartridge. The Filter Wheel Cartridge Dialog appears: Define the characteristics for this filter wheel cartridge. 1. Enter a unique Name for the cartridge, using up to 32 alphanumeric characters. 2. Select the Cartridge Type, Excitation or Emission. 3. For each filter wheel position, enter the Wavelength and Bandwidth information, or select Plug or Open. ¾It is important that the wavelength and bandwidth information be entered correctly for each filter. The wavelength and bandwidth values are often printed on the side of each filter. ¾Dispense / Read protocols have special filter position requirements; turn to the next page for more information. 4. User's Guide to KCjunior Click OK to save the changes and return to the previous screen, or click Cancel to discard the changes. Setting Up the System • 4-13 Special Filter Position Requirements for Dispense / Read Protocols Single filter set protocols: • If light shuttering is specified, a blocking filter (Plug) must be placed in the excitation filter wheel in one of the two positions next to the excitation filter that is specified in the protocol. Dual filter set protocols: 4-14 • Setting Up the System • The two excitation filters specified in the protocol must be positioned next to each other in the excitation filter wheel. • The two emission filters specified in the protocol must be positioned next to each other in the emission filter wheel. • If light shuttering is specified, two blocking filters (Plugs) must be placed in the excitation filter wheel. User's Guide to KCjunior Defining Protocols Overview A Protocol contains: • Instructions for controlling the attached microplate reader. • Information for analyzing data retrieved from the reader (or for analyzing data entered manually or read from a file). User-definable protocol features include: • Protocol name and description • Minimum and maximum optical density limits • Minimum and maximum relative fluorescence/luminescence unit limits • Reading method (Endpoint, Kinetic, MultiWavelength, Spectral Scan, or Dispense / Read), and related parameters • Fluorescence/Luminescence-specific parameters such as chemistry, number of filter sets, optics position, and sensitivity • Template design for : ¾Well IDs ¾Dilutions ¾Transformation and Plate Formulas ¾Sample IDs • Curve-fitting parameters • Cutoff criteria • Reporting options Defining Protocols describes how to customize the properties of every feature listed above. User's Guide to KCjunior Defining Protocols • 5-1 Working with Protocols This section provides information for creating, changing, accessing, storing, and sharing protocols. Where are Protocols Stored? Protocols are stored inside a Protocol Database, which is a file that is typically located on a computer’s hard drive, or on a network to which the computer is attached. When opening or saving protocols, KCjunior automatically refers to a user-specified Protocol Database Pathname for retrieval and storage. • The Protocol Database Pathname contains the name and location of the “current” protocol database. Multiple protocol databases can be stored on a computer or on a network, but there can only be one current database. ¾Example pathname: C:\KCjunior\Database\Protocol.mdb. • Select Setup|Configuration, Pathnames to view or modify the current protocol database pathname. See “Pathnames” in Setting Up the System for more information. Opening an Existing Protocol To open an existing protocol, begin by clicking the Open Protocol button in the KCjunior main screen, selecting Open Protocol from the Protocol Menu, or by selecting a name from the protocol drop-down menu in the toolbar. The Open Protocol dialog appears: 5-2 • Defining Protocols • This dialog lists the names of all protocols available in the currently configured Protocol Database. • To open a protocol, highlight the desired name in the list, then double-click the mouse button, or click the Open button. User's Guide to KCjunior ¾If KCjunior is configured for use with two readers: When a protocol is opened, KCjunior attempts to determine which reader best supports the protocol, and then sets it as the Current Reader (see “Reader Support” in Setting Up the System for more information). Selection criteria includes fluorescence / absorbance reading capabilities, and read method parameters. If the readers are equally capable of supporting the protocol, KCjunior does not change the Current Reader. • To close this dialog without opening a protocol, click Cancel or press the Esc key. • To select a different Protocol Database, close this dialog then select Setup|Configuration|Pathnames. Creating a New Protocol To create a new protocol, begin by clicking the New Protocol button in the KCjunior main screen, selecting New Protocol from the Protocol Menu, or by clicking the toolbar icon. The General Information dialog appears, requesting identification information for the new protocol. See “Defining General Information” at the start of Defining Protocol Parameters for more information. Before Defining a New Protocol Set the appropriate Reader Type before defining a protocol. See “Reader Setup” in Getting Started for more information. User's Guide to KCjunior The available, definable parameters for every new protocol vary depending on the currently configured Reader Type. Note: Before defining a new protocol, make sure the Reader Type is properly set under Setup|Reader, and the correct reader is selected under Current Reader. Examples: • If the currently selected Reader Type is ELx808, the available Read Method Types are Endpoint and Kinetic. • If the currently selected Reader Type is PowerWave 340, the available Read Method Types are Endpoint, Kinetic, and MultiWavelength, and the available wavelength range is limited to 340-800 nm. Defining Protocols • 5-3 Modifying Protocols To modify an existing protocol, begin by opening the desired protocol (select Protocols|Open Protocol). Once the protocol is open, click the Modify Protocol button in the KCjunior main screen, select Modify Current Protocol from the Protocol Menu, or click the toolbar icon. The General Information dialog appears, containing identification information for that protocol. See “General Information” at the start of Defining Protocol Parameters for more information. Saving and Closing Protocols After creating or modifying a protocol, save the information by selecting Save Protocol from the Protocol Menu or by clicking the toolbar icon. • KCjunior stores the protocol in the current protocol database under the name defined in the General Information dialog. To close an open protocol, select Close Protocol from the Protocol Menu, or click the toolbar icon. If the protocol is newly created, or if modifications were made to an existing protocol, KCjunior provides an option to save: 5-4 • Defining Protocols • Click Yes to save the new or modified information and close the protocol. • Click No to close the protocol without saving changes. • Click Cancel to close this dialog and return to the open protocol. The new or modified information is retained but not yet saved. User's Guide to KCjunior Copying Protocols To copy the contents of an existing protocol to a new one with a different name, begin by opening the protocol to be copied. Once the protocol is open, select Save As from the Protocol Menu. KCjunior asks for a new protocol name: • Enter a new protocol name using up to 32 alphanumeric characters and spaces, then click OK. The new protocol is created, saved, and kept open for modification. • Click Cancel to cancel this operation and return to the original protocol. Sharing Protocols and Databases Since KCjunior stores protocols in a database, there are several options for sharing protocols and protocol databases among users: • A protocol database can be stored on a network for multi-user availability. ¾Each user must configure the Protocol Database Pathname within his or her copy of KCjunior to point to the network database. • A protocol database can be copied to a diskette or CD and exchanged between users. ¾If the database has grown too large to fit on a diskette, create an empty protocol database and then copy only the desired protocols into the new database: User's Guide to KCjunior 1. Select Utilities|Database Maintenance|Create Archive Protocol Database. The Create Empty Protocol Database dialog appears. 2. In the Save in field, select a location for the new database, then enter an identifying File name. 3. Click Save to create the database and return to the main screen. 4. Select Utilities|Database Maintenance|Archive Protocols. The Archive Protocol Database Pathname dialog appears. Defining Protocols • 5-5 5. Enter the drive, directory, and file name for the newly created empty database. 6. Click OK. The Archive Protocols dialog appears, listing the contents of the current Protocol Database. 7. Select the protocol(s) to be copied. Do NOT check Delete after archive. 8. • When all items have been selected, click the Archive Protocol(s) button. The selected items are copied to the new database. Protocols can be imported from one database into another. See “Importing Protocols” below for more information. Suggestions: ¾Protocols can be imported from a “master” protocol database stored on a network. ¾Protocols can be imported from a protocol database stored on a diskette or on a CD. Importing Protocols Protocols from one Protocol Database can be imported into another. The Protocol Database that will receive the imported protocols is the one defined under Setup|Configuration|Pathnames. To import protocols from another database: 1. If a protocol is open, close it. 2. Select Protocol|Import Protocols. The Import Protocol Database Pathname dialog appears. 3. In the Protocol Database Pathname field, enter the pathname (drive, directory, and file name), of the database containing the protocols to be imported. Alternatively, use the Browse feature to locate and select the database. 4. 5-6 • Defining Protocols Click OK. The Import Protocols dialog appears, listing all protocols in the database. User's Guide to KCjunior 5. Use the mouse to select the protocol(s) to be imported. ¾Press the Shift key while using the mouse to select contiguous protocols. ¾Press the Ctrl key while using the mouse to select non-contiguous protocols. 6. Click the Import Protocol(s) button. The protocol import begins. ¾If a duplicate Protocol Name is detected, KCjunior does not overwrite the protocol. User's Guide to KCjunior Defining Protocols • 5-7 Defining Protocol Parameters When creating a new protocol, a minimum set of General Information and Read Method parameters must be defined for the protocol to be “valid”. In addition, Templates, Curve parameters, Cutoff criteria, and Report options can be specified. Defining Protocol Parameters describes every step of the protocol definition process. Defining General Information General Information includes protocol identification, minimum/maximum limit setting, and precision options. To define this information for a protocol: 1. Choose to create or modify a protocol. Select the General Information tab. The General Information dialog appears: 2. If this is a new protocol, enter a Protocol Name, using up to 32 alphanumeric characters. The protocol will be stored in the current protocol database under this name. 3. (Optional) Enter a Protocol Description, using up to 1024 alphanumeric characters. ¾Text entered here appears at the top of the Protocol Report. 4. 5-8 • Defining Protocols (Optional) Adjust the Raw Data Limits Minimum and Maximum Values to define an inclusive data range for all wells. The valid limits are reader-dependent. User's Guide to KCjunior Explanation: The Raw Data Limits (OD) Minimum Value can be set to a number less than zero, to accommodate dual wavelength reads. During data reduction, the OD, RFU, or RLU value in each well is verified against this range. If the value falls outside the range, two options are available: ¾Discard the out-of-range value. If Discard Out-of-Range Values is selected, the well is reported as OUT and is excluded from data reduction calculations. For example, if one replicate of a sample group is reported as OUT, the sample group mean is based on the remaining in-range replicates. For example, if the Minimum Value is set to -0.500 OD, a post-dual wavelength subtraction value of -0.600 OD falls outside the valid range ¾Retain the out-of-range value. If Discard Out-of-Range Values is not selected, KCjunior automatically sets the raw OD, RFU, or RLU value to the Minimum or Maximum Raw Data Limits value, as appropriate. The new value is displayed inside brackets [2.999], and is included in further calculations (such as group mean calculation, transformations, and standard curve generation). 5. (Optional) Adjust the Blank Limits Minimum and Maximum Values to define an inclusive data range for blank wells. The valid limits are reader-dependent. Explanation: During data reduction, the OD, RFU, or RLU value in each blank well is verified against this range. If a value falls outside the range, two options are available: ¾Discard the out-of-range value. If Discard Out-of-Range Values is selected, the blank well is reported as OUT and is excluded from the calculation of the blank mean. ¾Retain the out-of-range value. If Discard Out-of-Range Values is not selected, KCjunior automatically sets the raw OD, RFU, or RLU value to the Minimum or Maximum Blank Limits value, as appropriate. This new value is displayed inside brackets [0.010], and is included in the calculation of the blank mean. Protocol database versions 1.2 and greater support the Precision parameters. Select About KCjunior from the Help menu to see the version of the currently selected Protocol Database. User's Guide to KCjunior 6. Set the Displayed Decimal Places value to 0, 1, 2, or 3. This value overrides the setting under Setup|Configuration, Reporting Options. Values such as optical density measurements, transformation results, and concentrations will be reported with the number of decimal places defined in this field, unless Scientific Notation is enabled. Defining Protocols • 5-9 7. (Optional) Check Scientific Notation (Raw Data / Blanks) to report Raw and Blanked data in scientific notation. Check Scientific Notation (Transforms/Concentrations) to report Transformation results and calculated Concentrations in scientific notation. If Scientific Notation is not enabled, KCjunior automatically displays a very small number like 0.00004 as 0.000 instead of as 4e-05. Read Method Parameters The configuration of the Read Method parameters controls plate reading. The availability of individual Read Method parameters depends on the current reader type, and can include read method type, wavelengths, filter sets, sensitivity, kinetic settings, number of plates, microplate geometry, incubation and shaking instructions, and more. Before Defining Read Method Parameters Because the availability of various Read Method parameters is readerdependent, ensure that the desired Reader Type is selected under Setup|Readers and also in the Current Reader menu before defining these parameters. The reader does not need to be connected to the computer to define Read Method parameters. Selecting a Read Method Type The Endpoint and Kinetic read methods are available for all readers supported by KCjunior. For certain readers (such as the PowerWave and the µQuant), the MultiWavelength and Spectral Scan read methods are available. For the FLx800 with its optional reagent dispenser, the Dispense / Read read method is available. To select a Read Method Type, click to open the drop-down list and select Endpoint, Kinetic, MultiWavelength, Spectral Scan, or Dispense / Read. 5-10 • Defining Protocols • After a type is selected, related definable parameters automatically become accessible. For example, if Kinetic is chosen, data entry fields such as Kinetic Reads and Kinetic Read Interval becomes accessible. • Sample Read Method dialogs are shown on the following pages. User's Guide to KCjunior Read Method Dialogs for Absorbance Readers User's Guide to KCjunior • During an Endpoint Read, every well on the plate is read at one or two wavelengths. One optical density (OD) value is reported for each well. • During a Kinetic Read, every well on the plate is read a defined number of times at one or two wavelengths. One optical density value is reported for each well for each plate read. A graph showing OD vs. Time is reported for each well. Defining Protocols • 5-11 (Read Method Dialogs for Absorbance Readers) 5-12 • Defining Protocols • During a MultiWavelength Read, the plate is read at each defined wavelength (up to 6). The optical density value measured at each wavelength is reported for each well. Note: The Pathlength Correction feature can be used with MultiWavelength reads. • During a Spectral Scan, multiple readings are taken across a wavelength range on up to 8 wells. A graph showing absorbance or transmission vs. wavelength is reported for each well. User's Guide to KCjunior Read Method Dialogs for Fluorescence/Luminescence Readers User's Guide to KCjunior • During an Endpoint Read, the plate is read from one to six times, depending on the number of filter sets specified. One Relative Fluorescence Unit (RFU) or Relative Luminescence Unit (RLU) value is reported for each well for each filter set. • During a Kinetic Read, the plate is read a defined number of times, using one or two filter sets. One Relative Fluorescence Unit (RFU) or Relative Luminescence Unit (RLU) is reported for each well, for each kinetic read and for each filter set. A graph showing RFU/RLU vs. Time is generated for each well. Defining Protocols • 5-13 • 5-14 • Defining Protocols During a Dispense / Read sequence (FLx800), fluid is dispensed before or during sample measurement. KCjunior generates a kinetic curve showing Relative Fluorescence Units (RFU, Y axis) versus Time (X Axis) for each well. User's Guide to KCjunior Defining Read Method Parameters After the Read Method Type is selected, the definable parameters automatically adjust accordingly. All possible Read Method parameters are described on the following pages. See below for a list of the remaining topics in this section. • The following topics are specific to absorbance readers: Selecting Primary and Reference Wavelengths, p. 5-16. Selecting Multiple Wavelengths, p. 5-16. Defining the Spectral Scan Wavelength Range, p. 5-20. Defining the Number of Plates to be Read, p. 5-20. Selecting a Read Mode, p. 5-35. • The following topics are specific to fluorescence/ luminescence readers: Choosing the Chemistry, p. 5-21. Specifying Dispense / Read Options, p. 5-21. Selecting Filter Wheel Cartridges, p. 5-23. Defining Filter Sets, p. 5-24. Specifying Filter Set Options, p. 5-27. Ejecting the Plate Between Filter Sets, p. 5-30. • The following topics apply to most readers: Defining Kinetic Parameters, p. 5-31. Selecting the Plate Geometry, p. 5-31. Setting a Time Delay Before Reading, p. 5-32. Monitoring Wells, p. 5-32. Defining Incubation Parameters, p. 5-34. Defining Shake Parameters, p. 5-34. Validating Read Method Parameters, p. 5-36. Retrieving Reader Wavelengths/Filters, p. 5-36. “Sending” Reader Wavelengths, p. 5-36. Calibrating the Reader, p. 5-37. Calibrate Before First Read, p. 5-37. User's Guide to KCjunior Defining Protocols • 5-15 Selecting Primary and Reference Wavelengths If a Primary Wavelength is specified alone, the plate is read at a single wavelength. Dual wavelength readings significantly reduce optical interference caused by scratches or fingerprints on the microplate. If a Reference Wavelength is also specified, the plate is read twice, once at each wavelength. During data reduction, KCjunior automatically calculates the Delta OD as the difference between the two readings. To select Primary and Reference Wavelengths: 1. Select a Read Method Type of Endpoint or Kinetic. 2. Enter the Primary and Reference Wavelengths in the appropriate fields. Alternatively, click the Get Reader Wavelengths button to retrieve wavelength information from the reader. The reader must be connected to the computer, and communication parameters must be set properly. Following successful retrieval, use the drop-down menus to select the Primary and Reference Wavelengths. Selecting Multiple Wavelengths For certain reader models, KCjunior provides the ability to read a plate at multiple (up to six) wavelengths. Common reasons for reading a plate at multiple wavelengths include: • Calculating the ratio of measurements at two different wavelengths. • Determining a solution’s peak absorbance by measuring at several wavelengths. To select Multiple Wavelengths: 1. Select a Read Method Type of MultiWavelength. 2. Enter up to six wavelength values in the Wavelengths fields. Alternatively, click the Get Reader Wavelengths button to retrieve wavelength information from the reader. The reader must be connected to the computer, and communication parameters must be set properly. Following successful retrieval, click the drop-down arrows to select the desired wavelengths. Instruct KCjunior to calculate and report the difference in measurements between an empty plate and the sample plate. 5-16 • Defining Protocols 3. (Optional) For any defined wavelength, check Empty Plate to perform two reads at the corresponding wavelength − the first read on an empty plate, and the second on the sample plate. KCjunior automatically subtracts the value of each well of the empty plate from the corresponding well of the sample plate. User's Guide to KCjunior For example, examine the Wavelength setup shown below: The “Empty Plate” can represent an empty dry plate or a plate filled with solution for blanking. The empty plate will be read at 340 nm and 405 nm. The sample plate will be read at 340 nm, 405 nm, and 490 nm. 4. (Optional) Check Use Pathlength Correction to normalize absorbances to 1 cm. This option is only available for readers that support the MultiWavelength read method and wavelength values up to 999 nm. Pathlength Correction requires the 5th and 6th filters to be set either to <None> or to the Test and Reference Wavelengths, respectively. ¾If Pathlength Correction is enabled, KCjunior: (1) Calculates the pathlength for each well. (2) Calculates the corrected absorbance for each well. (3) Displays the corrected absorbance for each well under the Pathlength Correction results tab. ¾KCjunior calculates each well’s pathlength using the following formula: (A977 nm - A900 nm)well / (A977 nm - A900 nm)1.0 cm water The pathlengths can be included on the Matrix Report. See “Selecting Options for the Matrix Report” at the end of this chapter. The well is measured at 977 nm and again at 900 nm, then the difference is calculated. The result is divided by the absorbance of water at 1 cm. 977 nm and 900 nm represent default Test and Reference Wavelengths, respectively. These wavelengths can be changed under Advanced Options. KCjunior uses a default value of 0.18 for the absorbance of water at 1 cm. This default value can be overridden by changing the Constant Value under Advanced Options. Alternatively, click Use Bio-Cell to calculate the absorbance of water at 1 cm value using Bio-Tek’s Bio-Cell plate. Set the Location of the cuvette in the plate. User's Guide to KCjunior Defining Protocols • 5-17 ¾KCjunior calculates the corrected absorbance for each well according to the following formula: Awavelengthwell ÷ pathlength of well The measurement taken at the user-defined wavelength is divided by the calculated pathlength. The Raw Data value of the well is used in the correction formula, unless an empty plate is read or blank subtraction is performed. If an empty plate is read, the difference (or Result) in the Raw Data readings between the full and empty plate is used in the formula. If blank subtraction is performed on the Raw Data or the Result value, the Blanked Data value is used in the formula. ¾Click the Advanced Options button to change the Test or Reference Wavelength values, or to change the Constant Value. The valid range for the Test and Reference Wavelengths fields is 200-999 nm. To define a Constant Value other than 0.18 for use with calculating pathlengths, click Other Value, then enter the desired number. Click Use Default Settings to reset the Test and Reference Wavelengths to 977 and 900 nm, respectively, to reset Other Value to 1, and to reselect the use of the Absorbance of water at 1 cm value. 5-18 • Defining Protocols User's Guide to KCjunior Example 1: A protocol specifies the following: ¾MultiWavelength read method type ¾Microplate read at 405 nm ¾Pre-read an empty plate at 405 nm ¾Pathlength Correction is enabled ¾The default value of 0.18 represents the absorbance of water at 1 cm (977-900 nm). The empty plate is read at 405 nm, to obtain the blanking absorbances for each well. The sample plate is initially read at the Test and Reference Wavelengths. Well A1 readings at 977 and 900 nm are 0.175 and 0.025, respectively. The pathlength for A1 is calculated as (0.175-0.025)/0.18, or 0.8333. The sample plate is then read at 405 nm, and the empty plate values are subtracted to determine the 405 Result values. The 405 Result value for well A1 is 2.576. The corrected value equals 2.576 / 0.8333, or 3.091. Example 2: A protocol specifies the following: ¾MultiWavelength read method type ¾Microplate read at 405 nm ¾Do not pre-read an empty plate ¾Pathlength Correction and Use Bio-Cell are enabled ¾Blank wells are defined in the well ID template The Bio-Cell plate is read at the Test and Reference Wavelengths. The absorbance of water at 1 cm (977-900 nm) value is 0.182. The sample plate is initially read at the Test and Reference Wavelengths. Well H1 readings at 977 and 900 nm are 0.208 and 0.034, respectively. The pathlength for H1 is calculated as (0.208-0.034)/0.182, or 0.956. The sample plate is then read at 405 nm, and after blank well subtraction, the 405 Result value for well H1 is 2.619. The corrected value equals 2.619 / 0.956, or 2.740. User's Guide to KCjunior Defining Protocols • 5-19 Defining the Spectral Scan Wavelength Range During a Spectral Scan, the reader takes multiple measurements across a wavelength range on each of up to 8 wells. A graph showing absorbance or transmission vs. wavelength is reported for each well. To define the Spectral Scan wavelength range: 1. Select the Spectral Scan Read Method Type. 2. Enter the First Scan Wavelength and Last Scan Wavelength. The valid ranges for the First and Last Scan Wavelength fields are 200-998 nm and 201-999 nm, respectively. The First setting must be lower than the Last setting. 3. Set the Scan Increment to determine which wavelengths will be used for measurement within the wavelength range. For example, if the wavelength range is 200-600 nm with a Scan Increment of 10 nm, measurements are taken at 200, 210, 220, … 600 nm. Defining the Number of Plates to be Read Tip: For a quantitative endpoint assay that calculates results based on a stored curve, use the Number of Plates feature to read up to 100 plates. Up to 100 successive plate reads can be performed with one Endpoint protocol. The plate carrier is automatically ejected after each read, to allow for submittal of a different plate. To define the Number of Plates to be read: 1. Enter the number of plates to be read in the Number of Plates field. ¾At run-time, KCjunior provides the option to assign a Plate ID to each individual plate. ¾If the attached reader is equipped with a plate barcode scanner and Use reader’s barcode scanner for plate ID is selected under Setup|Configuration, General, KCjunior scans the plate before each read to capture the plate ID. ¾The raw data for all of the endpoint reads are stored as one record, under one Results ID, in the Results Database. 5-20 • Defining Protocols User's Guide to KCjunior Note: The following sections discuss read method parameters that are specific to fluorescence and luminescence readers. Skip ahead to page 5-31 for information on defining kinetic parameters, enabling shaking or incubation, validating read method parameters, and more. For general information on Read Method parameters, or for instructions on selecting a Read Method type, see page 5-10. Choosing the Chemistry Click the radio button associated with the desired chemistry, Fluorescence or Luminescence. • KCjunior sets certain parameters in accordance with the chosen chemistry. For example: ¾Measurements are reported as either RFU or RLU, to represent Relative Fluorescence Units or Relative Luminescence Units, respectively. ¾A warning message appears if the Excitation filter is not set to “Plug” in a Luminescence protocol (a plug is recommended for Luminescence readings). • For Luminescence protocols, the instrument’s lamp automatically turns off just prior to plate reading. Refer to the instrument operator’s manual for more information on the lamp. Specifying Dispense / Read Options If the current reader is the FLx800 and it is equipped with the reagent dispensing module, you can choose to dispense reagent before or during sample measurement. To define Dispense / Read options: 1. Ensure that the Read Method Type is set to Dispense / Read. 2. Click the Dispense / Read button. 3. If a read will be performed, check Perform Read. If no read will be performed, skip to step 8. 4. If performing a read, choose Well Mode or Plate Mode. ¾In Well Mode the FLx800 reads each well individually for a specified number of times using 1 or 2 sampling windows, dispensing reagent as specified in Dispense Parameters (see step 8). This mode is typically used for fast kinetic reactions. ¾In Plate Mode the FLx800 reads a whole or partial plate for a specified number of times, dispensing reagent as specified in Dispense Parameters (see step 8). User's Guide to KCjunior Defining Protocols • 5-21 5. If reading in Well Mode, select the number of Sampling Windows, 1 or 2. 6. For one or both Sampling Windows: ¾Enter a Lag Time from 0 to 600 seconds. This is the delay before the first Sample is read. Note: For two Sampling windows, KCjunior automatically calculates the Sampling Start time for the second window. The second window begins immediately after the first finishes, unless a Lag Time greater than 0 is specified for the second window. ¾Enter the total number of Samples (measurements to be taken) per well, from 1 to 300. ¾Enter the Sample Interval (the delay between sample measurements), from 0.02 to 12 seconds. ¾(Optional) Check Light Shutter to block the light when not measuring to inhibit photo bleaching. 7. If reading in Plate Mode: ¾Enter the total number of Kinetic Reads, from 1 to 300. ¾Enter a Kinetic Interval (delay between reads) of 1 to 9999 seconds. ¾(Optional) Check Light Shutter to block the light when not measuring to inhibit photo bleaching. 8. If performing a dispense, check Perform Dispense. 9. (Optional) If no read will be performed, or if a Well Mode read will be performed, choose a Tip Prime Option of Before First Well or Before Every Well and then enter a dispense tube Prime Volume of 5 to 20 ul. ¾Tip: If there is a long duration between dispenses from well to well, consider priming Before Every Well to compensate for any fluid loss at the dispense tip due to evaporation. 10. (Optional) If a Plate Mode read will be performed, check Prime Tip Before Start of Processing and then enter a dispense tube Prime Volume from 5 to 20 ul. 11. Enter a reagent Dispense Volume from 5 to 1000 ul. ¾The minimum Dispense Volume varies depending on the Dispense Rate selected. 12. Select a fluid Dispense Rate, of 1, 2, 3, or 4. ¾With each rate selection, the corresponding ul/sec value is displayed. 5-22 • Defining Protocols User's Guide to KCjunior 13. (Optional) If no read will be performed, or if a Well Mode read will be performed, enter a Lag Time from 0 to 6000 seconds. This is the delay before the dispense. ¾Tip: If two Sampling Windows are defined and you wish to dispense between the two windows, enter a Lag Time that matches the calculated Sampling Start time. 14. If a Plate Mode read will be performed, enter an Inject on Interval value from 1 to the number of Kinetic Reads. This is the read number at which the dispense will occur. ¾Note: The kinetic curve will display a green line on the X axis (Time) to indicate when the dispense occurred. 15. Click OK to save the changes and return to the Read Method dialog. ¾Important: If tip priming will be performed, make sure that the tip priming trough is installed in the instrument (refer to the operator’s manual for placement instructions). Selecting Filter Wheel Cartridges For a FLx800 that is used for a variety of applications, multiple Excitation and/or Emission filter wheel cartridges may be prepared and installed as needed. The contents of Excitation and Emission filter wheel cartridges are defined under Setup|Configuration. You can then select the cartridges to be associated with each protocol. To select filter wheel cartridges: User's Guide to KCjunior 1. Ensure that under Setup|Configuration|Filter Wheel Cartridges, Excitation and Emission cartridges are defined. 2. Click the Select Cartridges button from the Read Method dialog. The Select Filter Wheel Cartridge dialog appears. 3. Using the drop-down menus, select the desired Excitation and Emission Filter Wheel cartridges. 4. After selecting a cartridge, clicking View displays the cartridge’s contents. Defining Protocols • 5-23 ¾Click Cancel to return to the Select Filter Wheel Cartridge dialog. 5. Click OK to save the changes and return to the Read Method dialog. The contents of the Excitation and Emission drop-down selection boxes now match the selected cartridges. Defining Filter Sets Each Filter Set specifies the Excitation filter, Emission filter, optics position, sensitivity setting, and sampling information to be applied during one plate read. • One to six filter sets can be defined for an Endpoint protocol. • One or two filter sets can be defined for Kinetic and Dispense / Read protocols. ¾Note: Dispense / Read protocols have special filter position requirements. See “Filter Wheel Cartridges” in Setting Up the System for more information. There are many applications for the use of multiple filter sets, including: 5-24 • Defining Protocols • Comparison of results among various sensitivity settings with otherwise identical filter settings. • Assays that have more than one fluorophore per well. • Comparison of results between the top and bottom optics positions (if the reader is equipped with dual-optics). Select two filter sets with identical settings, one for the top probe and the other for the bottom probe. • Comparison of results among various sampling settings. User's Guide to KCjunior To define Filter Sets: 1. Ensure that the Read Method Type and Chemistry settings are correct. 2. If the reader is connected to the computer and turned on, click Get Reader Filters to update KCjunior’s internal filter table with the reader’s current settings. 3. Select the number of Filter Sets (1 to 6 for endpoint, 1 or 2 for kinetic). 4. Perform steps 5 through 8 for each filter set. 5. Select an Excitation filter and an Emission filter. ¾The Excitation filter selects a narrow band of light to which the sample will be exposed. The Emission filter selects a band of emitted light to be measured by the instrument’s photomultiplier. ¾Valid selections include a wavelength/bandwidth combination (in nanometers), “Plug” to indicate the presence of a plug, and “Open” to indicate the absence of a filter or plug. ¾If the desired filter cannot be found within the drop-down list, manually enter the wavelength and bandwidth values. Each filter is imprinted with its wavelength/bandwidth combination. The correct format is wavelength/bandwidth, in nanometers. For example, 485/20 represents the 485 nm wavelength with a bandwidth of 20 nm. This combination permits the transmission of light from 475 to 495 nm. ¾To prevent damage to the photomultiplier, KCjunior (1) prohibits the saving of a protocol with overlapping Excitation and Emission wavelengths defined; or (2) provides a warning if the wavelengths are considered to be “too close”, but does not prohibit the saving of the protocol. ¾Just prior to a plate read, KCjunior communicates with the reader to see if its filter table contains all of the filter/bandwidth combinations defined in the protocol. 6. Choose an Optics Position of Top or Bottom. ¾Not all fluorescence/luminescence readers are equipped with two probes. When a plate read is initiated, KCjunior communicates with the reader to see if the selected Optics Position is supported. ¾If the reader is connected and is turned on, click the Validate Read Method button to see if the currently selected Optics Position is supported. User's Guide to KCjunior Defining Protocols • 5-25 7. RFU or LFU 99999 Specify the Sensitivity setting of the photomultiplier, unless automatic sensitivity adjustment will be used (see next step). The signal from the range of fluorescence and luminescence assays can be very weak, very strong, or anywhere in between. The photomultiplier (PMT) is the device inside a fluorometer that measures the light emitted from the sample. 0 For each assay the sensitivity (gain) of the PMT should be adjusted to ensure that the signals from all wells fall within the appropriate dynamic range of 0 to 99,999 relative fluorescence or luminescence units (RFU or RLU). R ange of sam ples “O ptim um ” sensitivity S am ples fall w ithin the 0 to 99999 R FU /R LU range. Low est values are above 0. The drawing on the left compares results with an optimum sensitivity setting with settings that are too low or too high. Tips for selecting the “optimum” sensitivity: 99999 RFU or LFU ¾Assays using 96- (or fewer) well plates typically require sensitivities between 75 and 190. Assays using 384-well or other higher-density plates will likely require higher sensitivities because of the narrower optical probes. ¾One method for determining the optimum sensitivity for an assay is to define multiple filter sets with the same parameters, varying only the sensitivity setting. Another method is to enable KCjunior’s Automatic Sensitivity Adjustment feature (see “Specifying Filter Options”). 0 R ange of sam ples S ensitivity is too low S om e sam ples are reported as 0 R FU /R LU . ¾As the sensitivity setting increases, the measurement values increase. If many wells result in OVERFLOW (indicating RFU or RLU values greater than 99,999), the sensitivity setting is probably too high. 99999 R FU or LFU ¾If each well contains more than one fluorophore, one of which might give brighter or weaker results, assign each filter set its own sensitivity. ¾If the Sensitivity field is dimmed and inaccessible, the Automatic Sensitivity Adjustment feature is enabled. 0 R ange of sam ples S ensitivity is too high S om e sam ples are reported as 999 99 R FU /R LU . 5-26 • Defining Protocols 8. Click the Options button to specify Sampling parameters and/or to enable the Automatic Sensitivity Adjustment feature. See “Specifying Filter Set Options” for further information. User's Guide to KCjunior Specifying Filter Set Options Each filter set has its own configuration of options for well sampling, and for automatic sensitivity adjustment (if required). Click the Options button to define Sampling and/or Automatic Sensitivity options for a filter set. Sampling KCjunior provides three Sampling options to specify the well reading characteristics for a filter set. Note: Click the Get Defaults button to set all three options to their original default settings. To define the Sampling options: 1. Specify the Number of Samples (measurements) to take per well. The valid entry range is 1 to 255 measurements. The value reported for each well represents the average of its measurements. ¾The reader spends approximately 10 milliseconds performing each measurement. ¾Usually, the more samples per well the better the CV’s, although selecting more than 10 samples per well typically results in only marginal improvement. 10 is the recommended combination of sensitivity and speed. User's Guide to KCjunior Defining Protocols • 5-27 2. Set the Delay Before Sampling, in milliseconds. This is the pause time to allow plate contents to settle before the measurements begin. The valid entry range is 10 to 2550 milliseconds, in 10 ms increments. ¾350 milliseconds is the recommended setting to ensure the plate is definitely stopped for measurement and for the minimum amount of time. 3. Set the Delay Between Samples, in milliseconds. This is the time delay between samples. The valid range is 0 to 255 milliseconds. ¾For fluorescence assays, a delay of 10 milliseconds is recommended. Note: Delays longer than 200 milliseconds may “bleach” the samples. ¾For luminescence assays, longer delays between samples may result in better CV’s. Automatic Sensitivity Adjustment The Help system shows how to define pre-reading parameters for a sample assay: KCjunior provides an Automatic Sensitivity Adjustment feature as an alternative to the more manual method of defining multiple filter sets with varying sensitivity settings. 1. Click the Help button from within the Filter Options dialog. If this feature is enabled, KCjunior instructs the reader to perform several pre-readings on the microplate. In general, these readings are performed on user-specified wells using incremental sensitivity settings. Each increase in sensitivity raises the RFU/RLU values of all of the wells. Certain wells are monitored to ensure that they, and hence the assay, do not overrange. KCjunior reviews the results of the pre-readings and selects the “optimum sensitivity” for plate reading. 2. Click on the last option, “Examples…”. KCjunior provides two options for Automatic Sensitivity Adjustment: • Scale to Low/High Range. If this feature is enabled, the instrument performs several pre-readings of the specified Low, Test, and High Wells. With each reading, the sensitivity (gain) of the photomultiplier is increased. The target wells are monitored to ensure that they, and hence the assay, do not exceed the defined High Value. KCjunior reviews the results of the pre-readings and selects the “optimum sensitivity” – the one that gives the best signal-tonoise ratio when comparing one (higher) set of wells with another (lower) set of wells. The entire microplate is then read using this sensitivity setting. 5-28 • Defining Protocols User's Guide to KCjunior • Scale to High Well. If this feature is enabled, the instrument performs several pre-readings of the specified High Well. With each reading, the sensitivity (gain) of the photomultiplier is increased. The target well is monitored to ensure that it, and hence the assay, does not exceed the defined High Value. Measurements stop when the target well reaches the High Value. The sensitivity that produced the RFU/RLU closest to the High Value (without exceeding it), is chosen for the microplate read. To enable Automatic Sensitivity Adjustment and define the pre-reading parameters for the Scale to Low/High Range option: Note: For any of the following parameters, enter a single well location (ex. A1), or a “rectangle” of well locations (ex. B1-C2). 1. Specify the Low Well Range, to define the well(s) representing the expected Base Value (see step 4). ¾Low Wells are usually blank wells, buffer wells, zero standards, or negative controls, and are expected to yield a low RFU or RLU. ¾This range must not overlap the Test Well Range. 2. Specify the Test Well Range, to define the well(s) to be used in conjunction with the Low Wells to determine signal-to-noise ratios. ¾Test Wells are usually low standards or low positive controls, and are expected to yield a mid-range RFU or RLU. ¾For best results, designate as the Test Wells those wells on the plate generating a signal at least 50% greater than the Low Wells. ¾This range must not overlap the Low Well Range. 3. Specify the High Well Range, to define the well(s) representing the expected High Value (see step 5). ¾High Wells are usually the highest standards or high positive controls, and are expected to yield a high (but not overrange) RFU or RLU. ¾This range must not overlap the Low Well Range. It can, however, overlap the Test Well Range. User's Guide to KCjunior Defining Protocols • 5-29 4. Specify the Base Value. This is the fluorescence or luminescence value that the Low and Test Wells must exceed during sensitivity determination, to ensure that the plate produces values that are large enough to be meaningful. ¾The default (and recommended) setting is 100 RFU/RLU. 5. Specify the High Value. This is the fluorescence or luminescence value that the High Well(s) should approach but not exceed, in order to produce a valid signal-to-noise ratio calculation. ¾The default setting is 90,000 RFU/RLU, and the maximum value is 99,999. Practically, this value could be anywhere from 10,000 to 90,000. 6. If this is Filter Set #1, checking Use Result for All Filter Sets instructs KCjunior to use the sensitivity determined here for all other filter sets with Automatic Sensitivity Adjustment enabled. To enable Automatic Sensitivity Adjustment and define the pre-reading parameters for the Scale to High Well option: 1. Specify the High Well. This is the target well to be measured. ¾The High Well usually represents a high standard or high positive control, and is expected to yield a high (but not overrange) RFU or RLU. 2. Specify the High Value. This is the fluorescence or luminescence value that the High Wells should approach but not exceed. ¾The default setting is 90,000 RFU/RLU, and the maximum value is 99,999. Practically, this value could be anywhere from 10,000 to 90,000. 3. If this is Filter Set #1, checking Use Result for All Filter Sets instructs KCjunior to use the sensitivity determined here for all other filter sets with Automatic Sensitivity Adjustment enabled. Ejecting the Plate Between Filter Sets For fluorescence/luminescence protocols, enable Eject between filter set reads to: 5-30 • Defining Protocols • Provide the ability to add reagent to the same plate between readings. • Enable the reading of an initial blank plate followed by the sample plate. • Enable the reading of up to 6 different plates using one protocol User's Guide to KCjunior Defining Kinetic Parameters To define Kinetic parameters: 1. Select the Kinetic Read Method Type. 2. Enter the number of Kinetic Reads. The Kinetic Read value represents the number of times the entire plate will be read. 3. Enter the Kinetic Interval in seconds. The Kinetic Interval is the time delay between Kinetic Reads. ¾Alternatively, allow KCjunior to select the minimum kinetic interval. Check the Fastest Interval box to instruct KCjunior to calculate the minimum kinetic interval appropriate for the currently selected reader type. This helps to ensure the fastest plate read possible. Let KCjunior automatically calculate the minimum Kinetic Interval. Note: If shaking is enabled, the Shake Duration is included in the calculation of the Total Read Time. ¾After the Kinetic Reads and Kinetic Interval have been entered, KCjunior automatically calculates the approximate Total Read Time and displays it in the ~HH:MM:SS format. 4. If the reader is set to run in Rapid Mode, the minimum kinetic interval can be set to a lower value than the theoretical minimum value calculated by KCjunior. Refer to the reader’s user manual for instructions on changing the reading mode. For the ELx800, PowerWave, PowerWaveX, µQuant, and FLx800 readers: ¾When Fastest Interval is selected, KCjunior calculates a theoretical minimum kinetic interval. ¾If the reader is connected to the computer, click the Validate Read Method button to verify this value. If the KCjunior theoretical value is too low, the reader returns a valid range for the Kinetic Interval field. ¾If the reader is not currently connected to the computer and Fastest Interval is selected, the Kinetic Interval is verified just prior to a plate read. If the value is too low, the reader returns a valid range for the Kinetic Interval field. Selecting the Plate Geometry The reader does not need to be connected to the computer to select a Plate Geometry. The Plate Geometry represents the number of rows and columns in a microplate. For example, a Plate Geometry of 8x12 represents the standard 96-well plate. 8x12 is the default for every reader type. Depending on the current reader, additional geometry selections can include 2x3, 3x4, 4x6, 6x8, 6x10(Terasaki), 6x12(Terasaki), 8x12 (Hellma), 8x12 (Metric), 8x12(Terasaki), 16x24, and BioCell. User's Guide to KCjunior Defining Protocols • 5-31 To select a Plate Geometry: 1. Ensure that under Setup|Reader, the desired Reader Type is currently selected. 2. Use the drop-down menu to view a list of available geometry options for the current reader type. 3. Click once on the desired Plate Geometry type. 4. (Optional) If partial plate reading is supported by the current reader, click the button to the right of the Geometry field to define the well(s) to be read. ¾Define a “rectangle” of wells to be read by entering the First Well and Last Well, or by highlighting the desired wells in the grid. For example, to read columns 4 through 7 of a 6x8 plate, set First Well to A4 and Last Well to F7, or highlight columns 4, 5, 6, and 7 in the grid. ¾To set the First and Last Well values to coordinate with the currently selected Geometry, click Read Full Plate. ¾Click OK to return to the Read Method dialog. Setting a Time Delay Before Reading Set a Delay Before Read to allow time for stabilization. Use this feature to set a delay between the time the operator initiates the plate read and the time the plate read actually begins. Notes: For MultiWavelength reads, if Read Empty Plate is enabled, the delay begins after the empty plate(s) are read. For multiple-plate Endpoint reads, the delay occurs before each plate is read. To set a Delay Before Read: 1. Enter the time (in seconds), in the Delay Before Reading field. Monitoring Wells If the currently selected reader supports well monitoring, the Monitor Well option is available. This feature enables the instrument to repeatedly read a single well or a group of wells and evaluate the measurements against pre-defined criteria. Once the criteria are met, the plate read begins. To define Monitor Well parameters: 5-32 • Defining Protocols 1. Check the Monitor Well box. 2. Click the Monitor Well Parameters button. The Monitor Well Parameters dialog appears: User's Guide to KCjunior KCjunior database versions 1.4 and greater support the Monitor Well feature. From the main menu, select Help|About KCjunior to see the version numbers for the currently selected protocol and results databases. 3. Specify the monitoring Criteria: ¾Note: For the EL311/312/340 readers, the criteria is limited to the entry of a Comparison Value (OD). When the selected well reaches the defined comparison value, monitoring stops and the plate read begins. ¾From the first drop-down list, select a statistic of At Least One Well, Average of wells, or All Wells. Note: If only one well will be monitored, select any statistic. The behavior will be the same for all three options. ¾From the second drop-down list, select a logical operator, <, <=, >, or >=. ¾Enter a limit value. This is the target measurement value for the selected well(s). The valid range is readerdependent. ¾Examples: At Least One Well >= 0.050 OD: The plate read will begin when at least one of the selected wells is greater than or equal to 0.050 OD. Average of Wells > 0.300 OD: The plate read will begin when the average value of the selected wells is greater than 0.300 OD. All Wells < 80000 LFU: The plate read will begin when all of the selected wells measure less than 80000 LFU. 4. (Optional) Enter a Delay Between Reads, in seconds. This is the delay between readings of the selected well(s). ¾0 indicates no delay. User's Guide to KCjunior Defining Protocols • 5-33 5. Highlight up to 8 wells to be monitored. ¾If a well is shaded, it has been selected and will be monitored. ¾Any well(s) on the plate can be monitored, even if the protocol specifies only a partial plate read. ¾Click the Clear Plate button to clear the currently selected wells. ¾Note: For the EL311/312/340 readers, select only one well. 6. Click OK to save the settings and return to the Read Method parameters dialog. Defining Incubation Parameters If the currently selected reader supports plate incubation, the Incubation option is available. To define Incubation parameters: 1. Ensure that under Setup|Reader, the desired Reader Type is currently selected. ¾The reader does not need to be connected to the computer to define Incubation parameters. 2. Check the Incubation box. The Temperature field becomes accessible. 3. Enter the setpoint temperature (°C) in the Temperature field. This is the temperature to which the plate chamber will be heated prior to plate reading. The valid range is from 20°C (or 4°C above room temperature, whichever is greater), to 50°C. Defining Shake Parameters If the currently selected reader supports plate shaking, the Shake parameters are accessible in the Read Method dialog. To define Shake parameters: 1. Ensure that under Setup|Reader, the desired Reader Type is currently selected. ¾The reader does not need to be connected to the computer to define Shake parameters. 2. Select a Shake Method from the drop-down menu. Available options include None, Shake First Read and Shake Every Read. ¾If Shake First Read is selected, the plate is shaken prior to the first plate reading. ¾If Shake Every Read is selected, the plate is shaken prior to every plate reading. This option typically applies to the kinetic read method. 5-34 • Defining Protocols User's Guide to KCjunior Not every reader that supports plate shaking supports the Variable intensity setting. 3. Select the Shake Intensity. Available options include Low, Medium, High, and Variable. If Variable is selected, the plate is shaken at varying intensities over the defined duration. 4. Set the Shake Duration. The valid range is 1-60 seconds. 5. (Optional) For kinetic protocols, if Shake Every Read is enabled, the Continuous Shake option is available. If selected, the plate shakes continuously between the kinetic reads. Selecting a Read Mode If the currently selected reader supports multiple Read Modes, choose a mode of Normal, Rapid, or Sweep: • Normal mode is the default and its exact behavior is reader- dependent. In general this mode results in slower plate reading and yields the most precise results. • With Rapid mode, reading is faster than with Normal mode. • With Sweep mode, reading is very fast because the carrier “sweeps” the plate through the reader without stopping. Notes: The selection of one read mode over another generally depends on the desired outcome of the assay (better precision versus faster plate reading). All readers that support multiple read modes support the Normal mode. Many readers also support the Rapid mode. The PowerWave Robotic instrument supports the Sweep mode (more readers may support this mode in the future). Just before the plate read, KCjunior checks to see if the attached reader supports the Read Mode currently selected. If the reader does not support the current Read Mode, a different one must be selected. User's Guide to KCjunior Defining Protocols • 5-35 Validating Read Method Parameters The Validate Read Method button is available in the Read Method dialog for some readers. When this button is clicked, KCjunior communicates with the reader to verify the defined Kinetic Interval, and also verifies that all required fields contain valid entries. To validate the read method parameters: 1. Ensure that under Setup|Reader, the desired Reader Type is currently selected, and that the communication parameters are set correctly. 2. Ensure the reader is attached to the computer and turned on. 3. Define the read method parameters. 4. Click the Validate Read Method button. KCjunior attempts to communicate with the reader. If communication is successful, the parameters are validated and the results are displayed. If a change is required, KCjunior provides the necessary instructions. Retrieving Reader Wavelengths/Filters KCjunior provides the capability to retrieve wavelength/filter information from the attached reader, and store that information in the drop-down Wavelength or Filter selection menus. To retrieve Wavelength/Filter information from a reader: 1. Attach the reader to the computer and turn it on. 2. Ensure that under Setup|Reader, the desired Reader Type is currently selected, and that the communication parameters are set correctly. 3. Click the Get Reader Wavelengths button (or the Get Reader Filters button) from the Read Method dialog. KCjunior attempts to communicate with the reader. If communication is successful, the Wavelength/Filter dropdown menus are updated to match the reader’s current settings. “Sending” Reader Wavelengths For the PowerWave, PowerWaveX, and µQuant readers: Just prior to plate reading, if the protocol contains wavelengths that are not present in the reader’s filter table KCjunior instructs the reader to calibrate the new wavelengths. 5-36 • Defining Protocols User's Guide to KCjunior Calibrating the Reader The Calibrate Reader button is available in the Read Method dialog for readers that support calibration. When this button is clicked, the reader runs a calibration routine and performs a system test. Note: For Spectral Scan reads, there is a Calibrate Before First Read checkbox instead of a Calibrate Reader button. See the next topic. To calibrate the reader and perform a system test: 1. Ensure that under Setup|Reader, the desired Reader Type is currently selected, and that the communication parameters are set correctly. 2. Ensure the reader is attached to the computer and turned on. 3. Ensure that the Wavelengths are specified appropriately. 4. Click the Calibrate Reader button from the Read Method dialog. KCjunior attempts to communicate with the reader. If communication is successful, the reader performs calibration and then runs the system test. 5. When the system test is complete, the results are displayed. Click OK to close the results and return to the Read Method dialog. Calibrate Before First Read For Spectral Scan reads, the Calibrate Before First Read option is available. User's Guide to KCjunior • If this box is checked, the reader calibrates at all of the wavelengths defined in the protocol, just prior to plate scanning. • If this box is not checked, the reader calibrates at only those wavelengths that have not yet been calibrated since the reader was turned on. Defining Protocols • 5-37 Templates Within each KCjunior protocol, four unique Templates can be designed to indicate location and related information for Well IDs, Dilutions, Transformations, and Sample IDs: • Well Identifiers play an important role in calculations such as blank subtraction, curve generation, and cutoff evaluation. • Dilutions can be specified to indicate a reduction in the amount of concentration in solutions. • Transformations are user-definable formulas that can be applied to one or more wells. • Sample IDs can be defined to distinctly identify sample wells. To design templates: 1. Choose to create or modify a protocol. 2. Click the Template tab. The Well ID Template appears. 3. Define or modify Well ID information, or click the Dilutions, Transformations, or Sample IDs radio button to select a different template type. After a template type is selected, related definable parameters automatically become accessible. For example, if the Well ID Template is selected, data entry fields such as Well Type Selection, Blank Method, and [Replicate] Number become accessible. Regardless of the template type, the information entry screens are conveniently arranged with rows and columns that align with the selected Plate Geometry. A sample Template information entry screen for the 8x12 plate geometry is shown below: Instructions for defining Default Well IDs and designing Templates are provided on the following pages. 5-38 • Defining Protocols User's Guide to KCjunior Defining Default Well IDs Define the default Well IDs before designing Templates. Well IDs are used to identify the four well types supported by KCjunior – Blank, Standard, Sample, and Control. Common IDs for these well types are BLK, STD, SMP, and CTRL, respectively. Default Well IDs are defined within the System Configuration dialog, found under Setup|Configuration. Define these IDs before creating any templates. For more information, see “Setting Up the System - System Configuration” in Getting Started. Assigning Well Identifiers Well information, such as type, location, replicates, and blanking method, is defined in the Well ID Template. Note: The parameters available within the Well ID Template for the Spectral Scan reading method are limited to well type selections of Blank and Sample, and Sample Numbering. One to eight wells can be scanned, and the wells do not have to be contiguous. Designing a New Well ID Template Design the Well ID template before defining dilutions, transformations, or sample IDs. To design a Well ID Template: 1. Ensure that the Default Well IDs for Blank, Standard, Sample, and Control wells are defined appropriately under Setup|Configuration. 2. Ensure that the correct Plate Geometry is selected under the Read Method tab. 3. From within the Well ID Template, select a well type from the Well Type Selections drop-down menu. ¾The Well Type Selection names are the descriptive links between the generic well type (i.e., Blank, Sample, Standard, and Control), and the 2 to 5 character Well ID. Well Type Selection names and Well IDs are configured under Setup|Configuration, Well IDs. User's Guide to KCjunior Defining Protocols • 5-39 4. If applicable, define the Number of Replicates, Replicate Direction, and Map Direction associated with that ID: ¾Specify the Number of Replicates for the selected well type. The Number of Replicates value represents the number of individual replicates (1, 2, 3) within a single group (SMP, BLK, STD). KCjunior automatically increments the numeric ID suffix. ¾Specify the Replicate Direction, Down or Across. The Replicate Direction is the direction in which individual replicates within a single group are mapped. A direction of Down maps replicates down columns, e.g. A1-B1, C1-D1. A direction of Across maps replicates across rows, e.g. A1-A2, A3-A4. ¾Specify the Map Direction, Down or Across. The Map Direction is the direction in which the groups are mapped. 5. If applicable, enter the Standard or Sample Number to be associated with the starting replicate group. For example: ¾Setting Standard Number to 1 labels the starting standard group “[ID]01”, such as “STD01”. ¾Setting Sample Number to 6 labels the starting sample group “[ID]06”, such as “SMP06”. 6. For well types of Standard and Sample, check Auto-Increment to automatically increment each subsequent group number by one. 7. After selecting the Well Type and defining any additional information, assign the Well ID to one or more wells in the template. ¾To assign an ID to a single well, click once on the desired well. ¾To assign an ID to multiple contiguous wells, move the mouse cursor to the “starting” well, then click and hold the left mouse button. Drag the mouse cursor across and/or down to the “ending” well, then release the mouse button. ¾If the plate contains more than 8 rows and/or 12 columns, the template is viewable in quadrants. To select a quadrant for well ID assignment, click on the appropriate Quadrant number. 5-40 • Defining Protocols User's Guide to KCjunior 8. If the template contains Blank wells, select a Blanking Method. Available methods are Full, Half, Quarter, Row, Column, and Constant. If Constant is selected, set a Blank Constant value. The valid Blank Constant range is -9.9999e+99 to 9.9999e+99. The Blanking Methods are described below: Full The average of the blank wells is subtracted from every well on the plate. Half The average of the blank wells in the first half of the plate (column-oriented) is subtracted from each well of the first half of the plate. The average of the blank wells in the second half of the plate is subtracted from each well of the second half of the plate. Quarter The average of the blank wells in the first quadrant of the plate (column-oriented) is subtracted from each well of the first quadrant. The average of the blank wells in the second quadrant is subtracted from each well of the second quadrant, etc. 9. Row The average of the blank wells in each row is subtracted from each well of that row. Column The average of the blank wells in each column is subtracted from each well of that column. Constant Each well of the plate is reduced by the value of a Blank Constant. If the template contains Standard wells, define the associated Concentrations. • Before defining concentrations, ensure that the Well ID template contains Standard well IDs as required to support the desired curve fit type. For more information, see “Defining Curve Parameters - Selecting a Curve Method” in Defining Protocols. To define Concentrations, click the Concentrations button from within the Well ID Template. User's Guide to KCjunior Defining Protocols • 5-41 The Concentrations dialog appears: ¾Within the Concentrations dialog, the Standard IDs that were defined in the template appear in sequential order in the STANDARD column. The concentrations associated with each Standard ID appear in the CONC column. ¾Individual concentrations can be entered manually in the CONC column, or they can be assigned using the AutoNumbering feature: Enter the Starting Concentration – the concentration value to be assigned to the first standard. Note: Valid concentration values include 0 and 1.0000e-99 to 9.9999e+99. Choose the method by which to increase the concentration values for subsequent standards: Delta to increase each standard exactly by a defined value, or Factor to increase standards by a defined factor value. Enter the Delta or Factor value, as appropriate. Click the mouse button at the top of the CONC column to assign the concentrations. Click OK to save the information and return to the Well ID Template. 10. When the Well ID Template is complete, the Dilutions, Transformations, and Sample ID Templates can be designed. ¾Click the Dilutions radio button to assign Dilutions. ¾Click the Transformations radio button to define Transformation and Plate Formulas. ¾Click the Sample IDs radio button to assign sample identifiers. 5-42 • Defining Protocols User's Guide to KCjunior Modifying an Existing Well ID Template Before modifying an existing Well ID Template, consider the following: • Changes made to the Well ID Template may affect the Dilution, Transformation, and Sample ID Templates as well. For example, if all 'PC' wells are removed from the Well ID Template, any Transformation containing 'PC' will become invalid, and should be modified or removed. • Changes made to the default Well IDs may affect modifications to the Well ID Template. When a Well ID Template is created, the default Well IDs that were defined via Setup|Configuration are assigned to template wells, as illustrated below: KCjunior requires that within one template, a single Well ID must be defined for wells of type Blank, Standard, and Sample. Because of this, it is useful to know if any default Well IDs have been changed before modifying an existing Well ID Template. In the following example, the user plans to add one more blank well to a template in a previously saved protocol. In the time since the protocol was last saved, the default well ID for wells of type Blank had been changed. ¾The original Well ID Template was created as shown above, with two wells of type Blank, with the ID BLK. The protocol was then saved with this template setup. ¾Via Setup|Configuration, a change was made to the default Well ID for wells of type Blank; they are now referred to as BLANK instead of BLK. ¾To add another Blank well, Well Type Selection is set to Blank, then well C1 is “clicked” to assign the ID. Now the template looks like this: ¾This is currently an invalid template. To make the template valid, two options are available: User's Guide to KCjunior Defining Protocols • 5-43 Option 1: With the Well Type Selection still set to Blank, click wells A1 and B1 to change them to BLANK. The template is now valid. Note: If any transformations in this protocol referred to “BLK”, all references would have to be changed to “BLANK” to ensure validity. Option 2: Via Setup|Configuration, change the default Well ID for Blank wells back to BLK. Return to the Well ID Template. With Well Type Selection set to Blank, click on well C1 to assign the ID BLK. The template is now valid. Defining Dilutions KCjunior provides the ability to assign dilutions to sample and control wells. • In quantitative assays, calculated concentrations are multiplied by the dilutions to produce the final concentrations. • In titer assays, for each sample group containing multiple dilutions KCjunior automatically attempts to generate a curve using the dilutions as concentrations. To define Dilutions: 1. Ensure that Sample and/or Control wells are defined appropriately within the Well ID Template. 2. Access the Dilutions Template: A dilution value of 1 indicates the sample is not diluted (1:1). A dilution value of 2 indicates the sample is diluted 1:2. The resulting concentration for the sample will be multiplied by 2.0 to achieve the true concentration. 5-44 • Defining Protocols User's Guide to KCjunior 3. To assign dilutions and manually increase the dilution values: ¾Enter the starting dilution value in the Dilution field. The valid dilution range is from 1.0000e-99 to 9.9999e+99. ¾Specify the Number of Replicates and Replicate Direction. The Number of Replicates represents the number of contiguous wells to be assigned the same dilution value. The Replicate Direction is the direction in which contiguous wells should be assigned the same dilution value, Down or Across. ¾Within the template, click one or more wells to assign the current dilution value. ¾To assign the next dilution, change the value in the Dilution field, then click one or more wells. 4. To assign dilutions and let KCjunior increase the dilution values: ¾Enter the starting dilution value in the Dilution field. The valid dilution range is from 1.0000e-99 to 9.9999e+99. ¾Specify the Number of Replicates and Replicate Direction, as explained in step 3. ¾Select a Fill Count method of Delta or Factor. Choose Delta to increase each dilution exactly by a defined value. Choose Factor to increase dilutions by a defined factor value ¾Enter a Delta Value or Factor Value, as appropriate. ¾Specify a Map Direction of Down or Across. This is the direction in which increasing dilutions should be mapped. ¾Highlight a block of contiguous wells to assign dilutions. 5. To clear any mistakes: ¾Set the Dilution value to 1.000. ¾Set Replicates to 1. ¾De-select the Fill Count. ¾Highlight the well(s) to be reset to 1.000. User's Guide to KCjunior Defining Protocols • 5-45 Defining Transformations Transformations are user-defined formulas applied to plate data for analysis or for data transformation before calculating concentrations or cutoffs. The basis for formula calculation may be Raw Data, Blanked Data, data normalized by Pathlength Correction, or the Maximum Slope, depending on the protocol definition. See “Essential Information” in Getting Started to review the results calculation structure. Results calculationTwo types of formulas can be defined within one protocol: • Transformation Formulas. These formulas are manually assigned to individual wells. Results of these formulas serve as the basis for curve generation and cutoff evaluation. • Plate Formulas. These formulas are automatically applied to every well on the plate that has a Well ID assigned. Results of these formulas do not serve as the basis for curve generation or cutoff evaluation. To define Transformations: 1. Ensure that Well IDs are defined appropriately in the Well ID Template. 2. Access the Transformations Template: Click the Help button and then click the light bulb icon for tips on: • Making a column wider or a row higher. • Removing a transformation from a well. • Highlighting all wells at once. ¾Use this template to define, modify, and apply Transformation and Plate Formulas. 5-46 • Defining Protocols User's Guide to KCjunior Working with Transformation Formulas To apply an existing Transformation Formula to one or more wells: 1. To the right of the Transformation Formula field, click the down arrow to see a list of available formulas. 2. Click on the desired formula to select it. 3. To apply the formula to all wells, click the Apply To All Wells button. 4. To apply the formula to specific wells, use the mouse to highlight one well or a block of wells, then click the Apply to Selection button. 5. To access Copy, Paste, and Undo features, click either the right mouse button or the Options button. To define and apply a new Transformation Formula: 1. Type the formula in the Transformation Formula field. See “Formula Syntax” at the end of this section for more information. Alternatively, let KCjunior assist with defining a new Transformation Formula: ¾Click the button to the right of the Transformation Formula field to access the Formula dialog: See “Formula Syntax” for information on mathematical values and symbols, and location indicators. ¾Assemble the formula using a combination of Functions, Well IDs, Mathematical values and symbols, and Location indicators. A Function performs a specific operation on the contents inside the parenthesis, such as the calculation of a mean value or the Standard Deviation. The Well IDs list contains those Well IDs that are valid for this protocol. Each Well ID represents the mean value of its group (CTL1 represents the mean of all wells labeled as “CTL1”). The identifier X represents the current value of the well. User's Guide to KCjunior Defining Protocols • 5-47 ¾Functions and Well IDs can be entered manually, or they can be selected from the list boxes. To add an item from a list box to the Formula field, highlight the desired item then double-click. To insert an item between two existing items in the Formula field, begin by clicking the mouse once in the Formula field where the new item should appear. Highlight the desired item in the list box, then double-click to insert. ¾Mathematical values and symbols can be entered manually, or selected by clicking the appropriate buttons. ¾Location indicators can be entered manually, or selected by clicking the appropriate buttons. ¾KCjunior provides the option to perform a verification of the formula and check for syntax errors. When the formula is fully assembled, click the Verify button. If the test is successful, the message “Formula is valid” appears. If the test is unsuccessful, a message will appear describing the error(s). Edit the formula accordingly, then click Verify again. ¾Click OK to close the Formula dialog and return to the Transformations Template. The newly created formula will appear in the Transformation Formula field. 2. (Optional) Click the Add to List button to save the new Transformation Formula.. 3. To apply the formula to all wells, click the Apply to All Wells button. To apply the formula to specific wells, use the mouse to highlight one well or a block of wells to which the formula should be applied, then click the Apply to Selection button. 5-48 • Defining Protocols User's Guide to KCjunior KCjunior performs basic formula validation at this time. For example, if a formula references a well that is invalid for the current plate geometry, a formula validation error message appears. To perform a more thorough validation, highlight the well containing the formula in question, open the Formula dialog, then click the Verify button. 4. To access Copy, Paste, and Undo features, click either the right mouse button or the Options button. Working With Plate Formulas To apply an existing Plate Formula: 1. To the right of the Plate Formula field, click the down arrow to see a list of available formulas. 2. Click on the desired formula to select it. ¾During data reduction, this formula is automatically applied to every well that has been assigned a Well ID. To define and apply a new Plate Formula: 1. Type the formula in the Plate Formula field. See “Formula Syntax”, “Order of Precedence”, and “Examples” later in this section for more information. Alternatively, let KCjunior assist with defining a new Plate Formula. ¾Click the button next to the Plate Formula field to access the Formula dialog. See “To define and apply a new Transformation Formula” under Working with Transformation Formulas for instructions. 2. User's Guide to KCjunior (Optional) Click the Add to List button to save the new Plate Formula. Defining Protocols • 5-49 Formula Syntax In KCjunior, a formula contains a combination of Functions, Well IDs, Mathematical values and symbols, and Location indicators. Formula elements are listed and described below: + - * The + operator represents addition. • PC + NC calculates the sum of the PC mean and the NC mean. • X + 0.005 calculates the sum of the current well and 0.005. The - operator can represent either subtraction or negation. • PC - BLK subtracts the BLK mean from the PC mean. • X-BLK subtracts the BLK mean from the current well. The * operator represents multiplication. • SMP01*10 multiplies the mean of the sample replicate group SMP01 by 10. • / () X*100 multiplies the current well by 100. The / operator represents division. • PC/NC divides the PC mean by the NC mean. • X/[A2] divides the current well by the value in well A2. Parentheses ( ) represent an inclusive unit for calculation. • (PC-NC)/100 divides the difference between the PC mean and the NC mean by 100. • ([B4]/STD1)*100 divides well B4 by the STD1 mean, then multiplies the result by 100. CV( ) The CV function calculates the coefficient of variation of the contents inside the parenthesis. The CV represents the standard deviation as a percentage of the mean: (standard deviation/mean)*100. The CV function supports up to five parameters, each of which must equate to a single value. • CV(3.124, 3.094, 2.997) returns 2.161. • CV(CTRL1, CTRL2) returns the coefficient of variation for all replicates of both control groups. If there is a single parameter inside the parenthesis then it is assumed to be a Well ID. • 5-50 • Defining Protocols CV(PC) returns the coefficient of variation for the group PC. User's Guide to KCjunior DIL The DIL function brings forth the currently assigned dilution value in the well. This value can then be included in a formula. The DIL function has no parameters associated with it. It returns a single value, the dilution defined for the well in the Dilutions template. • DIL returns the currently defined dilution value for the well, such as 10.000. • DIL * X multiplies the defined dilution value by the current value in the well. For example, with a quantitative assay, the X value may represent the calculated concentration for the well. • FS( ) DIL is not valid within a Cutoff formula. The FS function is available for fluorescence and luminescence protocols, and is used to specify a particular filter set for use in the formula. • FS(4) * 100 multiplies the result in each well of Filter Set #4 by 100. • FS(1) / FS(2) divides the result in each well of Filter Set #1 by the result in the corresponding well of Filter Set #2. • To control the basis for standard curve and concentrations calculation in a multiple filter set read, apply FS(<filter set number>) to every well in the Transformation Template. KCjunior automatically uses the results calculated for that filter set when generating the curve and calculating concentrations. • MEAN( ) FS is not valid within a Cutoff formula. The MEAN function calculates the average of the contents inside the parenthesis. It supports up to five parameters, each of which must equate to a single value. • MEAN(7, 16, 4) returns 9. • MEAN(PC, NC) returns the mean of the PC and the NC replicate groups. If there is a single parameter inside the parenthesis then it is assumed to be a Well ID. • User's Guide to KCjunior MEAN(BLK) returns the mean of the BLK wells. Defining Protocols • 5-51 SD( ) The SD function calculates the standard deviation of the contents inside the parenthesis. The Standard Deviation is a measure of the distribution of individual values relative to the mean. The SD function supports up to five parameters, each of which must equate to a single value. • SD(3.124, 3.094, 2.997) returns 0.06638. • SD(CTRL1, CTRL2) returns the standard deviation for all replicates of both control groups. If there is a single parameter inside the parenthesis then it is assumed to be a Well ID. • WV( ) SD(NC) returns the standard deviation of the group NC. The WV function references the set of data at the wavelength specified inside the parenthesis. • WV(450) references the set of data read at or calculated for 450 nm. (In a MultiWavelength read, if an empty plate is read at 450 nm, WV(450) represents the Result, or the difference in readings between the actual microplate and the empty plate). • WV(405)/WV(630) in a well divides its 405 nm result by its 630 nm result. • To control the basis for standard curve and concentrations calculation in a MultiWavelength read, apply WV(<wavelength>) to every well in the Transformation Template. KCjunior automatically uses the measurements at that wavelength when generating the curve and calculating concentrations. • [] $ 5-52 • Defining Protocols WV is not valid within a Cutoff formula. Use brackets [ ] to reference a well by its location on the plate. For example: • (([A2]-[A12])/2)+[A12] • X-([C2]-[C3]) Use a dollar ($) sign to retain the row and/or column reference when copying formulas from cell to cell in the template. • [A1], [$A1], [A$1], and [$A$1] all refer to well A1. • [A1] copied from A1 to B1 becomes [B1]. • [$A1] copied from A1 to B2 becomes [$A2]. • [A$1] copied from A1 to B2 becomes [B$1]. User's Guide to KCjunior X The letter X represents the value of the current well. • X-BLK in well G6 subtracts the BLK mean from the value in well G6. • X-[A2] in well A1 subtracts the value in well A2 from the value in well A1. • <well id> X is not valid within a Cutoff formula Any Well IDentifier used in a formula represents the group mean or average. • PC represents the mean of all PC wells on the plate. • SMP01 represents the mean of all SMP01 wells on the plate. • SD(BLK) calculates the standard deviation of the BLK wells. Order of Precedence KCjunior processes formulas according to a certain order of precedence: 1st: ( ) parenthesis 2nd: - unary minus 3rd: * and / 4th: + and • Operators * and / are of equal precedence • Operators + and - are of equal precedence • Within an expression, operators of equal precedence are processed from left to right Examples: Values in three PC wells: 3.002, 3.186, 2.998 Values in three NC wells: 0.868, 0.798, 0.824 (PC-NC)/100 = 0.02232 (MEAN(PC,NC))/100 = 0.01946 User's Guide to KCjunior Defining Protocols • 5-53 Identifying Samples KCjunior provides the ability to assign custom identifiers, such as “Jones” or “003672865A”, to sample groups. These identifiers are referred to as Sample IDs, and they are defined within the Sample ID Template. To define Sample IDs: 1. Ensure that Sample wells are defined appropriately within the Well ID Template. 2. Access the Sample ID Template: 3. In this template, highlight a sample well to prepare it for identification. The well ID will appear in the Sample ID field. Only one replicate within a sample group needs to be highlighted. 5-54 • Defining Protocols 4. Replace the contents of the Sample ID field with the new sample group identifier, using up to 16 alphanumeric characters. 5. Click the Apply button to assign the ID to the highlighted sample group. 6. Repeat for the remaining sample wells. User's Guide to KCjunior Curves KCjunior provides three methods for generating curves: • A standard curve can be generated based on the standard wells defined within the protocol. • A previously generated and stored curve can be referenced from within the protocol. • A titer curve can be generated using multiple dilutions of sample groups as concentrations. The basis for curve calculation may be Raw Data, Blanked Data, data normalized by Pathlength Correction, or Maximum Slope, depending on the protocol definition. See “Essential Information” in Getting Started to review the results calculation structure. To define Curve parameters: 1. If this is a titer protocol, ensure that samples and dilutions have been defined. If the curve will be based on standards, ensure that the Standard well IDs are assigned within the Well ID Template. Note: Each curve-fitting method requires a minimum number of standards: 2. User's Guide to KCjunior Linear 2 2 Parameter 4 Quadratic 3 4 Parameter 4 Cubic 4 Point-to-Point 2 Cubic-Spline 3 Access the Curve dialog: Defining Protocols • 5-55 3. If the standard curve will be based on a stored curve: ¾Click Use Stored Curve at the bottom of the Curve dialog. ¾Select a stored curve from the drop-down list. ¾No other Curve parameters need to be defined. 4. Select a Curve Method from the drop-down list. Available options are Linear, Quadratic, Cubic, 2 Parameter, 4 Parameter, Point-to-Point, and Cubic Spline: Linear: A simple best-fit, straight line is plotted using the values of the standards. Quadratic: Uses the quadratic equation ax2+bx+c=y to plot the standard values. Using this curve, any particular data point for a standard which deviates from the ideal value does not affect the entire curve. Cubic: Uses the equation ax3+bx2+cx+d=y to plot the standard values. The cubic curve is affected even less than the quadratic fit when any particular standard has a poor value. 2 Parameter: Also known as Logit-Log. Characterized by a skewed sigmoidal plot that eventually becomes asymptotic to the upper and lower standard values. The logistic equation is algebraically transformed to a simpler form, where experimentally determined values are used for the responses at concentrations of zero and infinity. 4 Parameter: Characterized by a skewed sigmoidal plot that eventually becomes asymptotic to the upper and lower standard values. The four parameters are left asymptote, right asymptote, slope, and slope at the inflection point. Point-to-Point: Follows each standard point with no averaging of the values to “smooth” the curve. Cubic Spline: A piecewise polynomial approximation consisting of joining a set of data points by a series of straight lines, which is then “smoothed” by using a cubic fit. 5. Enter a name for the graph in the Graph Report Name field, using up to 16 alphanumeric characters. ¾This name appears on Standard Curve reports. 6. Select a Y Axis Scale of Linear or Log. ¾For most curve methods, if a logarithmic scale is selected, then logarithmic numbers are used for both the calculation of the curve and the plotting of the curve. For the 2 Parameter and 4 Parameter curve methods, however, the logarithmic scale is applied only to the plotting of the curve. The curve is calculated using linear numbers. 5-56 • Defining Protocols User's Guide to KCjunior 7. Specify a Y Axis Label, using up to 32 alphanumeric characters. This label appears on displayed and printed reports. ¾Common labels are “Optical Density”, “RFU”, and “RLU”. 8. Select an X Axis Scale of Linear or Log. ¾For most curve methods, if a logarithmic scale is selected, then logarithmic numbers are used for both the calculation of the curve and the plotting of the curve. For the 2 Parameter and 4 Parameter curve methods, however, the logarithmic scale is applied only to the plotting of the curve. The curve is calculated using linear numbers. 9. Specify an X Axis Label, using up to 32 alphanumeric characters. This label appears on displayed and printed reports. ¾A common label is “Concentration”. 10. If the Standards are defined with multiple replicates, enable standard averaging by clicking Average Standards. ¾If Average Standards is enabled, KCjunior uses the average of the standard replicates when generating the curve. ¾If Average Standards is disabled, KCjunior uses the individual standard replicates when generating the curve. ¾Note: The Point-to-Point and Cubic Spline curve methods automatically use the average of the standard replicates. 11. If required, click Extrapolate to display extrapolated concentrations (unknown values on the Y axis which are outside the range of the standards). ¾On data displays and reports, extrapolated concentrations are enclosed by parenthesis, for example (27.345). ¾Note: The Cubic Spline curve method does not permit the display of extrapolated concentrations. 12. (Optional) To calculate the concentration for a specific value, enable Calculate Interpolation Value, then enter the desired value. Valid Interpolation Values include 0 and 1.0000e-99 to 9.9999e+99. ¾If a curve generates successfully, KCjunior calculates a concentration for the entered Interpolation Value. The Interpolation Value is displayed on the Standard Curve dialog and on the Standard Curve report. User's Guide to KCjunior Defining Protocols • 5-57 Cutoffs Cutoffs are used to classify results. During data reduction, KCjunior evaluates results against user-defined cutoff criteria and assigns each well a user-defined Label. The basis for cutoff evaluation may be Raw Data, Blanked Data, data normalized by Pathlength Correction, or Maximum Slope, depending on the protocol definition. See “Essential Information” in Getting Started to review the results calculation structure. To define Cutoffs and Labels: See “Data Reduction and Analysis” under Essential Information to review the calculation structure which determines the basis for cutoff evaluation. 1. If a cutoff value or formula contains references to specific Well IDs, ensure that the IDs are defined in the Well ID Template. 2. Access the Cutoffs dialog: 3. Enter the cutoff values or formulas in the Cutoff fields. These are the criteria against which the plate data will be evaluated. ¾Up to four cutoffs can be specified. Each cutoff can be any one of the following: A simple numeric value, such as 1.500 or 50000. A well ID, such as NC or LPC. A formula combining numeric values and well IDs, such as STD01*0.800. ¾Multiple cutoffs must be entered in ascending order, down the screen. In the following example, the NC mean must equate to a value that is less than that of the PC mean for the cutoff evaluation to be valid. 5-58 • Defining Protocols User's Guide to KCjunior 4. Click the button to the right of a Cutoff field to let KCjunior assist with formula definition and verification. The Formula dialog appears: ¾Assemble the formula using a combination of Functions, Well IDs, Mathematical values and symbols, and Location indicators. ¾Functions and Well IDs can be entered manually, or they can be selected from the list boxes. A Function performs a specific operation on the contents inside the parenthesis, such as the calculation of a mean value or the Standard Deviation. The Well IDs list contains those Well IDs that are valid for this protocol. Each Well ID represents the mean of its replicate group. To add an item from a list box to the Formula field, highlight the desired item then double-click. To insert an item between two existing items in the Formula field, begin by clicking the mouse once in the Formula field where the new item should appear. Highlight the desired item in the list box, then double-click to insert. User's Guide to KCjunior Defining Protocols • 5-59 ¾Mathematical values and symbols can be entered manually, or selected by clicking the appropriate buttons. ¾Location indicators can be entered manually, or selected by clicking the appropriate buttons. ¾When the formula is fully assembled, click the Verify button to check for syntax errors. If the test is successful, the message “Formula is valid” appears. If the test is unsuccessful, a descriptive message appears. Edit the formula accordingly and click Verify again. ¾Click OK to close the Formula dialog and return to the Cutoff dialog. The newly created formula will appear in the appropriate Cutoff field. 5. Specify the text to be associated with each cutoff zone in the Label fields. These labels will be assigned to wells after evaluation. ¾Each label can contain up to five alphanumeric characters. ¾The number of labels must exceed the number of cutoff values or formulas by one. ¾In the following example, labels will be applied to wells as follows: Neg if the value in the well is less than 10.0. Eqv if the value in the well is greater than or equal to 10.0 and less than 20.0. Pos if the value in the well is greater than or equal to 20.0. 5-60 • Defining Protocols User's Guide to KCjunior Reports KCjunior provides up to seven different reports, depending on the current protocol settings. The contents of some of these reports can be further customized for greater flexibility with data presentation. To select the reports for use with a particular protocol: 1. Choose to modify an existing protocol or create a new one. 2. Select the Reports tab. The Reports dialog appears. 3. Define a Report Banner, using up to 32 alphanumeric characters. This banner appears at the top of each printed report. 4. Check the box or radio button next to every report and corresponding option(s) to be printed. Appendix A at the end of the User's Guide contains sample reports. Most reports require that well identifiers be assigned in the template. The Raw Data Report, however, can be printed even if no well ID’s are assigned. ¾The Protocol Report lists many of the parameters defined in this protocol. Click Show Template to include a row x column matrix containing all defined Well IDs. Click Show Formula to list the Transformation and/or Plate Formulas. ¾The Raw Data Report contains the raw and/or blanked optical density data or relative fluorescence/luminescence data in one or more matrices corresponding with the plate geometry. Click Raw Data, Blanked Data, or Both, as appropriate. User's Guide to KCjunior Defining Protocols • 5-61 For MultiWavelength reads, one matrix prints for each wavelength. For Fluorescence and Luminescence reads, one matrix prints for each filter set. ¾The Maximum Slope Report is available with kinetic protocols. It reports the maximum slope calculated for every well, in a matrix corresponding with the plate geometry. For Fluorescence and Luminescence kinetic protocols with two filter sets defined, two maximum slope values will print for each well (one for each filter set). ¾The Formula Report contains the results of the Transformation Formula(s) and/or Plate Formula in a matrix corresponding with the plate geometry. Click Transformation Formula, Plate Formula, or Both, as appropriate. Click Show Formula to list the Transformation and/or Plate Formulas. ¾The Column Report lists Sample IDs/Well IDs, well location, up to three categories of measurement values, and assigned cutoff labels, if appropriate. Information can be sorted by Sample ID or by location in the plate (down or across). If sorting is by Sample ID, the report also contains the mean, standard deviation, and coefficient of variation for each Sample ID / Well ID. ¾The Matrix Report contains well-specific information in a matrix corresponding with the plate geometry. The contents of this report can be customized: In the Options box, highlight up to 8 items to appear on the report, then click the Add button. The selected item(s) will appear in the Selections box. Available options depend on the current protocol settings. See “Selecting Options for the Matrix Report” on the next page for more information. To remove an item from the Selections box, highlight the item and click the Remove button. To insert a reporting option between items in the Selection box, highlight the item in the Selection box above which the new option will be inserted, highlight the data set in the Options box, then click Add. 5-62 • Defining Protocols User's Guide to KCjunior ¾The Curve Report contains the graphical representation of the standard, titer, or spectral scan curve, as appropriate for the protocol. 5. Select OK to close the protocol and retain the new settings, or click another tab to define additional information. • The contents of some of these reports can be further customized for greater flexibility with data presentation. • Appendix A of the “User's Guide to KCjunior” contains samples of each report type. • Most reports require that well identifiers be assigned in the template. The Raw Data Report, however, can be printed even if no well ID's are assigned. Selecting Options for the Matrix Report The options available for printing depend on the current protocol settings, and can include some or all of the following: • Well ID • Raw, Blanked, and/or Corrected Data ¾Endpoint and Kinetic absorbance reads: The options to include raw or blanked data in the Matrix Report are presented as “Raw Data” or “Blanked Data”. ¾Endpoint and Kinetic fluorescence/luminescence reads: There are multiple “Raw” and “Blank” options available for the Matrix Report, one for each filter set defined. For example, if the Read Method options specify 3 filter sets, and there are blank wells defined in the template, the selectable Matrix Report options include the following: Raw(1) Raw(2) Raw(3) Blank(1) Blank(2) Blank(3) Raw(1) represents the raw data values obtained with filter set 1, Blank(1) represents the values obtained with filter set 1 after blank subtraction, and so on. User's Guide to KCjunior Defining Protocols • 5-63 ¾MultiWavelength absorbance reads: An option is presented for each individual wavelength. For example, if the protocol specifies reading at 405, 450, and 490 nm, with blanking, the options include the following: Raw(405) Raw(450) Raw(490) Blank(405) Blank(450) Blank(490) If Read Empty Plate is enabled for a wavelength, the Raw and Blanked data sets for that wavelength represent the results after empty plate subtraction. If Pathlength Correction is enabled, the “Corr” option is presented for each wavelength. This data set represents results after blank subtraction and pathlength correction. • Pathlengths ¾The Pathlengths option is available for MultiWavelength protocols with Pathlength Correction enabled. • Max Slope ¾The Max Slope option is available for Kinetic protocols, to report the maximum slope calculated for every well. ¾For fluorescence/luminescence Kinetic protocols with two filter sets defined, Max Slope (1) and Max Slope (2) represent the maximum slopes calculated for every well, for filter sets #’s 1 and 2, respectively. • Transformations • Plate Transformations • Standard Conc/Dilutions ¾Standard concentrations or dilutions are included as they are defined in the protocol, under the Curve tab. 5-64 • Defining Protocols • Calculated Concentrations • Cutoff Labels User's Guide to KCjunior Reading Plates Overview The terms “plate data” and “results” refer to the set of measurements either retrieved from a microplate reader, entered manually by the operator, or read from an existing data file, and the results of any calculations performed on those measurements. Reading Plates describes how to use KCjunior to: User's Guide to KCjunior • Read a microplate with, and retrieve plate data from, the attached reader. • Simulate a plate read. • Copy data from a spreadsheet and paste it into a KCjunior plate. • Import plate data from an archive results database into the current results database. • Share plate data and results databases among multiple KCjunior users. • Read data from a KCJr for DOS plate file or from an OmniSystem absorbance file. • Export plate data to a text file or directly into a Microsoft Excel spreadsheet. • View, store, and access results. Reading Plates • 6-1 Working With Plates and Results This section describes accessing, generating, modifying, storing, and sharing plate data. Where is Plate Data Stored? Data for each plate is stored in a Results Record in the Results Database. Each record is identified by a user-assigned Results ID. One results record stores all of the raw optical density, fluorescence, or luminescence values for a plate that was read once (as with a single-plate endpoint protocol), or for a plate that was read multiple times (as with a kinetic, multi-wavelength, spectral scan, or multi-plate endpoint protocol). Results Databases are typically stored on a computer’s hard drive, or on a network to which the computer is attached. When opening or saving results records, KCjunior automatically refers to the Results Database Pathname for retrieval and storage. • The Results Database Pathname represents the location and name of the “current” results database. ¾Example pathname: C:\KCjunior\Database\Results.mdb. • The results database pathname can be viewed or changed under Setup|Configuration, Pathnames. Opening an Existing Results Record To open an existing results record, begin by clicking the Open Results button in the KCjunior main screen, selecting Results|Open Results, or by selecting a name from the Results drop-down menu in the toolbar. The Open Results dialog appears, as shown below: Click on the Results column header to sort the list by name, in ascending or descending order. Or click on the Creation Date column header to sort by creation date and time. 6-2 • Reading Plates User's Guide to KCjunior • To open an existing results record, highlight the desired Results record name in the list, then double-click the mouse button or click the Open button. • To change the sort order, click on the Results column header and/or the Creation Date column header. • To close this dialog without opening a record, click Cancel or press the Esc key. Generating a New Set of Plate Data Plate data can be retrieved from a microplate reader, generated manually (referred to as simulation data), or read from a file. To generate any new set of plate data, begin by clicking on the Read Plate button in the KCjunior main screen, selecting Results|Read Plate, or by clicking the toolbar icon. The Read Plate dialog appears, providing three options for generating the plate. For more information see: • “Reading a Plate” on page 6-7 • “Simulating a Plate Read” on page 6-12 • “Reading Plate Data from a File” on page 6-13 Before Reading a New Plate A microplate can be read with or without a Protocol. A protocol contains information for the operation of the microplate reader, as well as instructions for analyzing data retrieved from the reader. To read a plate without a protocol (to perform a fast read), simply click the Read Plate button from within the Read Plate dialog. KCjunior requests minimal read method information then initiates the plate read. If desired, a protocol can be opened or defined after the data is retrieved from the reader. To define or open a protocol before reading a plate, refer to the Defining Protocols section of this User’s Guide. User's Guide to KCjunior Reading Plates • 6-3 Saving and Closing Results Records After generating or modifying a plate, save the information by selecting Results|Save Results or by clicking the toolbar icon. Results records are stored in the current Results Database. KCjunior either automatically saves the record under the Results ID assigned prior to microplate reading, or requests the entry of a Results ID if not previously assigned. To close an open record, select Results|Close Results or click the toolbar icon. If the record is new, or if modifications were made to an existing record, KCjunior provides an option to save: • Click Yes to save the new or modified information and close the record. • Click No to close the record without saving changes. • Click Cancel to close this dialog and return to the main view. The new or modified information is retained but not yet saved. Copying an Existing Results Record KCjunior provides an option to copy all of the contents of an existing results record to a new record with a different name. To copy an existing record, begin by opening it. Once it is open, immediately select Save As from the Results Menu. KCjunior asks for a new name: 6-4 • Reading Plates • Enter a new name, then click OK to create the new results record, save it in the current Results Database, and keep it open for modification. • Click Cancel to cancel this operation and return to the original results record. User's Guide to KCjunior Sharing Results Records and Databases Since KCjunior stores results records in a database, there are several options for sharing records and databases among users: • A results database can be stored on a network for multi-user availability. ¾Each user must configure the Results Database Pathname within his or her copy of KCjunior to point to the network database. • A results database can be copied to a diskette or CD and exchanged between users. If the database has grown too large to fit on a diskette, create an empty results database, then copy only the desired results records into the new database: 1. Select Utilities|Database Maintenance|Create Archive Results Database. The Create Empty Results Database dialog appears. 2. In the Save in field select a location for the new database, then enter an identifying File name. 3. Click Save to create the database and return to the main screen. 4. Select Utilities|Database Maintenance|Archive Results. The Archive Results Database Pathname dialog appears. 5. Enter the drive, directory, and file name for the newly created empty database. 6. Click OK. The Archive Results dialog appears, listing the contents of the current Results Database. 7. Select the record(s) to be copied. Do NOT check Delete after archive. 8. • Click the Archive Results button. The selected records are copied to the new database. Results records can be imported from one database into another. See Importing Results below for more information. Suggestions: ¾Results records can be imported from a “master” results database stored on a network. ¾Results records can be imported from a results database stored on a diskette. User's Guide to KCjunior Reading Plates • 6-5 Importing Results Results records from one results database can be imported into another results database. The Results Database that will receive the imported records is the one defined under Setup|Configuration|Pathnames. To import results records from a stored database: 1. If a results record is currently open, close it. 2. Select Results|Import Results. The Import Results Database Pathname dialog appears. 3. In the Results Database Pathname field, enter the pathname (drive, directory, and file name), of the database containing the records to be imported. Alternatively, use the Browse feature to locate and select the database. 4. Click OK. The Import Results dialog appears, listing all records in the database. ¾Click the Results and Creation Date column headers to sort the records alphabetically or by date. 5. Use the mouse to select the record(s) to import. ¾Press the Shift key while using the mouse to select contiguous records. ¾Press the Ctrl key while using the mouse to select noncontiguous records. 6. Click the Import Results button. KCjunior imports the selected records. ¾If a duplicate record name is detected, KCjunior does not overwrite the record. 6-6 • Reading Plates User's Guide to KCjunior Reading a Plate A microplate can be read with or without pre-defining or opening a Protocol. A protocol contains information for the operation of the microplate reader, as well as instructions for analyzing data retrieved from the reader. Reading a Plate Without a Protocol If a “fast read”is required (that is, with no protocol open), KCjunior requests minimal information then initiates the plate read. Following the read, a protocol can be created or opened to analyze the data. Note: The spectral scan read method requires a protocol to define the wells to be scanned. To perform a Fast Read: 1. Ensure that the reader is properly attached to the computer, and that the correct reader type and communication parameters are defined under Setup|Reader. See “Setting up the System” in Getting Started for more information. 2. Initiate the read by clicking the Read Plate button in the KCjunior main screen, selecting Results|Read Plate, or by clicking the toolbar icon. The Read Plate dialog appears: User's Guide to KCjunior Reading Plates • 6-7 3. Enter a Results ID, using up to 32 alphanumeric characters. The ID is optional in this dialog, but it will be required later if the results are to be stored in the Results Database. ¾If performing a multiple-plate endpoint read, all of the plates in the read will be stored in the Results Database (in one record) under this Result ID. 4. (Optional) Enter a Plate Description, using up to 1024 alphanumeric characters. 5. Click the Read Plate button. The Read Method dialog appears: 6. Define the basic Read Method parameters. See “Defining Read Method Parameters” in Defining Protocols for more information. 7. (Optional) If the attached reader supports calibration, click the Calibrate Reader button to calibrate the reader at the defined wavelength(s). 8. Click OK to continue with the read. A second Read Plate dialog appears. 6-8 • Reading Plates User's Guide to KCjunior 9. (Optional) Manually assign a Plate ID to this plate. ¾For multiple plate endpoint absorbance protocols, each individual plate can have its own Plate ID assigned. This prompt appears before each plate is read. 10. Place the plate on the carrier, then click OK to initiate the plate read. ¾If the attached reader is equipped with a barcode scanner and Use Reader’s Barcode Scanner for Plate ID is enabled in KCjunior under Setup|Configuration|General, KCjunior attempts to scan the plate. If no barcode is detected, or if the attached reader is not equipped with a barcode scanner, the Plate ID can be entered manually. ¾Click the Abort Read button to halt the read in progress. Data reduction is based on any data retrieved up to the time the button was clicked. ¾When the plate read is complete, KCjunior automatically retrieves the measurements from the reader, performs data reduction, and displays the results. See Viewing Results or Interpreting Results for more information. 11. To save the results: • Select Results|Save Results, or press CTRL+S. KCjunior requests a Results ID if one was not defined before the plate read. Enter the ID using up to 32 alphanumeric characters. This is the name under which the record will be stored in the Results Database. Click OK to save the results. 12. To apply a protocol to the results, leave the results record open and do one of the following: ¾Open an existing protocol. If the read method parameters are compatible, KCjunior automatically recalculates the results. If the read method parameters are not compatible, KCjunior provides further instructions. ¾Create a new protocol. KCjunior automatically transfers the read method parameters defined for the fast read into the new protocol. User's Guide to KCjunior Reading Plates • 6-9 Reading a Plate With a Protocol To read a microplate with a protocol: 1. Ensure that the reader is properly attached to the computer, and that the correct reader type and communication parameters are selected under Setup|Reader. 2. Open an existing protocol or define a new one. See either “Opening an Existing Protocol” or “Defining Protocol Parameters” in Defining Protocols for more information. 3. Initiate the read by clicking on the Read Plate button in the KCjunior main screen, selecting Protocol|Read Plate, or by clicking the toolbar icon. The Read Plate dialog appears: 4. Enter a Results ID, using up to 32 alphanumeric characters. The ID is optional in this dialog, but it will be required later if the results are to be stored in the Results Database. ¾If performing a multiple-plate endpoint read, all of the plates read will be stored in the Results Database under this ID (although they can each have their own Plate ID). 5. 6-10 • Reading Plates Enter a Plate Description, using up to 1024 alphanumeric characters. This description is optional. User's Guide to KCjunior 6. Click the Read Plate button. A second Read Plate dialog appears. 7. (Optional) Manually assign a Plate ID to this plate. ¾For multiple plate endpoint absorbance protocols, each individual plate can have its own Plate ID assigned. This prompt appears before each plate is read. 8. Place the plate on the reader, then click OK to begin the plate read. ¾If the attached reader is equipped with a barcode scanner and Use Reader’s Barcode Scanner for Plate ID is enabled in KCjunior under Setup|Configuration|General, KCjunior attempts to scan the plate. If no barcode is detected, or if the attached reader is not equipped with a barcode scanner, the Plate ID can be entered manually. ¾Click the Abort Read button to halt the read in progress. Data reduction is based on any data retrieved up to the time the button was clicked. ¾When the plate read is complete, KCjunior automatically retrieves the measurements from the reader, performs data reduction, and displays the results. See Viewing Results or Analyzing and Manipulating Results for more information. 9. To save the results: ¾Select Results|Save Results, or press CTRL+S. KCjunior requests a Results ID if one was not defined before the plate read. Enter the ID using up to 32 alphanumeric characters. This is the name under which the record will be stored in the Results Database. Click OK to save the results. User's Guide to KCjunior Reading Plates • 6-11 Simulating a Plate Read Note: Simulation Data is not supported for the spectral scan read method. KCjunior provides the option to simulate a plate read by entering plate data manually, or by copying data from a spreadsheet and pasting it into a KCjunior plate. Simulation data typically represents previously acquired measurements entered into KCjunior for analysis. Simulation data can be generated with or without a protocol open, and it can be saved, accessed, and modified. To simulate a plate read: 1. Ensure that under Setup|Reader, the desired Reader Type is currently selected. The reader does not need to be connected to the computer to simulate a plate read. 2. If desired, open an existing protocol or define a new one. 3. Initiate the simulation by clicking the Read Plate button in the KCjunior main screen, selecting Results|Read Plate, or by clicking the toolbar icon. The Read Plate dialog appears. 4. Enter a Results ID, using up to 32 alphanumeric characters. The ID is optional in this dialog, but it will be required later if the results are to be stored in the Results Database. ¾If performing a multiple-plate endpoint read, all of the plates in the read will be stored in the Results Database under this Results ID. 5. Enter a Plate Description, using up to 1024 alphanumeric characters. This description is optional. 6. Click the Simulation Data button. Note: If there is no protocol open, the Read Method dialog appears. Enter the basic Read Method parameters, then click OK to continue. The Simulation Data dialog appears, in a format corresponding with the defined Plate Geometry. 7. Enter OD, RFU, or RLU values directly into the appropriate “wells”, or copy values from the spreadsheet and paste them here by pressing Ctrl+V. ¾If a dual-wavelength Endpoint or Kinetic absorbance read is defined, the value entered in each well must represent the delta OD for that well. ¾Set the Kinetic Read value to simulate each plate reading in the kinetic reading cycle. ¾Set the Wavelength value to simulate each wavelength reading in a MultiWavelength read. 8. 6-12 • Reading Plates When the data entry is complete, click OK. KCjunior performs data reduction based on the defined protocol parameters, if applicable, and then displays the results. User's Guide to KCjunior Reading Plate Data from a File KCjunior can read plates that were generated with Bio-Tek’s KCJr for DOS software, and absorbance files generated by Bio-Tek’s OMNI System. To read plate data from one of these files: 1. If desired, create a protocol or open an existing one. The read method parameters should be appropriate for the file to be opened. Note: Before creating or defining a protocol to accommodate a multi-wavelength Omni-System absorbance file, make sure the reader type specified under Setup|Reader supports multiwavelength reads. The reader does not need to be connected to the computer to read plate data from a file. 2. Select Results|Read Plate, or click the Read Plate button in the main screen. The Read Plate dialog appears. 3. Enter a Results ID, using up to 32 alphanumeric characters. The ID is optional in this dialog, but it will be required later if the results are to be stored in the Results Database. 4. (Optional) Enter a Plate Description, using up to 1024 alphanumeric characters. 5. Click the Read From File button. A standard Open File dialog appears. 6. Locate and highlight the desired file, then click Open. KCjunior examines the file to determine certain characteristics such as read method, wavelengths, number of reads, and kinetic interval (if applicable). If there are no discrepancies, KCjunior opens the file and calculates the results. If KCjunior is unable to determine one or more of these characteristics, a Read File dialog appears, requesting entry of the unknown values. The Read File dialog contains as much information as KCjunior was able to retrieve from the file. Any unknown values must be entered before results calculation can begin. ¾If a field is dimmed and inaccessible, KCjunior requires no further input. ¾If the Read Method field drop-down box is accessible, choose Endpoint or Kinetic as applicable. ¾If the Primary Wavelength field contains 0, enter a wavelength from 1 to 999. User's Guide to KCjunior Reading Plates • 6-13 ¾If the Reference Wavelength field contains 0, enter a wavelength from 1 to 999, or leave it set to 0 if no reference wavelength is required. ¾If the Kinetic Interval field is accessible, enter a value (in seconds) from 1 to 9999. ¾Click OK to accept the values. KCjunior validates the settings and then calculates the results. 7. To save the results, select Results|Save Results, or press CTRL+S. 8. KCjunior requests a Results ID if one was not defined before the plate read. Enter the ID using up to 32 alphanumeric characters. This is the name under which results will be stored in the Results Database. 9. Select OK to save the results. Collecting Data from an EL301 Microstrip Reader The EL301 microstrip reader does not support computer control for its operation. Optical density data stored in the reader, however, can be transferred to KCjunior for analysis. • KCjunior accepts EL301 data in Absorbance (ABSORB) mode, and does not accept data in the Ratio (RATIO), Linear Equation (LINEQU), or Difference (DIFF) modes. • KCjunior accepts data for up to 96 wells with each transfer. ¾To transfer two or three plates of data to KCjunior, send them separately and save each plate under a different name. • If a blank well was read, the EL301 automatically performs blank subtraction before data transfer. • If a dual-wavelength read is performed, the EL301 automatically calculates the Delta OD before data transfer. To collect data from an EL301 reader: 1. Perform the necessary microstrip reads. 2. Connect the reader to the computer on which KCjunior is loaded. ¾Consult the EL301 Operator's Manual for instructions on “Connecting the Model EL301 to an External Computer”. 6-14 • Reading Plates User's Guide to KCjunior 3. In KCjunior, define the Reader Setup parameters as follows: Reader Type: EL301 Com Port: Communication port on computer Baud Rate: 1200 Data Bits: 8 Parity: None Stop Bits: 2 EOT Character: 4 4. Open an existing or define a new protocol. ¾The Well ID Template should correspond with the type of strip(s) read. 8-well strips: A1 to H1, A2 to H2, … A12 to H12. 12-well strips: A1 to A12, B1 to B12, … F1 to F12. 16-well strips: A1 to H2, A3 to H4, … A11 to H12. 5. Select Results|Read Plate, or click the Read Plate button. KCjunior displays the prompt “Press DATA OUT key on reader when ready”. 6. Within the reader's main menu, select the data to be transferred, then press the DATA OUT key. The optical density values are transferred to KCjunior. ¾On the EL301 display, make sure the cursor is positioned under the Strip Number to send data for one strip, or under the Plate Letter to send data for up to six strips. The picture above shows the cursor positioned under the Strip Number. Data for File 1, Plate A, Strip 3 will be sent to KCjunior. The picture above shows the cursor positioned under the Plate Letter. Data for File 4, Plate A, Strips 1 to 6 will be sent to KCjunior. User's Guide to KCjunior Reading Plates • 6-15 ¾Do not position the cursor under the File Number, as shown below: ¾Consult the EL301 Operator's Manual for more information on “Data Output to Peripheral Devices”. 7. Data retrieved from the EL301 can be analyzed, manipulated, saved, and printed in the same manner as any other set of plate data in KCjunior. ¾Overrange reads, unread strips, and unread wells appear as ****** in KCjunior. Reader Runtime Errors If the reader experiences an error, KCjunior attempts to perform data reduction with any data that it received prior to the failure. For example, if the reader experiences an error during the 10th of 12 kinetic reads, results are generated based on reads 1 through 9. KCjunior also displays appropriate error messages with the results. • Refer to the reader’s user guide for information on error messages displayed on the reader. • See Communication Errors in the Troubleshooting section for more information on KCjunior’s error and warning messages. Comments/Warnings Following data reduction, if an error is detected or a condition is present that requires notification, a Comments / Warnings button becomes available in the results display. Click this button to see the comments and/or warnings generated for the plate. • 6-16 • Reading Plates See Comments and Warnings in the Troubleshooting section for specific information on data reduction comments and warnings. User's Guide to KCjunior Selecting a Filter Wheel Cartridge Depending on the prompt options settings in the Setup|Configuration| Filter Wheel Configuration dialog, the Select Filter Wheel Cartridge dialog may appear (applies to FLx800 reader only). This dialog shows the Excitation and Emission filters required by the protocol. The selected filter wheel cartridges must contain filters to support the protocol. 1. Using the drop-down menus, select the desired Excitation and Emission Filter Wheel cartridges. ¾The contents of Excitation and Emission filter wheel cartridges are defined under Setup|Configuration. 2. After selecting a cartridge, clicking View displays the cartridge’s contents. ¾Click Cancel to return to the Select Filter Wheel Cartridge dialog. 3. Click OK to save the changes. ¾If the selected cartridge(s) do not contain the necessary filters to support the current protocol, either select a different cartridge or modify the protocol. User's Guide to KCjunior Reading Plates • 6-17 Exporting Data Plate data can be exported to a file or directly into a Microsoft Excel spreadsheet. The data options available for export depend on the current protocol parameters. For example, if the protocol performs blanking, uses transformations, and generates a standard curve, the raw data, blanked data, transformation results, and/or calculated concentrations can be exported. Note: If no protocol is open, the raw data can still be exported. To export data to a file or to an Excel spreadsheet: 1. Open/Create a protocol (if desired), then read/open a plate. 2. Select Results|Export Data. The Export Data dialog appears: ¾Review the items under “Essential Exporting Information” on page 6-23 before performing a data export. 3. From within the Export Data dialog, choose an Export Destination. ¾Choose File to export the data to a text file. The Export File and Delimiter options are presented. See “Exporting Data to a File” on page 6-19. ¾Choose Directly to Microsoft Excel to export the file to an Excel spreadsheet. The Start Excel Now button and First Excel Cell Location option are presented. See “Exporting Data Directly to Microsoft Excel” on page 6-21. 6-18 • Reading Plates User's Guide to KCjunior Exporting Data to a File To export data to a file: Select Results|Export Data to open the Export Data dialog. 1. From within the Export Data dialog, choose the Export Destination option File. 2. Select the Data Option(s) to be exported. ¾In the Data Options box, highlight the item(s) to be exported, then click the Add button. The selected item(s) will appear in the Selections box. ¾To remove an item from the Selections box, highlight the item and click the Remove button (or double-click). ¾To insert a data option between two items in the Selection box, highlight the item in the Selection box above which the new item will be inserted, highlight the item in the Data Options box, then click Add. 3. Check Output report header to include the Plate ID and the date and time of the plate reading. 4. Check Output data descriptions to include identifying information for each set of plate data. ¾See “Sample Output with Report Header and Data Descriptions” on page 6-23. 5. Check Output empty row between plates to add a blank line after each set of plate data. ¾See “Sample Output with Empty Row Between Plates” on page 6-23. 6. Enter a valid path and file name in the Export File field. ¾Example: C:\KCjunior\Results\Export 01.txt ¾Long file names are supported. If no file extension is specified, KCjunior automatically uses .txt (text file). ¾Alternatively, click Browse to search the directory structure. Locate and highlight the desired file name, then click Open to select it, or travel to the desired file storage location, enter a new file name, then click Open to create/select it. ¾The file can be stored on a computer's hard drive, on a network to which the computer is attached, or on a floppy disk. ¾If the file name already exists, KCjunior provides the option to overwrite the entire contents of the file or to append the new data to the end of the file. User's Guide to KCjunior Reading Plates • 6-19 7. Choose a Delimiter, or define a new one. ¾KCjunior uses delimiters to separate individual values such as raw ODs, calculated concentrations, and transformation results. ¾Choose Tab or Comma, or choose Other and enter a custom delimiter, such as | or #. Example: If the comma delimiter is used, exported Raw Data will resemble the following: 1.235,0.267,0.541,1.749,0.232,2.418 0.784,0.154,1.982,0.247,1.583,3.148 2.961,0.235,1.287,1.768,0.336,0.234 0.984,2.514,1.674,3.992,1.852,0.235 ¾Tip: If the file will be imported by another application, check to see which delimiter(s) that application accepts. 8. Click the Export button. ¾If the file name already exists, KCjunior provides the option to overwrite the entire contents of the file or to append the new data to the end of the file. ¾Note: If exporting data for a multiple-plate endpoint read, the Export Endpoint Plates dialog appears. Specify the First and Last plates to export, then click OK to continue. Export format: All selected data sets are exported for the first plate, then for the second plate, and so on through the last plate. 6-20 • Reading Plates User's Guide to KCjunior Exporting Data Directly to Microsoft Excel To export data to Microsoft Excel: Select Results|Export Data to open the Export Data dialog. 1. From within the Export Data dialog, choose the Export Destination option Directly to Microsoft Excel. 2. If exporting to an existing Excel spreadsheet: ¾Click Start Excel now to launch Excel immediately. ¾Open the spreadsheet. ¾Review the spreadsheet to determine what data is expected and where it should be stored. ¾Important! If the spreadsheet contains formulas or other important information, take the following into consideration to avoid overwriting these cells, and to ensure that the data exports to the correct cells: 'well' is the KCjunior term referring to a location in the microplate, and 'cell' is the Microsoft Excel term referring to a location in the spreadsheet. The spreadsheet may contain formulas that reference other cells in the spreadsheet. Be sure to define the export parameters so that the correct set of plate data is sent to the correct cells. KCjunior exports data starting with well A1 in the specified First Excel Cell Location. ¾Switch back to KCjunior. 3. Select the Data Option(s) to be exported. ¾In the Data Options box, highlight the item(s) to be exported, then click the Add button. The selected item(s) will appear in the Selections box. After each export, KCjunior retains the list of Selections (up to 15), for use with the next export. This is particularly useful if exporting the same set(s) of plate data for multiple plates. ¾To remove an item from the Selections box, highlight the item and click the Remove button (or double-click). ¾To insert a data option between two items in the Selection box, highlight the item in the Selection box above which the new item will be inserted, highlight the item in the Data Options box, then click Add. 4. Check Output report header to include the Plate ID and the date and time of the plate reading. 5. Check Output data descriptions to include identifying information for each set of plate data. ¾See “Sample Output with Report Header and Data Descriptions” on page 6-23. User's Guide to KCjunior Reading Plates • 6-21 6. Check Output empty row between plates to add an empty row after each set of plate data. ¾See “Sample Output with Empty Row Between Plates” on page 6-23. 7. Specify the location (ex. A1, C3, K15) of the first cell in the current Microsoft Excel spreadsheet. ¾This is where the first entry will be made in the spreadsheet. If Output Report Header is enabled, the header is stored in this location, followed by a blank row. The first data value (such as the contents of well A1), is stored below the specified “first cell”. Subsequent values then fill in to the right of and below the first data value. ¾See the sample Excel spreadsheet after data export below: ¾Tip: If performing multiple exports to the same spreadsheet, use the First Excel Cell Location and Output empty row between plates features to append one data set to another, with a row between each set. 8. Click the Export button. ¾Note: If exporting data for a multi-plate endpoint read, the Export Endpoint Plates dialog appears. Specify the First and Last plates to export, then click OK to continue. Export format: All selected data sets are exported for the first plate, then for the second plate, and so on through the last plate. ¾KCjunior launches Excel if it is not already open and then exports the data to the current Sheet. 6-22 • Reading Plates User's Guide to KCjunior Tip: To avoid overwriting the contents of “Sheet1” in Microsoft Excel, choose another Sheet before performing the next data export. Essential Exporting Information • Certain numeric data is annotated by KCjunior when it is displayed. Numeric data is exported, however, without these annotations. Examples of annotations include: Masked wells contain a strike-through, extrapolated concentrations are surrounded by ( ), and ambiguous concentrations are surrounded by { }. • Data that is currently a string, such as OUT, *****, or ?????, is exported exactly as it is displayed in KCjunior. • Data for all wells on the plate is exported, even if the well is considered to be “empty”. For all data options, a well is empty if no ID is assigned to it. For some data options (such as Blanked Data), a well is empty if its Raw Data value is currently masked. • The export utility is not available for the spectral scan read method. Sample Output with Report Header and Data Descriptions Raw Data (405) 0.000,0.500,0.667,0.750,0.800,0.833,0.857,0.875,0.889,0.900 1.423,1.429,1.433,1.438,1.441,1.444,1.447,1.450,1.990,1.991 1.992,1.992,1.993,1.993,1.993,1.993,2.017,2.019,2.021,2.022 2.028,2.029,2.031,2.032,2.033,2.035,2.036,2.037,2.038,2.039 Sample Output with Empty Row Between Plates Kinetic Read 1 (00:00:00) 0.000,0.500,0.667,0.750,0.800,0.833,0.857,0.875 1.423,1.429,1.435,1.438,1.421,1.434,1.497,1.450 1.992,1.992,1.993,1.993,1.993,1.993,2.017,2.019 2.028,2.029,2.031,2.032,2.033,2.035,2.036,2.037 (empty row here) Kinetic Read 2 (00:10:00) 1.010,1.465,1.557,1.793,1.510,1.835,1.987,1.675 2.423,2.429,2.433,2.438,2.441,2.484,2.447,2.450 2.982,2.942,2.895,2.045,2.963,2.223,3.017,3.019 3.028,3.029,3.031,3.032,3.033,3.035,3.036,3.037 User's Guide to KCjunior Reading Plates • 6-23 Viewing Results When plate reading is complete, or after simulation data has been entered or data has been read from a file, KCjunior displays the results in a format similar to the one shown below: Initially, Raw Data results are displayed. Depending on the protocol definition, KCjunior may also display Blanked Data, Pathlength Correction, Transformation Results, Concentrations, Labels, Template, and Plate Formula Results. Some “quick tips” are listed here. Detailed information can be found in the next section, Interpreting Results. • To view a particular type of data, click on its “tab”. • To view statistical information for a particular type of data, click on its tab then click the Statistics button. • To “mask” a well (temporarily exclude it from calculations), place the cursor over the desired well, click the right mouse button, then select Mask Well. • To access more detailed information about the plate, place the cursor in the matrix, click the right mouse button, then select Plate Information. • To access more detailed information for a particular well, place the cursor over the desired well, click the right mouse button, then select Well Information. • If a Comments / Warnings button is available, click it to see the data reduction comments and/or warnings generated for the plate. • To export data to a file or directly into Microsoft Excel, select Results|Export Data. • 6-24 • Reading Plates To copy the data to another application, highlight the desired wells, then press CTRL+C. Switch to the destination application, then press CTRL+V (or select a Paste option). User's Guide to KCjunior Interpreting Results Overview When plate reading is complete, or after simulation data has been entered or data has been read from a file, KCjunior displays the results, as shown below: The Raw Data set of results is always displayed. Raw Data represents the measurements that were either retrieved from the microplate reader, entered manually, or read from a file. Results are arranged with rows and columns that align with the specified plate geometry. Depending on the protocol definition, Blanked Data, Pathlength Correction, Transformation Results, Concentrations, Labels, Template, and Plate Formula Results may also be displayed. Interpreting Results begins by describing the Well Notations that may appear in one or more results categories, then explains how to interpret each of the eight possible sets of results. User's Guide to KCjunior Interpreting Results • 7-1 Well Notations Within the results displays, different circumstances may cause the result in a well to be displayed with a special symbol, such as a strike-through or parenthesis ( ), or to be completely replaced with symbols such as ?????? or OUT. The following list describes the well notations that may appear in results displays and on reports: • If a well contains OUT in place of an OD, RFU, or RLU, the raw data value fell outside the acceptable min/max data range defined in the protocol, and it has been excluded from further calculations. ¾See “General Information” in Defining Protocols for information on setting Raw Data Limits and Blank Limits. • If an OD, RFU, or RLU value is enclosed in brackets [2.999], the raw data value fell outside the acceptable min/max data range defined in the protocol, and was automatically set to the upper or lower limit of this range as appropriate. • If a Raw data value contains a strike-through (2.684), it has been masked, or temporarily removed from calculations. See Results Options at the end of this section for information on masking and unmasking wells. • A well containing DIV/0 indicates a failed attempt to divide by zero. • A well containing asterisks (******) indicates a well status error. • If the concentration in a well is enclosed in parenthesis (20.345), it was calculated through extrapolation. • If the concentration in a well is enclosed in curly braces {10.765}, it is ambiguous. • An empty well indicates no result was calculated. Possible reasons include: ¾If a protocol is open, no Well ID was assigned to this location. ¾The Raw Data value is currently masked. ¾The Raw Data value is out of range (OUT). ¾If the well is empty under Concentrations, Extrapolation may be disabled. 7-2 • Interpreting Results User's Guide to KCjunior • A well containing question marks (??????) indicates that a value could not be calculated. Possible reasons include: ¾The well references another well with a status of: Well Read Error OUT Masked Divide by Zero Well Failure ¾A calculation within or involving the well: attempted an invalid logarithmic function. is syntactically invalid. references an invalid location. references an invalid Well ID. attempted a Standard Deviation on a well group with an insufficient sample population. attempted a Coefficient of Variation on a well group with an insufficient sample population. ¾The well is in a blank sector that contains blanks but none of them are valid. ¾Cutoffs could not be evaluated for the well. ¾A concentration had no valid solutions on the generated curve. ¾The curve could not be generated. User's Guide to KCjunior Interpreting Results • 7-3 Raw Data Raw Data represents the original measurements that were either retrieved from the microplate reader, entered manually, or read from a file. The format of the Raw Data display differs based on the defined Read Method (Endpoint, Kinetic, MultiWavelength, or Spectral Scan), as described on the following pages. Raw Endpoint Read Data Raw Data results for an endpoint read are shown below: • For single-wavelength absorbance reads, each well contains the OD measured at the Primary wavelength. • For dual-wavelength absorbance reads, each well contains the delta OD value calculated by the reader. The reader calculates the delta OD by subtracting the measurement at the Reference wavelength from the measurement at the Primary wavelength. • For fluorescence and luminescence reads, 1 to 6 sets of raw data are presented, depending on the number of filter sets specified in the protocol. Initially, the RFU/RLU values for filter set #1 are presented. Use the drop-down menu at the bottom of the screen to choose a different filter set. • 7-4 • Interpreting Results For multi-plate endpoint reads, use the Plate Number selection box to choose a different plate. User's Guide to KCjunior Raw and Blanked Kinetic Read Data Raw and blanked kinetic data are viewed under the Raw Data tab. View options include sets of individual kinetic reads, the kinetic curve for each well, and the maximum slope for each well. To switch between the different views, click the appropriate Kinetic View Options radio button. Individual Kinetic Reads Raw Data results for individual kinetic reads are shown below: Kinetic data is initially displayed in this format, reporting the raw values for each well of Kinetic Read #1. User's Guide to KCjunior • For single-wavelength absorbance reads, each well contains the OD measured at the Primary wavelength. • For dual-wavelength absorbance reads, each well contains the delta OD value calculated by the reader. The reader calculates the delta OD by subtracting the measurement at the Reference wavelength from the measurement at the Primary wavelength. • For fluorescence or luminescence reads, each well contains the RFU or RLU value calculated for the the first filter set defined in the protocol. If two filter sets are defined, use the Filter Set drop-down menu to choose a different filter set. Interpreting Results • 7-5 • If blank wells were defined in the Well ID template, click the Blanked Data radio button to view the data after blank subtraction. • To view the results for a different kinetic read, enter the desired read number in the Kinetic Read field (or click the up/down arrow buttons). • Click the Calculation Options button to adjust the kinetic read limits, to alter the maximum slope calculation, or to choose a different maximum slope unit of measure. Kinetic Curves Kinetic read results are shown below, in the Kinetic Curve format: To print the Kinetic Curves display as shown here: Press Alt+Print Screen to copy the screen shot to the Clipboard, paste the Clipboard contents into (for example) an empty word processing document, then print the document. • In this format, each well initially displays a graph of the data points corresponding to the OD, RFU, or RLU readings taken over time. • If blank subtraction was performed, the kinetic curves are automatically based on the Blanked values. • Click the Calculation Options button to adjust the kinetic read limits, to alter the maximum slope calculation, or to choose a different maximum slope unit of measure. • To enlarge the view of the curve in an individual well, place the cursor over the desired well and click the left mouse button. The Kinetic Curve dialog appears: 7-6 • Interpreting Results User's Guide to KCjunior ¾The Kinetic Curve and its Maximum Slope and R-Square values are displayed for the well. ¾Click OK to return to the Kinetic Curve results display. Maximum Slope Kinetic read results are shown below, in the Maximum Slope format: User's Guide to KCjunior • The Maximum Slope is initially based on the total number of kinetic points (“single slope”). • If blank subtraction is performed, the maximum slope is automatically based on the Blanked values. • Click the Calculation Options button to adjust the kinetic read limits, to alter the maximum slope calculation, or to choose a different maximum slope unit of measure. Interpreting Results • 7-7 Adjusting Kinetic Read Limits Kinetic calculations initially include all measurements taken over the duration of the plate read. Kinetic read limits can be adjusted so that calculations are based on a subset of the total number of measurements. 1. From within any kinetic results display, click the Calculation Options button to open the Kinetic Calculations dialog: 2. To change the number of points for inclusion in the kinetic calculations, enter a new First Read and/or Last Read value, then click OK. The kinetic results redisplay, showing only the points in the new calculation range. The Maximum Slope automatically recalculates, based on the new calculation range. Altering the Maximum Slope Calculation The Maximum Slope is initially calculated based on the total number of kinetic points (“single slope”). The number of successive points for inclusion in the slope calculation can be adjusted: 1. 7-8 • Interpreting Results From within any kinetic results display, click the Calculation Options button to open the Kinetic Calculations dialog: User's Guide to KCjunior 2. Deselect Single Slope. 3. Enter a new value in the Points / Slope field. 4. (Optional) Select a Maximum Slope Unit of Measure. The default is mOD/min. 5. Click OK. The kinetic results redisplay. The Maximum Slope automatically recalculates, based on the new Points/Slope value. Raw and Blanked Spectral Data Raw and blanked spectral scan data are viewed under the Raw Data tab. View options include sets of ODs at each wavelength, the spectral curve for each well, and the peak OD and corresponding wavelength for each well. To switch between the different views, click the appropriate Scan View Options radio button. Individual Spectral Reads Raw Data results for individual spectral reads are shown below: Spectral data is initially displayed in this format, reporting the Raw OD read for each well at the First Scan Wavelength. User's Guide to KCjunior • To view the Raw ODs for a different wavelength, enter the desired wavelength value in the Wavelength field (or use the up/down arrow buttons). • If a blank well was defined in the Well ID template, click the Blanked Data radio button to view the ODs after blank subtraction. Interpreting Results • 7-9 • Click the Calculation Options button to adjust the wavelength range used for calculations for all scanned wells. • Click the Spectral Chart button to select up to 8 spectral curves to overlay in one graph. Spectral Chart Spectral scan results are shown below, in the Spectral Chart format: • In this format, each well displays a graph of the data points corresponding to the OD readings taken across a wavelength range. • To enlarge the view of the curve in an individual well, place the cursor over the desired well and click the left mouse button. • If blank subtraction was performed, the spectral scan curves are automatically based on the Blanked ODs. • Click the Calculation Options button to adjust the wavelength range used for calculations for all scanned wells. • Click the Spectral Chart button to select up to 8 spectral curves to overlay in one graph. • To enlarge the view of the curve in an individual well, place the cursor over the desired well and click the left mouse button. The Spectral Scan Curve dialog will appear: 7-10 • Interpreting Results User's Guide to KCjunior ¾The Spectral Scan Curve initially contains all ODs read at all wavelengths as defined in the protocol. ¾The Peak OD and its corresponding wavelength display at the bottom of the graph. ¾Move the mouse cursor over a data point to see its exact OD and Wavelength values. ¾Click Print/Copy to print the graph or to copy it to the clipboard. ¾Click Options to adjust the curve calculations and/or the display options for this well. Peak OD/Wavelength Typical spectral scan results are shown below, in the Peak OD/Wavelength format: User's Guide to KCjunior • The peak (highest) optical density reading and its corresponding wavelength value are reported for each well. • The Peak OD is initially based on the complete wavelength range as defined in the protocol. If the wavelength range is adjusted, the Peak OD is redetermined based on the new range. Interpreting Results • 7-11 • If blank subtraction was performed, the Peak OD is automatically based on the Blanked ODs. • Click the Calculation Options button to adjust the wavelength range used for calculations for all scanned wells. • Click the Spectral Chart button to select up to 8 spectral curves to overlay in one graph. Adjusting the Wavelength Range Used for Calculations Spectral scan calculations initially include all measurements taken across the wavelength range as defined in the protocol. The wavelength range can be adjusted so that calculations are based on a subset of the full wavelength range. 1. From within the Spectral Scan results display, click the Calculation Options button to open the Spectral Scan Calculations dialog. 2. To change the range of wavelengths for inclusion in the spectral scan curve for all scanned wells, enter a new First Wavelength and/or Last Wavelength value, then click OK. The Spectral Scan results will redisplay. The spectral curves will show only the points within the new wavelength range, and the Peak ODs will be recalculated. Curve Display Options Click the Calculations Options button to change the curve display. The available curve display options include: 7-12 • Interpreting Results • Display Points only. • Display Line only. This is a point-to-point line, shown without the individual data points. • Display Points and Line. This is a point-to-point line, and the data points are displayed. See the example below: User's Guide to KCjunior Raw MultiWavelength Read Data Raw Data results for a MultiWavelength read are shown below: • Each well contains the OD value measured at the wavelength displayed in the Wavelength field. Use the drop-down list to choose a different wavelength. • If an empty plate was read at a particular wavelength, results will be provided for the Empty plate, the Read plate, and the difference between the two (Result). The read method parameters shown to the left correspond with the results shown above. Read Method parameters User's Guide to KCjunior Interpreting Results • 7-13 Raw Dispense / Read Data Raw data results and kinetic curves are viewed under the Raw Data tab. To switch between the different views, click the appropriate Kinetic View Options radio button. Individual Reads Raw Data results for individual kinetic reads are shown below: Data is initially reported in this format, reporting the raw values for each well of Kinetic Read #1. 7-14 • Interpreting Results • Each well contains the RFU or RLU value calculated for the the first filter set defined in the protocol. If two filter sets are defined, use the Filter Set drop-down menu to choose a different filter set. • The word ‘Dispense’ in a well indicates that a dispense or dispense-related activity occurred (well mode only). • To view the results for a different kinetic read, enter the desired read number in the Kinetic Read field (or click the up/down arrow buttons). User's Guide to KCjunior Kinetic Curves (Dispense/Read) Kinetic read results are shown below, in the Kinetic Curve format: • Each well initially displays a graph of the data points corresponding to the RFU/RLU readings taken over time. • To enlarge the view of the curve in any well, click once on the desired well. ¾Place the cursor over a data point to see its RFU/RLU value and reading Time. ¾Depending on the current Dispense/Read parameters, you can adjust the X Axis Scale and/or select an Interval (sampling window) to view. ¾A dotted green line indicates the start of a dispense. ¾A green triangle indicates that a dispense or dispenserelated activity occurred (well mode only). User's Guide to KCjunior Interpreting Results • 7-15 Blanked Data Blanked Data represents Raw Data that has undergone blank subtraction. The format of the Blanked Data results display differs based on the defined Read Method − Endpoint, Kinetic, MultiWavelength, or Spectral Scan. Note: To view Blanked data for a Kinetic or Spectral Scan read, click the Raw Data tab, then click the Blanked Data radio button under Kinetic or Scan View Options. See “Raw and Blanked Kinetic Read Data” on page 7-5 or “Raw and Blanked Spectral Data” on page 7-9 for more information. Blanked Endpoint Read Data Blanked Data results for an Endpoint read are shown below: • If a single-wavelength absorbance read was performed, each well contains the OD measured at the Primary wavelength, less the average of the blank wells. • If a dual-wavelength absorbance read was performed, each well contains the delta OD value calculated by the reader, less the average of the blank wells. • For fluorescence and luminescence reads, 1 to 6 sets of data are presented, depending on the number of filter sets specified in the protocol. Initially, the RFU/RLU values for filter set #1 are presented. Use the drop-down menu at the bottom of the screen to choose a different filter set. 7-16 • Interpreting Results User's Guide to KCjunior Blanked MultiWavelength Data Blanked Data results for a MultiWavelength read are shown below: • Each well contains the OD value after blank subtraction. • Use the drop-down list to view Blanked Data for a different wavelength. • If an empty plate is read for a particular wavelength, the empty plate measurements are subtracted from the raw data measurements to generate the Result values (e.g. “405 Result”). Blank subtraction is then performed on the Result values. Pathlength Correction Pathlength Correction can be enabled to normalize absorbances to 1 cm. Its use is controlled within a MultiWavelength protocol’s Read Method dialog. See page 5-16 for more information. If Pathlength Correction is enabled, KCjunior first calculates the pathlength for each well. The absorbance in each well is then divided by the pathlength, resulting in the corrected absorbance. When calculations are complete, the corrected absorbances are displayed under the Pathlength Correction results tab. Typical results are shown on the next page: User's Guide to KCjunior Interpreting Results • 7-17 • The Corrected ODs are initially displayed. • Click the Pathlengths radio button to view the pathlength value for each well. • Each corrected well contains the result of the following formula: (A[wavelength]well) ÷ pathlength of well The method used to calculate pathlengths depends on the Pathlength Correction parameters defined under the Read Method tab in the protocol. See page 5-16 for more information. • To view the corrected absorbances at a different wavelength, choose a value from the Wavelength drop-down menu. • If Bio-Tek’s Bio-Cell plate was used to calculate the absorbance of water at 1 cm value, click the Bio-Cell Results button to see the absorbance readings at the Test and Reference Wavelengths. 7-18 • Interpreting Results User's Guide to KCjunior Transformation Results Transformation Results are displayed if at least one Transformation Formula was applied to one or more wells on the plate. Transformation Formulas are applied according to a certain structure. See “Essential Information” in Getting Started for more information. • Each well contains the result of its Transformation Formula, if one was applied. Otherwise, the well contains its Raw, Blanked, or Corrected value. • For Kinetic reads, Transformation Formulas are applied to the Maximum Slope. • For MultiWavelength reads, Transformation Formulas are applied to the Raw or Blanked Data for the first defined wavelength, unless the WV function is used to specify a different wavelength. • For multiple Filter Set reads, Transformation Formulas are applied to the Raw or Blanked Data for the first defined filter set, unless the FS function is used to specify a different filter set. See “Defining Transformations - Formula Syntax” in Defining Protocols, for more information on the WV and FS functions. User's Guide to KCjunior Interpreting Results • 7-19 Concentrations Concentrations are reported if curve parameters are defined in the protocol and if the curve generated successfully. Concentrations are calculated for every well on the plate, based on the standard curve and according to a certain structure. See “Essential Information” in Getting Started for more information. 7-20 • Interpreting Results • Each well contains its calculated concentration. • For Endpoint reads, curves are based on the OD, RFU, or RLU values. • For Kinetic reads, curves are based on the Maximum Slope values. • For MultiWavelength reads, curves are based on the measurements at the first defined wavelength unless Transformation Formulas utilizing the WV function are applied to specify a different wavelength. • For multiple Filter Set reads, curves are based on the measurements at the first defined filter set, unless Transformation Formulas utilizing the FS function are applied to specify a different filter set. • See “Defining Transformations - Formula Syntax” in Defining Protocols, for more information on the WV and FS functions. • Click the Standard Curve button to view the graph (see next page). User's Guide to KCjunior The Standard Curve The Standard Curve dialog displays the calculated curve and provides options for printing, copying, and storing the curve, and for editing standard outliers and/or curve parameters: To access advanced graphing options, place the cursor inside the graph and click the right mouse button. • Click Print/Copy to print the graph, or copy it to the Clipboard. ¾A Curve Report can be printed if it is selected as a reporting option within the protocol. See page 5-61 for more information. • If the Calculate Interpolation Value curve parameter is selected in the protocol, click Interpolation to see the concentration calculated for the value. • Click Curve Params to change any curve fitting parameters. • Click Edit Stds… to suppress or restore one or more standards. Note: This feature is not available for titer or stored curves. Alternatively, click on a standard point in the graph to temporarily exclude it from curve calculations. Click again to restore the standard. User's Guide to KCjunior • Click Store the Curve to store a standard curve for use with other protocols. • Toggle the Display Legend setting to include/exclude a legend in the graph. • Click OK to close the Standard Curve dialog. Any changes to the standards will be reflected in the results calculations. • Click the right mouse button inside the graph to access advanced graphing options. Interpreting Results • 7-21 Titer Curves If titer curves were generated, clicking the Standard Curve button opens the Sample List dialog: • Select up to 8 samples to be overlaid in one graph. • Press the Shift key while using the mouse to select contiguous IDs (ex. SMP01-04). • Press the Ctrl key while using the mouse to select noncontiguous IDs (ex. SMP02, 05, 07, 08). • Click the OK button to view the graph: ¾If Graph Interpolation Result is enabled under Setup|Configuration|Reporting Options, the interpolation value will be plotted on the curve. The value will not be reported, however, if more than one sample is selected. ¾Data points cannot be edited within this dialog. To exclude a well from the curve, return to the Raw Data results display and Mask the desired well. 7-22 • Interpreting Results User's Guide to KCjunior ¾Click Print/Copy to print the graph, or copy it to the Clipboard. Note: A Titer curve report can also be printed if it is selected as a reporting option within the protocol. ¾Click Titer Results to view Curve Parameters, R-Square values, and Interpolation results for all samples on the plate. ¾Toggle the Display Legend setting to include/exclude a legend in the graph. ¾Click the right mouse button inside the graph to access advanced graphing options. ¾Click OK to close the Titer Curve dialog. Titer Results Regardless of the number of titer curves selected for viewing, the Titer Results dialog shows results for all samples defined for the plate. User's Guide to KCjunior • The curve fitting method chosen in the protocol and its equation are displayed under Curve Type. • If defined in the protocol, the Interpolation Value is provided. • Each Sample ID is listed in alphabetical order. • For each sample, the Curve Parameters and corresponding R-Square values are reported. • If an interpolation value was defined, its calculated value for each titer curve is reported in the Interpolation column. Interpreting Results • 7-23 Interacting with the Graph The displayed graph can be scaled, moved, and zoomed, and the altered display can then be printed or copied to the Clipboard. The graph report name and and curve equation information does not scale, move, or zoom with the graph. Note: At any time, press “r” to reset the graph to its original size and position. To scale the graph: 1. Press and hold the Ctrl key. 2. Press and hold both mouse buttons (or the middle button of a 3-button mouse). 3. Move the mouse down to increase the graph size, or up to decrease the graph size. To move the graph: 1. Press and hold the Shift key. 2. Press and hold both mouse buttons (or the middle button of a 3-button mouse). 3. Move the mouse to change the position of the graph. To zoom in on a portion of the graph: 1. Press and hold the Ctrl key. 2. Press and hold the left mouse button. 3. Drag the mouse to select the zoom area. 4. Release the mouse button before releasing the Ctrl button. To zoom in on a portion of the graph and have the axes adjust accordingly: 1. Press and hold the Shift key. 2. Press and hold the left mouse button. 3. Drag the mouse to select the zoom area. 4. Release the mouse button before releasing the Shift button. Advanced Graphing Options Clicking the right mouse button from within the graph provides access to many advanced graphing options, including: 7-24 • Interpreting Results • Creating a border around the entire chart. • Changing the color of the background, foreground, lines, and symbols. • Scaling the X and/or Y axis to better focus in on the curve. User's Guide to KCjunior • Changing the title and font of the X and/or Y axis. • Adding a legend to the graph. • Adding informative labels to the graph. Printing and Copying the Graph The graph and any edits made to it can be copied to the clipboard or printed. To print or copy the graph: 1. Click the Print/Copy button. A selection list will appear: 2. Click the Print Chart button to print the graph. 3. Click the Copy Chart to Clipboard button to copy the graph to the Clipboard. The graph can then be pasted into another program. 4. Click Cancel to return to the graph. Editing the Standard Curve After the standard curve has been generated, one or more standards can be temporarily excluded from the recalculation of the curve. This feature does not apply to titer curves or stored curves. There are two ways to edit the standard curve: 1. From within the Standard Curve dialog, click once on the standard point to be excluded. The selected standard will dim, and the curve will automatically attempt to recalculate. ¾Restore an edited standard by clicking on it once. The curve will automatically recalculate. 2. User's Guide to KCjunior Click the Edit Stds… button to open the Edit Standards Dialog. This dialog lists each standard with its Y-Axis Value, Concentration (as defined in the protocol), and current Status. Interpreting Results • 7-25 ¾If the Status field is empty, the standard is currently included in the curve calculation. Click the checkbox to suppress the standard. ¾If the Status field contains “Suppressed” the standard is currently suppressed. Click the checkbox to restore the standard. ¾Click OK to close the dialog and return to the Standard Curve dialog. The curve will automatically recalculate. Storing the Standard Curve The standard curve can be stored for use by another protocol. This feature does not apply to titer curves. To store a standard curve: 1. From within the Standard Curve dialog, click the Store the Curve button. The Stored Curve dialog will appear. 7-26 • Interpreting Results 2. Enter a unique name and click OK to store the curve and return to the Standard Curve dialog. 3. Click OK to close the Standard Curve dialog and return to the Concentrations results display. User's Guide to KCjunior Labels Labels are displayed if cutoffs are defined in the protocol. • Each well contains the Label assigned to it after cutoff evaluation. • For Endpoint reads, cutoff evalution is based on the OD, RFU, or RLU values. • For Kinetic reads, evaluation is based on the Maximum Slope values. • For MultiWavelength reads, evaluation is based on the measurements at the first defined wavelength unless Transformation Formulas utilizing the WV function are applied to specify a different wavelength. • For multiple Filter Set reads, evaluation is based on the measurements at the first defined filter set, unless Transformation Formulas utilizing the FS function are applied to specify a different filter set. See “Defining Transformations - Formula Syntax” in Defining Protocols, for more information on the WV and FS functions. • User's Guide to KCjunior Click the Cutoff Values button to see the cutoff criteria, the calculated cutoff value(s), and the labels assigned to each cutoff zone. Interpreting Results • 7-27 Template Well identification information can be viewed under the Template tab. • The Well ID or Sample ID and corresponding concentration/dilution value are displayed for each well. • Well IDs are used to identify the four well types supported by KCjunior – Blank, Standard, Sample, and Control. 7-28 • Interpreting Results User's Guide to KCjunior Plate Formula Results Plate Formula Results are displayed if a Plate Formula is defined in the protocol. • Each well contains the result of the Plate Formula defined in the protocol. • For Endpoint reads, the Plate Formula is based on the OD, RFU, or RLU values. • For Kinetic reads, the Plate Formula is based on the Maximum Slope values. • For MultiWavelength reads, Plate Formulas are applied to the Raw or Blanked Data for the first defined wavelength, unless the WV function is used to specify a different wavelength. • For multiple Filter Set reads, Plate Formulas are applied to the Raw or Blanked Data for the first defined filter set, unless the FS function is used to specify a different filter set. See “Defining Transformations - Formula Syntax” in Defining Protocols, for more information on the WV and FS functions. User's Guide to KCjunior Interpreting Results • 7-29 Statistics Within each results display, the Statistics button is available if a Well ID Template is defined in the protocol. When the Statistics button is clicked, KCjunior automatically calculates and displays the mean, standard deviation, and coefficient of variation of every replicate group. • Click the Samples, Statistics, or Controls button to see a different set of statistics, or click OK to return to the results display. • For MultiWavelength reads, the Raw Data column contains the Read (or Result, if an empty plate was read) values for the first defined wavelength. The Blank Data column contains the blanked data for the first defined wavelength. • For multiple Filter Set reads, the Raw and Blank Data columns contain the raw and blanked values for the first defined filter set. • If viewing statistics for a titer protocol, click the Titer Results button to view curve parameters, r-square values, and interpolation results for all samples on the plate. • The information provided in the Statistics dialog depends on the protocol parameters. The following may be displayed: Well ID The identifier assigned to each well. Loc The location of the Well ID in the plate. Note: If viewing statistics for a protocol that uses a stored curve, the Loc values for the standards will contain XXX. 7-30 • Interpreting Results User's Guide to KCjunior Blank Data If the protocol specifies blanking and does not contain transformation formulas, the Blank Data will be displayed. Calc Conc If concentrations were calculated, they will be displayed in the Calc Conc column. Corrected If Pathlength Correction is enabled in the protocol (MultiWavelength reads only) to normalize absorbances to 1 cm, the Corrected ODs will be displayed. Concentration If viewing statistics for a protocol that uses a stored curve, the concentration values (as defined in the protocol) will be displayed in the Concentration column. Dilution If dilutions were assigned in the protocol, they will be displayed in the Dilutions column. Label If cutoff criteria are specified, the Label will be displayed for every replicate and group mean. Max Slope The Max Slope is reported for kinetic protocols. Mean The Mean is automatically calculated for every multiple-replicate standard, control, blank, and sample group. Note: The Mean is not displayed for samples/controls with multiple dilutions. Raw Data If the protocol does not specify blanking or contain transformation formulas, the Raw Data will be displayed. Std Dev, CV% The Standard Deviation and CV% are automatically calculated for every multiplereplicate standard, control, blank, and sample group. Note: CV% = 100*(Std Dev/Mean) User's Guide to KCjunior Transform If the protocol contains transformation formulas, the results will be displayed in the Transform column. Y-Axis Data If viewing statistics for a protocol that uses a stored curve, the Y-Axis Data will be displayed for the standards. Interpreting Results • 7-31 Auto Sensitivity Results For fluorescence and luminescence readers, KCjunior provides an Automatic Sensitivity Adjustment feature as an alternative to the more manual method of defining multiple filter sets with varying sensitivity settings. See “Defining Filter Sets” under Defining Protocols for more information. If this feature is enabled, KCjunior instructs the reader to perform several pre-readings on the microplate. In general, these readings are performed on user-specified wells using incremental sensitivity settings. Each increase in sensitivity raises the RFU/RLU values of all of the wells. If the Automatic Sensitivity Adjustment option Scale to High/Low Range is selected, KCjunior compares the results of the pre-readings and selects the sensitivity that gives the best signal-to-noise ratio when comparing one (higher) set of wells with another (lower) set of wells. The entire microplate is then read using this sensitivity setting. A graph showing the results of these pre-readings can be viewed from the results dialog, by clicking the Auto Sensitivity button. The Auto Sensitivity Results dialog appears: 7-32 • Interpreting Results • This graph can be viewed during or following the automatic sensitivity adjustment process. • Each point represents the signal-to-noise ratio calculated at a particular sensitivity setting. • To change the filter set(s) shown in the graph, select or deselect the Filter Set checkboxes. • This graph is not saved with the plate. Click Print/Copy to print the graph or to copy/paste it into another application. User's Guide to KCjunior • If the message “There is no valid auto sensitivity data to display” appears, an error occurred during the auto sensitivity adjustment process. See “Comments and Warnings” in the Troubleshooting section of this guide for more information. Automatic Sensitivity Adjustment Process The automatic sensitivity adjustment process (for the Scale to Low/High Range option) is performed as follows: • Using the filter set parameters provided, an initial reading is performed on the designated “pre-reading” wells, using a sensitivity setting of 25. • A signal-to-noise ratio is calculated. If it is found to be valid, the sensitivity setting and the value are retained for further evaluation. • The sensitivity is then increased by increments of 25 and additional readings are made until one of the following conditions are met: Condition 1 (success) If two successive valid signal-to-noise ratios are within either 0.1 or 5 percent of each other, then 2 additional readings are performed using sensitivity settings at one-quarter increments between the sensitivity of those readings. For example, if the signal-to-noise ratio at sensitivities 50 and 75 are 120.31 and 120.38, respectively, then additional readings will be performed at sensitivities 55, 60, 65, and 70. The valid signal-to-noise ratios of the 6 successive readings are then compared to determine the highest value. The sensitivity of the highest signal-to-noise ratio is then chosen for the actual filter set read. If the highest signal-to-noise ratio occurs at multiple sensitivity settings, then the highest sensitivity will be selected. Condition 2 (success) If Condition 1 is not met after a sensitivity reading of 250 or before the sensitivity at which one or more of the High Wells exceeds the High Value, then the sensitivity of the highest valid signal-to-noise ratio acheived is chosen for the actual filter set read. If the highest signal-to-noise ratio occurs at multiple sensitivity readings, then the highest sensitivity is selected. Condition 3 (failure) If Condition 2 is not met because there are no valid signal-tonoise ratios, then an error message will appear and the read will be terminated. User's Guide to KCjunior Interpreting Results • 7-33 Condition 4 (failure) If none of the previous conditions are met, then an error message will appear and the read will be terminated. Signal-to-Noise Ratio Calculation • If there are multiple Low Wells and Test Wells defined in the protocol, the signal-to-noise ratio is calculated as follows: (Mean of the Test Wells - Mean of the Low Wells) / Total Standard Deviation where Total Standard Deviation = SQRT((Std Dev of the Test Wells)^2 + (Std Dev of the Low Wells)^2)) • If there is a single Low Well and/or a single Test Well, the signal-to-noise ratio is calculated as follows: (Mean of the Test Wells - Mean of the Low Wells) / Mean of the Low Wells Results Options From within any results matrix, highlighting a well and clicking the right mouse button produces a sub-menu with a variety of options: Accessibility to some Results Options depends on the protocol definition, the current results display, and the method of obtaining plate data. For example, “Modify Simulation Data” is not available if the plate data was retrieved from a microplate reader. All Results Options are described below and on the following pages. Plate Information Detailed Plate Information is available from within any results display. To access this information: 7-34 • Interpreting Results 1. Highlight any well in any results matrix. 2. Click the right mouse button. The Results Options menu will appear. User's Guide to KCjunior 3. Select Plate Information. The Plate Information dialog appears: ¾The Plate ID is an optional identifier associated with the plate. It is entered at run time, either manually or via a reader’s plate barcode scanner. The ID can be changed here if the result file has not yet been saved. ¾The date and time of the plate reading is displayed in the Plate Read Time field. ¾The possible Plate Status values are: OK if the plate was read without error. Aborted if the plate read was aborted before completion. Reader Control Error if the reader experienced a failure before the completion of the read and could no longer respond to KCjunior. Reader Error [code] if the reader experienced a failure before the completion of the read and was able to communicate an error code. ¾The Reader field contains the reader model with which the plate was read. ¾The name of the person to whom KCjunior is registered appears as the default in the Created By field. The name can be changed here if the plate has not yet been saved. ¾If applicable, the Temperature will be reported, in degrees Celsius. This value reflects the temperature of the incubation chamber at the time the plate was read. ¾If the Monitor Well feature was enabled in the protocol, the dialog displays the elapsed time between the start of the User's Guide to KCjunior Interpreting Results • 7-35 monitoring process and the point when the monitored well(s) met the specified criteria. ¾The Plate Description can be defined or edited in this dialog. ¾To see the Read Method parameters defined for this plate, click the Read Method button. ¾Click OK to save any changes and return to the previous dialog. ¾Click Cancel to close this dialog without saving changes. Well Information Detailed Well Information is available for any well, from within the Raw Data results display. To access this information for a particular well: 1. Click the Raw Data results tab. 2. Place the cursor over the desired well and click the right mouse button. The Results Options menu will appear. 3. Select Well Information. The Well Information dialog will appear: ¾The Well Location represents the well’s location in the microplate, in row by column format. ¾For a multiple-plate Endpoint read, the Read Number represents the plate for which the raw data value in this well was measured. ¾If the read is Kinetic, the Kinetic Read represents the read during which the raw data value in this well was measured. ¾For a MultiWavelength read, the Wavelength field shows the wavelength associated with the current Read Value, and Empty, Read, or Result, as appropriate for the data set. ¾The Read Value is the original unchanged Raw Data value. Note: A Read Value of -99.99 or -99,999 indicates a well error (see Read Status, Error on the next page). 7-36 • Interpreting Results User's Guide to KCjunior ¾The possible Read Status values are: OK if the well was read without error. Out if the Read Value falls outside the acceptable min/max data range and Discard Out of Range Values is selected. Over if the Read Value exceeds the upper limit of the acceptable min/max data range and Discard Out of Range Values is not selected. Under if the Read Value falls below the lower limit of the acceptable min/max data range and Discard Out of Range Values is not selected. Error if the reader determined the OD, RFU, or RLU of the well to be significantly out-of-range. ¾If the Read Status is Over or Under, the Adjusted Value contains the Raw Data Limits or Blank Limits Maximum or Minimum Value as defined in the protocol. ¾Click OK to close the dialog and return to the results display. Masking Wells Within any results display, individual wells can be masked, or temporarily excluded, from a recalculation of the results. For example, a standard replicate with an atypical absorbance can be temporarily masked and excluded from the recalculation of the standard curve. To Mask a well: 1. Place the cursor over the desired well and click the right mouse button once. The Results Options menu will appear. 2. Select Mask Well to mask the current well. If the read is kinetic, the well will be masked only in the current kinetic read. Select Mask All Reads to mask the current well across all kinetic reads. ¾In the Raw Data results display, the value in a masked well appears with a line running through it (ex. 1.275). ¾In other results displays, the well will be empty. To Unmask a well: 1. Place the cursor over the desired well and click the right mouse button. The Results Options menu will appear. 2. Select √ Mask Well to unmask the current well. If the read is kinetic, the well will only be unmasked in the current kinetic read. Select Unmask All Reads to unmask the current well from all kinetic reads. User's Guide to KCjunior Interpreting Results • 7-37 Modifying Simulation Data If results were generated based on manually entered measurements, the measurements can be modified from within the Raw Data results display. To modify manually-entered (simulated) data: 1. Click the Raw Data tab. 2. Place the cursor over the desired well and click the right mouse button once. The Results Options menu will appear. 3. Select Modify Simulation Data. The Simulation Well dialog will appear: ¾The Well Location represents the well's location in the microplate, in row x column format. ¾If the read is kinetic, the Read Number represents the read during which the value for this well was measured. ¾The Read Value is the current value in the well. 4. 7-38 • Interpreting Results Edit the Read Value, then click OK to return to the Raw Data results display. User's Guide to KCjunior Printing Reports Reports After plate data has been acquired and data reduction is complete, KCjunior can generate a user-customizable set of reports. Available reports include the Protocol, Raw Data, Maximum Slope, Formula, Column, and Curve Reports, as well as the configurable Matrix Report. Reporting options are selected and customized within a protocol, under the Report tab. See “Defining Protocol Parameters - Reports” in Defining Protocols for more information. Note: A protocol must be open to print most reports. If no protocol is open, however, a Raw Data Report containing just the raw plate data can be printed. Print Preview Before actually printing reports, select Results|Print Preview to see what they will look like. • For multiple-plate endpoint reads, the Print Endpoint Plates dialog appears. ¾The Number of Plates field contains the total number of plates that were read. ¾Adjust the First Plate to Print and Last Plate to Print values to preview a subset of the total number of plates. ¾Click OK to continue with the preview. User's Guide to KCjunior Printing Reports • 8-1 • The Print Preview dialog can display one or two pages at a time. ¾Click to view the next page of the report. ¾Click to view the previous page. ¾Click or to change the view. ¾Click to access the Print dialog, to select a printer and related options. ¾Click to close the print preview dialog and return to the KCjunior main screen. Print Results Select Results|Print Results to print the reports. • If printing reports for a multiple-plate endpoint read, the Print Endpoint Plates dialog appears. ¾The Number of Plates field contains the total number of plates that were read. ¾Adjust the First Plate to Print and Last Plate to Print values to preview a subset of the total number of plates. ¾Click OK to continue with the preview. 8-2 • Printing Reports User's Guide to KCjunior Print Setup To change the printer, paper size or source, or page orientation, select Results|Print Setup to access a standard Windows Print Setup dialog. The Print Setup dialog appears: User's Guide to KCjunior • To select a different printer, click the Printer Name drop-down arrow. • To change print properties such as paper type and resolution, click the Properties button. • To select a different paper size, click the Paper Size drop-down arrow. • To select a different paper source, click the Paper Source dropdown arrow. • To select the paper orientation, click the Portrait or Landscape radio button. • Click OK to save the changes and return to the KCjunior main screen. Printing Reports • 8-3 8-4 • Printing Reports User's Guide to KCjunior Utilities Overview Special reader and database maintenance services are accessible through the Utilities menu, including: • Incubation Control (reader-dependent) • Carrier Out/In (reader-dependent) • Dispenser Control Panel • Reader System Test • Universal Plate Test • Database Maintenance functions: ¾Creating empty Results and Protocol Databases for archiving. ¾Archiving results records, protocols, stored curves, and reader system and universal plate tests. ¾Deleting protocols from the current Protocol Database. ¾Deleting results records, stored curves, and reader system and universal plate tests from the current Results Database. User's Guide to KCjunior Utilities • 9-1 Incubation Control If the attached reader supports incubation, the Incubation Control utility is available. Use this utility to set the incubation setpoint temperature and duration, then to turn on the reader’s incubator and allow it to stabilize before performing a plate read. • Note: For the EL312I and EL340I readers, the Incubation Control utility does not set or monitor the reader temperature. This utility can, however, be used as a timer while the incubation temperature rises to and settles at a setpoint. See step 6 for more information. An alternative method for controlling incubation is to define incubation information in a protocol. If the protocol is open, KCjunior will automatically turn on the reader's incubator when a plate read is initiated. The plate read will begin when the incubation temperature reaches and stabilizes at the setpoint temperature. To use the Incubation Control utility: 1. Ensure that the reader is properly connected to the computer, and that all communication parameters are set correctly. 2. Select Utilities|Incubation Control . The Incubation Control dialog appears: Incubate a plate now. 3. To turn the incubator on and incubate a plate now: ¾Click the On radio button. ¾Enter the Set Point temperature. The valid range for most readers is from 20°C (or 4°C above room temperature, whichever is greater), to 50°C. ¾Deselect Indefinite duration. ¾Enter the incubation Duration in seconds. 9-2 • Utilities User's Guide to KCjunior ¾Click Start. The Read Plate dialog appears, showing the Actual Temperature of the reader as it rises toward the setpoint. Click the Override button to begin the incubation before the setpoint temperature is reached. Note: The acceptable temperature range for plate reading for most readers is +/- 2°C of the setpoint temperature. Because of this, KCjunior may provide the “Place plate on carrier” indication when the reader temperature is within 2°C of the set point temperature. The incubator temperature will continue to rise and then stabilize at the set point temperature. ¾When the setpoint temperature is reached, place the plate in the carrier, then click OK. The plate incubation will begin. KCjunior will display the Time Remaining. Click the Abort Incubation button to stop the plate incubation. ¾When the incubation is complete, remove the plate from the carrier. Incubate a plate later. 4. To turn the incubator on now and incubate a plate later: ¾Click the On radio button. ¾Enter the Set Point temperature. The valid range for most readers is from 20°C (or 4°C above room temperature, whichever is greater), to 50°C. User's Guide to KCjunior Utilities • 9-3 ¾Select Indefinite duration. ¾Click Set. The Incubation dialog will close and the reader temperature will begin to increase or decrease appropriately. Turn the incubator off. 5. To turn the incubator off: ¾Click the Off radio button. ¾Select Indefinite duration. ¾Click Set. The Incubation dialog will close and the reader temperature will begin to decrease to room temperature. Set a timer. 6. To set a timer (EL312I and EL340I readers only): ¾Manually set the temperature on the EL312I or EL340I. Refer to the reader's user manual for instructions. ¾In KCjunior's Incubation dialog, enter the Set Point temperature (optional, for visual effect only). ¾Click the Start button to start the timer. ¾When the timer reaches 0, KCjunior will provide an indication to place the plate in the carrier. Carrier Out/In If the reader type specified under Setup|Reader supports computercontrolled operation of the plate carrier or door, the Carrier Out and Carrier In options are accessible in the Utilities Menu. • Select Carrier Out to open the door or to extend the plate carrier. • Select Carrier In to close the door or to retract the plate carrier. Dispenser Control Panel For the FLx800 reader with the optional reagent dispense capability, KCjunior provides a Dispenser Control Panel. The panel displays the current dispenser status and provides access to dispenser-specific functions such as prime and purge. To access the Dispenser Control Panel: 9-4 • Utilities 1. Ensure that the reader is properly connected to the computer, and that all communication parameters are set correctly. 2. Ensure that FLx800 is selected as the Current Reader. 3. Select Utilities|Dispenser Control Panel. User's Guide to KCjunior • Sampling Windows Supported: The maximum number of unique sample measurement scenarios supported per well per kinetic read in a Dispense / Read protocol. • Number of Dispensers Supported: The maximum number of dispensers that the reader currently supports. For each dispenser, the following information is provided: • Connected: Indicates whether or not the reader recognizes that the dispenser is connected. • Initialized: Indicates whether or not the dispenser is initialized and ready for use. • Primed: Indicates whether or not the prime operation has been run since the dispenser was last initialized. • Injector Position: Displays the reader’s current injector position setting (Top or Bottom). • Dispense Events: The maximum number of dispenses supported per well in a Dispense / Read protocol. Initializing the Dispenser If the dispenser was connected before the reader was turned on, or if a system test was run, the dispenser should initialize automatically. If for any reason the dispenser does not initialize automatically, you can initialize it from KCjunior. This may be necessary if the dispenser was connected to the reader after the reader was turned on, or following the installation of a new syringe. To initialize the dispenser: User's Guide to KCjunior 1. Select Utilities|Dispenser Control Panel. 2. Click Initialize Dispenser. The dispenser’s syringe drive will move to its home position and its sensors will be verified. Utilities • 9-5 Priming the Dispenser The dispenser’s syringe and tubing must be fully primed with the desired fluid before plate reading can begin. In addition, the FLx800 operator’s manual contains decontamination procedures that require the dispenser to be primed. Important: A special priming plate (Bio-Tek part number 7142002) must be placed in the carrier prior to priming. To prime the dispenser: 1. Fill the supply bottle with the desired fluid. 2. Place the priming plate on the carrier. 3. In KCjunior, select Utilities|Dispenser Control Panel. 4. Click Prime Dispenser. 5. Enter the desired Prime Volume, from 5 to 5000 ul. 6. Select a Prime Dispense Rate from 1 to 4. ¾Note: With each rate selection, the corresponding ul/sec value is displayed. 7. Click Start Prime to begin the prime. Purging the Dispenser KCjunior provides a utility for purging fluid from the dispenser by pumping the fluid in reverse, back into the supply bottle. Important: The tip priming trough must be placed in the carrier prior to purging. During this process, the carrier is positioned so that the tip priming trough sits under the fluid injector head. To purge the dispenser: 9-6 • Utilities 1. Ensure that the tip priming trough is in place on the carrier (see the FLx800 operator’s manual for placement instructions). 2. In KCjunior, select Utilities|Dispenser Control Panel. 3. Click Purge Dispenser. 4. Enter the desired Purge Volume, from 5 to 5000 ul. 5. Click Start Purge to begin the purge. User's Guide to KCjunior Setting the Injector Position The FLx800’s fluid injector head can be positioned either next to the top probe or directly above the bottom probe. Refer to the FLx800 operator’s manual for details. If the fluid injector head is moved, the reader software must be reconfigured accordingly; this can only be done through KCjunior. To configure the injector position setting: 1. In KCjunior, select Utilities|Dispenser Control Panel. 2. Click Set Injector Position. 3. Click the radio button associated with the Injector Position (next to top probe, or above bottom probe). 4. Click Set Position. The message “Injector position setting successfully completed” should appear. 5. Click OK to return to the Dispenser Control Panel. The Injector Position field will display the new position. Syringe Setup KCjunior provides access to special Syringe Setup functions for maintenance and calibration purposes. • Important: Do not change the syringe position or calibrate the dispenser unless instructed to do so as part of installation, upgrade, or maintenance. Moving the Syringe to its Maintenance Position If the syringe needs to be installed or replaced, it must first be moved to its Maintenance Position. To do this from KCjunior: 1. Select Utilities|Dispenser Control Panel. 2. Click Syringe Setup. 3. Click Move Syringe to Maintenance Position. The syringe plunger will move to its furthest-from-home position. The syringe can then be disconnected from the drive bracket and unscrewed from the valve (see the FLx800 operator’s or service manual for further details). User's Guide to KCjunior Utilities • 9-7 Diagnostics The Reader System Test and the Universal Plate Test should be performed routinely to validate and document the consistency of a reader’s optical and electronic performance, alignment, accuracy, reproducibility, and linearity. Reader System Test The Reader System Test validates and documents the consistency of reader optical and electronic performance. For most readers, this test can be performed from within KCjunior. To perform a Reader System Test: 1. Ensure that the reader is properly connected to the computer, and that all communication parameters are set correctly. 2. From the Utilities menu, select Diagnostics, then Reader System Test. The System Test dialog appears: 9-8 • Utilities 3. Enter the Reader Serial Number, and an appropriate Comment if desired. 4. Click the Run Test button. KCjunior performs the test and displays the results. Sample test results are shown on the next page. User's Guide to KCjunior ¾Results should show SYSTEM TEST PASS. ¾If the test fails and the reader begins “beeping”, press the Stop button on the reader. The reader should then send an error code to KCjunior, resembling the following: ***SYSTEM TEST FAIL*** ERROR (0302) DETECTED Refer to the reader’s user manual for a list of error codes and their potential causes. ¾Click Print to print the results, or OK to close the results. Test results are automatically saved in the Results Database. Reader System Test History When a Reader System Test is complete, the test results are automatically saved to the Results Database. These test results can viewed at any time. To view historical Reader System Test results: 1. Select Utilities|Diagnostics|Reader System Test History. The View Test dialog appears, listing the test results: ¾The list is sorted by date. To switch between ascending and descending sort order, click the Test Results column header. User's Guide to KCjunior Utilities • 9-9 2. Highlight the desired test, then click the View Test button to view the results. 3. Click OK to close the results and return to the View Test dialog. 4. View another test, or click the Exit button to return to the main screen. Universal Plate Test The Universal Plate Test utilizes Bio-Tek’s Universal Calibration Test Plate to validate and document the consistency of reader alignment, accuracy, reproducibility, and linearity. For most readers, this test can be performed from within KCjunior. To perform the Universal Plate Test: 1. Ensure that the reader is properly connected to the computer, and that all communication parameters are set correctly. 2. The reader should be equipped with the necessary filters to perform the test. Refer to the calibration data table that came with the test plate to determine the required wavelengths. 3. Select Utilities|Diagnostics|Universal Plate Test to access the Universal Test Plate Dialog. 4. Examine the contents of the Universal Plate ID list box. The Universal Plate ID list box should contain a list of data sheets associated with the universal test plate. There should be one data sheet for each wavelength used for the test. ¾If all of the required data sheets exist for the test plate, highlight the first Plate ID (Wavelength) to test, then skip ahead to step 5. ¾If one or more data sheets need to be created, click the New Data Sheet button. See “Setting Up a New Data Sheet” for more information. 9-10 • Utilities User's Guide to KCjunior ¾If one or more data sheets needs to be viewed or modified, highlight a data sheet and click the View/Modify button. ¾To delete a data sheet, highlight the desired item in the Universal Plate ID list, then click Delete Data Sheet. KCjunior will request confirmation before deletion. 5. If necessary, modify the Operator name. 6. Enter the Reader Serial Number and any Comments. 7. If supported by the reader, Perform Peak Wavelength Test is accessible. If this box is checked, the Peak Wavelength Test will be included in the universal plate test. 8. Click the Run Test button. The reader performs the test and KCjunior displays the results. 9. Click Print to print the results, or OK to close the results. Test results are automatically saved in the Results Database. 10. Repeat steps 4-8 for the remaining wavelengths. 11. Click the Exit button to return to the main screen. Setting Up a New Data Sheet A data sheet contains exact spectrophotometric calibration data associated with a neutral density filter at 1 of 8 possible wavelengths. To create a set of data sheets (one for each wavelength), for use with the Universal Plate Test: 1. User's Guide to KCjunior Click New Data Sheet from the Universal Plate Test dialog. The Data Sheet dialog appears: Utilities • 9-11 2. Select a Universal Plate. ¾#9000547 does not have a filter in the C6 location. It is the standard test plate that can be used on any Bio-Tek reader. If this plate is selected, the Peak Wavelength Test will not be performed. ¾#7260522 has a filter in the C6 location, for the Peak Wavelength test. It is the test plate that is used on readers that support spectral scanning. 3. Enter the test plate’s Serial Number. 4. Enter a Wavelength, or select one from the drop-down list. 5. Refer to the calibration data table that came with the test plate to determine the expected OD for each test well at the selected wavelength. For each Location (C1, D4, E2, F5, G3, H6), enter the OD associated with that well at the selected wavelength. For readers that support spectral scanning, a Peak Wavelength value is required. Enter the value in nanometers (nm). 9-12 • Utilities 6. Click OK to save the data sheet and return to the Universal Test Plate dialog. 7. Repeat the above steps to create a data sheet for each Universal Test Plate ID (Wavelength) to be tested. User's Guide to KCjunior Universal Plate Test History When a Universal Plate Test is complete, the test results are automatically saved in the Results Database. These test results can viewed at any time. To view historical Universal Plate Test results: 1. Select Utilities|Diagnostics|Universal Plate Test History. The View Test dialog appears, listing all test results: ¾The list is sorted by date. To switch between ascending and descending order, click the Test Results column header. User's Guide to KCjunior 2. Highlight the desired test, then click the View Test button to view the results. 3. Click OK to close the results and return to the View Test dialog. 4. View another test, or click the Exit button to return to the main screen. Utilities • 9-13 Database Maintenance Protocols, results records, stored curves, system test results, and universal plate test results can be copied into archive databases that can then be stored as a part of normal backup procedures. During the archive process: • Protocols are copied to an Archive Protocol Database. • Results records, stored curves, system test results, and universal plate test results are copied to an Archive Results Database. Archived or otherwise unnecessary protocols, results records, stored curves, stored transformations, system test results, and universal plate test results can be deleted from the Protocol and Results Databases currently in use. A Note on Backup Procedures It is strongly recommended that you backup (safely store) your protocol and results databases regularly. Here are some suggestions: • Routinely copy the complete protocol and results databases from your hard drive to the network or to a floppy diskette. Note: Check to ensure that network files are automatically backed up. See “Pathnames” under Setting Up the System to find out where these databases are stored. ¾Enhance this suggestion by first copying certain protocols, results records, stored curves, and/or test results to archive protocol and results databases. Then copy the archive databases to the network or to a floppy diskette. Continue to review “Database Maintenance” for instructions. • Instead of keeping your protocol and results databases on your hard drive, store them on the network. See “Sharing Protocols and Databases” under Defining Protocols and “Sharing Results Records and Databases” under Reading Plates for more information. 9-14 • Utilities User's Guide to KCjunior Creating Archive Databases Before protocols can be archived, an Archive Protocol Database must be created. Before results records, stored curves, system test results, and universal plate test results can be archived, an Archive Results Database must be created. During the archive process, selected items are copied from the current Results and Protocol Databases into the archive databases. Look under Setup|Configuration|Pathnames to see the names and locations of the currently configured Results and Protocol Databases. To create an archive database: 1. Select Utilities|Database Maintenance|Create Archive (Results or Protocol) Database. The Create Empty (Results or Protocol) Database dialog appears. 2. In the Save in field select a location for the new database. 3. Enter an identifying File name, such as ArchRslts.mdb or ArchProt.mdb. 4. Click Save to create the database and return to the main screen. Archiving Results Records and Protocols When results records and protocols are archived they are copied from the current Results and Protocol Databases, respectively, into the archive databases. To archive results records and protocols: 1. Make sure that archive databases have been created. 2. Select Utilities|Database Maintenance|Archive Results or Protocols. User's Guide to KCjunior Utilities • 9-15 The Archive Results or Protocol Database Pathname dialog appears. 3. Enter the drive, directory, and file name of the archive database, or use the Browse button to locate this information. 4. Click OK. The Archive Results or Archive Protocols dialog appears, listing the contents of the current Results or Protocol Database. 5. Select the results record(s) or protocol(s) to be archived: ¾If archiving results records, click the Results and Creation Date column headers to sort the records alphabetically or by date. ¾Use the mouse to select the items(s) to be archived. Press the Shift key while using the mouse to select contiguous items. Press the Ctrl key while using the mouse to select non-contiguous items. ¾Check Delete after archive to permanently delete the item(s) from the current database after being copied to the archive database. 6. Click the Archive Results or Archive Protocol(s) button. The selected items are copied to the archive database and then deleted from the current database (if Delete after archive is checked). ¾If a duplicate Results Record or Protocol Name is detected, KCjunior will not overwrite the results record or protocol. 9-16 • Utilities User's Guide to KCjunior Archiving Stored Curves When stored curves are archived, they are copied from the current Results Database into the Archive Results Database. To archive stored curves: 1. Make sure that an Archive Results Database has been created. 2. Select Utilities|Database Maintenance|Archive Stored Curves. The Archive Results Database Pathname dialog appears. 3. Enter the drive, directory, and file name of the archive database, or use the Browse button to locate this information. 4. Click OK. The Archive Stored Curves dialog appears, listing the curves stored in the current Results Database. 5. Select the curve(s) to be archived: ¾Use the mouse to select the items(s) to be archived. Press the Shift key while using the mouse to select contiguous items. Press the Ctrl key while using the mouse to select non-contiguous items. ¾Check Delete after archive to permanently delete the item(s) from the current database after being copied to the archive database. 6. Click the Archive Curve(s) button. The selected items are copied to the archive database and then deleted from the current database (if Delete after archive is checked). ¾If a duplicate Curve Name is detected, KCjunior does not overwrite the curve. User's Guide to KCjunior Utilities • 9-17 Archiving Test Results When Reader System and Universal Plate Test Results are archived they are copied from the current Results Database into the Archive Results Database. To archive test results: 1. Make sure that an Archive Results Database has been created. 2. Select Utilities|Database Maintenance|Archive System Test Results or Universal Plate Test Results. The Archive Results Database Pathname dialog appears. 3. Enter the drive, directory, and file name of the archive database, or use the Browse button to locate this information. 4. Click OK. The Archive System Test Results or Archive Universal Plate Test Results dialog appears, listing the test results stored in the current Results Database. 5. Select the test result(s) to be archived: ¾To switch between ascending and descending sort order, click the Test Results column header. ¾Use the mouse to select the items(s) to be archived. Press the Shift key while using the mouse to select contiguous items. Press the Ctrl key while using the mouse to select non-contiguous items. ¾Check Delete after archive to permanently delete the item(s) from the current database after being copied to the archive database. 9-18 • Utilities User's Guide to KCjunior 6. Click the Archive Test(s) button. The selected items are copied to the Archive Results Database and then deleted from the current database (if Delete after archive is checked). ¾If a duplicate Date/Time is detected, KCjunior does not overwrite the existing test results. Deleting Results Records and Protocols After results records and protocols have been safely archived, or if certain results records or protocols are no longer needed, they can be deleted from the current Results and Protocol Databases. To delete results records and protocols: 1. Close any open records/protocols. 2. Select Utilities|Database Maintenance|Delete Results or Delete Protocols. The Delete Results or Delete Protocols dialog appears, listing all results records or protocols in the current database. 3. Select the results record(s) or protocol(s) to be deleted: ¾If deleting results records, click the Results and Creation Date column headers to sort the records alphabetically or by date. ¾Use the mouse to select the item(s) to be deleted. Press the Shift key while using the mouse to select contiguous items. Press the Ctrl key while using the mouse to select noncontiguous items. 4. User's Guide to KCjunior Click the Delete Results or Delete Protocol(s) button. The selected items are permanently removed from the current database. Utilities • 9-19 Deleting Stored Curves After stored curves have been safely archived, or if certain curves are no longer needed, they can be deleted from the current Results Database. To delete stored curves: 1. Close any open protocols. 2. Select Utilities|Database Maintenance|Delete Stored Curves. The Delete Stored Curves dialog appears, listing all curves stored in the current Results Database. 3. Select the curve(s) to be deleted. ¾Use the mouse to select the items(s) to be deleted. Press the Shift key while using the mouse to select contiguous curves. Press the Ctrl key while using the mouse to select noncontiguous curves. 4. 9-20 • Utilities Click the Delete Curve(s) button. The selected item(s) are permanently removed from the current Results Database. User's Guide to KCjunior Deleting Stored Transformations If certain stored transformations are no longer needed, they can be deleted from the current Protocol Database. To delete stored transformations: 1. Close any open protocols. 2. Select Utilities|Database Maintenance|Delete Stored Transformations. The Delete Stored Transformations dialog appears, listing all formulas stored in the current Protocol Database. 3. Select the formula(s) to be deleted. ¾Use the mouse to select the items(s) to be deleted. Press the Shift key while using the mouse to select contiguous formulas. Press the Ctrl key while using the mouse to select non-contiguous formulas. 4. User's Guide to KCjunior Click the Delete Formula(s) button. The selected item(s) are permanently removed from the current Protocol Database. Utilities • 9-21 Deleting Test Results After System Test and Universal Plate Test results have been safely archived, or if certain test results are no longer needed, they can be deleted from the current Results Database. To delete stored System Test or Universal Plate Test results: 1. Close any open plates. 2. Select Utilities|Database Maintenance|Delete System Test Results or Delete Universal Plate Test Results. The Delete System Test Results or Delete Universal Plate Test Results dialog appears, listing all test results stored in the current Results Database. 3. Select the test(s) to be deleted. ¾Use the mouse to select the items(s) to be deleted. Press the Shift key while using the mouse to select contiguous tests. Press the Ctrl key while using the mouse to select noncontiguous tests. 4. 9-22 • Utilities Click the Delete Test(s) button. The selected item(s) are permanently removed from the current Results Database. User's Guide to KCjunior Troubleshooting Overview There are three categories of error and warning messages that may appear in KCjunior: • Reader errors that occur during a plate read. • Communication errors between the computer and the attached microplate reader. • Data reduction comments and warnings. This section describes every communication error and data reduction warning or comment that may occur while running KCjunior, and in many cases provides suggestions for fixing the error. User's Guide to KCjunior Troubleshooting • 10-1 Reader Errors If the reader experiences an error during a plate read, KCjunior may present a message resembling the following: • If a reader error message is presented, note the error code (ex. AF90), then refer to the reader’s Operator’s Manual for more information. The manual should contain a table of possible error codes. • KCjunior will attempt to save any data that was retrieved from the reader before the error occurred. The Plate Status will be updated with the reader error code. To check the Plate Status, select Plate|Plate Information. Communication Errors Reader Status Failure KCjunior is unable to communicate with the attached reader. Suggestions: • Select Setup|Reader, then click Test Communications. KCjunior will provide appropriate messages for reconfiguring the communication parameters. • Make sure that the proper Reader Type is selected under Setup|Reader, then run the reader system test. • If the reader just experienced a failure, the reader system test must be run before plate reading can resume. Reader Timeout Error KCjunior received no response from the reader. Suggestions: 10-2 • Troubleshooting • The reader should be on and at its main display when communicating with KCjunior. • Try to perform a reader system test from within KCjunior. User's Guide to KCjunior If you cannot communicate with the reader, run the test from reader front panel. If the test fails, refer to the reader's user manual for assistance. • If the error appeared while performing a kinetic read: Close all unnecessary programs that are running concurrently with KCjunior (see “System Requirements” in Installing the Software for more information). If the error persists with a fast kinetic read, you may need to lengthen the kinetic interval. Serial Read Error An error occurred when KCjunior attempted to communicate with the reader. Suggestions: • Make sure that the reader is on and ready to accept serial commands. • Check to see if the correct serial cable is being used, and that it is properly connected to the PC and the reader. • Check that the communication settings under Setup|Reader are correct for this reader. The communication parameters can be tested from within the Setup|Reader dialog. Serial Write Error An error occurred when KCjunior attempted to communicate with the reader. Suggestions: • Make sure that the reader is on and ready to accept serial commands. • Check that the communication settings under Setup|Reader are correct for this reader. The communication parameters can be tested from within the Setup|Reader dialog. User's Guide to KCjunior Troubleshooting • 10-3 Comments and Warnings ?????? indicates a calculation could not be performed If a well contains ??????, one of the following occurred during data reduction: • The well references another well with a status of: ¾Well Read Error ¾OUT ¾Masked ¾Divide by Zero ¾Well Failure • A calculation within or involving the well: ¾attempted an invalid logarithmic function. ¾is syntactically invalid. ¾references an invalid location. ¾references an invalid Well ID. ¾attempted a Standard Deviation on a well group with an insufficient sample population. ¾attempted a Coefficient of Variation on a well group with an insufficient sample population. • The well is in a blank sector that contains blanks but none of them are valid. • Cutoffs could not be evaluated for the well. • A concentration had no valid solutions on the generated curve. • The curve could not be generated. [ ] indicates a well was set to the maximum valid value The Raw Data value measured for this well exceeded the upper limit of the valid data range that was defined in the protocol. KCjunior is currently configured to use this altered value in further calculations. Suggestions: • To extend the upper limit of this range, or to exclude this and all out-of-range wells from further calculations: 1. 10-4 • Troubleshooting Click to access the General Information dialog. User's Guide to KCjunior 2. Do one of the following: Set the Raw Data or Blank Limits Maximum Value to the desired OD, RFU, or RLU. Select Discard Out-of-Range Values for Raw Data Limits or Blank Limits, as appropriate. All out-of-range wells will be reported as OUT. 3. Click OK to accept the change. [ ] indicates a well was set to the minimum valid value The Raw Data value measured for this well fell below the lower limit of the valid data range that was defined in the protocol. KCjunior is currently configured to use this altered value in further calculations. Suggestions: • To extend the lower limit of this range, or to exclude this and all out-of-range wells from further calculations: 1. Click to access the General Information dialog. 2. Do one of the following: Set the Raw Data or Blank Limits Minimum Value to the desired OD, RFU, or RLU. Select Discard Out-of-Range Values for Raw Data Limits or Blank Limits, as appropriate. All out-of-range wells will be reported as OUT. 3. Click OK to accept the change. ( ) indicates an extrapolated concentration The concentration for this well was calculated through extrapolation. If Extrapolate is enabled in the protocol, the curve is extended outside the total range of the standards in order to calculate a concentration for an OD, RFU, or RLU value beyond the highest and lowest standard values. Suggestion: • User's Guide to KCjunior To disable Extrapolation: 1. Click to modify the protocol. 2. Click the Curve tab. 3. Deselect Extrapolate. 4. Click OK to accept the change and recalculate the results. Troubleshooting • 10-5 { } indicates ambiguous concentrations Two or more concentrations were calculated for the Y-value in this well. • KCjunior automatically reports the largest concentration. ***** indicates a well read error A well read error may be caused by one of the following: • The reader determined that the OD, RFU, or RLU in this well was significantly out-of-range, then set the error status before sending data to KCjunior. • If plate data was read from an Omni-System absorbance file, the absorbance file may contain an invalid status (1, 2, 89, or 99) for that well, indicating an error during plate processing or data reduction. A memory allocation error has occurred. KCjunior was unable to access system memory. Suggestions: • This error may occur if so many programs are open at once that system memory is overly consumed. Close any unnecessary programs. • Make sure that your computer meets the minimum system requirements, listed on page 2-2 in “Installing the Software”. BTI shared library could not be found The file BTI_DLL.DLL is missing from the Windows\System directory. Suggestions: • Search your hard drive to see if the file has been moved. If you find the file, move it back to the Windows\System directory. • If you cannot find the file, reinstall KCjunior. Cutoff X could not be calculated A cutoff formula defined in the protocol could not be calculated. Suggestions: 10-6 • Troubleshooting • Check the Cutoff dialog in the protocol to ensure that cutoffs are defined correctly. • If a cutoff references a well ID (ex. “PC”), this error may indicate that all replicates of the well ID are invalid. User's Guide to KCjunior Cutoff X is not greater than the previous cutoff Two or more cutoffs are defined in the protocol and they are not in ascending order. Suggestions: • Check the Cutoff dialog in the protocol to ensure that cutoffs are defined correctly. • If a cutoff references a well ID (ex. “STD02”), this error may indicate that the actual mean value for the well ID greatly varies from its expected value. DIV/0 DIV/0 represents an attempt to divide by zero. Suggestion: • This error is most likely to appear in the Statistics dialog after an unsuccessful attempt at a CV% calculation. Click the Statistics button to view the results. Any DIV/0 warnings will appear in the CV% column. Error during auto sensitivity This message indicates a failure during the auto sensitivity adjustment process. The most likely reason is an error during the calculation of the signal-to-noise ratio. Review the Auto Sensitivity selections in the protocol: • Ensure that the Low, Test, and High Wells are assigned correctly. ¾The Low Well(s) are usually blank wells, buffer wells, zero standards, or negative controls. ¾The Test Well(s) are usually low standards or low positive controls. ¾The High Well(s) are usually the highest standards or high positive controls. User's Guide to KCjunior • The Base Value should be greater than zero. The default setting is 100. • If the High Value is set too low, the Low, Test, and/or High Wells can overrange before two valid signal-to-noise ratios can be calculated. Troubleshooting • 10-7 Grayed numbers indicate a suppressed standard If, in the Results displays, a standard well contains a “grayed” value, this indicates that the standard has been suppressed. • To restore the standard, click Standard Curve, click Edit Stds…, then change the Status of the desired well. Illegal log function attempted on a standard This error typically results during curve generation if the Y-Scale value is set to Log and the OD, RFU, or RLU value for a standard or dilution well is 0.000. • For titer curves, the warning will report the Sample ID(s) experiencing the error. Insufficient valid standards for this curve type To generate a successful curve, the selected curve method requires more standards than are currently valid on the plate. Suggestions: • Check the Raw Data values for the standards. If one or more standards is reported as OUT, this means that the OD, RFU, or RLU value fell outside the minimum/maximum data range defined in the protocol and is excluded from further calculations. • If you just edited one or more standard outliers, there may now be too few remaining valid standards. • The minimum number of required valid standards for each curve method are: Linear and Point-to-Point (2) Quadratic and Cubic-Spline (3) Cubic, 2 Parameter and 4 Parameter (4). No valid blanks in sector X All blank wells in one or more sectors in the plate are invalid. Suggestion: • If all blank wells in a sector are reported as OUT, the Raw Data values for these wells exceeded the minimum/maximum data range defined in the protocol. Click to open the General Information dialog to see the current Raw Data Limits and Blank Data minimum and maximum settings. 10-8 • Troubleshooting User's Guide to KCjunior OUT indicates a well exceeded the min/max range The Raw Data value measured for this well fell outside the valid data range as determined by the reader or as defined in the protocol. Out-ofrange values are currently being excluded from further calculations. Suggestion: • To include out-of-range wells in further calculations: 1. If a protocol is open, click Information dialog. to access the General If no protocol is open, select Protocol|New Protocol. The General Information dialog will appear. 2. Alter the Raw Data Limits and/or Blank Limits Minimum and Maximum values, if necessary. 3. Deselect Discard Out-of-Range Values for Raw Data Limits or Blank Limits, as appropriate. 4. Click OK to accept the change(s). All wells that were previously reported as OUT will be set to the minimum/maximum values as appropriate and displayed in brackets. These altered values will now be used in further calculations. The Pathlengths could not be generated This warning will appear if, during the read, the Abort Read button was clicked to halt the read in progress before the necessary pathlength correction wavelengths were read. Plate was aborted during read This warning will appear if, during a read, the Abort Read button was clicked to halt the read in progress. • KCjunior will attempt to perform data reduction based on any data retrieved up to the time the button was clicked. Reader control error occurred during read This warning will appear if, during a plate read the reader experiences a failure and is unable to respond to the computer. • The reader control error may appear if there is a serial communication failure during the plate read. • If the reader control error appears, try the following: ¾Turn off the reader. ¾Ensure that the serial cable is properly connected. User's Guide to KCjunior Troubleshooting • 10-9 ¾Close KCjunior then reboot the computer. ¾Turn the reader on. Run a system test. ¾Launch KCjunior. ¾Under Setup|Reader, check the communication parameters, then click Test Communications. If the test is successful, try re-reading the plate. • Refer to the reader’s Operator’s Manual for information on specific reader failures and corrective action. Strikethrough indicates a masked well A well with a strikethrough 2.577 indicates that the well is “masked”, or temporarily excluded from calculations. To unmask the well: 1. Highlight the well and click the right mouse button. 2. Select ' Mask Well. 3. KCjunior will automatically recalculate the results. Stored curve does not exist The protocol references a stored curve that does not exist in the current Results Database. Suggestions: • Choose to modify the protocol then click the Curve tab. Select a different Stored Curve. • Open the System|Configuration|Pathnames dialog. Change the Results Database Path name to access a different database. Too many standards for curve type Too many standards or unique dilutions (titer assay) were defined for the curve type. • 10-10 • Troubleshooting For example, the 2P (Logit-Log) and 4P curve types allow a maximum number of 24 standard groups. User's Guide to KCjunior Unable to generate curve The curve could not be generated. Possible reasons include: • No solution is available for the given set of points. • If this is a titer assay, there may be insufficient dilutions defined for the selected curve method. • There are insufficient valid standards due to OUT, masked, suppressed, or failed (*.***) well conditions, or other data reduction failures. • The concentrations are all equal, resulting in a slope of infinity. Unable to initialize curve standards If this is a titer assay, all replicates within a sample group are currently invalid. • Invalid notations include: ¾OUT (well is out-of-range) ¾*.*** (well status error) ¾Strikethrough 2.765 (well is masked). User's Guide to KCjunior Troubleshooting • 10-11 10-12 • Troubleshooting User's Guide to KCjunior Appendix A Sample Reports This section contains sample KCjunior reports. Reports are selected within a protocol, under the Reports tab. See “Reports” in Defining Protocols for more information. User's Guide to KCjunior Appendix A, Sample Reports • 11-1 Protocol Report for an absorbance assay, showing Formula information. 11-2 • Appendix A, Sample Reports User's Guide to KCjunior Protocol Report for a fluorescence assay, showing the Template information. User's Guide to KCjunior Appendix A, Sample Reports • 11-3 Raw Data Report. 11-4 • Appendix A, Sample Reports User's Guide to KCjunior Maximum Slope Report (6x8 Plate Geometry). User's Guide to KCjunior Appendix A, Sample Reports • 11-5 Formula Report with Transformation and Plate Formula information. 11-6 • Appendix A, Sample Reports User's Guide to KCjunior Column Report, page 1 of 2. User's Guide to KCjunior Appendix A, Sample Reports • 11-7 Column Report, page 2 of 2. 11-8 • Appendix A, Sample Reports User's Guide to KCjunior Column Report showing Titer Results Information. User's Guide to KCjunior Appendix A, Sample Reports • 11-9 Matrix Report for an absorbance assay. 11-10 • Appendix A, Sample Reports User's Guide to KCjunior Matrix Report for a fluorescence assay. User's Guide to KCjunior Appendix A, Sample Reports • 11-11 Standard Curve Report. 11-12 • Appendix A, Sample Reports User's Guide to KCjunior Curve Report showing two overlaid spectral scan curves. User's Guide to KCjunior Appendix A, Sample Reports • 11-13 Curve Report showing three overlaid titer curves. 11-14 • Appendix A, Sample Reports User's Guide to KCjunior Glossary List of Terms Abscissa The coordinate representing the distance of a point from the y-Axis in a plane Cartesian coordinate system, measured along a line parallel to the x-Axis. Ambiguous Curve A curve is ambiguous if multiple concentrations exist for a given OD, RFU, or RLU value. Average Standards In a protocol, if standard groups are defined with multiple replicates, the Average Standards option is available. • If Average Standards is enabled, KCjunior uses the average of the standard replicates when generating the curve. • If Average Standards is disabled, KCjunior uses the individual standard replicates when generating the curve. Coefficient of Variation (CV) The coefficient of variation represents the standard deviation expressed as a percentage of the mean: (Standard Deviation / Mean) * 100. In formulas, the coefficient of variation is represented by CV( ). User's Guide to KCjunior Glossary • 12-1 Database A database is a computer file that contains multiple records of information. In KCjunior: • The protocol database contains multiple records called “protocols”. Within each record (protocol) is a set of fields, containing information specific to that protocol, such as protocol description, read method type, and curve method type. • The results database contains multiple records called “results records”. Within each record is a set of fields, containing information specific to that plate, such as Results ID, Plate ID, read status, and raw plate data values. Dilution The amount by which a sample is mixed with a solution to bring the specie of interest into the operating range of the analysis. Endpoint Read During an endpoint absorbance read, every well on the plate is read with one (single) or two (dual) wavelengths. • One optical density (OD) value is reported for each well. During an endpoint fluorescence or luminescence read, the plate is read from one to six times, depending on the number of filter sets specified. • One Relative Fluorescence Unit (RFU) or Relative Luminescence Unit (RLU) value is reported for each well for each filter set. Extrapolation KCjunior provides the option of displaying extrapolated concentrations − unknown values on the Y axis which are outside the range of the standards. On data displays and reports, extrapolated concentrations are enclosed by parenthesis, for example (20.345). 12-2 • Glossary User's Guide to KCjunior Kinetic Read During a kinetic absorbance read, every well on the plate is read a defined number of times with one (single) or two (dual) wavelengths. • One optical density value is reported for each well for each plate read. In addition, a graph showing OD vs. Time is reported for each well. During a kinetic fluorescence or luminescence read, the plate is read a defined number of times, using one filter set. • One Relative Fluorescence Unit (RFU) or Relative Luminescence Unit (RLU) is reported for each well for each kinetic read. In addition, a graph showing RFU/RLU vs. Time is generated for each well. MultiWavelength Read During a MultiWavelength read, every well on the plate is read once at each defined wavelength (up to 6). The optical density value measured at each wavelength is reported for each well. Optical Density (OD) The amount of light at a specific wavelength that is absorbed by the chromophore. It is the reciprocal of transmission (1/T). Protocol A protocol is one of many records in a protocol database containing user-defined information for performing a plate read and data reduction. RFU/RLU RFU stands for Relative Fluorescence Unit, RLU stands for Relative Luminescence Unit. In KCjunior, if the current reader is set to a fluorescence/luminescence reader (such as the FLx800), the Protocol|Read Method dialog contains a Chemistry parameter. If the Chemistry is set to Fluorescence, the plate measurement values are reported as RFU (ex. 87954 RFU). If the Chemistry is set to Luminescence, the plate measurement values are reported as RLU (ex. 57697 RLU). User's Guide to KCjunior Glossary • 12-3 R-Square Also referred to as the Coefficient of Determination, R-Square indicates the strength of a regression function (curve fit). If the value is 1.0, then the fit is very strong, meaning that all of the points lie on the curve. Standard Deviation (SD) The standard deviation is a measure of how widely values are dispersed from the average value (the mean). In formulas, standard deviation is represented by SD( ). Template In each KCjunior protocol, four unique templates can be designed to indicate location and related information for Well IDs, Dilutions, Transformations, and Sample IDs. Transformations Transformations are user-defined formulas applied to plate data for analysis, or for data transformation before calculating concentrations or cutoffs. Two types of transformations can be defined within one protocol: • A transformation formula is performed only on the well(s) to which it is assigned. If Transformation Formulas are applied, the results serve as the basis for curve generation and cutoff evaluation. • A plate formula is automatically applied to every well on the plate that has been assigned a Well ID. Well Identifier KCjunior supports four different types of wells − Blank, Standard, Sample, and Control. To accommodate a variety of applications, KCjunior provides the flexibility to customize references to these wells. These customized references are called Well Identifiers. 12-4 • Glossary User's Guide to KCjunior Index 2 Parameter curve 5:56 4 Parameter curve 5:56 A Aborting a read in progress 6:9, 6:11, 10:9 Add to List button 5:48, 5:49 Addition (in a formula) 5:50 Adjusted value 7:37 Algorithm for auto sensitivity adjustment 7:33 Allow pathname selection at program start 4:12 Ambiguous curve 12:1 Apply to all wells 5:47, 5:48 Apply to selection 5:47, 5:48 Archive Archive protocol database 9:15 Archive results database 9:15 Archiving results records and protocols 9:15 Archiving stored curves 9:17 Archiving test results 9:18 Creating archive databases 9:15 Auto sensitivity adjustment Algorithm 7:33 Base value 5:30 Defining the pre-reading parameters 5:28 High value 5:30 High well range 5:29 Low well range 5:29 Overview 5:28 Test well range 5:29 Use result for all filter sets 5:30 Viewing results of pre-readings 7:32 Average standards 5:57, 12:1 B Backup procedures 9:14 Bandwidth Defining in a filter set 5:25 Warnings 5:25 User's Guide to KCjunior Barcode scanning 4:10, 6:11 Basecode version 4:3 Base value 5:30 Baud rate 4:3, 4:4 Bio-Cell(tm) 5:17, 7:18 Bio-Tek, contacting 1:3 Blank Data 7:5, 7:9, 7:16 Blank limits, setting 5:9 Blanking method 5:39, 5:41 Blanks, defining 4:5, 5:38 Bottom optical probe 5:25 C Calibrate before first read 5:37 Calibrating the reader 5:37, 6:8 Chemistry 5:21 Closing a results record 6:4 Coefficient of variation (CV) 5:50, 7:30, 12:1 Colors, changing 4:5, 4:9 Communication Connecting the reader to the computer 4:2 Errors 6:17, 10:2 Get communication defaults 4:4 Port 4:4 Reader system test 4:4, 9:8 Testing communication 4:5 Comparison value (OD) 5:33 Computer Minimum system requirements 2:1, 2:2 Conc x dilution 5:51 Concentrations Calculated concentrations 7:20 Defining expected 5:42 Viewing results 7:20 Configuring setup parameters 4:5, 5:39 Configuring well identifiers 4:7 Connecting the reader to the computer 4:2 Constant value 5:18 Contacting Bio-Tek Instruments, Inc. 1:3 Continuous shake 5:35 Index • 13-1 Control panel, dispenser 9:4 Controls, defining 4:6, 5:38 Copying a results record 6:4 Copying formulas 5:47 Copying plate data to another application 6:24 Corrected absorbance 5:18 Create archive database 9:16 Cubic curve 5:56 Cubic spline curve 5:56 Current reader menu 3:6, 4:2 Current reader status 3:6 Curve Average Standards 5:57 Curve Method 5:56 Editing parameters 7:21 Extrapolate 5:57, 7:2 Graph Report Name 5:56, 7:21 Outliers 7:25 Overlaying 7:22 Printing 5:63, 7:25 Report 5:61 Sample curves 7:22 Spectral scan 7:11 Standard 5:55, 7:21 Stored 5:55 Titer 5:55, 7:22 X and Y Axes Label, Scale 5:57 Cutoffs Analyzing results 7:27 Defining 5:58 Labels 5:58, 7:27 CV function 5:50, 12:1 D Data bits 4:3, 4:4 Data reduction 3:10, 7:1-7:29 Errors 10:5, 10:7, 10:12 Database 4:9, 5:2, 5:5, 6:2, 6:5, 12:1 Database maintenance A note on backup procedures 9:14 Archiving results records and protocols 9:15 Archiving stored curves 9:17 Archiving test results 9:18 Creating archive databases 9:15 Deleting results records and protocols 9:19 Deleting stored curves 9:20 Deleting stored transformations 9:21 Deleting test results 9:22 Database version 4:10 Decimal places, changing the number of 4:8, 5:9 Delay before reading 5:32 Delay before sampling 5:28 13-2 • Index Delay between samples 5:28 Delete after archive 6:5, 9:17, 9:18 Delimiter, choosing for data export 6:18 Delta OD 5:16, 6:12, 7:4, 7:5 DILution function 5:51 Dilutions Defined 12:1 Defining 5:44 Valid dilution range 5:45 Dispense / Read Read method type 5:14, 5:21 Viewing results 7:14 Dispenser (FLx800) Control panel 9:4 Filter position requirements 4:14 Initializing 9:5 Injector Position 9:7 Priming 9:6 Purging 9:6 Syringe setup 9:7 Display curve legend 4:9 Display settings 2:2 Displayed decimal places, 5:9 Division (in a formula) 5:50 Dual-reader support 4:1, 4:2, 5:3 E Editing standard outliers 7:25 Eject plate between filter sets 5:30 Emission filter 5:24, 5:25 Emission filter wheel 4:11, 5:23 EL301 microstrip reader 6:14 Empty plate, MultiWavelength read 5:16 End of transmission character 4:4 Endpoint read 5:10 Defined 12:1 Multiple endpoint reads 5:10, 5:20 Results 7:4 EOT character 4:4 Error code, retrieving from reader 3:6 Errors and warnings A memory allocation error has occurred 10:7 Ambiguous concentrations 10:7 BTI shared library could not be found 10:7 Calculation could not be performed 10:5 Cutoff could not be calculated 10:7 Cutoff is not greater than previous 10:8 DIV/0 7:2, 10:8 Error during auto sensitivity 10:8 Extrapolated concentration 10:6 Grayed numbers indicate a suppressed standard 10:9 User's Guide to KCjunior Illegal log function attempted 10:9 Insufficient valid standards 10:9 No valid blanks in sector 10:9 OUT 10:10 Pathlengths could not be generated 10:10 Plate was aborted during read 10:10 Reader control error occurred during read 10:10 Reader error 10:2 Reader Status Failure 10:2 Reader Timeout Error 10:3 Serial Read Error 10:3 Serial Write Error 10:3 Stored curve does not exist 10:11 Strikethrough indicates masked well 10:11 Too many standards for curve type 10:11 Unable to generate curve 10:12 Unable to initialize curve standards 10:12 Well read error 10:7 Well was set to maximum valid value 10:5 Well was set to minimum valid value 10:6 Excel, exporting data to 6:21 Excitation filter 5:24, 5:25 Excitation filter wheel 4:11, 5:23 Extrapolate 5:57, 7:2 Exporting data Copying results data and pasting it in another application 6:24 Delimiters 6:18 Directly to Microsoft Excel 6:21 Including an empty row or blank line 6:18 Including text headers 6:18 Specifying the first Excel cell location 6:18 To a text file 6:18 To an existing Excel spreadsheet 6:18 F Fast read 6:7 Fastest kinetic interval 5:31 Filter position requirements for Dispense / Read protocols 4:14 Filter set (FS) function 5:51, 7:19, 7:20, 7:27, 7:29 Filter sets Auto sensitivity 5:24, 5:28 Defining 5:24 Optics position 5:25 Options 5:27 Referencing in a formula 5:51 Sampling 5:27 Selecting the set for curve calculations 5:51, 5:56 Sensitivity 5:26 Filter wheel cartridges Configuration 4:11 User's Guide to KCjunior Emission 4:11, 5:23 Excitation 4:11, 5:23 Selecting at run-time 6:17 Selecting within a protocol 5:23 Filters, retrieving from reader 5:36 First Excel cell location for data export 6:18 Fluorescence Auto sensitivity results 7:32 Blanked Data 7:16 Chemistry 5:21 Dispense / Read 5:10, 5:21 Endpoint read 5:10 Kinetic read 5:10 Raw Data 7:4 Relative Fluorescence Unit (RFU) 12:1 FLx800 Configuring filter wheel cartridges 4:11 Filter set definition in protocol 5:24 Filter wheel cartridge selection in protocol 5:23 FLx800 dispenser Filter position requirements 4:14 Initializing 9:5 Injector position 9:7 Priming 9:6 Purging 9:6 Syringe setup 9:7 Formula Coefficient of variation (CV) 5:50 Copying from well to well 5:47 DIL function 5:51 Help with creating 5:47, 5:49, 5:60 Filter sets (FS) 5:51 MEAN function 5:51 Order of precedence 5:53 Plate formula 5:49 Saving 5:48, 5:49 Standard deviation (SD) 5:52 Syntax rules 5:50 Transformation formula 5:47 Validating 5:48, 5:49 Value of current well (X) 5:53 Viewing results 7:19, 7:29 Wavelength (WV) 5:52 Well location reference [ ] 5:52 Well reference <well ID> 5:53 FS (filter set) function 5:51, 7:19, 7:20, 7:27, 7:29 G Get basecode version 4:3 Get communication defaults 4:4 Get current reader status 3:6 Get reader wavelengths 5:16, 5:36 Index • 13-3 Getting Help 3:8 Glossary 12:1 Graph Copying 7:23, 7:25 Moving, scaling, zooming 7:24 Printing 5:61, 7:23, 7:25 Graph interpolation result 4:8 Graphing options Axes scaling 7:24 Borders and colors 7:24 Legends and labels 7:24 Spectral scan curve display options 7:12 Guided tour 2:15, 3:12 H Help menu 3:7 Help system 3:8 High value 5:30 High well range 5:29 I Importing Protocols 5:6 Results records 6:5, 6:6 Incubation Defining read method parameters 5:34 Incubation control utility 9:2 Override button 9:3 Setting a delay before reading 5:32 Inject on interval 5:23 Interpolation Calculate interpolation value 5:57 Graph interpolation result 4:9 Interpolation result 7:21, 7:22, 7:23 K KCJr. for DOS plate files, opening 6:3, 6:13 Kinetic Fastest interval 5:31 Interval 5:31 Max slope unit of measure 7:8, 7:9 Reads, number of 5:31 Kinetic read 5:10 Defined 12:1 Results 7:5 13-4 • Index L Labels 5:58, 7:27 Lag time 5:22 Legend, displaying in graph 4:9, 7:21, 7:22, 7:23 Lin or Log axes 5:56, 5:57, 7:24, 7:25 Linear curve 5:56 Logit Log curve 5:56 Low well range 5:29 Luminescence Auto sensitivity results 7:32 Blanked Data 7:16 Chemistry 5:21 Dispense / Read 5:10, 5:21 Endpoint read 5:10 Kinetic read 5:10 Raw Data 7:4 Relative Luminescence Unit (RLU) 12:1 M Masking reads, wells 7:37 Maximum slope Curves 3:11, 5:55 Cutoffs 3:11, 5:58 Statistics 7:30 Transformations 3:11, 5:46 Unit of measure 7:8, 7:9 MEAN function 5:51 Microsoft Excel, exporting plate data to 6:18 Microsoft Windows operating system 2:2 Minimum and maximum raw and blanked data values 5:8, 5:9 Monitoring wells Defining the criteria 5:33 Elapsed time 7:35 Selecting the well(s) to monitor 5:34 Multiple-plate endpoint read 5:20, 6:10 Multiple wavelengths Empty plate 5:16 Pathlength correction 3:10, 5:17 Referencing in a formula (WV) 5:52 Selecting 5:16 Selecting the set for curve calculation 5:52, 5:55 Viewing results 7:4, 7:5 Multiplication (in a formula) 5:50 MultiWavelength read 5:10, 12:1 User's Guide to KCjunior N Network, sharing databases 5:5, 6:5 Number of plates 5:10, 5:20 Number of samples 5:27 O OD 5:9, 12:1 OMNI System absorbance files, opening 6:3, 6:13 Opening a results record 6:2 Optical density 5:9, 12:1 Optics position 5:25 Optimum sensitivity 5:26, 5:28 OUT indication 6:15, 7:2, 7:37, 10:5 Outliers, editing 7:21, 7:25 Output empty row between plates 6:18 Output text headers 6:18 ‘Over’ indication 7:37 P Parenthesis, using in a formula 5:50 Parity 4:4 Partial plate reading 5:32 Password, obtaining from Bio-Tek 2:16, 2:17 Pathlength correction 3:10, 5:17, 7:17 Pathnames 4:5, 4:10, 4:12, 5:2, 5:6 Peak OD 7:11 Peak wavelength 9:12 Peak wavelength test 9:10 Plate Closing 6:4 Copying 6:4 Description 6:8, 6:10, 6:12, 6:13, 7:35 Exporting data 6:19 Geometry 5:32 ID 4:10, 5:20, 7:35, 6:8, 6:9, 9:10 Importing 6:5 Opening a results record 6:2 Partial plate reading 5:32 Plate status 7:35 Reading 6:15 Saving 6:4 Shaking 5:34 Plate formula 5:46, 5:49 Plate geometry 5:32 Plate ID 4:10, 5:20, 6:9, 6:11, 6:18 Multi-plate read 6:9, 6:10, 6:11 Plate information 7:34 Plate mode reading 5:21 Point-to-Point curve 5:56 PowerWaveX reader models 2:14, 4:3 User's Guide to KCjunior Primary wavelength 5:16 Printing reports 5:61, 8:1 Print preview 8:1–8:2 Print results 8:2 Print setup 8:3 Product information 1:3 Protocol Blank limits 5:9 Copying 5:5 Defined 3:9 Deleting 9:19 Description 5:8 Importing 5:6 Name 5:8 Raw data limits 5:8 Read Method Type 3:11, 5:10 Report Options 5:8 Saving and closing 5:4 Sharing protocols among users 5:5 Protocol database Archive protocol database 9:15 Creating an empty database 5:5 Importing protocols 5:6 Pathnames 4:10 PROTOCOL.MDB 4:10 Sharing protocols and databases 5:5 Version 4:12 Q Quadratic curve 5:56 R Rapid read mode 5:35 Raw Data 7:4 Printing 8:1 Viewing results 7:1 Raw data limits, setting 5:8 Raw Data report Selecting 5:61 Printing 8:1 Read from file 6:3, 6:13 Read full plate 5:32 Read Method Auto sensitivity adjustment 5:28 Calibrate before first read 5:37 Calibrate Reader 5:37, 6:8 Chemistry 5:21 Delay Before Read 5:32 Fastest kinetic interval 5:31 Filter sets 5:25 Get Reader Wavelengths 5:16, 5:36 Index • 13-5 Kinetic Interval 5:31 Kinetic Reads 5:31 Monitor well 5:32 Number of Plates 5:10, 5:20 Plate Geometry 5:31 Read Method Type 3:11, 5:10 Sampling 5:27 Sensitivity 5:26 Total kinetic read time 5:31 Validating parameters 5:31 Wavelengths 5:16 Read mode, selecting 5:35 Reader 1 or 2 4:1 Reader calibration 5:37, 6:8 Reader errors 7:35, 10:2, 10:10 Reader setup Baud Rate 4:4 Com Port 4:4 Data Bits 4:4 EOT Character 4:4 Get Comm Defaults 4:4 Parity 4:4 Reader Type 2:14, 4:3, 5:10 Stop Bits 4:4 Test Communications 4:5 Reader system test 9:8 Reader system test history 9:9 Reader type 2:14, 4:3, 5:10 Reading a plate 6:13, 6:15 Reading a plate with a protocol 6:10 Reading a plate without a protocol 6:7 Reading plate data from a file 6:3, 6:13 Reconfiguring pathnames 4:5, 4:10, 5:2, 5:6 Reference wavelength 5:16 Referencing a well location in a formula 5:52 Registering KCjunior 2:15 Relative fluorescence/luminescence units 12:1 Removing KCjunior from your computer 2:3 Report options 5:8 Reports Available types 5:61, 11:1 Display curve legend 4:9 Graph interpolation result 4:9 Print preview/setup 8:1–8:3 Print results 8:2 Printing 8:1 Sample printouts 11:1 Selecting in a protocol 5:61 Results Analyzing 6:24 Auto sensitivity results 7:32 Blanked Data 7:16 Concentrations 7:20 13-6 • Index Cutoff values 7:27 Database 4:9, 4:10, 6:2 Labels 7:27 Manipulating 7:34 Pathlength correction 7:17 Plate Formula Results 7:29 Printing reports 8:1 Raw Data 7:1, 7:4 Results records 6:2 Statistics 7:30 Template 7:28 Transformation Results 7:19 Viewing 6:24 Viewing statistics 7:30 Results database 2:10 Archive results database 9:14 Creating an empty database 6:5 Importing results 6:6 Pathnames 4:10 RESULTS.MDB 4:10 Sharing results records and databases 6:5 Version 4:12 Results ID 5:20, 6:2, 6:8, 6:9, 6:10 Results record Copying 6:4 Deleting 9:19 Exporting data 6:18 ID 6:2, 6:8, 6:9, 6:10 Importing 6:5, 6:6 Opening 6:2 Saving 6:4, 6:9, 6:11 Sharing records and databases 6:5 RFU/RLU 12:1 R-square 12:1 S Sample curves 7:22 Sample interval 5:21 Sample names, assigning 5:54 Sample protocols and results 2:15 Sample reports, 11:1 Samples Defining 4:5, 5:38 Identifying 5:54 Sampling 5:27 Delay before sampling 5:28 Delay between samples 5:28 Number of samples 5:27 Sampling windows 5:22, 9:5 Saving a results record 6:4, 6:9, 6:11 Scanning a plate barcode label 4:10, 6:9, 6:11 Scientific notation 5:9, 5:10 User's Guide to KCjunior Screen resolution 2:2 SD (standard deviation) function 5:52, 12:1 Select cartridges 5:23 Sensitivity Auto sensitivity adjustment 5:28 Optimum sensitivity 5:26, 5:28 Specifying within a filter set 5:26 Setup configuration 4:5, 5:39 Setup Menu 3:6 Shake Continuous during kinetics 5:35 Defining parameters 5:34 Intensity 5:34 Method 5:34 Sharing protocols and databases 5:5 Sharing results records and databases 6:5 Simulating a plate read 6:3, 6:12 Simulation data 6:3, 6:12, 6:24, 7:34, 7:38 Software registration 2:15 Software serial/version number 1:3 Spectral scan Adjusting the wavelength range used for calculations 7:12 Calculation options 7:10 Calibrate before first read 5:37 Curve display options 7:12 Peak OD 7:11 Protocol definition 5:20 Raw and blanked spectral data 7:9 Spectral chart 7:10 Standard curve Editing 7:25 Printing 5:61, 7:25 Storing 7:26 Titer curve 7:22 Viewing 7:21 Standard deviation (SD) 5:52, 12:1 Standard outliers, editing 7:21, 7:25 Standards, defining 4:6, 5:38 Starting protocol 4:9 Statistics 7:30 Status Plate status values 7:35 Read status values 7:37 Stop bits 4:4 Stopping a read 6:9, 6:11, 10:9 Stored curves Archiving 9:8 Deleting from database 9:21 Use stored curve 5:56 Storing a standard curve 7:26 Subtraction (in a formula) 5:50 User's Guide to KCjunior Surge protector 4:2 Sweep mode 5:35 Symbols, in results 10:5 System configuration 4:5, 5:39 System requirements, minimum 2:2 System test, reader 9:8 T Technical support 1:3 Temperature, setting 5:34, 9:1-9:2 Template Assigning well IDs 5:38 Dilutions 5:44 Sample Ids 5:54 Transformations 5:46 Viewing results 7:28 Test well range 5:29 Testing communication 4:5 Tip prime option 5:22 Titer Curves 7:22, 7:26 Defining dilutions 5:44 Interpolation value 5:57 Statistics 7:30 Top optical probe 5:25 Total kinetic read time 5:31 Transformations Defining 5:46 Deleting stored 9:22 Formula syntax 5:50 Plate formula 5:46, 5:49 Transformation formula 5:46, 5:47 Tutorial 2:15, 3:12 U ‘Under’ indication 7:37 Uninstalling KCjunior 2:3 Universal plate test 9:10 Universal plate test history 9:14 Use result for all filter sets 5:30 Utilities Carrier Out/In 9:4 Database maintenance 9:14 Diagnostics 9:8–9:13 Dispenser control panel 9:4-9:7 Incubation control 9:1–9:2 Reader system test 9:8 Universal plate test 9:10 Utilities menu 3:5 Index • 13-7 V Validate a formula 5:48, 5:49 Validate read method parameters 5:31 View menu 3:7 W Wavelength function (WV) 5:52, 7:19, 7:20, 7:27, 7:29 Wavelengths Multiple 5:16 Primary 5:16 Reference 5:16 Retrieving from reader 5:16, 5:36 Well identifiers 4:5, 5:38 Well IDs Assigning 5:38, 5:39 Defining defaults 5:39 Modifying an existing template 5:43 Referencing in a formula 5:53 Template 5:38 Well information 7:36 Well location, referencing in a formula 5:52 Well mode reading 5:21 Well notations 7:1, 7:2 Well reference [ ] 5:52 Well type colors 4:5, 4:9 Windows operating system 2:2 (WV) wavelength function 5:52, 7:19, 7:20, 7:27, 7:29 X X (in a formula) 5:53 13-8 • Index User's Guide to KCjunior