1
M508E 11.12.NF.5 (2/2)
Time Lapse Imaging System
BioStation IMQ
CELL-S2 / CELL-S2-P
Instructions
<Application Software>
Introduction
Thank you for purchasing a Nikon product.
This instruction manual is written for the users of the application software of the Time Lapse Imaging
System BioStation IM/IMQ.
To ensure correct usage, read this manual carefully before operating the product.
•
No part of this manual may be reproduced or transmitted in any form without prior written permission
from Nikon.
•
The contents of this manual are subject to change without notice.
•
Although every effort has been made to ensure the accuracy of this manual, errors or inconsistencies
may remain. If you note any points that are unclear or incorrect, please contact your nearest Nikon
representative.
•
If you intend to use any other equipment with this product, read the manual for that equipment too.
•
If the equipment is used in a manner not specified by the manufacturer, the protection provided by the
equipment may be impaired.
•
Microsoft, Windows, and Internet Explorer are registered trademarks of Microsoft Corporation in the
U.S. and other countries. Other product and company names mentioned in this manual are trademarks
or registered trademarks of their respective owners.
i
Notes on Handling the Software
(Read the following before use.)
To ensure correct and safe operation, read this manual before using the product.
1.
Disclaimer
Nikon shall not be liable for any damages and problems on user side or on a third-party side, which may
result from the use of this software.
2.
Notes on the control PC
•
Factory Setting
The software comes with a control PC.
Do not use any other PC to operate the product.
A change to the OS environment factory setting may lead to incorrect operation.
The control PC must not be modified by the user.
•
Power-saving mode
Use of the control PC with power-saving mode turned on causes the time lapse to stop halfway.
Be sure to set power-saving mode to OFF (factory setting) in using the PC.
•
Anti-virus software
Set real-time scanning of anti-virus software to OFF. Real-time scanning enabled may cause this
software to run unstably.
3.
File compatibility
Files created by the software of Ver. 1.* to Ver. 2.0 can be read into the software of Ver. 2.1 or later,
whereas those created by the software of Ver. 2.1 or later cannot be read into the software of Ver. 1.*.
Additionally, if a file created by the software of Ver. 1.* to Ver. 2.0 is read into the software of Ver. 2.1 or
later, it is automatically upgraded to the file format of the version currently used. Once upgraded, it
cannot be read into the software of the version by which it was originally created.
4.
About the example screens used in the manual
•
This manual describes various operations in BioStation IM/IMQ (Referred to as the BioStation IM
series together, hereafter.) using BioStation IMQ screens as examples.
Procedures are virtually identical for BioStation IM series.
•
This manual describes various operations in Windows XP/Vista/7 using Windows XP screens as
examples. Procedures are virtually identical for Windows XP, Vista, and 7.
Depending on the specific OS type or version, the actual appearance of the screen or operations
may not correspond precisely to the example screens shown at various points throughout the
manual. For information on operations or screens specific to your OS version, please consult the
OS user's manual.
ii
Contents
Introduction ........................................................................................................................................................... i
Notes on Handling the Software .......................................................................................................................... ii
Chapter 1
1.1
1.2
1.3
Chapter 2
2.1
2.2
Basic Operations ............................................................................................................................ 1
Starting and Closing the Software ................................................................................................. 1
1.1.1
Starting the Software........................................................................................................ 1
1.1.2
Registering AF Position of the Reference Mark (BS-IM-MC MOT Chamber)................... 2
1.1.3
Closing the Software ........................................................................................................ 3
Common Function ......................................................................................................................... 4
1.2.1
Screen Switch Buttons ..................................................................................................... 4
1.2.2
Status Display and Settings of the Microscope ................................................................ 5
Context Menu on the Title Bar ....................................................................................................... 6
1.3.1
Checking the Software Versions ...................................................................................... 6
1.3.2
Checking the Device Information ..................................................................................... 7
1.3.3
Checking the Error Information ........................................................................................ 7
1.3.4
Basic Settings .................................................................................................................. 8
1.3.5
Hide Control Panel ........................................................................................................... 9
Live Observation Screen .............................................................................................................. 10
Image Adjustment Buttons and Captured Image Display ............................................................ 11
2.1.1
Captured Image List View .............................................................................................. 13
2.1.2
Tone Curve Adjustment ................................................................................................. 14
2.1.3
Checking Saturation ....................................................................................................... 15
2.1.4
Intensity Screening......................................................................................................... 16
2.1.5
Pseudo Color Display..................................................................................................... 17
Setting Observation Conditions (Filter, Magnification, Mode, Z position, and Save) ................... 18
2.2.1
2.3
Saving Observation Conditions ...................................................................................... 20
Setting Observation Conditions (Focus Mode, Automatic Exposure, Condition File Loading,
Light Intensity, Exposure Time, Gain, and Resolution) ................................................................ 21
2.3.1
2.4
Chapter 3
3.1
Gain Compensation Value Fine Adjustment................................................................... 22
Observation Point and Focus Adjustment.................................................................................... 23
New Time-lapse Setting Screen ................................................................................................... 24
Live Screen.................................................................................................................................. 24
3.1.1
Time-lapse Confirmation Window .................................................................................. 26
3.1.2
Observation Point Verification Display ........................................................................... 27
3.1.3
Time-lapse Experiment Scheme (Points Tab)................................................................ 28
3.1.4
Time-lapse Experiment Scheme (Time Tab).................................................................. 30
3.1.5
Time-lapse Experiment Scheme (Cell Name etc... Tab) ................................................ 33
3.1.6
Time-lapse Experiment Scheme (Zstack Tab) ............................................................... 35
3.1.7
Setting and Editing Observation Conditions (Setting for Observation Filter
and Magnification/Editing Z-stack) ................................................................................. 37
3.2
Wide Field Screen ....................................................................................................................... 39
3.2.1
Observation Point Verification Display ........................................................................... 41
3.2.2
Browsing or Clearing the Tiled Image ............................................................................ 42
3.2.3
Setting Observation Conditions and Moving the Stage .................................................. 44
iii
Contents
Chapter 4
4.1
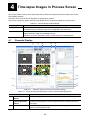
Time-lapse Images in Process Screen ........................................................................................ 46
Channels Display......................................................................................................................... 46
4.1.1
Image Magnification and Enlarge/Reduce...................................................................... 48
4.1.2
Scrolling an Enlarged Image .......................................................................................... 49
4.1.3
Setting a Clipping Range of the Displayed Image .......................................................... 49
4.1.4
Magnification Button....................................................................................................... 50
4.1.5
Z-stack Display Control .................................................................................................. 50
4.1.6
Time-lapse Observation Images Display (Ph/FI1/FI2/Multi) ........................................... 52
4.1.7
Intensity Graph............................................................................................................... 56
4.1.8
Intensity Graph Displaying Method ................................................................................ 57
4.1.9
Time Line Display and Image Playback Operation......................................................... 59
4.1.10 Time-lapse Experiment Scheme (Points Tab)................................................................ 61
4.1.11 Time-lapse Experiment Scheme (Time Tab).................................................................. 62
4.1.12 Time-lapse Experiment Process Display........................................................................ 63
4.1.13 Captured Image Printing ................................................................................................ 65
4.1.14 Captured Image Saving ................................................................................................. 66
4.1.15 Example of a Saved Image ............................................................................................ 81
4.2
Chapter 5
5.1
Points Display .............................................................................................................................. 82
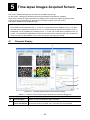
Time-lapse Images Acquired Screen........................................................................................... 83
Channels Display......................................................................................................................... 83
5.1.1
5.2
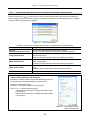
Saving Time-lapse Result File as a New File and Saving a Captured Image................. 85
Points Display .............................................................................................................................. 88
iv
1
Basic Operations
1
This chapter describes the basic operations commonly used for starting and closing and all windows of the
“BioStation IM”
1.1
Starting and Closing the Software
This section describes how to start and close this software installed in the control PC.
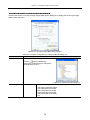
1.1.1
Starting the Software
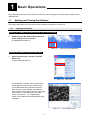
Starting the software from the shortcut icon on the desktop
1.
Double-click the Bio Station IM shortcut icon
on the desktop of the control PC.
The BioStation IM starts up.
Figure 1.1-1
Shortcut icon of Bio Station IM
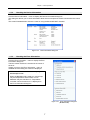
Starting the software from the start menu
1.
Open the Start menu, and then click Bio
Station IM.
The Bio Station IM starts up.
Figure 1.1-2
Start menu
For the BS-IM-C chamber, the Live observation
screen appears first when this software starts.
For the BS-IM-MC MOT chamber with the AF
(Auto focusing) mode enabled, the Reference
mark register screen appears first. For registering
the AF position of the reference mark on this
screen, see Section 1.1.2, “Registering AF
Position of the Reference Mark (BS-IM-MC MOT
Chamber)”.
Figure 1.1-3
1
Live observation screen
Chapter 1
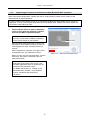
1.1.2
Basic Operations
Registering AF Position of the Reference Mark (BS-IM-MC MOT Chamber)
When using the BS-IM-MC MOT chamber with the AF mode enabled, register the AF position of the
reference mark as described below.
If the AF position of the reference mark is not registered, the New time-lapse setting screen cannot be
displayed. To carry out time-lapse observation on the BS-IM-MC MOT chamber, be sure to register the
AF position of the reference mark.
1.
Check that the reference mark is displayed
on the screen after the software is started,
and click the Mark registration button.
To make observations with greater AF
accuracy, check that the “Stable” is indicated
on the screen display on the software.
Reference mark
When the Mark registration button is clicked, the
AF positions of the reference marks for wells 1 to
4 are registered in order. This takes about four
minutes.
When registration is complete, an image of well 1
is displayed on the Live observation screen.
When you carry out only live observation, click the
Exit button; the screen is switched to the Live
observation screen.
If the reference mark is not placed within the
blue frame at the center of the screen, click
the Mark registration button to register the AF
positions of the reference marks.
For details see Section 7.4, “Setting up the
BS-IM-MC MOT chamber”, in the separate
manual, “BioStation IMQ Instructions
<System>”.
2
Figure 1.1-4
Reference mark register screen
Chapter 1
1.1.3
1.
Basic Operations
Closing the Software
Click the Close button (
corner of the window.
) in upper right
This software closes, and the Windows desktop
appears.
Perform this procedure when you detach the
chamber.
For the BS-IM-MC MOT chamber, this procedure
triggers the dish mounting part take the position in
readiness to sustain dismounting of the chamber.
Figure 1.1-5
Close button
Close confirmation dialog box
If the Close button is clicked while captured images
remain unsaved, the Close confirmation dialog box
appears.
To save the captured image, click the No button to
return to the Bio Station IM screen.
To close the software without saving the captured
image, click the Yes button.
Figure 1.1-6 Close confirmation dialog box
3
Chapter 1
1.2
Basic Operations
Common Function
The items shown on the top screen of the software are common functions for all screens.
Screen switch buttons
Status display and
settings of the
microscope
Figure 1.2-1
1.2.1
Live observation screen
Screen Switch Buttons
Click these buttons to select each function of the BioStation IM series.
Figure 1.2-2
Table 1.2-1
Screen switch buttons
Functions of screen switch buttons
Item
Function
Live observation
Select to use the BioStation IM series as a microscope.
New
time-lapse setting
Select to perform time-lapse experiment.
Select to start time-lapse experiment, after setting observation point, observation
condition, and so on.
Time-lapse image
in process
The time-lapse experiment in progress is displayed.
This screen automatically appears after time-lapse experiment starts on the New
time-lapse setting screen. This screen cannot be displayed by operating any buttons.
Time-lapse images
Acquired
Select to playback performed time-lapse images.
This screen automatically appears after time-lapse experiment ends.
On this screen, loading and reproducing saved file of time-lapse experiment results
are available.
4
Chapter 1
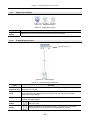
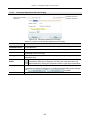
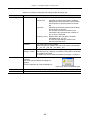
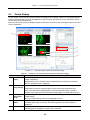
1.2.2
Basic Operations
Status Display and Settings of the Microscope
This area shows the current temperatures and the temperature settings of the culture chamber and the
humidifier water tank. The outside air temperature is also shown here.
For the temperature settings of the culture chamber and the humidifier tank, see Step 3 in Section 2.1,
“Start-up”, in the separate manual, “BioStation IMQ Instructions <System>“.
Figure 1.2-3
Table 1.2-2
Temperature status display of the microscope
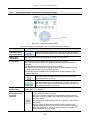
Functions on the status display and settings of the microscope
Item
Function
Temp
Click the Temp button to display the Temperature dialog box. The temperature change
since the software is started up and temperature status during time-lapse experiment
can be checked.
Chamber
Display area
Temperature detected with the temperature sensor of the culture
chamber is displayed.
Setting area
Set temperature inside the culture chamber to be suitable for
time-lapse experiment.
Display area
Temperature detected with the temperature sensor of the humidifier
water tank is displayed.
Setting area
Set water temperature inside the humidifier water tank to be suitable
for time-lapse experiment.
Water
Outside
Current ambient temperature is displayed. If room temperature is below 18°C or above
28°C a warning symbol appears and “POWER” lamp of the LED indicator blinks rapidly.
Stable/
Unstable
When both the temperature inside the culture chamber and the water temperature inside
the humidifier water tank reach the set value and stabilize, the status display changes
from “Unstable” to “Stable”. And, time-lapse experiment becomes possible.
Also, the “STABLE” lamp of the LED indicator on the microscope is lit.
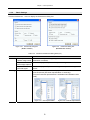
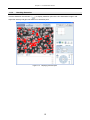
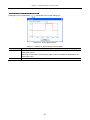
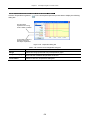
Displaying the logarithmic graph of temperature change
Click the Temp button to display the Temperature dialog box.
The time-lapse
experiment is running
under a stable condition.
An unstable condition is
detected during the
time-lapse experiment.
Figure 1.2-4
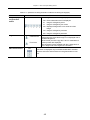
Table 1.2-3
Temperature dialog box
Functions on the Temperature dialog box
Item
Function
Range
Select time range (horizontal axis) of temperature graph.
Temperature
graph
Temperature changes inside of the culture chamber and the humidifier water tank,
and that of ambient temperature are shown.
Close button
Select to close the Temperature dialog box.
5
Chapter 1
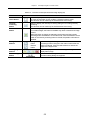
1.3
Basic Operations
Context Menu on the Title Bar
Right click on the title bar of this software window displays the context menu.
Figure 1.3-1
Context menu on the title bar
Table 1.3-1
Functions of context menu
Item
Function
About Bio Station
IM...
The About BioStation IM dialog box is displayed.
The dialog box showing the version information of this software appears.
Device information...
The Device information dialog box is displayed.
The Device information dialog box allows you to check information about the
microscope and camera connected to the control PC.
Error information...
The Error information dialog box is displayed.
The item is enabled when an error occurs, and the Error information dialog box
allows you to check the cause of the error.
Preferences...
The Preferences dialog box is displayed.
The dialog box allows you to configure basic settings appropriate for the
environment.
Hide control panel
Only the left side of the software window remains displayed.
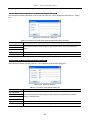
1.3.1
Checking the Software Versions
Click the About Bio Station IM... menu to display the About BioStation IM dialog box. This dialog box allows
you to check the version of the software.
Figure 1.3-2
About BioStation IM dialog box
6
Chapter 1
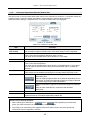
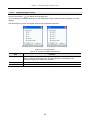
1.3.2
Basic Operations
Checking the Device Information
Click the Device information... menu to display the Device information dialog box.
This dialog box allows you to check information about the microscope and camera connected to the control
PC.
The screen illustrated below shows the case for using the BS-IM-MC MOT chamber.
Figure 1.3-3
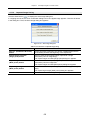
1.3.3
Device information dialog box
Checking the Error Information
Click the Error information... menu to display the Error
information dialog box.
The item whose checkbox is checked is the cause of
the error.
If there is no error, the Error information... menu is
disabled thus this dialog box cannot be displayed.
Difference of the error detection scope by the
microscope in use
When the BioStation IM is used as a microscope,
only the temperature sensor status can be
detected. Only the checkbox of “Temperature
controller communication error” is displayed on
the Error information dialog box.
Figure 1.3-4
Error information dialog box
(BioStation IMQ)
7
Chapter 1
1.3.4
Basic Operations
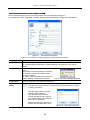
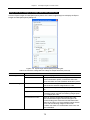
Basic Settings
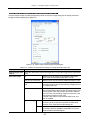
Click the Preferences... menu to display the Preferences dialog box.
Figure 1.3-5
Preferences dialog box
Figure 1.3-6
(BS-IM-C chamber)
Table 1.3-2
Functions of Preferences dialog boxes (1/2)
Item
General
Viewing
Preferences dialog box
(BS-IM-MC MOT chamber)
Function
Data input when
capture image saved
Select to save captured images together with information such as
observation conditions.
Explorer launches
when image capture
Select to display the Explorer after captured images are saved.
Explorer launches
when file export
Select to display the Explorer after images are exported in the general
format.
Exposure Time
Select the unit of exposure time displayed on the software
(msec/Fractional (Fractional representation in seconds)).
(Only the Fractional representation is available when BioStation IM is
used.)
Figure 1.3-7
msec representation
8
Figure 1.3-8 Fractional representation
Chapter 1
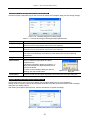
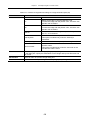
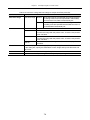
Table 1.3-2
Basic Operations
Functions of Preferences dialog boxes (2/2)
Item
Viewing
EPI Lamp
Function
Select the unit of the light intensity of the EPI lamp displayed on the
software (Transmission rate/Position representation).
(Only the Position representation is available when BioStation IM is used.)
Figure 1.3-9
Transmission rate
Figure 1.3-10 Position representation
representation
Dish
Type
Select the dish type (Normal/Hi-Q4) used for observation.
Selecting Hi-Q4 shows the fields to input and edit the names of the
compartments of the film bottom 4-quadrant dish on the Cell name
etc… tab.
Figure 1.3-11 Cell name etc… tab
BS-IMMC MOT
chamber
1.3.5
Enable AF Mode
Select to enable the AF mode and display the Reference mark register
screen. Auto-focusing is carried out whenever you switch between the
wells on the New time-lapse setting screen.
Launch as Mark
window mode
Select to display the Reference mark register screen immediately after
the software is started. If this is not selected, the Live observation
screen appears instead.
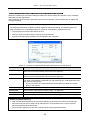
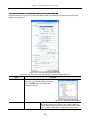
Hide Control Panel
Click the Hide control panel menu to display only the image view on the left side of the window.
Figure 1.3-12 Hide control panel
9
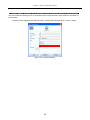
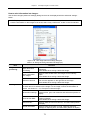
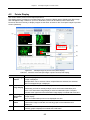
2
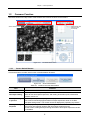
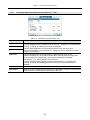
Live Observation Screen
2
When the BioStation IM/IMQ is used as a microscope, select this screen.
You can check the specimen is suitable or not for time-lapse experiment by observing cell shape and the
amount of fluorophore in cell.
(2)
(1)
(6)
(4)
(3)
(5)
Figure 2.0-1
Table 2.0-1
Live observation screen
Functions on the Live observation screen
Item
Function
(1)
Live observation
image display
The Live observation image of the field of view is displayed. Click in this display
to move the stage until the clicked point locates at the center of this display.
(2)
Observation
point display
The field of view is indicated by the red frame and displayed as the live
observation image.
Click the desired point to move the stage and to display the live image of the
clicked point.
(3)
Image
adjustment
buttons
Select to set tone adjustment, saturation check, intensity screening, and
pseudo color display.
(4)
Capture button
Select to capture the live observation image and register it to the Captured
image display (5).
(5)
Captured
image display
Display
area
The images captured with the Capture button are thumbnailed.
Any thumbnail image can be enlarged and displayed on another
window by clicking on the enlarge button (magnifier icon).
Function
To save the captured images, highlight the thumbnail image and click
). All highlighted images are saved at the
the Image save button (
same time.
Click the Trash button to delete the selected thumbnail images.
(6)
Observation
condition and
observation point
Adjust the stage position, the focusing condition, and the observation
conditions such as filters, magnification, light intensity, and exposure time.
10
Chapter 2
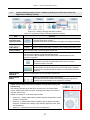
2.1
Live Observation Screen
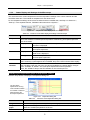
Image Adjustment Buttons and Captured Image Display
Figure 2.1-1
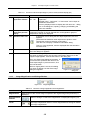
Table 2.1-1
Image adjustment buttons and captured image display
Functions of the image adjustment buttons and captured image display (1/2)
Item
Automatic tone
curve adjustment
apply button
Function
Select to automatically set the range.
Display range of intensity is
automatically set.
The highest intensity (A) of the
displayed image is set as the upper
limit (C) and the lowest intensity (B) is
set as the lower limit (D).
Figure 2.1-2
Intensity graph
Tone curve
adjustment
setting button
Select to set tone curve adjustment manually.
The Tone curve adjustment dialog box appears to set tone curve adjustment.
Tone curve
adjustment
cancel button
Select to cancel the applied tone curve adjustment and return to the original
screen.
Saturation check
button (FL1 &
FL2 only)
Select to display saturation point in red.
And then, adjust the intensity and gain until there is no saturation point.
To clear the saturation check condition, clicked this button again.
This function can be used only for the fluorescent microscopy.
Intensity
screening button
(FL1 & FL2 only)
Select to display the Intensity Screening dialog box for setting intensity
screening.
This function can be used only for the fluorescent microscopy.
Pseudo color
button
Select to display the live observation image with the pseudo color of the filter.
This function can be used only for the fluorescent microscopy.
Capture button
Select to capture the live observation image and register it to the Captured
image display.
If intensity screening and image adjustment are performed, the performed
image is registered.
With the single image capture switch of the ergonomic controller, this
operation can be performed.
Image overlay
button
Select to overlay more than one thumbnail image selected.
Select more than one thumbnail image on the Captured image display (5) and
click this button to add the overlaid image to the Captured image display (5).
The Image overlay button is enabled only when the XY coordinates of
selected thumbnails match and different filters are used.
11
Chapter 2
Table 2.1-1
Live Observation Screen
Functions of the image adjustment buttons and captured image display (2/2)
Item
Function
Trash button
Select to delete only selected thumbnail image.
The frame of selected thumbnail image is displayed in blue.
Image save
button
Select to save all thumbnail images in a file. Thumbnail image must be
highlighted prior to saving.
Select save format from TIFF, JPEG, BMP, or PNG.
For TIFF format, image resolution is selectable between 16 bits and 8 bits.
Captured image
display
The images captured with the Capture button are thumbnailed.
Click the Enlarge button (magnifier icon) at the bottom right of thumbnail image to
display the enlarged image on other screen.
If number of thumbnail images becomes five or more, a scroll bar appears at the
bottom of thumbnail display.
Gallery button
Select to display the Captured Image Gallery window and to show the
thumbnailed images captured with the Capture button in a list.
Reference mark
button
This button is displayed only for the BS-IM-MC MOT chamber.
Select to display the Reference mark register screen to register the AF
position of the reference mark.
12
Chapter 2
2.1.1
Live Observation Screen
Captured Image List View
Click the Gallery button (
) to display the Captured Image Gallery window and to show the thumbnailed
images captured with the Capture button in a list.
Figure 2.1-3
Table 2.1-2
Captured Image Gallery window
Functions on the Captured Image Gallery window
Item
Function
Enlarge button
Select to display the enlarged image on other screen.
Image save
button
Select to save all thumbnail images selected in a file. The thumbnail images
must be highlighted prior to saving.
Select the save format from TIFF, JPEG, BMP, or PNG.
For TIFF format, image resolution is selectable between 16 bits and 8 bits.
Image overlay
button
Select to overlay more than one thumbnail image selected.
Select more than one thumbnail image on the Captured image display (5) and
click this button to add the overlaid image to the Captured image display (5).
The Image overlay button is enabled only when the XY coordinates of
selected thumbnails match and different filters are used.
Trash button
Close button
Right-click menu
Select to delete only selected thumbnail image.
The frame of selected thumbnail image is displayed in blue.
Select to close the Captured Image Gallery window.
Right click the thumbnailed image to display the menu. In the menu, saving and
deleting the clicked images or selected images are available.
13
Chapter 2
2.1.2
Live Observation Screen
Tone Curve Adjustment
Click the Tone curve adjustment setting button (
Figure 2.1-4
Table 2.1-3
) to display the Tone curve adjustment dialog box.
Tone curve adjustment dialog box
Tone curve adjustment functions
Item
Enable tone
curve checkbox
Function
Select to enable the tone curve adjustment.
Apply button
Select to apply the set tone curve adjustment setting to the Live observation image
display.
Close button
Select to close the Tone curve adjustment dialog box without applying the tone curve
adjustment setting.
14
Chapter 2
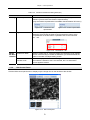
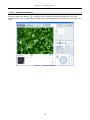
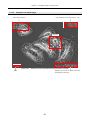
2.1.3
Live Observation Screen
Checking Saturation
Click the Saturation check button (
) to display saturation point of the live observation image in red.
Adjust the intensity and gain until there is no saturation point.
Figure 2.1-5
Displaying saturation point
15
Chapter 2
2.1.4
Live Observation Screen
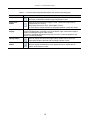
Intensity Screening
Click the Intensity screening button (
) to display the Intensity Screening dialog box.
Image select box
Figure 2.1-6
Table 2.1-4
Intensity screening dialog box
Intensity screening functions
Item
Enable Screening
checkbox
Function
Select to enable the intensity screening functions.
Image select box
(yellow box)
Drag a marquee (left click and drag) around the area for intensity screening.
Enlarge, reduce, or move the area with a mouse pointer if necessary.
Right click the box to display the Delete menu to delete the box.
Image display
Screening points (same intensity points) are displayed in blue.
Histogram
Intensity histogram of the image is displayed.
To adjust the intensity range, drag the ▼ and ▲ buttons from side to side.
Apply button
Select to apply setting of intensity screening to the Live observation image display.
Close button
Select to close the Intensity Screening dialog box.
16
Chapter 2
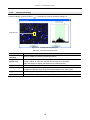
2.1.5
Live Observation Screen
Pseudo Color Display
Click the Pseudo color button (
) to display the live observation image with the pseudo color of the
fluorescent filter. You can capture the live observation image displayed with the pseudo color and save it into
a file.
Figure 2.1-7
Pseudo color display
17
Chapter 2
2.2
Live Observation Screen
Setting Observation Conditions (Filter, Magnification, Mode, Z
position, and Save)
Some observation condition settings vary between the phase contrast microscopy and the fluorescent
microscopy.
Also, there are the Manual mode and the Simple mode for the observation condition.
Both modes are available for settings in this section.
Figure 2.2-1
Setting observation conditions (for fluorescent filter; Left: Manual mode, right: Simple mode)
Table 2.2-1
Functions for setting observation conditions (1/2)
Item
Filter button
Function
Select the filter for observation. The blue frame appears on the selected filter button.
This operation is also available with the Observation method switches of the ergonomic
controller.
Select to perform phase contrast microscopy with the diascopic
illumination of the red LED illuminator built in the microscope.
Fluorescent filter is not used.
Select to perform the fluorescent microscopy using the selected filter
with the illumination of external mercury lamp. This button does not
appear unless the HG precentered fiber illuminator is connected and
turned the power on.
Magnification
button
Select the magnification for observation. This operation is also available
with the Magnification adjustment selector switch (UP/DOWN) of the
ergonomic controller.
Simple button
Select the Simple mode. Set the observation condition selecting from
the following three given exposure conditions:
● Bright: to brighten dark images
● Middle: to observe half-bright images
● Dark: to darken too bright images
Set a condition for each combination of filters (Ph, Fl1, and Fl2) and
magnifications (three types).
Manual button
Select the Manual mode. Set all observation conditions manually or load
the already registered condition file.
Set a condition for each combination of filters (Ph, Fl1, and Fl2) and
magnifications (three types).
18
Chapter 2
Table 2.2-1
Live Observation Screen
Functions for setting observation conditions (2/2)
Item
Z Position
Save button
Function
Register an appropriate Z position (focus position) for each selected filter.
For example, set the Z position for the fluorescent filter 1 (Fl1) and click the Fix button to
display the input value in red and register it.
Even if the fluorescent filter 2 (Fl2) is selected and the Z position is changed, the
registered value appears when the fluorescent filter 1 (Fl1) is selected again.
Click the Fix button again to clear the registered value.
Additionally, changing the Z position is available even after once registering the Z
position. To display the registered Z position again, click the Go button.
These settings can also be performed on the Simple mode.
Select to save observation condition setting in a setting file or in a file for
setting on the Simple mode.
19
Chapter 2
2.2.1
Live Observation Screen
Saving Observation Conditions
Click the Save button (
) in the observation condition setting area to display the Save setting dialog box.
And then, save observation condition setting in a setting file or the Bright, Middle, or Dark setting file on the
Simple mode.
Setting file compatibility
Files created by the software of Ver. 2.1 or later cannot be read into the software of Ver. 1.*.
Figure 2.2-2
Table 2.2-2
Save settings dialog box (Save into file)
Functions for saving observation conditions (Save into file)
Item
Function
Save into file
Select to save the observation condition as a setting file.
Save button
Select to display the Windows Save As dialog box.
Input a file name and save the observation condition as a setting file.
Close button
Select to close the dialog box without saving the observation condition.
Figure 2.2-3
Table 2.2-3
Save settings dialog box (Save as “Simple Setting” for)
Functions for saving observation conditions (Save as “Simple Setting” for)
Item
Function
Save as “Simple
Setting”for
Select to save the observation condition as the setting file in the Simple mode.
Specify the exposure condition for which the observation condition is saved.
Save button
Select to display the save confirmation
dialog box.
To save setting, click the OK button.
To return to the Save settings dialog box
without saving, click the Cancel button.
Figure 2.2-4
Close button
Save confirmation dialog box
Select to close the dialog box without saving observation condition setting.
20
Chapter 2
2.3
Live Observation Screen
Setting Observation Conditions (Focus Mode, Automatic Exposure,
Condition File Loading, Light Intensity, Exposure Time, Gain, and
Resolution)
Each setting in this section is available only on the Manual mode.
Figure 2.3-1
Setting observation conditions on the Manual mode (left: fluorescent filter, right: phase contrast filter)
Table 2.3-1
Functions for setting observation conditions (1/2)
Item
Function
AE (focus)
button
Select only for the Manual mode.
AE button
Select only for the Manual mode.
The exposure adjustment is performed with a focus priority mode. It is
useful for the focus adjustment because the exposure time for the dark
specimen is 1/6 second maximum. However, noise of the image
increases because this operation increases gain.
In this case, exposure time and gain are adjusted automatically. These
conditions cannot be adjusted manually.
Click this button again to clear focus priority mode.
Automatic exposure is performed once. Exposure time and gain value
used for the automatic exposure are displayed in each item box of
observation condition.
Load settings
Intensity
setting
Click here to load the already registered observation condition file.
Adjust intensity of each lamp with the slider and the right and left triangle buttons.
Display changes depending on selected filter.
This operation is also available with the Illumination intensity adjustment selector
(UP/DOWN) switch of the ergonomic controller.
For fluorescent filter: set the intensity of episcopic illumination (external
mercury lamp).
EPI Lamp
Close
Open
Select to open or close the shutter for excitation light.
They are enabled only when fluorescent filter is
selected.
This operation is also available with the Shutter
open/close switch of the ergonomic controller.
For phase contrast filter: set the intensity of diascopic illumination (built-in
LED illuminator).
DIA Lamp
Turned on
Turn on or off the built-in LED illuminator.
Turned off
21
Chapter 2
Table 2.3-1
Live Observation Screen
Functions for setting observation conditions (2/2)
Item
Function
Exposure
time
Select exposure time from the pull-down menu.
Setting value can be increased or decreased by “1” with the ▼ and ▲ buttons.
Gain
Click the value displayed next to the Gain to display the Edit detailed gain dialog box.
In the dialog box, set the compensation value with the keyboard.
The compensation value can also be set with the slider and the right and left triangle
buttons displayed next to the value.
Resolution
Select resolution from the pull-down menu.
Resolution can be set for each channel separately. The applicable combinations are
shown as follows:
Resolution combinations for BioStation IMQ
Resolution
640x480
640x480 Binning
640x480
640x480 Binning
1280x960
1280x960
Resolution combinations for BioStation IM
Resolution
800x600
800x600 Binning
800x600
800x600 Binning
1600x1200
1600x1200
: applicable
None: not applicable
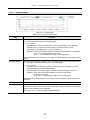
2.3.1
Gain Compensation Value Fine Adjustment
Click the compensation value displayed next to “Gain” to display the Edit detailed gain dialog box.
Gain compensation value can be adjusted finely.
Figure 2.3-2
Table 2.3-2
Edit detailed gain dialog box
Functions of gain compensation value fine adjustment
Item
Function
Compensation
value setting
Set the compensation value with the keyboard or the ▼ and ▲ buttons.
Apply button
Select to apply selected compensation value and close the dialog box.
Close button
Select to cancel compensation value setting and close the dialog box.
22
Chapter 2
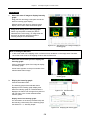
2.4
Live Observation Screen
Observation Point and Focus Adjustment
Jog dial
Figure 2.4-1
Table 2.4-1
Setting observation point
Functions of observation point movement and focus adjustment
Item
Jog dial
Function
Coarse
focus
Fine
focus
Focus button
Coarse
focus
Fine
focus
Undo button
Focus slide
bar
Well switch
button
Click each direction button of the jog dial to move stage.
At the center part of the jog dial, X and Y coordinates of current stage
position are displayed.
This operation is also available with the X stage knob or the Y stage
knob of the ergonomic controller.
Click the up-arrow button or down-arrow button to move objective in
the Z direction.
This operation is also available with the Focus knob of the ergonomic
controller.
Select to return observation point to the previous focus position.
Slide up or down the slider to adjust focus.
This button is displayed only for the BS-IM-MC MOT chamber.
Select to switch the well to observe in the glass bottom 4-well dish.
4
3
2
1
Figure 2.4-2
23
Position of the well number
3
New Time-lapse Setting Screen
3
You can set and save observation points and observation conditions, and perform time-lapse experiment on
this screen.
Two screens, “Live” screen and “Wide field” screen, are provided to set observation points and observation
conditions for time-lapse observation.
On the Live screen, the live image is used for the settings. On the Wide field screen, a captured tiled image is
used for the settings.
When using the BS-IM-MC MOT chamber with the AF mode enabled, the New time-lapse setting screen
cannot be displayed unless the AF position of the reference mark is registered. To carry out time-lapse
observation on the BS-IM-MC MOT chamber, be sure to register the AF position of the reference mark.
For details on registering AF position of the reference mark, see Section 1.1.2, “Registering AF Position
of the Reference Mark (BS-IM-MC MOT Chamber)”.
Do not have an access to the time-lapse result file for the target specimen during time-lapse experiment.
Otherwise, experiment data obtained while the file is being accessed may not be saved on the
Time-lapse result file.
(Ex.) If you copy the time-lapse result file for backup from Explorer during the time-lapse experiment,
the experiment data obtained while it is being copied will not be saved on the file.
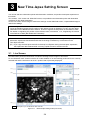
3.1
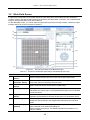
Live Screen
Set observation points and observation conditions checking the live image on this screen.
For the BS-IM-MC MOT chamber with the AF mode enabled, AF is automatically performed for the currently
selected well and the well moves to the X-Y position that is previously displayed.
(5)
(1)
(2)
(6)
(8)
(3)
(7)
(4)
: Displayed only for the BS-IM-MC MOT chamber.
Figure 3.1-1
New time-lapse setting screen (Live screen)
24
Chapter 3
Table 3.1-1
New Time-lapse Setting Screen
Functions on the New time-lapse setting screen (Live screen)
Item
Function
(1)
Screen switch
buttons
Select to switch between the Live screen and the Wide field screen.
(2)
Observation
point
verification
display
The field of view is indicated by the red frame and displayed as the live observation
image.
The registered observation point is indicated by the blue frame.
Click the desired point to move the stage and to display the live image of the clicked
point.
For the BS-IM-MC MOT chamber, the Well switch tabs are displayed. Click the Well
switch tab to show its observation points.
(3)
Live
observation
image display
The live observation image of the field of view is displayed.
Click in this screen to move the stage until the clicked point locates at the center of this
screen.
(4)
Image
adjustment
buttons
Select to set tone adjustment, saturation check, intensity screening, and pseudo color
display.
Operation of each function is the same as that for the Live observation screen.
(5)
Start
time-lapse
button
Select to start time-lapse experiment.
Time-lapse start confirmation dialog box (Confirmation window) appears.
Time-lapse
experiment
scheme
Points tab
Select to display the observation conditions (filter name, exposure time,
and magnification) for each observation point.
Click an observation point to display the Point information dialog box. In
the dialog box, checking, changing, and deleting the condition are
available.
Time tab
Select to display the capturing interval time, total observation time, and
number of rounds for time-lapse experiment.
Click time-lapse experiment time display to display the Timelapse dialog
box. In the dialog box, changing and deleting time-lapse experiment
time setting are available.
Click the New button to add new time-lapse experiment time.
Cell name
etc... tab
Select to input subordinate information of time-lapse experiment.
“Sample name”, “Cell name”, or “User name” can be input.
Click any displayed name to display the Cell name etc... dialog box. In
the dialog box, inputting, changing, and deleting the name are available.
Zstack tab
To specify multiple observation points in the Z-direction for an
observation point, use this function. Up to 99 observation points can be
set by specifying the travel amount and travel count along Z-axis.
However, the setting that exceeds the maximum stroke in the Z
direction is not available.
(6)
(7)
Observation
condition and
observation
point
(8)
Time-lapse
experiment
point
registration
button
If the Pause button (Time-lapse images in process screen) is used to suspend the
time-lapse experiment that is running, the Start time-lapse button changes from
to
for restart.
Set observation conditions (filter selection, magnification selection, intensity
adjustment, and exposure time setting) and move stage and perform focusing with the
Jog dial.
For the BS-IM-MC MOT chamber, the Well switch button is displayed. Clicking the
Well switch button displays the live observation image of the selected well.
After specifying all observation conditions, click the Time-lapse
experiment point registration button to register the specified conditions
to the Time-lapse experiment scheme.
If registered observation condition setting is changed, the setting is
overwritten. Up to 99 points can be registered.
25
Chapter 3
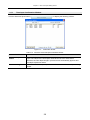
3.1.1
New Time-lapse Setting Screen
Time-lapse Confirmation Window
Click the Start time-lapse button (
) to display the following window.
Figure 3.1-2
Table 3.1-2
Confirmation window
Functions on the Time-lapse confirmation window
Item
Start time-lapse
button
Function
Select to display the Windows Save As dialog box.
Input a file name for the time-lapse result file and click the Save button.
And then, the Time-lapse image in process screen automatically appears and
time-lapse experiment starts.
Back to setting button Select to cancel time-lapse experiment and return to the New time-lapse setting
screen.
26
Chapter 3
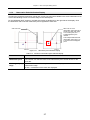
3.1.2
New Time-lapse Setting Screen
Observation Point Verification Display
Checking the registered observation points and current view point are available in the entire observation area.
Click in the following screen to move the stage to the clicked point.
For the BS-IM-MC MOT chamber, the Well switch tabs are displayed on the right side of the display. Click
the Well switch tab to see the observation points registered to each well.
Well switch tabs
When two or more
observation points are set at
points very near each other
or at a same point, the “...”
symbol appears by the
number.
This example indicates that
observation points from 1 to
5 are set at the overlapped
point.
Figure 3.1-3
Table 3.1-3
Observation point verification display
Functions of observation point verification display
Item
Function
Registered
observation point
The registered observation point is indicated by the blue frame.
The number over the blue frame is the same as the point number shown on the
Point tab.
Live image display
range
The field of view is indicated by the red frame and displayed as the live
observation image.
X and Y coordinates of the center are displayed.
27
Chapter 3
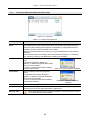
3.1.3
New Time-lapse Setting Screen
Time-lapse Experiment Scheme (Points Tab)
Figure 3.1-4
Table 3.1-4
Points tab
Functions on the points tab
Item
Function
Observation
point
Select the Points tab to display observation conditions (filter name, exposure time,
and magnification) for each observation point. The number next to the checkbox is
the point number indicating the sequence of registration. For the BS-IM-MC MOT
chamber, the well number is prefixed to the number.
When time-lapse experiment is performed, only point selected with a check mark is
observed.
Click an observation point to display the Point information dialog box. In the dialog
box, checking, changing, and deleting the condition are available.
Delete button
Select to delete the selected observation
point.
The Delete confirmation dialog box
appears. To delete the selected observation
point, click the OK button.
To return to the Points tab without deleting,
click the Cancel button.
Clear button
Select to delete all selected observation
points.
The Delete all confirmation dialog box
appears. To delete all selected observation
points, click the OK button.
To return to the Points tab without deleting,
click the Cancel button.
Figure 3.1-5 Delete confirmation dialog box
Figure 3.1-6
Delete all confirmation
dialog box
Load button
Select to load the registered time-lapse experiment condition file.
Save button
Select to save the registered observation point, observation condition, and time-lapse
experiment time to a time-lapse experiment condition file.
Warning mark
If time-lapse experiment time setting is disabled or hard disk space of control
PC is insufficient, this mark appears.
28
Chapter 3
New Time-lapse Setting Screen
Checking or deleting observation condition
Click an observation point on the Point tab to display the Point information dialog box.
In the dialog box, check observation condition setting for each combination of filters and magnifications.
Figure 3.1-7
Table 3.1-5
Point information dialog box
Functions for checking, changing or deleting observation condition
Item
Function
Go button
Select to change the displayed settings.
To change displayed observation condition settings to new settings, click the Go
button.
Delete button
Select to delete the selected observation
point.
The Delete confirmation dialog box appears.
To delete the selected observation point,
click the OK button.
To return to the Point information dialog box
without deleting, click the Cancel button.
Close button
Edit comment
button
Figure 3.1-8 Delete confirmation dialog box
Select to close the Point information dialog box.
Select to add or edit a comment per observation point.
Click the Edit comment button to display Edit comment dialog box for adding
or editing comments.
Click the Apply button to add the
comment after creating it.
Click the Close button without
clicking the Apply button to ignore
the entered comment and close the
Edit comment dialog box.
Added comment pops up when you
double-click the observation point.
Figure 3.1-9
29
Edit comment dialog box
Chapter 3
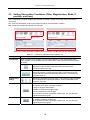
3.1.4
New Time-lapse Setting Screen
Time-lapse Experiment Scheme (Time Tab)
When the stream setting is configured during the time-lapse experiment time setting, the display of Time tab is
replaced with Stream.
Figure 3.1-10 Time tab
Table 3.1-6
Functions on the Time tab
Item
Function
Time-lapse
experiment
time display
Select to display the capturing interval time, total observation time, and number of rounds
for time-lapse experiment.
Click time-lapse experiment time display to display the Timelapse dialog box (for setting
change). In the dialog box, changing and deleting capturing interval time and total
observation time are available.
Delete button
Select to delete the selected time-lapse
experiment time.
The Delete confirmation dialog box appears.
To delete the selected time-lapse experiment
time, click the OK button.
To return to the Time tab without deleting,
click the Cancel button.
Figure 3.1-11
New button
Select to set new time-lapse experiment time.
The Timelapse dialog box (for new registration) appears.
Clear button
Select to delete all settings of time-lapse
experiment time.
The Delete all confirmation dialog box
appears. To delete all settings of time-lapse
experiment time, click the OK button.
To return to the Time tab without deleting,
click the Cancel button.
Delete confirmation dialog box
Figure 3.1-12 Delete all confirmation dialog box
Load button
Select to load the registered time-lapse experiment condition file.
Save button
Select to save the registered observation point, observation condition, and time-lapse
experiment time to a time-lapse experiment condition file.
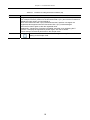
Registering multiple time-lapse experiment times is
available.
This software can register multiple time-lapse experiment times,
which are composed of different total observation time and
capturing interval time.
When a time-lapse experiment starts, the multiple time-lapse
experiment times registered with the Time tab are automatically
applied in descending order.
Additionally, even during the time-lapse experiment, adding a
new time-lapse experiment time and changing or deleting
unperformed time-lapse experiment time are available.
30
Figure 3.1-13 Time tab
Chapter 3
New Time-lapse Setting Screen
Changing or deleting time-lapse experiment time
Click a time-lapse experiment time on the Time tab to display the Timelapse dialog box (for setting change).
Figure 3.1-14 Timelapse dialog box (for setting change)
Table 3.1-7
Functions for changing or deleting time-lapse experiment time
Item
Function
Acquisition cycle
Input capturing interval time for time-lapse experiment.
Select a unit from the pull-down menu next to the input box.
Total time
Input total observation time of time-lapse experiment.
Select a unit from the pull-down menu next to the input box.
Rounds
Round value is displayed.
This value is automatically calculated from total observation time and capturing
interval time.
Apply button
Select to apply the input values to time-lapse experiment time setting.
Delete button
Select to delete the highlighted time-lapse
experiment time.
The Delete confirmation dialog box appears. To
delete the selected time-lapse experiment time,
click the OK button.
To return to the Timelapse dialog box without
deleting, click the Cancel button.
Close button
Figure 3.1-15
Delete confirmation
dialog box
Select to cancel the Time-lapse experiment time setting and close the dialog box.
Registering new time-lapse experiment time
Click the New button of the Time tab to display the Timelapse dialog box (for new registration).
Setting values of capturing interval time and total observation time are the same as those of the Timelapse
dialog box (for setting change).
After setting time-lapse experiment time, click the Add button to register the setting.
Figure 3.1-16 Timelapse dialog box (for new registration)
31
Chapter 3
New Time-lapse Setting Screen
Registering a new time-lapse experiment time for stream capturing
When the conditions for the stream setting are fulfilled, the Stream setting box appears on the Timelapse
dialog box (for new registration).
After configuring the time-lapse experiment time for stream capturing, click the Add button to register the
configured settings.
Stream setting limitations
The following observation conditions must be applied for the stream setting. The Stream setting box
does not appear on the Timelapse dialog box unless all of the following conditions are met.
•
The exposure time must be less than a second.
•
One type each for the filter and the objective must be selected.
•
A single observation point (Z-stack) must be applied in the Z direction.
Figure 3.1-17 Timelapse dialog box (for stream capturing)
Table 3.1-8
Functions for registering the time-lapse experiment time for stream capturing
Item
Function
Acquisition cycle
Input the capturing interval time for the time-lapse experiment.
Select a unit from the pull-down menu next to the input box.
Total time
Input the total observation time of the time-lapse experiment.
Select a unit from the pull-down menu next to the input box.
Stream blocks
The number of stream blocks is displayed.
The value is automatically calculated from the streaming time, total observation time,
and capturing interval time.
* The unit of stream data captured with the stream setting is called the “Stream
block” in this manual.
Stream setting
Select to enable the stream setting.
Stream time
Set the stream capturing time (setting range: 1 to 3600 sec).
Add button
Select to configure the set values as the time-lapse experiment time
Close button
Select to cancel the Time-lapse experiment time setting and to close the dialog box.
Caution on stream capturing
•
After the time-lapse experiment for the stream capturing is performed, the volume of the file data
becomes heavy. Be sure to keep enough blank space in the hard disk on the control PC before
performing the time-lapse experiment.
•
For the stream capturing, the number of frames varies among the stream blocks.
32
Chapter 3
3.1.5
New Time-lapse Setting Screen
Time-lapse Experiment Scheme (Cell Name etc... Tab)
Figure 3.1-18 Cell name etc... tab
Table 3.1-9
Functions on the Cell name etc... tab
Item
Sample name
Cell name
User name
Function
The Sample name, Cell name, and User name are displayed.
Click any displayed name to display the Cell name etc... dialog box. In the dialog box,
inputting, changing, and deleting the name are available.
The time-lapse experiment can be performed even if none of them is input.
The input information in the Cell name etc... dialog box can be displayed on saved
images or Live images.
Dimension
This field appears when Hi-Q4 (film bottom 4-quadrant dish) is set on the
Preferences dialog box. Since the BS-IM-MC MOT chamber does not support the
Hi-Q4 (film bottom 4-quadrant dish), the Dimension field does not appear.
(See Section 1.3.4, “Basic Settings” as a reference)
Click the Dimension field to display the Dimension dialog box. In the dialog box,
inputting, changing, and deleting the names of the first to fourth quadrants are
available.
Load button
Select to load the saved time-lapse experiment condition file.
Save button
Select to save the registered observation point, observation condition, and time-lapse
experiment time as a time-lapse experiment condition file.
33
Chapter 3
New Time-lapse Setting Screen
Inputting subordinate information of time-lapse experiment
Click Sample name/Cell name/User name on the Cell name etc... tab to display the Cell name etc... dialog
box.
Figure 3.1-19 Cell name etc... dialog box
Table 3.1-10 Functions for inputting time-lapse experiment subordinate information
Item
Sample name
Cell name
User name
Function
Input names (arbitrary letter strings) for the Sample name, Cell name, and User
name.
Apply button
Select to register the input name.
Close button
Select to close the dialog box without registering the input name.
Inputting name of film bottom 4-quadrant dish
Click Dimension field on the Cell name etc... tab to displays the Dimension dialog box.
Figure 3.1-20 Dimension dialog box
Table 3.1-11 Functions on the Dimension dialog box
Item
Function
First quadrant
Second quadrant
Third quadrant
Input names (arbitrary letter strings) for the respective compartments of the film
bottom 4-quadrant dish.
Fourth quadrant
Apply button
Select to register the input name.
Close button
Select to close the dialog box without registering the input name.
34
Chapter 3
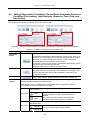
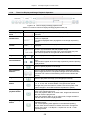
3.1.6
New Time-lapse Setting Screen
Time-lapse Experiment Scheme (Zstack Tab)
Use this function to set up multiple observation points in the Z-direction at a same X-Y coordinate. When the
Z-stack function is used, the setting information is saved and will be restored at the next time.
When the stream setting is configured on the Time tab, the Zstack tab is not displayed.
Figure 3.1-21 Zstack tab
Table 3.1-12 Functions on the Zstack tab
Item
Function
Register points
with Z-stack
Select to enable the Z-stack function. On the Time-lapse images in process screen
and Time-lapse images Acquired screen, the Z-stack display control is displayed.
Step
Specify the travel amount (step width) in the Z direction.
Enter a value with the keyboard. (Minimum step: 0.05 µm)
The value can be changed with the arrow buttons in 0.1 µm steps.
Independent steps
Select to enable the UP steps function.
Down/Up
Specify the travel count (step count) in the Z direction.
Enter a value with the keyboard.
The value can be changed with the arrow buttons. (Acceptable range: 1 to 49 steps)
Up to 99 steps can be set for the Z-stack (current observation point + 49 steps for
Down/Up).
From/To
Total travel amounts in the Z direction (plus and minus directions) appear.
These values are calculated automatically from the step width and the step count.
Z-stack sequence
Captures images with all selected filters by Z position of an identical
observation point.
Select to capture images by filters at an identical observation point in
a short time. The filters are switched whenever an image is captured,
thus it takes longer time to make observations.
Captures observation images in the Z direction together by selected
filters.
Select to make observations in a short time with less filter
switchovers.
Load button
Select to load the saved time-lapse experiment condition file.
Save button
Select to save the registered observation point, observation condition, and time-lapse
experiment time as a time-lapse experiment condition file.
Caution on the Z-stack sequence
•
When switching the settings for (
) and (
) after registering the observation
points, the Z-stack sequence of all observation points is changed.
•
The image of an observation point registered with the Z-stack function cannot be reproduced
successively with this application software.
35
Chapter 3
New Time-lapse Setting Screen
Z position display examples for observation points registered with the Z stack function
The Point information dialog box for an observation point configured with Z stack shows the Z position as
shown below.
Reference value (negative-side absolute value – positive-side absolute value, number of steps)
Figure 3.1-22 Z position examples
36
Chapter 3
3.1.7
New Time-lapse Setting Screen
Setting and Editing Observation Conditions (Setting for Observation Filter and
Magnification/Editing Z-stack)
Figure 3.1-23 Setting or changing observation conditions
Table 3.1-13 Functions for setting or changing observation conditions
Item
Function
Time-lapse
experiment point
registration button
Select to register the observation points and conditions to the
Time-lapse experiment scheme.
If registered observation condition setting is changed, the setting is overwritten.
New registration
/setting change
select menu
New point
Select to register observation condition for a new observation point.
For point
Select to change observation condition of the existing observation point.
Filter checkbox
Select the filter used for the time-lapse experiment.
Filter button
Select the filter button to display the image with the selected filter.
The blue frame appears on the selected filter button.
This operation is also available with the Observation method switches of the
ergonomic controller.
Select to perform phase contrast microscopy with the diascopic
illumination of the red LED illuminator built in the microscope.
Fluorescent filter is not used.
Select to perform the fluorescent microscopy using the selected filter with
the illumination of external mercury lamp. This button does not appear
unless the HG precentered fiber illuminator is connected and turned the
power on.
Magnification
checkbox
Magnification
button
Select the magnification for the time-lapse experiment.
Select the magnification for the observation.
This operation is also available with the Magnification adjustment
selector switch (UP/DOWN) of the ergonomic controller.
Details about setting observation condition, moving observation point,
and focusing
The following operations are the same as those of the Live observation
screen: setting observation condition, selecting observation point with the
Jog dial, and focusing.
Reference: Chapter 2, “Live Observation Screen”
•
Section 2.2, “Setting Observation Conditions (Filter, Magnification, Mode,
Z position, and Save)”
•
Section 2.3, “Setting Observation Conditions (Focus Mode, Automatic
Exposure, Condition File Loading, Light Intensity, Exposure Time, Gain,
and Resolution)”
•
Section 2.4, “Observation Point and Focus Adjustment”
37
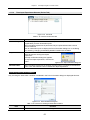
Chapter 3
New Time-lapse Setting Screen
Editing Z-stack
Follow the procedure below to edit the Z-stack of an existing observation point.
Note that editing is not available after the start of time-lapse experiment.
(1) Display the observation point of which you
want to edit Z-stack.
Select an observation point to edit on the New
registration/setting change select menu.
Figure 3.1-24 Selecting observation point
(2) Open the Zstack tab and edit Z-stack.
Figure 3.1-25 Zstack tab
(3) Click the Time-lapse experiment point
registration button to confirm updated
setting conditions.
Figure 3.1-26 Confirming setting conditions
38
Chapter 3
3.2
New Time-lapse Setting Screen
Wide Field Screen
If a specimen is exposed to an excitation light during the observation point settings and the observation
condition settings, the deterioration speed of the specimen becomes faster. To avoid it, use a captured tiled
image to set up observation points and conditions.
On the Wide field screen, you cannot adjust the light intensity and the focusing condition. Therefore, adjust
intensity and focus on the Live screen in advance.
(1)
(8)
(2)
(9)
(3)
(10)
(4)
(6)
(7)
(11)
(5)
Figure 3.2-1
Table 3.2-1
New time-lapse setting screen (Wide field screen)
Functions on the New time-lapse setting screen (Wide field screen) (1/2)
Item
Function
(1)
Screen switch
buttons
Select to switch between the Live screen and the Wide field screen.
(2)
Observation point
verification display
The current pointer is indicated by the red frame. The registered
observation point is indicated by the blue frame.
(3)
Browse/clear
buttons
Select to set and clear a browse area of a tiled image.
(4)
Tiled image display
The images browsed as a tiled image are displayed. The current pointer is
indicated by the yellow frame. The registered observation point is indicated
by the blue frame.
(5)
Image adjustment
buttons
Select to set up tone curve adjustment.
Operation of these buttons is the same as that of the Live observation screen.
(6)
Partial enlargement
Click the Magnifier button and drag the mouse pointer on the tiled image to
enlarge the area according to the magnification selected from the pull-down
menu.
(7)
Cross line display
checkbox
The Show cross line checkbox appears when Hi-Q4 (film bottom 4-quadrant
dish) is selected on the Preferences dialog box.
Select to display the crosshair. This software identifies the quadrants 1 to 4
with the crosshair.
39
Chapter 3
Table 3.2-1
New Time-lapse Setting Screen
Functions on the New time-lapse setting screen (Wide field screen) (2/2)
Item
Function
(8)
Start time-lapse
button
Select to start a time-lapse experiment.
A time-lapse start confirmation dialog box (Confirmation window) appears.
(9)
Time-lapse
experiment scheme
Displays and functions of the tabs are same as those of the Live screen.
(10) Observation condition
and observation point
settings
Switch filters and a magnification to be used.
When an enlarged view of the tiled image is displayed, the display area can
be scrolled with the operation of these controls.
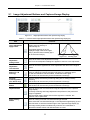
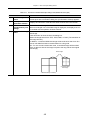
(11) Save Wide field image
button
Select to combine range-selected observation area and save it as one Wide
field image.
Click this button to show the Save As dialog box.
Select the image format from TIFF, JPEG, BMP, or PNG. (The resolution of
the image is fixed.)
In addition, a combined Wide field image will be reduced so that it can fit a
size of one Wide field area or smaller based on a long side.
(Ex.: For a 2×2 matrix observation area, a combined image will be scaled
down so that one side of the image is equal to the long side of the original
size image.)
Same length
Combined Wide
field image
Selected area (2×2 matrix)
40
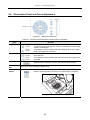
Chapter 3
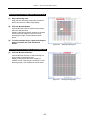
3.2.1
New Time-lapse Setting Screen
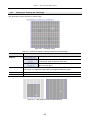
Observation Point Verification Display
The current pointer location, the registered observation area locations, and the current image display area
can be identified on the upper screen.
Figure 3.2-2
Observation point verification display (magnifications; left: Full/middle: 2×/right: 4×)
Table 3.2-2
Functions of observation point verification display
Item
Function
Registered
observation point
The registered observation point is indicated by the blue frame.
The number on the blue frame corresponds with the point number shown on the
Point tab.
Current pointer
The red frame (yellow frame on the tiled image display) indicates the current pointer
and provides the X and Y coordinates of the center.
Click the desired point to move the current pointer to the position.
Image display area
The area of the tiled image is indicated by the purple large frame.
The purple frame does not appear when the magnification is “Full”, because the
entire tiled image is displayed.
For the BS-IM-MC MOT chamber, the Well switch tabs are displayed on the right side of the display. Click
the Well switch tab to see the observation points registered to each well.
Well switch tabs
Figure 3.2-3
Observation point verification display for the BS-IM-MC MOT chamber (magnification: Full)
41
Chapter 3
3.2.2
New Time-lapse Setting Screen
Browsing or Clearing the Tiled Image
The observation area is browsed as a tiled image.
Figure 3.2-4
Table 3.2-3
Tiled image display
Functions for setting or clearing a browse area on the tiled image
Item
Function
Browse/clear
buttons
Select to clear browsing the tiled image.
Select to browse the selected area with the mouse pointer as
a tiled image. (See the figure at lower left.)
Select to browse the entire image as a tiled image. (See the
figure at lower right.)
Blue frame
Registered observation point.
The number of a registered observation point appears within the frame.
Yellow frame
Current pointer, which specifies an observation point
Scroll bar
Use this scroll bar to scroll the display when the tiled image is enlarged.
Figure 3.2-5
Tiling images (left: Browse/right: Browse all)
42
Chapter 3
New Time-lapse Setting Screen
Browsing only the image within selected area
(1) Select browsing area.
(2)
Drag (left click and drag) a marquee around the
area to browse on the tiled image display.
(2) Click the Browse button.
Click the Browse button to start browsing image
within the selected area.
Display of the Browse button changes to “Browse
cancel” while the image is browsed. To stop
browsing the image, click the Browse cancel
button.
(3) To select multiple areas, repeat selecting the
areas to browse and click the Browse
button.
(1)
Figure 3.2-6
Selecting browsing area
Browsing the entire image of observation area
(1) Click the Browse all button.
(1)
Click the Browse all button to start browsing the
entire image of observation area.
Display of the Browse all button changes to
“Browse cancel” while image is browsed. To stop
browsing image, click the Browse cancel button.
Figure 3.2-7
43
Starting browsing image
Chapter 3
3.2.3
New Time-lapse Setting Screen
Setting Observation Conditions and Moving the Stage
Jog dial
Figure 3.2-8
Table 3.2-4
Setting observation condition
Functions for setting observation conditions and moving the stage (1/2)
Item
Time-lapse
experiment point
registration button
Filter setting
checkboxes
Filter buttons
Function
Select to register the observation point data and the observation
conditions for the browsing to the Time-lapse experiment scheme.
Select the filter used for the browsing the image as a tiled image.
Select the filter button to display the image with the selected filter.
When selecting multiple filters, the images overlaid with the selected filters are
displayed.
Switching display while browsing an image is not available.
Filter buttons not selected when browsing the tiled image are disabled to select.
The blue frame appears on the selected filter button.
This operation is also available with the Observation method switches of the
ergonomic controller.
Select to perform phase contrast microscopy with the diascopic
illumination of the red LED illuminator built in the microscope.
Fluorescent filter is not used.
Select to perform the fluorescent microscopy using the selected
filter with the illumination of external mercury lamp. This button
does not appear if the HG precentered optical fiber light source is
connected and turned the power on.
Selecting
magnification
Register Wide
field image points
in a batch
checkbox
On the Wide field screen, magnification is fixed to 20×. Therefore, changing
magnification is not available.
Select to register points in an observation area (in blue frame) selected
on the Wide field screen in a batch.
Click the Time-lapse experiment point registration button with this
checkbox checked to register the points in the selected area (in blue
frame) in a batch.
The points will be registered from left top -> right top -> left bottom ->
right bottom.
When the total of registered observation points and points to be
registered exceeds 99 points or selected area overlaps a registered
Wide field area (that is, the XY coordinates match completely), the
batch registration is not available.
44
Chapter 3
Table 3.2-4
New Time-lapse Setting Screen
Operations for setting observation conditions and moving the stage (2/2)
Item
Function
Image display
magnification
button
Select magnification of tiled image display with these buttons.
Full: Entire observation area is displayed.
2×: Image is enlarged by twice.
4×: Image is enlarged by four times.
20×: Displayed image size is one sheet of a tiled
image.
40×: Image is enlarged by 40 times.
80×: Image is enlarged by 80 times.
Jog dial
Coarse focus
Fine focus
Click each direction button of the jog dial to scroll the tiled
image when the entire tiled image is not displayed due to
partial enlargement.
At the center part of the jog dial, X and Y coordinates of
current pointer are displayed.
This operation is also available with the X stage knob or
the Y stage knob of the ergonomic controller.
Well switch button
This button is displayed only for the BS-IM-MC MOT chamber.
Select to switch the well to observe in the glass bottom 4-well
dish.
45
4
Time-lapse Images in Process Screen
4
This screen shows process of time-lapse experiment. When time-lapse experiment is started, this screen
automatically appears.
Therefore, this screen cannot be displayed by operating any buttons.
There are the Channels display and the Points display for the Time-lapse images in process screen.
Table 4.0-1
Channels display and Points display
Item
Function
Channels
Four display areas are provided for one observation point. Three filter images, filters
overlapped image, and Ratio image can be displayed at the same time.
Points
One display area is provided for one observation point. Switch the display area to
display each filter image and overlapped image.
Therefore, up to four observation points can be observed at the same time.
4.1
Channels Display
(2)
(3)
(4)
(5)
(6)
(1)
(13)
(7)
(8)
(14)
(9)
(10)
(15)
(16)
(11)
(17)
(12)
(18)
Figure 4.1-1
Table 4.1-1
Time-lapse images in process screen (Channels display)
Functions on the Time-lapse images in process screen (Channels display) (1/3)
Item
Function
(1)
Screen switch
buttons
Select to switch between the Channels screen and the Points screen.
(2)
Image magnification
and enlarge/reduce
buttons
Magnification of the current image compared to the original image size
(resolution) is displayed. Click the magnifier buttons to enlarge or reduce
the image.
(3)
Scroll mode button
Scroll the image freely by clicking this button and dragging the mouse
pointer on the enlarged image.
46
Chapter 4
Table 4.1-1
Time-lapse Images in Process Screen
Functions on the Time-lapse images in process screen (Channels display) (2/3)
Item
Function
(4)
Clipping button
Select to perform clipping on the image area. The function is turned on or
off each time the button is clicked.
(5)
Magnification
buttons
Select to show the current magnification.
(6)
Z-stack display
control
The Z-stack display control is displayed when Register points with Z-stack
is checked on the Zstack tab of the New time-lapse setting screen. The
pull-down menu shows the Z coordinate of the image taken, and time-lapse
observation image display can be switched by making a choice. The slider
allows you to switch the image display along the Z coordinate.
(7)
Image of time-lapse
experiment (Ph)
Phase contrast microscopy image of time-lapse experiment is displayed.
If phase contrast filter is not selected for observation condition, its image is
not displayed.
(8)
Image of time-lapse
experiment (Fl1)
Fluorescent microscopy image of time-lapse experiment is displayed.
If the fluorescent filter (Fl1) is not selected for observation condition, its
image is not displayed.
(9)
Image of time-lapse
experiment (Fl2)
Fluorescent microscopy image of time-lapse experiment is displayed.
If the fluorescent filter (Fl2) is not selected for observation condition, its
image is not displayed.
(10) Image of time-lapse
experiment (Multi
Ch)
When two or more filters are selected, their images are
overlapped and displayed.
Select to display the Ratio image of time-lapse
experiment.
Select to display the Ratio setting dialog box and set
the Ratio image.
(11) Intensity graph
This graph shows changes in intensity during time-lapse experiment.
The color of graph line is the same as that of each filter.
(12) Time line display
and image playback
control
Use the slider to check process of time-lapse experiment. The button
at the right and left of the slide bar is used to reproduce images step by
step or reproduce images step by step in a reverse order.
Also, use the image control buttons to pause, playback, forward fast,
playback slowly, reverse slowly, repeat partially, and mark a point.
(13) Observation point
verification display
The observation point of time-lapse experiment is indicated by the yellow
frame.
The registered observation point is indicated by the blue frame.
(14) Time-lapse
experiment scheme
Points tab
Select to display the observation conditions (filter name,
exposure time, and magnification) for each observation point.
Click an observation point to display the Point information
dialog box. In the dialog box, checking, changing, and deleting
the condition are available. Click the Stop button to stop the
running time-lapse experiment.
Time tab
Select to display the capturing interval time, total observation
time, and number of rounds for time-lapse experiment.
Click time-lapse experiment time display to display the
Timelapse dialog box. In the dialog box, changing and deleting
time-lapse experiment time setting are available.
Click the New button to add new time-lapse experiment time.
47
Chapter 4
Table 4.1-1
Time-lapse Images in Process Screen
Functions on the Time-lapse images in process screen (Channels display) (3/3)
Item
Function
(14) Time-lapse
experiment scheme
Cell name
etc... tab
(15) Time-lapse
experiment process
display
The time-lapse experiment time, start and estimated end time of time-lapse
experiment, number of rounds, elapsed time, and logarithmic graph of
temperature change are displayed.
(16) Saturation alert icon
Select to input subordinate information of time-lapse
experiment.
“Sample name”, “Cell name”, or “User name” can be input as
subordinate information.
Click any displayed name to display the Cell name etc... dialog
box. In the dialog box, inputting, changing, and deleting the
name are available.
If saturation occurs during the time-lapse experiment, this icon
appears.
(Determined as saturation when adjacent two pixels or more
reached the maximum intensity continuously.)
Click the icon to display a saturation information dialog.
This icon, once appeared, remains displayed after the saturation
has been reset.
(17) Print button
Select to print the image captured with time-lapse experiment.
The Print dialog box appears.
(18) Save button
Select to save images captured with the time-lapse experiment to an image
file. When a clipping area is set, the save confirmation dialog box for the
clipped image appears. Click the OK button in the dialog box.
Then, the Save image dialog box appears. To
cancel the save operation and return to the
Time-lapse images in process screen, click
the Cancel button.
When a clipping area is not set, this dialog
box does not appear, but the Save image
dialog box appears.
4.1.1
Figure 4.1-2 Confirmation
dialog box
Image Magnification and Enlarge/Reduce
Figure 4.1-3
Table 4.1-2
Image magnification
Functions of image magnification and enlarge/reduce
Item
Magnification
Enlarge/reduce
buttons
Enlarge/reduce
menu
Function
Magnification of the current image compared to the original image size (resolution) is
displayed.
Select to enlarge or reduce the magnification of displayed images by 5%.
Click the down arrow (▼) button at the right of the magnification to display
the image magnification list box. Click a magnification to enlarge or reduce
the image magnification.
48
Chapter 4
4.1.2
Time-lapse Images in Process Screen
Scrolling an Enlarged Image
Figure 4.1-4
Table 4.1-3
Scroll mode button
Function for scrolling an enlarged image
Item
Scroll mode
button
4.1.3
Function
Scroll the image freely by clicking this button and dragging the mouse pointer on the
enlarged image.
When the image is dragged without clicking the scroll mode button or clipping button, a
region of interest (ROI) area is drawn.
Setting a Clipping Range of the Displayed Image
Figure 4.1-5
Table 4.1-4
Clipping button
Function for setting a clipping range of the displayed image
Item
Clipping
button
Function
Select to set a clipping range of the displayed image.
Select (left click and drag) an area of the displayed image. A clipping range of the image
can be set.
If this operation is performed for one image, the same clipping area is set for other three
images. However, when a clipping area is set for an image, only the set clipping area
(clipping image) can be saved.
Click the clipping button again to turn off the clipping
function.
To delete the set clipping area, display the delete confirmation
dialog box by right clicking the clipping area and selecting
Delete from the submenu, or selecting the clipping area
and pressing the Delete key on the keyboard, then click the
OK button in the dialog box.
Figure 4.1-6 Delete confirmation
dialog box
Saving an image when a clipping area is set with the clipping
function
If a clipping area is set, click the Save button to display the save
confirmation dialog box for the clipping image and click the OK button to
save the clipping image. If a clipping area is not set, the displayed image
is saved.
49
Figure 4.1-7 Save confirmation
dialog box
Chapter 4
4.1.4
Time-lapse Images in Process Screen
Magnification Button
Figure 4.1-8
Table 4.1-5
Magnification button
Magnification function
Item
Function
Magnification
button
4.1.5
Magnification used for running time-lapse experiment is displayed.
Z-stack Display Control
Z-stack sequence icon
Figure 4.1-9
Table 4.1-6
Z-stack display
Functions on the Z-stack display
Item
Function
Z-stack
sequence icon
The means to capture observation image in the Z direction during the time-lapse
experiment is indicated.
Pull-down
menu
The Z coordinate of the image currently displayed is displayed. Select the Z coordinate
of the captured image displayed in the pull-down menu to switch the time-lapse
observation image display.
Slider
Switch the Z coordinate to the positive or negative side from the reference observation
point for the image display.
Z focus mark
button
Select to register the optimum image displayed by switching the slider bar as
the focus point.
Z focus graph
button
Select to display the Z focus graph dialog. This allows you to check the
points registered by using the Z focus mark button on a graph.
50
Chapter 4
Time-lapse Images in Process Screen
Graphical display of focus positions
Clicking the Z focus graph button (
) shows the Z focus graph dialog box.
Figure 4.1-10 Z focus graph dialog box
Table 4.1-7
Functions on graphical display of focus positions
Item
Function
Target
Click the ▼ button on the right side of the Target item to show the selection list of the
observation points.
Selecting an observation point shows a graph of the focus positions registered for the
observation point.
Close button
Select to closes the Z focus graph dialog box.
51
Chapter 4
4.1.6
Time-lapse Images in Process Screen
Time-lapse Observation Images Display (Ph/FI1/FI2/Multi)
Images of time-lapse experiment are displayed.
If a filter (Ph/Fl) is not selected for time-lapse experiment scheme, its image cannot be displayed.
Phase contrast
microscopy image
Fluorescent
microscopy image (2)
Fluorescent
microscopy image (1)
Multi microscopy image
Figure 4.1-11 Time-lapse observation images display
Table 4.1-8
Functions on time-lapse observation image display (1/2)
Item
Observation
image display
Function
Each observation images are displayed respectively on each display area.
Filter button
Select to change the filter name and color of each filter button.
Right click the filter button to open the sub-menu.
Select the sub-menu to display the Filter settings dialog box.
You can change the filter name and select an image color in this dialog
box.
Also, you can set up the pseudo color for fluorescence images and the
image color for overlaid image.
Scale bar button
Select to display a scale bar on the bottom left of observation image.
The scale length is 10 µm and has three ticks at 0 µm, 5 µm, and 10 µm.
Automatic tone
curve
adjustment
apply button
Select to automatically set the range.
The range of the intensity to be
displayed is automatically set. The
highest intensity (A) of the displayed
image is set as the upper limit (C)
and the lowest intensity (B) is set as
the lower limit (D).
Figure 4.1-12 Intensity graph
Tone curve
adjustment
setting button
Select to set tone curve adjustment manually.
The Tone curve adjustment dialog box appears to set tone curve
adjustment.
Tone curve
adjustment
cancel button
Select to cancel tone curve adjustment and return to the original screen.
52
Chapter 4
Table 4.1-8
Time-lapse Images in Process Screen
Functions on time-lapse observation image display (2/2)
Item
Function
Saturation
check button
Select to display saturation point in red.
To clear the saturation check condition, clicked this button again.
This function can be used only for the fluorescent microscopy.
Intensity
screening
button
Select to display the Intensity Screening dialog box for setting intensity
screening.
This function can be used only for the fluorescent microscopy.
Pseudo color
button
Select to assign a pseudo color for fluorescence images.
For overlaid images, this button is available only when a fluorescence image
is used.
When this button is clicked, the saturation check button and the intensity
screening button are disabled. On the other hand, when the saturation check
button or the intensity screening button is clicked, the pseudo color button is
disabled.
Enlarge/reduce
buttons
Enlarge
button
Reduce
button
Select to enlarge the image.
The enlarge button changes to the reduce button after the
image is enlarged. Click the reduce button to reduce the
image to the original size.
Overlapping
buttons
Select to display selected filters overlapped image or
display Ratio image.
Ratio setting
button
Select to set Ratio image.
The Ratio setting dialog box appears.
53
Chapter 4
Time-lapse Images in Process Screen
Changing filter name and display color
Right click the Fl1 or Fl2 filter button to open the sub-menu (
display the Filter settings dialog box.
). Select the sub-menu to
Custom color setting
button
Figure 4.1-14 Filter settings dialog box
Table 4.1-10 Functions for changing filter name, display color, and overlaid image color
Item
Function
Filter
The selected filter name is displayed.
Name
Enter a filter name (up to four alphanumeric characters).
EX/DM/BA
Set the wavelength for the three filters.
Selecting the file name from the drop-down list box of the Name box automatically
apply the default wavelength and color to these three filters. To change the
wavelength, adjust the value clicking the up or down arrow (▲ or ▼) buttons or
entering values.
Color
Select a color from these buttons to apply its color to filter button displayed image
color and graph line.
Click the desired color to display a check symbol.
Use the custom
color to overlap
the image
Custom color
setting button
Select to enable the custom color function with which you can set up the pseudo
color for fluorescence images and the image color for overlaid image.
Select to display the Color dialog box. You
can create an arbitrary color.
The color can be used for the pseudo
color of fluorescence images and for the
display color of overlaid images.
Figure 4.1-15 Color dialog box
Apply button
Select to close the dialog box applying the settings of file name and color.
Close button
Select to close the dialog box without applying settings.
54
Chapter 4
Time-lapse Images in Process Screen
Setting ratio
Click the Ratio setting button (
Setting dialog box.
) of the time-lapse experiment image (Multi Ch) to display the Ratio
In this area, set the lower limit of the intensity for ratio setting.
Figure 4.1-16 Ratio Setting dialog box
Table 4.1-11
Functions for setting ratio
Item
Function
Ratio Channel
Select “Ratio Channel” from the pull-down menu.
Ratio Range
Input “Ratio Range”.
Apply button
Select to register Ratio settings.
Close button
Select to close the dialog box without applying Ratio settings.
55
Chapter 4
4.1.7
Time-lapse Images in Process Screen
Intensity Graph
Figure 4.1-17 Intensity graph
Table 4.1-12 Functions of intensity graph
Item
Time Range
Function
Select the time range (horizontal axis) of one-page graph from the pull-down menu.
Fit: total observation time fits in one-page graph.
1×, 2×, 3×, and 4×:
calculated from minimum interval time, value of Time Range, and coefficient.
Time per scale = (4)/(value of Time Range) × (minimum interval time)
Time range of one-page graph = (time per scale) × 7
Example: when value of Time Range is 2× and minimum interval time is 10 minutes:
(4/2) × 10 = 20 minutes (time per scale)
20 × 7 = 140 minutes (time range of one-page graph)
If total observation time cannot fit in one page, scroll bar appears at the bottom of the
graph.
Intensity Range
Select the intensity range (vertical axis) of one-page graph from the pull-down menu.
Fit: full range of measured intensity fits in one-page graph.
1×, 2×, 3×, and 4×:
calculated from the following equations when one unit is the range of 0 to the
maximum intensity (measurement result)/4.
Intensity range of one-page graph= (4/value of Intensity Range) × one unit
Example: when value of Intensity Range is 2× and one unit is 600
(Intensity: 0 to 2400):
(4/2) × 600 = 1200 (intensity range for one-page graph)
When value of Intensity Range is 2× or more, a scroll bar appears at the right side of
the graph.
Grid button
Select to display or hide grid line on graph.
Calculate button
Select to calculate intensity value.
If this button is clicked after an area of an observation image is selected, the intensity
graph for the selected area is displayed.
See Section 4.1.8, “Intensity Graph Displaying Method”.
56
Chapter 4
4.1.8
Time-lapse Images in Process Screen
Intensity Graph Displaying Method
Intensity graph of an image can be displayed during a time-lapse experiment or by selecting an area (by
specifying an area using the ROI mark) in the display area of a time-lapse result file.
The procedure to show the intensity graph for the Channels display is different from that for the Points
display.
Channels display
1.
ROI mark
Select the area of image to display the
intensity graph.
Drag (left click and drag) a marquee around the
area for the intensity graph display.
When performed in one display area, the same
areas in other three displays are selected at the
same time.
Image area setting for an intensity graph
When only the phase contrast (Ph) filter is
selected for the microscopy, no image area can
be set for an intensity graph because the
intensity analysis is not necessary.
Figure 4.1-18
Selecting the area of image to display
an intensity graph
Note on setting the ROI mark
•
2.
In the scroll mode or the clipping mode, no ROI mark can be drawn on the image area. Therefore,
cancel the scroll mode or the clipping mode to draw an ROI mark.
Display the intensity graph.
Click the Calculate button. The intensity graph of
the selected area is displayed in the intensity
graph display area.
When the intensity graph is displayed, the
selected area frame changes from yellow to red.
Figure 4.1-19 Calculate button
Display area of an intensity graph
For information on the time (horizontal axis) and
the intensity (vertical axis) of the intensity graph,
see Section 4.1.7, “Intensity Graph”.
Figure 4.1-20 Displaying the intensity graph
57
Chapter 4
Time-lapse Images in Process Screen
Points view
1.
Select the area of image to display intensity
graph.
Drag (left click and drag) a marquee around the
area for intensity graph display.
Different points and range for intensity graph
display can be set to each observation point.
Image area setting for an intensity graph
When only the phase contrast (Ph) filter is
selected for the microscopy, no image area can
be set for an intensity graph because the
intensity analysis is not necessary.
Figure 4.1-21 Selecting the area of image to display an
intensity graph
Note on setting the ROI mark
•
2.
In the scroll mode or the clipping mode, no ROI mark can be drawn on the image area. Therefore,
cancel the scroll mode or the clipping mode to draw an ROI mark.
Select the observation point to display the
intensity graph.
Click an observation point of an image to display
its intensity graph.
A blue frame appears on the point number of the
selected observation image.
Figure 4.1-22 Selecting the area of image to display the
intensity graph
3.
Display the intensity graph.
Click the Calculate button.
The intensity graph of the selected area is
displayed in the intensity graph display area.
When the intensity graph of a selected area is
displayed, its frame color changes from yellow to
red The frame color of other selected areas
remains yellow.
Figure 4.1-23 Calculate button
Display area of an intensity graph
For information on the time (horizontal axis) and
the intensity (vertical axis) of the intensity graph,
see Section 4.1.7, “Intensity Graph”.
Figure 4.1-24 Displaying the intensity graph
58
Chapter 4
4.1.9
Time-lapse Images in Process Screen
Time Line Display and Image Playback Operation
Figure 4.1-25 Time line display and image playback control
Table 4.1-13 Functions on time line display and image playback control (1/2)
Item
Function
A to B repeating
mark
The repeating section set with the Repeat partially button is
indicated.
Number of
stream block
The number of the stream block of the playback slider’s current
position is displayed.
This field is displayed when playingback of the image captured by
stream.
Number of
rounds
The number of rounds of the playback slider's current position is
displayed.
Playback slider
This slider shows the current playback point and elapsed time, and
moves in synchronization with the playback image.
To play back the image from the point, move this slider to a point
with a mouse pointer or the right and left arrow buttons.
Step buttons
Select to play back the image forward or backward frame by frame.
Stream block
forward buttons
Select to forward or backward to the start position of the stream
block.
These buttons appear when the image captured by stream capturing
is played back.
Pause button
Slow playback
buttons
Playback button
Select to pause playback of the image.
Select to slowly playback the image forward or backward. (One to
three images per second. The speed changes each time the button
is clicked. The number of dots blinking of the button indicates the
speed.)
Select to play back the image. (Five images per second)
Fast-forward
button
Select to fast-forward the image. (Six settings with skip intervals of
2, 3, 5, 10, 20, and 30 are available. The reproduction speed
changes every time the button is clicked. The circle symbol of the
button changes in accordance with the reproduction speed.)
Marked image
playback button
Select to play back ten or more images set before and after the user
mark or the cell stimulus mark.
When the playback slider is on either mark, images set before and
after the mark are played back.
When the playback slider is not on either mark, images set before
and after the next mark are played back.
Repeat partially
button
Select to set or clear a repeating section and to repeat the selected
repeating section.
The A to B repeating mark appears on the selected repeating
section. Each time this button is clicked, the function changes as
follows: set A point -> set B point -> repeat from A to B -> clear
repeating section.
59
Chapter 4
Time-lapse Images in Process Screen
Table 4.1-13 Functions on time line display and image playback control (2/2)
Item
Function
User mark
setting button
Select to set the user mark.
The user mark is displayed at the current playback point or observation
point.
Cell stimulus
mark setting
button
Select to set the cell stimulus mark.
The cell stimulus mark is displayed at the current playback point or
observation point.
Right click this button to display the submenu
for assigning keys.
Assignable keys are “Space”, “Return”, “Shift”,
and “Tab”.
Select one from these four keys. And then, the
selected key can be used instead of the cell
stimulus mark setting button. If the None key is
selected, no key is assigned.
User mark
This mark is displayed at the point set with the
user mark setting button.
Right click the user mark to display the
submenu.
Figure 4.1-26 submenu
Figure 4.1-27 submenu
Select Delete from the submenu to delete comments.
Select Edit to display the Mark Comment Input dialog box with which
you can input, confirm, or change comments.
Click the Apply button in the
Mark Comment Input dialog
box to apply the edited
comments.
Left click the user mark to
move the playback slider to
the user mark position.
Figure 4.1-28 Mark Comment Input dialog box
Cell stimulus
mark
This mark is displayed at the point set with the
cell stimulus mark setting button.
Right click the cell stimulus mark to display the
submenu.
Figure 4.1-29 submenu
Select Delete from the submenu to delete comments.
Select Edit to display the Mark Comment Input dialog box with which
you can input, confirm, or change comments.
Click the Apply button in the
Mark Comment Input dialog
box to apply the edited
comments.
Left click the cell stimulus
mark to move the playback
slider to the cell stimulus
mark position.
Figure 4.1-30 Mark Comment Input dialog box
60
Chapter 4
4.1.10
Time-lapse Images in Process Screen
Time-lapse Experiment Scheme (Points Tab)
Figure 4.1-31 Points tab
Table 4.1-14 Functions on the Points tab
Item
Observation point
Function
Select to display the observation conditions (filter name, exposure time, and
magnification) for each observation point.
When time-lapse experiment is performed, only the point selected with a check
mark is observed.
Click an observation point to display the Point information dialog box. In the dialog
box, checking, changing, and deleting detailed condition are available.
Stop button
Select to stop the running time-lapse
experiment.
The stop confirmation dialog box appears.
To stop time-lapse experiment, click the OK
button.
Figure 4.1-32 Stop confirmation dialog box
Resume button
When time-lapse experiment is stopped, the Stop button is changed to the Resume
button. Click the Resume button to restart time-lapse experiment.
Checking observation condition
Only checking the observation condition is available in the Point information dialog box displayed this time.
Figure 4.1-33 Point information dialog box
Table 4.1-15 Function for checking the observation condition
Item
Close button
Function
Select to close the Point information dialog box.
61
Chapter 4
4.1.11
Time-lapse Images in Process Screen
Time-lapse Experiment Scheme (Time Tab)
When the stream setting is configured during the time-lapse experiment time setting, the display of Time tab
is replaced with Stream.
Figure 4.1-34 Time tab
Table 4.1-16 Functions on the Time tab
Item
Function
Time-lapse
experiment time
Capturing interval time, total observation time, and rounds for time-lapse experiment
are displayed.
Click a time-lapse experiment time to display the Timelapse dialog box. In the dialog
box, changing and deleting capturing interval time setting and total observation time
setting are available.
Delete button
Select to delete the selected time-lapse experiment
time.
The Delete confirmation dialog box appears. To
delete the selected time-lapse experiment time,
click the OK button.
To return to the Time tab without deleting, click the
Cancel button.
However, currently running and already done
time-lapse experiment times cannot be deleted as
the Delete button becomes disabled.
Figure 4.1-35 Delete confirmation
dialog box
Red dot
Indicates the time-lapse experiment is running.
New button
Select to set new time-lapse experiment time.
The Timelapse dialog box appears for new registration of time-lapse experiment
time.
Details on the Timelapse dialog box
Operation of the Timelapse dialog box is the same as that of the
New time-lapse setting screen.
Reference: Chapter 3 “New Time-lapse Setting Screen”
Section 3.1.4, “Time-lapse Experiment Scheme (Time Tab)”
Changing or deleting time-lapse experiment time
Registering new time-lapse experiment time
Figure 4.1-36 For setting change
Figure 4.1-37 For new registration
62
Chapter 4
4.1.12
Time-lapse Images in Process Screen
Time-lapse Experiment Process Display
Estimated end time of
time-lapse experiment
Start time of time-lapse
experiment
Figure 4.1-38 Time-lapse experiment process display
Table 4.1-17 Functions on the time-lapse experiment process display
Item
Function
Start time/
estimated end time
Start time and estimated end time of time-lapse experiment are displayed.
(month/date/time)
Time line
Process of time-lapse experiment is displayed with the bar graph.
Number of rounds
Number of rounds of running time-lapse experiment is displayed. (current number of
rounds/total number of rounds)
Passage of time
Passage of time-lapse experiment time is displayed (current passage of time/total
observation time).
Temperature log
button
Pause button
The logarithmic graph of temperature change since the software is started (the
Temperature dialog box) is displayed. This dialog box is the same as the one
that is displayed by clicking the Temp button shown in upper right of the window.
Select to pause the running time-lapse experiment.
If suspended, the Start time-lapse button on the New time-lapse setting screen changes
to
from
for restart.
Stop button
Select to stop the running time-lapse experiment.
63
Chapter 4
Time-lapse Images in Process Screen
Displaying the logarithmic graph of temperature change
Click the Temperature log button (
dialog box.
) in the time-lapse experiment process area to display the following
The time-lapse
experiment is running
under a stable condition.
An unstable condition is
detected during the
time-lapse experiment.
Figure 4.1-39 Temperature dialog box
Table 4.1-18 Functions on the Temperature dialog box
Item
Function
Range
Select time range (horizontal axis) of temperature graph.
Temperature graph
Temperature changes inside of the culture chamber and the humidifier water
tank, and that of ambient temperature are shown.
Close button
Select to close the Temperature dialog box.
64
Chapter 4
4.1.13
Time-lapse Images in Process Screen
Captured Image Printing
Click the Print button (
) to display the Print dialog box.
The Print dialog box changes depending on the observation image conditions (Channels display or Points
display).
Use this dialog box to print the images captured with time-lapse experiment.
Print dialog box for Channels display
Print dialog box for Points display
Figure 4.1-40 Print dialog boxes
Table 4.1-19 Functions of captured image printing
Item
Function
Select channel
Select the image to be printed. For Channels display, select a filter. For Points
display, select an observation point. The filters that are not specified for the
time-lapse experiment condition are disabled.
Print button
Select to print an image.
Cancel button
Select to stop printing and close the dialog box.
65
Chapter 4
4.1.14
Time-lapse Images in Process Screen
Captured Image Saving
Click the Save button (
) to display the Save image dialog box.
If a clipping area is set, the save confirmation dialog box for the clipped image appears. Click the OK button
in the dialog box. Then, the Save image dialog box appears.
Figure 4.1-41 Save image dialog box
Table 4.1-20 Functions of captured image saving
Item
Function
Save as...(BioStation IM format)
button
During time-lapse experiment, this button is disabled because the
file is already saved at the beginning of the experiment.
Export images and data
(Single point) button
Select to save the time-lapse images captured at a single
observation point as image file(s).
The Export images and data (Single point) dialog box appears.
Export images and data
(Multi points) button
Select to save the time-lapse images captured at multiple
observation points as image files.
The Export images and data (Multi points) dialog box appears.
Export large images
(Multi points) button
Select to save the time-lapse images (Wide field image) as image
file(s).
The Export large images (Multi points) dialog box appears.
Cancel button
Select to close the Save image dialog box.
66
Chapter 4
Time-lapse Images in Process Screen
Image data save settings for a single observation point (1/2)
Click the Export images and data (Single point) button of the Save image dialog box to display the Export
images and data (Single point) dialog box.
Figure 4.1-42 Export images and data (Single point) dialog box
Table 4.1-21 Functions of image data save settings for a single observation point (1/2)
Item
Function
Export images and
data of
Select the observation point and magnification to save the image from the pull-down
menu.
Save time range
All
Select to save all images of the selected observation
point under the selected magnification in a file.
One shot of current time
Select to save only the currently displayed image in a file.
Neighbors of current
time
Select to save the currently displayed image, the five
preceding images, and the five following images (total of
11 images) into a file.
Concatenate all marks
Select to save all concatenated images into a file.
The concatenated images consist of images of all marks
including user marks and cell stimulate marks added in
the Time Line, five preceding images of each mark, and
five following images of each mark.
If neither user mark nor cell stimulate mark is set, this
item is disabled.
Input time range
Round
Saves the image in the specified round range as a file.
According to the round count specified in these fields,
the time of the Time field is automatically set.
Time
Saves the image within the specified shooting time as a file.
According to the time specified in these fields, the count of
the Round field is automatically set.
67
Chapter 4
Time-lapse Images in Process Screen
Table 4.1-21 Functions of image data save settings for a single observation point (2/2)
Item
Save channel
Function
Ph
Select to save the Ph channel data into a file.
Fl1
Select to save the Fl1 channel data into a file.
To save the image with the pseudo color, check the use
pseudo color checkbox.
Fl2
Select to save the Fl2 channel data into a file.
To save the image with the pseudo color, check the use
pseudo color checkbox.
Multi ch
Select to save overlaid image composed of any of the
Ph, Fl1, or Fl2 channel.
Intensity data
Select to save the intensity data into a file.
This option is enabled only when the intensity is
calculated.
Time-lapse-log
Select to save the time-lapse experiment log into a file.
Mark comment
Select to save the comments of the user mark and cell
stimulus marks.
This option is enabled only when the user mark or the
cell stimulus mark is used.
Next button
Select to display the Save images (Single point) dialog box.
In the dialog box, specify the destination to save image and input its file name and
file format.
Back button
Select to return to the Save image dialog box.
Cancel button
Select to close the Export images and data (Single point) dialog box.
68
Chapter 4
Time-lapse Images in Process Screen
Image data save settings for a single observation point (2/2)
Click the Next button of the Export images and data (Single point) dialog box to display the Save images
(Single point) dialog box.
Figure 4.1-43 Save images (Single point) dialog box
Table 4.1-22 Functions of image data save settings for a single observation point (1/2)
Item
Folder
Function
Select a folder to save images.
button to display the Browse
Click the
For Folder dialog box and specify the
destination to save.
Figure 4.1-44
Save image
Format
Browse For Folder dialog box
Select a format from six formats to save images.
TIFF (Gray: 16 bits/Color: 24 bits), TIFF (Gray: 8 bits/Color:
24 bits), BMP (Gray: 8 bits/Color: 24 bits), PNG (Gray: 8 bits
/Color: 24 bits), JPEG (Gray: 8 bits/Color: 24 bits), or AVI
69
Chapter 4
Time-lapse Images in Process Screen
Table 4.1-22 Functions of image data save settings for a single observation point (2/2)
Item
Save image
Function
AVI settings
Enabled when “AVI” is selected in the Format field.
Interval Time:
Specifies the frame rate (number of
frames displayed per second) at which
pictures taken are saved into an AVI file
(maximum frames: 60).
Total Time:
Specifies the time during which pictures
taken are saved into an AVI file.
The number of frames and total time are
calculated, and if the frame rate is above
33 fps, an error is indicated.
Frequency every: Enabled when this checkbox is enabled.
(Allowable range: 2 to 99)
The thinning-out setting is valid for both
Interval Time/Total Time.
Filename
Input a file name to save images.
Channel names will be added to the end of file names
automatically. Ph: _ch1, Fl1: _ch2, Fl2: _ch2, Multi: _ch4
Save z-stack
images
Enables only the Z-stack images. Select to enable the
Z-stack save settings.
According focus setting:
Saves images at the Z position
registered by the Z focus mark button.
According range setting:
Saves images including Z-stack data.
By changing the values of the From/To
fields, the Z-stack range to save the
image can be specified.
Advanced
settings… button
Save Intensity data
Displays the Save images (Advanced settings) dialog.
This allows you to configure, for example, information to be
written into images to be saved.
Format
Select a format from the pull-down menu to save the
intensity graph.
Filename
Input a file name to save the intensity graph.
The suffix, “_intensity”, is added to the end of the file name
automatically.
Time-lapse log
Input a file name to save a log file (text file) of time-lapse experiment.
The suffix, “_timelapse”, is added to the end of the file name automatically.
Mark comment
Input a file name to save comments of the user marks and cell stimulus marks.
The suffix, “_mark”, is added to the end of the file name automatically.
Save button
Select to save the image into a file
according to setting.
After saving is succeeded, the dialog box
appears.
Click the OK button to close the dialog box.
Figure 4.1-45 Save succeeded dialog box
Back button
Select to return to the Export images and data (Single point) dialog box.
Cancel button
Select to close the Save images (Single point) dialog box.
70
Chapter 4
Time-lapse Images in Process Screen
How to write information into images:
Use the Save images (Advanced settings) dialog box that can be displayed with the advanced settings…
button.
If “TIFF (Gray: 16 bits/Color: 24 bits)” is selected in the Format field, writing information is disabled. To
enter the information on the images to be saved, select “Gray: 8 bits/Color: 24 bits” in the Format field.
Figure 4.1-46 Save images (Advanced settings) dialog box
Table 4.1-23 Settings for writing information into images (1/2)
Item
Image
processing
Overlay text
Function
Apply tone curve
processing
Select to save the image that underwent tone curve
adjustment.
Not available when saving a Wide field image.
Write current ROI
into images
Select to write the ROI mark into images for the intensity
graph.
Not available when saving a Wide field image.
Add ratio color bar
Select to add a color bar to an image for which the ratio is set.
The color bar appears on the right side of the image.
Not available when saving a Wide field image.
Check this checkbox to enable the following checkboxes to specify the write position
for each item to be written into the image. For the image in which the information is
written, see Section 4.1.15, “Example of a Saved Image”.
Observation settings
Select to write the observation conditions such as the
exposure time, gain, and resolution and select their position of
display.
Scale & User Mark
Select to write the scale and user mark, and select their
position of display.
Not available when saving a Wide field image.
Cell name etc…
Select to write the cell name and etc, and select their position
of display.
Round information
Select to write the number of round, capturing date, and
passage of capturing time, and select their position of display.
71
Chapter 4
Time-lapse Images in Process Screen
Table 4.1-23 Settings for writing information into images (2/2)
Item
Use font setting
Function
Select to enable the following checkboxes to specify the font, size, and color of the
characters for the image to be written.
Name
Specifies font of the character written into the image.
Size
Specifies size of the character written into the image.
Color
Specifies color of the character written into the image.
Set Default
Restores the character settings written into the image to the
default settings.
OK button
Select to save the settings and to return to the Save images (Single point) dialog.
Cancel button
Select to close the Save images (Advanced settings) dialog box.
72
Chapter 4
Time-lapse Images in Process Screen
Image data save settings for multiple observation points (1/2)
Click the Export images and data (Multi points) button of the Save image dialog box to display the Export
images and data (Multi points) dialog box.
Figure 4.1-47 Export images and data (Multi points) dialog box
Table 4.1-24 Functions of image data save settings for multiple observation points (1/2)
Item
Select export data
Save time range
Function
Select ALL Points
Select to highlight all observation points.
Point 1 to Point n
All registered observation points appear here. To select
desired observation points, uncheck the Select ALL
Points checkbox and check desired observation points.
All
Select to save all images of the selected observation
point under the selected magnification in a file.
One shot of current time
Select to save only the currently displayed image in a
file.
Neighbors of current time
Select to save the currently displayed image, the five
preceding images, and the five following images (total
of 11 images) into a file.
Concatenate all marks
Select to save all concatenated images into a file.
The concatenated images consist of images of all
marks including user marks and cell stimulate marks
added in the Time Line, five preceding images of each
mark, and five following images of each mark.
If neither user mark nor cell stimulate mark is set, this
item is disabled.
73
Chapter 4
Time-lapse Images in Process Screen
Table 4.1-24 Functions of image data save settings for multiple observation points (2/2)
Item
Save time range
Save channel
Function
Input time range
Round
Saves the image in the specified round range as a file.
According to the round count specified in these fields,
the time of the Time field is automatically set.
Time
Saves the image within the specified shooting time as a file.
According to the time specified in these fields, the count of
the Round field is automatically set.
Ph
Select to save the Ph channel data into a file.
Fl1
Select to save the Fl1 channel data into a file.
To save the image with the pseudo color, check the use pseudo
color checkbox.
Fl2
Select to save the Fl2 channel data into a file.
To save the image with the pseudo color, check the use pseudo
color checkbox.
Multi ch
Select to save overlaid image into a file with the displayed
condition.
Next button
Select to display the Save images (Multi points) dialog box.
In the dialog box, specify the destination to save image and input its file name and
file format.
Back button
Select to return to the Save image dialog box.
Cancel button
Select to close the Export images and data (Multi point) dialog box.
74
Chapter 4
Time-lapse Images in Process Screen
Image data save settings for multiple observation points (2/2)
Click the Next button of the Export images and data (Multi points) dialog box to display the Save images
(Multi points) dialog box.
Figure 4.1-48 Save images (Multi points) dialog box
Table 4.1-25 Functions of image data save settings for multiple observation points (1/2)
Item
Folder
Function
Select a folder to save images.
Click the
button to display the
Browse For Folder dialog box and specify
the destination to save.
Figure 4.1-49 Browse For Folder dialog box
Save image
Format
Select a format from six formats to save images.
TIFF (Gray: 16 bits/Color: 24 bits)
TIFF (Gray: 8 bits/Color: 24 bits)
BMP (Gray: 8 bits/Color: 24 bits)
PNG (Gray: 8 bits/Color: 24 bits)
JPEG (Gray: 8 bits/Color: 24 bits)
AVI
75
Chapter 4
Time-lapse Images in Process Screen
Table 4.1-25 Functions of image data save settings for multiple observation points (2/2)
Item
Save image
Function
AVI setting
Enabled when “AVI” is selected in the Format field.
Interval Time:
Specifies the frame rate (number of
frames displayed per second) at which
pictures taken are saved into an AVI file
(maximum frames: 60).
Total Time:
Specifies the time during which pictures
taken are saved into an AVI file.
The number of frames and total time
are calculated, and if the frame rate is
above 33 fps, an error is indicated.
Frequency every: Enabled when this checkbox is
enabled.
(Allowable range: 2 to 99)
The thinning-out setting is valid for both
Interval Time/Total Time.
Save button
Filename
Input a file name to save images.
Channel names are added to the end of file names
automatically. Ph: _ch1, Fl1: _ch2, Fl2: _ch2, Multi: _ch4
Advanced settings…
button
The Save images (Advanced settings) dialog box appears.
This allows you to configure, for example, information to be
written into images to be saved.
For detail, see “How to write information into images” on
page 71.
Select to save the image into a file
according to setting.
After saving is succeeded, the dialog box
appears.
Click the OK button to close the dialog box.
Figure 4.1-50 Save succeeded dialog box
Back button
Select to return to the Export images and data (Multi points) dialog box.
Cancel button
Select to close the Save images (Multi point) dialog box.
76
Chapter 4
Time-lapse Images in Process Screen
Image data save settings for Wide field image (1/2)
Click the Export large images (Multi points) button of the Save image dialog box to display the Export large
images (Multi points) dialog box.
Figure 4.1-49 Export large images (Multi points) dialog box
Table 4.1-26 Functions of image data save settings for Wide field image (1/2)
Item
Select export data
Function
Target
Select the first observation point of a Wide field image to save.
Order
Select the registration order of observation points in a Wide field
image to save.
Usually use Type1 when the Register Wide field image points in a
batch checkbox is enabled.
Use Type2 to Type4 when the points are registered manually one by
one.
Type1: Left top -> right top -> left bottom -> right bottom
Type2: Left top -> right top -> left bottom -> right bottom, turn back
on even lines
Type3: Left bottom -> right bottom -> left top -> right top
Type4: Left bottom -> right bottom -> left top -> right top, turn back
on even lines
77
Chapter 4
Time-lapse Images in Process Screen
Table 4.1-26 Functions of image data save settings for Wide field image (2/2)
Item
Select export data
Function
X/Y combo
box
Select (matrix-like) selection area of a Wide field image.
It allows you to select any number of images when you want to save
a combined image of observation points that are not adjacent.
Usually, when using the Register Wide field image points in a batch
checkbox to register an area, the number of images is automatically
selected for registration at the time the Target is selected.
Preview
Save time range
Displays the array of observation points.
All
One shot of
current time
Select to save all images of the selected observation point
under the selected magnification in a file.
Select to save only the currently displayed image in a file.
Neighbors of
current time
Select to save the currently displayed image, the five
preceding images, and the five following images (total of 11
images) into a file.
Concatenate
all marks
Select to save all concatenated images into a file.
The concatenated images consist of images of all marks
including user marks and cell stimulate marks added in the
Time Line, five preceding images of each mark, and five
following images of each mark.
If neither user mark nor cell stimulate mark is set, this item is
disabled.
Input time range
Save channel
Round
Saves the image in the specified round range as a
file.
According to the round count specified in these
fields, the time of the Time field is automatically
set.
Time
Saves the image within the specified shooting time as
a file.
According to the time specified in these fields, the
count of the Round field is automatically set.
Ph
Select to save the Ph channel data into a file.
Fl1
Select to save the Fl1 channel data into a file.
To save the image with the pseudo color, check the use
pseudo color checkbox.
Fl2
Select to save the Fl2 channel data into a file.
To save the image with the pseudo color, check the use
pseudo color checkbox.
Multi ch
Select to save overlaid image into a file with the displayed
condition.
Next button
Select to display the Save large images (Multi points) dialog box.
In the dialog box, specify the destination to save image and input its file name and
file format.
Back button
Select to return to the Save image dialog box.
Cancel button
Select to close the Export large images (Multi points) dialog box.
78
Chapter 4
Time-lapse Images in Process Screen
Image data save settings for Wide field image (2/2)
Click the Next button of the Export large images (Multi points) dialog box to display the Save large images
(Multi points) dialog box.
Figure 4.1-50 Save large images (Multi points) dialog box
Table 4.1-27 Functions of image data save settings for Wide field image (1/2)
Item
Folder
Function
Select a folder to save images.
button to display the
Click the
Browse For Folder dialog box and specify
the destination to save.
Figure 4.1-51 Browse For Folder dialog box
Save image
Format
Select a format from six formats to save images.
TIFF (Gray:16bit Color:24bit)
TIFF (Gray:8bit Color:24bit)
BMP (Gray:8bit Color:24bit)
PNG (Gray:8bit Color:24bit)
JPEG (Gray:8bit Color:24bit)
AVI
79
Chapter 4
Time-lapse Images in Process Screen
Table 4.1-27 Functions of image data save settings for Wide field image (2/2)
Item
Save image
Function
AVI settings
Enabled when “AVI” is selected in the Format field.
Interval Time:
Specifies the frame rate (number of frames
displayed per second) at which pictures taken
are saved into an AVI file (maximum frames:
60).
Total Time:
Specifies the time during which pictures taken
are saved into an AVI file.
The number of frames and total time are
calculated, and if the frame rate is above 33
fps, an error is indicated.
Frequency every: Enabled when this checkbox is enabled.
(Allowable range: 2 to 99)
The thinning-out setting is valid for both
Interval Time/Total Time.
Save button
Filename
Input a file name to save images.
Channel names are added to the end of file names automatically.
Ph: _ch1, Fl1: _ch2, Fl2: _ch2, Multi: _ch4
Advanced
settings…button
The Save images (Advanced settings) dialog box appears.
This allows you to configure, for example, information to be written
into images to be saved.
For detail, see “How to write information into images”, on page 71.
Select to save the image into a file according
to setting.
After saving is succeeded, the dialog box
appears.
Click the OK button to close the dialog box.
Figure 4.1-52 Save succeeded dialog box
Back button
Select to return to the Export large images (Multi points) dialog box.
Cancel button
Select to close the Save large images (Multi points) dialog box.
80
Chapter 4
4.1.15
Time-lapse Images in Process Screen
Example of a Saved Image
Observation conditions
Input information on the Cell name etc... tab
ROI mark
Figure 4.1-53
Example of a saved image (When the 4-quadrant dish is selected)
Scale
Displaying the number of rounds, photo date,
and passage of photo time
81
Chapter 4
4.2
Time-lapse Images in Process Screen
Points Display
This screen shows process of time-lapse experiment.
One display area is provided for one observation point. Switch the display area to display each filter image
and overlapped image. Therefore, up to four observation points can be observed at the same time.
Functions other than the way to display images are the same as those for the Time-lapse images in process
Screen (Channels).
(1)
(2)
(2)
(3)
(5)
(2)
(2)
(4)
Figure 4.2-1
Table 4.2-1
Time-lapse images in process screen (Points display)
Functions on the Time-lapse images in process screen (Points display)
Item
(1)
Overlapping
buttons
Function
Select to highlight filters for references. The selected filter is checked and the
image is displayed.
Multiple filters can be selected. When multiple filters are selected, the selected
filters overlapped image is displayed.
(2)
Observation
image display
Images at different points can be displayed on the four observation image displays.
Additionally, the ROI for intensity analysis can be set for each observation point.
Click in the observation image display to select an observation point. The point
number at the upper left of the observation image display is marked with a blue box.
(3)
Selecting
observation
points
Only the image at the checked observation point is displayed on the observation
image display.
(4)
Calculate
button
Select to calculate intensity value. If this button is clicked after an area of an
observation image is selected, the intensity graph for the selected area is
displayed.
(5)
ROI mark
The ROI mark is normally marked with a yellow frame, and the ROI mark when an
intensity graph is displayed is marked with a red frame.
Up to four observation points can be displayed at a time.
82
5
Time-lapse Images Acquired Screen
5
This screen automatically appears at the end of time-lapse experiment.
On this screen, loading and reproducing the saved time-lapse result files are available.
There are the Channels display and the Points display for the Time-lapse images Acquired screen.
A part of functions is different from those of the Time-lapse images in process screen.
This section indicates only the different part.
File compatibility of the saved file of time-lapse result files
Files created by the software of Ver. 1.* to Ver. 2.0 can be read into the software of Ver. 2.1 or later,
whereas those created by the software of Ver. 2.1 or later cannot be read into the software of Ver. 1.*.
Additionally, if a file created by the software of Ver. 1.* to Ver. 2.0 is read into the software of Ver. 2.1
or later, it is automatically upgraded to the file format of the version currently used. Once upgraded, it
cannot be read into the software of the version by which it was originally created.
5.1
Channels Display
(1)
(2)
(3)
(4)
(5)
(6)
Figure 5.1-1
Table 5.1-1
Time-lapse images Acquired screen (Channels display)
Functions on the Time-lapse images Acquired screen (Channels display) (1/2)
Item
Function
(1)
File load button
Select to load the saved time-lapse result file.
(2)
Observation point
and file information
Position of observation point, its X and Y coordinates, loaded file name of
time-lapse result file, sample name, and cell name are displayed.
83
Chapter 5
Table 5.1-1
Time-lapse Images Acquired Screen
Functions on the Time-lapse images Acquired screen (Channels display) (2/2)
Item
(3)
Time-lapse
experiment result
(4)
Temperature log
button
Function
Total time/start time/end time of time-lapse experiment, number of rounds,
logarithmic graph of temperature changes, and maximum and minimum
values of temperature change are displayed.
Select to display the logarithmic graph of temperature change (the
Temperature dialog box) during time-lapse experiment. For functions
of the Temperature dialog box, see “Displaying the logarithmic graph
of temperature change” on page 64.
Clicking the Temperature log button on the Time-lapse images in
process screen displays the current temperature status during
time-lapse experiment; however, clicking the Temperature log button
on the Time-lapse images Acquired screen displays the temperature
status during time-lapse experiment result.
(5)
Save button
Select to save a time-lapse result file as an alias file, or to save an image
captured with the time-lapse experiment into an image file.
The Save button on the Time-lapse images Acquired screen has a shortcut
key setting (Ctrl+S key on the keyboard).
If a clipping area is set, the save confirmation
dialog box for the clipped image appears.
Click the OK button in the dialog box. Then,
the Save image dialog box appears. To
cancel the save operation and return to the
Time-lapse images Acquired screen, click the
Cancel button.
Figure 5.1-2
Save confirmation
dialog box
If a clipping area is not set, this dialog box does not appear, but the Save
image dialog box appears.
(6)
Fluctuation
correction button
Select to measure the fluctuation amount of the stage from a captured image
and correct the image by shifting it in the X and Y directions. In principle, the
image size is reduced by the shift amount. The area shifted is marked with a
black frame.
Corrected image data is saved in a new file.
84
Chapter 5
5.1.1
Time-lapse Images Acquired Screen
Saving Time-lapse Result File as a New File and Saving a Captured Image
Click the Save button (
) or press the Ctrl+S key on the keyboard shows the Save image dialog box.
When a clipping area is set and the OK button is clicked on the save confirmation dialog box for a clipping
image, the Save image dialog box appears.
Figure 5.1-3
Table 5.1-2
Save image dialog box
Functions for saving time-lapse result file as a new file and saving a captured image
Item
Function
Save as...
(BioStation IM format) button
Select to save the time-lapse result file as a new file.
The Save into Bio Station IM format (ics/ids) dialog box appears.
Export images and data
(Single point) button
Select to save the time-lapse images captured at a single observation
point as image file(s).
The Export images and data (Single point) dialog box appears.
Export images and data
(Multi points) button
Select to save the time-lapse images captured at multiple observation
points as image files.
The Export images and data (Multi points) dialog box appears.
Export large images
(Multi points) button
Select to save the time-lapse images (Wide field image) as image
file(s).
The Export large images (Multi points) dialog box appears.
Cancel button
Select to close the dialog box.
Export images and data (Single point) dialog box and Export
images and data (Multi points) dialog box
Operations of the two Export images and data dialog boxes are
the same as the Time-lapse images in process screen.
Refer to the following sections:
Chapter 4, “Time-lapse Images in Process Screen”
Section 4.1.14, “Captured Image Saving”
Image data save settings for a single observation point
(1/2) and (2/2)
Image data save settings for multiple observation points
(1/2) and (2/2)
Figure 5.1-4
85
Export images and data
(Single point) dialog box
Chapter 5
Time-lapse Images Acquired Screen
Saving into the Bio Station IM format
Click the Save into Bio Station IM format (ics/ids) button of the Save image dialog box to display the Save
into Bio Station IM format (ics/ids) dialog box.
Figure 5.1-5
Table 5.1-3
Save into Bio Station IM format (ics/ids) dialog box
Functions on the Save into Bio Station IM format dialog box (1/2)
Item
Folder
Function
Select a folder to save an image.
Click the
button to display the Browse For
Folder dialog box and specify the destination to
save.
Figure 5.1-6
Filename
Input a file name for the time-lapse result file.
86
Browse For Folder dialog box
Chapter 5
Table 5.1-3
Time-lapse Images Acquired Screen
Functions on the Save into Bio Station IM format dialog box (2/2)
Item
Save time range
Function
All
Select to save all images of the selected
observation point under the selected magnification
into a file.
One shot of current time
Select to save only the currently displayed image
in a file.
Neighbors of current time
Select to save the currently displayed image, the
five preceding images, and the five following
images (total of 11 images) into a file.
Concatenate all marks
Select to save all concatenated images into a file.
The concatenated images consist of images of all
marks including user marks and cell stimulate
marks added in the Time Line, five preceding
images of each mark, and five following images of
each mark.
If neither user mark nor cell stimulate mark is set,
this item is disabled.
Input time range
Round
Saves the image in the specified round range as a
file.
According to the round count specified in these
fields, the time of the Time field is automatically set.
Time
Saves the image within the specified shooting time
as a file.
According to the time specified in these fields, the
count of the Round field is automatically set.
Save points
Select an observation point to save.
Save tone curve
processing parameter
Select to save the tone curve adjustment parameter.
Only tone curve adjustment parameter is saved. The image to which the tone
curve adjustment applied is not saved.
Save ROI information
Select to save positions of the ROI set for each observation point.
Save button
Select to save images into a file according to
settings.
When the file is saved successfully, a dialog
box appears.
Click the OK button to close the dialog box.
Figure 5.1-7
Save succeeded
dialog box
Back button
Select to return to the Save image dialog box.
Cancel button
Select to cancel saving and close the Save into Bio Station IM format (ics/ids)
dialog box.
87
Chapter 5
5.2
Time-lapse Images Acquired Screen
Points Display
On this screen, one observation point occupies one display area. A filtered image or an overlapped filtered
image of the observation point can be displayed on the area when specified. Up to four observation points
can be observed at the same time.
Functions other than the way to display images are the same as those for the Time-lapse images in process
Screen (Channels).
(1)
(2)
(2)
(3)
(5)
(2)
(2)
(4)
Figure 5.2-1
Table 5.2-1
Time-lapse images Acquired screen (Points display)
Functions on the Time-lapse images Acquired screen (Points display)
Item
(1)
Screen switch
button
Function
Select to highlight filters for references. The selected filter is checked and the
image is displayed.
Multiple filters can be selected. When multiple filters are selected, the selected
filters overlapped image is displayed.
(2)
Observation
image display
Images at different points can be displayed on the four observation image displays.
Additionally, the ROI for intensity analysis can be set for each observation point.
Click in the observation image display to select an observation point. The point
number at the upper left of the observation image display is marked with a blue box.
(3)
Selecting
observation
points
Only the image at the checked observation point is displayed on the observation
image display.
(4)
Calculate
button
Click this button to calculate intensity value. If this button is clicked after an area of
an observation image is selected, the intensity graph for the selected area is
displayed.
(5)
ROI mark
The ROI mark is normally marked with a yellow frame, and the ROI mark when a
intensity graph is displayed is marked with a red frame.
Up to four observation points can be displayed at a time.
88
' ! ""# #" !
'1 " " "!"!"!## -!- *2(.
K+
@
%@
(. *
#K2@
,*
K@$$#@
I
K 2@!I
'# "!."$#&'!# .!
"//
E
DDD
% 0 / D
"E-DDD
D'-2
D0D1
DF
(
2DD
! / ! /!!# !
G
/
?
%H
?G
'
D
(?
H
0
H
' ! "!!"' #" # +!
0...
=.;.
...A1
A..0;.
.. .
1..0
'$ !((!"% " #"# !
.
2
#00.
2
2'-0
'0
0.
. 0-. 0 0. 0
0
" / !/#!! #"(!/!!# #!
G
/D
H2G
?
G
'B
11D
( CJ 0 ?0BG
" " ("!# )
0
%0
$ F '3
( 2 0 3
' ! " # !
....
A.-..
...0.
.&A...0
-...
'0 ! "#-"#!-
@.A@
I-@0@.@
@.@0I@0@
@(.A.A0
I..AI@-.
0I0
! -'! # !!
@@..@.@@@.
*0..00.@@-@
@@ .@@@ . . .@@ >@
@0@-@.
%@--@-@@.-@0
# !
" #$%
&
&
" # #'
#$ #
!""#
$ % & $ '()
" "
!
" # $ # # %
# !!$#"
!&!!
*
'*
/
,+(
2
"
))*
3$
')
*(*
* $
3 '
*23'
/
,+( 2!'))'
**
() $)* $
$
' ( '
')'
*2**$
3*
*'
( '%'
%%"
)1)
)4
4
!)
++
+1(
(0'+
)
)+44.5
5*
!'
)+
&+$+6')+50()
)7+
-)++
Jp 䝬䞀䝱䝇䝕䛱䛐䛗䜑ᗣᲘ∸ืᅂ䛴䜻䝷䝠䝯䝢䞀䜳
This symbol is provided for use in the People’s Republic of China,
for environmental protection in the fields of electronic information
products.
䛙䛴䝢䞀䜳䛵䚮 ୯ᅗ䛴䛐ᐂᵕ䛱ྡྷ䛗䛥䜈䛴䛭䚮 㞹Ꮔሒ⿿ဗฦ㔕䛱
䛐䛗䜑⎌ሾಕ㆜䜘┘Ⓩ䛮䛝䛬䛊䜄䛟䚯
䛙䛴䜻䝷䝠䝯䝢䞀䜳䛵ᮇ⿿ဗ䛒ื䛱ᅂ䛛䜒䛰䛗䜒䛶䛰䜏䛰䛊䛙䛮䜘
♟䛝䛬䛊䜄䛟䚯
ḗ㡧䛵ᮇ⿿ဗ䜘䝬䞀䝱䝇䝕 䟺㻨㻸䟻 䛭⏕䛟䜑ሔྙ䛱䛴䜅㐲⏕䛛䜒䜄䛟䚯
㻃 ᮇ⿿ဗ䛵ᣞᏽ䛛䜒䛥㞗ሔᡜ䛭ื䛱ᅂ䛛䜒䜑䜎䛌䛱ᏽ䜇䜏䜒䛬
䛊䜄䛟䚯 ᐓᗖ䜸䝣䛮䛝䛬ᗣᲘ䛝䛰䛊䛭䛕䛦䛛䛊䚯
㻃 リ⣵䛱䛪䛊䛬䛵㈅⌦ᗉ䜄䛥䛵ᆀᇡ䛴ᗣᲘ∸ฌ⌦ᶭ㛭䛱䛚㏻⤙
䛕䛦䛛䛊䚯
ᚲ 䋯 ADDRESS
↥ᬺᯏེ㩷 䋯㩷 Industrial Instruments㩷
䊋䉟䉥䉰䉟䉣䊮䉴 䋯 Bio Science
ᩣᑼળ␠䊆䉮䊮
䇾100-8331
᧲੩ㇺජઍ↰ᭉ↸ 1-12-1 ᣂᭉ↸䊎䊦
䉟䊮䉴䊃䊦䊜䊮䉿䉦䊮䊌䊆䊷 ༡ᬺ⛔ㇱ ༡ᬺㇱ ↥ᬺᯏེ༡ᬺ⺖
㔚䋺䋨03䋩3216-2384
䉟䊮䉴䊃䊦䊜䊮䉿䉦䊮䊌䊆䊷 ༡ᬺ⛔ㇱ ༡ᬺᚢ⇛ㇱ ↥ᬺᯏེ⺖
㔚䋺䋨03䋩3216-2371
ᩣᑼળ␠䊆䉮䊮
䇾100-8331
᧲੩ㇺජઍ↰ᭉ↸ 1-12-1 ᣂᭉ↸䊎䊦
䉟䊮䉴䊃䊦䊜䊮䉿䉦䊮䊌䊆䊷 ༡ᬺ⛔ㇱ ༡ᬺㇱ 䊋䉟䉥䉰䉟䉣䊮䉴༡ᬺ⺖
㔚䋺䋨03䋩3216-2375
䉟䊮䉴䊃䊦䊜䊮䉿䉦䊮䊌䊆䊷 ༡ᬺ⛔ㇱ ༡ᬺᚢ⇛ㇱ 䊋䉟䉥䉰䉟䉣䊮䉴⺖
㔚䋺䋨03䋩3216-2360
ᩣᑼળ␠䊆䉮䊮䉟䊮䉴䊁䉾䉪
ᧄ㩷 㩷 㩷 㩷 㩷 ␠
䇾100-0006
᧲੩ㇺජઍ↰ᭉ↸ 1-12-1䋨ᣂᭉ↸䊎䊦 4F䋩
㔚䋺䋨03䋩3216-9163 䋨䊋䉟䉥䉰䉟䉣䊮䉴䋩
㔚䋺䋨03䋩3216-9171 䋨↥ᬺᯏེ䋩
ᩣᑼળ␠䊆䉮䊮䉟䊮䉴䊁䉾䉪
ᧄ㩷 㩷 㩷 㩷 㩷 ␠
䇾100-0006
᧲੩ㇺජઍ↰ᭉ↸ 1-12-1䋨ᣂᭉ↸䊎䊦 4F䋩
㔚䋺䋨03䋩3216-9163 䋨䊋䉟䉥䉰䉟䉣䊮䉴䋩
ᧅᏻ༡ᬺᚲ
䇾060-0051
ᧅᏻᏒਛᄩධ 1 ᧦᧲ 2-8-2䋨SR 䊎䊦 8F䋩
㔚䋺䋨011䋩281-2535 䋨䊋䉟䉥䉰䉟䉣䊮䉴䊶↥ᬺᯏེ䋩
ᧅᏻ༡ᬺᚲ
䇾060-0051
ᧅᏻᏒਛᄩධ 1 ᧦᧲ 2-8-2䋨SR 䊎䊦 8F䋩
㔚䋺䋨011䋩281-2535 䋨䊋䉟䉥䉰䉟䉣䊮䉴䊶↥ᬺᯏེ䋩
ฬฎደ༡ᬺᚲ
䇾465-0093
ฬฎደᏒฬ᧲৻␠ 3-86䋨䉪䉣䉴䊃䊎䊦 2F䋩
㔚䋺䋨052䋩709-6851 䋨䊋䉟䉥䉰䉟䉣䊮䉴䊶↥ᬺᯏེ䋩
ฬฎደ༡ᬺᚲ
䇾465-0093
ฬฎደᏒฬ᧲৻␠ 3-86䋨䉪䉣䉴䊃䊎䊦 2F䋩
㔚䋺䋨052䋩709-6851 䋨䊋䉟䉥䉰䉟䉣䊮䉴䊶↥ᬺᯏེ䋩
㑐㩷 㩷 ᡰ㩷 ᐫ
䇾532-0003
ᄢ㒋ᏒᶰᎹችේ 3-3-31䋨䊆䉾䉶䉟䊎䊦䋩
㔚䋺䋨06䋩6394-8801 䋨䊋䉟䉥䉰䉟䉣䊮䉴䋩
㔚䋺䋨06䋩6394-8802 䋨↥ᬺᯏེ䋩
㑐㩷 㩷 ᡰ㩷 ᐫ
䇾532-0003
ᄢ㒋ᏒᶰᎹችේ 3-3-31䋨䊆䉾䉶䉟䊎䊦䋩
㔚䋺䋨06䋩6394-8801 䋨䊋䉟䉥䉰䉟䉣䊮䉴䋩
㩷 Ꮊ㩷 ᡰ㩷 ᐫ
䇾913-0034
ጟᏒ᧲ᄙ䈱ᵤ 1-4-1
㔚䋺䋨092䋩611-1111 䋨䊋䉟䉥䉰䉟䉣䊮䉴䊶↥ᬺᯏེ䋩
㩷 Ꮊ㩷 ᡰ㩷 ᐫ
䇾913-0034
ጟᏒ᧲ᄙ䈱ᵤ 1-4-1
㔚䋺䋨092䋩611-1111 䋨䊋䉟䉥䉰䉟䉣䊮䉴䊶↥ᬺᯏེ䋩
NIIKON INSTRUMENTS INC.
1300 Walt Whitman Road, Melvile, N.Y. 11747-3064, U.S.A.
tel. +1-631-547-8500
NIIKON INSTRUMENTS INC.
1300 Walt Whitman Road, Melvile, N.Y. 11747-3064, U.S.A.
tel. +1-631-547-8500
NIKON INSTRUMENTS EUROPE B.V.
Laan van Kronenburg 2, 1183 AS Amstelveen, The Netherlands
tel. +31-20-44-96-300
NIKON INSTRUMENTS EUROPE B.V.
Laan van Kronenburg 2, 1183 AS Amstelveen, The Netherlands
tel. +31-20-44-96-300
NIKON INSTRUMENTS(SHANGHAI)CO.,LTD.
tel. +86-21-6841-2050
NIKON INSTRUMENTS(SHANGHAI)CO.,LTD.
tel. +86-21-6841-2050
NIKON SINGAPORE PTE LTD
tel. +65-6559-3618
NIKON SINGAPORE PTE LTD
tel. +65-6559-3618
NIKON MALAYSIA SDN BHD
tel. +60-3-7809-3688
NIKON MALAYSIA SDN BHD
tel. +60-3-7809-3688
NIKON INSTRUMENTS KOREA CO.,LTD.
tel. +82-2-2186-8410
NIKON INSTRUMENTS KOREA CO.,LTD.
tel. +82-2-2186-8410
NIKON INDIA PRIVATE LIMITED
tel. +91-124-4688500
NIKON INDIA PRIVATE LIMITED
tel. +91-124-4688500
NIKON CANADA INC.
tel. +1-905 602 9676
NIKON CANADA INC.
tel. +1-905 602 9676
NIKON FRANCE S.A.S.
tel. +33-1-4516-45-16
NIKON FRANCE S.A.S.
tel. +33-1-4516-45-16
NIKON GMBH
tel. +49-211-941-42-20
NIKON GMBH
tel. +49-211-941-42-20
NIKON INSTRUMENTS S.p.A.
tel. +39-055-300-96-01
NIKON INSTRUMENTS S.p.A.
tel. +39-055-300-96-01
NIKON AG
tel. +41-43 277-28-67
NIKON AG
tel. +41-43 277-28-67
NIKON UK LTD.
tel. +44-208-247-1717
NIKON UK LTD.
tel. +44-208-247-1717
NIKON GMBH AUSTRIA
tel. +43-1-972-6111-00
NIKON GMBH AUSTRIA
tel. +43-1-972-6111-00
NIKON BELUX
tel. +32-2-705-56-65
NIKON BELUX
tel. +32-2-705-56-65
NIKON METROLOGY, INC.
12701 Grand River Avenue, Brighton, MI 48116 U.S.A.
tel. +1-810-220-4360
[email protected]
NIKON METROLOGY EUROPE NV
Geldemaaksebaan 329, 3001 Leuven, Belgium
tel. +32-16-74-01-00
[email protected]
NIKON METROLOGY GMBH
tel. +49-6023-91733-0
[email protected]
NIKON METROLOGY SARL
tel. +33-1-60-86-09-76
[email protected]
NIKON METROLOGY UK LTD.
tel. +44-1332-811-349
[email protected]