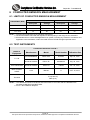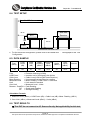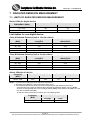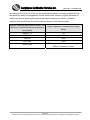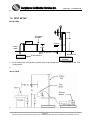
1
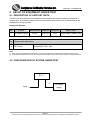
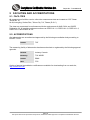
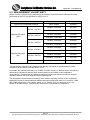
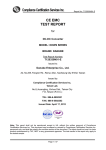
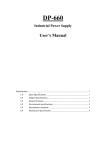
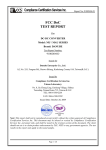
Report No.: T120308N03-D
FCC 47 CFR PART 15 SUBPART B
TEST REPORT
for
DC-DC Converter
MODEL: PU-3 SERIES
BRAND: DANUBE
Test Report Number:
T120308N03-D
Issued to:
Danube Enterprise Co., Ltd.
A2, No.255 Fengren Rd., Renwu Dist, Kaohsiung City 81452, Taiwan (R.O.C)
Issued by:
Compliance Certification Services Inc.
Tainan BU.
No.8,Jiucengling, Xinhua Dist., Tainan City
712, Taiwan (R.O.C.)
TEL: 886-6-5802201
FAX: 886-6-5802202
Issued Date: March 30, 2012
Note: This report shall not be reproduced except in full, without the written approval of Compliance
Certification Services Inc. This document may be altered or revised by Compliance Certification Services Inc.
personnel only, and shall be noted in the revision section of the document. The client should not use it to
claim product endorsement by TAF, NIST or any government agencies. The test results in the report only
apply to the tested sample.
Page 1 / 23
Report No.: T120308N03-D
Revision History
Rev.
Issue Date
Revisions
Effect Page
Revised By
00
March 30, 2012
Initial Issue
ALL
Eva Lin
Page 2
This report shall not be reproduced except in full, without the written approval of Compliance Certification Services.
Report No.: T120308N03-D
TABLE OF CONTENTS
1
2
3
TEST RESULT CERTIFICATION ....................................................................................... 4
EUT DESCRIPTION .............................................................................................................. 5
TEST METHODOLOGY ....................................................................................................... 6
3.1.
DECISION OF FINAL TEST MODE.................................................................................................... 6
3.2.
EUT SYSTEM OPERATION ............................................................................................................... 6
4
SETUP OF EQUIPMENT UNDER TEST ........................................................................... 7
4.1.
DESCRIPTION OF SUPPORT UNITS ............................................................................................... 7
4.2.
CONFIGURATION OF SYSTEM UNDER TEST ................................................................................ 7
5
FACILITIES AND ACCREDITATIONS .............................................................................. 8
5.1.
FACILITIES ......................................................................................................................................... 8
5.2.
ACCREDITATIONS............................................................................................................................. 8
5.3.
MEASUREMENT UNCERTAINTY...................................................................................................... 9
6
CONDUCTED EMISSION MEASUREMENT.................................................................. 10
6.1.
LIMITS OF CONDUCTED EMISSION MEASUREMENT ................................................................. 10
6.2.
TEST INSTRUMENTS ...................................................................................................................... 10
6.3.
TEST PROCEDURES....................................................................................................................... 11
6.4.
TEST SETUP .................................................................................................................................... 12
6.5.
DATA SAMPLE ................................................................................................................................. 12
6.6.
TEST RESULTS................................................................................................................................ 12
7
RADIATED EMISSION MEASUREMENT....................................................................... 13
7.1.
LIMITS OF RADIATED EMISSION MEASUREMENT...................................................................... 13
7.2.
TEST INSTRUMENTS ...................................................................................................................... 15
7.3.
TEST PROCEDURES....................................................................................................................... 16
7.4.
TEST SETUP .................................................................................................................................... 17
7.5.
DATA SAMPLE ................................................................................................................................. 18
7.6.
TEST RESULTS................................................................................................................................ 19
8
PHOTOGRAPHS OF THE TEST CONFIGURATION ................................................... 23
APPENDIX 1 - PHOTOGRAPHS OF EUT ......................................................................A1
Page 3
This report shall not be reproduced except in full, without the written approval of Compliance Certification Services.
Report No.: T120308N03-D
1 TEST RESULT CERTIFICATION
Product:
DC-DC Converter
Model:
PU-3 SERIES
Brand:
DANUBE
Applicant:
Danube Enterprise Co., Ltd.
A2, No.255 Fengren Rd., Renwu Dist, Kaohsiung City 81452,
Taiwan (R.O.C)
Manufacturer
Danube Enterprise Co., Ltd.
A2, No.255 Fengren Rd., Renwu Dist, Kaohsiung City 81452,
Taiwan (R.O.C)
Tested:
March 19, 2012 – March 21, 2012
Standard
FCC 47 CFR Part 15 Subpart B,
ICES-003 Issue 4
ANSI C63.4-2003
Note:
EMISSION
Item
Result
Remarks
Conducted (Power Port)
PASS
No Requirement for DC device
Radiated (Below 1GHz)
PASS
Meet Class B limit
Radiated (Above 1GHz)
N/A
No Requirement
1. The statements of test result on the above are decided by the request of test standard only; the
measurement uncertainties are not factored into this compliance determination.
2. The information of measurement uncertainty is available upon the customer’s request.
Deviation from Applicable Standard
None
The above equipment has been tested by Compliance Certification Services Inc., and found
compliance with the requirements set forth in the technical standards mentioned above. The
results of testing in this report apply only to the product/system, which was tested. Other
similar equipment will not necessarily produce the same results due to production tolerance
and measurement uncertainties.
Approved by:
Reviewed by:
Jeter Wu
Assistant Manager
Eric Huang
Assistant Section Manager
Page 4
This report shall not be reproduced except in full, without the written approval of Compliance Certification Services.
Report No.: T120308N03-D
2 EUT DESCRIPTION
Product
DC-DC Converter
Model
PU-3 SERIES
Brand Name
DANUBE
Applicant
Danube Enterprise Co., Ltd.
Manufacture
Danube Enterprise Co., Ltd.
Housing material
Plastics
Identify Number
T120308N03
Received Date
March 08, 2012
EUT Power Rating
For model: PUS-0505B3 (I/P:5Vdc, O/P:5Vdc/600mA)
For model: PUS-2415B3 (I/P:24Vdc, O/P:15Vdc/200mA)
Note:
Client consigns only two model samples to test (Model Number: PUS-0505B3; PUS-2415B3). Therefore,
the testing Lab. just guarantees the unit, which has been tested.
PARTNUMBERS STRUCTURE
Model Name
Difference
PUv-x1x2x3x4
P=Series Name
PUv-x1x2x3x4x5-zzz
U=Unregulated
v=Type of output voltage (S=Single output;D=Dual output)
x1=Input voltage
(03.3~4.5V;05~8.5V;09~11.5V;12~14.5V;15~18V;19~24V)
x2=Output voltage
(03.3~4.5V;05~8.5V;09~11.5V;12~14.5V;15~18V;19~24V)
x3=Difference Package
X4=Type of output power
X5=Function
zzz= 0~9,A~Z or blank for market purpose
Page 5
This report shall not be reproduced except in full, without the written approval of Compliance Certification Services.
Report No.: T120308N03-D
3 TEST METHODOLOGY
3.1. DECISION OF FINAL TEST MODE
The EUT was tested together with the above additional components, and a
configuration, which produced the worst emission levels, was selected and recorded
in this report.
The test configuration/ modes are as the following:
Conduction Modes:
1.
N/A
Radiation Modes: Full Load
1.
2.
PUS-0505B3
PUS-2415B3
3.2. EUT SYSTEM OPERATION
1.
Setup whole system for test as shown on setup diagram.
2.
Turn on power and check function.
3.
Start to test by test mode.
Page 6
This report shall not be reproduced except in full, without the written approval of Compliance Certification Services.
Report No.: T120308N03-D
4 SETUP OF EQUIPMENT UNDER TEST
4.1. DESCRIPTION OF SUPPORT UNITS
The EUT has been tested as an independent unit together with other necessary accessories or
support units. The following support units or accessories were used to form a representative test
configuration during the tests.
Peripherals Devices:
No.
Product
1
DC power supply
No.
A
Manufacturer Model No. Certify No.
LOKO
DPS-5050
DOC
Signal cable
Power cable, unshd, 1.6m
Signal cable description
DC Power
Unshielded, 0.4m, 1pcs
Note:
1) All the equipment/cables were placed in the worst-case configuration to maximize the emission during the test.
2) Grounding was established in accordance with the manufacturer’s requirements and conditions for the intended use.
4.2. CONFIGURATION OF SYSTEM UNDER TEST
E.U.T.
A
Load
DC power
supply
Page 7
This report shall not be reproduced except in full, without the written approval of Compliance Certification Services.
Report No.: T120308N03-D
5 FACILITIES AND ACCREDITATIONS
5.1. FACILITIES
All measurement facilities used to collect the measurement data are located at CCS Taiwan
Tainan BU. at
No.8,Jiucengling, Xinhua Dist., Tainan City 712, Taiwan (R.O.C.)
The sites are constructed in conformance with the requirements of ANSI C63.4 and CISPR
Publication 22. All receiving equipment conforms to CISPR 16-1-1, CISPR 16-1-2, CISPR 16-1-3,
CISPR 16-1-4 and CISPR 16-1-5.
5.2. ACCREDITATIONS
Our laboratories are accredited and approved by the following accreditation body according to
ISO/IEC 17025.
Taiwan
TAF
The measuring facility of laboratories has been authorized or registered by the following approval
agencies.
Canada
Industry Canada
Germany
TUV NORD
Taiwan
BSMI
USA
FCC
Copies of granted accreditation certificates are available for downloading from our web site,
http://www.ccsrf.com
Page 8
This report shall not be reproduced except in full, without the written approval of Compliance Certification Services.
Report No.: T120308N03-D
5.3. MEASUREMENT UNCERTAINTY
Where relevant, the following measurement uncertainty levels have been estimated for tests
performed on the EUT as specified in CISPR 16-4-2:
Measurement
Frequency
Uncertainty
Power Line Conducted Emission
9kHz~30MHz
±2.90dB
30 MHz ~200 MHz
±3.76dB
200 MHz ~1000 MHz
±3.73dB
30 MHz ~200 MHz
±3.60dB
200 MHz ~1000 MHz
±3.70dB
30 MHz ~200 MHz
±3.99dB
200 MHz ~1000 MHz
±3.31dB
30 MHz ~200 MHz
±3.38dB
200 MHz ~1000 MHz
±3.27dB
30 MHz ~200 MHz
±3.59dB
200 MHz ~1000 MHz
±3.27dB
1000 MHz ~6000 MHz
±3.20dB
Test Site : OATS-5
Radiated Emission
(10m)
Test Site : OATS-6
Test Site : OATS-7
Test Site : OATS-5
Radiated Emission
(3m)
Test Site : OATS-6
Test Site : OATS-6
This uncertainty represents an expanded uncertainty expressed at approximately the 95%
confidence level using a coverage factor of k=2.
Consistent with industry standard (e.g. CISPR 22: 2005, clause 11, Measurement Uncertainty)
determining compliance with the limits shall be base on the results of the compliance
measurement. Consequently the measure emissions being less than the maximum allowed
emission result in this be a compliant test or passing test.
The acceptable measurement uncertainty value without requiring revision of the compliance
statement is base on conducted and radiated emissions being less than UCISPR which is 3.6dB
and 5.2dB respectively. CCS values (called ULab in CISPR 16-4-2) is less than UCISPR as
shown in the table above. Therefore, MU need not be considered for compliance.
Page 9
This report shall not be reproduced except in full, without the written approval of Compliance Certification Services.
Report No.: T120308N03-D
6 CONDUCTED EMISSION MEASUREMENT
6.1. LIMITS OF CONDUCTED EMISSION MEASUREMENT
Class A (dBuV)
FREQUENCY (MHz)
Class B (dBuV)
Quasi-peak
Average
Quasi-peak
Average
0.15 - 0.5
79
66
66 - 56
56 - 46
0.50 - 5.0
73
60
56
46
5.0 - 30.0
73
60
60
50
NOTE: 1. The lower limit shall apply at the transition frequencies.
2. The limit decreases in line with the logarithm of the frequency in the range 0.15 to 0.50 MHz.
3. All emanations from a class A/B digital device or system, including any network of conductors and
apparatus connected thereto, shall not exceed the level of field strengths specified above.
6.2. TEST INSTRUMENTS
Conducted Emission room # 1
Name of
Equipment
Manufacturer
Model
Serial Number
Calibration Due
SCHWARZBECK
NNLK 8130
8130124
Sep. 25, 2012
Rohde & Schwarz
ESH 3-Z5
840062/021
Aug. 02, 2012
Rohde & Schwarz
ESCS 30
100348
JUL. 03, 2012
CCS
BNC50
11
OCT. 30, 2012
L.I.S.N.
TEST RECEIVER
BNC COAXIAL
CABLE
Test S/W
e-3 (5.04211c)
R&S (2.27)
NOTE: 1. The calibration interval of the above test instruments is 12 months and the calibrations are
traceable to NML/ROC and NIST/USA.
2. N.C.R = No Calibration Request.
Page 10
This report shall not be reproduced except in full, without the written approval of Compliance Certification Services.
Report No.: T120308N03-D
6.3. TEST PROCEDURES
Procedure of Preliminary Test
z
The EUT and support equipment, if needed, were set up as per the test configuration to
simulate typical usage per the user’s manual. When the EUT is a tabletop system, a wooden
table with a height of 0.8 meters is used and is placed on the ground plane as per ANSI C63.4
(see Test Facility for the dimensions of the ground plane used). When the EUT is a floor
standing equipment, it is placed on the ground plane, which has a 12 mm non-conductive
covering to insulate the EUT from the ground plane.
z
All I/O cables were positioned to simulate typical actual usage as per ANSI C63.4.
z
The test equipment EUT installed by DC main power, through a Line Impedance Stabilization
Network (LISN), which was supplied power source and was grounded to the ground plane.
z
All support equipment power by from a second LISN.
z
The test program of the EUT was started. Emissions were measured on each current
carrying line of the EUT using an EMI Test Receiver connected to the LISN powering the EUT.
z
The Receiver scanned from 150kHz to 30MHz for emissions in each of the test modes.
z
During the above scans, the emissions were maximized by cable manipulation.
z
The test mode(s) described in Item 3.1 were scanned during the preliminary test.
z
After the preliminary scan, we found the test mode described in Item 3.1 producing the highest
emission level.
z
The worst configuration of EUT and cable of the above highest emission level were recorded
for reference of the final test.
Procedure of Final Test
z
EUT and support equipment were set up on the test bench as per the configuration with
highest emission level in the preliminary test.
z
A scan was taken on both power lines, Line 1 and Line 2, recording at least the six highest
emissions. Emission frequency and amplitude were recorded into a computer in which
correction factors were used to calculate the emission level and compare reading to the
applicable limit.
z
The test data of the worst-case condition(s) was recorded.
Page 11
This report shall not be reproduced except in full, without the written approval of Compliance Certification Services.
Report No.: T120308N03-D
6.4. TEST SETUP
Vertical Reference
40 cm
EMI Test
Receiver
EUT
8
80 cm
LISN
Reference Ground Plan
z
For the actual test configuration, please refer to the related item – Photographs of the Test
Configuration.
6.5. DATA SAMPLE
Freq.
(MHz)
LISN
Factor
(dB)
Cable
Loss
(dB)
Meter
Reading
(dBuV)
Measured
Level
(dBuV)
Limits
(dBuV)
Over
Limits
(dBuV)
Detector
x.xx
9.6
0.1
15.7
25.4
46
-20.6
QP
Freq.
LISN Factor
Cable Loss
Meter Reading
Measured Level
Limit
Over Limit
Detector : Peak/PK
QP
AV
= Emission frequency in MHz
= Insertion loss of LISN and Pulse Limiter
= Cable’s loss (LISN to EMI Tester Receiver)
= Uncorrected Analyzer/Receiver reading
= Meter Reading + LISN Factor + Cable loss
= Limit stated in standard
= Measured Level - Limits
= Peak Reading
= Quasi-peak Reading
= Average Reading
Calculation Formula
1. Measured Level (dBuV) = LISN Factor (dB) + Cable Loss (dB)+ Meter Reading (dBuV)
2. Over Limit (dBuV) = Measured Level (dBuV) – Limits (dBuV)
6.6. TEST RESULTS
※ This EUT do not connect to AC Source directly. Not applicability for this test.
Page 12
This report shall not be reproduced except in full, without the written approval of Compliance Certification Services.
Report No.: T120308N03-D
7 RADIATED EMISSION MEASUREMENT
7.1. LIMITS OF RADIATED EMISSION MEASUREMENT
Below 1GHz (for digital device)
dBuV/m (At 10m)
FREQUENCY (MHz)
Class A
40
47
30 ~ 230
230 ~ 1000
Class B
30
37
Limit tables for non-digital device:
Class A Radiated Emission limit at 10m (for others)
Frequency
(MHZ)
30 - 88
88 - 216
216 – 960
Above 960
Field Strength Limit
(uV/m)Q.P.
90
150
210
300
Field Strength Limit
(dBuV/m)Q.P.
39
43.5
46.4
49.5
Class B Radiated Emission limit at 3m (for others)
Frequency
(MHZ)
30 - 88
88 - 216
216 – 960
Above 960
Field Strength Limit
(uV/m)Q.P.
100
150
200
500
Field Strength Limit
(dBuV/m)Q.P.
40
43.5
46
54
Above 1GHz(for all device)
Frequency
(MHZ)
Above 1000
Class A (dBuV/m) (At 10m)
Average
Peak
49.5
69.5
Class B (dBuV/m) (At 3m)
Average
Peak
54
74
NOTE: 1. The lower limit shall apply at the transition frequencies.
2. Emission level (dBuV/m) = 20 log Emission level (uV/m).
3. The measurement above 1GHz is at close-in distances 3m,and determine the limit L2
corresponding to the close-in distance d2 by applying the following relation: L2 = L1 (d1/d2),
where L1 is the specified limit in microvolts per metre (uV/m) at the distance d1 (10m), L2 is the
new limit for distance d2 (3m).
So the new Class A limit above 1GHz at 3m is as following table:
Frequency
(MHZ)
Above 1000
Class A (dBuV/m) (At 3m)
Average
Peak
60
80
Page 13
This report shall not be reproduced except in full, without the written approval of Compliance Certification Services.
Report No.: T120308N03-D
According to FCC Part 15.33 (b), for an unintentional radiator, including a digital device,
the spectrum shall be investigated from the lowest radio frequency signal generated or
used in the device, without going below the lowest frequency for which a radiated
emission limit is specified, up to the frequency shown in the following table:
Highest frequency generated or used in the
device or on which the device operates or
tunes (MHz)
Upper frequency of measurement range
(MHz)
Below 1.75
30
1.75-108
1000
108-500
2000
500-1000
5000
th
Above 1000
5 harmonic of the highest frequency or
40GHz, whichever is lower
Page 14
This report shall not be reproduced except in full, without the written approval of Compliance Certification Services.
Report No.: T120308N03-D
7.2. TEST INSTRUMENTS
Open Area Test Site # 7
Model
Serial Number
Calibration
Due
Rohde & Schwarz
ESCS 30
100343
DEC. 06, 2012
SUHNER
RG_214_U/2X
7
NOV. 24, 2012
Sunol sciences
JB1
A070506-1
OCT. 05, 2012
Name of Equipment Manufacturer
TEST RECEIVER
TYPE N COAXIAL
CABLE
BILOG ANTENNA
EMI e-3 / AUDIX (5.04211c)
Test Software
Above 1GHz Used
RF Cable
SUHNER
SUCOFLEX104PEA
20520/4PEA
NOV. 10, 2012
Horn Antenna
Com-Power
AH-118
071032
DEC. 27, 2012
Spectrum Analyzer
R&S
FSEK 30
835253/002
Sep,29,2012
Pre-Amplifier
MITEQ
AFS44-00108650-42-10P-44
1205908
NOV. 23, 2012
Turn Table
Yo Chen
001
----------
N.C.R.
Antenna Tower
AR
TP1000A
309874
N.C.R.
Controller
CT
SC101
----------
N.C.R.
ERS-180A
EC1204141
N.C.R
RF Swicth
E-INSTRUMENT
TELH LTD
e-3 (5.04303e)
Test Software
NOTE: 1. The calibration interval of the above test instruments is 12 months and the calibrations are
traceable to NML/ROC and NIST/USA.
2. N.C.R = No Calibration Request.
Page 15
This report shall not be reproduced except in full, without the written approval of Compliance Certification Services.
Report No.: T120308N03-D
7.3. TEST PROCEDURES
Procedure of Preliminary Test
z
The equipment was set up as per the test configuration to simulate typical usage per the user’s
manual. When the EUT is a tabletop system, a wooden turntable with a height of 0.8 meters is
used which is placed on the ground plane. When the EUT is a floor standing equipment, it is
placed on the ground plane which has a 12 mm non-conductive covering to insulate the EUT
from the ground plane.
z
Support equipment, if needed, was placed as per ANSI C63.4.
z
All I/O cables were positioned to simulate typical usage as per ANSI C63.4.
z
The EUT received DC power source from the outlet socket under the turntable. All support
equipment power received from another socket under the turntable.
z
The antenna was placed at 3 or 10 meter away from the EUT as stated in ANSI C63.4. The
antenna connected to the Spectrum Analyzer via a cable and at times a pre-amplifier would be
used.
z
The Analyzer / Receiver quickly scanned from 30MHz to 40GHz. The EUT test program was
started. Emissions were scanned and measured rotating the EUT to 360 degrees and
positioning the antenna 1 to 4 meters above the ground plane, in both the vertical and the
horizontal polarization, to maximize the emission reading level.
z
The test mode(s) described in Item 3.1 were scanned during the preliminary test:
z
After the preliminary scan, we found the test mode described in Item 3.1 producing the highest
emission level.
z
The worst configuration of EUT and cable of the above highest emission level were recorded
for reference of the final test.
Procedure of Final Test
z
EUT and support equipment were set up on the turntable as per the configuration with highest
emission level in the preliminary test.
z
The Analyzer / Receiver scanned from 30MHz to 40GHz. Emissions were scanned and
measured rotating the EUT to 360 degrees, varying cable placement and positioning the
antenna 1 to 4 meters above the ground plane, in both the vertical and the horizontal
polarization, to maximize the emission reading level.
z
Recording at least the six highest emissions. Emission frequency, amplitude, antenna position,
polarization and turntable position were recorded into a computer in which correction factors
were used to calculate the emission level and compare reading to the applicable limit. Below
1GHz the Q.P. reading and above 1GHz the Peak and Average reading are presented.
z
The test data of the worst-case condition(s) was recorded.
Page 16
This report shall not be reproduced except in full, without the written approval of Compliance Certification Services.
Report No.: T120308N03-D
z
7.4. TEST SETUP
Below 1GHz
Test table &
Turntable
1m ~ 4m
EUT
Coaxial
Cable
Power
Cable
0.8 m
10 m or 3 m
Filter
Ground Plane
To Power Source
EMI
Receiver
z
For the actual test configuration, please refer to the related item – Photographs of the Test
Configuration.
z
Above 1GHz
z
Page 17
This report shall not be reproduced except in full, without the written approval of Compliance Certification Services.
Report No.: T120308N03-D
7.5. DATA SAMPLE
Below 1GHz
Reading
Freq.
(MHz)
x.xx
dBuV/m
Antenna
Factor
dB
Cable
loss
dB
Measure
level
dBuV/m
dBuV/m
24.48
7.33
1.50
33.31
40
Freq.
Reading
Antenna Factor
Cable los
Measure level
Limit
Over limit
Detector: Peak/PK
..
QP
..
AV
Limit
Over
Detector
limit
dBuV/m
-6.69
QP
= Emission frequency in MHz
= Uncorrected Analyzer/Receiver reading
= Antenna Factor
= Cable’s loss
= Reading + Antenna Factor + Cable loss
= Limit stated in standard
= Measure level – Limit
= Peak Reading
= Quasi-peak Reading
= Average Reading
Calculation Formula
Over limit (dBuV/m) = Result (dBuV/m) – Limit (dBuV/m)
Above 1GHz
Freq.
Reading
AF
C_loss
Pre-amp
Filter
Level
Limit
Margin
Mark
(MHz)
(dBμV)
(dBμV)
(dB)
(dB)
(dB)
(dBμV/m)
(dBμV/m)
(dB)
(P/Q/A)
XXXX. XX
56.00
25.14
2.07
41.77
0.72
42.16
70.00
-27.84
P
Freq.
Reading
AF
C_loss
Pre-amp
Filter
Level
Limit
Margin
Mark:
= Emission frequency in MHz
= Uncorrected Analyzer/Receiver reading
= Antenna Factor
=Insertion loss of cable
= Pre-amplifier Gain
= Insertion loss of filter
= Readind+AF+Closs-Pre-amp+Fliter
= Limit stated in standard
= Reading in reference to limit
P = Peak Reading
Q = Quasi-peak Reading
A = Average Reading
= Antenna Height
..
Height
Calculation Formula
Margin (dB) =Level (dBuV/m) – Limit (dBuV/m)
Page 18
This report shall not be reproduced except in full, without the written approval of Compliance Certification Services.
Report No.: T120308N03-D
7.6. TEST RESULTS
Below 1GHz
Model No.
PUS-0505B3
Test Mode
Full Load
Environmental
Conditions
25deg.C, 58% RH
6dB Bandwidth
120 kHz
Antenna Pole
Vertical
Antenna Distance 10m
Detector Function
Quasi-peak.
Tested by
Shiang Su
(The chart below shows the highest readings taken from the final data.)
Note:
1. QP= Quasi-peak Reading.
2. The other emission levels were very low against the limit.
Page 19
This report shall not be reproduced except in full, without the written approval of Compliance Certification Services.
Report No.: T120308N03-D
Model No.
PUS-0505B3
Test Mode
Full Load
Environmental
Conditions
25deg.C, 58% RH
6dB Bandwidth
120 kHz
Antenna Pole
Horizontal
Antenna Distance 10m
Detector Function
Quasi-peak.
Tested by
Shiang Su
(The chart below shows the highest readings taken from the final data.)
Note:
1. QP= Quasi-peak Reading.
2. The other emission levels were very low against the limit.
Page 20
This report shall not be reproduced except in full, without the written approval of Compliance Certification Services.
Report No.: T120308N03-D
Model No.
PUS-2415B3
Test Mode
Full Load
Environmental
Conditions
25deg.C, 58% RH
6dB Bandwidth
120 kHz
Antenna Pole
Vertical
Antenna Distance 10m
Detector Function
Quasi-peak.
Tested by
Shiang Su
(The chart below shows the highest readings taken from the final data.)
Note:
1. QP= Quasi-peak Reading.
2. The other emission levels were very low against the limit.
Page 21
This report shall not be reproduced except in full, without the written approval of Compliance Certification Services.
Report No.: T120308N03-D
Model No.
PUS-2415B3
Test Mode
Full Load
Environmental
Conditions
25deg.C, 58% RH
6dB Bandwidth
120 kHz
Antenna Pole
Horizontal
Antenna Distance 10m
Detector Function
Quasi-peak.
Tested by
Shiang Su
(The chart below shows the highest readings taken from the final data.)
Note:
1. QP= Quasi-peak Reading.
2. The other emission levels were very low against the limit.
Above 1GHz
※ No applicable, since the highest frequency of the internal sources of the EUT is
less than 108MHz, the measurement shall only be made up to 1 GHz.
Page 22
This report shall not be reproduced except in full, without the written approval of Compliance Certification Services.
Report No.: T120308N03-D
8 PHOTOGRAPHS OF THE TEST CONFIGURATION
RADIATED EMISSION TEST
Page 23
This report shall not be reproduced except in full, without the written approval of Compliance Certification Services.