1
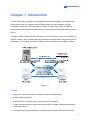
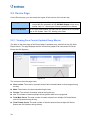
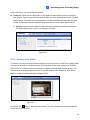
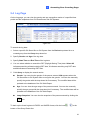
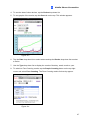
GV-Web Report User's Manual V2.1.1 © 2010 GeoVision, Inc. All rights reserved. Under the copyright laws, this manual may not be copied, in whole or in part, without the written consent of GeoVision. Every effort has been made to ensure that the information in this manual is accurate. GeoVision, Inc. makes no expressed or implied warranty of any kind and assumes no responsibility for errors or omissions. No liability is assumed for incidental or consequential damages arising from the use of the information or products contained herein. Features and specifications are subject to change without notice. GeoVision, Inc. 9F, No. 246, Sec. 1, Neihu Rd., Neihu District, Taipei, Taiwan Tel: +886-2-8797-8377 Fax: +886-2-8797-8335 http://www.geovision.com.tw Trademarks used in this manual: GeoVision, the GeoVision logo and GV series products are trademarks of GeoVision, Inc. Windows and Windows XP are registered trademarks of Microsoft Corporation. November 2010 Contents Naming and Definition .................................................iii Chapter 1 Introduction ................................................1 1.1 Minimum System Requirements ................................................................................2 Chapter 2 Installation ..................................................3 2.1 Installing the GV-Web Report ....................................................................................3 2.2 Installing dbSync2 on the GV-System ......................................................................4 Chapter 3 Getting Started ...........................................5 3.1 Starting the GV-Web Report ......................................................................................5 3.2 Connecting GV-System to GV-Web Report ...............................................................5 3.2.1 Sending People Counting Results ...................................................................6 3.2.2 Sending Face Counting Results ......................................................................8 3.3 Configuring the dbSync2 Program on GV-System.....................................................9 3.4 Connecting GV-Smart Box to GV-Web Report ........................................................11 3.5 The Main Screen of GV-Web Report .......................................................................12 3.6 Configuring the GV-Web Report ..............................................................................13 3.6.1 General Settings ............................................................................................13 3.6.2 Account Settings............................................................................................14 3.6.3 Remote Access Settings................................................................................15 3.6.4 Database Settings .........................................................................................16 3.6.5 E-Mail Settings...............................................................................................16 3.6.6 UPnP Port Mapping Settings .........................................................................19 Chapter 4 Accessing People Counting Page ..........20 4.1 Accessing People Counts and Graphics ................................................................20 4.2 Device Page.............................................................................................................22 4.2.1 Viewing People Counts Updated Every Minute .............................................22 4.2.2 Viewing the Current People Counts...............................................................23 4.2.3 Viewing Live Video ........................................................................................24 4.3 Group Page..............................................................................................................25 i 4.4 Log Page..................................................................................................................28 4.4.1 Playing Back Recordings...............................................................................29 4.5 Query Page ..............................................................................................................31 Chapter 5 Accessing Face Counting Page..............35 5.1 Accessing Face Counts and Graphics .....................................................................35 5.2 Device Page.............................................................................................................38 5.2.1 Viewing Face Counts Updated Every Minute ................................................38 5.2.2 Viewing Live Video ........................................................................................39 5.3 Group Page..............................................................................................................40 5.4 Log Page..................................................................................................................41 5.5 Query Page ..............................................................................................................42 Chapter 6 Mobile Phone Connection .......................46 Appendix......................................................................49 A. Enabling UPnP in Windows XP..........................................................................49 B. Modifying Port Number for running GV-Web Report on the same computer with GV-System ........................................................................................................50 ii Naming and Definition GV-System GeoVision analog and digital video recording software. In most of documents, the GV-System also refers to Multicam System, GVNVR System and GV-Hybrid DVR System at the same time. GV-Smart Box The GV-Smart Box is a standalone device featuring People Counting, Face Counting and Gender and Age Recognition functions. Through the web browser, the GV-Smart Box delivers live view, face snapshots and gender/age analysis. iii 1 Introduction Chapter 1 Introduction The GV-Web Report is designed to integrate and analyze the people counting and face counting data from GV-Systems and GV-Smart Boxes, as well as gender and age recognition results from GV-Smart Boxes. Suitable for large-scale video surveillance deployments, it can receive the data from up to 1000 units of GV-Systems and GV-Smart Boxes. Through the Web interface of GV-Web Report, you can access the reports and graphs of real-time, hourly, daily, monthly and yearly statistics on people traffic and gender and age distribution. You can also view the live video and the recordings from multiple locations. Figure 1-1 Features • Support for up to 1000 units of GV-Systems and GV-Smart Boxes • People traffic monitoring • Real-time, daily, monthly, yearly counting reports and graphs • E-mail notification and I/O trigger when the number of people remaining exceeds the specified maximum • Counting results query from iPhone, iPad and other Android-based mobile devices 1 • Analysis of gender and age distribution • Grouping function to combine desired devices’ cameras for data analysis • Remote playback of recordings from GV-Systems • Face counting results and snapshots from GV-Systems and GV-Smart Boxes 1.1 Minimum System Requirements The following are minimum system requirements for the server to run GV-Web Report, and for the GV-System to run dbSync 2 in order to connect to GV-Web Report. GV-System GV-System V8.3.2 or later Software .Net Framework 3.5 dbSync2 Note: .Net Framework and dbSync2 can be found in the accompanying software CD. GV-Web Report OS Windows XP, Vista, Windows 7, Server 2003, Server 2008 Software .Net Framework 3.5 Browser Internet Explorer 7.0 or later Hardware External or Internal GV-USB Dongle Note: 1. .Net Framework can be found in the accompanying software CD. 2. GV-USB Dongle for 200, 500 and 1000 clients are available upon purchase. Note that if multiple GV-USB Dongles are inserted, the dongle that supports greater number of clients will be used. 2 2 Installation Chapter 2 Installation 2.1 Installing the GV-Web Report The GV-Web Report program may be installed on a separate computer or the same computer with the GV-System, but it is recommended to install on a dedicated computer. Before installing the GV-Web Report, you need to install the USB dongle driver and .Net Framework first. Follow the steps below to install the programs. 1. Insert Software CD to the computer. This window pops up automatically. Figure 2-1 2. To install USB driver, select Install or Remove GeoVision GV-Series Driver and click Install GeoVision USB Devices Driver to start. 3. To install .Net Framework, select Install Microsoft. NET Framework 3.5 to start. 4. To install GV-Web Report, select Install GeoVision V2.1.1.0 GV-Web Report System and click GeoVision GV-Web Report System to start. 3 2.2 Installing dbSync2 on the GV-System To send people counting data from GV-System to GV-Web Report, it is required to install the dbSync2 program on the GV-System. Follow the steps below to install the program. 1. Insert Software CD to the computer. The Install Program window (Figure 2-1) pops up automatically. 2. To install .Net Framework, select Install Microsoft. NET Framework 3.5 (Not compatible with Windows 2000) to start. 3. To install dySync2, select Install GeoVision V2.1.1.0 GV-Web Report System and click dySync2 to start. 4 3 Getting Started Chapter 3 Getting Started The GV-Web Report server is a dedicated computer on a network that analyzes the people and face counts from GV-Systems and GV-Smart Boxes, as well as gender and age recognition results from GV-Smart Boxes. The GV-Web Report server enables you to access the analysis data anywhere through a web browser. 3.1 Starting the GV-Web Report To start the GV-Web Report service, follow these steps: 1. Run GV-Web Report (from Windows Start menu or from the desktop). For the first-time user, you will be prompted to enter a password. The default ID (account) is admin. 2. On the GV-Web Report window, click Service from the menu bar and select Data Service to start receiving data from connected GV-Systems and GV-Smart Boxes. 3.2 Connecting GV-System to GV-Web Report To send people counting results from a GV-System to the GV-Web Report server, you need to run the dbSync2 program on the computer of GV-System. To send face counting results from GV-Systems to the GV-Web Report, use the Face Count function of the GV-System. Note: To send face counting results from GV-Systems to GV-Web Report, an AVP dongle is required and the GV-System must be of version 8.4.0.0 or later. 5 3.2.1 Sending People Counting Results 1. Run dbSync2 (from Windows Start menu or from the desktop). This dialog box appears. Figure 3-1 2. Click the Setting button. This dialog box appears. Figure 3-2 6 3 Getting Started 3. In the GV-Web Report Configuration section, enter the IP address, username and password of the GV-Web Report server. Keep the port 30000 or modify it if necessary. The port value must match the port of GV-Web Report server (Figure 3-10). For details on account settings on the GV-Web Report server, see 3.6.2 Account Settings. 4. Click Test to connect to the GV-Web Report server. If the connection is established, a successful connection message will appear on both the GV-System and the GV-Web Report. Note: Ensure that the GV-Web Report service has been started (see 3.1 Starting the GVWeb Report). Otherwise, the connection attempt will fail. 5. Since the dbSync2 program only sends the logged counts to the GV-Web Report server, it is required to configure the Update the log every x Min. option in the Counter/Intrusion Alarm Setting on the GV-System. Based on the specified interval in minute, the counts are logged to the GV-System and will be sent to the GV-Web Report server through the dbSync2 program. Figure 3-3 To define a specific time to send people counts to the GV-Web Report server, see 3.3 Configuring the dbSync2 Program on GV-System. 7 3.2.2 Sending Face Counting Results To send face counting results from GV-Systems to GV-Web Report, an AVP dongle is required and the GV-System must be of version 8.4.0.0 or later. Make sure remote access to GV-Systems has been enabled on GV-Web Report. See 3.6.3 Remote Access settings for details. 1. On the GV-System, click the Configure button, select Advanced Video Analysis and select Face Count Setting. 2. Select the cameras you would like to configure and click Configure. This dialog box appears. Figure 3-4 3. Select Face Count under Alarm Type. 4. In the Option section, select Save counting results to GV-Web Report. A dialog box appears. Figure 3-5 5. Type the Domain Name or IP Address, Port, UserName, and Password of the GVWeb Report. The default port number is 30000. For details on account settings on the GV-Web Report server, see 3.6.2 Account Settings. 6. Click OK. 8 3 Getting Started 3.3 Configuring the dbSync2 Program on GV-System The dbSync2 program, installed on the computer of GV-System, sends people counts to the GV-Web Report server. It also enables remote access to the GV-System for live video and playback applications. 1. Run dbSync2. This dialog box appears. Figure 3-6 Daily Sync. Time: Specify a time to send the counts to the GV-Web Report server automatically. Update Interval: Specify a time interval in minute to send the counts to the GV-Web Report server automatically. Sync: Click this button to send the counts to the GV-Web Report server immediately. Batch: Click this button, and select the desired data files to be sent to the GV-Web Report server. The files of people counts are named with prefix "sys", e.g. sys20071127. The default path for data files is: \GV folder\database. Setting: Click this button to configure connections to the GV-Web Report server. 9 2. Click the Setting button. This dialog box appears. Figure 3-7 [Sync Configuration] Displays the database path. The default path for database is: \GV folder\database. [GV-Web Report Configuration] Type the connection information of the GV-Web Report server, including its IP address, login username and password. The default port value is 30000. Click Test to ensure the connection information is correct. [DVR Configuration for Remote Access] The configuration allows remote access to the live video and the recordings of GV-System. Before the configuration, enable WebCam Server on the GV-System first so that the dbSync2 program can automatically acquire the necessary port values (Common Port, Data Port, Audio Port and Viewing Port) from the GV-System. Enter the IP address, login username and password of the GV-System. Then click Update to send the configuration values to the GV-Web Report server. 3. Click OK. The dbSync2 program is minimized to the notification area. When people counts are logged to the GV-System, the dbSync2 program will send it to the GV-Web Report server at the specified time or time interval each day. You can not only query counting data, but also view live video and recordings through an IE browser anywhere. 10 3 Getting Started 3.4 Connecting GV-Smart Box to GV-Web Report To send either people counts or face counts and gender and age recognition results from a GV-Smart Box to the GV-Web Report server, you need to configure the GV-Smart Box to allow connection to GV-Web Report. For details, see 7.1 Connecting to GV-Web Report in GV-Smart Box User’s Manual. 1. Select Events and Alerts and then Web Report Setting in the Web interface of the GVSmart Box. This page appears. Figure 3-8 2. Enable the Web Report function. 3. Enter the IP address of the GV-Web Report server, and the login username and password. Then click Apply. The Connection Status is shown on the bottom of the page to show whether GV-Web Report is connected and the time of connection. 11 3.5 The Main Screen of GV-Web Report 3 4 5 1 2 Figure 3-9 No Name Description 1 Host List Displays connected hosts. 2 Event List Displays the connection information. 3 Service Enables and disables the GV-Web Report services. Data Service: Allows connection to GV-Systems and GVSmart Boxes. Web Service: Accesses to the GV-Web Report’s Web Interface. Also allows remote access to live video and recordings of GV-System as well as face snapshots captured from GV-Smart Boxes. 4 Browse Links to the Web interface of the GV-Web Report. 5 Tools Accesses the advanced settings. See 3.5 Configuring the GV-Web Report. 12 3 Getting Started 3.6 Configuring the GV-Web Report To access more settings of the GV-Web Report server, click Tools (No. 5, Figure 3-9) on the main screen. The following sections describe these advanced settings: General Settings, Account Settings, Remote Access Settings, Database Settings, E-Mail Settings, and UPnP Port Mapping Settings. 3.6.1 General Settings The General Settings allow you to configure the communication ports of the GV-Web Report server and automatic startup services. Figure 3-10 [Data Server] Server Name: Name the GV-Web Report server. The default value is the computer name. Listen Port: The default port value of the GV-Web Report server is 30000. The port value must match the GV-Web Report related port on a GV-System (Figure 3-2) and GVSmart Box (Figure 3-8). Max Client Limit: Define the maximum number of GV-Systems and GV-Smart Boxes that can be connected to the GV-Web Report. The maximum value is indicated on the right. Auto Start Service: Automatically start connection to GV-Systems and GV-Smart Boxes once the GV-Web Report server is started. [Web Server] Listen Port: The default port value is 80. The HTTP port enables connecting the GVWeb Report server to the Web. 13 Auto Start Service: Automatically start the remote access to GV-Systems and GVSmart Boxes. Auto startup after login Windows: Automatically start the GV-Web Report server after Windows startup. Start Auto login: Automatically log into the GV-Web Report server after Windows startup. Click the Arrow button to enter the login account and password. 3.6.2 Account Settings Using the Account Settings, the GV-Web Report supervisor can create new accounts with different access rights. The supervisor account has the privilege to log into the GV-Web Report and make configuration settings, while the user account is only allowed to access the Web interface of the GV-Web Report. The maximum account number, including supervisor and user accounts, is 100. Figure 3-11 For details on the Allow Group Setting option in the GV-Web Report tab, see 4.3 Group Page. 14 3 Getting Started 3.6.3 Remote Access Settings The Remote Access Settings display the available GV-Systems and GV-Smart Boxes for remote access to their live video, recordings, and face snapshots through the web browser. The asterisk * on the State column indicates that the account name and password are required for access to the specific device. To allow remote access to the GV-System or GVSmart Box, select the device on the list and then enter its login account name and password. Figure 3-12 15 3.6.4 Database Settings You can modify the storage path of the GV-Web Report’s database, specify the number of days to keep the database, and change the storage path of face snapshots from GV-Smart Boxes. If the computer of the GV-Web Report server is of NTFS file system, you can select Enable Database Compression to save disk space. Figure 3-13 3.6.5 E-Mail Settings Using the E-Mail Settings, you can send e-mails to the supervisor when a GV-System or GV-Smart Box is disconnected. You can also send e-mail notifications when the number of people remaining reached the pre-defined maximum. See 4.3 Group Page on how to set the maximum. Figure 3-14 16 3 Getting Started 3.6.5.1 Setting Mail Server 1. Enter URL or IP address of the SMTP server. 2. Enter the sender’s e-mail address. The entered e-mail will appear as sender when the e-mail is received. 3. Enter the recipient’s e-mail address. For multiple recipients, add a semicolon between each e-mail address. 4. Enter a subject coming with the alert message. 5. Click Test E-Mail Account to send out a test e-mail to see whether the setup is correct. If the connection attempt fails, you may also need to check the settings of SMTP Authentication Setting and SMTP Server Settings described below. Other options on the dialog box: [SMTP Authentication Setting] If your e-mail service provider requires authentication for sending e-mails, select this option and enter the account ID and password of your SMTP. [SMTP Server Setting] SMTP Port: Enter the SMTP port value. The default value is 25. SSL: If your e-mail server requires an SSL (Secure Sockets Layer) authentication for connection, select this option. 3.6.5.2 Setting E-Mail Alert When a GV-System or GV-Smart Box is disconnected from the GV-Web Report, the e-mail will be sent out to warn the supervisor. Follow the steps below to set the e-mail alert. 1. Right-click the host in the host list and select Host Setting. Figure 3-15 17 2. Enable Send E-Mail Notification when disconnected, and click OK. Figure 3-16 18 3 Getting Started 3.6.6 UPnP Port Mapping Settings The GV-Web Report server supports UPnP technology (Universal Plug and Play) to allow automatic port configuration to your router. In order for UPnP to be enabled, the following requirements must be met: z Windows XP Service Pack 2 or later z Windows operating system has been configured to use UPnP (see Enabling UPnP in Windows XP, Appendix) z UPnP has been enabled on your router (consult your router’s documentation) To enable UPnP on the GV-Web Report: 1. Click Tools from the menu bar and select UPnP Port Mapping Setting. This dialog box appears. Figure 3-17 2. Click Searching to search the UPnP-enabled routers. 3. If your server is installed with more than one router, select a desired one from the UPnPbased Router drop-down list. 4. If you server is installed with more than one network adapter, select a desired one from the drop-down list. 5. Click Configure to automatically configure the communication ports on the router. Tip: If you don’t use the default ports, modify the related ports in the General Settings dialog box (Figure 3-11), re-open the UPnP Port Mapping dialog box and follow above steps to configure your router. 19 Chapter 4 Accessing People Counting Page After the GV-Web Report Service is started, you can access the counts, graphics and live video on the network. The GV-Web Report is divided into 2 pages, People Counting page and Face Counting page. This chapter describes in details the functions of the People Counting page. • People Counting page: provides counting data regarding the number of people in, out of, and remaining in the surveillance area. The counting data can be from GV-Systems and GV-Smart Boxes. • Face Counting page: provides face counting data, and gender and age recognition results of people entered the surveillance area. The counting data can be from GVSystems and GV-Smart Boxes. Note: For remote viewing through network, Internet Explorer 7.0 or later is required. 4.1 Accessing People Counts and Graphics To access people count results through the web browser, ensure that Web Service on the GV-Web Report server has been enabled as shown below; otherwise the login through the web browser will fail. Figure 4-1 20 4 Accessing People Counting Page 1. Two methods to access the Web interface of GV-Web Report: A. If you are at the local GV-Web Report server, select Browse on the main screen of the GV-Web Report (Figure 3-9) and select GV-Web Report Data. The login page appears. Figure 4-2 B. If you are at a remote computer, start the Internet Explorer browser. Enter the IP address or the domain name of GV-Web Report in the Location/Address field of your browser. The login page appears. 2. Enter the login ID and Password of the GV-Web Report. The ID and Password should match those of any account set in the Account dialog box (Figure 3-11). 3. Enter the characters shown in the image. 4. Click Login. The Web page similar to the following example is now displayed in your browser. Figure 4-3 5. To display the graphs, it is required to download Microsoft Silverlight to your computer. Click the link on the page to start downloading the program. 21 4.2 Device Page On the Device page, you can access three types of people counts of the current day. Main page On the main page of the Device page, the people counts of the current day are updated from the GV-Web Report server every minute. See 4.2.1 Viewing the Counts Updated Every Minute. Counting Signage On the Counting Signage page, the people counts of the current day is updated from the GV-Web Report server immediately. See 4.2.2 Viewing the Current Counts. Live View Window On the Live View window, the people counts are updated directly from a GV-System. You can also view live video from a GVSystem or GV-Smart Box. See 4.2.3 Viewing Live Video. 4.2.1 Viewing People Counts Updated Every Minute The data on the main page of the Device page is updated every minute from the GV-Web Report server. The page displays the people counts and graphs of all connected GVSystems and GV-Smart Boxes. Figure 4-4 The counts on the main page show: In: The number of people entered during the day. Out: The number of people left during the day. Average In: The average number of people entered every minute during the day. Average Out: The average number of people left every minute during the day. 22 4 Accessing People Counting Page Total In: The total number of entered people from multiple devices during the day. Total Out: The total number of left people from multiple devices during the day. Stay: The number of people remaining. That is subtracting the number of Total Out from the number of Total In. On the left menu, you can find these options: Total List: Select one device under the list to access its individual counts. A green mark indicates that the device is now updating data to the GV-Web Report server; otherwise a red mark appears. On the individual device’s page, the people counts of the current day are updated every minute from the GV-Web Report server. Camera: Access the live video if remote access is enabled on both the device and GV-Web Report server. See 4.2.3 Viewing Live Video later in this chapter. Counting Signage: Access the people counts of the current day updated immediately from the GV-Web Report server. Figure 4-5 4.2.2 Viewing the Current People Counts To view the people counts of the current day continuously updated from the GV-Web Report server, select Counting Signage from the left menu of the Device page. Figure 4-6 23 4.2.3 Viewing Live Video To access live video, select the desired camera from the left menu of the Device page. To have video streaming, ensure the following settings have been configured or enabled: • GV-System: WebCam Server and DVR Configuration for Remote Access settings (Figure 3-7) on dbSync2 • GV-Web Report: Configuration for Remote Access settings (Figure 3-12) Figure 4-7 By clicking the Start button on the Live View window, you can view the updating counts from the GV-System. Note: 1. The In and Out counts on the Live View window is updated directly from the GVSystem instead of the GV-Web Report server. 2. Once the counts are logged into the GV-System, the In and Out counts will become zero and the GV-System will start counting those numbers again. 3. The GV-Smart Box does not support the direct update of the people counts on the Live View window. 24 4 Accessing People Counting Page 4.3 Group Page On the Group page, you can group different cameras from different GV-Systems and GVSmart Boxes, and see the people counts of the set group. You can also set up the maximum number of people entered, left and remaining to activate the computer alarm. I/O trigger to warn the onsite operator of the GV-Web Report server and e-mail notification can be activated when the number of people remaining reaches the pre-defined maximum. To set up a group: 1. Select Add Group from the left menu of the Group page. This page appears. Figure 4-8 2. Name the group. 3. Select the cameras that you want to include in the group. 4. In the Maximum In field, set the maximum number of people that can enter during the day before activating the computer alarm. 5. In the Maximum Out field, set the maximum number of people that can leave during the day before activating the computer alarm. 6. In the Maximum Stay field, set the maximum number of people that can remain during the day before activating the computer alarm, sending a notification e-mail or triggering an output device. 7. To receive e-mail notifications when the maximum number of people remained is reached, select Yes for Set email for reaching the maximum. 8. To trigger an output device when the maximum number of people remained is reached, select Yes for Set I/O trigger for reaching the maximum. 9. Click Submit. 10. From Total List in the left menu, select the set Group to see the sum of every people count from those selected cameras. 25 To set up e-mail notifications: To receive e-mail notifications when the maximum number of people remaining is reached, you must first set up the mail server on the GV-Web Report server, and then set up an email group as below. To set up the mail server to send e-mails, see 3.6.5 E-mail Settings. 1. Select Add Email Group from the left menu of the Group page. This page appears. Figure 4-9 2. Name the group. 3. In the Group member email field, type the E-mail address to sent notification to. Separate multiple e-mail addresses with semicolons. 4. Click Submit. 5. Customize the e-mail subject and content by clicking Maintain Group and then the Update Group button . Type the e-mail subject and content. 6. To edit an existing e-mail group, select Maintain Email Group and click the Update Group button 26 . To delete an existing group, click the Delete Group button . 4 Accessing People Counting Page To set up I/O triggers: The I/O trigger warns the onsite operator of the GV-Web Report server when the number of people remaining reaches the pre-defined maximum. The I/O trigger function only supports these GV I/O devices: GV-I/O Box 4 Ports, 8 Ports and 16 Ports. Note: The I/O trigger function only supports one output device through a GV-I/O Box, and the GV-I/O Box needs to be connected to the COM port of the GV-Web Report server. 1. Select Add I/O Device from the left menu of the Group page. This page appears. Figure 4-10 2. Select the device name from the drop-down list. 3. Select the corresponding COM port and address for the I/O device. 4. Select the output to trigger and its signal type. For Pulse type, specify the amount of time in second you want the output device to be triggered for. 5. Click Submit. On the left menu of the Group page, you can find these options: Total List: Access the people counts of the set groups updated every minute from the GV-Web Report server. Counting Signage: Access the people counts of the set groups updated immediately from the GV-Web Report server. When the limit of Maximum In, Maximum Out or Maximum Stay is reached, the warning texts will be displayed on the page and the computer alarm will be activated too. 27 4.4 Log Page On the Log page, you can view the people counts of a specified time period from GVSystems and GV-Smart Boxes. Figure 4-11 To search the log data: 1. Select a specific GV-System or a GV-Smart Box from the Device drop-down list or a created group from the Group drop-down list. 2. Specify Start Time and End Time of the log data. 3. You can select whether to search the DST (Daylight Saving Time) data. Select All indicates searching all data including DST data, Y indicates searching only DST data and N indicates not searching DST data. 4. Click Query to display the search results. To back up the found log data in EXCEL and WORD format, click the icons 28 . 4 Accessing People Counting Page 4.4.1 Playing Back Recordings To retrieve recordings, click the Video Clip icon on the Log page. The following playback window will appear. To have video streaming, ensure the following settings have been configured or enabled: • dbSync2: DVR Configuration for Remote Access (Figure 3-7). • GV-System: WebCam Server with the Run Viewlog Server option enabled • GV-Web Report: Configuration for Remote Access settings (Figure 3-12) Note: The GV-Smart Box does not support the playback function. Figure 4-12 29 Right-click the playback window to have the following features: Play Mode Render Tools 30 Includes these options: Frame by Frame: Play back video frame by frame. Real Time: Play back video on real time. This mode saves waiting time for rendering, but drop frames to give the appearance of realtime playback. Auto Play Next 5 Minutes: Play back video up to 5 minutes. Audio: Turn on or off the video sound. Includes these options: Deinterlace: Convert the interlaced video into non-interlaced video. Scaling: Smoothen mosaic squares when enlarging a playback video Deblocking: Remove the block-like artifacts from low-quality and highly compressed video. Defog: Enhance image visibility. Stabilizer: Reduce camera shake. Text overlay’s camera name and time: Overlay camera name and time onto the video. Text overlay’s POS/GV-Wiegand: Overlay POS or GV-Wiegand Capture data onto the video. Full Screen: Switch to the full screen view. Snapshot: Save a video image. Save as AVI: Save a video as avi format. Download: Download the video clip to the local computer. 4 Accessing People Counting Page 4.5 Query Page The Query page provides you with the daily, weekly, monthly and yearly people counting graphs and tables. To search the counting data, select a GV-System or GV-Smart Box from the Device dropdown list or a created group from the Group drop-down list, specify a date, and select the options below. Use the Chart drop-down list using bar graph, pie graph or line graph. to choose to display the data Note: Pie graph is not available for the following types of data: • In/Out Counts per hour and Total Stay • Total In, Out and Stay per Hour • In Counts per Hour • Out Counts per Hour • Total Stay per Hour [Daily Report] Display the counting report of the specified date. In/Out Counts per hour and Total Stay: The hourly number of people entered and left, and the total number of people remaining until now. Difference between In and Out per hour: The hourly number of people remaining. Total In, Out and Stay per hour: The total number of people entered, left and remaining during the day. 31 The following figure is an example of the In/Out Counts per hour and Total Stay option. The value 16, 179 indicates the count of remaining people until 16 pm is 179. Figure 4-13 [Weekly Report] Display the weekly report that contains the data of 7 days before your specified date. In Counts per hour: The hourly number of people entered for the week. Out Counts per hour: The hourly number of people left for the week. Total Stay per hour: The hourly number of people remaining for the week. In Percentage per hour: The hourly percentage of people entered for the week. Stay Percentage per hour: The hourly percentage of people remaining for the week. 32 4 Accessing People Counting Page The following figure is an example of the In Percentage per hour option. The value 15:00, 65 (9.02%) indicates the total number of entered people at 15 pm every day for the week is 65. The number takes up 9.02 percent of the total people entered for the week. Figure 4-14 33 [Monthly Report] In Percentage per day: The daily percentage of people entered in the month. In Percentage per hour: The hourly percentage of people entered in the month. Stay Percentage per hour: The hourly percentage of people remaining in the month. [Yearly Report] In Percentage per month: The monthly percentage of people entered in the year. Out Percentage per hour: The hourly percentage of people entered in the year. Stay Percentage per hour: The hourly percentage of people remaining in the year. 34 5 Accessing Face Counting Page Chapter 5 Accessing Face Counting Page After the GV-Web Report Service is started, you can access the counts, graphics and live video on the network. The GV-Web Report is divided into 2 pages, People Counting page and Face Counting page. This chapter describes in details the functions of the Face Counting page. • People Counting page: provides counting data regarding the number of people in, out of, and remaining in the surveillance area. The counting data can be from GV-Systems and GV-Smart Boxes. • Face Counting page: provides face counting data, and gender and age recognition results of people entered the surveillance area. The counting data can be from GVSystems and GV-Smart Boxes. Note: 1. The Face Counting function is only supported in GV-System version 8.4.0.0 or later. 2. For remote viewing through network, Internet Explorer 7.0 or later is required. 5.1 Accessing Face Counts and Graphics To access face counts and gender and age recognition results through the web browser, ensure that Web Service on the GV-Web Report server has been enabled as shown below; otherwise the login through the web browser will fail. Figure 5-1 35 1. Two methods to access the Web interface of GV-Web Report: A. If you are at the local GV-Web Report server, select Browse on the main screen of the GV-Web Report (Figure 3-9) and select GV-Web Report Data. The login page appears. Figure 5-2 B. If you are at a remote computer, start the Internet Explorer browser. Enter the IP address or the domain name of GV-Web Report in the Location/Address field of your browser. The login page appears. 2. Enter the login ID and Password of the GV-Web Report. The ID and Password should match those of any account set in the Account dialog box (Figure 3-11). 3. Enter the characters shown in the image. 4. Click Login. The Web page similar to the following example is now displayed in your browser. Figure 5-3 36 5 Accessing Face Counting Page 5. Click the Face Counting tab on the upper right corner of the Web page. The Web page is switched to the Face Counting page similar to the following example. Figure 5-4 6. To display the graphs, it is required to download Microsoft Silverlight to your computer. Click the link on the page to start downloading the program. 37 5.2 Device Page On the Device page, you can access two types of face counts of the current day. Main page On the main page of the Device page, the face counts of the current day are updated from the GV-Web Report server every minute. See 5.2.1 Viewing the Counts Updated Every Minute. Live View Window On the Live View window, you can view live video from a GV-Smart Box or GV-System. See 5.2.2 Viewing Live Video. 5.2.1 Viewing Face Counts Updated Every Minute The data on the main page of the Device page is updated every minute from the GV-Web Report server. The page displays the face counts and graphs of all connected GV-Smart Boxes and GV-Systems. Figure 5-5 The counts on the main page show: Face counts: The number of people entered and counted based on face images during the day. Male: The number of males entered during the day. Female: The number of females entered during the day. n/a: The number of entered people whose gender failed to be recognized. Total Male Count: The total number of males entered from multiple GV-Smart Boxes and GV-Systems during the day. Total Female Count: The total number of females entered from multiple GV-Smart Boxes and GV-Systems during the day. 38 5 Accessing Face Counting Page On the left menu, you can find these options: Total List: Select one GV-Smart Box or GV-System under the list to see its individual face counts. A green mark indicates that the device is now updating data to the GV-Web Report server; otherwise a red mark appears. On the individual device’s page, the face counts of the current day are updated every minute from the GV-Web Report server. Camera: Access the live video if remote access is enabled on both the device and GV-Web Report server. See 5.2.2 Viewing Live Video. Figure 5-6 5.2.2 Viewing Live Video To access live video, select the desired camera from the left menu of the Device page. Make sure remote access to GV-Systems and GV-Smart Boxes has been enabled on GV-Web Report. See 3.6.3 Remote Access settings for details on how to allow remote access. You will also need to enable Webcam Server on the GV-System. See Chapter 8, DVR User’s Manual on the Surveillance System Software DVD. Figure 5-7 By clicking the icon on the Live View window, you can view the live video from the GV- Smart Box or GV-System. 39 5.3 Group Page On the Group page, you can group different cameras from different GV-Smart Boxes and GV-Systems, and then see the face counts of the set group. To set up a group: 1. Select Add Group from the left menu of the Group page. This page appears. Figure 5-8 2. Name the group. 3. Select the cameras that you want to include in the group. 4. Click Submit. 5. From Total List in the left menu, select the set Group to see the sum of every face count from those selected cameras. On the left menu of the Group page, you can find these options: Total List: Access the face counts of the set groups updated every minute from the GV-Web Report server. Manage Group: ~ Add Group: Select this option to set a group. ~ Maintain Group: Select this option to modify the group setting or delete a group. 40 5 Accessing Face Counting Page 5.4 Log Page On the Log page, you can view the gender and age recognition results of a specified time period and the snapshots from GV-Smart Boxes and GV-Systems. Figure 5-9 To search the log data: 1. Select a specific GV-Smart Box or GV-System from the Device drop-down list or a created group from the Group drop-down list. 2. Specify Gender and Age of the log data. 3. Specify Start Time and End Time of the log data. 4. You can select whether to search the DST (Daylight Saving Time) data. Select All indicates searching all data including DST data, Y indicates searching only DST data and N indicates not searching DST data. 5. Click Query to display the search results. Gender: You can view the gender of the person entered. N/A appears when the GV-Smart Box or GV-System fails to recognize the gender. You can also manually specify the gender with the drop-down list if necessary. The modified data will be updated to the database of the GV-Web Report. Age: You can view the age range of the person entered. You can also manually specify the age group with the drop-down list if necessary. The modified data will be updated to the database of the GV-Web Report. Image Snapshot: You can view the snapshot of the person entered by clicking the icon. To back up the found log data in EXCEL and WORD format, click the icons in the bottom of the Query Result List. 41 5.5 Query Page The Query page provides you with the daily, weekly, monthly and yearly face counting graphs and tables. To search the face counting data, select a GV-Smart Box or GV-System from the Device drop-down list or a created group from the Group drop-down list, specify a date, and select the following options below. Use the Chart drop-down list above the graphs to choose to display the data using bar graph, pie graph or line graph. Note: Pie graph is not available for the following types of data. • Male Female Count per 60 Minutes • Total Male and Female count per 60 Minutes • Age range Count per 60 Minutes • Total range Count per 60 Minutes. [Daily Report] Display the face counting report of the specified date. Male/Female count per 60 minutes: The hourly number of males and females entered during the day. Total male and female count per 60 minutes: The hourly accumulated number of males and females entered during the day. Male and female percentage: The total number and the percentage of males and females entered during the day. Age range count per 60 minute: The hourly number of people of each age range entered during the day. Total Age range count per 60 minutes: The hourly accumulated number of people of each age group entered during the day. Age range percentage: The total number and the percentage of people of each age range entered during the day. 42 5 Accessing Face Counting Page The following figure is an example of the Male/Female count per 60 minutes option. The value 9, 5 indicates the count of males until 9 am is 5. Figure 5-10 [Weekly Report] Display the weekly report that contains the data of 7 days before your specified date. Male count percentage: The daily number and the percentage of males entered for the week. Female count percentage: The daily number and the percentage of females entered for the week. Male and female percentage: The total number and the percentage of males and females entered for the week. Age range percentage: The total number and the percentage of people of each age range entered for the week. 43 The following figure is an example of the Age range percentage option. The value 30 ~ 35, 321 (32.96%) indicates the number of 30 ~ 35 year-olds entered is 321. 30 ~ 35 year-olds takes up 32.96 percent of all persons entered that week. Figure 5-11 44 5 Accessing Face Counting Page [Monthly Report] Display the monthly report that contains the data of a month before your specified date. Male count percentage: The daily number and the percentage of males entered for the month. Female count percentage: The daily number and the percentage of females entered for the month. Male and female percentage: The total number and the percentage of males and females entered for the month. Age range percentage: The total number and the percentage of persons of each age range entered for the month. [Yearly Report] Display the yearly report that contains the data of a year before your specified date. Male count percentage: The monthly number and the percentage of males entered for the year. Female count percentage: The monthly number and the percentage of females entered for the year. Male and female percentage: The total number and the percentage of males and females entered for the year. Age range percentage: The total number and the percentage of people of each age range entered for the year. 45 Chapter 6 Mobile Phone Connection Using iPhone, iPad or other mobile devices with built-in Android OS, you can view people counting and face counting results on your mobile phone. After logging in, you can query the data and chart for people counting and face counting results. 1. On your mobile device, type the IP address of the GV-Web Report server in the address field of the browser. The login dialog box appears. Figure 6-1 2. Type the account ID and password. 3. Click Login. The People Counting results for that day appear. Figure 6-2 46 6 Mobile Phone Connection 4. To see the data of other devices, tap the Device drop-down list. 5. To see graphs of the results, tap the Chart tab on the top. This window appears. Figure 6-3 6. Tap the Date drop-down list to select a date and tap the Device drop-down list to select a device. 7. Use the Type drop-down list to display the results of that day, week, month or year. 8. To switch to Face Counting results, tap the People Counting button on the top-right corner and select Face Counting. The Face Counting results for that day appear. Figure 6-4 47 9. To see the data of other devices, tap the Device drop-down list. 10. To see graphs of the results, tap the Chart tab on the top. This window appears. Figure 6-5 11. Tap the Date drop-down list to select a date and tap the Device drop-down list to select a device. 12. Use the Type drop-down list to display the results of that day, week, month or year. 48 Appendix Appendix A. Enabling UPnP in Windows XP 1. Go to Windows Start, click Start button, select Settings, and select Network Connections. This window appears. 2. Right-click one Local Area Connection, select Properties, and click the Advanced tab. This dialog box appears. 3. Click the Settings tab, and click Exceptions tab. This dialog box appears. 4. Select UPnP Framework, and click OK. 49 B. Modifying Port Number for running GV-Web Report on the same computer with GV-System Since the GV-Web Report server and the WebCam Server of GV-System use the same HTTP port number of 80 to connect to the Web, it is required to modify the port number of either GV-Web Report or WebCam Server if the two are run on the same computer. If not, the following message will appear and you cannot access the Web interface of the GV-Web Report server: Starting Web Server Failed To modify the HTTP port number of GV-Web Report: 1. Click Tools from the menu bar and select General Setting. 2. In the Web Server section, change the default Listen Port of 80 to a different port number within the range of 1024 to 65535. 3. Click Apply. 50