1
THE EFFECTS OF IMPLEMENTING AN INTERACTIVE STUDENT
RESPONSE SYSTEM IN A COLLEGE ALGEBRA CLASSROOM
By
Dina L. Blodgett
B.S. University of Southern Maine, 2002
B.S. The University of the State of New York, 1994
A THESIS
Submitted in Partial Fulfillment of the
Requirements for the Degree of
Master of Science in Teaching
The Graduate School
The University of Maine
May 2006
Advisory Committee:
Dr. John E. Donovan II, Assistant Professor of Mathematics Education, Advisor
Dr. Robert Franzosa, Professor of Mathematics
Dr. John R. Thompson, Assistant Professor of Physics
LIBRARY RIGHTS STATEMENT
In presenting this thesis in partial fulfillment of the requirements for an advanced
degree at The University of Maine, I agree that the Library shall make it freely available
for inspection. I further agree that permission for “fair use” copying of this thesis for
scholarly purposes may be granted by the Librarian. It is understood that any copying or
publication of this thesis for financial gain shall not be allowed without my written
permission.
Signature: ____________________________
Date: ________________________________
THE EFFECTS OF IMPLEMENTING AN INTERACTIVE STUDENT
RESPONSE SYSTEM IN A COLLEGE ALGEBRA CLASSROOM
By Dina L. Blodgett
Thesis Advisor: Dr. John E. Donovan II
An Abstract of the Thesis Presented
in Partial Fulfillment of the Requirements for the
Degree of Master of Science in Teaching
May 2006
During the spring 2005 semester at The University of Maine, an interactive
student response system was implemented in a traditional college algebra (MAT 111)
lecture classroom. This thesis studies the effects of this implementation.
First, to determine if the use of an interactive student response system increases
academic achievement in college algebra, a common exam was administered to five
sections of MAT 111 after the 4th week of instruction. Four sections comprised the
control group and one section the treatment group. Prior to the exam, the control group
received traditional lectures, while the treatment group received instruction that included
use of an interactive student response system. Statistical analysis of the exam scores
revealed that the treatment groups’ mean scores were not statistically significantly higher
than the control groups’ mean scores. However, a time constraint, which limited the
interactive system’s use, as well as variations between MAT 111 sections may have
affected the results of this study.
Second, to determine students’ attitudes toward the interactive student response
system (Qwizdom), a preliminary questionnaire, an attitude survey, and a post-study
continuation survey were administered to the treatment group. Although there were
technical problems with the system, the students’ attitudes were positive otherwise.
Overall, students generally liked using Qwizdom and felt that they had benefited from its
use. The surveys revealed that students perceived that the use of Qwizdom provided
problem-solving practice, increased their understanding and was a good learning tool,
increased attentiveness, and made math more interesting and fun. Furthermore, the
system’s anonymity encouraged participation in class. However, the attitude survey also
revealed that the use of the interactive system had no affect on class attendance.
Third, to determine the instructor’s attitude toward the interactive student
response system, my thoughts were recorded in a daily journal throughout this study. In
particular, I feel that Qwizdom’s Interactive Learning System is a well-designed, userfriendly, and versatile wireless response system. Although we experienced some
technical problems with the system, these problems have been, or can be, resolved with
further programming and system upgrades. In general, I enjoyed using the interactive
system because the students enjoyed using it and it provided an interactive component
that previous classes I had taught were lacking. When not using the system, the students
in this study did not ask many questions and generally appeared uninterested in the
lecture material. When using the system, however, the students were engaged and
appeared to be having fun – a positive atmosphere I believe most instructors would
prefer. Unfortunately, due to the fast pace, set schedule, and predefined curriculum of
MAT 111 at The University of Maine, I do not believe that this traditional course is an
ideal setting for an interactive student response system, however.
To conclude, I review the results of the study regarding academic achievement,
students’ attitudes, and instructor’s attitude to conjecture if the interactive student
response system is an effective tool for instruction in a traditional college algebra lecture
environment. I also explore ideas and questions for future research studies.
ACKNOWLEDGEMENTS
First, I want to thank Dr. John Donovan, Dr. Bob Franzosa, and Dr. John
Thompson for being on my committee. Special thanks to the chair, John Donovan, for
his leadership, advice, and words of encouragement. He has been an excellent mentor
and role model, and I am honored to have had the opportunity to work with him.
Next, I want to thank the MST faculty and my fellow MST students and for their
academic and moral support. I also want to thank Dr. Phil Pratt for his assistance in
analyzing SAT scores, as well as the students who participated in this study.
Thanks also to Cathy Michels at Qwizdom, Inc. for her assistance with the new
Interact software.
Finally, I want to thank Sandra Smith for her editing assistance and tireless
support throughout the course of this research project.
ii
TABLE OF CONTENTS
ACKNOWLEDGEMENTS ........................................................................................................................................... ii
LIST OF TABLES .........................................................................................................................................................vii
LIST OF FIGURES ......................................................................................................................................................viii
CHAPTER 1 - INTRODUCTION................................................................................................................................ 1
CHAPTER 2 – LITERATURE AND TECHNOLOGY REVIEW ......................................................................... 3
Introduction................................................................................................................................................................ 3
Interactive Student Response Systems................................................................................................................... 4
History of Interactive Student Response Systems ........................................................................................... 4
Qwizdom’s Interactive Learning System.......................................................................................................... 6
Previous Studies with Interactive Student Response Systems........................................................................... 8
Studies Referenced by Qwizdom, Inc. .............................................................................................................. 9
Additional Studies............................................................................................................................................... 23
Conclusion................................................................................................................................................................ 24
CHAPTER 3 – METHODOLOGY ............................................................................................................................ 26
The Research Context ............................................................................................................................................. 26
The Research Participants...................................................................................................................................... 27
Control Group...................................................................................................................................................... 28
Treatment Group ................................................................................................................................................. 29
Data Collection ........................................................................................................................................................ 31
Data Collection – Academic Achievement..................................................................................................... 32
Data Collection – Students’ Attitudes ............................................................................................................. 33
Preliminary Questionnaire............................................................................................................................ 33
Attitude Survey.............................................................................................................................................. 34
Post-study Continuation Survey.................................................................................................................. 35
Data Collection – Instructor’s Attitude........................................................................................................... 35
iii
Data Analysis ........................................................................................................................................................... 35
Data Analysis – Academic Achievement........................................................................................................ 36
Statistical Tests............................................................................................................................................... 36
Data Analysis – Students’ Attitudes ................................................................................................................ 37
Preliminary Questionnaire............................................................................................................................ 37
Attitude Survey.............................................................................................................................................. 38
Post-study Continuation Survey.................................................................................................................. 38
Data Analysis – Instructor’s Attitude.............................................................................................................. 38
Summary of Methodology..................................................................................................................................... 38
CHAPTER 4 – ACADEMIC ACHIEVEMENT...................................................................................................... 40
Review of Findings................................................................................................................................................. 40
Discussion of Results.............................................................................................................................................. 42
CHAPTER 5 – STUDENTS’ ATTITUDES ............................................................................................................. 45
Preliminary Findings............................................................................................................................................... 45
Attitude Survey Results .......................................................................................................................................... 46
Likert Scale Statements...................................................................................................................................... 46
Open-Response Questions................................................................................................................................. 55
Summary of Findings from Preliminary Questionnaire and Attitude Survey............................................... 63
Post-study Continuation Survey Results and Other Findings.......................................................................... 64
CHAPTER 6 – INSTRUCTOR’S ATTITUDE........................................................................................................ 66
Time -Related Issues ................................................................................................................................................ 66
System Setup........................................................................................................................................................ 66
System Use........................................................................................................................................................... 67
Coverage of Required Material......................................................................................................................... 67
Attitude in General.................................................................................................................................................. 69
iv
CHAPTER 7 – CONCLUSION.................................................................................................................................. 70
An Effective Tool for Instruction?....................................................................................................................... 70
Ideas and Ques tions for Future Studies ............................................................................................................... 72
Qwizdom’s Lesson Slides.................................................................................................................................. 72
Qwizdom’s Radio Frequency Remotes........................................................................................................... 72
Qwizdom’s Interactive Games.......................................................................................................................... 72
The Novelty Factor ............................................................................................................................................. 73
Time Constraint and Variations between Sections........................................................................................ 73
Multiple-Choice versus Open-Response Questions...................................................................................... 73
Qwizdom in a Non-traditional Lecture Environment ................................................................................... 73
Final Remarks .......................................................................................................................................................... 74
BIBLIOGRAPHY.......................................................................................................................................................... 75
APPENDICES................................................................................................................................................................ 78
Appendix A: One-way ANOVA of SAT Scores Descriptives ........................................................................ 79
Appendix B: Common Exam #1........................................................................................................................... 80
Appendix C: Raw Data – Exam Scores ............................................................................................................... 87
Appendix D: Student Attitude Survey................................................................................................................. 89
Appendix E: Instructor’s Experiences using Qwizdom................................................................................... 97
Interact Software Program................................................................................................................................. 97
Curriculum Packages.......................................................................................................................................... 97
Technical Problems – Resolved........................................................................................................................ 98
Importing Class Lists .................................................................................................................................... 98
Login ID .......................................................................................................................................................... 99
Curriculum Folder Organization ...............................................................................................................100
% Wrong Flag ..............................................................................................................................................100
Remotes .........................................................................................................................................................101
v
Technical Problems – Unresolved..................................................................................................................102
Logging In .....................................................................................................................................................103
Remotes .........................................................................................................................................................104
Slide editor screens......................................................................................................................................106
Grade Book...................................................................................................................................................106
Overall Attitude towards Qwizdom...............................................................................................................106
BIOGRAPHY OF THE AUTHOR...........................................................................................................................107
vi
LIST OF TABLES
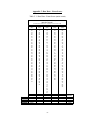
Table 1: One-way ANOVA of SAT Scores (alpha = .05)...................................................................................... 28
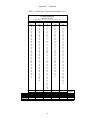
Table 2: Statistical Analysis of Variances (F-test)................................................................................................... 41
Table 3: t -test for Independent Samples .................................................................................................................... 42
Table 4: Likert Statement Results............................................................................................................................... 47
Table A. 1: One-way ANOVA of SAT Scores Descriptives ................................................................................. 79
Table C. 1: Raw Data - Exam Scores (entire exam) ................................................................................................ 87
Table C. 2: Raw Data - Exam Scores (chapters 1 & 2) ........................................................................................... 88
vii
LIST OF FIGURES
Figure 1: Qwizdom's Q3 Student Remote ................................................................................................................... 7
Figure 2: Qwizdom's Q3 Instructor Remote ............................................................................................................... 7
viii
CHAPTER 1 - INTRODUCTION
At The University of Maine, College Algebra (MAT 111) is typically taught using
a traditional lecture-style format (procedural content is emphasized), with little or no
interaction between the students and between the students and the teacher (i.e. passive
learning). In this thesis, I will report on research conducted to study the effects of
implementing an interactive student response system in a MAT 111 class to determine if
it is an effective tool for instruction in a traditional college algebra lecture environment.
In my experience as a student and a mathematics lecturer, the content of lectures
often is directly extracted from the text. In addition, the traditional lecture style includes
only superficial, if any, student interaction between the students and between the students
and teacher. I suspect that for most students, this makes it very difficult to remain
interested and attentive during class, and may often result in decreased attendance. For
example, in high school, I found I could do well on most exams by studying the textbook
on my own, and that my attendance did not increase my understanding of the subject. As
a college undergraduate, I found class attendance to be critical as many of my
undergraduate classes consisted of the instructor telling us, at a very fast pace, what we
needed to know. Consequently, I spent the entire class period trying to capture, in my
notes, everything that the instructor said or demonstrated, leaving no time for me to
process the information. As a result, I was unable to recognize confusing concepts and to
ask questions during the lecture. In fact, questions were rarely, if ever, asked by the
students or by the instructor; there was little or no classroom interaction.
As a teacher, I would like to incorporate more interaction in my classrooms,
avoiding, or at least minimizing, the traditional passive lecture environment that I
1
experienced as a student. I believe the use of interactive technology is one way to
accomplish this.
In this research study, I investigated the following questions :
1. Does the use of an interactive student response system increase academic
achievement in college algebra, as measured by standard exams?
2. What are students’ attitudes towards the interactive student response system?
3. What is the instruc tor’s attitude towards the interactive student response system?
4. Overall, is an interactive student response system an effective tool for instruction
in a traditional college algebra lecture environment?
2
CHAPTER 2 – LITERATURE AND TECHNOLOGY REVIEW
Tell me, I forget.
Show me, I remember.
Involve me, I understand.
Chinese proverb
Introduction
Driscoll (2002) uses the preceding Chinese proverb to illustrate “the importance
of getting learners mentally involved in learning activities, generating connections
between what they already know and what they are being asked to learn, and constructing
meaning from their experiences” (p. 2). As this proverb suggests, learning is active.
Moreover, learning is social. Piaget (1976) considered the role of social interaction in
learning and argued, “social interaction is a necessary condition for the development of
logic” (p. 80). Likewise, “Mathematics is inherently a social activity” (Schoenfeld, 1992,
p. 335).
Brown & Palincsar (1989) discuss the active and social aspects of learning, and
argue that it is necessary to reconsider the traditional lecture format, where the teacher
lectures at the board and students sit passively at their desks, and to give serious
consideration to a type of interactive learning known as reciprocal teaching. In reciprocal
teaching students are typically in small groups discussing a problem or task. As students
master a task, they become teachers to those who are still learning. Furthermore, Lloyd
(1999) cites three studies that support this type of interactive learning and states, “When
students work in groups to communicate their ideas and questions, agree and disagree
3
among themselves, and negotiate joint theories and ideas, rich mathematical learning can
occur” (p. 228).
Interactive Student Response Systems
As the references above point out, learning is active and social. In other words,
learning is interactive. One way to incorporate interactive learning in the classroom is
with the use of interactive student response systems, including variations known as
classroom communication systems, classroom performance systems, personal response
systems, student response systems, wireless response systems, and electronic response
systems.
Interactive student response systems use wired or wireless communication
systems in which the students are able to answer questions electronically while in the
classroom. One advantage of this approach is that students are able to get immediate
feedback to their answers, either in the form of a histogram showing class results, and/or
as a signal on their individual remotes/keypads. This immediate feedback can then be
used in reciprocal teaching, where the students learn from each other by discussing their
correct/incorrect answers in collaborative groups. The interactive system also informs
the instructor, in real time, of student understanding, which enables him/her to focus on
misconceptions and concept areas that are confusing. Of course, this depends on the
questio n asked. For example, asking, “Do you understand this,” and getting a reply of
“yes” does not guarantee understanding.
History of Interactive Student Response Systems
According to Judson & Sawada (2002), “The use of electronic response systems
in large lecture courses, particularly science classes, can easily be dated to the
4
1960s” (p.168). These systems were hard-wired, and consisted of knobs or buttons
mounted at the students’ seats. The instructor station had gauges that indicated the
percentage of students responding to each choice on a particular multiple-choice
question. The goal of these early systems is also a goal of modern systems - instant
feedback.
Research from the 1960s and 1970s did not support an increase in student
achievement, as measured by standard exams, when electronic response systems were
used (Judson & Sawada, 2002). However, despite the lack of evidence of increased
academic achievement, Judson & Sawada cite several studies that show students’
endorsement of the system. In those studies, “positive attitude toward the class, feeling
of the usefulness of the system, acceptance of the system, and feeling of increased
understanding were all highly supported by the student survey data” (p. 173).
Research that is more recent, particularly from the 1990s, also shows student
support for the systems, but “the issue of academic achievement remains open” (Judson
& Sawada, 2002, p. 175). For example,
In the 1990s investigations reporting student academic achievement were
found only within the discipline of physics. The use of electronic
response systems was not a distinct characteristic among high achieving
physics courses, however, electronic response systems were viewed as one
mechanism to elevate student interaction in large lecture halls. Among
physics studies, improved student achievement was detected when the
pedagogy was distinguished as constructivist in nature, thus promoting
interactive engage ment among students. (p. 176)
5
Examples of physics investigations that support the claim that electronic response
systems promote academic achievement include studies by Hake (1998) and Mazur
(1997), both of which I review later.
Interactive student response systems have evolved from wired systems that
required a dedicated classroom to portable one-way and two-way wireless systems.
Classtalk, a wired system developed by Better Education, Inc., was a very common
system used in research studies of the 1990s. Better Education, Inc. has discontinued
Classtalk, but there are other wireless systems, such as CPS by eInstruction and PRS by
EduCue Inc., replacing this popular system. Another popular system, and the one used in
this study, is the Interactive Learning System by Qwizdom, Inc.
Qwizdom’s Interactive Learning System
Qwizdom’s Interactive Learning System is a wireless response system that uses
two-way (send and receive) infrared or radio frequency communication to provide instant
assessment and feedback to every participant in a classroom setting.
Qwizdom currently has three different systems that use either the Q3 (infrared),
Q4 (radio frequency), or Q5 (radio frequency) remotes. It is the Q3 version that we used
in this study, and the one that I describe here.
The Qwizdom Q3 system consists of interactive software (Interact), a receiver
unit that attaches to the USB port of any computer, an instructor remote, and a specified
number of response (student) remotes. Up to 255 student remotes can be used at once,
with a working range up to 100 feet (Qwizdom.com, 2004).
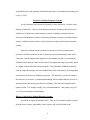
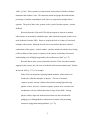
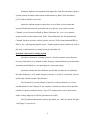
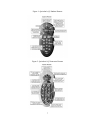
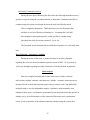
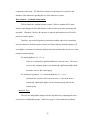
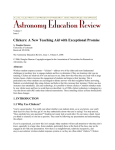
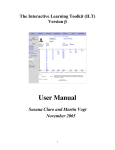
The Q3 student and instructor remotes (Qwizdom, Inc., 2004) are shown in Figure
1 and Figure 2, respectively.
6
Figure 1: Qwizdom’s Q3 Student Remote
Figure 2: Qwizdom’s Q3 Instructor Remote
7
The keypad on the student remote enables the student to log into the system by
ID, and to answer multiple choice, true/false, numeric, or yes/no questions. The student
remote also has instant visual feedback via a LED flashing light. At the discretion of the
instructor, the students may receive immediate confirmation if their response is correct
(green “right” LED) or incorrect (red “wrong” LED). The student s’ individual responses
are anonymous, but the class results may be displayed in the form of a histogram (i.e. bar
graph) for group discussion.
The instructor remote frees the instructor from the computer and enables him/her
to present activity slides, randomly call on individuals, display summaries of responses or
scores (e.g. bar graphs), play or pause audio and video, and spontaneously pose questions
from anywhere in the room (Qwizdom.com, 2004). The presentation of activity slides is
very similar to a Microsoft PowerPoint presentation. In fact, the Qwizdom Interact
software enables you to import PowerPoint slides into a Qwizdom activity.
Qwizdom offers a variety of ready-to-use curriculum packages. Packages include
pre-made lessons; quizzes; review activities; learning games; photographs, illustrations,
and animations; and hundreds of question and answer sets. All content can be edited and
used in any of the software’s presentation or printing formats (Qwizdom, Inc., 2004,
product brochure).
Previous Studies with Interactive Student Response Systems
In their literature Qwizdom, Inc. refers to several studies which show that when
“using a system like the Interactive Learning System – students: understand subjects
better, enjoy class more, come to class prepared, pay more attention in class, and most
importantly show dramatic learning gains” (Qwizdom Inc., 2004, product brochure). In
8
addition, “independent studies show that interaction and learning increase when keypads
are used” (Qwizdom.com, 2004, software/remotes p. 2).
Interestingly, none of the referenced studies (discussed below) actually used
Qwizdom’s Interactive Learning System. Qwizdom, Inc. acknowledged that fact with the
following disclaimer, “Many of these articles refer to radio frequency response units
which cost significantly more than Qwizdom's response system but have almost identical
functionality…” (Qwizdom.com, 2004, software/remotes p. 2).
Studies Referenced by Qwizdom, Inc.
The studies referenced by Qwizdom, Inc. are summarized in the following
paragraphs, and include: Mazur (1997), Burnstein & Lederman (2001), Hake (1998),
Sokoloff & Thornton (1997), Horowitz (1988), and MacDonald (1999).
In addition to being referenced by Qwizdom, Mazur (1997) is the most referenced
publication that I found for articles discussing active learning and interactive student
response systems in the classroom. In 1991, Mazur began developing what is known as
“Peer Instruction” in his physics classes at Harvard. Many instructors worldwide have
since adopted this method of teaching, which involves students in the teaching process
and focuses their attention on underlying concepts.
Instead of covering the detail normally found in textbook or lecture notes, the
Peer Instruction lectures are comprised of short presentations of key points, each
followed by a ConcepTest (sic). The ConcepTest has the following general format
(Mazur, 1997, p 10).
1. Question posed
1 minute
2. Students given time to think
1 minute
9
3. Students record individual answers (optional)
1-2 minutes
4. Students convince their neighbors (peer instruction)
1-2 minutes
5. Students record revised answers (optional)
6. Feedback to teacher: Tally of answers
7. Explanation of correct answer
2+ minutes
If most students choose the correct answer, then the instructor moves on to the
next topic. If the percentage of correct answers is too low (% up to instructor), the
instructor is immediately aware that s/he should revisit the topic with further explanation
and discussion, so as to avoid students’ confusion.
The convince-your- neighbors (peer instruction) step of the ConcepTest
“systematically increases both the percentage of correct answers and the confidence of
the students” (p. 12). Mazur gives the following explanations for this:
There is always an increase and never a decrease in the percentage of
correct answers. The reason is that it is much easier to change the mind of
someone who is wrong than it is to change the mind of someone who has
selected the right answer for right reasons. The observed improvement in
confidence is also no surprise. Students who are initially right but not
very confident become more confident when it appears that neighbors
have chosen the same answer or when their confidence is reinforced by
reasoning that leads to the right answer. At times, it seems that students
are able to explain concepts to one another more effectively than are their
teachers. A likely explanation is that students who understand the concept
when the question is posed have only recently mastered the idea and are
10
still aware of the difficulties involved in grasping the concept.
Consequently, they know precisely what to emphasize in their
explanation… As time passes and a lecturer is continuously exposed to
the material, the conceptual difficulties seem to disappear and therefore
become harder to address. (pp. 13-14)
In my experience, explaining concepts to others increases my own understanding.
Therefore, I can see where the peer instruction approach of thinking for yourself and
putting your thoughts into words, as well as hearing others’ explanations, would increase
conceptual understanding.
Mazur also stresses that the convince-your- neighbor discussion, and the different
perspectives that his students offer, gives him a feel for how students think and how they
may have reasoned their way to an incorrect answer. This allows him to refocus his
lecture and address the issues that are confusing. The discussions also help him keep in
touch with the class.
To assess students’ learning, Mazur uses the “Force Concept Inventory”
(Hestenes, Wells, & Swackhamer, 1992) and the “Mechanics Baseline Test” (Hestenes &
Wells, 1992). Both of these tests were designed to test students’ conceptual
understanding of Newtonian mechanics. The Force Concept Inventory (FCI) is a
multiple-choice test that probes students understanding of the Newtonian concept of force
by forcing a choice between Newtonian concepts and commonsense alternatives
(preconceptions or misconceptions). This test was given as a pre-test (before instruction)
and a post-test (after instruction). The Mechanics Baseline Test (MBT) is a problemsolving test, which was given after instruction. While the FCI was designed to be
11
meaningful to students without formal training in mechanics and to elicit their
preconceptions about the subject, the MBT emphasizes concepts that cannot be grasped
without formal knowledge about mechanics (Hestenes & Wells, page 159).
Mazur’s results from these tests showed a marked improvement when Peer
Instruction was implemented. The pre and post FCI scores increased from a gain of 8%
in 1990 using the conventional (or traditional) method to a gain of 21% in 1995 using
Peer Instruction. The MBT scores increased from 67% in 1990 using the conventional
method to 76% in 1995 using Peer Instruction (Mazur, 1997, p. 16, Table 2.1). Based on
these results, Peer Instruction seems to be more effective in increasing conceptual
understanding than the traditional lecture style.
Feedback is a very important element in teaching and learning. The more
immediate the feedback the more effective it is. Peer Instruction allows immediate
feedback from student-to- instructor and instructor-to-student. Although a show-of- hands
can be used to elicit responses and tally answers, it is not anonymous and may have
adverse effects on students. An electronic response system, however, gives anonymity to
the students. Mazur chose to implement an interactive student response system called
Classtalk, developed by Better Education, Inc. With this system, students answered the
ConcepTest questions on their hand- held devices. Their responses were immediately sent
to the instructor’s computer and the instructor was then able project the class results for
the entire class to view and discuss. Anonymity was retained since the results displayed
were class results and not individual results.
Mazur makes an interesting and important point regarding textbook problems and
traditional teaching methods. “I don't think we should be satisfied when a student just
12
knows how to plug numbers into an equation in a given situation, how to solve a
differential equation, or how to recite a law of physics. …we need to look deeper than
the standard textbook problem does” (p. 31). Later he goes on to say, “a disturbingly
large fraction of students develop strategies for solving problems without achieving even
the most basic understanding of the concepts involved” (p. 39). In my own experience as
a student in math and physics classes that used traditional methods, doing as many of the
textbook problems as I could and passing exams with similar type problems constituted
success and understanding; I did not necessarily develop a strong conceptual
understanding.
Mazur recognizes that when incorporating the Peer Instruction method it is not
possible to cover the amount of material typically covered in a traditional lecture. Thus,
more responsibility must be given to the students. For example, they must read assigned
material before class. He stresses to his students that they are responsible for all material
in the assigned reading even if he does not cover it in class, and routinely gives
homework problems and exam questions on such topics. He initially enforced this
assigned reading by giving reading quizzes, which counted toward the final grade. The
reading quizzes have since been replaced with web-based assignments to ensure that
students read the material and come to class prepared (Crouch & Mazur, 2001; KimShapiro, Yip, Kerr, & Concannon, 2000). Web-based assignments would eliminate the
class time required for reading quizzes. However, the in-class reading quizzes could
provide an opportunity to implement an interactive student response system. The
response system could then be used to automatically do the grading, freeing the instructor
from this task later.
13
Even though Peer Instruction focuses on conceptual understanding, students must
still understand how to solve problems. Since problem solving has essentially been
removed from the lecture in Peer Instruction, Mazur gives homework assignments and
offers problem-solving sessions to help develop problem-solving skills. In regards to
examinations, he gives conceptual essay questions as well as standard textbook problems.
“Mixed examinations are the best way to make students aware of the increased emphasis
on concepts” (Mazur, 1997, p. 23).
Understanding that students tend to resist change, Mazur devoted a whole chapter
of his book to motivating the students (chapter 3). He begins the first lecture by setting
the tone – announcing to the students that he will not be lecturing straight out of his notes
or out of the textbook. He stresses that it would be a waste of his time and theirs, since
they are fully capable of reading the material on their own. He explains how passive
lectures do not promote learning, and that they need to learn how to be critical thinkers –
to learn how to analyze a situation and not just how to plug numbers into an equation. He
tells the students that he will provide a formula sheet on exams, to discourage
memorization and to provide the opportunity to focus on the meaning of the equations.
Another important point that he makes to his students is that Peer Instruction is
about cooperation and not competition. This applies to the convince-your- neighbor
discussions as well as to the ConcepTests. He tells the students that their performance on
the ConcepTests will not affect their final grade. However, they will be required to
participate. It is reasonable to assume that students will be more apt to interact when they
know that they will not be penalized for an incorrect answer. As Byrnes states, “a child
14
who is engaged in a classroom activity is an active, attentive, curious, willing participant”
(Byrnes, 2001, p. 94).
Mazur’s approach to student motivation deals with establishing a classroom
culture, or classroom norms. In mathematics education, these classroom or social norms
are called sociomathematical norms. Social norms are ways in which members of the
community interact and exchange ideas, while sociomathematical norms are normative
interactions specific to mathematics (Stylianou & Blanton, 2002).
Unfortunately, traditional mathematics classrooms are highly individualistic, and
prone to the social norm of sitting quietly while listening to the teacher. For example,
Young (2002) describes establishing a mathematical community in her classrooms, where
everyone was encouraged to participate with equal value and authority. Students worked
in groups and were expected to explain and justify their solutions, to try to make sense of
others’ explanations, and to think about and discuss alternative solutions. She states that
many students were uncomfortable with this interactive arrangement because such an
approach was so different from their previous (passive) experiences in mathematics
classes. Furthermore, Young states that students often perceive their mathematical
knowledge as something that someone in authority (e.g. teacher, textbook author) has
told them or shown them, i.e. it is someone else’s knowledge. This idea is compounded
in a passive classroom where the students are “told” what they need to know.
A collaborative community, such as Mazur’s Peer Instruction classroom, can
encourage intellectual autonomy, however. “If the students learn how to justify and
explain their solutions (sociomathematical norms) their chances of becoming
intellectually autonomous are increased. Intellectual autonomy occurs when students are
15
encouraged to take responsibility for their knowledge construction in conjunction with
other class members” (Young, 2002).
To continue with the studies referenced by Qwizdom, Burnstein & Lederman
(2001) felt that the traditional passive lecture style in their typically large physics classes
at the Illinois Institute of Technology was ineffective and impersonal. They wanted to
improve the lecture experience by actively involving the students in the lecture. In 1995,
they implemented an interactive student response system manufactured by Fleetwood
Group, Inc. The system consisted of two-way wireless keypads, which were assigned to
each student at the beginning of class so they could enter responses during lecture.
Questions that could be answered by ‘yes’/’no’ or multiple choice (1-10)
were woven into the lecture and made relevant to what just happened or
what was just about to happen. There were also questions to test whether
students prepared for class. When appropriate, peer instruction was
encouraged by asking students to rework a keypad question through
discussion with their teammates (usually two others) and arrive at a
consensual response. (pp 8-9)
The responses were projected for the class in the form of a histogram. The
responses were saved and used later for grading purposes. They awarded 10 points for a
correct answer, 3 points for any answer, and 0 points if no answer was received. They
reduced the weighting of homework problems in the final grade since the keypad
questions could be used to check for understanding of homework concepts.
Burnstein & Lederman used the keypads to check for student preparation by
asking questions pertaining to the assigned reading (reading quizzes). These answers
16
were recorded and used in the final grade. Their motivation was that students would be
more apt to read the material if they knew they would be tested on it with keypad
questions, and thus would come to class better prepared.
Although they did not cite specific studies, Burnstein & Lederman found that
using keypad answers in the final grade increased attendance and attentiveness during the
lecture. “We find that when keypad scores count for greater than 15% of the term grade,
there is a dramatic improvement in attendance that reaches the 80-90% level and, in
addition, the students make genuine attempts to prepare for the reading quizzes and
remain alert throughout the lecture period” (p. 10). Furthermore, by asking questions
during the lecture, the instructors were able to ascertain, in real time, if students
recognized and understood concepts and remembered important facts. This enabled the
instructor to repeat or modify topics to increase understanding.
Hake (1998) and what he calls “interactive engagement” are referred to in many
articles on active learning. In his “six-thousand-student survey,” he surveyed pre/post
test data for 62 introductory physics courses (6542 students) at various institutions. He
categorized the courses into either traditional or interactive engagement (IE), which he
defines as follows:
(a) “Interactive Engagement” (IE) methods as those designed at least in
part to promote conceptual understanding through interactive engagement
of students in heads-on (always) and hands-on (usually) activities which
yield immediate feedback through discussion with peers and/or
instructors, all as judged by their literature descriptions.
17
(b) “Traditional” (T) courses as those reported by instructors to make little
or no use of IE methods, relying primarily on passive-student lectures,
recipe labs, and algorithmic-problem exams.
(c) “Interactive Engagement” (IE) courses as those reported by instructors
to make substantial use of IE methods. (p. 2)
In his study, Hake sought to answer the question, “Can the classroom use of IE
methods increase the effectiveness of introductory mechanics courses well beyond that
attained by traditional methods?” (p. 3). To answer this, he compared pre- and post-test
data of T versus IE courses using the Force Concept Inventory (FCI) (Hestenes, Wells, &
Swackhamer, 1992) and post-test data from the Mechanics Baseline Test (Hestenes &
Wells, 1992).
Hake developed the average normalized gain to measure the effectiveness of a
course in promoting conceptual understanding. He defined average normalized gain to
be the ratio of the actual ave rage gain to the maximum possible average gain. He found
this quantity to be a figure of merit for the FCI: courses that made substantial use of IE
methods achieved almost two standard deviations of average normalized gain above that
of traditional courses. He concluded by stating that comparison of traditional and IE
courses implies that IE methods enhance problem-solving ability and that the classroom
use of IE methods can increase the effectiveness of introductory mechanics courses well
beyond that attained by traditional methods (which answered his initial research
question).
Although Hake did not actually mention classroom communication systems in his
research, the idea still applies since their use would fall under “Interactive Engagement.”
18
In fact, some of his data sources, such as Mazur (1997) – discussed earlier, did use such
systems.
Sokoloff & Thornton (1997) discuss the use of microcomputer-based Interactive
Lecture Demonstrations (ILDs) to increase student involvement in physics classes at the
University of Oregon and at Tufts University. The ILDs consist of a sequence of
physical experiments, which are demonstrated using microcomputer-based laboratory
(MBL) tools. The students make a prediction of what they think will happen and discuss
their predictions with others in their group. They then record their final prediction, which
consequently may have changed based on the discussion in their group. After eliciting
student predictions from the entire class, the instructor carries out the demonstration, and
the results are discussed. The instructor then discusses other physical situations that are
based on the same concepts, thus increasing conceptual understanding.
The ILD method is not quite the same thing as the interactive student response
system that we are investigating, but it does support the use of active learning and
interactive engagement. In their article, Sokoloff &Thornton mention that other
researchers have used a similar procedure (to their ILD method) to engage their students
during lecture using student reasoning or problem solving. “A number of these other
strategies involve a system that collects individual student responses and feeds them into
a computer for display to the instructor and, if desired, to the class” (p. 341). Mazur
(1997) is mentioned as one example of this.
Using the Force and Motion Conceptual Evaluation (Thornton & Sokoloff, 1998)
to assess conceptual understanding of kinematics and dynamics, Sokoloff & Thornton
found that after traditional instruction, introductory students did not commonly
19
understand these fundamental concepts. However, their studies showed improved
learning and retention of these concepts by students who participated in ILDs.
Horowitz (1988) describes the Advanced Technology Classrooms developed at
the IBM Corporate Management Development Center. The student response system is a
major component in these classrooms. “This system enables each student to participate
by responding to questions during the learning process. This interactive process was
designed to increase the students’ attentiveness, aid in individual knowledge discovery
and increase retention of key learning points” (paragraph 2).
The prototype classroom incorporated a wired student response system by
Reactive Systems, Inc., that included keypads that allowed the students to answer yes/no,
true/false, multiple choice, numeric entry, and rating type questions. In this classroom,
the facilitator used the keypads to solicit responses. Students were often put into groups,
where each group answered questions and the results from each group were displayed to
the class. The group response sequences “further stimulate interest by promoting healthy
competition among groups. The ‘Game’ environment creates a peer pressure to
participate and the desire to win encourages higher levels of attentiveness in order to
provide correct answers and contribute to the success of the Group ” (paragraph 23).
Horowitz compares traditional and interactive classroom environments in areas
such as student interaction, reaction, attentiveness, and retention. In the traditional
(lecture-style) classroom environments, he observed that
Participation was not evenly distributed among students. In a typical
class, between 10 and 20 percent of the students dominated the discussion,
i.e., these vocal students asked the most questions, offered most of the
20
unsolicited comments and were more likely to volunteer to answer the
questions posed by the instructor. The remaining 80 to 90 percent of the
students contributed only occasionally to the discussion unless specifically
asked to do so by the instructor. (paragraph 6, observation 4)
Students’ apparent interest and attentiveness while course material was
presented tended to decrease during pure lectures which did not encourage
student participation and increased as the instructor served more as a
facilitator/enabler who encouraged students towards interaction and
participation. (paragraph 6, observation 5)
Horowitz also observed attentiveness, and developed an index scale to measure it.
An index of 100 indicates attentiveness of every student at every
observation point. In the lecture style, this index was 47 or just under half
of the class. This index of attentive behavior increased to 68 for the class
taught with facilitation style. (paragraph 12)
The level of attentiveness increased even further in classrooms that combined
facilitation with student response systems where an index of “83” (paragraph 28) was
found.
In terms of retention, test scores were higher in the interactive environment –
“from the 19 percent improvement reported for the facilitation style to 27 percent when
this style was coupled with the student response system” (paragraph 28).
Students were also surveyed to determine the ir reaction to the interaction and
feedback provided by the student response system. Using a scale of 1 to 7, where 1
indicates a strong vote for the traditional approach, 7 indicates a strong vote for the
21
student response system, and 4 represents an equal attitude between the two classroom
approaches. “The results were a 6.6 out of 7 in favor of student response systems ”
(paragraph 29).
Based on his experiments and findings, Horowitz concluded that interactive
classrooms, which use student response systems, imp rove the learning process.
MacDonald (1999) discusses ways to improve audience participation in meetings,
but some of the issues he addresses could pertain to a classroom as well. The author, a
facilitator with the Central Intelligence Agency (CIA), discusses interactive response
keypad systems as one of four technologies that facilitators might use to increase the
efficiency and effectiveness of group activities. He mentions that these keypad systems
are more effective than a show of hands when trying to get participants’ inputs in a group
setting. The keypads allow the responses to be anonymous, which may affect the number
of responses as well as the response itself. The keypads also give every member a chance
to participate, which may be difficult to accomplish in a traditional setting, especially
when the group is large.
The following is a partial list of the advantages of interactive response keypads
mentioned by MacDonald (section 2, paragraph 3):
• Keeps your session participants involved – active participants stay alert, learn
and retain more information – especially in large groups.
• Provides instant feedback – find out their opinions, what are they thinking?
• Helps promote discussion within the group – individuals who see that their
peers share a common idea are more willing to express their opinions openly –
and helps the facilitator to manage the discussion.
22
Additional Studies
As mentioned earlier, the studies referenced by Qwizdom, Inc. did not actually
use Qwizdom’s Interactive Learning System, but rather, similar systems. In fact, with the
exception of a few testimonials on Qwizdom’s website and product brochure
(Qwizdom.com, 2004; Qwizdom, Inc., 2004, product brochure), at the time of this
literature review I could not find any studies that had explicitly used Qwizdom’s system.
I did, however, find additional studies regarding other interactive student response
systems in physics education (e.g. Dufresne, Gerace, Leonard, Mestre, & Wenk, 1996;
Cue, 1998; Abrahamson, 1999; Nicol & Boyle, 2003; and Beatty, 2004). Since my
research involves implementing an interactive student response system in a college
algebra classroom, I was curious if there were any studies specifically related to
mathematics. At the time that this literature review was completed, only one such study
was found – Cornell University’s GoodQuestions project.
In 2003, Cornell University started researching Mazur’s Peer Instruction method
(Mazur, 1997) in first semester calculus with their GoodQuestions project (Terrell, 2003).
During the fall 2004 semester, I was in email contact with Dr. Maria Terrell
regarding Cornell’s GoodQuestions project. They had a small NSF DUE “proof of
concept” project that experimented with the use of “clickers” (i.e. an interactive student
response system) and what they called “Good Questions” in teaching first semester
calculus. The official results from the project have not been published. However, the
preliminary results (released after the start of my own study), were discussed in a list-serv
email from Dr. Maria Terrell on March 11, 2005:
23
What we have found is that instructors who asked the questions but who
did not have the students discuss their vote – their students did not do any
better than instructors who did not use the questions at all. Instructors
who used questions regularly with peer discussion and re- vote – their
students did measurably better on the common exams. Our conclusion –
using clickers might help the instructor learn what the students’ don’t
know, but just telling them again is not effective, peer instruction is a
better use of time. We also found that the kind of questions you ask
students to discuss is important. Deep conceptual questions rather than
numerical or graphical ‘standard math’ questions were more effective in
helping students do well on both the computational and conceptual parts
of the exams.
As Dr. Maria Terrell discusses above, they found that the questions and “clickers”
alone did not make a difference with the students’ academic achievement. Only when
they incorporated Mazur’s Peer Instruction approach did they notice an improvement.
Conclusion
The studies discussed in this literature review highlight the importance of active
or interactive learning, and how interactive student response systems can be used to
support this type of learning. Many studies have been conducted in Physics using, or
based on, the Peer Instruction method developed by Eric Mazur. Mazur’s method
incorporates group discussion and ConcepTests, which are implemented using an
interactive student response system.
24
Mazur’s Peer Instruction method, using conceptually oriented questions in college
algebra, would be an interesting study to undertake. However, Mazur recognizes that the
amount of material covered in a traditional lecture is not possible when incorporating the
Peer Instruction method. Therefore, to incorporate this method, the pedagogy of MAT
111 would also need to be changed. In this study, we would like to determine how MAT
111 would be affected if we changed only one variable, i.e. including the use of an
interactive student response system without changing the traditional pedagogy of MAT
111. In other words, we would like to determine if the interactive student response
system itself is an effective tool for instruction in a “traditional” college algebra lecture
environment.
25
CHAPTER 3 – METHODOLOGY
This chapter describes the methods used in carrying out the study, with the goal of
answering the following research questions: (1) Does the use of an interactive student
response system increase academic achievement in college algebra, as measured by
standard exams; (2) What are students’ attitudes towards the interactive student response
system; (3) What is the instructor’s attitude towards the interactive student response
system; and (4) Overall, is an interactive student response system an effective tool for
instruction in a traditional college algebra lecture environment?
To investigate these research questions, both quantitative and qualitative methods
are used. To determine if the use of an interactive student response system increases
academic achievement in college algebra, a controlled experiment is performed in which
the control and treatment groups’ exam grades are quantitatively compared and
statistically analyzed. To determine students’ attitudes toward the interactive student
response system, quantitative and qualitative measurements are used, whereas those used
to evaluate the instructor’s attitude are purely qualitative. To conjecture if the interactive
student response system is an effective tool for instruction, the quantitative and
qualitative results of the other research questions are discussed and summarized.
The Research Context
The study took place in college algebra (MAT 111) classrooms at The University
of Maine during the Spring 2005 semester. The University of Maine, located in the town
of Orono – 8 miles north of Bangor, was established as the Maine College of Agriculture
and the Mechanics Arts in 1862. In 1897, the original name changed to The University
of Maine. The University of Maine has approximately 11,400 students from all over the
26
world, and offers 88 bachelor’s degree programs, 64 master’s degree programs, and 25
doctoral programs. The University of Maine is one of New England’s premier
universities; ranked in Kiplinger’s annual 100 best values in public colleges and selected
by the Princeton Review as one of America’s best 361 colleges. Furthermore, The
University of Maine is one of just 151 institutions (4%) nationwide to be classified by the
Carnegie Foundation for the Advancement of Teaching as a “Doctoral Research –
Extensive” university, the highest classification possible (UMaine, 2005).
The Research Participants
The participants are students enrolled in college algebra (MAT 111) during the
Spring 2005 semester at The University of Maine.
There are two groups defined for the purposes of this study – a control group and
a treatment group. The control group includes four sections of MAT 111 (sections 500,
502, 503, and 504) taught by four different instructors, and the treatment group is a fifth
section of MAT 111 (section 501) taught by me. There are approximately 40 students
registered in each section.
The mathematics topics covered in the control and treatment groups were the
same, based on the same course syllabus and textbook (Blitzer, 2002). The exams for
MAT 111 are “common,” meaning that the students from all of the sections take the same
exam at the same time and place. These exams are procedural in nature; comprised of
problems similar to problems discussed in lecture and in the textbook.
To establish that the groups are comparable academically, a statistical analysis
was conducted on the participants’ SAT scores. “The SAT measures critical thinking,
27
reasoning, and writing skills that students develop over time, both in and out of school,
which are related to successful performance in college” (The College Board, 2005).
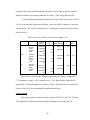
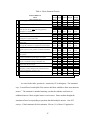
To test the null hypothesis that the mean SAT scores of the five sections of MAT
111 are not statistically significantly different, a one-way ANOVA (analysis of variance)
was performed. The ANOVA descriptives are in Appendix A, and the results are shown
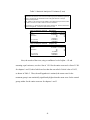
below in Table 1.
Table 1: One-way ANOVA of SAT Scores (alpha = .05)
Sum of
Squares
satv
satm
sat
Between
Groups
Within
Groups
Total
Between
Groups
Within
Groups
Total
Between
Groups
Within
Groups
Total
df
9548.704
1153892.5
51
1163441.2
56
Mean Square
4
2387.176
218
5293.085
F
Sig.
.451
.772
.674
.611
.344
.848
222
14368.438
1161817.2
13
1176185.6
50
4
3592.109
218
5329.437
222
21641.463
3429928.9
41
3451570.4
04
4
5410.366
218
15733.619
222
The ANOVA resulted in the following significance or p values: verbal (satv) =
.772, quantitative (satm) = .661, combined (sat) = .344. Because these values are all
greater than .05, the null hypothesis is retained. That is, the mean SAT scores of the five
sections of MAT 111 are not statistically significantly different.
Control Group
The control group is comprised of four sections of MAT 111 (500, 502, 503, and
504) taught by four different instructors using a traditional lecture approach. By
28
“traditional,” I mean that the instructors lecture from their notes and course textbook with
little or no interaction required by the students.
Even though I taught the treatment group in this study, I am familiar with the
methods used by the control group. During the Fall 2004 semester, I observed another
instructor teaching MAT 111 using the traditional lecture approach, and I subsequently
taught a section of MAT 111 using the same approach.
Several meetings were also held with the instructors of the control group to
discuss any variations in assessment, such as homework and attendance. For example,
some instructors assigned and graded homework, while others left it up to the students to
complete the suggested exercises. Some instructors took attendance, while others did
not. Furthermore, the weighting of various assessment methods varied between
instructors. For example, some instructors had quizzes and exams weigh more heavily
toward the student’s final grade than did other instructors. These variations between
sections are discussed in more detail in Chapter 4, as possible factors contributing to the
results of this study.
Treatment Group
The treatment (or experimental) group consists of one section of MAT 111
(section 501). As the instructor of the treatment group, I used the same notes and lecture
format that I used in my previously taught traditional MAT 111 class, with the addition of
one variable: The common lecture materials were supplemented with interactive
questions and sessions mediated through an interactive student response system
manufactured by Qwizdom, Inc.
29
During these interactive sessions, students answered numerical, true- false, and
multiple-choice questions, via their wireless Qwizdom remote controllers (“remotes”).
The students received immediate confirmation via colored LED lights on their remotes,
indicating correct or incorrect answers. The students’ individual remote responses were
anonymous (available to me, but not available to other students), but a histogram
displayed to the class showed the class results for group discussion. The histogram
showed the students how the rest of the class answered the question. More importantly, it
showed me what fraction of the class understood how to solve the problem and if I
needed to spend additional time covering the material and solution steps.
To receive credit for attending class, students were required to participate in the
Qwizdom sessions. To encourage participation, attendance and class participation
counted for 10% of their overall course grade. Students were not graded on the accuracy
of their answers, but on participation by answering questions with their remotes. I used
the automatic scoring and recording feature of the Qwizdom system to keep track of
student participation. Here is an excerpt from my course syllabus regarding class
participation:
On a daily basis, we will be using an Interactive Student Response System
called Qwizdom. Your answers to questions using this learning tool will
be recorded. You will not be penalized for incorrect answers, but you will
be expected to participate, with 10% of your grade based on this
participation. A separate handout with directions on how to log into the
system will be posted in the [on-line] course conference.
30
I believe this policy helped to ensure the subsequent active participation of the entire
class in responding to questions using Qwizdom. This contrasts strongly with the few
students who typically answer questions in a passive (traditional) lecture environment.
To ensure all students understood how to log into the system, a class handout was
developed, titled “Student Remote and Lo gin.” In this handout (also posted on our
course conference), the complete login process was explained and a digital photograph of
the student remote device (as shown in Chapter 2, Figure 1) was included.
Initially, I had planned to incorporate the interactive questions throughout the
lecture period. For example, in my traditionally taught section the previous semester, I
solved example problems throughout the lecture period to demonstrate the content being
covered that day. Immediately fo llowing my demonstration, students worked on an
example, with volunteers answering the question or describing the problem-solving steps.
For the treatment group, example problems were also solved throughout the lecture
period, but the Qwizdom interactive sessions were limited to the beginning and/or to the
end of each class due to the time involved in setting up the system presentation. I discuss
this in more detail in Chapter 6.
Unfortunately, in order to cover the required material before the first scheduled
exam date, we had to discontinue using Qwizdom at the end of chapter 2, a whole chapter
short of my intended goal. This is discussed further in Chapter 6.
Data Collection
Three different instruments were used in collecting data for this study. First, a
common exam was given to both groups (i.e. all sections of MAT 111), and the mean
31
scores were statistically compared, to determine if academic achievement increased with
the use of the interactive student response system.
Second, three surveys were administered to students in the treatment group to
determine their attitudes toward the interactive student response system. The first survey
was a preliminary questionna ire, administered after the third class period, to probe for
students’ first impressions of the interactive student response system. The second survey
was an attitude survey, administered at the end of the study (after the first exam), to
determine students’ attitudes after having used the interactive student response system.
The third survey was a post-study continuation survey, administered at the end of the
study, to determine if students wanted to continue using the interactive student response
system throughout the rest of the semester, if time permitted.
The third instrument was a daily journal that I kept during the study. This journal
would ultimately assist in determining the instructor’s (i.e. my) attitude toward the
interactive student response system.
Data Collection – Academic Achievement
As discussed earlier, the treatment group consists of one section of College
Algebra (MAT 111), taught by me, during the spring 2005 semester at The University of
Maine. The control group consists of the other four sections of MAT 111, taught by four
different instructors during the spring 2005 semester at The University of Maine.
Following the fourth week of instruction, a common exam was administered to all five
sections of MAT 111. This exam covered chapter 1 (algebra, mathematical models, and
problem solving), chapter 2 (functions and linear functions), and chapter 4 (inequalities
and problem solving) of the course textbook (Blitzer, 2002). This exam was procedural
32
in nature and similar to exams given in MAT 111 in previous semesters. A copy of the
exam is in Appendix B.
The instructors for each section graded the original exams and returned them to
the students. Before returning the exams, the instructors gave copies to me for purposes
of this study. To remove any inconsistencies in grading between instructors, I re-graded
the control group exams for this study. To avoid any inconsistencies in my grading, I
checked only for correctness in the answers given by the students in the applicable
answer blanks (i.e. partial credit was not considered). I determined that a maximum raw
score of 35 was possible for the entire exam and a raw score of 27 was possible for that
portion of the exam related to chapters 1 and 2 (i.e. through problem #21). A separate
raw score was collected for chapters 1 and 2 because the treatment group received
instruction that included use of the interactive student response system while covering
chapters 1 and 2 only. The exam scores, as tabulated raw data, are in Appendix C.
Data Collection – Students’ Attitudes
Preliminary Questionnaire
The interactive student response system (Qwizdom) was introduced to the
students on the first day of class, with interactive sessions beginning on the second day. I
was very interested in their initial reactions and first impressions of the system, so after
the third class period, I asked students to respond in writing to the following questions.
What is your first impression of the Qwizdom Interactive Student
Response System? Do you think you will enjoy using it? Do you think it
will aid in or distract from your learning? Any feedback (positive or
33
negative) you wish to provide is appreciated, and will not affect your
grade in any way! Thanks.
Attitude Survey
At the end of the study, an attitude survey was administered to all students in the
treatment group. The study officially ended at the first common exam (Wednesday,
February 9, 2005). Initially, I had planned to administer the survey immediately
following the exam, but due to revisions, it was administered two weeks later (Friday,
February 25, 2005).
Initially, the survey had several Likert scale statements and an open-response
question, but as I became more familiar with the Qwizdom system during its use in my
MAT 111 classroom, I realized that there were additional survey questions that would
benefit this study. To encourage the students to explore their thoughts and feelings
regarding the system, several open-response questions were added. Blank lines were also
included below the Likert scale statements to give students the opportunity to comment.
The final attitude survey has 14 Likert scale statements (with comments) and 8 openresponse questions. The survey is in Appendix D.
Because the survey is quite long and because I wanted students to spend time
thinking about the questions and their answers, students were asked to take the survey
home rather than using class time to complete it. A better response rate may have
resulted if the surveys were completed during class time, but it was believed that
increased detail and quality of answers would result if students had more time to
complete them. Students were allowed as much time as needed to return the surveys, but
were reminded daily. Ultimately, 23 out of 37 students returned their surveys.
34
Post-study Continuation Survey
During the class period following the first exam, the following anonymous survey
question was given (using the Qwizdom remotes) to determine if students would like to
continue using the system even though the research study had officially ended.
This is completely anonymous. Think about how you feel about Qwizdom
and how its use has affected your learning, etc. Assuming that I will still
take attendance (participation grade); would you like to continue using
Qwizdom (not daily, but as time permits)? Yes or No.
The Qwizdom system automatically recorded their responses so I could tally them
later.
Data Collection – Instructor’s Attitude
During the course of the study, a journal was kept to record my tho ughts
regarding the use of an interactive student response system in MAT 111 in general, as
well as my thoughts regarding Qwizdom’s Interactive Learning System in particular.
Data Analysis
Data was compiled and analyzed for three main areas of study: academic
achievement, students’ attitudes, and instructor’s attitude. Academic achievement was
measured for the control and treatment groups using a common exam, and statistically
analyzed using a t-test for independent samples. Qualitative student attitudes were
obtained in three areas: a preliminary questionnaire given during the third class period; an
attitude survey given following use of the system and first exam; and a continuation
survey, given to determine if the students wanted to continue using the system after
35
completion of the study. The third area of study was the subjective experience and
attitudes of the instructor regarding the use of the interactive system.
Data Analysis – Academic Achievement
With an interactive student response system, I believe students will be more
attentive and engaged in class, and that they will find class to be more interesting and
enjoyable. Ultimately, I believe this increase in interest and attentiveness will reflect
positively on their grades.
Therefore, my research hypothesis posits that students who receive instruction
using an interactive student response system in College Algebra (treatment group) will
score higher on measures of academic performance than students who do not receive this
treatment (control group).
H0 (null hypothesis): µ1 - µ2 = 0
There is no statistically significant difference in mean scores. The mean
score for the treatment group is not statistically significantly higher than
the mean score for the control group.
H1 (alternative hypothesis, i.e. research hypothesis): µ1 - µ2 > 0
Qwizdom has a positive effect on mean score, i.e. the mean score is
statistically significantly higher for the treatment group than for the
control group.
Statistical Tests
The t-test for independent samples tests the hypothesis by comparing the mean
scores for two independent groups. In this test, group 1 is the treatment (Qwizdom)
36
group and group 2 is the control group. These independent groups (or samples) represent
the population of students that may take college algebra in the future.
Since the treatment group received instruction that incorporated the interactive
student response system while covering chapters 1 and 2 only, statistical analyses were
performed for the entire exam and for that portion of the exam that covered chapters 1
and 2. The data analysis feature of Microsoft Excel was used to perform this analysis,
while Coladarci, Cobb, Minium, & Clarke (2004) and Fitz-Gibbon & Morris (1987) were
used as reference guides.
Before the t-test for independent samples could be performed, a statistical analysis
of variances (F-test) had to be conducted to determine if the variances of the control and
treatment groups are statistically significantly different. In the F-test, F is defined as the
variance of scores for control divided by the variance of scores for treatment, where
variable 1 is the control group and variable 2 is the treatment group. The results of these
analyses are discussed in Chapter 4.
Data Analysis – Students’ Attitudes
Preliminary Questionnaire
Of the 40 students registered in the class when the preliminary questionnaire was
administered, 20 students responded.
To analyze the responses from the preliminary questionnaire, the replies were
read and general themes were recorded. These replies and themes are discussed in
Chapter 5.
37
Attitude Survey
Of the 37 students registered in the class after the first exam when the attitude
survey was administered, 23 students returned their surveys.
To analyze the responses from the attitude survey, the replies were read and
reread from which general themes emerged. These replies and themes are discussed in
Chapter 5.
Post-study Continuation Survey
Since the Qwizdom system automatically records answers when using the
remotes, I was able to tally the students’ yes or no responses regarding the continuing use
of Qwizdom. There were 31 (of 37 total) students in class that day, so not everyone was
able to respond to this question using the Qwizdom remotes. This question was also
posted on our on- line course conference, and students were told that they could reply
anonymously, but no additional replies were received. The results of the post-study
continuation survey are discussed in Chapter 5.
Data Analysis – Instructor’s Attitude
To analyze and interpret the instructor’s attitude, the journal entries were read
from which general the mes emerged. These themes are discussed in Chapter 6.
Summary of Methodology
The following four paragraphs summarize the methodology used to answer the
four research questions of this study.
To determine if the use of an interactive student response system increases
academic achievement in college algebra, a common exam was administered to all five
sections of MAT 111. Four sections comprised the control group and one section the
38
treatment group. Prior to the exam, the control group received traditional lectures, while
the treatment group received instruction that included the use of an interactive student
response system (Qwizdom). The results of the academic achievement question are
discussed in Chapter 4.
To determine students’ attitudes toward the interactive student response system
(Qwizdom), a preliminary questionnaire, an attitude survey, and a post-study
continuation survey were administered to the treatment group. The students’ attitudes are
discussed in Chapter 5.
To determine the instructor’s attitude toward the interactive student response
system, I kept a daily journal while preparing for and conducting this study. I discuss my
thoughts regarding the use of an interactive student response system in general, and
Qwizdom in particular, in Chapter 6.
To conclude, in Chapter 7, I review the results of the study regarding academic
achievement, students’ attitudes, and instructor’s attitude to conjecture if the interactive
student response system is an effective tool for instruction in a traditional college algebra
lecture environment.
39
CHAPTER 4 – ACADEMIC ACHIEVEMENT
In this chapter, I discuss the results of the first MAT 111 examination to answer
the following question: Does the use of an interactive student response system increase
academic achievement in college algebra, as measured by standard exams?
Review of Findings
In Chapter 3, it was hypothesized that students who receive instruction using an
interactive student response system in College Algebra (treatment group) score higher on
measures of academic performance than students who do not receive this treatment
(control group). This hypothesis proved to be false. The t-test for independent samples
revealed that the mean exam scores of the treatment group were not statistically
significantly higher, as discussed below.
First, the results of the F-test (statistical analysis of variances) reveal an F value
for the entire exam of 1.257 and an F value for chapters 1 and 2 of 1.210, both of which
are less than the critical value of 1.597, as shown in Table 2. Therefore, the variances of
the control and treatment groups’ scores are not statistically significantly different, and
equal variances can be assumed in the t-test.
40
Table 2: Statistical Analysis of Variances (F-test)
Statistical Analysis of Variances: F-Test
To determine if the variances of the control and treatment groups are statistically significantly
different. Consequently, this will determine which t-test (equal variances or unequal
variances) will be performed.
Note: variable 1 is the control group and variable 2 is the treatment group for this test, where
F = variance of scores for control / variance of scores for treatment.
As shown below, F < Fcritical for Entire Exam and for Chapters 1&2. Therefore, difference in
variances not significant - can assume equal variances in t-test.
F-Test Two-Sample for Variances
Mean
Variance
Observations
df
F
P(F<=f) one-tail
F Critical one-tail
F-Test Two-Sample for Variances
Mean
Variance
Observations
df
F
P(F<=f) one-tail
F Critical one-tail
(Entire Exam)
Variable 1
21.72049689
49.02763975
161
160
1.257022177
0.212509072
1.596750809
(Chapters 1&2)
Variable 1
17.8136646
28.11506211
161
160
1.21022695
0.254880755
1.596750809
Variable 2
23.67567568
39.003003
37
36
Variable 2
19.13513514
23.23123123
37
36
Next, the results of the t-test, using a confidence level of alpha = .05 and
assuming equal varia nces, reveal a t Stat of 1.561 for the entire exam and a t Stat of 1.389
for chapters 1 and 2, both of which are less than the one-tailed t Critical value of 1.653,
as shown in Table 3. Thus, the null hypothesis is retained; the mean score for the
treatment group is not statistically significantly higher than the mean score for the control
group, neither for the entire exam nor for chapters 1 and 2.
41
Table 3: t-test for Independent Samples
Statistical Analysis: t-test for Independent Samples
Group 1 = Treatment (Qwizdom)
Group 2 = Control
alpha = .05 (confidence level or level of significance)
Variances are equal as determined by F-test
H0 (null hypothesis): mean 1 - mean 2 = 0
No statistically significant difference in mean scores. The mean score for treatment
group is not statistically significantly higher than the mean score for control group.
H1(alternative "research" hypothesis): mean1 - mean 2 > 0 (one-tail)
Qwizdom has a positive effect on mean score, i.e. mean score is statistically
significantly higher for treatment group than for control group.
Results (as shown below):
t Stat < t Critical one-tail (for Entire Exam and for Chapters 1&2).
Therefore, RETAIN the Null Hypothesis (H0). The mean score for treatment group is
NOT statistically significantly higher than the mean score for control group (for neither
the entire exam nor for chapters 1&2).
t-Test: Two-Sample Assuming Equal Variances
Mean
Variance
Observations
Pooled Variance
Hypothesized Mean Difference
df
t Stat
P(T<=t) one-tail
t Critical one-tail
P(T<=t) two-tail
t Critical two-tail
t-Test: Two-Sample Assuming Equal Variances
Mean
Variance
Observations
Pooled Variance
Hypothesized Mean Difference
df
t Stat
P(T<=t) one-tail
t Critical one-tail
P(T<=t) two-tail
t Critical two-tail
(Entire Exam)
Variable 1
23.67567568
39.003003
37
47.18637994
0
196
1.561202903
0.06004453
1.65266506
0.12008906
1.972141177
(Chapters 1&2)
Variable 1
19.13513514
23.23123123
37
27.21803195
0
196
1.389345729
0.083151986
1.65266506
0.166303972
1.972141177
Variable 2
21.72049689
49.02763975
161
Variable 2
17.8136646
28.11506211
161
Discussion of Results
Having only implemented the interactive student response system for a short time,
i.e. during two chapters of instruction (approximately 3 weeks), these results are not
unexpected. It is still believed, however, that over time, the increase in interest and
attentiveness in class when using an interactive student response system will reflect
positively on students’ grades.
42
Other factors, besides the time constraint, that may have affected the results are
the variations between MAT 111 sections. These variations include homework,
attendance, and weighting of various assessment methods, as discussed in the following
paragraphs.
First, some instructors assigned and graded homework, while others made it the
students’ responsibility to complete the suggested homework exercises. If homework is
required, it may be assumed that students are more likely to do the homework and keep
up with the course material, which should ultimately reflect positively on their grades.
Homework was suggested, but not required to be turned in, for the treatment group. It is
my belief, based on observations made while teaching two semesters of this course, that
many students will not complete the suggested homework if it is not “mandatory.” This
may be a reason why the exam scores of the treatment group were not statistically higher
than the control groups’ scores, as two of the four instructors in the control group
required homework.
A second variation between MAT 111 sections is attendance requirements. Three
of the four control group instructors included attendance in the students’ course grades,
essentially making attendance mandatory. Attendance was not mandatory in the
treatment group; however, participation points were included in students’ grades when
using Qwizdom. Although it is recognized that many students who are not graded on
attendance still regularly attend class, it is possible that this variation between sections
influenced the results.
A third variation is the weighting of the various assessment methods of the
course, that is, the percentage of overall course grade for quizzes, exams, homework, and
43
attendance varied for each instructor. In my opinion, if a student knows that a larger
percentage of their cour se grade is dependent on their quiz grades, for example, it is
likely that he or she would expend the effort to prepare for the quizzes. Quizzes
comprised 15% of the treatment group’s course grade, as did one of the control group’s
sections. Three of the four control group sections had quiz grades count for a larger
percentage (20%, 30%, and 40%). In addition, the exam scores counted for different
percentages between MAT 111 sections. The results of the first common exam
comprised 25% of the course grade in the treatment group. In the control group, one
instructor had a larger percentage (30%), one instructor had the same percentage (25%),
and two had smaller percentages (20%).
It is possible that both the time constraint (limiting the interactive system’s use)
and the number of variations between MAT 111 sections affected the results of this
study. However, further research may help to determine if these factors do in fact affect
academic achievement. Furthermore, the pedagogy of MAT 111 should also be
considered.
44
CHAPTER 5 – STUDENTS’ ATTITUDES
In this chapter, I discuss the students’ responses to the preliminary questionnaire,
attitude survey, and post-study continuation survey to answer the following research
question: What are students’ attitudes towards the interactive student response system?
Preliminary Findings
From the preliminary questionnaire, four themes emerged regarding the students’
first impressions with Qwizdom: anonymity encourages participation; Qwizdom
increases individual and classroom attentiveness; Qwizdom is enjoyable and fun; the
system has technical problems, but overall attitudes are positive.
Some representative replies from the preliminary questionnaire are listed below,
categorized under the four themes.
Anonymity encourages participation:
•
“I actually, really think I will enjoy the Qwizdom because I am shy and have a
hard time with class participation, therefore the Qwizdom will give me the
opportunity to participate without actually speaking!”
•
“I like Qwizdom. I like participating so that I can figure out what I’m doing
wrong, but I feel stupid raising my hand and making a spectacle out of my
misunderstandings.”
Qwizdom increases individual and classroom attentiveness:
•
“I think it will keep me focused in class.”
•
“It seems like a good way to keep everyone involved.”
45
Qwizdom is enjoyable and fun:
•
•
“Qwizdom seems like fun, something new, I’ve enjoyed it so far.”
“I thought it was a good idea. I think it is fun.”
System has technical problems, but overall attitudes are positive :
•
“I think it’s a great idea! It seems like a great tool and I will enjoy using it. (As
long as it’s working properly!)”
•
“I like it so far. If things went a little quicker I’d be happier!”
Of the 20 students who responded to this questionnaire, only one student had a
truly negative first impression by responding that Qwizdom distracts from learning. This
student also expressed an adverse attitude towards technology, which may influence her
reaction to interactive technology in the classroom. The other 19 students had positive
first impressions, with ten of them mentioning the benefits of the system’s anonymity.
Although three students did mention technical problems with the system, most of the
technical problems were eventually corrected, as discussed in Chapter 6.
Attitude Survey Results
As discussed in Chapter 3, the attitude survey was distributed to the treatment
group two weeks after the first exam, and copies were available to students after that
date. Ultimately, 23 out of 37 students returned the attitude survey. Detailed survey
results of the Likert scale statements and open-response questions follow.
Likert Scale Statements
The first part of the survey consists of 14 Likert scale statements. Students rated
each statement by circling a number between 1 and 5. The Likert statements,
descriptions of rating scale, and tabulated results are shown in Table 4.
46
Table 4: Likert Statement Results
SURVEY RESULTS
Likert
(23/37 response rate)
1 I liked using Qwizdom .
1
2
material.
3
The use of Qwizdom increased the likelihood that I would
attend class (for reasons other than being graded on
participation or attendance).
4
Qwizdom helped me stay attentive in class.
5
Qwizdom helped me to identify problem areas that I needed
to study prior to quizzes and exams.
I feel I would have learned more in class if Qwizdom had
not been used.
Qwizdom helped me be an active class participant, more
than I typically would be in a regular lecture environment.
There are other classes in which using an interactive student
response system, such as Qwizdom , would be of benefit to
me.
I liked seeing the histogram of class results displayed after
each question.
The automatic (right/wrong) feedback that the remotes
provided through flashing LED lights was helpful.
When the automatic feedback indicated my answer was
incorrect, I continued working to determine why.
It would have been helpful if the remotes had been enabled
to allow more than one answer.
I blindly entered answers, so that I would receive credit for
participating, without taking the time to think about the
problem and attempting to solve it first.
Overall, using Qwizdom was a positive experience for me.
6
7
8
9
10
11
12
*
13
14
2
3
4
5
Strongly Agree Neutral Disagree Strongly
Agree
Disagree
7
30.4%
13
56.5%
2
8.7%
1
4.3%
0
0.0%
5
21.7%
2
10
43.5%
5
7
30.4%
14
1
4.3%
2
0
0.0%
0
8.7%
10
21.7%
11
60.9%
1
8.7%
1
0.0%
0
43.5%
6
47.8%
8
4.3%
8
4.3%
0
0.0%
1
26.1%
34.8%
34.8%
0.0%
4.3%
0
2
5
8
8
0.0%
11
8.7%
7
21.7%
2
34.8%
3
34.8%
0
47.8%
5
30.4%
7
8.7%
6
13.0%
4
0.0%
1
21.7%
30.4%
26.1%
17.4%
4.3%
2
9
10
1
1
8.7%
7
39.1%
15
43.5%
1
4.3%
0
4.3%
0
30.4%
7
65.2%
12
4.3%
3
0.0%
1
0.0%
0
30.4%
7
52.2%
3
13.0%
8
4.3%
5
0.0%
0
30.4%
0
13.0%
0
34.8%
1
21.7%
6
0.0%
16
0.0%
12
0.0%
7
4.3%
3
26.1%
1
69.6%
0
52.2%
30.4%
13.0%
4.3%
0.0%
* Question #12 was ambiquous, so results may not be an accurate representation of students' attitudes.
As noted in the table, question (i.e. statement) #12 is ambiguous. The statement
says, “It would have been helpful if the remotes had been enabled to allow more than one
answer.” The statement’s intended meaning was that the students could enter an
additional answer if their original answer was incorrect. Some students thought the
statement referred to responding to questions that had multiple answers. Out of 23
surveys, 15 had comments for this statement. Eleven (11) of those 15 appeared to
47
understand the statement as intended, four (4) did not. Since eight (8) did not comment,
it cannot be determined if they understood the statement when rating the Likert scale.
Therefore, results for this statement may not be an accurate representation of students’
attitudes.
Although the Likert scale reveals a general idea of the students’ attitudes, in my
opinion it is the students’ own words (given as comments under each statement) that are
most revealing. Not every student chose to comment, and those that did, did not
necessarily comment on each statement. However, the detailed remarks that some
students made suggest they spent time thinking about their responses. In the following
paragraphs, the students’ Likert scale responses are discussed and the students’ verbal
responses to each statement are summarized.
Statement #1 (I liked using Qwizdom) and statement #14 (Overall, using
Qwizdom was a positive experience for me) evoke the students’ general attitudes toward
the interactive student response system. The majority of students agreed or strongly
agreed that they liked using Qwizdom (86.9%) and that overall, using Qwizdom was a
positive experience (82.6%).
Seven (7) students agreed or strongly agreed to statements #1 and #14 stating that
Qwizdom was “fun”, kept their attention, and “was a good change of pace from regular
class.” Eight (8) students, who also agreed or strongly agreed to statements #1 and #14,
mentioned Qwizdom’s use as a review tool to check for understanding of the material,
resulting in one student feeling “more confident” in his/her answers.
Three (3) students explicitly mentioned the benefits of the system’s anonymity,
appreciating the ability to participate in spite of their shyness in class.
48
The time factor involved in using Qwizdom and system “quirks” are recurrent
themes also mentioned by at least 10 of the students. I discuss these issues in more detail
in Chapter 6.
Statements #2 and #5 evoke the students’ opinions toward Qwizdom’s ability to
increase understanding of the course material and to identify problem areas. The
majority of students agreed or strongly agreed that Qwizdom increased their
understanding of the course material (65.2%), and that Qwizdom helped them identify
problem areas that they needed to study prior to quizzes and exams (60.9%).
Students identified both the step-by-step and visual aspects of Qwizdom as factors
which improved their understanding. The time limits imposed served to challenge
students as well, who “liked having to work quickly to get [their] answers in…”
Students also appreciated that Qwizdom helped them to identify problem areas
that they needed to study prior to quizzes and exams (statement #5). The immediate
feedback and increased participation helped to identify “the small steps I was leaving out
in the process of answering a question…,” and encouraged students to “think about” their
answers, rather than “…just copy[ing]…” the example from the board.
Seven (7) students (30.4%) expressed a neutral stance towards Qwizdom’s ability
to increase understanding of the course material (statement #2) and eight (8) students
(34.8%) responded neutrally to Qwizdom identifying problem areas prior to quizzes and
exams (statement #5).
One student, who expressed a neutral stance to both statements, commented, “We
haven’t done too much with it so far, or not enough that it would increase my
49
understanding more than reading and the teacher. If we had had more time with it, I am
confident it would have helped pick out key trouble areas.”
Class attendance did not seem to depend on the use of Qwizdom, as revealed by
statement #3: The use of Qwizdom increased the likelihood that I would attend class (for
reasons other than being graded on participation or attendance). The majority of students
(69.6%) disagreed or responded neutrally to this statement, whereas only 30.4% agreed
or strongly agreed. Individual reasons varied, but one student reflected the general
consensus by remarking, “Qwizdom didn’t necessarily increase the likelihood that I
would attend class, but it did make class more interesting.”
Even though Qwizdom did not affect attendance levels, it did increase students’
attentiveness and participation in class, as revealed by statements #4 and #7, respectively.
The majority of students agreed or strongly agreed that Qwizdom helped them stay
attentive in class (91.3%) and that Qwizdom helped them be an active participant, more
than they typically would be in a regular lecture environment (78.2%).
Students’ comments on reasons for increased attentiveness ranged from the need
“to enter an answer every time…,” to “it definitely kept my interest; therefore I was more
attentive to the lesson.” Several students state or imply that the system’s anonymity was
the reason for their increased participation. “We were able to be actively participating
without having to be vocal in front of the entire classroom.” Others cite Qwizdom’s
response system as a motivating factor that showed “…that each and every student is
participating.”
One student felt that attentiveness actually decreased and was the only student
who disagreed with statement #4. This student commented, “I think Qwizdom actually
50
took away from attentiveness due to the nature of the whole situation, such as: getting
started, doing the problem, and then trying to make sure my data was inputted into the
system.” Once again, the reoccurring time factor theme emerges as a negative aspect of
using Qwizdom.
The Likert scale results for statement #6 (I feel I would have learned more in class
if Qwizdom had not been used) reveal that the majority of students (69.6%) disagree or
strongly disagree with this statement, with an additional 21.7% responding neutrally.
Interestingly, regardless of the student’s response to the question (negative,
neutral, or positive), most commented negatively on the time factor involved with setting
up, using, and debugging the system during class. I believe, however, that with longer
use and increased familiarity with the system, the negative time factor would decrease in
significance. Also interesting to note is that four (4) respondents liked Qwizdom enough
to suggest a longer class period to accommodate the extra time required in using the
system.
When asked if there are other classes in which using an interactive student
response system, such as Qwizdom, would be of benefit to them (statement #8), the
majority of students (52.1 %) agreed or strongly agreed, while 26.1% responded neutrally
and 21.7% disagreed or strongly disagreed.
Five (5) students who agreed or strongly agreed gave specific examples of classes
that would benefit, such as geology and other science classes, business, English, and
computer classes. Other students suggested its use in all classes, with one stating that
“…in a larger lecture style class where there is simply no time to hear everyone’s
opinion, Qwizdom would be a benefit.” Another student suggested any class would
51
benefit due to students’ different learning styles, “it can help any class, keeping in mind
that every student learns a different way and some students find non- interactive long
lectures difficult to follow.”
Statements #9 and #10 relate to the feedback features of Qwizdom, i.e. the
histogram of class results (statement #9) and the flashing right/wrong LED lights on the
remotes (statement #10).
The histogram (or bar graph) is a response graph that shows the number of student
responses with the available choices. This graph was typically displayed after students
answered each multiple choice or true/false question. Initially, a graph was displayed for
numeric answers as well, but as I discuss in Chapter 6, it did not work well for this type
of answer.
The histogram helped me, the instructor, assess overall student understanding of
the material. The students had mixed feelings, however. Statement #9 (I liked seeing the
histogram of class results displayed after each question) revealed a fairly even split
between those that agreed or strongly agreed (11 students or 47.8%) and those that felt
neutral (10 students or 43.5%). Only two (2) students disagreed or strongly disagreed
with this statement.
Students commented that it was helpful “to see that you are not the only one
having trouble or vice versa.” Several students felt the histogram display was useful to
the instructor (in that “it shows progress, or lack of it”), but varied in their response to its
usefulness to them personally.
The students’ responses regarding the other feedback feature of Qwizdom, the
flashing right/wrong LED lights on the remotes, was overwhelmingly positive. When
52
responding to statement #10 (The automatic [right/wrong] feedback that the remotes
provided through flashing LED lights was helpful), 22 of the 23 students (95.6%) agreed
or strongly agreed. No one disagreed or strongly disagreed, and only one (1) student
responded ne utrally.
Six (6) students liked the automatic feedback because “it’s nice to know right
away whether you got it right or wrong.” Four (4) students also mentioned that “…the
immediate flashing red/green [lights, give you] more time to figure out why you were
wrong (or right).” Immediate feedback is an important element of Qwizdom, and the
premise behind the next statement (#11) in the survey.
Three (3) students also thought that the LED lights did not blink for “a long
enough period” and were sometimes missed. The brevity of the LED light seems to
hinder this valuable feedback feature, which I discuss in Chapter 6.
I encouraged students who got the answer incorrect to try to determine why and to
discuss with their neighbors, while everyone else finished answering the question. I was
curious if students actually did take the time to go back through their work if their answer
was incorrect, which is why statement #11 was included (When the automatic feedback
indicated my answer was incorrect, I continued working to determine why). The
majority of students (19 students or 82.6%) agreed or strongly agreed with statement #11,
while three (3) students responded neutrally, and one student disagreed.
Generally, students were motivated to continue to work on the problem if
answered incorrectly, as “it’s the only way to learn.” Two (2) students who agreed or
strongly agreed mentioned errors when hitting the buttons on the remote, or not pressing
the buttons hard enough. I discuss this problem with the remotes in Chapter 6.
53
Regarding the automatic feedback that the remotes provided, I was curious if
students would like to be able to enter additional answers after receiving the red LED
light, which indicated an incorrect answer. This is the premise behind statement #12, as I
had programmed the remotes to restrict the input to one answer per question.
Unfortunately, as discussed earlier, statement #12 is ambiguous. Consequently, the
Likert results for this statement may not be an accurate representation of students’
attitudes.
Statement #13 (I blindly entered answers, so that I would receive credit for
participating, without taking the time to think about the problem and attempting to solve
it first) was designed to determine how motivated students are, regarding opportunities
for learning. Particularly, whether or not students blindly entered answers when their
grade depended only on participation (i.e. entering answers) and not on answering
correctly. An overwhelming majority of students (95.7%) disagreed or strongly
disagreed with statement #13. This is interesting, as I suspect most people believe that
students do not take these kinds of things seriously, unless they are graded right/wrong.
An interesting comment to statement #13 came from a student who strongly
agreed stating, “I am competitive and want to do well on Qwizdom.” This competitive
student, and others, may have enjoyed Qwizdom’s built- in games, which were not used
due to time constraints. Would the students’ attitudes be significantly different from this
study if the games had been used? Would the use of games affect academic
achievement? These are questions to consider for future research studies.
54
Open-Response Questions
The second part of the student attitude surve y consists of eight (8) open-response
questions. As with the Likert statements, not every student chose to answer the
questions, but the detailed remarks of those that did suggest they spent time thinking
about their answers. In the following paragraphs, I list each question, categorize the
students’ responses to each question into common themes, and include some example
quotes.
1. Suppose a friend asked your advice on which math class to take. Two sections of the
same class were offered at the same time and both had good instructors. One class
used an interactive student response system, such as Qwizdom, one did not. Which
would you recommend and why?
The majority of students (20) said that they would recommend Qwizdom, for
reasons such as: Qwizdom is a good learning tool; makes class fun; not as boring; a nice
change of pace; and Qwizdom increases participation and attentiveness. None of the
students explicitly said that they would not recommend Qwizdom; however, three
students did have mixed reactions. The students’ responses are summarized below.
Qwizdom is a good learning tool:
• “I’d recommend the Qwizdom class because it really helped my learning
experience.”
• “I would recommend the one with Qwizdom because it is a good way to tell how
well one understands the material.”
55
Qwizdom makes class fun, not as boring, and a nice change of pace:
• “We were still able to learn a lot during the class and still able to mix it up and
have some fun!! It made class a bit rushed, but I enjoyed it.”
• “Hands down – I would most definitely suggest an instructor that uses Qwizdom
because it is beneficial and fun at the same time.”
Qwizdom increases participation and attentiveness:
• “I would recommend the class with an interactive system, because it keeps your
attention and is more hands on. Without it, one may tend to daydream or not feel
like participating in lecture, but Qwizdom gets students involved.”
•
“It also makes the student more comfortable to participate, ask questions, and
stay focused.”
Mixed reactions:
• “If it were only a 50 minute class I would not recommend one with an interactive
student response system because there is too much information to teach and not
enough time.”
• “I would have to look at the friend’s interests. If they like technology, then
Qwizdom, if they want fast paced math, the other.”
2. Did you prefer having the Qwizdom examples the same day as the lecture topic or at
the beginning of the following class period? Why?
Initially, Qwizdom was implemented at the end of each lecture period. As the
study progressed, however, I had to wait until the following class period because of time
constraints, as discussed in Chapter 6. I considered that this delay might be beneficial, in
56
that incorrect Qwizdom answers would alert me to specific areas in the material that
needed additional review with the class.
Interestingly, and contrary to what I suspected based on my own opinion, the
majority (13) of the students said, the same day, for reasons such as reinforcement and
practice of what they just learned in lecture. Seven (7) students indicated that they
preferred waiting until the following class period to better process the material, and
considered Qwizdom a good review tool. The students’ responses to question #2 are
summarized below.
Same day – reinforcement and practice of material just learned:
• “Same day because it imprinted everything into your mind and made clear what
you didn’t understand.”
• “I like having Qwizdom examples the same day as lecture material. Doing it
different days mixes it up and makes it confusing.”
Following class period – time to process material and a good review:
• “At the beginning of the next class because it allows for time to assimilate the
information.”
• “I think that the examples helped me more after I had the chance to take home the
material and practice them myself. If they were given directly after the material
was introduced, I might not yet fully understand it, and made working through the
problem in class more stressful because I didn’t feel that I was doing it right.”
57
3. If you answered a Qwizdom question incorrectly, did you discuss the problem with
classmates around you to help determine why it was incorrect? If so, did this
collaborative approach help you to better understand the problem? Explain.
Students were encouraged to discuss the Qwizdom examples with their
classmates, and although there appeared to be some discussion between students, I
thought there could have been more. I attribute this limited discussion to
sociomathematical norms, discussed in Chapter 2, and to the classroom size. Our
classroom was a large (95-student) lecture hall; students tended to spread out, not sitting
next to anyone for discussion.
I asked this question because I was curious how many students were using this
collaborative opportunity and what their thoughts were regarding this approach. The
results revealed 10 students indicating “yes,” 10 saying “no,” and 2 “sometimes.” One
student did not answer the question.
The 10 students who did discuss their responses with classmates cited reasons
such as: helps with finding errors, helps both students learn, one-on-one discussion
helpful, and learning from peers rather than from instructor.
Yes responses:
• “Yes, I did. And discussing it helped me because sometimes it’s easier to ask one
person one-on-one rather than in front of the entire class.”
• “I definitely asked the person around me, and I found it helpful because one may
tune out a professor, but a peer who got it correct may have an insight for way to
approach a problem. Like they say, 2 brains is better than one.”
58
I find this last quote to be very compelling, that students may tune out an
instructor and that a peer may have an insightful way to approach a problem. This agrees
with Mazur (1997), as discussed in Chapter 2.
The 10 students who said they did not discuss with classmates cited reasons such
as: would rework and catch mistakes on own, waited for solution, did not sit by anyone,
not enough time, and do not like group work. In addition, two (2) students said
“sometimes,” and one student did not answer.
No responses:
•
“No, not enough time between questions.”
•
“No, I don’t like group work.”
4. Which types of questions were most effective for your learning: multiple choice and
True/False questions, or open-ended questions with numeric answers? Please
explain.
The majority of students (16) said open-ended questions (numeric answers) are
more effective for learning. Fourteen (14) of those 16 students stated that open-ended
questions are more challenging (have to think more) and/or that you cannot guess the
answer as you can with multiple choice, while the other 2 students commented that openended questions are good practice and more similar to a test. Three (3) students said
multiple choice or T/F because they show options and you can guess. Four students said
a combination of all.
59
Open-ended:
• “I think that the open-ended questions helped me more because with the multiple
choice questions, especially in a math class, I find it pretty easy to guess the correct
answer, which doesn’t help me to go through a problem and generate my own
answer. In math, it’s more important to learn how to do a certain type of problem,
rather than guess the answer.”
•
“Open ended questions because it required more active problem solving techniques
which were good for practice.”
Multiple choice or true/false:
• “Multiple choice were most helpful, since it showed other options.”
• “Multiple choice and true/false because then you know.”
The results to this question were unexpected. I thought most students would
prefer multiple choice and true/false because they already have the answer; they just have
to figure out which one it is, which requires less effort.
5. Some students may spend a significant amount of time waiting for everyone else to
enter their answers in the Qwizdom remotes. Do you feel this lag time is taking away
from time spent on learning? Do you have any suggestions on how we can address
this lag time and keep all students engaged?
As an instructor, I found this to be an issue (discussed in Chapter 6), and thought
the students would offer both useful feedback and recommendations for change. The
responses were split, with 12 students saying yes, that lag time does take away from time
spent on learning, and 11 students saying no.
60
Yes responses:
• “I do think valuable class time was used waiting, but you can’t really rush people
any more – it won’t benefit them.”
•
“Sometimes there was a lot of lag time. What if there was a more challenging
problem for students to work on during this lag time? A problem similar to the one
asked, so the students who take more time won’t be missing out?”
No responses:
• “I think the extra time is good. If I have a wrong answer, I spend the extra time
trying to figure out what I did wrong.”
• “No. Teachers would have to take extra time to teach slower students either way.”
6. Compare this course with another math course you have taken that was similar in the
manner it was taught and/or the content covered. Through comparison, discuss the
effects of Qwizdom on your learning and success.
Six (6) students stated that Qwizdom provides problem-solving practice and
increases understanding, 5 students commented that Qwizdom increases participation and
attentiveness, and 2 students remarked that Qwizdom makes math more fun. In addition,
4 students said that they had nothing to compare to; for example, this is their first math
class, indicating that they did not realize that they could have compared to high school
math courses.
61
Qwizdom provides problem-solving practice and increases understanding:
• “In other math classes, we weren’t given the opportunity to work the problems on
our own. It’s difficult telling if you are comprehending the material without
actually solving the problem by yourself.”
• “I really struggled through HS pre-calculus and trigonometry, and felt that I was
the only one who had trouble. The Qwizdom really helps me understand the
concepts.”
Qwizdom increases participation and attentiveness:
•
“…Qwizdom counted for class participation and in a larger class which I could
have easily sat back and coasted, Qwizdom kept me involved.”
• “I like that Qwizdom is anonymous. In other classes, I did poorly in participation
because I’m too embarrassed to do problems in front of the class.”
Qwizdom makes math more fun:
• “Qwizdom didn’t help me learn a lot more, it just made it more fun.”
• “It gives you a chance to practice what you have learned and it makes it fun, like a
game almost.”
7. Discuss other ways that Qwizdom might be used in class and why.
Students provided some good ideas for Qwizdom’s use, such as: quizzes,
homework and review, polling and voting, and games.
• “I think if it was used at the end of class we could almost view it as a mini quiz of
the information we went over that class period – that way we have more of a reason
to really pay attention and work hard to grasp the information.”
62
• “For attendance, maybe on exams, entering homework answers if we have an extra
credit assignment.”
Using Qwizdom to both administer and grade quizzes (or homework) would be
very time efficient for the instructor. The instructor, however, would not be able to
assess the students’ step-by-step problem solving skills or offer valuable feedback (or
partial credit) regarding errors made during these steps. I believe assessment and
feedback are critical to student understanding.
8. Please add any other comments, or elaborations, below (use the back if needed).
Six students offered comments or elaborations. Listed below are quotes which
are indicative of the students responses.
• “Qwizdom was very helpful, and I would enjoy using it more often.”
• “Overall, I think Qwizdom was a positive experience. I think with better time
management, such as doing practice problems from the previous lesson in the
beginning of class or just doing a few problems after teaching a lecture, Qwizdom
could develop into a very useful program or teaching aid.”
• “The only negative aspect was the seemingly constant glitches of getting peoples
names in or their controllers not working because of the short range of the remotes
that took away from class time.”
Summary of Findings from Preliminary Questionnaire and Attitude Survey
Several common themes appeared throughout the preliminary questionnaire and
attitude survey regarding the Interactive Student Response System (Qwizdom). For
example, students believed that the use of Qwizdom provided problem-solving practice,
63
increased understanding and was a good learning tool, increased attentiveness, and made
math more interesting and fun. Furthermore, Qwizdom’s anonymity encouraged
participation in class. However, the students also reported that the use of Qwizdom had
no effect on class attendance.
Although there were technical problems with the system, the students’ attitudes
were positive otherwise. Overall, students generally liked using Qwizdom and felt that
they had benefited from its use.
Post-study Continuation Survey Results and Other Findings
As discussed in Chapter 3, during the class following the first exam, an
anonymous survey question was given (using the Qwizdom remotes) to determine if
students would like to continue using the system even though the research study had
officially ended.
Of the 31 students that were in class, 30 students responded with “yes” – they
would like to continue using Qwizdom! The one student that responded with “no” told
me after class that she was the one that answered this way. This student had indicated a
negative attitude toward technology throughout this study, so I was not surprised by her
response. Given that this student is an anomaly, however, her attitude is less likely to
merit consideration given the rapid technological infusion in education, sometimes even
to the benefit of the student.
As the semester progressed, several students verbally expressed that they really
liked using Qwizdom and asked when we were going to use it again. Unfortunately, even
though I had developed question slides for some of the material covered, the time needed
to get through the required course material did not allow for its continued use.
64
However, near the end of the semester, I was able to reintroduce Qwizdom during
the last 15 minutes of class. Everyone appeared engaged and the classroom was very
active with much collaborative discussion. It was obvious to me that the students were
having fun, some even said as much. Even though I realized (from personal observation
and experience) that students typically appear quiet, uninterested, and bored in a
traditional passive lecture environment, on that day I witnessed a sudden and dramatic
difference in both attitude and participation when using the interactive student response
system. In my opinion, this observation alone justifies the use of interactive technology
in the classroom, and at the minimum justifies further study of its use.
65
CHAPTER 6 – INSTRUCTOR’S ATTITUDE
In this chapter, I review my journal entries to answer the following research
question: What is the instructors’ attitude towards the interactive student response
system? In the following paragraphs, I discuss my thoughts regarding the use of an
interactive student response system in MAT 111.
My experience using Qwizdom’s Interactive Learning System and specifics
regarding its implementation are discussed in Appendix E. Since I have not had the
benefit of experimenting with other types of interactive student response systems, the
comments that follow may or may not apply to systems in general.
Time-Related Issues
Time-related issues and system “quirks” (i.e. technical problems) are recurrent
themes among the students’ attitudes, discussed in Chapter 5; I concur. Although many
of the technical problems with Qwizdom were resolved, some were not (as discussed in
Appendix E). As the instructor, I found the following three time-related issues to be
problematic to the classroom environment: system setup, system use, and coverage of the
required material.
System Setup
A significant amount of time, that could have been spent on instruction and
learning, was spent setting up the interactive system. For example, as discussed in
Appendix E, getting the presentation started and logging into the system for each
presentation took valuable classroom time.
Furthermore, I feel than an interactive system should be flexible enough to allow
for interruptions in the presentation. For example, I was hoping to incorporate interactive
66
questions periodically throughout the lecture period, similar to what I do in a typical
class. Unfortunately, this is not feasible with the Qwizdom system because each
presentation has to be initiated separately and students have to log in each time.
Moreover, once a presentation starts, students are not able to log in. Therefore, on
days in which we had the Qwizdom examples at the beginning of class, students that
were a few minutes late could not participate, and conseque ntly, missed the automatic
feedback opportunity.
System Use
In addition to time spent starting the presentations and logging in, using the
system in general takes time. For example, there is a significant amount of time
expended waiting for each student to answer the questions, as some students are
inherently slower than others are. This caused somewhat of a dilemma for me. Of
course, I wanted ALL students to participate, but I also did not want students waiting for
an extended period between questions. I considered the possibility that this lag time may
be taking away from the time spent on learning. However, in retrospect, I do not believe
it was time wasted because students used this time to collaborate with their neighbors to
resolve incorrect answers.
Coverage of Required Material
In order to keep pace with the predefined schedule and curriculum, there is a
significant amount of material to cover each day. Therefore, I had to establish some sort
of time limit in which students were required to enter their answers. There is a timer
feature on the Qwizdom presentation screen, but it is designed for presentations that are
in autopilot. I did not want the presentations to run on their own, however, because I
67
wanted to spend as much time as the students needed to discuss the solution slides. In
retrospect, I could have used a separate timer to establish a set time for each question.
Instead, I announced a “last call” for entries when the majority of students were finished.
Incorporating more multiple-choice and true/false questions, rather than open-response
questions that required numeric answers, did seem to speed things up a bit. However, as
the student attitude surveys reveal in Chapter 5, students preferred the challenge of openresponse questions.
Due to the time involved with setting up, logging in, and using the interactive
system, I was unable to keep pace with the predefined schedule and curriculum of MAT
111. Initially, I incorporated Qwizdom examples at the end of class, as a review of that
day’s material. However, as the study progressed and as we got further and further
behind schedule, I found I was incorporating the Qwizdom examples at the beginning of
the following class period because we ran out of time during the previous class.
Unfortunately, in order to get through the required material before the scheduled exam
date, we had to abandon Qwizdom at the end of chapter 2, a whole chapter short of my
intended goal.
Although the study had officially ended at the first exam, I was hoping to
integrate Qwizdom throughout the semester (not daily, but as time allowed) because the
students enjoyed using it and requested that we continue. Unfortunately, except for one
occasion towards the end of the semester, the time needed to get through the required
course material did not allow for its continued use.
68
Attitude in General
I really enjoyed using the interactive student response system in class, partly
because I like working with technology, but mainly because the students seemed to enjoy
using it. In addition, it incorporated an interactive component that I feel most classes are
lacking, as discussed in the Introduction. When not using the system, the students did not
ask many questions and generally appeared less interested in the lecture material. When
using the system, however, the students were engaged and appeared to be having fun – a
positive atmosphere I believe most instructors would prefer.
However, due to the fast pace, set schedule, and predefined curriculum of MAT
111 at The University of Maine, I do not believe that this traditional course is an ideal
setting for an interactive student response system like Qwizdom. Since all sections take
common exams, all sections must keep pace with the predefined curriculum and
schedule. Because Qwizdom takes time to set up and to use, and because each class is
only 50 minutes long, the treatment group got further and further behind schedule.
Consequently, I felt rushed and, ultimately, students began complaining that I was going
too fast. It is for this reason that I decided to cut the study short (stopping at the end of
chapter 2 rather than at the end of chapter 4), and why we were not able to continue using
the system as the semester progressed. Thus, due to the time factor issue, as a course
instructor I do not recommend using an interactive student response system such as
Qwizdom in a traditional college algebra lecture environment, particularly one that is
only 50 minutes long as is typically the case. However, if the pedagogy of the course
were changed, then I believe implementation of an interactive system is worth further
exploration.
69
CHAPTER 7 – CONCLUSION
In this concluding chapter, I discuss the results of this study to answer the fourth
and final research question: Overall, is the interactive student response system an
effective tool for instruction in a traditional college algebra lecture environment? I also
explore ideas and questions for future studies.
An Effective Tool for Instruction?
The student attitude surveys, discussed in Chapter 5, revealed that students
perceived that the use of the interactive student response system (Qwizdom) provided
problem-solving practice, increased understanding and was a good learning tool,
increased attentiveness (but not attendance), and made math more interesting and fun.
Furthermore, Qwizdom’s anonymity encouraged participation in class. Overall, students
generally liked using Qwizdom and felt that they had benefited from its use. Based on
these positive student attitudes, I believe an interactive student response system is an
effective tool for instruction, in general.
However, based on my (the instructor’s) attitude, discussed in Chapter 6, I do not
believe it is an effective tool for instruction in a “traditional” college algebra lecture
environment. That is, due to the fast pace, set schedule, and predefined curriculum of
MAT 111 at The University of Maine, and the time involved with incorporating an
interactive student response system, this traditional course (as it is currently taught) is not
an ideal setting for an interactive student response system such as Qwizdom. I believe
that Qwizdom would be better suited for a course that is more flexible in its structure,
schedule, and content. As discussed in Chapter 2, it is not possible to cover the amount
of material typically covered in a traditional lecture when incorporating Mazur’s Peer
70
Instruction method, which typically includes an interactive student response system
(Mazur, 1997).
Furthermore, academic achievement was not statistically significantly higher for
the section of MAT 111 that used the interactive student response system (treatment
group) versus the sections that did not (control group). This supports the results of
Cornell University’s GoodQuestions project (Terrell, 2003), as discussed in Chapter 2.
That is, the questions and “clickers” (i.e. interactive student response system) alone did
not make a difference with the students’ academic achievement in the GoodQuestions
project. Only when they incorporated Mazur’s Peer Instruction method did they notice
an improvement.
However, “Interest can affect the degree to which a student persists in an
activity… [and] interest has also been linked to deeper processing of information during
learning…” (Byr nes, 2001, p. 103). Therefore, I still believe that over time, the increase
in interest (enjoyment) and attentiveness in class when using an interactive student
response system, as revealed by the student attitude surveys, could positively impact
students’ grades.
Based on these results, I believe it would be beneficial to instructors and to
students if the traditional instruction method of college algebra were revised in order to
effectively implement an interactive system. Therefore, maybe the research question
should not have asked if the interactive student response system was an effective tool for
instruction in a traditional college algebra lecture format, but rather, if a traditional
college algebra lecture is an effective format for an interactive student response system.
71
Ideas and Questions for Future Studies
The following paragraphs explore some ideas and questions for future research
studies.
Qwizdom’s Lesson Slides
I found the Qwizdom curriculum “lesson” slides to be well written. In fact, I
would have enjoyed incorporating these lessons into my own lectures like a Microsoft
PowerPoint presentation, and I wonder how students would have responded to that
approach. Unfortunately, incorporating PowerPoint- like lectures would be an additional
change from the traditiona l lecture environment, and thus, may have skewed the results
of this study. Presentation of “lesson” slides is something to consider for future studies,
however.
Qwizdom’s Radio Frequency Remotes
As discussed in Chapters 5 and 6, the line-of-sight infrared (Q3) remotes used in
this study imposed some challenges or “quirks” that frustrated the students. Qwizdom
now has radio frequency (Q4 and Q5 remotes) that eliminate the line-of-sight issues and
other technical problems experienced with the Q3 remotes, as discussed in Chapter 6.
Would students’ attitudes significantly change if these newer/better remotes were used?
Qwizdom’s Interactive Games
Unfortunately, as mentioned in Chapter 5, we did not have time to use
Qwizdom’s built- in games. I wonder what students’ attitudes would be if the games were
used. Would they be significantly different from this study? Would the use of games
affect academic achievement?
72
The Novelty Factor
The overall student attitudes toward the interactive system were positive.
However, I wonder if students’ attitudes would change if the system had been used for a
longer period of time. That is, would the novelty factor wear off after extended use?
Time Constraint and Variations between Sections
It is possible that both the time constraint (limiting the interactive system’s use)
and the number of variations between MAT 111 sections affected the academic
achievement results of this study. However, further research may help to determine if
these factors do in fact affect academic achievement.
Multiple-Choice versus Open-Response Questions
In the open-response section of the student attitude surveys, I asked, “Which types
of questions were most effective for your learning: multiple choice and True/False
questions, or open-ended questions with numeric answers.” Based on their responses,
students prefer to be challenged. I wonder, and wish I would have asked, what their
answers would have been if they were “graded” on their response (i.e., if correct or not)
rather than just on their participation?
Qwizdom in a Non-traditional Lecture Environment
I believe Qwizdom has the potential of being a very effective tool for instruction
in a non-traditional lecture format, and its implementation is worth exploring. For
example, Mazur’s Peer Instruction method (Mazur, 1997) using conceptually oriented
questions in college algebra and an interactive student response system would be an
interesting study to undertake. Would academic achievement increase in this
environment? Mazur’s results, and others, suggest that it would.
73
Final Remarks
The attitude surveys show that the students enjoyed class more, and they seemed
to think they were learning more, using Qwizdom, but the empirical evidence on
academic achievement is that they did not learn more. The results of this and other work
(e.g., Cummings, Marx, Thornton, & Kuhl, 1999) indicate that simply incorporating new
technology into a traditional class without also including pedagogical changes matched to
the new technology is ineffective at anything but affective improvement. The attitude
improvement alone justifies further study, but lack of learning gains strongly implies that
future work should include appropriate pedagogical techniques.
74
BIBLIOGRAPHY
Abrahamson, A.L. (1999). Teaching with Classroom Communication System - What it
Involves and Why it Works. Paper presented at the 7th International Workshop "New
Trends in Physics Teaching", Puebla, Mexico, May 27-30, 1999. Downloaded on
5/26/04 from http://www.bedu.com/publications/html.
Beatty, I. (2004). Transforming Student Learning with Classroom Communication
Systems. EDUCAUSE Center for Applied Research – Research Bulletin, 4 (3).
Blitzer, R. (2002). Algebra for College Students. 4th ed. Prentice Hall, Upper Saddle
River, NJ.
Brown, A.L. & Palincsar, A.S. (1989). Guided, Cooperative Learning and Individual
Knowledge Acquistion. In Resnick, L.B. (Ed.), Knowing, Learning, and Instruction:
Essays in Honor of Robert Glaser (pp. 393-451). Lawrence Erlbaum Associates,
Hillsdale, NJ.
Burnstein, R.A. & Lederman, L.M. (2001). Using Wireless Keypads in Lecture Classes.
The Physics Teacher, 39, 8-11.
Byrnes, J.P. (2001). Cognitive Development and Learning in Instructional Contexts. 2nd
Ed. Allyn & Bacon, Needham Heights, MA.
Coladarci, T., Cobb, C.D., Minium, E.W., & Clarke, R.C. (2004). Fundamentals of
Statistical Reasoning in Education. John Wiley & Sons, Inc., Hoboken, NJ.
Crouch, C.H. & Mazur, E. (2001). Peer Instruction: Ten Years of Experience and
Results. American Journal of Physics, 69 (9), 970-977.
Cue, N. (1998). A Universal Learning Tool for Classrooms? Proceedings of the "First
Quality in Teaching and Learning Conference," Hong Kong International Trade and
Exhibition Center (HITEC), Hong Kong SAR, China, December 10-12, 1998.
Downloaded on 7/20/04 from http://celt.ust.hk/ideas/prs/pdf/Nelsoncue.pdf.
Cummings, K., Marx, J., Thornton, R., & Kuhl, D. (1999). Evaluating innovation in
studio physics. Physics Education Research, American Journal of Physics Supplement,
67 (7), S38-S44.
Driscoll, M.P. (2002). How people learn (and what technology might have to do with it).
Syracuse, NY: ERIC Clearinghouse on Information & Technology (ED470032).
Dufresne, R.J., Gerace, W.J., Leona rd, W.J., Mestre, J.P., & Wenk, L. (1996). Classtalk:
A Classroom Communication System for Active Learning. Journal of Computing in
Higher Education, 7, 3-47.
75
Fitz-Gibbon, C.T. & Morris, L.L. (1987). How to Analyze Data. SAGE Publications,
Inc., Newbur y Park, CA.
Hake, R.R. (1998). Interactive-Engagement vs. Traditional Methods: A Six-ThousandStudent Survey of Mechanics Test Data for Introductory Physics Courses. American
Journal of Physics, 66, 64-74.
Hestenes, D., Wells, M., & Swackhamer, G. (1992). Force Concept Inventory. The
Physics Teacher, 30 (March), 141-158.
Hestenes, D. & Wells, M. (1992). A Mechanics Baseline Test. The Physics Teacher, 30
(March), 159-166.
Horowitz, H.M. (1988). Student Response Systems: Interactivity in a Classroom
Environment. IBM Corporate Education Center. Downloaded on 5/11/04 from
http://www.qwizdom.com/software/remotes.htm (PDF*) and on 6/2/04 from
http://www.optionfinder.com/whitepapers/Interactivity%20in%20classroom.html
*Note: PDF file is corrupted (missing text).
Judson, E. & Sawada, D. (2002). Learning from Past and Present: Electronic Response
Systems in College Lecture Halls. Journal of Computers in Mathematics and Science
Teaching, 21 (2), 167-181.
Kim-Shapiro, D.B., Yip, C.W., Kerr, W.C., & Concannon, T. (2000). Just-in-Time
Teaching for Introductory Physics. In David G. Brown (Ed.), Teaching with Technology
(pp. 51-55). Anker Publishing Company, Inc., Bolton, MA.
Lloyd, G. (1999). Two teachers’ conceptions of a reform-oriented curriculum:
Implications for mathematics teacher development. Journal of Mathematics Teacher
Education, 2, 227-252.
MacDonald, M. (1999). Using Technology to Assist Facilitation. Paper presented to the
International Association of Facilitators, 1999 Annual Meeting, Williamsburg, VA,
January 14-17, 1999. Downloaded on 5/11/04 from
http://iaf-world.org/confs/old/IAF99/Thread4/macdonald.html
Mazur, E. (1997). Peer Instruction: A User’s Manual. Prentice Hall, Upper Saddle
River, NJ.
Nicol D.J. & Boyle, J.T. (2003). Peer Instruction versus Class-wide Discussion in Large
Classes: A Comparison of Two Interaction Methods in the Wired Classroom. Studies in
Higher Education, 28 (4), 457-473.
Piaget, J. (1976). The grasp of consciousness: Action and concept in the young child.
Cambridge, MA: Harvard University Press.
76
Qwizdom, Inc. (2004, product brochure). Qwizdom Interactive Learning System. 6818
86th Street East, Puyallup, WA 98371-6450. Ph: 800-347-3050 / 253-845-7738, Fax:
253-845-1909, Technical Support: 253-770-1285.
Qwizdom, Inc. (2004). Qwizdom Interact Help and User Guide. Puyallup, WA 983716450.
Qwizdom.com (2004). Teaching Made Easy, Learning Made Fun. Qwizdom, Inc.
http://www.qwizdom.com (accessed on 5/11/04).
Schoenfeld, A.H. (1992). Learning to think mathematically: problem solving,
metacognition, and sense making in mathematics. In Grouws, D. (Ed.), Handbook of
research on teaching and learning mathematics (pp. 334-370). Macmillan, New York,
NY.
Sokoloff, D.R. & Thornton, R.K. (1997). Using Interactive Lecture Demonstrations to
Create an Active Learning Environment. The Physics Teacher, 35, 340-347.
Stylianou, D.A. & Blanton, M. (2002). Sociocultural factors in undergraduate
mathematics: The role of explanation and justification. In Proceedings of the Second
International Conference on the Teaching of Mathematics. Crete, Greece.
Terrell, M. (2003). Asking good questions in the mathematics classroom. Prepared for
the AMS-MER Workshop “Excellence in Undergraduate Mathema tics: Mathematics for
Teachers and Mathematics for Teaching,” Ithaca College, New York, March 13-16, 2003.
Downloaded on 9/23/04 from http://www.math.cornell.edu/~GoodQuestions/news.html
The College Board (2005). The SAT Program. http://www.collegeboard.com/ (9/24/05).
Thornton, R.K. & Sokoloff, D.R. (1998). Assessing student learning of Newton’s laws:
The Force and Motion Conceptual Evaluation and the Evaluation of Active Learning
Laboratory and Lecture Curricula. American Journal of Physics, 66 (4), 338-352.
UMaine (2005). The University of Maine. Orono, Maine, 04469.
http://www.umaine.edu/ (9/24/05).
Young, E. (2002, PhD Dissertation). Unpacking Mathematical Content Through
Problem Solving. Downloaded on 3/14/05 from
http://math.youngzones.org/dissertation.html.
77
APPENDICES
78
Appendix A: One -way ANOVA of SAT Scores Descriptives
Table A. 1: One-way ANOVA of SAT Scores Descriptives
N
satv
satm
sat
Mean
Std. Deviation
Std. Error
95% Confidence Interval for
Mean
Min
Max
500
501
502
35
49
47
514.00
521.63
505.11
59.863
66.186
72.946
10.119
9.455
10.640
Lower Bound
493.44
502.62
483.69
Upper Bound
534.56
540.64
526.52
420
360
360
640
690
660
503
504
Total
500
501
46
46
223
35
49
522.61
518.70
516.55
502.00
488.98
76.054
83.894
72.393
60.624
82.190
11.213
12.370
4.848
10.247
11.741
500.02
493.78
506.99
481.17
465.37
545.19
543.61
526.10
522.83
512.59
390
280
280
380
360
710
710
710
680
790
502
503
504
Total
500
47
46
46
223
35
503.19
508.48
511.52
502.69
1016.00
70.437
69.024
77.459
72.788
96.137
10.274
10.177
11.421
4.874
16.250
482.51
487.98
488.52
493.08
982.98
523.87
528.98
534.52
512.30
1049.02
350
400
300
300
860
690
670
690
790
1270
501
502
503
504
Total
49
47
46
46
223
1010.61
1008.30
1031.09
1030.22
1019.24
124.640
132.687
119.782
142.556
124.690
17.806
19.354
17.661
21.019
8.350
974.81
969.34
995.52
987.88
1002.78
1046.41
1047.26
1066.66
1072.55
1035.69
730
760
810
580
580
1300
1350
1300
1220
1350
Appendix B: Common Exam #1
MAT 111 – Spring 2005
Common Exam #1 – February 9th
Name: _______________ Instructor: ____________Class Time: _________
ô
ô
ô
ô
ô
ô
ô
1.
Please write your name on ALL pages.
You have 2 hours for the exam.
Show work to receive partial credit.
Place one simplified final answer in each blank provided, as applicable.
You may not use a calculator.
Make sure your test contains 25 problems .
Each problem is worth a total of 4 points (100 points possible).
Evaluate:
5 + 3 ( x − 3) 3 for x = 5
1. _______________
2.
A football is kicked straight up from a height of 4 feet with an initial speed of 60 feet
per second. The formula below describes the ball’s height above the ground, h (in
feet), t seconds after it was kicked. What is the ball’s height 3 seconds after it is
kicked?
h = 4 + 60 t − 16t 2
2. _______________
3.
Simplify completely:
7 − 5( 5 − 8) 3
4 − 2 ⋅3
3. _______________
4.
Simplify completely:
12 − 15 − 9 − 10
4. _______________
80
Appendix B - continued
5.
Simplify completely:
3 – 4(5 – 2x) + 3(1 – x)
5. _______________
6.
Solve the following equation for x :
5x – (2x + 2) = x + (3x – 5)
6. _______________
7.
Solve the fractional equation for x by clearing the fractions :
5 +
x−2
x+3
=
3
8
7. _______________
8.
Solve the formula C =
5
(F − 32 ) for F.
9
8. _______________
9.
A rectangular swimming pool is three times as long as it is wide. If the perimeter of
the pool is 240 feet, what are its dimensions?
9. _______________
81
Appendix B - continued
10. Simplify completely:
(− 3x
4
y −2
)
−2
10. _______________
11. Simplify completely:
− 45 x −2 y 2
6 −5
9x y
2
11. _______________
12. Answer a & b for the following relation:
{(− 1, 2 ), (3, 2 ), (1, − 3), (2, − 1), (− 2, 3)}
a) Give the domain and range of this relation.
Domain: ________________
Range: ________________
b) Is this relation a function? Why or why not?
13. Let:
g (x) = 4 x2 − 3 x + 5
Find the function value: g (− 3)
13. _______________
14. Determine the domain of the function: f ( x ) =
3x
x−3
14. _______________
82
Appendix B - continued
15. Let:
f ( x ) = x 2 − 3 x and g ( x) = 3 − x
a) Evaluate: ( f + g )( −2)
15.
a) ____________
f
b) Evaluate: (1)
g
b) ____________
16. Graph the following equation using method of your choice (i.e. point-plotting,
intercepts and checkpoint, or slope-intercept):
ô Please remember to label and scale axes (otherwise graph has no meaning
in relation to the equation).
4 x + 3 y = 12
17. Find the slope of the line passing through the points:
(-2, 6) and (3, -4)
17. slope = ________
18. Find the slope and y- intercept of the equation:
2x – y = 6
18. slope = _______
y- intercept = _______
83
Appendix B - continued
19. Which pair of functions are perpendicular, and which pair are parallel?
3
f (x ) = x + 5
4
g ( x) = 4 x − 6
Perpendicular: ____________________
4
h (x ) = − x + 2
3
j (x ) = 4 x + 9
1
k (x ) = x − 3
Parallel:
_____________________
4
20. Give the slope -intercept form for the equation of the line satisfying the following
condition:
slope = -2, and passing through (3,-5).
Slope-Intercept Form: _________________
21. Give the point-slope and the slope -intercept forms for the equation of the line
passing through (-3,6) and (3,-2).
Point-Slope Form: ____________________
Slope-Intercept Form: _________________
22. Solve the following inequalities and compound inequalities. Express solutions using
both inequality and interval notation, and then graph on number line.
a) 5(3 − x) ≤ 3x −1
Inequality Notation: ________________
Interval Notation: __________________
84
Appendix B - continued
b) 3x < 3 or 2x > 10
Inequality Notation: ________________
Interval Notation: __________________
c) 3x = 15 and 2x > -6
Inequality Notation: ________________
Interval Notation: __________________
d) −6 < x − 4 ≤1
Inequality Notation: ________________
Interval Notation: __________________
23. Solve the following absolute value inequalities. Express solutions using both
inequality and interval notation, and then graph on number line.
a) x – 1 < 5
Inequality Notation: ________________
Interval Notation: __________________
b) x + 2 > 5
Inequality Notation: ________________
Interval Notation: __________________
85
Appendix B - continued
24. Solve the following absolute value equation:
2y – 6 = 10 – 2y
24. _______________
25. Graph the following inequality:
ô Please remember to label and scale axes (otherwise graph has no meaning).
2x – y < 4
86
Appendix C: Raw Data – Exam Scores
Table C. 1: Raw Data - Exam Scores (entire exam)
Entire Exam (chapters 1, 2, & 4)
Raw score = 35 max
(35 answer blanks and/or parts - completely correct to receive credit)
TREATMENT CONTROL #1 CONTROL #2 CONTROL #3 CONTROL #4
(501)
(500)
(502)
(503)
(504)
8
35
17
26
20
27
17
13
30
20
12
30
18
22
24
21
23
22
24
25
25
26
19
19
21
27
26
28
35
22
17
21
11
31
32
23
17
24
22
18
30
29
17
12
24
27
22
22
22
33
33
13
7
27
18
33
29
25
21
5
23
31
14
25
21
25
29
18
21
15
31
33
8
23
30
23
23
16
18
32
24
28
21
7
14
13
22
29
19
18
21
22
24
13
29
26
15
28
27
16
25
31
9
33
25
31
29
22
28
18
30
34
21
6
21
21
19
10
15
15
22
9
16
29
24
24
12
11
28
24
29
22
20
27
12
13
24
32
16
23
19
27
22
11
20
27
23
23
26
30
29
20
5
30
18
29
29
30
27
18
25
22
24
23
17
23
13
30
17
10
23
19
10
25
23
27
27
13
22
22
10
24
12
28
33
28
17
30
14
24
9
25
27
32
31
29
13
27
MEAN
MEDIAN
MODE
STD DEV
VARIANCE
23.676
25
27
6.245
39.003
24.051
24
29
6.505
19.311
20
22
7.507
87
22.417
23
22
6.967
21.537
21
18
6.257
COMBINED
CONTROL
21.72
22
22
7.002
49.028
Appendix C - continued
Table C. 2: Raw Data - Exam Scores (chapters 1 & 2)
Partial Exam (through problem #21 = Chapters 1 & 2)
= Period of Qwizdom use
Raw score = 27 max
(27 answer blanks and/or parts - completely correct to receive credit)
TREATMENT CONTROL #1 CONTROL #2 CONTROL #3 CONTROL #4
(501)
(500)
(502)
(503)
(504)
7
27
12
23
20
24
15
13
25
17
10
24
15
20
19
16
21
17
20
17
20
24
16
14
17
22
20
21
27
17
13
17
11
25
24
20
15
21
20
15
25
22
15
10
18
23
18
21
20
25
26
12
7
23
14
26
21
20
19
5
19
25
10
20
18
19
24
14
17
14
24
25
8
19
23
20
16
13
17
24
18
22
14
7
11
12
19
22
15
17
17
17
22
13
21
20
13
22
24
12
19
23
9
27
20
23
23
18
23
14
23
26
14
6
17
20
15
5
15
12
19
8
15
23
17
20
9
11
25
19
22
17
16
20
10
10
17
24
16
16
17
20
19
10
19
20
19
22
19
24
25
17
5
27
16
22
23
25
23
16
21
18
20
19
14
20
9
25
17
10
19
16
10
20
20
19
22
11
17
20
8
17
12
22
26
23
15
23
12
20
9
19
23
24
24
25
10
25
MEAN
MEDIAN
MODE
STD DEV
VARIANCE
19.135
20
20
4.820
23.231
19.103
19
17
4.887
16.133
15
22
5.960
88
19.028
20
20
5.358
17.366
17
17
4.386
COMBINED
CONTROL
17.814
18
17
5.302
28.115
Appendix D: Student Attitude Survey
Interactive Student Response System Survey
For the first part of this survey you are asked to rate (and comment on) statements
that may or may not describe your attitudes about the Qwizdom interactive student
response system that we used this semester. For the second part of this survey you
are asked to answer open response questions.
Part 1:
Please rate each statement by circling a number between 1 and 5 where the
numbers mean the following:
1
2
3
4
5
Strongly Agree
Agree
Neutral
Disagree
Strongly Disagree
Read the survey items carefully. For each statement circle the number that best
expresses how you feel. If you do not understand a statement, leave it blank. If you
understand, but have no strong opinion one way or the other, circle the 3.
_________________________________________________
_________________________________________________
_________________________________________________
_________________________________________________
____________________________________________ _____
89
Neutral
Disagree
Strongly Disagree
I liked using Qwizdom.
Comments:________________________________________
2
Agree
1.
1
Strongly Agree
Please comment on each statement after rating. Try to be as explicit as you can.
3
4
5
1
2
3
4
5
Appendix D - continued
Strongly Disagree
5
Disagree
4
Neutral
3
Agree
Qwizdom increased my understanding of the course material.
2
Strongly Agree
2.
1
1
2
3
4
5
1
2
3
4
5
1
2
3
4
5
Comments:________________________________________
__________________________________________________
__________________________________________________
__________________________________________________
__________________________________________________
__________________________________________________
3.
The use of Qwizdom increased the likelihood that I would
attend class (for reasons other than being graded on
participation or attendance).
Comments:________________________________________
__________________________________________________
__________________________________________________
__________________________________________________
__________________________________________________
__________________________________________________
4.
Qwizdom helped me stay attentive in class.
Comments:________________________________________
__________________________________________________
__________________________________________________
__________________________________________________
__________________________________________________
__________________________________________________
90
Appendix D - continued
Strongly Disagree
5
Disagree
4
Neutral
3
Agree
Qwizdom helped me to identify problem areas that I needed to
study prior to quizzes and exams.
2
Strongly Agree
5.
1
1
2
3
4
5
1
2
3
4
5
1
2
3
4
5
Comments:________________________________________
__________________________________________________
__________________________________________________
__________________________________________________
__________________________________________________
__________________________________________________
6.
I feel I would have learned more in class if Qwizdom had not
been used.
Comments:________________________________________
__________________________________________________
__________________________________________________
__________________________________________________
__________________________________________________
__________________________________________________
7.
Qwizdom helped me be an active class participant, more than I
typically would be in a regular lecture environment.
Comments:________________________________________
__________________________________________________
__________________________________________________
__________________________________________________
__________________________________________________
__________________________________________________
91
Appendix D - continued
Strongly Disagree
5
Disagree
4
Neutral
3
Agree
There are other classes in which using an interactive student
response system, such as Qwizdom, would be of benefit to me.
2
Strongly Agree
8.
1
1
2
3
4
5
1
2
3
4
5
1
2
3
4
5
Comments:________________________________________
__________________________________________________
__________________________________________________
__________________________________________________
__________________________________________________
__________________________________________________
9.
I liked seeing the histogram of class results displayed after
each question.
Comments:________________________________________
__________________________________________________
__________________________________________________
__________________________________________________
__________________________________________________
__________________________________________________
10.
The automatic (right/wrong) feedback that the remotes
provided through flashing LED lights was helpful.
Comments:________________________________________
__________________________________________________
__________________________________________________
__________________________________________________
__________________________________________________
__________________________________________________
92
Appendix D - continued
Strongly Disagree
5
Disagree
4
Neutral
3
Agree
When the automatic feedback indicated my answer was
incorrect, I continued working to determine why.
2
Strongly Agree
11.
1
1
2
3
4
5
1
2
3
4
5
1
2
3
4
5
Comments:________________________________________
__________________________________________________
__________________________________________________
__________________________________________________
__________________________________________________
__________________________________________________
12.
It would have been helpful if the remotes had been enabled to
allow more than one answer.
Comments:________________________________________
__________________________________________________
__________________________________________________
__________________________________________________
__________________________________________________
__________________________________________________
13.
I blindly entered answers, so that I would receive credit for
participating, without taking the time to think about the
problem and attempting to solve it first.
Comments:________________________________________
__________________________________________________
__________________________________________________
__________________________________________________
__________________________________________________
__________________________________________________
93
3
Neutral
Disagree
Strongly Disagree
Overall, using Qwizdom was a positive experience for me.
2
Agree
14.
1
Strongly Agree
Appendix D - continued
4
5
1
2
3
4
5
Comments:________________________________________
__________________________________________________
__________________________________________________
__________________________________________________
__________________________________________________
__________________________________________________
Part 2 – Open Response:
1. Suppose a friend asked your advice on which math class to take. Two sections of the
same class were offered at the same time and both had good instructors. One class
used an interactive student response system, such as Qwizdom, one did not. Which
would you recommend and why?
2. Did you prefer having the Qwizdom examples the same day as the lecture topic or at
the beginning of the following class period? Why?
94
Appendix D - continued
3. If you answered a Qwizdom question incorrectly, did you discuss the problem with
classmates around you to help determine why it was incorrect? If so, did this
collaborative approach help you to better understand the problem? Explain.
4. Which types of questions were most effective for your learning: multiple choice and
True/False questions, or open-ended questions with numeric answers? Please
explain.
5. Some students may spend a significant amount of time waiting for everyone else to
enter their answers in the Qwizdom remotes. Do you feel this lag time is taking away
from time spent on learning? Do you have any suggestions on how we can address
this lag time and keep all students engaged?
95
Appendix D - continued
6. Compare this course with another math course you have taken that was similar in the
manner it was taught and/or the content covered. Through comparison, discuss the
effects of Qwizdom on your learning and success.
7. Discuss other ways that Qwizdom might be used in class and why.
8. Please add any other comments, or elaborations, below (use the back if needed).
96
Appendix E: Instructor’s Experiences using Qwizdom
The comments that follow are directed towards Qwizdom’s Interactive Learning
System. Since I have not had the benefit of experimenting with other types of interactive
student response systems, these comments may or may not apply to systems in general.
Interact Software Program
When I started familiarizing myself with Qwizdom’s Interactive Learning System
during the summer of 2004, it was operating with a software program called T.A. I found
this program to be very non- intuitive and laborious to use. Fortunately, in the fall of
2004, Qwizdom introduced a new software program called Interact. This program is
Windows based, very similar to Microsoft PowerPoint, and is very intuitive and userfriendly. (The upgrade was for PC platforms only, but it is my understanding that they
are currently working on a Mac version.)
As with any new software program, there were “bugs” to work out. I was in
contact with technical representatives from Qwizdom almost daily, as we tried to identify
and troubleshoot these technical problems before my study began in the spring.
Consequently, three different upgrades to the Interact Software package were sent to us.
I discuss some of these difficulties in the “Technical Problems” sections below.
Curriculum Packages
As discussed in Chapter 2, Qwizdom offers a variety of ready-to-use K-12
curriculum packages. Since “All content can be edited and used in any of the software’s
presentation and printing formats” (Qwizdom, Inc., 2004, product brochure), I used the
question/answer sets in the Algebra I and II series as templates for developing interactive
question and answer slides for this college algebra course. That is, I took the series’
97
Appendix E - continued
existing slides and modified the questions and answers to more accurately reflect the
material covered in our college algebra textbook (Blitzer, 2002).
In addition to the question/answer sets, I found the lesson slides in the curriculum
package to be informative and nicely presented. In fact, I would have enjoyed
implementing the lesson slides into the course, but this PowerPoint-like presentation
would have incorporated an additional change from the traditional lecture environment,
possibly skewing the results of this study.
Although I find the curriculum packages to be respectable, there is room for
improvement. Unfortunately, I did not have time to review all of the slides for content,
but as with most textbooks, I did find a few errors to which I notified the Qwizdom
representative. In addition, I find that the answer slides are not as detailed or complete as
they could be. There can be up to 5 slides per question/answer set, but they rarely use all
5 slides. In fact, some questions only show the answer (2 slides total) without showing
any of the solution steps. Consequently, I modified the solution slides (that I used as
templates) so that they showed detailed solutions for class discussion.
Technical Problems – Resolved
Except for problems with the remotes, the following technical problems were not
problems of which the students were aware of, and should not have affected their
attitudes. However, they did affect me as the instructor.
Importing Class Lists
A nice feature of Qwizdom is the ability to import class lists from other
applications. Unfortunately, this feature was not working with the initial Interact
upgrade. After several days of troubleshooting with Qwizdom’s technical representative,
98
Appendix E - continued
we discovered that we had an old (prior to 12/16/04) version of Interact. Subsequently,
an upgrade was received and I was able to successfully import my class data, avoiding
the need to enter each name and ID manually.
Login ID
Once my class list was imported, I assigned each student an ID number – the last
4 digits of the ir social security number – that the student would enter on a remote to log
into the system.
One limitation to this method of ID number assignment is that Qwizdom does not
recognize leading zeros, which, incidentally, is not mentioned in the Qwizdom Interact
Help and User Guide (Qwizdom, Inc., 2004). Students that had leading zeros in the last 4
digits of their social security number were advised (in the Student Remote and Login
handout) to enter only those numbers after the leading zeros.
Length of names in class list is another limitation not mentioned in the Help and
User Guide. When I imported the class lists, I imported the entire name of each student
given (i.e. including middle name). When logging in remotes by ID, six of the IDs failed
with the following error message: “An unhandled exception has occurred in your
application… Index and count must refer to a location with the string…” The technical
representative at Qwizdom received the same error with my class list. Unable to
determine why this was happening, she passed the problem on to the programmers. The
programmers ascertained that the names for the IDs that failed were too long, and
recommended that I remove the middle names. Fortunately, this worked, and all students
were able to log into the system by the second day of class.
99
Appendix E - continued
Curriculum Folder Organization
To help with organization, the activities and curriculum folders can be neatly
arranged in a content tree, which comes up when the Interact application is opened.
When installing curriculum packages, the content folders should automatically arrange
under the applicable curriculum series folder. However, when I installed the Algebra I
curriculum package, the content folders for that series were not within the Algebra I
folder, but randomly distributed throughout the content tree. I subsequently re-arranged
the folders manually, but they reverted to the random distribution the next time the
Interact program was opened. Qwizdom was able to repair this problem and sent us
update files on 1/31/05.
% Wrong Flag
The % wrong flag appears if a preset percentage of students (set in the
presentation window) answered incorrectly. Although this sounds like a useful feedback
feature, I did not find it helpful because the flag does not come up until you advance to
the next question, and then only briefly. Preferably, it would appear while the
presentation is still on the question that the students got wrong. Then you can spend time
discussing the solution since the solution slides are part of the question/answer set.
However, I may have found the % wrong flag to be more useful if I had more time to use
it. It was not working until late in the study, after installing the third software update.
I found the histogram (bar graph) of class results to be a useful feedback tool.
The histogram was very helpful to me as an instructor because it alerted me to material
with which students had trouble understanding. This allowed me the opportunity to
resolve any questions in real-time, i.e. while the lecture material was still fresh in the
100
Appendix E - continued
students’ minds. The histogram worked well for multiple-choice and true/false questions,
but unfortunately, not for questions that required numeric entries because of the wide
range of possible answers.
Remotes
The remotes used in this study operate with 2-way infrared technology, which is
constrained to line-of-sight. That is, each remote and the receiver must have a clear and
direct “line-of-sight” path between them. This caused many problems for the students
when trying to log in and when entering answers, and I believe this is one of the system
“quirks” that students were referring to in the attitude surveys.
We started the semester in a very small classroom that had desks on the same
level. I did not foresee this as a problem because I thought the students could work
around the heads that were in front of them, blocking their line-of-sight. I was mistaken.
Fortunately, a tiered lecture hall was available for our use.
Moving to a tiered lecture hall helped, but did not resolve the line-of-sight
problems. Students still struggled with their remote entries not being acknowledged,
even when I stressed the importance of pointing the remote directly at the receiver.
Finally, I told them to think of the receiver like a television (TV) and their remote like a
TV remote. This was something they could relate to and it helped. Unfortunately, it was
not until the end of the study that most students successfully conquered the line-of-sight
issue.
On a daily basis, at least one student (not necessarily the same student) could not
get their remote to work and elected to try another one. I typically performed an
operational check on all remotes before class to ensure they were working, so I do not
101
Appendix E - continued
believe the remotes were faulty. Rather, I believe the students were still struggling with
line-of-sight issues as well as issues with the remote buttons (discussed in the unresolved
section below). However, there was one occasion in which we did have a faulty remote
(remote #3), in which the False button did not work. Upon further inspection, I
discovered a corroded circuit card and leaking/corroded batteries. Since the system was
relatively new and the batteries were included with the system, Qwizdom replaced the
remote at no charge. However, to eliminate this problem in the future, I highly
recommend removing the batteries if the remotes are not being used for an extended
period of time.
The remotes used in this study were the Q3 version, which uses 2-way infrared,
where line-of-sight between the remotes and the receiver is critical. According to
Qwizdom’s website (www.qwizdom.com), accessed on 8/22/05, they now have Q4 and
Q5 remotes that use a 2-way radio frequency. Thus, “all data is received without the ‘line
of sight issues’ typically associated with infrared (Q3) remotes.” Although for the most
part we were able to work around the line-of-sight issue, I believe the students’ attitudes
towards the systems’ “quirks” would have been different if we had been using radio
frequency remotes.
Technical Problems – Unresolved
Although the problems below remain unresolved, the only problems that directly
affected the students were issues surrounding logging in and the remotes. I discussed
many of problems with the technical representative at Qwizdom, and offered my
suggestions. She said that she would pass the suggestions on to the programmers for
possible future upgrades.
102
Appendix E - continued
Logging In
As many students pointed out in the student surveys, it takes a significant amount
of time to get everyone logged into the system. Each student has to enter their assigned
ID, and then verify that their login has registered. Unfortunately, students have to log in
each time you go into presentation mode (i.e. for each activity). To expedite the logging
in process, it would be helpful to be able to log in at the beginning of the class period for
all Qwizdom presentations that day. As soon as students arrive, they could pick up a
remote and log in, thereby reducing and possibly eliminating the amount of class time
required for this process. This is especially important for a class period that is only 50
minutes, as was the case for this course.
Furthermore, once a presentation starts, students are not able to log in. Therefore,
on days in which we had the Qwizdom examples at the beginning of class, students that
were a few minutes late could not participate. If Qwizdom, Inc. would redesign the
system, making the logging in process separate from the presentations, I believe this
problem and the problem in the previous paragraph would be resolved.
An additional problem with the logging in process concerns the login screen.
Since it would take too long for me to verify that everyone was logged in, I displayed the
login screen to the students so they could verify that their login was accepted. The login
screen only shows the first 10 logins. To see the others, the instructor has to scroll down
the list. Unfortunately, each time another person logs in, the screen reverts to the top.
Therefore, those that log in after the first 10 cannot see their name (i.e. verify their login)
until everyone has completed logging in and the instructor is able to scroll down to the
103
Appendix E - continued
bottom of the list. It would be helpful, and more time-efficient, if the system did not
revert to the top, but continued to scroll down as new names are added.
Remotes
Even though the line-of-sight issue is an inherent problem with infrared remotes,
we were able to work around it, for the most part anyway, as discussed above. Several
problems with the remotes could not be resolved, however, due to the design of the
remote or to the software program. Examples of these unresolved remote problems
include default remote numbers, momentary LED lights, and small buttons with the
inability to verify entries.
The software assigns default remote numbers to each student, which is overridden
when students log in by ID. If students do not log in by ID, then the software only
recognizes the default remote numbers assigned to each student. For example, if you
have 40 students on the class list, then the software recognizes 40 remotes – remotes
numbered 1-40. Unfortunately, the system does not recognize additional remote numbers
(e.g. 41-48). Of course, we discovered this the hard way. On a day when I decided not to
take the time needed to login by ID, students who picked up remotes numbered 41-48,
were not able to participate.
The right/wrong LED lights on the remotes do not stay on long enough to ensure
they are seen by the student. The light comes on as soon as the student’s answer is
acknowledged, but stays on only briefly (approximately 1-2 seconds). Unless the student
is looking directly at the remote when he or she sends the answer, the student will miss
this valuable feedback opportunity. This caused some frustration with the students, as
indicated by the attitude surveys in Chapter 5.
104
Appendix E - continued
The buttons on the remotes are somewhat small and require a certain level of
pressure before the student’s entry is acknowledged. Unfortunately, there is no way to
verify entries with the type of remote used in this study. Consequently, what the student
“thought” they entered may have been a correct answer, but the automatic feedback
showed otherwise. This inconsistency tended to confuse students. At the very least, it
frustrated them, as revealed by the attitude surveys discussed in Chapter 5. The small,
pressure-dependent, buttons also caused problems with logging in, making that timeconsuming process even longer.
The newer Q4 and Q5 versions of the remote have an LCD panel (larger on the
Q5 version) that allows users to see the answer and question number. This would have
been very helpful to the students in this study. For example, it would have eliminated the
problem with students receiving a wrong answer (or invalid login) when their answer on
paper was correct. If the students had been able “see” what they were entering, then I
believe their attitudes regarding some of the systems’ “quirks” would have been different.
The Q5 version also has a rocker switch that allows users to enter text-based
answers. This is one of the issues I have with the Qwizdom system we used, that the only
type of open-response question that can be answered with the Q3 remotes is one that
requires a numeric entry only. Of course, the Qwizdom slides can be used to discuss
other types of questions (e.g. fill in, short answer, essay, etc.), but students would have to
answer verbally or on paper. If answering verbally, then the benefits of anonymity are
negated. Having remotes that allow text-based answers opens up many possibilities for
the types of questions that can be asked.
105
Appendix E - continued
Slide editor screens
The slide editor (very similar to Microsoft PowerPoint) is where you create and
edit up to 5 slides (screens) for each question/answer set. Unfortunately, you cannot
move existing screens within the slider editor; you can only insert new screens
before/after the existing screens. Therefore, if you want to rearrange the order of the
screens, you cannot. I was able to work around this by copying/pasting and
inserting/deleting screens, but this is a little cumbersome.
Grade Book
Interact is able to track student answers, scores, and overall grades. This grade
book is available to the instructor only. Since I only graded students on participation, I
referred to the grade book to verify which students participated that day.
Unfortunately, the grade book does not allow comments where the scores for each
activity are located. Thus, I had to keep a separate log of students that had approved
absences (e.g. University sponsored events, athletes, etc.), or students who arrived to
class late (i.e. after login opportunity), so I would not penalize them for that day’s
participation/attendance grade.
Overall Attitude towards Qwizdom
Overall, I feel that Qwizdom’s Interactive Learning System is a well-designed,
user-friendly, and versatile wireless response system. Although we experienced some
technical problems with the system, these problems have been, or can be, resolved with
further programming and system upgrades.
106
BIOGRAPHY OF THE AUTHOR
Dina L. Blodgett was born in Jackson, Michigan in 1965. She grew up in a small
lakeside community in southern Michigan until age 17, when she moved to Roswell,
New Mexico with her parents. Upon graduation with honors from Roswell High School
in 1983, she attended New Mexico State University in Las Cruces and Eastern New
Mexico University in Roswell while working as a mortgage loan clerk for a local
financial institution.
In 1989, Dina joined the United States Navy, where she spent nine years active
duty as an aviation electronics technician, work center supervisor, and quality assurance
inspector. While serving her country, she received a Bachelor of Science in Sociology
from The University of the State of New York.
Upon her honorable discharge from the United States Navy in 1998, Dina
returned to school to study engineering. In 2002, she graduated summa cum laude with a
Bachelor of Science in Electrical Engineering and a Biology minor from the University
of Southern Maine.
While studying engineering, Dina realized that she would like to teach. She
worked as an associate process engineer until the opportunity to pursue an advanced
teaching degree became available in 2003. Dina is actively pursuing State of Maine
certification to teach secondary level mathematics, and would like to teach mathematics
at the college level as well. She is also pursuing certifications in secondary level physical
and life sciences, and in adult education. Dina is a candidate for the Master of Science in
Teaching (MST) degree from The University of Maine in May 2006.
107