1
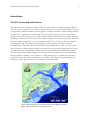
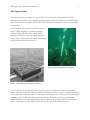
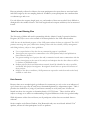
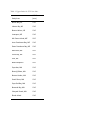
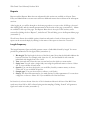
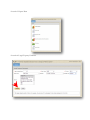
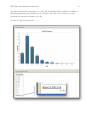
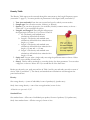
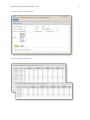
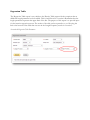
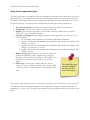
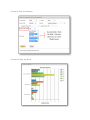
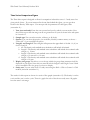
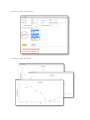
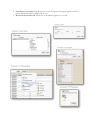
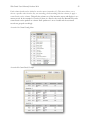
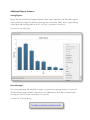
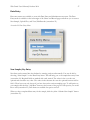
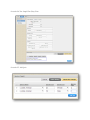
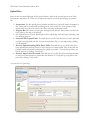
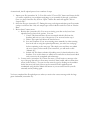
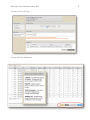
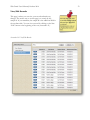
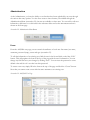
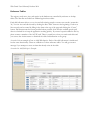
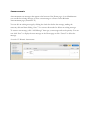
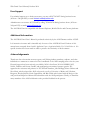
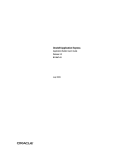
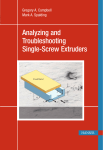
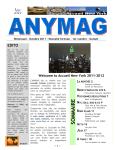
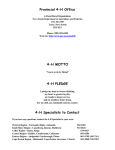
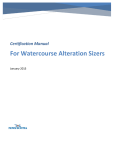
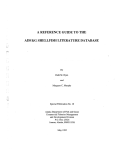
2 American Lobster Settlement Index Table of Contents Participants:......................................................................................................................................................... 4 Funding (since 1989): ........................................................................................................................................ 4 Introduction ........................................................................................................................................................ 5 The ALSI Partnership and Database .......................................................................................................... 5 Purpose of this Manual................................................................................................................................. 6 About the Web Portal................................................................................................................................... 6 Two Types of Data ....................................................................................................................................... 7 Data Use and Sharing Plan .......................................................................................................................... 8 Data Caveats .................................................................................................................................................. 8 Getting Started .................................................................................................................................................11 Levels of Access ..........................................................................................................................................11 Logging In/Accounts .................................................................................................................................11 Reports ..............................................................................................................................................................13 Length Frequency ........................................................................................................................................13 Density Table ...............................................................................................................................................16 Regression Table..........................................................................................................................................18 Study Area Comparison Figure .................................................................................................................19 Time Series Comparison Figure ................................................................................................................21 Raw Data Table ...........................................................................................................................................23 Additional Report Features ........................................................................................................................26 Saving Figures..........................................................................................................................................26 Error Messages ........................................................................................................................................26 Data Entry.........................................................................................................................................................27 New Sample/Key Entry .............................................................................................................................27 Upload Files .................................................................................................................................................29 View/Edit Records .....................................................................................................................................33 Administration..................................................................................................................................................34 Users ..............................................................................................................................................................34 Reference Tables .........................................................................................................................................35 Web Portal User’s Manual|October 2014 3 Announcements...........................................................................................................................................36 User Support.....................................................................................................................................................37 Additional Information ...................................................................................................................................37 Acknowledgements..........................................................................................................................................37 4 American Lobster Settlement Index Participants: University of Maine School of Marine Sciences www.umaine.edu/marine/ Maine Department of Marine Resources www.maine.gov/dmr/index.htm Massachusetts Division of Marine Fisheries www.mass.gov/eea/agencies/dfg/dmf/ Rhode Island Division of Fish & Wildlife www.dem.ri.gov/programs/bnatres/fishwild/ New Hampshire Department of Fish & Wildlife www.wildlife.state.nh.us/marine/ Department of Fisheries & Oceans Canada www.dfo-mpo.gc.ca/index-eng.htm Fishermen and Scientists Research Society www.fsrs.ns.ca/ Guysborough County Inshore Fishermen’s Association www.gcifa.ns.ca/ Funding (since 1989): NOAA/Sea Grant www.seagrant.noaa.gov/ NOAA/National Undersea Research Program www.nurp.noaa.gov/ NOAA/National Environmental Satellite, Data, and Information Service www.nesdis.noaa.gov/ National Science Foundation www.nsf.gov/ Department of Fisheries and Oceans Canada www.dfo-mpo.gc.ca/index-eng.htm Maine Department of Marine Resources www.maine.gov/dmr/index.htm Rhode Island Division of Fish & Wildlife www.dem.ri.gov/programs/bnatres/fishwild/ University of New Brunswick Atlantic Lobster Sustainability Foundation www.lobstersustainability.ca/ Web Portal User’s Manual|October 2014 5 Introduction The ALSI Partnership and Database The American Lobster Settlement Index (ALSI) is an annual survey of American lobster (Homarus americanus) nursery grounds in the northeast Atlantic off the coast of the US and Canada. The survey is supported by participant marine resource agencies, academic institutions, and the fishing industry. See page 4 for a complete list of participants. The survey gathers data not only on newly settled, young-of-year (YoY) lobsters, but also older juveniles and associated fauna such as fishes and crabs. Sampling is conducted by diver-based suction (airlift) samplers or vessel-deployed passive postlarval collectors. Approximately 100+ sites are sampled annually (Fig. 1). Each year, data are compiled from all regions and disseminated to the participants, industry groups, the media and other interested parties. The time series has been sustained and expanded since 1989, and is the largestscale assessment of lobster nursery habitat of its kind. It has also been the springboard for a variety of research projects, contributing to numerous peer-reviewed publications and technical reports. The data set provides valuable insights into both pre- and post-settlement processes influencing lobster population dynamics. A key objective of ALSI monitoring is to evaluate the forecasting power of the index for trends in recruitment to the fishery. The ALSI web portal enhances the availability of the region-wide data set to participants and stakeholders. Figure 1. ALSI monitoring sites where diver-based suction sampling (red) and/or passive collectors (yellow) have been deployed to date. Mission: To serve as a network of scientists and fishermen to monitor lobster nurseries throughout the species’ range using standardized protocols, and to provide accurate and timely reporting of the status of juvenile lobster populations and selected associated species, for purposes of stock assessment, forecasting, and research. Vision: Through the coordinated efforts of the ALSI partners, the time series becomes a key, region-wide indicator and predictor of the health of the lobster resource that is instrumental in managing the fishery. Values: Accurate and timely fishery-independent data are required for good lobster management and decision making. Coordination and collaboration amongst the partners are essential for success. The value of a comprehensive regional data base, centrally managed, is greater than the sum of the local data sets. The program must be responsive to changing needs of the partnership and of fishery managers. Data shall be accessible and easy to use. Decision processes for data access and use must be transparent and agreeable to all partners. Purpose of this Manual This manual provides background information on the ALSI partnership, the sampling tools and the resulting data base. Its main purpose is to serve as a guide for navigating the ALSI web portal. About the Web Portal The ALSI web portal is designed to serve a centralized data base to compile and report historical data collected from the entire spatial domain of the ALSI survey in the US and Canada. ALSI partners that conduct the survey and produce data submit their results annually to update time series. Data are uploaded as Excel spreadsheets or entered manually through web portal interface. Users can conduct data queries to produce reports in the form of tables and figures. Web Portal User’s Manual|October 2014 7 Two Types of Data The ALSI time series comprises two types of data: those from diver-based suction or airlift sampling and those from vessel-deployed passive postlarval collectors. Samples of juvenile lobsters and associated fauna are collected at the end of the lobster larval settlement season between August and October. Suction Sampling: Since the late 1980s, diver-based suction (airlift) sampling of naturally occurring cobble-boulder habitat has been widely used to quantify recruitment of recently settled American lobster (Fig. 2). This is the most widely used method of data collection for ALSI in the US. Figure 2. Diver-based airlift suction sampling. Figure 3. Vessel-deployed passive postlarval collector. Passive Collectors: Vessel-deployed passive postlarval collectors enable us to evaluate settlement at depths and locations that are otherwise unsafe or impractical for divers (Fig. 3). Collectors are made of 10-gauge vinyl-coated wire with a 37 mm mesh, measuring 61.0 cm x 91.5 cm x 15.0 cm deep and providing 0.55 m2 in floor area. These structures are then filled with rocks to provide suitable settlement habitat and weigh approximately 80 kg. Collectors are generally deployed in early July, prior to the settlement season, and are retrieved in at the end of the settlement season. Data are primarily collected on lobsters, but some participants also report data on associated crabs and fishes caught by the two sampling methods. In addition, some participants also contribute data on substrate type and cover. For each lobster the carapace length (mm), sex, and number of claws are recorded. Sex is difficult to distinguish for the smallest lobsters. Fish total length and crab carapace width may also be measured in mm. Data Use and Sharing Plan The University of Maine will work in partnership with the Atlantic Coastal Cooperative Statistics Program (ACCSP) to serve as the steward of the data uploaded to the ALSI online database. ALSI data are the intellectual property of the ALSI partner where the data set originated. The ALSI partners encourage the open, collaborative sharing of data with the scientific, fishery management and fishing industry, subject to these guidelines: Use or reproduction of the data for any commercial purpose is prohibited. Investigators are expected to communicate to the ALSI partner analysis and publications plans related to the data. Any person making use of project data and/or numerical results must communicate with the project investigators at the start of the analysis and anticipate that the data collectors will be co-authors of published results. Student projects (thesis and dissertation research) should be identified as early as possible and shared with project investigators. Investigators should strive to protect the interests of these projects. Subject to the above conditions, ALSI partners are expected to make data and results freely available to each other. Data Caveats Because there are no morphological age indicators for crustaceans, we rely on size as an indicator of age. Lobster size at age varies by study area as determined primarily by temperature regime. Table 1 provides size definitions of young-of-year lobsters currently in use by study area. Lobsters are binned into these size categories to determine density of YOY lobster. These size bins will be subject to change as we refine our understanding of regional differences in the size-age relationship. While all partners collect data on lobster, not all participants collect data on associated fauna or substrate. Suction samples at the Beaver Harbour, New Brunswick study area are collected within 0.25 m 2 quadrats, whereas all other participants use 0.5 m 2 quadrats. Web Portal User’s Manual|October 2014 9 Some data from New Brunswick have been withheld for student use, not including Beaver Harbour. In 1997, there was a second late season suction sampling effort at Damariscove Island-West in Midcoast Maine, resulting in two data sets at that site for that year. Table 1. Upper limits for YOY size bins. Study Area YOY Size (mm) Bonne Bay, NL 13.0 Lobster Bay, NS 13.0 Beaver Harbor, NS 13.0 Jonesport, ME 13.0 Mt. Desert Island, ME 10.5 Inner Penobscot Bay, ME 13.0 Outer Penobscot Bay, ME 13.0 Mid-Caost, ME 10.5 Casco Bay, ME 10.5 York, ME 10.5 New Hampshire 10.5 Cape Ann, MA 12.0 Beverly/Salem, MA 12.0 Boston Harbor, MA 12.0 South Shore, MA 12.0 Cape Cod Bay, MA 12.0 Buzzards Bay, MA 13.0 Vineyard Sound, MA 13.0 Rhode Island 13.0 Web Portal User’s Manual|October 2014 11 Getting Started Levels of Access There are three levels of access or user types associated with the ALSI web portal. All accounts require a username and password. Please contact an Administrator to obtain an account (see User Support page 36 for a list of Administrators). The three user types are: 1) Reports only account: This account is for users that are interested in reading background material and obtaining access to data available through the reports section of the portal. 2) Data Entry account: This account allows data entry and uploads, as well as data queries from the data base through the portal interface. 3) Administrative account: This account allows for all functionality available to the Data Entry account, as well as the ability to manage users, reference tables, and announcements. Logging In/Accounts All users will login to the ALSI portal thorough the login page as seen in Screenshot 1. (http://mahi.accsp.org:8888/pls/htmldb_safis/f?p=110:LOGIN:18672299574696) Your username will be your first initial and your last name with no capital letters or punctuation. For example, John Smith would have a username of jsmith and Jane Doe-Smith would have a username of jdoesmith. Your Administrator will provide you with a default password when your account is created. The first time you login you will be asked to create a new password. Your Administrator can reset your password if you should need. If you incorrectly enter your login information, you will be asked to wait for 5seconds before attempting to login again. Each incorrect entry will extend the wait time by an additional 5 seconds. Screenshot 1: Login Page Screenshot 2: Home Page Web Portal User’s Manual|October 2014 13 Reports Reports and the Reports Menu that are referenced in this section are available to all users. Data Entry and Administrative account users will have additional menus that are discussed in subsequent sections. After logging in, you will be brought to the home page where you can see the ALSI logo, the user’s data sharing policy and the current announcement at the bottom of the page (screenshot 2). Menus are available at the top of the page. The Reports Menu that is the topic of this section, can be accessed by clicking the box “Reports”, circled in red. This will bring you to the Reports Menu page (screenshot 3). We will now discuss the available options, functions and results of each of these reports. Each report can be accessed simply by clicking on the name of the report as shown in Screenshot 3. Length Frequency The length frequency figure and table generate counts of individuals binned by length. You must provide six parameters for this figure/table (screenshot 4): 1. Bin length: The bin length is the size of the bin in mm. Note that the bin labels indicate the bottom of the bin. For example, with a bin size of 5, the bin labeled 10 will count the individuals with lengths from 10 to 14.99. 2. Year (start and end): Enter the start year and end year for which you want results. 3. Study area: You can select a single study area using the pull down menu or choose “Select All” if you would like all study areas. 4. Species: You can select the species you would like, listed by common name, or choose “Select All” if you would like all species. 5. Sample type: You can select suction, collector, or all (both). 6. Site(s): This list will be narrowed as you make choices for other parameters. You can select a single site or choose –Select All- if you would like all of the listed sites. In Screenshot 4, we have chosen a bin size of 10 for American lobster in all sites of the Mid-Coast study areas from 1990 to 2013 collected using suction sampling. Clicking “Search” will generate a figure and a table of results (screenshot 5). Screenshot 3: Reports Menu Screenshot 4: Length Frequency Parameters Web Portal User’s Manual|October 2014 15 The table of results can be exported to a .csv file. This functionality will be available in a number of tables throughout the portal. Anytime you see “Export to CSV File” as in Screenshot 5, you can download the contents of the table to .csv file. Screenshot 5: Length Frequency Results Density Table The Density Table report can be accessed through the same menu as the Length Frequency report (screenshot 3 –page 13). You must provide six parameters for this figure/table (screenshot 6): 1. Year (start and end): Enter the start year and end year for which you want results. 2. Sample type: You can select suction, collector, or all(both). 3. Species: You can select the species you would like, listed by common name, or choose – “Select All”- if you would like all species. 4. Length 1 and Length 2: These lengths will represent the upper limit of the bin. So, if you chose 12 and 19: a. All: The density and standard error calculations will include all animals. b. Length 1: The density and standard error calculations will include those animals with a length <= 12 mm. c. Length 2: The density and standard error calculations will include those animals with a length > 12 mm and <= 19 mm. d. Length 3: The density and standard error calculations will include those animals with a length > 19 mm. 5. Study area: You can select a single study area using the pull down menu or choose “Select All” if you would like all study areas. 6. Site(s): This list will be narrowed as you make choices for other parameters. You can select a single site or choose “Select All” if you would like all of the listed sites. Results are shown by year, study area and site in Table 1 and by year and study area with a count of sites in Table 2 (screenshot 7). The density and standard error calculations used throughout the portal are listed here. Density Site average density = (count of individuals/count of quadrats)*(1/quadrat area) Study Area average density = sum of site average densities/count of sites All densities are expressed as N/m2. Standard Error Site standard error = SD count of individuals per quadrat/√count of quadrats/√(1/quadrat area) Study Area standard error = SD site averages/√count of sites Web Portal User’s Manual|October 2014 Screenshot 6: Density Table Parameters Screenshot 7: Density Table Results 17 Regression Table The Regression Table report is very similar to the Density Table report with the exception that an additional length parameter has been added. This is circled in red in Screenshot 8. Remember that the length parameters represent the upper limit of the bin. The purpose of this report is to provide input for the iterative regression process. The results of the table can be exported as a .csv file using the link at the bottom of the table that was seen in the Length Frequency results in Screenshot 5. Screenshot 8: Regression Table Parameters Web Portal User’s Manual|October 2014 19 Study Area Comparison Figure The Study Area report is designed to allow for comparison in densities across study areas for a given period of time. If you are interested in the raw data behind this figure, you can get those results in the Density Table report. This report has a parameter and selection feature that we have not seen in the previous reports. You must provide six parameters for this figure/table (screenshot 9): 1. Year (start and end): Enter the start year and end year for which you want results. 2. Sample type: You can select suction, collector, or all (both). 3. Species: You can select the species you would like, listed by common name, or choose “Select All”- if you would like all species. 4. Length 1 and Length 2: These lengths will represent the upper limit of the bin. So, if you chose 12 and 19: a. All: The density and standard error calculations will include all animals b. Length 1: The density and standard error calculations will include those animals with a length <= 12 mm. c. Length 2: The density and standard error calculations will include those animals with a length > 12 mm and <= 19 mm. d. Length 3: The density and standard error calculations will include those animals with a length > 19 mm. 5. Display size group: This allows you to choose which size group from parameter 4 will be displayed in your figure. Note that you must fill in both Length 1 and Length 2 even if both are not needed for the size group you chose to display. 6. Study area: You can select a single study area, choose “Select All” if you would like all study areas or use the Shift + Click or Control + Click method to select multiple study areas. The results for this report are shown in a bar chart (screenshot 10). The density is on the x-axis and the study area, with the maximum number of sites sampled in a single year found in the figure in parenthesis, is on the y-axis. The legend shows which year(s) are represented by each bar color in the figure. Screenshot 9: Study Area Parameters Screenshot 10: Study Area Results Web Portal User’s Manual|October 2014 21 Time Series Comparison Figure The Time Series report is designed to allow for comparison in densities across 1-3 study areas for a given period of time. If you are interested in the raw data behind this figure, you can get those results in the Density Table report. You must provide six parameters for this figure/table (screenshot 11): 1. Year (start and end): Enter the start year and end year for which you want results. Note that for this report the time range can be no greater than 30 years as shown in the red square in Screenshot 11. 2. Sample type: You can select suction, collector, or all (both). 3. Species: You can select the species you would like, listed by common name, or choose – “Select All”- if you would like all species. 4. Length 1 and Length 2: These lengths will represent the upper limit of the bin. So, if you chose 12 and 19: a. All: The density and standard error calculations will include all animals. b. Length 1: The density and standard error calculations will include those animals with a length <= 12 mm. c. Length 2: The density and standard error calculations will include those animals with a length > 12 mm and <= 19 mm. d. Length 3: The density and standard error calculations will include those animals with a length > 19 mm. 5. Display size group: This allows you to choose which size group from parameter 4 will be displayed in your figure. Note that you must fill in both Length 1 and Length 2 even if both are not needed for the size group you chose to display. 6. Study area: You can select from 1-3 study areas using the Shift + Click or Control + Click method (circled in screenshot 11). The results for this report are shown in a series of line graphs (screenshot 12). The density is on the x-axis and the year is on the y-axis. There is a graph for each of the chosen study areas. All graphs have the same x-axis range. Screenshot 11: Study Area Parameters Screenshot 12: Study Area Results Web Portal User’s Manual|October 2014 23 Raw Data Table The Raw Data Table report is designed to allow for flexibility in viewing data. This is the most versatile of the ALSI data report options. The default format for this table mimics the upload format with the addition of the sample id field. The search bar and actions menu allows you to perform a number of functions. Screenshot 13 shows the search bar and actions menu. The search bar will search all fields and rows for the search value. Screenshot 13: Raw Data Search Bar and Action Menu The Actions menu contains the following options (screenshot 13): 1. Select Columns (screenshot 14): Allows you to specify which columns to display and in what order. You can use the arrows to move columns from one side to the other. 2. Filter (screenshot 15): Allows you to filter your results for specific values. You can choose a column, a relational operator and a value from the pull down lists. 3. Rows Per Page: Lets you determine how many rows to display per page. 4. Format (screenshot 16) contains the following submenu: a. Sort: Allows you to choose the columns to sort on and determine whether to sort in ascending or descending order. b. Highlight: Allows you to define a filter that highlights the rows that meet your criteria. c. Compute: Allows you to add computed columns to a report. d. Aggregate: Allows you to perform mathematical computations against a column. e. Chart: Displays the report data as a chart. f. Group By: Allows you to group the result set by one or more columns and perform mathematical computations against columns. 5. Save Report (screenshot 17): Allows you to save the report. Your report will be saved as a private report and will be available only to you. 6. Download (screenshot 18): Allows you to download a report as a .csv file. Web Portal User’s Manual|October 2014 25 Each column header can be clicked to reveal a menu (screenshot 19). This menu allows you to choose a specific value from the list, sort ascending, sort descending, hide the column, or apply a control break on the column. This pulls the column out of the interactive report and displays it as a master record. In the example in Screenshot 20, there is a filter for the study area Buzzards Bay and a control break on the quadrat no column. Each quadrat no is now a header and the associated records are grouped accordingly. Screenshot 19: Column Heading Menu Screenshot 20: Control Break Example Additional Report Features Saving Figures Figures that are created in the Length Frequency, Study Area Comparison, and Time Series reports can be saved and/or copied so that they can be put into a document. This is done by right-clicking on the figure and choosing either “Save As” or “Copy” as shown in Screenshot 21. Screenshot 21: Save/Copy Figure Error Messages If you enter parameters that will yield no results, you get the error message shown in Screenshot 22. All other error messages should be reported to your Administrator. Note that it is helpful when resolving the issue if you take a screenshot of your error. Screenshot 22: No Results Message Web Portal User’s Manual|October 2014 27 Data Entry Data entry menus are available to users with Data Entry and Administrator accounts. The Data Entry menu is available on the left margin of the Home and Record pages and allows you to create a New Sample, Upload Files, and View/Edit Records (screenshot 23). Screenshot 23: Data Entry Menu New Sample/Key Entry New data can be entered into the database by entering each record manually. You can do this by choosing “New Sample” on the Data Entry menu. This will bring you to the sample data entry form (screenshot 24). Required fields are marked with a red asterisk. The values in the cover box are optional and can add to any value. The values in the substrate box are also optional but must add to 100%. These boxes are only shown if you have chosen the suction sampling type. To add species to your sample click the blue “Add Row” button at the bottom of the page for each species you would like to add (screenshot 25). Pull downs are available for species and sex. When you have completed data entry for the sample, click the yellow “Submit New Sample” button (screenshot 25). Screenshot 24: New Sample Data Entry Form Screenshot 25: Add Species Web Portal User’s Manual|October 2014 29 Upload Files Data can also be entered through the file upload feature, which is the second option on the Data Entry menu (screenshot 23). There are six important features on the file upload page (screenshot 26). 1. Instructions: The file upload process requires that files be in a specific format. Examples of this format can be downloaded by clicking on the icons in this box. Note that these files intentionally have errors in codes so that they cannot be accidentally loaded. 2. Progress Bar: This tracks your progress through the file upload. Always make sure that you have gotten to the end of the process. 3. File Upload Process: The file upload process box will change with each step. Uploading a file is a multistep process. 4. Successful File Upload Table: This table shows you all of the files that you have uploaded and when you uploaded each file. You can download the file as it was imported by clicking on “Download”. 5. Previous Uploads Pending/With Errors Table: This table shows you all files that have been uploaded but still have errors or rows that have not been loaded. Files in this table are partially loaded and should be addressed as quickly as possible. You can pick up where you left the process by clicking “View/Edit”. 6. Previous Imports Not Processed: This table shows you files that have been imported but no rows have been checked or loaded into the database. You can pick up your place in the process by clicking “View/Edit”. Screenshot 26: File Upload Page As mentioned, the file upload process has a number of steps: 1. Import your file (screenshot 26, 3): You click on the ”Choose File” button and locate the file you wish to upload on your computer navigating as you normally do through your folders. Once you have found the file, click on “Open” and the file name will appear. Click on “Import File”. 2. Select the file type (screenshot 27): During this step you designate whether your file contains suction or collector data. Only one sample type can be loaded in each file. Click on “Review Data”. 3. Review data/Correct errors a. Review data (screenshot 28): You are now viewing your data as they have been uploaded and you have four options. You can: i. Cancel: This button deletes all rows associated with this file from the database and exits you out of the process. You are now back at step 1. ii. Delete: This option will delete the checked rows. iii. Save and Continue: If you are correcting errors manually by either entering data in the cell or using the optional pull downs, you must save each page before continuing to the next page. This simply saves and does not submit the rows. Once you have made your corrections, you will need to click “Submit All”. iv. Submit All: This button submits all pending rows for check and write to the database. You use this button to submit rows until all rows have been loaded and you receive the completed upload message. b. Correct errors (screenshot 29): If there are errors, you will receive a message at the top of the page that tells you how many rows have been loaded and how many have errors (in the red box). You can view the errors by type by clicking on the number before the error (red circle). Errors can be corrected in the application and resubmitted using the blue Submit All button or you can cancel and fix your file externally and try loading again. You have completed the file upload process when you receive the success message with the large green checkmark (screenshot 30). Web Portal User’s Manual|October 2014 Screenshot 27: Choose File Type Screenshot 28: Review Data Buttons 31 Screenshot 29: Correct Errors Screenshot 30: Successful Upload Message Web Portal User’s Manual|October 2014 View/Edit Records This page is where you can view your record and make any changes. The easiest way to use this page is to search by the sample id. If you remember, the sample id is the additional field in the raw data table. You can view a record by clicking on the blue “Edit” button at the beginning of the row (screenshot 31). Screenshot 31: View/Edit Records 33 Administration As the Administrator, you have the ability to see data that have been uploaded by any user through the various data entry options. You also have access to three features, all available through the Administration Menu (screenshot 32), that are not available to other users. You can add or edit user information, add items to or edit items in the reference tables and set the announcement that is shown on the front page. Screenshot 32: Administration Menu Button Users From the Add/Edit user page you can control the attributes of each user: first name, last name, username, password (temp), status and type (screenshot 33). To edit the information of an existing user, find the user in the list and click on the blue “Edit” button. This will populate the form at the top of the page with the user’s information. You can change any field and save your changes by clicking “Save”. You can reset the password to some default value and Save if a user has lost their password. To create a new user, simply fill in the form at the top of the page and click the “Create” button. Note that you cannot create a user with the same username as an existing user. Screenshot 33: Add/Edit User Page Web Portal User’s Manual|October 2014 35 Reference Tables The regions, study areas, sites, and species in the database are controlled by reference or lookup tables. The data that are loaded are validated against these tables. Each add/edit menu allows you to view and edit existing records or create new records (screenshot 34). You can view and edit records by clicking the blue “Edit” button at the beginning of each row. New records can be created by filling in the form at the top of the page and clicking the “Create” button. Pull down menus have been provided where possible. Note that the available species pull down is a limited list to keep the application working quickly. If you need a species added to this list, please contact a member of the ACCSP staff. There is search bar so that you search each table and you can use the Actions menu to download the table for distribution to the group. Screenshot 34 is an example of how to Add/Edit Species. Each of the add/edit menus is similar and has the same functionality. There are validations on these reference tables. You will get an error message if you attempt to create an item that already exists in the table. Screenshot 34: Add/Edit Species Example Announcements Announcements are messages that appear at the bottom of the Home page. As an Administrator you can edit the existing message or create a new message to all users on the Maintain Announcement page (screenshot 35). You can edit an existing message by clicking the check box before the message, making the necessary edits and then clicking “Save”. You can use this method to delete an existing message. To create a new message, click “Add Message” then type your message and set the priority. You can now click “Save” to display the new message on the Home page or click “Cancel” to delete the message. Screenshot 35: Maintain Announcement Web Portal User’s Manual|October 2014 37 User Support For technical support or to obtain an account, you may call 207.563.8297 during business hours (8:30 am - 5:00 pm EST) or email [email protected]. Administrators can contact ACCSP staff by calling 703.842.0780 during business hours (8:30 am 5:00 pm EST) or email [email protected]. The ALSI Web Portal is compatible with Internet Explorer, Mozilla Firefox and Chrome platforms. Additional Information The ALSI Web Portal User’s Manual is produced exclusively by the ALSI Partners and the ACCSP. It is instructive in nature and is intended only for users of the ALSI Web Portal. Portions of this manual were excerpted from Oracle® Application Express Application Builder User's Guide Release 4. No specific citations have been made in order to preserve the continuity of this document. Acknowledgements Thanks are due to the marine resource agency staff, fishing industry members, students, and other individuals too numerous to name who have contributed to the ALSI sampling effort over the years. Financial support has been variously provided by NOAA-Sea Grant, NOAA-NESDIS, NSF, NASA, Fisheries and Oceans Canada, and participating state marine resource agencies. We appreciate the assistance and patience of ACCSP staff members, Julie Defilippi, Karen Holmes and Nico Mwai, who developed the ALSI web portal, as well as University of Maine staff, Charlene Bergeron, Phoebe Jekielek, Noah Oppenheim, and Rick Wahle who assisted with the design of the web portal and helped coordinate data submission with the ALSI participants. Finally, we thank the many members of the ALSI collaborative who provided feedback in the process. AMERICAN LOBSTER SETTLEMENT INDEX WEB PORTAL USER’S MANUAL RELEASE APRIL 2014