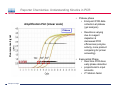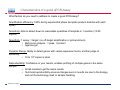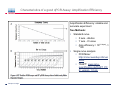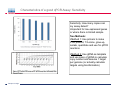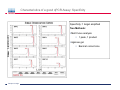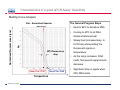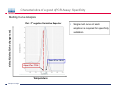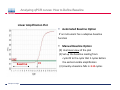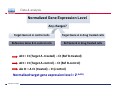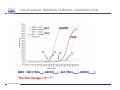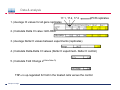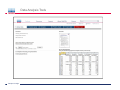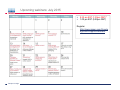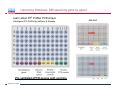
1
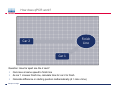
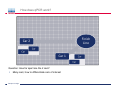
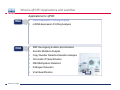
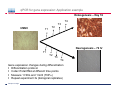
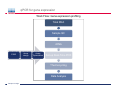
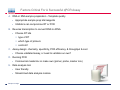
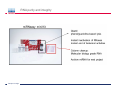
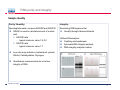
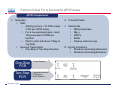
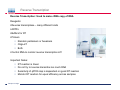
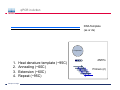
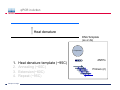
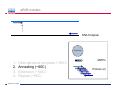
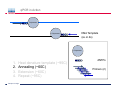
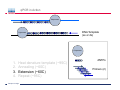
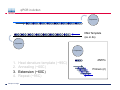
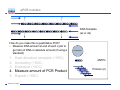
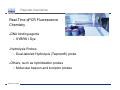
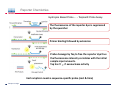
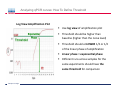
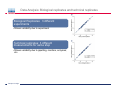
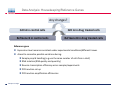
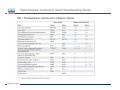
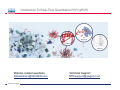
Introduction To Real-Time Quantitative PCR (qPCR)
Webinar-related questions:
[email protected]
Sample to Insight
Technical Support:
[email protected]
Welcome to our 4-part webinar series on qPCR
qPCR technology overview, applications, data
analysis and interpretation
Registration link: https://attendee.gotowebinar.com/register/1255411748535841794
Part 1: Introduction to Real Time PCR (Q-PCR/qPCR/qrt-PCR)
Part 2: Pathway-focused Gene Expression Analysis - Advanced Real-Time PCR
Array Technology
Part 3: PCR Array Data Analysis Tutorial
Part 4: Accelerate your discovery with QIAGEN service solutions for biomarker
research
Sample to Insight
2
Legal Disclaimer
QIAGEN products shown here are intended for molecular biology applications. These products are not
intended for the diagnosis, prevention, or treatment of a disease.
For up-to-date licensing information and product-specific disclaimers, see the respective QIAGEN kit
handbook or user manual. QIAGEN kit handbooks and user manuals are available at www.QIAGEN.com
or can be requested from QIAGEN Technical Services or your local distributor.
Sample to Insight
How does qPCR work?
Finish
Line
Car 2
Car 1
Question: How far apart are the 2 cars?
Cars race at same speed to finish line
As car 1 crosses finish line, calculate time for car 2 to finish
Calculate difference in starting position mathematically (d = rate x time)
Sample to Insight
How does qPCR work?
Finish
Line
Car 2
Car 1
Question: How far apart are the 2 cars?
Many cars; how to differentiate cars of interest
Sample to Insight
Seminar Topics
1.
What is qPCR? Applications and workflow
2.
qPCR for gene expression: What is the change in gene expression during
differentiation?
3.
Factors Critical For A Successful qPCR Assay
4.
RNA purity and integrity
5.
Reverse Transcription
6.
qPCR in Action
7.
Reporter chemistries
8.
Characteristics of a good qPCR assay
9.
Analyzing qPCR curves
10. Data & analysis
Sample to Insight
What is qPCR? Applications and workflow
What does Real-Time qPCR stand for?
Quantitative Polymerase Chain Reaction (qPCR) is a sensitive and reliable method for
detection and quantification of nucleic acid (DNA & RNA) levels.
It is based on detection and quantification of fluorescence emitted from a reporter
molecule in real time.
This detection occurs during the accumulation of the PCR product with each cycle of
amplification
Monitor the PCR reaction during early & exponential phase, where the first significant
increase in the amount of PCR product correlates to the initial amount of target template.
Sample to Insight
What is qPCR? Applications and workflow
Applications for qPCR
RNA
DNA
Sample to Insight
Gene Expression Profiling Analysis
miRNA Expression Profiling Analysis
SNP Genotyping & allelic discrimination
Somatic Mutation Analysis
Copy Number Detection/Variation Analysis
Chromatin IP Quantification
DNA Methylation Detection
Pathogen Detection
Viral Quantification
What is qPCR? Applications and workflow
Work Flow: A Brief Look
Sample
RNA (total, mRNA,
small RNA)
DNA
Sample QC
cDNA
SYBR/Probe
Assay design
Assay
Optimization
Sample QC
Real Time PCR Set Up
Instrument Set up & thermal cycling
Data Output & Analysis
Sample to Insight
What is qPCR? Applications and workflow
Applications for qPCR
RNA
DNA
Sample to Insight
Gene Expression Profiling Analysis
miRNA Expression Profiling Analysis
SNP Genotyping & allelic discrimination
Somatic Mutation Analysis
Copy Number Detection/Variation Analysis
Chromatin IP Quantification
DNA Methylation Detection
Pathogen Detection
Viral Quantification
qPCR for gene expression: Application example
Osteogenesis – Day 16
T4
hMSC
T2
T3
T1
Neurogenesis – 72 hr
T1
T2
T3
T4
Gene expression changes during differentiation
Differentiation protocol
Collect Total RNA at different time points
Measure 1 HKG and 1 GOI (TNFα)
Repeat experiment 3x (biological replicates)
Sample to Insight
qPCR for gene expression
Work Flow: Gene expression profiling
Total RNA
Sample QC
cDNA
SYBR
Assay
design
Assay
Optimization
Set-up Real-Time PCR
Thermocycling
Data Analysis
Sample to Insight
Factors Critical For A Successful qPCR Assay
A. DNA or RNA sample preparation - Template quality
Appropriate sample prep kits/reagents
Inhibitors can compromise RT or PCR
B. Reverse transcription to convert RNA to cDNA
Choose RT kits
type of RT
which type of primers
controls?
C. Assay design: chemistry, specificity, PCR efficiency, & throughput & cost
Choose validated assay, or need to validate our own?
D. Running PCR
Commercial mastermix or make own (primer, probe, master mix)
E. Data analysis tool
User friendly
Streamlined data analysis module
Sample to Insight
RNA purity and integrity
RNA Isolation:
Considerations
Sample type/amount
Target (total RNA, mRNA, miRNA)
Throughput
Difficult samples (stool, FFPE)
Challenges
Contamination (gDNA)
Yield
Quality
Method
Qiazol?
Column based method (RNeasy?)
Both: Efficient lysis and inhibition of RNases; molecular grade RNA
miRNA? Use a kit specific for miRNA and mRNA
Sample to Insight
RNA purity and integrity
Sample to Insight
RNA purity and integrity
Sample Quality
Purity/ Quantity:
Integrity:
Spectrophotometer: measure 260/280 and 260/230
OD260 is used to calculate amount of nucleic
acid
260/280 ratio
– typical minimum value 1.8-2.0
260/230 ratio
– typical minimum value 1.7
Denaturing RNA Agarose Gel
Usually through ribosomal bands
Low ratio may indicate a contaminant: protein,
QIAzol, Carbohydrates, Glycogen
Absorbance measurements do not show
integrity of RNA
QIAxcel/ Bioanalyzer
Capillary electrophoresis
Automate RNA integrity analysis
RNA integrity analysis number
Sample to Insight
16
Factors Critical For A Successful qPCR Assay
qPCR Components
A. Templates:
RNA
Starting amount ~10-1000 copies
of NA per qPCR assay
For a low-expressed gene, need
10ng equivalent of RNA per
reaction
Want to start with about 100pg to
1ug RNA
Reverse Transcription
One-Step or Two-Step Reaction
One-Step
PCR
• 1 Tube Reaction
Two-Step
PCR
• 2 separate reactions
• RT Reaction
• qPCR Reaction
Sample to Insight
B. Primers/Probes
C. Master Mix
DNA polymerase
Mg++
dNTPs
Buffer
Passive reference dye
D. Cycling Conditions
Denature>Annealing>Extension
Denature>Annealing/Extension
Reverse Transcription
Reverse Transcription: Used to make cDNA copy of RNA
Reagents:
Reverse transcriptase – many different kinds
dNTPs
Buffers for RT
Primers
Random pentamers or hexamers
Oligo-dT
Both
Control RNA to monitor reverse transcription kit?
Important Notes:
RT reaction is linear
Do not try to reverse transcribe too much RNA
Sensitivity of qPCR step is dependent on good RT reaction
Monitor RT reaction for equal efficiency across samples
Sample to Insight
qPCR in Action
DNA Template
(ss or ds)
What is in a PCR Reaction?
PCR= Polymerase Chain Reaction
Exponential Amplification of DNA in single tube
All reagents in excess (non-limiting)
Components:
•Thermostable polymerase
•dNTPs
•Primers
•Template
Sample to Insight
Polymerase
dNTPs
Primers (2)
qPCR in Action
DNA Template
(ss or ds)
Polymerase
1.
2.
3.
4.
Heat denature template (~95C)
Annealing (~60C)
Extension (~60C)
Repeat (~95C)
Sample to Insight
dNTPs
Primers (2)
qPCR in Action
Heat denature
DNA Template
(ss or ds)
Polymerase
1.
2.
3.
4.
Heat denature template (~95C)
Annealing (~60C)
Extension(~60C)
Repeat (~95C)
Sample to Insight
dNTPs
Primers (2)
qPCR in Action
DNA Template
Polymerase
1.
2.
3.
4.
Heat denature template (~95C)
Annealing (~60C)
Extension (~60C)
Repeat (~95C)
Sample to Insight
dNTPs
Primers (2)
qPCR in Action
Polymerase
Polymerase
DNA Template
(ss or ds)
Polymerase
1.
2.
3.
4.
Heat denature template (~95C)
Annealing (~60C)
Extension (~60C)
Repeat (~95C)
Sample to Insight
dNTPs
Primers (2)
qPCR in Action
Polymerase
DNA Template
(ss or ds)
Polymerase
Polymerase
1.
2.
3.
4.
Heat denature template (~95C)
Annealing (~60C)
Extension (~60C)
Repeat (~95C)
Sample to Insight
dNTPs
Primers (2)
qPCR in Action
Polymerase
DNA Template
(ss or ds)
Polymerase
Polymerase
1.
2.
3.
4.
Heat denature template (~95C)
Annealing (~60C)
Extension (~60C)
Repeat (~95C)
Sample to Insight
dNTPs
Primers (2)
qPCR in Action
DNA Template
(ss or ds)
Polymerase
1.
2.
3.
4.
Heat denature template (~95C)
Annealing (~60C)
Extension (~60C)
Repeat (~95C)
Sample to Insight
dNTPs
Primers (2)
qPCR in Action
DNA Template
(ss or ds)
How do you make this a quantitative PCR?
• Measure DNA amount at end of each cycle to
get ratio of DNA or absolute amount (if using a
standard)
1.
2.
3.
4.
5.
Heat denature template (~95C)
Annealing (~60C)
Extension (~60C)
Measure amount of PCR Product
Repeat (~95C)
Sample to Insight
Polymerase
dNTPs
Primers (2)
Reporter chemistries
Real-Time qPCR Fluorescence
Chemistry
DNA binding agents
SYBR® I Dye
Hydrolysis Probes
Dual-labeled Hydrolysis (Taqman®) probe
Others, such as hybridization probes
Molecular beacon and scorpion probes
Sample to Insight
Reporter chemistries: SYBR® Green I Assay
Non fluorescent SYBR I
SYBR I binds to double-strand DNA but not
single strand DNA. Little fluorescence emitted
from SYBR I in solution.
SYBR I upon binding to double-strand DNA
emits fluorescence very brightly
Fluorescent SYBR I
The SYBR I signal intensities correlate with
DNA amplified (amplicon amount) thus the
initial sample input amounts
• Simple & cost saving
• High Specificity Is Required when using SYBR Green since SYBR I binds all double-strand
DNA (non-specific or primer dimer).
Sample to Insight
Reporter Chemistries: Understanding Kinetics in PCR
•
Amplification Plot (Linear scale)
Plateau phase
• End-point PCR data
collection at plateau
(gel analysis)
Plateau
Fluorescence Signal
•
107 106 105
Sample to Insight
•
Reactions varying
due to reagent
depletion &
decreased PCR
efficiencies (enzyme
activity, more product
competing for primer
annealing)
Exponential Phase
• Real time PCR does
early phase detection
• proportional to input
amounts
• 2n=dilution factor
Reporter Chemistries
Hydrolysis Based Probe - - - Taqman® Probe Assay
The fluorescence of the reporter dye is suppressed
by the quencher
Primer binding followed by extension
Probe cleavage by Taq to free the reporter dye thus
the fluorescence intensity correlates with the initial
sample input amounts.
Taq has 5’ 3’ exonuclease activity
Each amplicon needs a sequence-specific probe (cost & time)
Sample to Insight
Reporter Chemistries: Understanding Kinetics in PCR
•
Amplification Plot (Linear scale)
Plateau phase
• End-point PCR data
collection at plateau
(gel analysis)
Plateau
Fluorescence Signal
•
107 106 105
Sample to Insight
•
Reactions varying
due to reagent
depletion &
decreased PCR
efficiencies (enzyme
activity, more product
competing for primer
annealing)
Exponential Phase
• Real time PCR does
early phase detection
• proportional to input
amounts
• 2n=dilution factor
Characteristics of a good qPCR Assay
What factors do you need to address to create a good PCR Assay?
Amplification efficiency: 100% during exponential phase (template product doubles with each
cycle)
Sensitivity: Able to detect down to reasonable quantities of template in 1 reaction (10-50
copies)
Specificity: 1 assay, 1 target: (no off-target amplification or primer-dimers)
• Melt-curve analysis - 1 peak, 1 product
• Agarose gel
Dynamic Range: Ability to detect genes with varied expression levels, another judge of
sensitivity
• 10 to 109 copies is ideal
Reproducibility: Confidence in your results, enables profiling of multiple genes in the same
sample
• All lab members get the same results
• Technical reproducibility ensures changes seen in results are due to the biology
and not the technology itself or sample handling
Sample to Insight
Characteristics of a good qPCR Assay: Amplification Efficiency
Amplification Efficiency: reliable and
accurate experiment
Two Methods:
Standard curve
X axis - dilution
Y axis - Ct value
Amp efficiency = 10(-1/slope) -1
*100
Single curve analysis
PCR Miner:
http://miner.ewindup.info/ver
sion2
“DART”: www.genequantification.de/DART_PC
R_version_1.0.xls
Sample to Insight
Characteristics of a good qPCR Assay: Sensitivity
Sensitivity: How many copies can
my assay detect?
Important for low expressed genes
or where there is limited sample
Two Methods:
Method 1: Use primers to make
PCR product, T/A clone, grow-up,
isolate, quantitate and use for qPCR
reactions
Method 2: Use gDNA as template
and use mass of gDNA to calculate
copy number and assume 1 target
per genome (or actually calculate
targets using bioinformatics)
Sample to Insight
Characteristics of a good qPCR Assay: Specificity
Specificity: 1 target amplified
Two Methods:
Melt Curve analysis
1 peak, 1 product
Agarose gel
Band at correct size
Sample to Insight
Characteristics of a good qPCR Assay: Specificity
Melting Curve Analysis
Plot - Normalized Reporter
The General Program Steps
Cooling to 60°C to let DNA
double strands anneal
Slowly heat (increase temp. to
0.2°C/sec) while plotting the
Rn
Normalized Fluorescence Signal
Heat to 94°C to denature DNA
fluorescent signal vs.
50% fluorescence
drop
As the temp increases, DNA
melts, fluorescent signal should
decrease.
Gene A Tm: 77.36
Temperature
Sample to Insight
temperature.
Gene B Tm: 78.94
Significant drop in signal when
50% DNA melts.
Characteristics of a good qPCR Assay: Specificity
Melting Curve Analysis
Plot -1st negative Derivative Reporter
Single melt curve of each
-delta F/delta T (the change rate)
amplicon is required for specificity
validation
Gene B Tm: 78.94
Gene A Tm: 77.36
Temperature
Sample to Insight
Analyzing qPCR curves: How to Define Baseline
Linear Amplification Plot
Automated Baseline Option
if an instrument has a adaptive baseline
function
Manual Baseline Option
(1) Use linear view of the plot
Baseline
Sample to Insight
Ct
(2) Set up the baseline reading from
cycle #2 to the cycle that 2 cycles before
the earliest visible amplification
(3) Usually a baseline falls in 3-15 cycles
Analyzing qPCR curves: How To Define Threshold
Log View Amplification Plot
Use log view of amplification plot
Threshold should be higher than
baseline (higher than the noise level)
Threshold should at LOWER 1/3 or 1/2
of the linear phase of amplification
Linear phase = exponential phase
Different runs across samples for the
same experiments should have the
same threshold for comparison
Sample to Insight
Data Analysis: Biological replicates and technical replicates
Biological Replicates: 3 different
experiments
• Shows variability due to experiment
Technical replicates: 3 different
measurements for same step
• Shows variability due to pipetting, machine, enzymes,
etc.
Sample to Insight
Data Analysis: Housekeeping/Reference Genes
Any changes?
GOI A in control cells
GOI A in drug treated cells
Ref Gene B in control cells
Ref Gene B in drug treated cells
Reference gene
Expression level remains consistent under experimental conditions/different tissues
Aimed to normalize possible variations during:
Sample prep & handling (e.g use the same number of cells from a start)
RNA isolation (RNA quality and quantity)
Reverse transcription efficiency across samples/experiments
PCR reaction set up
PCR reaction amplification efficiencies
Sample to Insight
Data Analysis: Commonly Used Housekeeping Genes
Sample to Insight
Data & analysis
1. Average Ct values for all gene replicates
2. Calculate ∆Ct value between GOI and HKG for each experiment
3. Average ∆Ct values between experiments (replicates)
4. Calculate ∆∆Ct values (∆Ct experiment- ∆Ct control)
5. Calculate Fold Change 2(-∆∆Ct)
Sample to Insight
Data & analysis
Normalized Gene Expression Level
Any changes?
Target Gene A in control cells
Target Gene A in drug treated cells
Reference Gene B in control cells
Ref Gene B in drug treated cells
∆Ct = Ct (Target A -treated) – Ct (Ref B-treated)
∆Ct = Ct (Target A-control) – Ct (Ref B-control)
∆∆ Ct = ∆ Ct (treated) – Ct (control)
Normalized target gene expression level = 2(-∆∆Ct)
Sample to Insight
Data & analysis: Delta Delta Ct Method - Amplification Plots
GAPDH
Ref
GOI
TNFα
α
Ct
Ct
Ct
Ct
∆∆Ct = ∆Ct (TNFαtreat-GAPDHtreat) - ∆ct (TNFαcontrol-GAPDHcontrol)
The fold change = 2(-∆∆Ct)
Sample to Insight
Data & analysis
17.1, 17.2, 17.2
1.) Average Ct values for all gene replicates
qPCR replicates
2.) Calculate Delta Ct value: GOI-HKG
3.) Average Delta Ct values between experiments (replicates)
4.) Calculate Delta-Delta Ct values (Delta Ct experiment- Delta Ct control)
5.) Calculate Fold Change 2(-Delta Delta Ct)
TNFα is up-regulated 32 fold in the treated cells versus the control
Sample to Insight
Data & analysis
http://www.qiagen.com/Products/Genes
and Pathways/Data Analysis Center Overview Page/
Sample to Insight
Data Analysis Tools
http://www.qiagen.com/Products/Genes
and Pathways/Data Analysis Center Overview Page/
Sample to Insight
Topics Covered Today
1.
What is qPCR? Applications and workflow
2.
qPCR for gene expression: What is the change in gene expression during
differentiation?
3.
Factors Critical For A Successful qPCR Assay
4.
RNA purity and integrity
5.
Reverse Transcription
6.
qPCR in Action
7.
Reporter chemistries
8.
Characteristics of a good qPCR assay
9.
Analyzing qPCR curves
10. Data & analysis
Sample to Insight
Upcoming webinars: July 2015
9:30 am EST (1:30pm GMT)*
1:00 pm EST (5:00pm GMT)
Register:
http://www.qiagen.com/Knowle
dge-and-Support/Webinars/
Sample to Insight
Upcoming Webinars: Still searching gene by gene?
Learn about RT2 Profiler PCR Arrays
Catalogued RT2 Profiler by pathway & disease
384-Well
4x96
370
Pre-validated qPCR assays with controls
Sample to Insight
Want to learn more?
Visit our new Biomarker Insights Blog!
Just go to: http://biomarkerinsights.qiagen.com/
Some recent topics:
"miRNA and lncRNA – serum biomarkers for lung cancer"
"Routine blood draw – biopsy of the future?"
"Liquid biopsy: a necessity in the age of personalized medicine"
Sample to Insight
Thank You for Attending
Questions? Ask now or contact Technical Support
• Call: 1-800-426-8157
• Email: [email protected]
Sample to Insight