1
Maemo Diablo Reference Manual for maemo 4.1
Debugging
December 22, 2008
Contents
1
Debugging
1.1 Introduction . . . . . . . . . . . . . . . . . . . . . . . . . . . . .
1.2 Maemo Debugging Guide . . . . . . . . . . . . . . . . . . . . .
1.2.1 Pre-Requisites . . . . . . . . . . . . . . . . . . . . . . . .
1.2.2 General Notes on Debugging . . . . . . . . . . . . . . .
1.2.3 Using Gdb Debugger . . . . . . . . . . . . . . . . . . . .
1.2.4 Debugging Hildon Desktop Plug-ins . . . . . . . . . . .
1.2.5 Running Out of Memory During Debugging in Device
1.2.6 Valgrind Debugger . . . . . . . . . . . . . . . . . . . . .
1.2.7 Other Debugging Tools . . . . . . . . . . . . . . . . . .
1.3 Making a Debian Debug Package . . . . . . . . . . . . . . . . .
1.3.1 Creating DBG Packages . . . . . . . . . . . . . . . . . .
1.3.2 Using and Installing DBG Packages . . . . . . . . . . .
1.3.3 For Further Reading . . . . . . . . . . . . . . . . . . . .
1
.
.
.
.
.
.
.
.
.
.
.
.
.
2
2
2
3
3
4
16
19
20
24
25
25
28
28
Chapter 1
Debugging
1.1
Introduction
The following code examples are used in this chapter:
• gdb_example
• MaemoPad
• valgrind_example
1.2
Maemo Debugging Guide
This section is targeted at beginner-level maemo developers needing to know
how to perform debugging in the maemo environment.
This section covers the two basic debugging tools available in the maemo
environment, and shows how to use them. The tools are:
• gdb - The Gnu Project Debugger. General tool for various debugging
needs.
• valgrind - Debugger and profiler. Valgrind works only in the X86 environment under Scratchbox, so this tool cannot be used in the device
itself.
This section assumes that the developer already knows how to:
• develop software in the Linux environment using the C language
• install software to the tablet device
• gain root access to the device
• install ssh to the device
• configure repositories in the /etc/apt/sources.list file
• set up USB networking between a Linux PC and the Tablet (the device
can also be used over a local WLAN connection instead)
• work with the Scratchbox environment and Scratchbox targets
2
1.2.1
Pre-Requisites
To follow the debugging examples the following is needed:
• maemo SDK installed in a Linux PC
• Nokia Internet Tablet device running OS2008.
• USB cable to connect the device with the Linux PC
• Internet access both for the tablet and for the Linux PC
• USB networking (or WLAN) set up between the Linux PC and the device
• root login access to the device over ssh
• package maemo-sdk-debug installed
• osso-xterm installed in the device
• ssh software installed in the device
1.2.2
General Notes on Debugging
Debugging Issues on ARM Architecture
There are some issues one needs to be aware of when debugging on the ARM
architecture.
• To make backtraces work properly in ARM side, the dbg packages need to
be installed for the libraries the application is using. Profiling and debugging (gdb) tools require code to have either framepointers or debugging
symbols to unwind stack. This is needed for showing backtraces or call
graphs.
• C language functions with the __attribute__((__noreturn__)) statement need to be compiled with the gcc option: -fno-omit-frame-pointer.
Without framepointers, no backtrace can be gotten through "noreturn"
functions. In practice, what would happen is that when the bt command
is used, this kind of function would repeat infinitely.
• In addition, for the gdb to be able to display the correct function names
during debugging, it also needs to have access to the debug symbols.
Without them, it shows preceding exported function name for a given
address.
Debugging Issues in Scratchbox
It is recommended to use the native gdb in the target, not the Scratchbox hostgdb.
When debugging threads in an application, gdb needs to be linked against
the same thread library that the application is using. For this reason, the
Scratchbox-provided gdb is not suitable for threads debugging, but the native
gdb needs to be used instead. See instructions in the next section on how to
start using the native gdb.
3
N.B.
The above-mentioned problem can produce "warning:
Cannot initialize thread debugging library: unknown
thread_db error ’22’" messages in gdb output, and info
threads command in gdb will show nothing.
1.2.3
Using Gdb Debugger
The Gnu Project Debugger, or gdb for short, is a general purpose debugger that
can be used for various debugging purposes.
This section does not explain how to use the gdb debugger itself, i.e. it does
not explain the specific commands in gdb to perform some specific actions.
There are other tutorials and documentation readily available in the Internet
for that purpose. This section focuses on explaining how to set up and perform
the basic debugging steps with the gdb in the maemo environment.
For additional gdb documentation, take a look at the maemo tools documentation for gdb.
Setting up Environment
Both the Internet Tablet device, described in section Setting up USB Networking
[4], and the Scratchbox environment, described in section Installing SDK [3],
both in chapter Development Environment of the Maemo Reference Manual,
need to be set up.
Preparing Scratchbox Environment for Debugging If the maemo SDK is not
yet installed, it must be installed before continuing.
After installing maemo SDK, the default target names are armel and x86.
These will be used in this example.
N.B.
The Scratchbox provides a gdb debugger. If just
[sbox-x86: ~] > gdb ... is run, then that gdb debugger is used. In this material, the native-gdb (i.e.
non-Scratchbox version of gdb) is used.
Next, install gdb to the Scratchbox from the maemo repositories.
[sbox-x86: ~] > fakeroot apt-get install gdb
[sbox-x86: ~] > fakeroot apt-get install maemo-debug-scripts
[sbox-x86: ~] > fakeroot apt-get install maemo-sdk-debug
Now two gdb programs are installed. The one used can be checked with:
[sbox-x86: ~] > which gdb
/targets/links/arch_tools/bin/gdb
If only using the command gdb, then the gdb used is the one provided by
Scratchbox.
Start briefly both gdb debuggers to see that they start properly in the Scratchbox environment. First just run gdb:
4
[sbox-x86: ~] > gdb
GNU gdb 6.4.90
Copyright (C) 2006 Free Software Foundation, Inc.
GDB is free software, covered by the GNU General Public License, and you are
welcome to change it and/or distribute copies of it under certain conditions.
Type "show copying" to see the conditions.
There is absolutely no warranty for GDB. Type "show warranty" for details.
This GDB was configured as "i686-pc-linux-gnu".
(gdb) q
[sbox-x86: ~] >
Then run the maemo version of gdb:
[sbox-x86: ~] > native-gdb
GNU gdb 6.6-debian
Copyright (C) 2006 Free Software Foundation, Inc.
GDB is free software, covered by the GNU General Public License, and you are
welcome to change it and/or distribute copies of it under certain conditions.
Type "show copying" to see the conditions.
There is absolutely no warranty for GDB. Type "show warranty" for details.
This GDB was configured as "i486-linux-gnu".
(gdb) q
[sbox-x86: ~] >
To quit from gdb, type ’q’ and hit ENTER.
The native-gdb is used here, since it allows also threads to be debugged.
Both gdb versions are available in the Scratchbox X86 environment. The
native-gdb should always be run instead of the Scratchbox version.
Preparing Internet Tablet for Debugging
N.B.
Because additional software is going to be installed, and
debugging will be performed in the real device that is
running the official Sales Image, it is recommended that
a full back-up of the device and any important files is
made before continuing.
The gdb needs to be installed in the Internet Tablet device. It is recommended that first osso-xterm and then ssh are installed in the device before
continuing.
1. Start osso-xterm.
2. Gain root access to the device while running osso-xterm.
3. Edit the /etc/apt/sources.list file in the device so that it contains line:
deb http://repository.maemo.org/ diablo free non-free
The /etc/apt/sources.list file can be edited with a text editor (e.g. vi), but
the following command given from the osso-xterm is also valid:
echo "deb http://repository.maemo.org/ diablo free non-free" >> /etc/apt/sources.list
Important: it is not recommended to perform device software updates
from the maemo sdk repositories (for example, ’apt-get upgrade’ is not
recommended for the device). The reason for this is that there might
be some software packages in the SDK repositories that are so-called sdk
5
variants. They might create a problem, if directly installed in the actual
device. In this example, only gdb software is used from the repository.
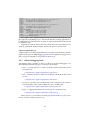
4. Perform an apt-get update in the device. The update command will
refresh the package list database in the device.
5. Perform an apt-get install gdb
You should now have the gdb and gdbserver (included in the gdb package)
installed in the device.
N.B.
After using the maemo sdk repositories in the device
/etc/apt/sources.list file, remove or comment the line
out. This way, you will not accidentally get programs
from the wrong repository to the device. See notes
above.
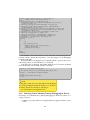
Debugging Use Cases with Gdb
Debugging Command Line Application in Scratchbox X86 Environment with
Gdb One of the most common debugging case is performing debugging in
the Scratchbox X86 environment.
By now, the gdb is installed in the x86 target. Next, download the gdb_example
sources.
The example apps are:
• the gdb_example.c is a very simple C application that has some functions
that call each other in a row. This is used here to demonstrate how to get
backtraces.
• the gdb_example2.c is a simple variant of the gdb_example.c that has
some additional sleep() calls. This will be used to demonstrate simple
core dump debugging.
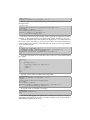
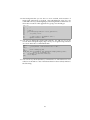
Next, the small gdb_example.c file should be compiled as shown below,
and the gdb debugger should be started. This simple example shows how to
set breakpoints, and how to get a backtrace from the program. Backtrace tells
what functions have been called and what parameters have been used.
Compile the gdb_example.c application with the -g option like this:
[sbox-x86: ~/src/testing/gdb_example] > gcc gdb_example.c -o gdb_example -g
Next, start the gdb with the gdb_example application as a parameter.
[sbox-x86: ~/src/testing/gdb_example] > native-gdb gdb_example
GNU gdb 6.6-debian
Copyright (C) 2006 Free Software Foundation, Inc.
GDB is free software, covered by the GNU General Public License, and you are
welcome to change it and/or distribute copies of it under certain conditions.
Type "show copying" to see the conditions.
There is absolutely no warranty for GDB. Type "show warranty" for details.
This GDB was configured as "i486-linux-gnu"...
Using host libthread_db library "/lib/libthread_db.so.1".
Set the breakpoint (br) to function example_3
6
(gdb) br example_3
Breakpoint 1 at 0x80483e9: file gdb_example.c, line 48.
Run the application under gdb giving a command line parameter foobar to
the application.
(gdb) run foobar
Starting program: /home/user/src/testing/gdb_example/gdb_example foobar
Now in main().
Now in example_1(2) function.
Now in example_2(parameter here) function.
Breakpoint 1, example_3 () at gdb_example.c:48
48
printf("Now in example_3()\n");
The above shows that the running of the application stopped in function
example_3. This happened, because the breakpoint (br example_3) was set.
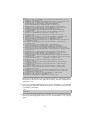
Now the backtrace (bt) can be listed from application to see what functions
have been called. The list goes from recent to older. The oldest function was
naturally the main() function at the end of the list. It shows also the parameters
to the called functions.
(gdb) bt
#0 example_3 () at gdb_example.c:48
#1 0x080483dc in example_2 (a=0x80484f8 "parameter here") at gdb_example.c:39
#2 0x080483b9 in example_1 (x=2) at gdb_example.c:30
#3 0x08048387 in main (argc=2, argv=0xbfc437e4) at gdb_example.c:18
(gdb)
It can be convenient to see what the source code is for a line mentioned in
the output:
(gdb) list 39
34
*
35
*/
36
int example_2(char* a)
37
{
38
printf("Now in example_2(%s) function.\n",a);
39
example_3();
40
return 0;
41
}
42
/*
43
*
(gdb)
Also the values of the variables can be inspected:
(gdb) br example_2
Breakpoint 1 at 0x80483c4: file gdb_example.c, line 38.
(gdb) run
Starting program: /home/user/src/testing/gdb_example
Now in main().
Now in example_1(1) function.
Breakpoint 2, example_2 (a=0x80484f8 "parameter here") at gdb_example.c:38
38
printf("Now in example_2(%s) function.\n",a);
To see the value of variable ’a’ just type:
(gdb) print a
$1 = 0x80484f8 "parameter here"
(gdb)
Essentially, debugging with gdb in the Scratchbox X86 target is similar to
debugging with gdb in any Linux host. In this example, only a small subset of
gdb’s functionality has been used.
7
Debugging Command Line Application in Internet Tablet Device It is possible to debug an application in the Internet tablet device itself using gdb.
Before starting, log in on the device and install (if you have not done so yet) the
gdb debugger to the device:
/home/user # apt-get install gdb
... etc ...
/home/user #
Here it is assumed that ssh and osso-xterm are already installed in the tablet
and that it is possible to log in on the device using ssh from a Linux PC. In addition, the maemo repository entries should be set in the /etc/apt/sources.list
file as explained previously.
Debugging with the gdb debugger in the device is similar to using gdb
in a normal Linux PC environment. The limitations are mostly related to the
available free RAM memory, meaning that in the worst case, memory might
run out while trying to debug an application in the device.
This example follows the basic logic of the first example, but this time is
performed in the device.
1. Compile the gdb_example.c application in the Scratchbox for armel architecture.
[sbox-x86: ~] > sb-conf select armel
Hangup
Shell restarting...
[sbox-armel: ~] > pwd
/home/user
[sbox-armel: ~] > cd src/testing/gdb_example
[sbox-armel: ~/src/testing/gdb_example] > gcc gdb_example.c -o gdb_example -g
[sbox-armel: ~/src/testing/gdb_example] > file gdb_example
gdb_example: ELF 32-bit LSB executable, ARM, version 1 (SYSV), for GNU/Linux 2.6.8,
dynamically linked (uses shared libs), not stripped
[sbox-armel: ~/src/testing/gdb_example] >
2. Copy the armel version of the gdb_example to the tablet. You need to
have the sshd daemon up and running in the device before you can copy
files with scp.
[sbox-armel: ~/src/testing/gdb_example] > scp gdb_example [email protected]:
[email protected]’s password: ...........
gdb_example
100% 9135
8.9KB/s
00:00
3. Log in on the device with ssh with username user. The IP address is an
example, and your device IP address can be different.
[sbox-armel: ~/src/testing/gdb_example] > ssh [email protected]
[email protected]’s password: ..........
BusyBox v1.6.1 (2007-09-27 18:08:59 EEST) Built-in shell (ash)
Enter ’help’ for a list of built-in commands.
~# cd ~user
4. Start the gdb debugger with the gdb_example application.
8
/home/user# gdb ./gdb_example
GNU gdb 6.6-debian
Copyright (C) 2006 Free Software Foundation, Inc.
GDB is free software, covered by the GNU General Public License, and you are
welcome to change it and/or distribute copies of it under certain conditions.
Type "show copying" to see the conditions.
There is absolutely no warranty for GDB. Type "show warranty" for details.
This GDB was configured as "arm-linux-gnueabi"...
Using host libthread_db library "/lib/libthread_db.so.1".
(gdb)
You should now be able to debug this small example application in a similar
way as in the previous example.
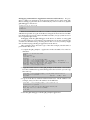
Debugging Core Files in Device This section explains how to debug core
files in the Internet Tablet.
The kernel does not dump cores of a failing process, unless told where to
dump the core files.
The default values for core dumps can be seen by reading the file linuxrc
with the more command in the device, and by studying the enable_coredumps()
function:
/home/user # more /mnt/initfs/linuxrc
... snip ...
enable_coredumps()
{
coredir=/media/mmc1/core-dumps
echo -n "Enabling core dumps to $coredir/..."
echo "$coredir/%e-%s-%p.core" > /proc/sys/kernel/core_pattern
ulimit -c unlimited
echo "done."
}
... snip ...
As can be seen, the default location for core dumps is in /media/mmc1/coredumps directory. The second echo command defines the name of the core
dump file. The default name contains the name of the executable (%e), the
signal (%s) and the PID number (%p).
If these default settings are satisfactory, it is enough to create the core-dumps
directory under the /media/mmc1 directory.
Next, the small example application gdb_example2 will be used to demonstrate how to debug the core file.
1. Compile the gdb_example2 in the Scratchbox armel target, and just copy
the file to the device using scp. Now, unplug the USB cable to get access
to memory cards. Then start the gdb_example2 in the device like this:
/home/user # ./gdb_example2 &
/home/user # gdb_example2.
Now in main().
Now in example_1(1) function.
2. The gdb_example2 is now running in the background, and it starts to
dump its output to the screen. There are some sleep() calls in the
gdb_example2, so that you have time to kill it with the SIGSEGV signal.
Now just make it to generate a core dump. Assuming that the process
is referred to as %1, just use the kill command as below and press the
ENTER key a couple of times:
9
/home/user # kill -SIGSEGV %1
/home/user #
[1] + Segmentation fault (core dumped) ./gdb_example2
3. You should now have a compressed core dump data file under the
/media/mmc1/core-dumps directory. Its name should include the name
of the file and end with the PID number of the gdb_example2 program.
Check that you got it (the number shown below, 1390, will naturally be
different in your environment):
/home/user # ls -l /media/mmc1/core-dumps/
-rw-r--r-1 user
root
139264 Nov
9 13:09 gdb_example2-11-1390.rcore.lzo
4. You have to extract the compressed data before you can use it with gdb.
You need to install sp-rich-core-postproc package and run the extract
command which creates a new directory (given as a second parameter)
where to extract data:
/home/user # apt-get install sp-rich-core-postproc
... snip ...
/home/user # rich-core-extract /media/mmc1/core-dumps/gdb_example2-11-1390.rcore.lzo \
coredir
The newly-created coredir includes lots of information in different files
about the system. The file to pass for the gdb is named coredump.
5. The gdb_example2 is linked against the libc library. If you want to be
able to resolve symbols also for the library during debugging, you need
to install libc6-dbg package in the device. The same rule applies to other
libraries that your application might be linked against. See the further notes
about the DBG packages in this material.
Now install the libc6-dbg package to get symbols for the library.
/home/user # apt-get install libc6-dbg
Reading Package Lists... Done
Building Dependency Tree... Done
The following NEW packages will be installed:
libc6-dbg
.... snip ...
/home/user #
6. Now you can debug the core file together with the gdb_example2 binary
that you compiled with the -g flag. Try and see where the execution of
the gdb_example2 was when you used the -SIGSEGV signal. Start the gdb
and give the gdb_example2 as the first parameter, and the core file as the
second parameter:
10
/home/user # gdb ./gdb_example2 coredir/coredump
GNU gdb 6.6-debian
Copyright (C) 2006 Free Software Foundation, Inc.
GDB is free software, covered by the GNU General Public License, and you are
welcome to change it and/or distribute copies of it under certain conditions.
Type "show copying" to see the conditions.
There is absolutely no warranty for GDB. Type "show warranty" for details.
This GDB was configured as "arm-linux-gnueabi"...
Using host libthread_db library "/lib/libthread_db.so.1".
Reading symbols from /lib/libc.so.6...BFD: /usr/lib/debug/lib/libc-2.5.so:
warning: sh_link not set for section ‘.ARM.exidx’
Reading symbols from /usr/lib/debug/lib/libc-2.5.so...done.
done.
Loaded symbols for /lib/libc.so.6
Reading symbols from /lib/ld-linux.so.3...BFD: /usr/lib/debug/lib/ld-2.5.so:
warning: sh_link not set for section ‘.ARM.exidx’
Reading symbols from /usr/lib/debug/lib/ld-2.5.so...done.
done.
Loaded symbols for /lib/ld-linux.so.3
Core was generated by ‘./gdb_example2’.
Program terminated with signal 11, Segmentation fault.
#0 0x410adcec in nanosleep () from /lib/libc.so.6
The example above shows that now gdb is using debug symbols from
/usr/lib/debug/lib/libc-2.5.so. Had the libc6-dbg package not been
installed, the gdb would not have information available about the libraries’ debug symbols.
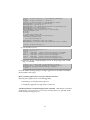
Now, the gdb is waiting for a command, so just give the bt (backtrace)
command. You should see something similar to this:
(gdb) bt
#0 0x410adcec
#1 0x410ada54
#2 0x0000846c
#3 0x0000842c
#4 0x000083e0
in
in
in
in
in
nanosleep () from /lib/libc.so.6
sleep () from /lib/libc.so.6
example_2 (a=0x8570 "parameter here") at gdb_example2.c:41
example_1 (x=1) at gdb_example2.c:32
main (argc=1, argv=0xbee57e24) at gdb_example2.c:19
N.B.
For this simple example, the available libc6-dbg
package was installed before starting to debug the
gdb_example2 application. If the dbg packages for various libraries were not installed, it would mean that
the backtrace information coming from the non-debug
version of the library could not be trusted.
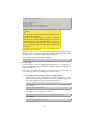
Depending on at what point the kill -SIGSEGV command was given,
the output may be different. In this example, the process was hit when
it was calling the sleep function inside the example_1 function in file
gdb_example2.c. It can also be seen that the sleep() function has further
called the nanosleep() function, and that is when it got the -SIGSEGV
signal (see the note above).
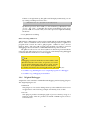
Debugging Core File from Device Inside Scratchbox Because the binaries
and libraries in the device are prelinked, successful debugging inside the
Scratchbox environment using the programs core file (from the device) would
require that:
• you copy the relevant libraries (i.e. the ones the application is using) from
the device to the Scratchbox. Otherwise addresses in the prelinked and
11
unprelinked libraries would not match, and gdb backtraces would not
load the library.
• If the core file debugging is performed in the Scratchbox ARMEL environment, the native gdb program needs to be used instead of the one
provided by Scratchbox. See the previous section on how to set the native
gdb as the default one.
After copying the /lib/libc6 library from the device and setting the native
gdb to be used, the application can be debugged normally.
N.B.
Keep in mind that generally the Scratchbox tools override the target tools.
Debugging UI Applications in Scratchbox X86 Many maemo applications
use the graphical UI, and debugging these applications differs slightly from
debugging simple command line applications.
Here the maemopad will be used as an example application to debug in the
X86 target with gdb.
If the Scratchbox environment is set up correctly as explained above, these
steps should be easy to follow to perform UI debugging with maemopad application.
1. Activate the X86 target, go to the testing directory and download the
source package of maemopad application.
[sbox-armel] sb-conf select x86
[sbox-x86] cd ~/src/
[sbox-x86 ~/src] mkdir maemopad
[sbox-x86 ~/src/maemopad] cd maemopad
[sbox-x86 ~/src/maemopad] apt-get source maemopad
Reading package lists... Done
Building dependency tree... Done
Need to get 384kB of source archives.
Get:1 http://juri.research.nokia.com diablo/free maemopad 2.3 (dsc) [476B]
Get:2 http://juri.research.nokia.com diablo/free maemopad 2.3 (tar) [384kB]
Fetched 384kB in 0s (4637kB/s)
dpkg-source: warning: extracting unsigned source package (./maemopad_2.3.dsc)
dpkg-source: extracting maemopad in maemopad-2.3
dpkg-source: unpacking maemopad_2.3.tar.gz
2. Check that you have the correct files.
[sbox-x86: ~/src/maemopad] > ls -l
total 388
drwxrwxr-x 6 maemo maemo
4096 Sep 26 15:00 maemopad-2.3
-rw-rw-r-- 1 maemo maemo
476 Nov 8 17:26 maemopad_2.3.dsc
-rw-rw-r-- 1 maemo maemo 383834 Nov 8 17:26 maemopad_2.3.tar.gz
3. Go to the maemopad-2.3 source directory, and set the DEB_BUILD_OPTIONS
environment variable, so that the generated binaries are not stripped.
Then build the maemopad package with dpkg-buildpackage command
as shown here:
12
[sbox-x86: ~/src/maemopad] > cd maemopad-2.3
[sbox-x86: ~/src/maemopad/maemopad-2.3] > export DEB_BUILD_OPTIONS=debug,\
nostrip
[sbox-x86: ~/src/maemopad/maemopad-2.3] > dpkg-buildpackage -rfakeroot -d
dpkg-buildpackage: source package is maemopad
dpkg-buildpackage: source version is 2.3
dpkg-buildpackage: source changed by Maemo Integration <[email protected]>
dpkg-buildpackage: host architecture i386
dpkg-buildpackage: source version without epoch 2.3
: Using Scratchbox tools to satisfy builddeps
.... etc ....
N.B.
In
this
example,
the
standard
export
DEB_BUILD_OPTIONS=debug,nostrip
environment variable is used, but there might be source
packages that do not support these debug,nostrip options. In that case, one must make sure that the source
is compiled with -g flag (usually this option can be
added to the CFLAGS variable in the debian/rules file),
and that the produced binaries will not be stripped.
In the long run, it is better to modify the source package
to generate a separate debug symbol (-dbg) package.
This requires modifying both the debian/rules and
debian/control files.
4. You should now have maemopad binaries generated so that they have
the debug symbols in them. Check that you get a not stripped flag from
the maemopad binary:
[sbox-x86: ~/src/maemopad/maemopad-2.3] > file debian/maemopad/usr/bin/maemopad
debian/tmp/usr/bin/maemopad: ELF 32-bit LSB executable, Intel 80386, version 1
(SYSV), for GNU/Linux 2.6.0, dynamically linked (uses shared libs), not stripped
5. You should now have a maemopad_2.3_i386.deb file in the ~/src/maemopad
directory. Check that you have it:
[sbox-x86: ~/src/maemopad] > ls -l
total 440
drwxrwxr-x 6 maemo maemo
4096 Nov
-rw-rw-r-- 1 maemo maemo
476 Nov
-rw-rw-r-- 1 maemo maemo 388593 Nov
-rw-rw-r-- 1 maemo maemo
675 Nov
-rw-r--r-- 1 maemo maemo 42632 Nov
9
9
9
9
9
13:37
13:36
13:36
13:37
13:37
maemopad-2.3
maemopad_2.3.dsc
maemopad_2.3.tar.gz
maemopad_2.3_i386.changes
maemopad_2.3_i386.deb
6. Install the newly compiled maemopad_2.3_i386.deb file inside the Scratchbox environment:
[sbox-x86: ~/src/maemopad] > dpkg -i maemopad_2.3_i386.deb
... output from dpkg ...
7. Start the Xephyr server outside the Scratchbox:
Linux-PC$ Xephyr :2 -host-cursor -screen 800x480x16 -dpi 96 -ac -extension Composite &
8. Start the Application Framework from inside the Scratchbox X86 target:
[sbox-x86: ~/src/maemopad/maemopad-2.1] > export DISPLAY=:2
[sbox-x86: ~/src/maemopad/maemopad-2.1] > af-sb-init.sh start
... lots of output from various programs ...
13
You should now have the application framework up and running and the
Xephyr window should contain the normal SDK UI.
9. Move to the source directory:
[sbox-x86: ~/src/maemopad/maemopad-2.1] > cd src/ui
10. In the ui directory, you should have the files:
[sbox-x86: ~/src/maemopad/maemopad-2.1/src/ui] ls -l
total 40
-rw-r--r-- 1 maemo maemo 12404 Sep 26 14:13 callbacks.c
-rw-r--r-- 1 maemo maemo 2250 Sep 26 14:11 callbacks.h
-rw-r--r-- 1 maemo maemo 15562 Jun 20 10:42 interface.c
-rw-r--r-- 1 maemo maemo 3282 Jun 20 10:42 interface.h
11. In this example, a debugging breakpoint will be set at the callback function
callback_help() located in the callbacks.c file. This function is called
when the user clicks the HELP button from the maemopad menu. Set the
debugging breakpoint like this:
[sbox-x86: ~/src/maemopad/maemopad-2.1/src/ui] > run-standalone.sh gdb \
maemopad
(gdb) br callback_help
Breakpoint 1 at 0x804bf56: file ui/callbacks.c, line 296.
12. Start the maemopad application from the gdb.
(gdb) run
Starting program: /targets/x86/usr/bin/maemopad
[Thread debugging using libthread_db enabled]
[New Thread -1222154560 (LWP 22944)]
/home/maemo/.osso/current-gtk-key-theme:1: Unable to find include file:
"keybindings.rc"
maemopad[22944]: GLIB WARNING ** GLib-GObject - invalid cast from ’HildonProgram’
to ’GtkWidget’
maemopad[22944]: GLIB CRITICAL ** Gtk - gtk_widget_show: assertion
’GTK_IS_WIDGET (widget)’ failed
Audio File Library: could not open file ’/usr/share/sounds/ui-window_open.wav’
[error 3]
Audio File Library: could not open file ’/usr/share/sounds/ui-window_close.wav’
[error 3]
hello-world background
N.B.
Thread-debugging: Now the native gdb program is
used. If you need to debug threads in the application,
you need to use the native gdb linked against the same
thread library that your application is using. Remember
that the Scratchbox gdb is not suitable for this purpose.
To use the native gdb, native-gdb needs to be used, as
mentioned earlier in this material.
13. Now you should be able to see the maemopad application inside the
Xephyr window, and you should be able to use it normally. Next, click
the upper menu and select the item HELP. In your gdb terminal window
you should now see :
Breakpoint 1, callback_help (action=0x80bda40, data=0x806eca8) at ui/callbacks.c:296
296
{
14
14. The breakpoint that you set above is now reached, and execution of
maemopad application is stopped. The gdb debugger waits for your
command now. Try something simple, like using the list command to see
where the execution of the application is going. You should get:
(gdb) list
291
}
292
}
293
294
/* help */
295
void callback_help( GtkAction * action, gpointer data )
296
{
297
osso_return_t retval;
298
299
/* connect pointer to our AppUIData struct */
300
AppUIData *mainview = NULL;
15. You can now debug the maemopad normally. Try and see, if you can
execute the maemopad step by step so that you can get the help window
on screen. Enter the s command like this:
(gdb) s
302
g_assert(mainview != NULL && mainview->data != NULL );
(gdb) s
304
retval = hildon_help_show(
(gdb) s
hildon_help_show (osso=0x80bda40, help_id=0x804cb08 "Example_MaemoPad_Content",
flags=1) at osso-helplib.c:636
636
osso-helplib.c: No such file or directory.
in osso-helplib.c
(gdb)
16. You can also try the bt (backtrace) command to see what functions were
called. You should see a list of functions that have been called, similar to
the following:
15
(gdb) bt
#0 hildon_help_show (osso=0x80bda40, help_id=0x804cb08 "Example_MaemoPad_Content",
flags=1) at osso-helplib.c:636
#1 0x0804bfb0 in callback_help (action=0x80bda40, data=0x1) at ui/callbacks.c:304
#2 0xb78bc688 in IA__g_cclosure_marshal_VOID__VOID (closure=0x8106ae0,
return_value=0x0, n_param_values=1, param_values=0xfffffffe,
invocation_hint=0xbfac6798, marshal_data=0x0) at gmarshal.c:77
#3 0xb78a563b in IA__g_closure_invoke (closure=0x8106ae0, return_value=0x1,
n_param_values=1, param_values=0x1, invocation_hint=0x1) at gclosure.c:490
#4 0xb78bb058 in signal_emit_unlocked_R (node=0x80f2bb8, detail=0,
instance=0x80bda40, emission_return=0x0,instance_and_params=0xbfac68c0)
at gsignal.c:2440
#5 0xb78bbfa8 in IA__g_signal_emit_valist (instance=0x80bda40, signal_id=1,
detail=0, var_args=0xbfac6a4c "\001\020") at gsignal.c:2199
#6 0xb78bc296 in IA__g_signal_emit (instance=0x1, signal_id=1, detail=1)
at gsignal.c:2243
#7 0xb7def78b in IA__gtk_widget_activate (widget=0x80bda40) at gtkwidget.c:4273
#8 0xb7cd9c62 in IA__gtk_menu_shell_activate_item (menu_shell=0x8103030,
menu_item=0x80bda40, force_deactivate=1) at gtkmenushell.c:1230
#9 0xb7cda009 in gtk_menu_shell_button_release (widget=0x8103030, event=0x810c060)
at gtkmenushell.c:748
#10 0xb7cd0f78 in gtk_menu_button_release (widget=0x8103030, event=0x810c060)
at gtkmenu.c:2978
#11 0xb7cc67d0 in _gtk_marshal_BOOLEAN__BOXED (closure=0x8071028,
return_value=0xbfac6c90, n_param_values=2, param_values=0xbfac6de0,
invocation_hint=0xbfac6cb8, marshal_data=0xb7cd0e40) at gtkmarshalers.c:84
#12 0xb78a5979 in g_type_class_meta_marshal (closure=0x8071028, return_value=0x1,
n_param_values=1, param_values=0xbfac6de0, invocation_hint=0x1, marshal_data=0x1)
at gclosure.c:567
#13 0xb78a563b in IA__g_closure_invoke (closure=0x8071028, return_value=0x1,
n_param_values=1, param_values=0x1, invocation_hint=0x1) at gclosure.c:490
#14 0xb78babcb in signal_emit_unlocked_R (node=0x80708c0, detail=0,
instance=0x8103030, emission_return=0xbfac6d70, instance_and_params=0xbfac6de0)
at gsignal.c:2478
#15 0xb78bbcfd in IA__g_signal_emit_valist (instance=0x8103030, signal_id=0, detail=0,
var_args=0xbfac6f70 "xo %G
%@00\020\b") at gsignal.c:2209
#16 0xb78bc296 in IA__g_signal_emit (instance=0x1, signal_id=1, detail=1)
at gsignal.c:2243
#17 0xb7def914 in gtk_widget_event_internal (widget=0x8103030, event=0x810c060)
at gtkwidget.c:4242
#18 0xb7cc4bd7 in IA__gtk_propagate_event (widget=0x8103030, event=0x810c060)
at gtkmain.c:2348
#19 0xb7cc4f2f in IA__gtk_main_do_event (event=0x810c060) at gtkmain.c:1582
#20 0xb7b40551 in gdk_event_dispatch (source=0x1, callback=0, user_data=0x0)
at gdkevents-x11.c:2318
#21 0xb78341fc in IA__g_main_context_dispatch (context=0x8066cc8) at gmain.c:2045
#22 0xb7835bb5 in g_main_context_iterate (context=0x8066cc8, block=1, dispatch=1,
self=0x80690e0) at gmain.c:2677
#23 0xb7835eda in IA__g_main_loop_run (loop=0x8062200) at gmain.c:2881
#24 0xb7cc41b3 in IA__gtk_main () at gtkmain.c:1155
#25 0x0804a669 in main (argc=1, argv=0xbfac7224) at main.c:108
At the top of the backtrace list are functions that were called last, and at
the bottom of the list are the applications main() function and then the
gtk_main(), etc.
17. If you now continued debugging with s (step) command, you would end
up looping the gtk main event loop. However, it is better to just give the
c (continue) command:
(gdb) c
Continuing.
18. Now the maemopad application is running. If you select the HELP menu
item again, the breakpoint is still set. So if you click HELP you would get
again:
16
Breakpoint 1, callback_help (action=0x80bda40, data=0x806ec78) at ui/callbacks.c:296
296
{
(gdb)
19. You can clear a specific breakpoint using the clear command. Remove the
breakpoint in callback_help() function:
(gdb) clear callback_help
Deleted breakpoint 1
(gdb) c
Continuing.
20. Because the breakpoint is now cleared, you can use the application normally under the Xephyr.
1.2.4
Debugging Hildon Desktop Plug-ins
This section explains how to debug Hildon Desktop plug-ins in maemo environment.
Desktop and Control Panel applications are both launched by the maemolauncher daemon. Their plug-ins are all shared libraries (i.e. .so files). Writing
these plug-ins is explained in maemo.org documentation [1].
Downloading and Compiling the Example Apps
For this example, you need to first download, compile and install the helloworld-app package.
1. Download the source package of hello-world-app:
[sbox-x86: ~/src] > apt-get source hello-world-app
Reading package lists... Done
Building dependency tree... Done
Need to get 235kB of source archives.
Get:1 http://repository.maemo.org diablo/free hello-world-app 2.1 (dsc) [363B]
Get:2 http://repository.maemo.org diablo/free hello-world-app 2.1 (tar) [235kB]
Fetched 235kB in 0s (264kB/s)
dpkg-source: warning: extracting unsigned source package (./hello-world-app_2.1.dsc)
dpkg-source: extracting hello-world-app in hello-world-app-2.1
dpkg-source: unpacking hello-world-app_2.1.tar.gz
2. Go to the sources directory ...
[sbox-x86: ~/src] > cd hello-world-app-2.1
[sbox-x86: ~/src/hello-world-app-2.1] >
3. ... and compile it like this:
17
[sbox-x86: ~/src/hello-world-app-2.1] > export DEB_BUILD_OPTIONS=debug,\
nostrip
[sbox-x86: ~/src/hello-world-app-2.1] > ./autogen.sh
... etc ...
[sbox-x86: ~/src/hello-world-app-2.1] > dpkg-buildpackage -rfakeroot
dpkg-buildpackage: source package is hello-world-app
dpkg-buildpackage: source version is 2.1
dpkg-buildpackage: source changed by Maemo Integration <[email protected]>
dpkg-buildpackage: host architecture i386
dpkg-buildpackage: source version without epoch 2.1
dpkg-checkbuilddeps: Using Scratchbox tools to satisfy builddeps
fakeroot debian/rules clean
dh_testdir
dh_testroot
rm -f build-stamp configure-stamp
# Add here commands to clean up after the build process.
/scratchbox/tools/bin/make clean
... snip, output from compilation ...
dpkg-genchanges: including full source code in upload
dpkg-buildpackage: full upload; Debian-native package (full source is included)
[sbox-x86: ~/src/hello-world-app-2.1] >
4. You should now have:
[sbox-x86: ~/src/hello-world-app-2.1] > cd ..
[sbox-x86: ~/src] > ls -lt
total 312
-rw-rw-r-- 1 maemo maemo
738 Nov 14 08:27 hello-world-app_2.1_i386.changes
-rw-r--r-- 1 maemo maemo 58402 Nov 14 08:27 hello-world-app_2.1_i386.deb
drwxr-xr-x 5 maemo maemo
4096 Nov 14 08:27 hello-world-app-2.1
-rw-rw-r-- 1 maemo maemo
363 Nov 14 08:26 hello-world-app_2.1.dsc
-rw-rw-r-- 1 maemo maemo 234825 Nov 14 08:26 hello-world-app_2.1.tar.gz
5. Install the newly compiled debug version of the package hello-worldapp_2.1_i386.deb:
[sbox-x86: ~/src] > fakeroot dpkg -i hello-world-app_2.1_i386.deb
(Reading database ... 15186 files and directories currently installed.)
Unpacking hello-world-app (from hello-world-app_2.1_i386.deb) ...
... snip ...
Now the Hildon desktop plug-ins example applications should be installed in
the Scratchbox X86 target.
How to Debug Applications Started by Maemo-Launcher
Basically, these applications can be debugged by:
• attaching to an already running process
• starting the application using maemo-summoner
Attaching to Maemo-Launched Application with Gdb With maemo-launched
applications, it is necessary to give maemo-launcher binary to gdb and attach
to the already running process.
18
[sbox-x86: ~/ ] > export DISPLAY=:2
[sbox-x86: ~/ ] > af-sb-init.sh start
... snip ...
[sbox-x86: ~/ ] > pidof hildon-desktop | cut -d’ ’ -f1
22961
#
# this would take the first (largest) PID value from the returned list. The number 22961 is
just an example.
# smallest PID value is maemo-invoker which had requested maemo-launcher to start
hildon-desktop.
#
[sbox-x86: ~/ ] > native-gdb maemo-launcher
... snip ...
(gdb) attach 22961
Attaching to program: /targets/x86/usr/bin/maemo-launcher, process 22961
... snip...
(gdb)
Now it should be possible to debug the application normally with the gdb.
Starting Maemo-Launched Application with Maemo-Summoner The following will start the Control Panel under (native) gdb, and the newly installed
Control Panel applet called hello-world-app will be debugged. The breakpoint will be set to function hello_world_dialog_show(). Pay attention to the
question about the "pending shared library load".
[sbox-x86: ~/ ] > export DISPLAY=:2
[sbox-x86: ~/ ] > af-sb-init.sh start
... snip ...
[sbox-x86: ~/ ] > run-standalone.sh native-gdb maemo-summoner
... snip ...
(gdb) br hello_world_dialog_show
Make breakpoint pending on future shared library load? (y or [n]) y
Breakpoint 1 (hello_world_dialog_show) pending.
(gdb) run /usr/bin/controlpanel.launch
Starting program: /targets/x86/usr/bin/maemo-summoner /usr/bin/controlpanel.launch
... snip ...
This should start the Control Panel in the Xephyr screen. When clicking the
hello world plug-in in the Control Panel, the execution should stop at the given
breakpoint. Try, for example, to get a backtrace:
19
Breakpoint 2, hello_world_dialog_show () at libhelloworld.c:68
68
GtkWidget *dialog = hello_world_dialog_new ();
(gdb) bt
#0 hello_world_dialog_show () at libhelloworld.c:68
#1 0xb70b05f7 in execute (osso=0x8075948, data=0x8084088, user_activated=1)
at hello-world-applet.c:11
#2 0xb7ea4a71 in hcp_app_idle_launch (d=0x810ad08) at hcp-app.c:200
#3 0xb776c4d1 in g_idle_dispatch (source=0x810ac98, callback=0x806ac70,
user_data=0x8075948) at gmain.c:3928
#4 0xb77691fc in IA__g_main_context_dispatch (context=0x806dbc0) at gmain.c:2045
#5 0xb776abb5 in g_main_context_iterate (context=0x806dbc0, block=1, dispatch=1,
self=0x806f228) at gmain.c:2677
#6 0xb776aeda in IA__g_main_loop_run (loop=0x80deb40) at gmain.c:2881
#7 0xb7bec1b3 in IA__gtk_main () at gtkmain.c:1155
#8 0xb7ea1e37 in main (argc=1, argv=0xbfa7d184) at hcp-main.c:64
#9 0x08048a8b in main (argc=2, argv=0xbfc15bb4) at summoner.c:45
#10 0xb7e667e5 in __libc_start_main () from /lib/libc.so.6
#11 0x08048791 in _start ()
(gdb) list
63
}
64
65
void
66
hello_world_dialog_show ()
67
{
68
GtkWidget *dialog = hello_world_dialog_new ();
69
gtk_dialog_run (dialog);
70
gtk_widget_destroy (dialog);
71
}
72
(gdb) c
Continuing.
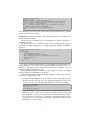
The backtrace tells what functions were called before the breakpoint was
reached at hello_world_dialog_show(). Now the plug-in can be debugged
normally with gdb.
Because the hello world plug-in was compiled with the -g option, the source
code listing can be viewed with the list command.
To do this same for desktop, the hildon-desktop process needs to be killed
first. The desktop can be killed with the command:
[sbox-x86: ~] > kill $(pidof hildon-desktop)
#
# after this you could start the hildon-desktop under gdb like this:
#
[sbox-x86: ~] > run-standalone.sh gdb maemo-summoner
... snip ...
(gdb) run /usr/bin/hildon-desktop.launch
... snip ...
N.B.
Doing this on the device would require first disabling
the software lifeguard with the flasher tool. If this is
not done, the device will reboot. The flag is:
--set-rd-flags=no-lifeguard-reset
1.2.5
Running Out of Memory During Debugging in Device
If running out of RAM memory during debugging in the device, there are a
couple of options:
1. Add (more) swap to the device using the Memory applet from the Control
Panel.
20
If there is enough memory, but gdb is still abruptly terminated, you can
try setting it OOM-protected as root:
/home/user # echo -17 > /proc/[PID of your gdb]/oom_adj
By default, processes have OOM (i.e. Out-of-Memory) adjustment value
of zero. The value -17 disables the kernel OOM killing for the given
process. N.B. As a result of this, some other processes might be killed by
the kernel.
2. Use gdbserver to debug.
Notes on Using Gdbserver
gdbserver is a debugging tool that can be started and run in the Internet Tablet
device. Then a connection can be made to this running instance of gdbserver
program from a Linux PC with a gdb program. Gdbserver uses a lot less
memory than a full scale gdb program, thus making it possible to perform
debugging in devices that have a limited RAM memory, such as PDAs.
The gdbserver does not care about symbols in the binary, but instead the
Linux PC side gdb expects to have a local copy of the binary being debugged
so that the binaries in the device can be stripped.
N.B.
Debugging core files from the device in Scratchbox with
gdbserver has the same issues. In practice, it is easier
to perform the debugging in the device itself. See the
section above about prelinked binaries and libraries.
For further information about using gdbserver, gdb and DDD, see:
• scratchbox.org: Running the cross-compiled programs in a debugger
• scratchbox.org: Debugging in Scratchbox
1.2.6
Valgrind Debugger
Valgrind is a CPU simulator with different debugging and analyzing plug-ins.
The Valgrind plug-ins are:
• memcheck
This plug-in tool is used to debug memory leaks and deallocation errors
in applications. The following example will mainly focus on this.
• massif
This plug-in produces PostScript graph of process memory usage as a
function of time. This also produces an ASCII or HTML report of allocation backtraces.
21
• callgrind
This can be used for profiling performance and getting call traces from
programs. These can be further visualized with the Kcachegrind tool.
• helgrind
This helps in finding race conditions in threaded programs. This does not
work in maemo Valgrind. It works only with Valgrind 2.2.
N.B.
In the maemo environment, you can use the Valgrind
debugger only in the Scratchbox X86 target.
Valgrind has many options, but only the basic ones are covered here with
examples. The link to the full Valgrind manual is given at the end of this section.
Installing Valgrind Tool
Installing Valgrind is simple. Log in on Scratchbox and run the following
commands:
1. Get Valgrind from the repository:
[sbox-armel: ~] > sb-conf select x86
[sbox-x86: ~] > apt-get install valgrind
...
Setting up valgrind (3.3.0-1.osso1) ...
[sbox-x86: ~] >
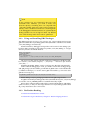
N.B.
The maemo Valgrind version depends on the libc6-dbg.
On the desktop Linux, some of the debug symbols are
included in the libc6 library itself. If the debug symbols
are missing from the libraries, Valgrind cannot match
the error suppressions to the internal library functions.
In the maemo libc6 case, it would show lots of errors
for the dynamic linker.
If using a non-maemo version of Valgrind, the following
environment variable needs to be set before valgrinding
programs using Glib:
[sbox-x86: ~] > export \
G_SLICE="always-malloc"
Without this, Valgrind will report bogus leaks from
Glib.
2. Get the two small example applications written in C language to demonstrate the basic usage of valgrind tool. You can download these from
maemo.org: valgrind_example.tar.gz.
22
[sbox-x86: ~] > mkdir src
[sbox-x86: ~] > cd src
[sbox-x86: ~/src] >
After downloading, just copy the valgrind_example.tar.gz file to the
~/src/ directory and perform the following:
[sbox-x86: ~/src] > tar xvzf valgrind_example.tar.gz
valgrind_example/
valgrind_example/valgrind_example.c
valgrind_example/valgrind_example2.c
[sbox-x86: ~/src] > cd valgrind_example
[sbox-x86: ~/src/valgrind_example] >
3. Compile the two small example applications in the following way:
[sbox-x86: ~/src/valgrind_example] > gcc valgrind_example.c -o \
valgrind_example -g
[sbox-x86: ~/src/valgrind_example] > gcc valgrind_example2.c -o \
valgrind_example2 -g
Using Valgrind Memory Debugger Tool
After compiling the small example application, it can be run under valgrind
with the command:
[sbox-x86: ~/src/valgrind_example] > valgrind --tool=memcheck --leak-check=yes \
--show-reachable=yes --num-callers=20 --track-fds=yes ./valgrind_example
Explanation of the parameters and their meanings:
• --tool=memcheck
Defines which tool Valgrind should use. In this example, the memory
checker tool is used.
• --leak-check=yes
With this option, Valgrind checks the code for potential memory leaks.
• --show-reachable=yes
This option creates a stack trace of the creation of the reachable but unfreed
memory when the program exits.
• --num-callers=20
With this option, the number of function call levels that Valgrind displays
can be changed. The default value is 12. Giving higher number takes a
bit more memory. It is advisable to tune this option, because for example
the gtk callstack can consist of more than 100 items.
• --track-fds=yes
Track-fds means Track FileDescriptors. If the application is opening
and closing files with fopen() or open(), this will report which files are
not closed.
The output of the example application should look like:
23
==4493==
==4493==
==4493==
==4493==
==4493==
==4493==
==4493==
==4493==
==4493==
==4493==
==4493==
==4493==
==4493==
==4493==
==4493==
==4493==
==4493==
==4493==
==4493==
==4493==
==4493==
==4493==
==4493==
==4493==
==4493==
==4493==
==4493==
==4493==
==4493==
==4493==
==4493==
==4493==
==4493==
==4493==
==4493==
==4493==
==4493==
==4493==
==4493==
==4493==
==4493==
==4493==
==4493==
==4493==
==4493==
==4493==
==4493==
==4493==
==4493==
==4493==
==4493==
==4493==
==4493==
==4493==
==4493==
==4493==
==4493==
==4493==
==4493==
==4493==
==4493==
==4493==
==4493==
==4493==
==4493==
==4493==
==4493==
==4493==
Memcheck, a memory error detector.
Copyright (C) 2002-2007, and GNU GPL’d, by Julian Seward et al.
Using LibVEX rev 1732, a library for dynamic binary translation.
Copyright (C) 2004-2007, and GNU GPL’d, by OpenWorks LLP.
Using valgrind-3.2.3-Debian, a dynamic binary instrumentation framework.
Copyright (C) 2000-2007, and GNU GPL’d, by Julian Seward et al.
For more details, rerun with: -v
Conditional jump
at 0x400A970:
by 0x40033B3:
by 0x4012C29:
by 0x400193F:
by 0x4000846:
or move depends on uninitialised value(s)
_dl_relocate_object (in /targets/x86/lib/ld-2.5.so)
dl_main (in /targets/x86/lib/ld-2.5.so)
_dl_sysdep_start (in /targets/x86/lib/ld-2.5.so)
_dl_start (in /targets/x86/lib/ld-2.5.so)
(within /targets/x86/lib/ld-2.5.so)
Conditional jump
at 0x400A99C:
by 0x40033B3:
by 0x4012C29:
by 0x400193F:
by 0x4000846:
or move depends on uninitialised value(s)
_dl_relocate_object (in /targets/x86/lib/ld-2.5.so)
dl_main (in /targets/x86/lib/ld-2.5.so)
_dl_sysdep_start (in /targets/x86/lib/ld-2.5.so)
_dl_start (in /targets/x86/lib/ld-2.5.so)
(within /targets/x86/lib/ld-2.5.so)
Conditional jump
at 0x400AFF3:
by 0x40033B3:
by 0x4012C29:
by 0x400193F:
by 0x4000846:
or move depends on uninitialised value(s)
_dl_relocate_object (in /targets/x86/lib/ld-2.5.so)
dl_main (in /targets/x86/lib/ld-2.5.so)
_dl_sysdep_start (in /targets/x86/lib/ld-2.5.so)
_dl_start (in /targets/x86/lib/ld-2.5.so)
(within /targets/x86/lib/ld-2.5.so)
Conditional jump
at 0x400A825:
by 0x4003448:
by 0x4012C29:
by 0x400193F:
by 0x4000846:
or move depends on uninitialised value(s)
_dl_relocate_object (in /targets/x86/lib/ld-2.5.so)
dl_main (in /targets/x86/lib/ld-2.5.so)
_dl_sysdep_start (in /targets/x86/lib/ld-2.5.so)
_dl_start (in /targets/x86/lib/ld-2.5.so)
(within /targets/x86/lib/ld-2.5.so)
Conditional jump
at 0x400A86C:
by 0x4003448:
by 0x4012C29:
by 0x400193F:
by 0x4000846:
or move depends on uninitialised value(s)
_dl_relocate_object (in /targets/x86/lib/ld-2.5.so)
dl_main (in /targets/x86/lib/ld-2.5.so)
_dl_sysdep_start (in /targets/x86/lib/ld-2.5.so)
_dl_start (in /targets/x86/lib/ld-2.5.so)
(within /targets/x86/lib/ld-2.5.so)
Conditional jump
at 0x400A99C:
by 0x4003448:
by 0x4012C29:
by 0x400193F:
by 0x4000846:
or move depends on uninitialised value(s)
_dl_relocate_object (in /targets/x86/lib/ld-2.5.so)
dl_main (in /targets/x86/lib/ld-2.5.so)
_dl_sysdep_start (in /targets/x86/lib/ld-2.5.so)
_dl_start (in /targets/x86/lib/ld-2.5.so)
(within /targets/x86/lib/ld-2.5.so)
FILE DESCRIPTORS: 3 open at exit.
Open file descriptor 2: /dev/pts/2
<inherited from parent>
Open file descriptor 1: /dev/pts/2
<inherited from parent>
Open file descriptor 0: /dev/pts/2
<inherited from parent>
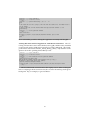
ERROR SUMMARY: 11 errors from 6 contexts (suppressed: 0 from 0)
malloc/free: in use at exit: 40 bytes in 2 blocks.
malloc/free: 3 allocs, 1 frees, 60 bytes allocated.
For counts of detected errors, rerun with: -v
searching for pointers to 2 not-freed blocks.
checked 56,760 bytes.
24
==4493==
==4493== 10 bytes in 1 blocks are definitely lost in loss record 1 of 2
==4493==
at 0x4020626: malloc (vg_replace_malloc.c:149)
==4493==
by 0x804841B: main (valgrind_example.c:26)
==4493==
==4493==
==4493== 30 bytes in 1 blocks are definitely lost in loss record 2 of 2
==4493==
at 0x4020626: malloc (vg_replace_malloc.c:149)
==4493==
by 0x8048482: main (valgrind_example.c:48)
==4493==
==4493== LEAK SUMMARY:
==4493==
definitely lost: 40 bytes in 2 blocks.
==4493==
possibly lost: 0 bytes in 0 blocks.
==4493==
still reachable: 0 bytes in 0 blocks.
==4493==
suppressed: 0 bytes in 0 blocks.
[sbox-x86: ~/src/valgrind_example] >
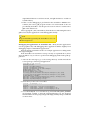
The output of the Valgrind tells that there were 40 unallocated bytes for
the application ("definitely lost"). This means that the example application is
leaking memory, and cannot free it anymore. This means that the code should
be studied closely.
Valgrind also tells the lines in the code where these allocations that are not
freed are performed. In this example, the lines in question are 41 and 19.
Official Valgrind Manual
Valgrind.org has an official Valgrind manual available in the Internet, explaining the many options and debugging practices that Valgrind can support. For
full coverage of Valgrind see Valgrind User Manual [5].
1.2.7
Other Debugging Tools
The SDK provides a number of other tools that are useful in debugging. See
the linked documentation pages to learn more about them.
• strace - a system call tracer. Prints out all the system calls made by the
traced process.
– http://maemo.org/development/tools/doc/strace
• ltrace - a library call tracer. Prints out all library calls made by the traced
process.
– http://maemo.org/development/tools/doc/ltrace
• sp-rich-core - produce rich cores that will provide a snapshot of the system’s
state at the time of the crash in addition to the core dump file.
– http://maemo.org/development/tools/doc/sp-rich-core
• syslog - a logging system that can collect logs in a centralized way.
– http://maemo.org/development/tools/doc/syslog
Please also have a look at the tools main page Maemo SDK tools [2] for even
more tools that could be useful for you.
25
1.3
Making a Debian Debug Package
Application developers should provide debug packages corresponding to their
application packages. This section shows how to do that.
Debian debug packages contain debug symbol files that debuggers (like gdb)
will automatically load when the application is debugged.
On ARM environment, the debugger cannot do backtracing or show correct
function names without debugging symbols making it thus impossible to debug
optimized binaries or libraries. All libraries in the device are optimized.
In X86 target, debugging can be done without debug symbols.
If the package maintainer provides no debug package, then the other developers in the community need to spend extra time and effort to recompile
the application (or the library) with the debugging symbols. This extra (timeconsuming) step can be simply eliminated by the package maintainer by providing a ready compiled debug package.
This section covers creating a Debian debug package from the
maemo/Scratchbox point of view.
It is the package maintainers role and decision to create and provide a debug
package for their application or library. This means that you as the package
owner are responsible to modify the debian package configurations, so that the
dpkg-buildpackage tool will produce the additional dbg-package.
If you are a maintainer of a library or binary package, it is strongly recommended to create a corresponding debug package. This is needed by anybody
wanting to either debug or profile your software or something using it.
1.3.1
Creating DBG Packages
Steps to create a debian DBG package are:
1. Clean up any previous dbg configurations from your package
If your package already provides the debugging symbols the "hard, old
way" then you should clean these configurations first.
If you use dh_strip --dbg-package option in debian/rules file, then
it is not necessary to build or copy anything to the -dbg package build
directory anymore. Check your packages debian/rules file and remove
all lines that have statements to create dbg packages.
If you have any files named debian/*-dbg.* then just remove these files.
These were required with the old way to use dh_strip.
The following steps are the only ones needed to create the debug packages
with newer versions of dh_strip.
After you have cleaned up any previous dbg configurations from your
debian files move to the next step.
2. Define DBG package(s)
For every package listed in your debian/control file that contains libraries or binaries, you need to add corresponding <package>-dbg entry.
If you have debian/control.in then modify that instead.
Make the debug package(s) to depend from the corresponding binary/library package. Here is an example:
26
.
. other package definitions above
.
Package: libgtk2.0-0-dbg
Section: libdevel
Architecture: any
Depends: libgtk2.0-0 (= ${binary-Version})
Description: Debug symbols for the Gtk library
N.B.
If the package contains binaries instead of libraries, the
Section should be devel.
N.B. The new -dbg package may have a different
name from the old style debug package (for example
libgtk2.0-0-dbg, not libgtk2.0-dbg). If there are
earlier (old style) debug packages in the repositories
the new debug package should replace/conflict with
the old one.
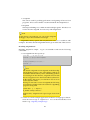
3. Add option -g to CFLAGS
Make sure you have set option -g in CFLAGS in the debian/rules file, and
that this option is effective and always enabled. Otherwise the debug
package will not contain the required debug symbols.
For example, use a line like this for CFLAGS
CFLAGS = -Wall -g
4. Use dh_strip
You can either provide all debugging information for your package, or
just a minimal debugging information required to debug something else
using your library.
You want to select the latter option only if you want to reveal as little of
your code as possible (for example) for contract reasons.
(a) Providing all debug information in your dbg package.
Debian/compat levels smaller than 3 should not be used (1 is default!). If your package sets debian/compat level below 5, give the
following arguments to dh_strip in debian/rules file:
dh_strip --dbg-package=<package1> [--dbg-package=<package2> ...]
For example:
dh_strip --dbg-package=libgtk2.0-0
If compat level is 5 or higher, use syntax:
dh_strip --dbg-package=<package1>-dbg [--dbg-package=<package2>-dbg ...]
For example:
dh_strip --dbg-package=libgtk2.0-0-dbg
27
If you’re using cdbs instead of debhelper (i.e. dh_* commands) in
your debian/rules file, use this instead:
DEB_DH_STRIP_ARGS := <dh_strip arguments>
For example (for compat levels below 5):
DEB_DH_STRIP_ARGS := --dbg-package=<package1> ...
(b) Providing just minimal debug information
In case you do not want to reveal all information about your binary
(e.g. for contract reasons), you can provide a debug symbol file just
with the .debug_frame section (which is the minimal information
needed by gdb to show working backtraces in ARM environment).
In addition to information provided by the binary file, it will reveal
only static function names and the number of function arguments.
To do this, replace the above dh_strip line in debian/rules file
binary-arch target with:
chmod +x $(shell pwd)/debian/wrapper
export PATH=$(shell pwd)/debian/wrapper:$$PATH; \
dh_strip --dbg-package=<package1> [--dbg-package=<package2> ...]
Notice that the wrapper script is set executable because the dpkg-source
does not preserve the exec permissions.
Store the following wrapper script as debian/wrapper/objcopy:
#!/bin/sh
#
case " $* " in
*" --only-keep-debug "*)
exec /usr/bin/objcopy -R .debug_info -R .debug_aranges \
-R .debug_pubnames -R .debug_abbrev -R .debug_line \
-R .debug_str -R .debug_ranges -R .comment -R .note "$@"
;;
esac
exec /usr/bin/objcopy "$@"
With this dh_strip will use objcopy through this wrapper (i.e. remove the other debug sections).
5. Verify the package(s)
Update the Debian changelog with dch -i and build the package with
dpkg-buildpackage -rfakeroot. This will create new Debian source
package (dsc + diff) and binary package(s) which you can install on the
target for additional testing.
See also dh_strip (1) and debhelper (7) manual pages for details about the
helper scripts.
28
N.B.
If the package has any function(s) that have the
noreturn GCC attribute, you need to make sure
that the object(s) containing those are compiled with
-fno-omit-frame-pointer (or remove the noreturn attribute). This is needed for backtraces containing them
to be debuggable when the binaries are optimized, the
debug symbols are not enough for them. By default
GCC omits frame pointer when code is optimized.
1.3.2
Using and Installing DBG Packages
The debug packages are easy to use, just apt-get install them and on target
gdb will load the new style debug symbol files (installed to subdirectories under
/usr/lib/debug/) automatically.
Inside Scratchbox, debuggers and profilers will search for the debug symbol files under scratchbox target directory under /usr/lib/debug, so a target
directory needs to be linked under it.
mkdir /usr/lib/debug
cd /usr/lib/debug
mkdir targets
ln -s /usr/lib/debug \
targets/$(sh -c ’. /targets/links/scratchbox.config;echo $SBOX_TARGET_NAME’)
The reason for this is that realpath on libraries and binaries inside Scratchbox returns /scratchbox/targets/.../usr/lib/... instead of just normal
/usr/lib/....
Installing the maemo-debug-scripts package does this link automatically.
And for thread debugging to work, you need to install libc6-dbg package
and gdb package, the Scratchbox provided host gdb doesn’t work with threads
(or ARM core dumps). To use the native gdb in Scratchbox, you need to start
gdb the following way:
SBOX_REDIRECT_IGNORE=/usr/bin/gdb /usr/bin/gdb /usr/bin/my-binary
maemo-debug-scripts package provides native-gdb script for this.
For gdb to find old style debug symbol files (installed directly into /usr/lib/debug/)
you need to use LD_LIBRARY_PATH or load them manually in gdb.
Files in these old style debug symbol files contain both the binary and debug
symbol sections, so they are also larger than the new style debug symbols that
dh_strip instructions above will create.
1.3.3
For Further Reading
• Debian New Maintainers’ Guide
• Debian Developer’s Reference, Chapter 6 - Best Packaging Practices
29
30
Bibliography
[1] Maemo developer documentation.
http://maemo.org/development/documentation/.
[2] Maemo SDK tools. http://maemo.org/development/tools/.
[3] Maemo Diablo Reference Manual for maemo 4.1, chapter Development
Environment, section Installing SDK.
http://maemo.org/development/documentation/.
[4] Maemo Diablo Reference Manual for maemo 4.1, chapter Development
Environment, section Setting up USB Networking.
http://maemo.org/development/documentation/.
[5] Valgrind User Manual.
http://valgrind.org/docs/manual/manual.html.
31