1
P8
MODEL
CATCHMENT
URBAN
MANUAL
USER'S
Version 1.1
PreparedF~
Street
Bay Project
Promenade
291
Narragansett
Providence,
RI 02903
P%~redBy:
IEP, Inc.
01532
:MA
orthborough,
N
6 Maple Street, P.O. Box 780
TABLE or CONTENTS
FILlS
DISTRIBUTION
DI~
Procedure
AND
AND
Files
Func t ions.
Hodes
KBCBANICS
OVDVIEV
Installation
Disk
Program
User
HODEL
INTROOUCrION
~nDD6fATION
DfSTA1J.ATION
4.1
4.2
PROGRAM
5.2
5.1
1.0
1
. . . . . . . . . . . . . . . . . . . . . . . . . . . . . . . . . . . . . . . . . . . .
2.0
1
3.0
4
4.0
.5
5
6
s.o
7
8
8
Utilities
Step-by-Step
Applications
and
Scale
Documentation
Help
Started:
Inputs
Output
OPDAfiON
On-line
Hodel
Hodel
Other
Yatershed
Getting
5.3
MODEL
6.1
6.2
6.3
6.4
6.5
Functions
7
6.0
10
7.0
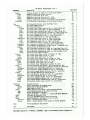
APPBHDICBS . . . . . . . . . . . . . . . . . . . . . . . . . . . . . . . . . . . . . . . . . . . . . . . . . . . . . . . .
Append ix
Append ix
Append ix
Append ix
A: Menu Structure
B: Data Entry Vorksheets
C: Example Case Applications
D: Limitations/Uses
Summary
19
18
17
lS
10
14
INTRODUcrIOH
causes
years
recent
in
development
as
area
of
land
developed
"washed"
In
undeveloped
lands
have
runoff.
vhich
and
76%,
surface
cover)
45%,
about
in
vegetative
pollutants
of
of
the
are
runoff.
contrast,
account
transport
periods
dry
surface
In
infiltration,
that
surface.
is
impervious
65%
in
numbers
increase
This
and
surfaces
available
for
infiltration
modifications
tend to increase
high
of
sources
runoff
nonpoint
the
for
land
and
Residential
particular,
land,
during
a
the
imperviousness,
In
developed
("build
leaves
over
(low
surface
reduces
accumulate
which
passes
Nationally,
to
while
hydrologic
the
runoff
characteristics
and
as
which
water
of
pollutants
areas,
proportion
surfaces
increases
dramatically,
precipitation
decline.
These
off
environment.
land
the generation
catchments.
increasing
1988).
surrounding
as
forested
site
the
or
predicting
urban
up")
on
for
in
given
open
(RIDEM,
Island
impacts
from
a model
pollution,
converted
is
pollutants
have
of
Rhode
the
throughout
a number
P8,
runoff
in
Hodel,
stormwater
developments
of
commercial
transport
appeared
1.0
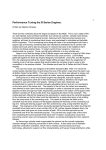
The Urban Catchment
of the degradation
of estuaries,
lakes,
and rivers,
respectively
(EPA, 1989).
On the other hand, municipal
and industrial
point
source discharges
account for
- 30% of
the degradation
of these water resources.
only
9
provide
evaluating
the
data.
for
site-specific
of
minimum
a
wi.th a tool
to
was
intent
The
developed.
with
and engineers
quality,
water
on
was
Model
Catchment
Urban
P8
land use planners
development
of
and state
impacts
local
the
Project,
Throuih sound land use planning and reviev processes, contributions
of
contaminants in urban runoff can be minimized, and vater, vetland,
and vildlife
resources protected.
Therefore,
under a contract with the Narragansett
Bay
2 . 0 MODEL OV:ii.YIiW
The user is referred
to the P8 Program Documentation for a detailed
documentation of the P8 Hodel including
applications,
limitations,
reference
citations,
and simulation
methods. Single-event
or continuous simulation
of
rainfall
events can be completed for user-defined
systems consisting
of a
maximum of (24) watersheds, twenty-four
(24) stormvater management devices
terminology
components.
1
Figure
series.
time
rainfall
hourly
continuous
by
has
P8
However,
TR-20).
D3RM,
aspp,
SVHM,
(i.e.,
models
runoff
been designed
a Binimum of site specific
data, which is expressed in
to most local enaineers and planners.
Extensi ve user
to require
familiar
interface,
including
facilitate
.odel
(B~Ps),
size classes, and ten (10) water quality
the conceptual organization
and functional
components. and variables
by the model.
P8 consists primarily
of algorithms derived from other
urban
illustrates
simulated
tested
(5) particle
are
five
driven
,
Simulations
(BMPs)
including
use.
spreadsheet-like
The Bodel will
swales, buffer
menus
and on-line
simulate
strips,
a variety
detention
help documentations
of treatment
devices
ponds (dry, wet, extended),
flow splitters,
and infiltration
basins (offline
and online) as illustrated
in
Figure 2.
Initial
calibration
of certain water quality parameters has been
completed, such that runoff concentrations
correspond to values measured under
the Nationwide Urban Runoff Program (NURPj Athayde et al., 1983).
-1-
~
~
<
.w
~
cn
~
w
~
~
~
(J)
(J)
I
m
~
..J
~
~
~
Z
(II
(J
~
w
-
c.
~
t-
cn
Q
(J
~
w
>
:I:
w
CJ
~
w
w
~
~
~
t-
(J
.-
2
>
-
Z
Iw
0
<
C
~
0
~
0.
2
w
U-
w
c
..a
>
~
..
-
",
2
c
1&1
=
0
2
=
II.
'"
0
(..)
~
<
~
z
:::
.-
~
0
w
f/J
=
~
-J
f/J
~
~
w
cn
I~
.oJ
-<
&&..
~
>-<
x
)(
!.
.
.
.
.
.
.
.
.
.
.
.
.
.
.
.
.
.
.
.
.
.
.
.
2
FIG..~
P 8 DEVICE TYPES
1
DETENTION POND
.'I.L.WAY
.
IKLWAY
.
BASIN
3
TJON
.
TRA
2
INFJL
WL~ATIOM
45
.
GENERAL
DEVICE
PIPE / MANHOLE
=
spurTER
.
6
w\.ow
7 . AQUIFER
""
~
.'
LMU~"
/
,
~:~IIII~..-'"
,'.'~
-'-ow
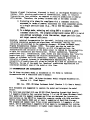
Because of model limitations,
discussed in detail in the Program Documentation
(Valker,
1990), absolute predictions
of concentrations,
loads, or violation
frequencies are less reliable,
as compared to relative
predictions
of removal
efficiencies.
Therefore,
the primary intended uses of the model include:
class
(e.g.,
2) In a design mode, selecting
reliability
of
Urban
Catchment
flows)
are
Model
applications,
the
availability
site
methods,
and
for
P8
Vithout
the
verification.
of
as with
load,
will
often
be limited
less
reliable
by a lack
model for
"absolute"
of the model at this
1P90.
1.1.
1990.
predictions
time.
than
"relative
of
a
are
calibration
data.
applications
are
technical
(a
forms
two
in
manual):
P8 Urban Catchment
Final
Model:
Program
Documentation.
Report.
P8 Urban
suggested
are
documents
Inc.
documented
user's
V.V.
Version
IEP,
is
Model
simplified
a
and
Catchment
Urban
P8
Valker,
Both
document,
However,
simulation
testing,
DOCUllmrrATIOR AND DISTRIBtrrIOR
documentation
The
3.0
including
calibration,
the relative
differences
(% change)
between
scenarios).
However,
absolute
predictions
in watershed-scale
applications,
but the
predictions
the use of the
secondary
uses
model,
companion
1990).
and
concentration,
comparing
built-out
interest
Therefore,
considered
the
used
the
certainty
and
(e.g.,
(e.g.,
different
of greater
to match
"absolute"
in
calibration
for
data
interpretation
of
predictions
BHP's
the
and algorithms,
be
for
methods
Program
Documentation
(Valker,
watershed-scale
applications.
predictions
number of
typically
time
storm
documentation
provided
scales
by
are
BMP's to achieve a given
also
limitations
solids,
RIDEH,
85% TSS removal,
automatically
output
simulation
suspended
efficiency.
This
technical
including
removal
model
Detailed,
and sizing
objective,
total
limited
target
and
70% or
The program
watersheds,
objective.
user-defined
treatment
a treatment
for
particle
particle
with
efficiency
class,
compliance
removal
may
or a single
1988).
for
of
target
plans
terms
calibration,
in
series,
site
expressed
is
Evaluating
model
1)
Catchment
to operate
Model
(Version
the model
1.1):
User's
and interpret
Manual.
the model
Access
Hemory
(RAM)
1.1
at
least
2
of
the
density
high
P8 Urban Catchment
Hodel.
megabytes
of
Bard
640k
with
are designed for interactive
available
system
computer
compatible
or
and
System)
DOS
one
MS
Version
support programs and files
PC
the
on
applications
This model and its
Random
with
that contains
diskette
IBM
1.2 megabyte
Operating
You have been provided
(Disk
output.
Disk
Storage.
and
disk
hard
a
with
computer
class
higher
or
processor)
(80286
AT
An
files.
The program and sample input files
occupy approximately
1.2 me,abyte of disk
space, and an additional
1 megabyte of disk space is recommended for working
compiler
(graphics,
screen
4.1 Installation
The
following
is
program
5.0
The
Version
Inc.
computations.
Microsoft,
the
to
using
recommended
accelerate
subroutine
libraries
include
ASMUTIL 2 and BUTILE
Francisco.
further
information
contact:
Proeedure
is
diskette.
filename
used
This
'Readme'.
to
install
procedure
This
pa
is
file
on
your
provided
hard
on
can be accessed
drive
the
from
distribution
using
the
diskette
the >Type command in
Place
Enter
the
the
distribution
following
diskette
in
Disk
Drive
in
a directory
line:
>A:
1.
2.
A:
DOS.
under
or
procedure
distribution
Supportini
manipulation)
FILlS
assistance
DISI.
technical
library).
character
San
AND
For
(emulator
control,
Eniineerini,
INSTA1J.ATION
Impulse
4.0
from
compiled
and
are
FORTRAN-77
coprocessor
in
numeric
written
optimizing
.
> INSTALL
For Computers
Computers
.
Por
P8,
enter
available
one
of
the
on your system:
graphics:
with
Iraphics:
(Standard
CGA
For
called
the type of graphics
VGA
with
.
(C)
upon
EGA
with
Computers
INSTALL
>
For
.
> INSTALL
Disk
EGA
Computers
pa
For
hard
depending
C
.
the
VGA
on
lines
pa
install
following
C
3. To
IBM-PC)
color
graphics:
C pa CGA
with
CGA monochrome
graphics:
> INSTALL C P8 MCGA
Computers
with
other
graphics:
> INSTALL C pa XXX
4. Add the following
hard disk:
line
to the CONFIG.SYS file
FILES.20
-5-
in
the root
directory
of your
enter
Notes:
The graphics
(HCGA)
is
lines:
switch
to hard drive)
access P8 directory)
run P8)
resolution
is
suggested.
poor
HCGA
in CGA mode and monochrome
has
higher
resolution
that
and viII
run vith
either
color
or monochrome
computers vith
other graphics
or no graphics
run but vithout
plotting
routines.
The program
using
step
enter
switch
4.2
is
now loaded
5 of
the
on your
installation
hard
disk,
CGA,
monitors.
(XXX mode),
but
the
and can be accessed
procedure.
XXX . EGA, VGA, CGA, etc.
version
If
(see
you
want
'Readme'
to
file
for
change
for
no
color,
on
(to
(to
(to
>cd\P8
>P8
following
installed
>c:
the
If
program,
P8
run
To
5.
program
vill
future
use
driver
further
later,
details).
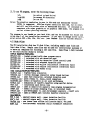
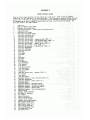
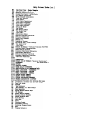
Disk. Piles
disk has 91 disk files,
including sample case files
and
input data files.
Sample case files
may be used for instructional
purposes or
to serve as templates for building a new case file.
Case files (.CAS)
included
The PB installation
include:
SIMPLB DAllPLBS/TlMPLATBS:
DEFAULT.CAS
loaded automatically
-
-
- one tracer
comparison
watershed
infiltration
(daily
device
facility
facility
basin, vet pond
streaaflov
simulation)
only
runoff
simulation
analysis
loads
documentation)
program
watershed
on
(see
baseflow
- upper detention
- lower detention
lane offline
aquifer
performance
using
pond
post-development
freq.
analysis.
mall
devices
pond
type
includes
IMPACT.CAS;
vs.
street-sweeping
sensitivity
in
of
as
square
emerald square mall
- hunt/potovomut
baseflow
&
wet
swale-->pond
on
vs.
flow
runoff
of
base
pond-->swale
used
effect
emerald
basin
:
each device
pre-develop.ent
same
-
-
-
-
- illustrates
-
basin
(retention)
strip
infiltration
infiltration
pond
simulation
of
-
effect
-
PONDS'JAL.CAS
BASEPOND.CAS
pond
control)
detention
on-line
offline
with
1
with
with
extended detention
with
watershed
watershed
highway/swale
si.ulation
DYPOND.CAS
ESH U.CAS
ESH-L.CAS
TRACER.CAS
HUNT.CAS
with
pond
- rooftop
drainage
simulation
using traced
- peak flpw simulation,
extended detention
HmOUSE.CAS
lEAL V'OBLD:
1
-
CAS
-
HIGHVAY.CAS
when program starts
wet detention
IlAMPLlSrrBllPLATES
COMPLU
MORI
BUFFER.
ONLINE.CAS - 1
OFFLINE.CAS - 1
watershed
EXTPOND.CAS
watershed
- 1 watershed
DRYPOND.CAS
RIVBAS. CAS
TEST. CAS
SENSIT.CAS
SVEEP.CAS
IMPACT. CAS
IMPACT2.CAS
with
dry
1 watershed
buffer
-
VETPOND.CAS
(retention)
diskette
(flood
on the distribution
NURP90.PAR
distribution
mode,
NOVICE
the
if
-
Edit
be
Bovever,
may
specified.
particle
the
using
available,
vith
sail
precipitation
mode
is
data
calibrated
NURPSO.PAR
bare
the
class
(NURP 10% Settling
Velocity)
to NURP median event-mean
runoff
concentrations
to
NURP
90th percentile
sites
-
-
-
BARESOIL.PAR
Several
ADVANCED
- one particle
calibrated
SIMPLE.
PAR
NURPSO.PAR
the
in
site-specific
edited
or
sufficient
entered
sequence.
be
must
(.PAR)
on
been calibrated
have
In
Nation-vide
Urban Runoff Program (~_~_E;
one of the folloving
particle
files
command
provided
data
Particles
input
'CEP'
characteristics
These
1983).
particle
al.,
for
belovo
characteristics
files
listed
et
are
Case
input
diskette
At~yade
The four
pervious
runoff
files
concs.
increased
(e..g., construction
conditions
for
the
Providence
NOAA
to
reflect
sites)
station
are
included
on
the
distribution
diskette
for convenience.
In addition,
the UTILITIES
function
in
the P8 MENU allows
the user to convert
hourly
precipitation
data available
on
diskette
for any NOAA weather station
or period of record.
Storm files
(.STH)
distribution
diskette
for
II . 74,
II . 79,
It . 87
. (complete
PROV6987.STK
TYPE2.STH
year
specified
(one
76,80
83
record
inch,
24 hour
{.4 inch,
Northeast
file
6 hour,
TSS removal
with
total
II
distribution)-
efficiency
PASSES>
75 hour
.
in Rhode
5
interval)-typical
for
provid es on-line
and
HODES,
USER
two
has
MENU,
from
HODE),
provides
HODE
ADVANCED
or
model.
the
to
of
set
is
number
limited
program
a
the
with
HODE,
132 of the program functions
startup,
At
NOVICE
of
access to
operation
primary
NOVICE
HODE
The
(NOVICE
HODES
the
to
follow.
the
restricting
menu.
program
continue.
to
the
in
key
any
location
P~ess
any
mode.
new
the
from
ADVANCED
HODE
(or to return to novicemode),press
simultaneously
indicating
keys
experience.
of
USER
two
to
find
may
difficult
users
New
less
<F1>
appear
and
while
provides access to all
NOVICE
HODE.To changeto
message will
functions,
supplementary
are
progr..
ADVANCED HODE
choices,
level
of
users
either
the
in
upon
runs
based
which
the
options.
Vhile,
and
long-term
this
SCS Type
documentation.
functions
access to the 43 basic
option
with
User
program
selected
The
5.1
HELP
The program is operated
<Shift>
storm
PROGRAMKBCB.ANICS
a
5.0
use
including:
average years
wet years
others
Providence
1969-1987)
at
to approximate
Island,
AVERAGE.5TH
.t,
dry
{record
II
PROVlt.STK
include:
years
the
65,81
on
.
provided
5.2
Prograa
Functions
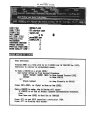
The MENU, appearinr
in a blue box at the top of th. computer screen,
operates
similar
to a spreadsheet,
and provides
access to up to four tiers
of program
options
or functions
(Figure
3).
The bottom portion
of the MENU screen
describes
the current
application
or CASE. The primary
menu options
include:
-
a
To get
help
fro.
. (F1>
. (F7>
..
any
data
entry
of
of help
6.0
section
detailed
in
more
presented
'help.exe':
usin,
>help
-8-
<F1>
running
help
the
search
file
by
or
.enu,
to
KEY
BELP
the
pressinl
.
screens
from
the
use of editor
DOS
from
screens
help
view
<8> prompt .vhich
screen
screen:
. (F8> . help for current input field
. (F9> . help for any P8 function
.
A
A
the
help for data entry screen
help for
the user
<PI)
MENU
of
top
or croup
fro.
a any help screen
Select
BBLP
corner
or
topic,
in the main aenu:
procedure
and press
tier
left-hand
option
.
lover
permit
phase.
a help screen "for any output
screen:
. Press <PI) in response
to any hold screen
the
BELP SCREENS
screens.
aain
the
in
a user defined
documentation
These utilities
by
DOS.
or,anized
fro.
help screen for any procedure
. Have the cursor
to the desired
To viev
only)
DOS
A.
is
by
accessed
or output
selection
BELP
the
croups,
screens containing
in
To
only)
mode
to
Index).
Appendix
Device
in
utilities
and
be
can
screens
fro.
screens,
'help.exe'
in
utility
screens
help
documentation.
in the program provide extensive on-line
These
accessible
also
return
and
Case
Edit
program
the main menu, data-entry
independent
view
companion
Doe.~tat1oD
program~
the
for
are
to
in
provided
output,
are
input,
and the
BELP SCREENS included
To viev
(advanced mode
scre.ns
are
5.3 On-liD. Help
To viev
help
arroys
options
model
of
program
document
all
session
End
functions
(e.I.,
discussion
various
menu level
for
on-line
-
QUIT
Additional
QUIT
Cursor
Bowever, a faster
the
(advanced
Supplementary functions
Access
provided in lower levels of the MENUfor each of the
can be used to maneuver around the menu.
method is to enter the letter of the desired choice at each
'CEDI' description of the
options.
while
output
Plot
-
PLOT
UTILITIES
UTI LrrIES
HELP
HELP--
this
output
List
PLOT-
of
or save input data
model
Execute
-
LIST -LIST
primary
read, list
Enter/edit,
-
RUN
RUN
CASE CASE
(cursor location)
Bain
vill
HENU:
appear
=
=
=
~TI(J6
=
WATERQUALITY CfJ1P .
PARTICLE
aTO
pro u6988 . tlItP
= SrnPLE.PAH
=
I~
CES
I
BJ
D
D9J
EDS
~ATEHSH
TBEAmErtT
THACED
=
FILE
.
=
=
FILE
RAnGE
FILE
TITLE
CASE
CASE
STORn
DATE
AIB
TEr1P.
FILE
PARTICLE
DEFAULr . CAS
P8 startup case
type2 . stR
9
6.0
6.0
MODBL OPERATION
of the
the command
I
of
groups utilized
to
demonstration
cases are
provided
demonst:
are provided in
tly used commands,
data
entry
procedures,
,
procedures, and
This section
provides
a brief
description
scription
Several
enter/edit
data and view output.
Several
Appendix
C,
and entry
in
CBDD
CEDI
CBP
CBVD
CBVI
CBI
Device
Data
Data
cap
Vater
General
help
screens
certain
data
input
are
n,
section
Case
List
necessary
the
the
of
(similar
devices
dia,ram
specifications.
compile
to
design
is
treatm8nt
schematic
and
a
device
case
new
a
constructing
for
data
folloving
D.vice
Each
are
Prolram
commands:
Type)
Vatershed)
file
in
on-line
for
~eferenee.
in
disk
MODE only)
<F1).
Hore detailed
rates,
Curve
<F8) when pointinr
for
infiltration
help
Input
stored
from
USER
(ADVANCED USER MODE only)
by pressing
the
the
Each
(ADVANCED
infiltration
provided
and
and loads
loads
a disk
are
to
the
printed
using
input
curve
can be listed
file
help
on
Numbers,
rates,
screens
data
field
numbers
at
the
end
using
the
'CLS'
'CSI'
(.
Case
on
and
of
Save
and
sequence,
screen.
right
listing
storm
by
and
lover
on
use
values
input
subsequent
appears
normally
class,
class,
and mass-balance
include
each
each device,
device,
partic
ce, particle
particle
event
-10-
term.
total
nev
a
or
ehanged
are
values
input
values
StOI
Stored
until
available
is
disk.
disk.
of
for
set
.essage
file
riven
disk
a
for
Exec
Exeeuted"
te.porary
"Model
"Model
a
exeeuted
A
for
for
run is availal
the
the
from
fro.
run
a given
read
given
a
for
read
for
routines.
A
in
is
saved
model
executed
for a
in a temporary
routines.
are
the
plotting
is
for
by pressing
(e.g.,
comaand,
using
Screen
Components
tables
easy
Model
Steps
accessed
accessed
or edit
4.
Data
collection
and
and subsequently
subsequently retrieved
retrieved using
using 'CiA'
'CIA' (.(. Case Read All).
results
Vhen
are
to enter
Catchaent
Characteristics
Quality
in Figure
the data
Parameters
Lookup
Site)
plotting
Output
(Separate
Time
values
Vhen the model is
results
are saved
case
Screen
Characteristics
screen.
this
and
Index
Vatershed
used
Urban
performed
(Separate
Va tershed
CICF
Hanning's
vatershed
File
& Storm
Index
Particle
is
of
Title
Device
Simulation
n)
P8
Case
Evapotranspiration
date-entry
are
the
is
Read Particle
Hanninr'S
which
of
entry/editinl
ClP
Output
first
appendices
Data
CIT
case
entering
and
by
The screens
the
Documentation.
linkage
the
in Tl-20
applications)
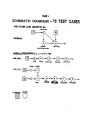
as illustrated
are provided
in Appendix
B to expedite
process.
illustrated
Inputs),
Inputs),
commands
characteristics
defining
to diagrams
used
entry
vorksheets
a
used
watershed
facilitated
th8
step
illustrates
is
for
first
data
vhich
proc8ss
input
The
site
frequently
Inputs
Model
The
6.1
illustrating
formats.
in
output
flows
(.
~
MA
DIAGRAMS
P8 TEST CASES
LEXINGTON,
TIC
LAN!,
TRACER
ONE
SCHEMA
FIGJRE4
S'UTTU
~
W8T
JPLM
0
fRACIR.CAI
MA
A
WiTLAIe
I.AU
D8VIC8
0
c.-,
~
._~(:~)
~
(;\
--
0
,...~)
~
t-:\---
0-0
ji.:.'.~:j!
(:-\
\.~)
'Co,..
.,;; '1"\__/:\-
ISM_U.CAI
W8TUI8
N.
MALL.
SQUARE
--\!I
EMERALD
.,pa, TWA
TIOMU"
Infiltration
References
1!1
ill
4.64
1.18
.43
.26
.13
.06
.04
.04
.03
.02
.01
8.27
2.41
1.02
Rates
(in/hr)
i!l.
~
Loam
Silty
Clay
Loam
Loam
Clay
Loam
Sandy
Clay
Clay
Sandy Clay
Silty
Clay
.
GROUP
A
B
C
.27
.52
.17
.09
.06
.05
.04
.02
D
Loam
Loam
Survey
Sandy
Silt
Sand.
"Soil
Loamy
SCS
Sand.
SOIL
SCS
SOIL. TB:mJRB
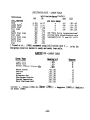
provide
data
(permeability)
on
wlDense
Dense
Undergrow
th
Growth
Pasture
Lawns
Bluegrass
Shortgrass
Sod
Prairie
Sparse Vegetation
Bare
Clay-Loam Soil
Sources: a -
McCuen (1982);
and Huber (1988)
b-
.03
.00-.05
of
1 in/hr
for
-
N
5
Hanning'S 11
Light Turf
Dense Turf
Forest
.30-.45
.15-.30
.05-.15
Interpretations"
infiltration
rate
for specific
soils.
* Yousef et al.,
(1986) recommend using infiltration
rate
designing retention
basins in sandy and sandy loam soils.
Cover Type
.43
.26
.13
.20
.35
.80
a
a
a
.40-.50
.30-.40
.20-.30
.20-.50
.10-.20
.05-.03
.01-.03
d
d
d
d
d
d
d
Shaver (1986); c.
-12-
Source
Musgrave (1985);
d-
Bedient
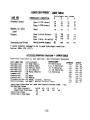
RUNOFF CURVE NUMBERS
Grassed
Hydrologic
CONDmON
-
-D
Poor «50% cover)
39
49
68
61
69
79
74
79
86
88
84
89
Good
38
58
71
78
25
36
45
55
60
66
70.
73
77
77
79
83
81
89
93
96
Areas
or
(>75%
Good
Idle
Group
-
Fair'
Meadow
Soil
ABC
-
HYDROLOGIC
LAND USB
LOOKUPTABLE
cover)
Good
Fair
ods
(thidkforest)
Poor (thin,.no
Sites
Newly
graded
condition
(1977)
assumed to be in good hydrologic
SCS
USDA,
Source:
* Lawns normally
Areas
Construction
mulch)
IMPIRVIOUS PRAcrIONS
LOOmPTABLB
CODI/CATEGORY
EQUIV ALmf'r
111
113
Hedium
Residential
114
Hed-Low
Residential
115
Low
Residential
116
Rural
>8 Units/acre
1-3, 9 Units/ac
.5-.9
Units/ac
.2-.49
Units/ac
<.2 Units/ac
Commercial
Industrial
Industrial
128
131
Transportation
Institutional
Impervious
Density
Dens,
Dens.
Density
Density
Heavy
132
H.dium
141
Roads,
188 Educ.,
Fractions
Interch.,
Service
Health,
Prisons,
Hilit.
VB. Land Use Classifications
(USDA. 1
Fraction:
Industrial
Areas
Commercial & Business
.65
.38
.38
.72
.85
-13-
1
<.1/8
1/2
(acres):
1/3
Size
Impervious
.25
.44
.27
.25
.14
.85
.62
.81
.77
.41
..47
Areas
1/4
Residential
Lot
High
A
GIS LAND USE
Residential
Residential
VDAGB
Yo
Land
.20
RAt«;B
.32-.60
.29-.38
.06-.79
.10-.18
.03-.06
.44-.92
.74-.93
.59M1.0
.23-.60
.30-.77
~
KodelOutput
have been entered
data
for a given
case,
the model must be
is
storms
'HODEL
using
the
following
that
indicate
to
screen
menu
the
precipitation,
and
or
or
loads
loads
elevation,
volume,
devices.
(See
specific
been
or
data
for
HODE.
development
screen).
for
a
for
loads
used
or
graphic
model
USER
in
flows,
flows,
have
of
convenient
Graphs'
format
viewing
use
ADVANCED
the
for
when
ASCII
Printing
in
"d"
in
only
series
may be
utilities
primarily
(Press
disk
-
screen-duap
Prograa
time
concentrations,
precip.,
precip.,
Plot
detailed
formats:
are
Plot
total
total
5
displays.
yearly
in
routines
of
etc.,
They
series
.
for
spreadsheets
monthly
time
to
for
formats:
screen
of
Plot
following
to
plots
PT
the
file
utilities).
distributions
frequency
plots
series
dumped
'Help
files
Output').
testing.
series
frequency
time
processors
be
of
time
cumulative
disch~rge,
developed
corner
cumulative
scatter
Plot
Independent
in
concs.,
PH
PT
in disk
to a disk
'Utilities
available
loads,
normal
or routed
.
precip.,
flows,
time
series
log
accessible
is
screen
'UO'
Graphic
only)
(see
print
screen
on the
use
such
other
input
(to
Plot
output
or
to
may be displayed
printing
PI
Graphic
stored
Tabular output are accessed
water and mass balances
by device and component
removal efficiencies
by device and component
comparison
of flow,
loads,
and concs. across devices
violation
frequencies
for event-mean
concentrations
peak elevation
and outflow
ranges for each device
sediment accumulation
rates by device
mean inflow
or outflow
concs. by device and component
detailed
statistical
summaries by device and component
continuity
(mass-balance)
check on simulation
results
results
output
are
of
List
List
List
List
List
List
List
List
List
subsequent
results
commands:
simulation
Tabular
Simulation
and graphing routines.
list
LBA
La
LT
LV
LP
LS
LK
LD
LC
right
lower
complete.
access by reporting
event
is
later
by
the simulation
the
in
appears
EXECUTED'
message
of
sequence
The
command.
Hodel')
'Run
(-
'RH'
the
via
executed
trackedon thescreenuntil thesimulationis completed.
A red
route
quick
a
Some
output
procedures
produce
several
series.
In order to stop the output
sequence and return
to menu, press <Esc> when the <B> prompt occurs.
In
general,
the <Esc> key (sometimes
hit more than once) provides
back to the program menu.
-14-
may
Once the input
word
6.2
6.3
Other
Design
Functions
and Utilities
Hode
document.
a particular
and
and
70%
the
and
provides
This
device).
prototype,
data.
pre-defined
the
of
of
efficiencies
removal
watershed
one
least
at
with
case
treated,
any
be
a catalogue
watershed,
device
volumes,
and
outlet
the
12
using
of
repeatedly
a
command.
class,
Hodel'
particle
'Run
to
define
maximum
run
first
A
is
areas,
feasible.
model
must
the
via
user
target
it
include
always
are
The
the
rescaled,
options
Solutions
sequence.
only).
be
devices
of
list
Rescaling
ponds
procedure,
execute
this
tunes or rescales
device(s)
any particle
class or w.ter
performed.
is
use
design
to
efficiency.
storm
solids
suspended
to
(overwrites
watershed
order
preliminary
for
a
In
prompted
is
In order
to
save
results
for
values
daily-average
are set using
Tracing
is not
devices
should
each
the 'UT'
required
step, devices must be TRACED. Trace
time
. 'Utilities
Trace'
command (ADVANCED USER
unless plotting
of within-event
variation
or
desired. Since tracing consumes
disk spaceand computer
fs
User
iterations
contains
Device
switches
HODE).
time,
for
. 'Run Design Tune')
removal efficiency
for
('RDT'
(detention
specified
capacities
requirements
one user-defined
objective.
not
component.
disk
1980 rainfall
and
quality
Trace
design
to
a user-defined
containing
procedure
achieve
case
Another
removal
of Providence
device
of
and TSS removal
target
The program
total
achieve
new
guess"
valid
a
routine,
this
use
the
"initial
type,
removal for
device
Design
'Run
.
this
of
C
to
the
specifies
for
user
location
The
suspended solids
based upon simulation
85%,
Lookup') selects and sizes a device to
must be pre-defined.
sized
devices
one device
an
or _85% total
To
watershed.
One procedure
achieve _70%
('RDL'
Appendix
in
The model can be used in a "design mode" to select and size devices appropriate
for treating
runoff from specified
vatershed(s).
Step-by-step
procedures for
using the program in a design mode are provided in the Program Documentation and
be
traced
only
when
necessary.
Sensi ti vi ty Analysis
Another procedure
outflow
concentration
are
reported
for
each
charged
during
and
removal
removal
of
percent
sensitivity
variable
resultant
The
tests
factors.
Sensitivity')
scale
'Run
storm
and
parameters,
particle
('RS'
.
efficiency
and device outflow
concentration
to each model input value.
Each
input value is increased by a fixed percentage (one at a time).
The model is
re-executed.
Effects
on removal efficiency
and outflow
concentration
are
tabulated.
Tested inputs
include
watershed variables,
device variables,
the
sensitivity
analysis.
In addition,
the relative
chan,e and percent change in
both percent removal and concentration
is reported for each input variable.
The
sensitivity
coefficient
is the percent increase in the output value relative
to
-15-
the percent
increase
in
on which
change
in
X).
This
model
inputs
most
important
therefore
the input
procedure
have
variable
(i.e.,
is especially
the greatest
to
estimate
SENS . % increase
useful
for obtaining
impact
on model
accurately
in Y/X
perspectives
predictions,
(Valker,
and are
1982).
Calibration
applying the P8 model to a large watershed application
procedure
compares
predicted
(e.g.,
of the model to predict
daily-mean
'Run
(.
'RC'
by
calibration
facilitated
is
series
time
flow
Hunt-Potowomut watershed),
the
Vhen
outflow
Calibrate')
time
the
measured daily
command.
series
from
a
This
specified
values contained in a disk file.
The model must be
('RM' command), and the device used in the calibration
be traced in order to obtain daily output values ('UT'
'ptilities
Trace'
measured
.
program
merges
observed
and
predicted
daily
flows
results
A
developments.
will
a
and
baseflow,
total
obtain
to
of
PIPE
second
time
This
ADVANCED HODE.
The
the model output.
stored
in
If
the
disk
a temporary
when running
a large
number of
for one or more years.
Batch.
in
beginning
with the case file
specified
file
file
storm
stor.
the
desired
the
specified,
and
be
sequence.
the
variables.
name given in
a
to
File'
or
mode
Output
(default)
ADVANCED
'Utilities
screen
the
the
the
to
use
in
file
output
disk
available
a
8odel
only
is
to
the
send
output
to
option
This
the
select
send
To
may
command.
file.
user
DestiaatioD
is
be
only
useful
cases
created using any line editor
0-31,
may
files
columns
stormfile
'UOF'
disk
The
Output
a
adjusting,
not
input
be
selected
or
in
'UB'
in
archiving
watershed
no
is
cases
of
Batch'-
This model utility
is particularly
or when it is desired
to run several
file.
cases
simulate
to
number
various
If
a
for
32.
execute
provided
is
The coabined
file
option
to
routed
through
are
PIPE
factors,
column
to
areas.
case
be
scaling
on
noarchive
watershed
the
also
used
is
the various
is accessed by 'Utilities
has the option
of archiving
information
user
individual
for
may
AQUIFER
an
and
and other
Batch files
files
from
acccomplished
is
AQUIFER
concentrations,
Batch
runoff
used
Calibration
outflow.
the
surface
from
to collect
outflow
used
function,
this
of this function
and its applications
to the Bunt Potowomut
in the P8 Urban Catchment Hodel Program Documentation.
utilize
To
discussion
is provided
by date.
Observed and
This procedure
is
The
used.
command).
Hoving averages are calculated
at a user-defined
interval.
predicted
time series are plotted and compared statistically.
not relevant
to designing BMP's
must
PIPE
beforehand
detailed
with
executed
will
device
without
exiting
the
command
'uv'
View'-
'Utilities
The
View
maybeusedto viewanyDOS
text/ASCII
file
PB program.
. -16-
NOAA
created
weather
NOAA
order
first
any
mode.
for
which
by the user utilizing
the 'Utilities
This function
reads hourly
ADVANCED
US.
the
the
purchased
in
data
in
station
precipitation
can be
files
command
be
storm
'UN'
can
Additional
NOAA'-
the
up
break
to
text
a
Use
be
frames.
time
PB.
vill
by
use
other
or
editor
Huber and Dikinson
obtuse
othervise
missing
no
containing
or
vith
Providence
Step-by-Step
Assemble
reference
2.
Construct sche..tic
devices.
.aterials
for
entry
and
data
for
B
entering,
Appendix
to
creating,
runs.
case
is
example
for
site
(maps,
diagraa illustrating
engineering
reports).
dovnstreaa linkage of vatersheds
and
1.
instructions
reader
C
The
case.
Appendix
nev
and
and Huber (1986);
not a problem (based upon experience
are step-by-step
a
executing
worksheets
"normal",
be
Storm
.ust
Started:
The folloving
See Bedient
referred
Getting
HINIHUM INTER-EVENTTIME
supplied vith the program vere ienerated vith an
years in input files .ust be betveen 1942 and 1999.
files
hours.
file
5
of
input
value
6.4
screen
this
years
subsequent
3-10 hrs.).
records.
This is usually
and Boston data files).
read
anda single
storm
file (.STH)
hours of each other are considered part of the same
HIT
The Providence
NOAA
HIT
on
(typically
(1988).
The
hours vithin
for
"storm"
separate
- vet
into
file
.STH
(KIT)
generated
be
vill
for
specified
names
File
The National
Climatic
Data Center
in Ashville,
NC can provide
hourly
precipitation
data
on diskette
for NOAA weather
stations
in the u.s..
Call
704-259-0682
to order.
The cost
is -S90/station
for
the period
of record
(-33
yrs.).
Request
files
in RELEASE B/CONDENSED FORHAT.
Each file
typicallycontains
5 years
of data.
3. Assign a name«.8 characters) and number(1-24) to each vatershed.
Write
these on your scheaatic.
a name «.8
needed for .odel input,
as
B.
Appendix
in
Assign
vorksheets
5.
on
Tabulate basic vatershed characteristics
indicated
4.
characters),
number (1-24),
and device type code (1-7) to
each device.
It is often convenient (but not necessary) to assign
numbers in dovnstre..
order.
Write these on your schematic.
introductory
needed for .odel input,
as indicated
help
screens
(to
skip
-17-
these,
press
<ESC».
'pe'.
enter
and
disk
hard
on
directory
B.
program
to
Appendix
in
Review
Kove
proiram.
Run
7.
8.
worksheets
Tabulate basic device characteristics
on
6.
device
9.
10.
Clear
existing
Enter
site
schematic
data
(Procedure.
(Procedure
to identify
'CZ'
-
'CU'
.
-
'Case
'Case
device/watershed
Zero').
Edit
All').
numbers
using
Load desired
particle
file
(Procedure.
'CRP'
'SIMPLE.
PAR'
and
'TYPE2.STM'
in
susses
speed computations.
t
11.
data
Refer
to
your
and names.
.
'Case
Read Particles');
preliminary
runs;
this
vill
12. Print a copy of the watershed/device network linkage for future reference;
Procedure. 'CLN'
'Case List Network';
hit
'Print
Scrn' key at <8> prompt.
6.5
Vatershed
Inputs').
Save
Case
.
etc.
'CSI'
Hodel')
'Run
(Procedure.
.
'aM'
disk
on
values
(Procedure.
case
input
simulation
Save
Run
14.
13.
-
Seale Applications
In order to utilize
convert land usage into impervious areas for watershed-scale
applications.
Again, each subbasin of the watershed may be modeled as separate watersheds
linked by the PIPE and AQUIFER devices (see section 6.3 Calibration
for
additional details on linking watersheds to the AQUIFERand PIPE
devices).
and
The
of
accounts
which
level
watershed
or
based upon the users knowledge
of characteristics
within
the
basin
the
on
modeling
modeled is selected
and the variability
complex
Hare
watershed.
number of subwatersheds
the overall
watershed,
to
13
Page
on
provided
been
has
table
lookup
A
RIGIS.
in
available
information
the pa Hodel for watershed-scale
application.,
a similar
procedure is used to that outlined
in Section 6.4, but simply focusing on a
larger scale.
Vatershed characteristics
from (i.e.,
infiltrations
rates,
impervious areas, areas, etc.) are obtained from land use/land cover and soils
for the attenuation
of pollutants
in wetlands and/or buffer zones is also
possible.
This would require routing the watershed runoff to the specific
buffers or wetland areas, and having sufficient
information
regarding the
characteristics
of buffers or wetlands to supply model inputs for these
treatment
areas.
.
detail
land
and quality,
use
the model
scenarios
should
user
the
Once
load).
and
flow,
Again, as mentioned in Section 2.0 without calibration,
"relative"
predictions
(i.e. % change) are more reliable
than "absolute predictions(concentration,
has calibrated
the model using
data of suitable
the model
with
only
may be used
a known
be utilized
degree
for
of
to predict
certainty.
relative
-18-
absolute
Vithout
predictions.
changes
such
of various
calibration,
7.0 APPENDICES
Structure
Menu
APPENDIX
A
.
CGaa8D~.~1oaa
28
Devi0. . Ca8poD_t
21
0
0
0
80
0
2'
1
17
0
17
. 17
0
80
b7 Devic. . Co.poD8D~
0
'0
0
13
1
87
1
I'
1
I'
1
18
1
18
1
8'
18
1
80
Iaput Var1abl..
1
80
0
78
0
7'
0
78
78
78
1
28
701
ISI
1
za
0
78
0
ZS
I.t~rt
0
1
Deta
Inpu~
0
33
tabl..
El...~10D
va.
0
1
0
1
Data
0
1
Ce..
0
Z4
Ou~put
and
Group8
De~e
Iaput
All
Seve
1
Fl1.
Diu
a
1n
Group.
Input
'ar~icl./Coapoa8ft~
S.v.
Z2
Fl1..
0
2a
It!1c1eaCT
Devlc.
CO8pOftent
Curr8D~
Velu..
Iapu~
Ca..
All
Ere..
P.rt1cl..
Sev.
S.v.
0
Z2
Fl1.
D1.t
e
la
Groupa
Da~e
0
11
Fil.
Dete
Input
0
10
Fl1.
Diu
!ra8
Groups
Da~e
Input
Par~lcl./CO8pOD8D~
. D1.t Fil.
0
2a
I.t~rt
R8809al
OD.
for
S1z. D8Ylc..
11
Var1abl..
D8Y1c.
Dev1c.
011.
tara.t
Ou~flow
Iapu~
for
Velil"
Inpat
L1.~
Z.ro
Fl1.
De~e
Input
R..d
Groups
Dete
Input
S1te
All
Ed1t
All
1
18
Lt81t
Error
Con~inu1ty
6
Lenaths
St.p
T18.
Edlt
T~t.p.
F.ctors
1
37
V.rlabl..
Input
Ent1r.
for
I.~~rk
D8Yia.
6
Wa~r.b8d
L1s~
L1a~
17
10)
-
8
(CO8pOD.n~s
17
S)
-
1
(Coapoa8CtS
Group
S.cand
Group
Flrs~
Ed1t
First
Edit
S.cond
17
Cr1t.r1e
6
CO8pOD8D~'
Que11ty
We~.r
Edit
CO8pOD8Dt.
Curve
W.t.r.bed
Oeta (Ar.e, tmperv. Fr8c.,
Nu.b.r, etc.)
Edit Per~1cl. Deta (RUDot! Conc., S.tt11n. V.loc., etc.)
1
21
Inpa~a
D..1a.
.
Wat.rshed
for
6
Device
I
Wa~.r8bed
L1.~
Sit.
88
1
1
0
1
1
8
4
1
0
7
D8Y1c..)
Outflow
6
Lab.L.
(W.t.r8hed
Indez
Wet.rabed
0
40
D.ta
or
Indez
W.~er8b.d
Edit
Ed1t
Indez
Wa~.rahed.
0
10
etc.)
Slop..,
Rat..,
Infiltr.tion
(Di88n.1ona,
Da~a
Dev1ce
Edit
Data
0
8
Typ..)
.
Lab.ls
(D..1c.
Indez
Dev1c.
Ed1t
Ind.z
0
70
Data
or
Ind.z
Dev1ce
Ed1t
Dev1ce.
, Storm Date.
1
21
Par...t.rs
Input
D8Y10.
OD
Qu.l1ty
Horpba8.~rr
D8Ylc.
L1s~
H.t~rk
0
110
Veriablee
C.ee
Edit
Edit
Define C.ee
1
21
D8Y1c.
F~
Pred1oted
6
Variabl..
Iapat
W.t.r.bed
OD
for D.!1aed Weter.hedC.)
..
Ca8paD-t
.
Flr.t)
Ob.8ZYed
Part1cl.
on
'rSS 1-..1
C~-~
6
Sto~
All
OD
We~.r.hed/D8Yic.
We~.r
6
Par~1cl.
Ll.~
lee
Tab
~_'-=-D~
~-~
21
Flow-W.iah~ed-H88D Coac8D~r.~ion.
D8Yic.
S~s~.ly
Stoaa
Hod.l
OD
e D8Y1c. to Acb1eve tSS R-.el
De.11D.
Curr8ft~
or
Hod.l
for
Hod.l
RUD
RIID
Psr...t.r.
Edit
Sp1l1w.,)
+
Devia.
b7
AU
Ach18Y.
to
Prelia1nazy
R.tr18Y.
. D8Y1c. to Achl...
R.tr1...
H
T.a8
Coao-~.~1oaa
b7
t.~
I8Oh
Ca8p8r'
Etf1cl8DCT
D8Yic.Cs)
a..cal.
Retr1...
b7
T.aa
Coa.ea~.~1oaa
CIDf11t.+Ko2881+Spi~)
(I)
IuD
OD Hod.l
V.1oclt1..
Coao8D~.~1oaa
Clo2881
Ou~f~
fu
Etf1c18DCT
R8809al
Tar..t
Hod.l
Sto~ Fil.
I.l8Dc.
Coa.8D~.~1oaa
Conc8ft~r.~iOD.
Og~flow
Ogtflow
t.aa
fo~
Anal,.1.
a88DY81
Tar..t
011.
Looku~
701
851
H
8Dd
Iaflow
for Surf.o.
Devic.
Hae.-lel8DC.
Zveat-H8aa
Totel
Outf~
AnaLysis
Sea.1t1Y1ty
RIID
All
TUD.
Grovpa tra8
An?
Li.~
b7
To~e1
Iaf~
Anal,.1s
S8D81t1v1ty
RIID
S8D81t1Y1ty
Edit Ev.potranspir.tion
ConO8D~r.~1OD.
Aay
Vl01et10D Freqqeaoi..
fo~
Wet.r 6 Mae. lelaac..
Cor
AnalY.i.
Sea.1t1yity
RIID
Wat.rshed.
Data Fl1e I..e.,
Ou~tlow
Og~f~,
for
-
Anal,.1.
Sen.1t1v1ty
Rua
D.vic..
I 51.. D..lc..
Ra~..
Cor
CHu8t
Anal,.i.
Sena1t1vity
RIID
loth
Iaput
InClow
l.laDc..
Ca11b~a~1OD
Senalt1y1ty
RIID
Part1cl..
Dete
To~el
l8l8Da.s
Output
Flow
Rua
All
Input
M88.-1.18D..
ZU1c18Do1..
Hae.
MOd.l
L1s~
Cel1bra~.
S.lect
.
F~
Mae.
.
Wet.~
.
Wet.~
All
Seve ell
total
D8Yi..
a-.l
Li.~
18Gh
Input.
All
Suzfec.
D8Y1c.
Li.t/Plot
R~
R.ed
to~
D8Wto.
Lis~/Plot
t.r88
R.ed
P.n1cl.s
Ma..-lel8Do.
Aay
Li.tJPlot
0g~tlG8
All
E1..a~iOD.,
Freqq8Coi..
LiatJP1o&
Suzfs..
De.1aD
Freqq_oi..
L1a~/Plot
IDtla8
Arcb1v.
Freqq8Dci.e
V101e~1OD
Aay
Reed
Frequ_ci..
V101.t1OD
Vlolat1oaa
Ev.potran8
H8ZyP~
Vlo1a~iOD
Ogt~
Edit Tltle,
AccU8Ula~iOD
Sedu..a~
Vlola~1oa
IDflow
Oete
F~iah~ed-H8aa
Li.~
Aay
Particl..
F~iah~ed-H8aa
H.aa.
Lie~
P.8k8
Suztec.
Ll.~
Sedia
lalaao..
Ll.~
Iaflow
First
Ou~flow
Conc.
r1a.-W.1.h~ed-H88D
Ll.~
OU~Clow
RUD
C.ae
toc
SurCn.
r~iahr.ed-H88D
1.1.&
SuzC...
An?
L1.~
APPERDI%j.
P8 Menu Structure
moP tmZ
110
0
5
0
18
10
0
0
10
0
Z2
1
180
0
77
0
0
0
1
0
1
1
~
P8 URBAN CATCHMENTMODEL
DATA ENTRY VORl:.sBBBT
note:
notes,
(labels,
inputs
defined
user
are
"*"
an
with
Data
inputs
1)
denoted
Notes:
filenames)
Storm
Data
Notes
(User
about
prov
tables
detailed
more
Dotes)
reference
user
case):
*
-
6.splitter
basin
3.svale/buffer
7-aquifer
TYPES
-
-
-
-
-
-
-
LABEL.
NO.
IT
18
-
-
8
7
16
-
3
4
5
6
-
19
~$
1
2
-
12
13
14
1.5
pond 2.infiltration
-TYPES
-
11
for si8Ulation)
de~ices
20
LABEL.
10
treat8eDt
21
of
22
NO.
9
list
23
nmll
DEVICE
(define
LABEL.
1.detention
S.pipe/manhole
unless
values
default
na8eS,
(1)
Schematic Diagram:
EDIT
CASE
NO.
(Filename.stm):
reference
from
*
*
(Filename.cas):
File
selected
available.
(Label):
Case Data File
Site
file
(title,
Title
is
sources
(I) are
24
Case
FIRST
information
EDIT
denoted by
site-specific
CASE
5) Data inputs
Use
the model help screens or from other available
Data inputs
denoted by a number in parentheses
available
computer disk files.
up
look
from
taken
be
should
"@"
from
"+"
4)
denoted with a "$" should be available
drainage plan
sequence, watershed and device characteristics)
provided
denoted
inputs
(hydrologic
3) Data
with
2) Data inputs
4-general
on
~
DATA PJI'l'RT
CASB EDIT DEVICE DATA - PIPE/MANHOLE
Device
Label:
Device
Device Number:
Label:
to
S If Surface Elev. <
to alternative
(hrs;
outflow
Concentration
of
SPLIn~
* *
Device:
Otherwise,
Time
$
default.
Outflow
-
+
default.O):
FLOV
Number:
DEVICE
EDIT
Device
CASB
Outflow
(hrs;
Concentration
-
of
DATA
Time
-. .
Feet
device:
+
Number:
0):
Device
CASB EDIT DEVICE DATA - AQUIFD
Device
Number:
Device
Label:
-
*
*
.
Outflow
Time
Device
of
Number:
Concentration
To direct
floyout
listed
in device
-$
(hrs;
of system
index.
defaul
t . 0):
set device
number
+
to
"0"
or to other
device
number
-Defines
similar
Device
elevation,
input
is
area,
required
No. (specified
DEVICB
dischar,e
table
for hydrololic
for device vith
up to
models (i.e.,
TR-20)
in device index):
in device
three
outlets;
*
index):
.*
NORMAL
Label (specified
G:BNERALIZID
-
DATA
DBVICB
EDIT
CASI
P8 URBAN CATCHMENT MODBL
DATA mrrRY VORl:.sHEET
SPILLVAY
OUTLET
INFILTI.
OlrrFLOV DEVICE NUMBERS
OUTFLOV
feet$
cfs$
acres$
To direct
listed
RATES
ELEVATION AREA
floy
in
device
out
of
system
index.
set
device
number
to
"0" or to other device number
~
Program
the
development
residential
for
".
~
3) Lookup an extended wetpond design for a given watershed
model
and
command
entry
data
MENU
design
include:
BMP
proposed
1) Running a sample case (one device-one vatershed)
Evaluate
model
new
sequence is provided
CASE
2)
typical
entering
of
E
Appendix
in
is
provided
scenario and
case
A
cases,
The
CASE
scenarios
illustrating
output.
CASE
example
examples
for running sample
screens,
demonstration
1990).
followed
(Valker,
example,
each
Documentation
for
several
General instructions
designing Site BHPs
the
and
cases,
provides
screen,
appendix
applications.
by
This
CASB
SAKPLB
A
RUNNING
1:
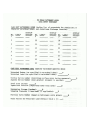
CASB
Scenario:
example
This
using
illustrates
the
the BUFFER.CAS sample
basic
model functions
case file
provided
on
(CASE, RUN,
the distribution
LIST)
diskette.
.
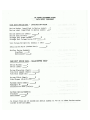
4) List
.
**
This
**
any
press
directly.
to select
path
and
arrows
loaded;
is
filename
file
when
to
appear
<ESC>
will
(use cursor
enter
CRA
Press
for
help.
MENU
MENU
to
main
to
return
back
will
go
to
program
escape
<H>;
press
screens;
at
CLS
screen
-
all
through
key
<F1>
Site'
case files
point.
.
3) Execute model:
Select
'Run Hodel'
the
<B>
or
data:
'Case List
passing
any
after
at
or
next
input
any
the
of disk
prompt
return)
continue
. Select
Press
View
.
2)
to
listin,
to
key
for
Screen
press
Bold
The
.
file,
. Press return
All'-
File:
view
Case
Read
.
'Case
Load
Select
1)
screen
Press
percent
Select
while
any key at
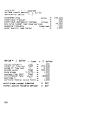
- RH (VAIT
model
- will
flash
in the upper right
is running)
<B> to return
to MENU
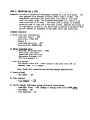
pollutant
removal:
'List
Removals'
- LR
procedure
may be used to read any case file
from the disk
corner of
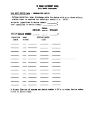
~
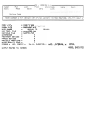
CASE'
STORM
DATE
-
I
.
.
I FILE
.
RANGE
AIR TEMP. FILE
FILE
WATERSHEDS
TREATMENT
TRACED
DEVICES
DEVICES
PARTICLE
FRACTIONS
QUALITY
COMP
.
.
.
.
.
-
Parameters
BUFFER.CAS
buffer-
.t.r-ip
pr-cv87.st.m
870201
TO
870601
pr-cv69B8.t.mp
NURP~O.PAR
1
1
0
5
7
OUTPUT ROUTED TO: SCREEN
.
I
HELP
<Fl,F7>
ROUTINE,
RUN
Dat~
TO
<First
Quit
Helo
Utilities
Ar.as
Incut
OR
<Enter>
=
FILE
TITLE
PARTICLE
& Device
HIT
&
CURSOR
MOVE
CASE
List
Tables
W.t.rshed
1.1
Letter>
Network
List
~TER
Plot
List
Run
Sit.
VERSION
Zero
Save
Read
Edit
Case
8 -
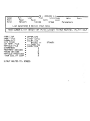
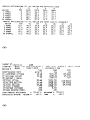
watershed.
surfac.
1
runoff
oercolAtion
device
d.vice
watershd
= 1 buff.r
= 0
w.tershed .rea
imcervicus
impervious
scs
curve
depression
stora;a
numb.r
(pervious
portion)
sweepin;
frequency
water
load
devic..
1
bottom
el.v.tion
length
of
of
bottom
side
inch.s
=
fActor
flow
flow
'feet
'feet
p.th
"I.
mannings
particl8
depth
rate
n
r.moval
-
'feet
.
-
in/hr'
scale
-
=
'f..t
'ft-h/ft-v
flow
=
type
path
slop.
infiltrAtion
-
butter,
width
maximum
factor
.~filtr.t.e
rout.d
to d.vic.
normAl outlet
rout.d
to devic.
<H)
-
times/week
Quality
slope
acres
frAction
.
-
3
buffer
.000
294.248
2.000
500.000
1.000
.100
.500000
.400
1.000
0
0
OUT
OUT
100.000
.2~0
.020
74.000
.000
1.000
S
68.7
86.5
95.3
~9.4
84.5
hc
zn
component
67.3
84.5
84.~
67.3
07.3
67.3
cu.lity
84.5
68.7
70.9
70.9
water
pb
and
tp
(%)
device
99.4
P80%
95.3
P50"/.
tss
89.9
89.9
OVERALL
25
1 buffer
cl.ss
4
P30%
vs.
49.4
25
OVERALL
efficiencies
.oarticl.
PI0"/.
49.4
devic.
remov.l
and
3
86.5
PO"/.
1 buffer
device
tkn
jevice
vs.
2
07.3
("/.)
1
cu
effici.ncies
67.3
remov.l
<H>
<SPACE>
TO SELECT(*)
NO( ) ,
<ENTER>=DONE,
<a>=
ALL,
PRESS
OR
SELECT PARTICLE CLASSES / WQ COMPONENTS
(n)-NONE
of
devic.
=
=
storms
.
2864.
hrs.
1 buffer,
storm
31
=
duration
type
= buffer
319.
v.riabl.
ppm
norm.l
07
spillway
outlet
outlet
lOAd
continuity
<H>
total
surf.c.
+ d.c.y
inflQw
08 sedimen
outflow'
outflow
groundw
outflow
tot.l
trApped
total
increas.
stor.g.
m.ss b.l.nc.
check
efficiency
removal
.
errors:
=
volume
=
7746.24
762.66
.00
762.66
522.99
261..79
6197.47
38.71
17.60
20.87
38.47
.00
.00
.24
7746.24
784.78
.00
784.78
6960.12
1.33
.00
73.b21~
13.4440
.0000
.0000
13.8987
.0000
06
09
10
11
12
13
14
15
14.72
2~.b404
O~ filt.red
38.71
20.87
20.87
.00
13.84
3.76
.00
.62
%.
89.85
load
=
89.85
.00
73.021~
10.4046
.0000
7.~0~0
%
infiltrate
-
inflows
adjusted
watershed
04e)(filtr.te
03
=
lbs
%.
01
precip
tss
conc
acre-ft
term
=
load
flow
mass-b.lance
hrs,
~
~umb.rinter-v.l
%
inc h.\.
specifications
for
wet
treat
the
lake.
design
recreational
a
to
preliminary
adjacent
to
and
plan
proposed
pond
site
a
with
is
!VALUATION
development
provided
been
residential
have
A
You
Scenario:
CASB 2: SITE PLAN/BKP
stormwater
runoff
leaving
the
a
with
to
designed
pond
site.
Approximately
235 acres of the parcel
drain
to the lake via 4
existing
drainage
swales.
The dominant hydrologic
soil
group on the
site
is Class B with grass cover in fair
condition.
The 235 acre
parcel
has been divided
into four subcatchaent
areas,
each with a wet
the mean storm of 0.4
by the site
engineer:
capacity
equal
inches.
to
the
volume
The following
of
table
runoff
from
has been provided
BASDf
raperv.
Volu.
Area (.c)
Area (.c)
(ac-ft)
~
Subc.tchaent.
Area
Drainage
(TS5)
0.32
0.40
0.31
will
each
Total
for
for
pond sizinr
criteria
85%
the
if
Solids
0.23
the preliminary
deter8ine
to evaluate
to
subcatchment
You would like
Suspended
0.46
0.64
1.41
1.10
10.3
14.3
22.5
17.8
removal
32.7
54.8
71.0
76.8
1
2
3
4
be met.
Sequence:
1)
Compile
.
case
Draw
data:
Schematic
. Complete
2)
Create
new
diagram
data
of
entry
case
file:
.
'Case
Edit
All'
.
'Case
Read
Particles'
-
the
system
worksheets
as necessary
CEA (enter
data
- CRP
for
(read
all
data
desired
entry
particle
screens)
characteristic
file)
first
entry
file
disk
to
data
input
(saves
specified in
screen)
RH
necessary
to
be
used
for
the
this
operation).
proponent
or
Type
device)
to
redesign
or
The 'Run
initial
tarlet.
an
to
used
removal
(The
subcatchment
confiruration
request
be
may
P8
of
85% TSS removal
each
provide
met;
for
outlet
not
to achieve
and
function
aeet
removal
the
criteria
systems
pond
to
-
treatment
Tune'
re-scaling
Design
of
percent
volume
85% TSS Removal
resizing
should
LR (lists
ROT
Note:
-
Removal'
the
'List
area
'Run
Model:
5) View Results:
.
CSI
-
data
Hodel'
.
4) Execute
Inp'ut'
Save
.
'Case
3) Save input data:
2 or
Averale
storm
file
FILE.
EVALUATION
BMP
4
4
0
S
PRECIP.
OUTPUT ROUTED TO:
SCREEN
7
=
=
.
COMP
QUALITY
WATER
TREATMENT DEVICES
TRACED DEVICES.
PARTICLE FRACTIONS.
10Q,
801231
NURP5Q.PAR
WATERSHEDS
STORMS.
TO
prov6Q88.tmp
=
800101
FILE
TEMP.
RANGE.
PARTICLE
2
CASE
PROV6Q87.STM
FILE.
STORM
DATE
AIR
CASE_2.CAS
TITLE.
FILE.
CASE
CASE
36.11.
DURATION.
602.,
INTERVAL
8704.
MODEL EXECUTED
DATA
WATERSHED
LABEL
runoff
32.7
0
surface
.31
l/week
0
69
-
NUMBER
for
.02
inches
-
acres
NUMBER
FREQUENCY
CURVE
PERVIOUS
SWEEPING
STORAGE
FRACTION
AREA
DEPRESSION
IMPERVIOUS
TOTAL
1 (--
NUMBER,
DEVICE
DEVICE
AQUIFER
OUTFLOW
!
BASIN!
percol.tion
WATERSHED
for
NUMBER
(--
WATERSHED
SCALE FACTOR FOR POLLUTANT LOADS 1
w.tershed
Fl=HELP,
F2=DONE/SAVE,
device
Fl-HELP.
l.bel
F3-EDIT
FIELD,
F7-HELP/EDITOR,
<ESC>-ABORT
1.bRl
F2-DDNE/SAVE.
F3-EDIT
FIELD,
F7=HELP/EDITDR,
<ESC>-ABORT
~
94.1
6~.6
33.7
63.7
64.7
35.6
63.7
34.6
65.6
33.7
64.7
3~.6
33.7
34.6
3~.6
39.2
34.6
41.3
70.6
40.2
33.q
65.3
64.4
34.8
33.9
65.3
h~
zn
cb
comoonent
64.4
73.5
56.9
34.8
33.9
34.8
39.4
cu.lity
cu
water
tkn
.nd
72.4
71.6
71.2
40.4
P80%
9~.1
94.7
94.2
93.1
3 POND3
OVERALL
POND2
72.1
cl.ss
4 POND4
25
2
1 PONDl
o.rticle
P50%
75.0
73.7
74.2
71.6
d.vi~.
tc
(%) Y5.
tss
.fficiencies
device
r.movAl
and
P30%
5=.4
~5.1
58.9
56.3
39.3
P10%
39.0
38.0
40.7
38.7
.0
PO%
.0
.0
.0
.0
OVERA~~
25
d.vic.
1 POND1
2 POND2
3 POND3
4 POND4
d.vice
4
VS.
3
(%)
2
.f1ici.nci.s
1
r.mov.l
(H>
typ..
variabl..
scillwAY
sedimen
OC1
10
12
13
14
l'
totAl
outlet
+
decAY
07
08
outflow
tot.loutflow
tat.l
tr.pped
stor.q.
mASS
load
r.moval
continuity.rrors:
<H>
increAS.
b.1Anc.
ch.ck
-
efficiency
volume.
72.10
.00
%.
ppm
Qbql.S4
26QB.00
bQBB.07
33.68
33.68
33.68
.00
.00
.00
inflow
surf.c.
lbs
33.bB
3J.bB
.00
inflows
%,
01 watershed
105.8b04
2Q.4702
.0000
lO~.8604
2C7.4702
2C7.4702
q6ql.~4
26qS.OO
26Qa.00
6Qaa.07
5.45
.00
adjust.d.
lo.d
72.10
.
.00
%
%
inches
3b.ll
tss
acr.-ft
term
m.ss-balance
orecic.
hr..
b02.
=
pond,
conc
.
loAd
1 PONDl
storm
hrs.
8704.
flow
devic. -
109
.
duration
of
intervAl
storms
number
development
planned
on a 100 acre
Enter
case
Storm
File:
- CRP
watershed
data:
Edit
Yatershed
Data'
- CEVD
Total Area: 100 acres
Impervious
Fraction:
0.25
Depression
Storage:
0.02
SCS
Curve
3)
Look
Number:
74
up a design:
'Run Design
drawdovn
Note:
4) Execute
Lookup
time,
Hodel
3.5
will
85%' - RDL8 (select
ft
a dry
pond with
a 48 hour
depth).
overwrite
any
existing
design
specification
Hodel
. 'Run Hodel'
- RH
5) Vie... results:
efficiency
using continuous
.
to
storm
series:
PROV80
removal
'Case
Edit
First'
- CEF (Change
. 'Run Hodel'
- RK
'List
Removals'
- LR
.
file:
Verify
'-1.1
storm
6)
Removal
design
. 'List
.5TM)
is
85%
of
minimum
a
case
achieve
to
worst
like
under
would
you
TYPE2.STM
Read Particle'
'Case
solids
A),
- CEF
5
Particle
. 'Case
suspended
(Class
information:
First'
File:
Passes:
2) Enter
of
quality
file
'Case Edit
.
NURP90.PAR
1)
The
hydrologic
soil
group
falls
into
Class
C, with
good
grass
cover.
The proposed
development
viII
result
in an
area of 25 acres.
You vould
like
to design
an extended
pond to treat
the storm
vater
runoff.
Because
the stream
removal
high
percent
of
predominant
condition
impervious
detention
parcel.
The
You have a residential
downgradient si~e boundary follovs a small Class A
stream.
Scenario:
conditions.
CASB
3: DBSIGN
BKPPORA SITE
= CASE_3.CAS
FILE
TITLE
=
CASE
CASE
STORM FIL.E
=
CASE 3: DESIGN A BMP
type2.stm
RANGE
.
AIR TEMP. FILE
=
prov6988.tmp
.
NURP90.PAR
DATE
PARTICLE
FILE
WATERSHEDS
TREATMENT
TRACED
DEVICES
DEVICES
PARTICLE
WATER
FRACTIONS
QUALITY
COMP
0
TO
.
.
=
1
1
0
.
=
,
. 1
0
..~-
OUTPUT ROUTED TO: SCREEN
-..
watershed
Fl=HELP,
F2=DONE/SAVE.
label
F3=EDIT FIELD,
F7=HELP/EDITOR.
<ESC>=ABORT
~
<ESC>
FILE
CASE_3.CAS
DATES:
PRECIP.
KEEP
DEVICES
PROVo987.STM
1/
STORM
PASS.
KEEP
-
SIMULATION
CASE 3: DESIGN A BMP
801231
800101
.45
-
109
11
DURATION
=
1
w."..ninc;: devic.
DS
WATERSHE
STORM.
CASE
STORMFILE.
TO STOP
1
PRESS
CASE TITLE.
ov.rflow:
-
1
1
t
DATE.
INTERVAL..
801229
75
1 dry pond, storm.
16
<H>
class
S
pArticl.
4
compon.n t
45.9
76.8
zn
QuAlity
4~.9
and wAt.r
P80"l.
99.4
99.4
pb
P50%
95.3
95.3
76.8
~3.3
.~3.3
85.0
tp
devic.
and
cu
84.1
84.1
(%) vs.
8~.0
pond
dry
OVERALL
1
2~
46.8
46.8
t..
.ffici.nci.s
d.vicR
r.movAl
device
3
P30"/.
.0
.0
dry
POi.
pond
OVERALL
2~
1
devic.
V5.
:2
P1C"/.
1
45.9
("/.)
efficienciRs
45.9
r.mov.l
MINUTES/DEVICE/YEAR
~.212
tkn
<H>
4~.9
calculat.in;
3.229 MINUTES.
=
tot.l.
ov.~ .11 sto~ms...
45.9
-
TIME
RUN
..
nc
76.8
76.8
~
Ez.-pl..
Simple
-
Fil..
c...
84
D.~
Help
Screen Index (ct.)
c... D.t. Fil.. - 1.8&1
a,
8S
tt)d.lina
- Buff.rISw.l.
Conat.ruct.1onS1t...
Haz1muDFlow D.pt.b
87
Fil. M~DI COIIV8Dt.1on.
88
89
70
71
72
73
74
a.CeDt.
P:oar-
Enbmc_t.a
'Cu. Edit. D8Y1c..'
'Plot. Ev8Dt.a'
'Plot. Ev8Dt.. c-lat.1v..'
'Plot.
Ev8Dt..
Fr8q\aeDCY'
Ev8Dt.a Loa1fo_l'
7'
'Plot
Ev8Dt.. Scat.t..r'
78
77
78
78
81
82
83
84
'Utilit1..
~'
Tim.'
D..1an
'~
,~
D..ian
!lab."
Star...
-
Seaait.1Vit.y'
TUD.
'11m
D..ian
11m
Depr...ion
H
II
H8IIDiDI'.
Error
I=oU
Curve
'Li.t ,.at.'
Infiltrat.ion
l.at...
Particl. S.tt.lina V.loc1t.1..
Particl. C'8paait1on
8'
'U.t. T_'
W88boff
'ar...~.r.
PerVi~
-
I=off
Wa~ar
Particle
Fr.ct.1OD&
QIIal1~y
Cr1t..r1a
De~eDt.1OD
PODd
S.al./luffer
Out.l.~
e,draulic.
e,dr.ulic.
Particle
ScOU%iDI
V.locit.1..
Wat..~ahed ~rVioua
Fract.1ona
'Cu. Edit. Evapot.r8D8'
P8
WAT!RSB!DS
DEVICES
PAJ.TICL! CLASSES
WAtD. QUALITYcat!ORDfS
DEVICES
~~
DAtA
m!PmATUI!
GDDAL
-
LDa'W'I~
LDa'W'I~
fm!L
fl]DEL
-
AIR.
LDa~
..
tIJDIL
~IPI'W'I~
~
OOTPUT
~
oumJr
TABULAR
~C
113
APPLICAtI~
-
DC
%
T!S
~
123
180
'Plot. ~t.hl,.'
Mag o,.rat.18
or 'Plot.
Yearl,.'
181 Sere. !d1t.o~Ccmt.ralx.,..
W~
w~
Choice
OIoic.
Siql.
.-alt.1pi.
Qrapbio8
Hode
Fil.
Def1De
~
18&
18S
<B> MMa...
Vi-
184
183
182
Plot.a
18&
1&7 U8e~Hod.
189
193
P:1Dt.iq
P:o.~-..in&
Gr8pba
D.t.aila
1;4
19S
Di~.ctin&
Help
P:oar..
Output
19& P~oar" MeCn-iC8
De8i8D
~
for
c.~~at.e'
'~
Pnoedure
a.c~8d
Cue Li8t. Ar...
P8-PLUS
Sit..
117
ua
tIJDIL
11.5
TYPICAl.
114
~~
DISTR.IJU'rI~ .. SVPPf3;%
:
M)
Predict.iona")
Pred1c~i0D8
Ab.olut.e
C-I,.lat.1"
C"
PRam.AH
rRaiIWt
OF
OF
USES
USES
S!CCIIDARf
P!.IHAR.Y
IlftRCDUC'TIOM
121
118
118
120
PiCI-P8CI
CoDceD~ra~iOD&
lU
86
87
88
88
80
91
82
83
84
8'
86
87
88
100
101
102
103
104
10'
loa
107
108
108
110
111
lat.ch'
D..ian'
'~
, Plot