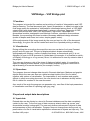
1
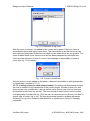
Bridge plot User’s Manual
11/28/2014Page 1 of 49
VSPBridge – VSP Bridge plot
1 Function
The program is intended for creation and a printing of results of interpretation and VSP
data processing. The final document (plot, report, presentation, or tablet) includes in the
final image some the materials of interpretation coordinated among them: a VSP NMO
seismic field (with double times hodograph), a primary reflections, fragments of CMP
section (before and after CMP-VSP convolution), log curves, calculated onedimensional models, stratigraphic and lithologic columns, correlation lines-markers.
Besides, the accounting document contains necessary additional design elements
(scales of depths and times, text notes, simple graphic notes).
All the adjustments of the image made by the user are kept in a file of the document.
Accordingly, the given file can be loaded and used for a repeated printing or editing.
1.1 Visualization
During editing the accounting document the user can use data of only one Geoeast
project and only one well. The part of displayed data is drawn automatically
(stratigraphy and lithology, scales of depths and times, a dimensional grid). It is not
obligatory to user to fill all elements of a tablet data (for example, it is possible to switchoff display of lithology or of log curves). More, it is authorized to use any seismic data of
the project.
The user can change a ratio of the sizes of displayed tablet’s parts, it is possible to
switch-off display of some details, to put necessary explaining graphic notes and to
adjust drawing of concrete elements (for example, curves).
1.2 Operations
The program does not change data stored in Geoeast data base. Markers and graphic
objects which the user can draw on a tablet are kept inside of the file of a tablet,
together with options of visualization. For importation of such markers and graphic
objects in other accounting document, the user should use in advance already written
file of a tablet for creation of the new document.
As a result of the work the program can generate only: own files of the kept parameters
of visualization and files of a printing (cgm, jpg, png).
2 Input and output data descriptions
2.1 Input data
Entered data can be divided on stored in Geoeast database and the data completely
certain by the user. To the first type of data concerns seismic data, log curves, onedimensional models, hodographs. The user only defines references to objects of data
and parameters of their visualization. Program does not change them during work; at
preservation of a file of visualization options the references to objects are kept only. The
GeoEast-VSP project
© GEOVERS Ltd., BGP R&D Center, 2005
Bridge plot User’s Manual
11/28/2014Page 2 of 49
second type of data includes formations markers and graphic primitives. They have no
relation to Geoeast databases and are stored directly in a file, their any change is there
and then fixed and at preservation in a file their current condition is remembered.
2.1.1 Files of visualization options (extension *.vspbridge).
This is an actually result of work of the program; they are created at preservation by the
user of current options of visualization. The given files comprise necessary adjustments
for display of a tablet; therefore they can be used some time for restoration of the
concrete report for a repeated printing or the subsequent editing. Files contain all
parameters of visualization of elements of a tablet, the references on given elements in
Geoeast database, graphic primitives, added by the user and their properties, etc. Files
of visualization options are stored in XML format.
2.1.2 Seismic data
It is defined by the user in work process. Data of seismic that can be displayed on a
tablet are stored in Geoeast database. Display of three types of seismic files is
probable:
- VSP NMO seismic field. As coordinate, word H_GRPDEPTH from heading of a
seismic file is used, or the vertical depth of the receiver (counted as H_WELL_ELEV H_RECEIVER_ELEV) is used.
- Primary reflections (one seismic trace repeats the set amount of times). As coordinate,
field H_CMP_TRACE from heading is used.
- Fragment of CMP section (before and after convolution). As coordinate field
H_CMP_TRACE from heading is used.
2.1.3 Hodographs
The program can display hodograph on a NMO seismic field. It is defined by the user
indirectly, hodograph’s data automatically undertake from a file of the NMO seismic field
which is stored in Geoeast database. Field H_VSP_FIRST_PSCK from heading of lines
is used. Hodograph is drawn (with dark blue color) atop of a wave field, and is loaded
automatically right after loading of a seismic file. If hodograph’s data is absent, it is not
drawn.
2.1.4 Log curves
The program allows drawing log curves from Geoeast database. References on given
curves are determined by the user. Because one well is used only, it must be defined at
addition on a tablet of the first curve. To replace a well, it is necessary to remove from a
tablet all used curves, and then it is possible to choose a new well.
2.1.5 1D velocity models
The program allows drawing one-dimensional models in the form of curves. Data of 1d
velocity models are stored in Geoeast database, all references on given are defined by
the user online. Models is drawn on the tablet similarly like log curve, but the source of
data is not restricted by a concrete well; instead of this the binding to surveys is used.
2.1.6 Stratigraphy
The data are stored in base Geoeast, the reference on given is determined by the user
indirectly. The stratigraphy is draw automatically; the binding to that well which has
GeoEast-VSP project
© GEOVERS Ltd., BGP R&D Center, 2005
Bridge plot User’s Manual
11/28/2014Page 3 of 49
been certain at a conclusion of log curves is used. If log curves are not present, the user
can specify any well.
2.1.7 Lithology
The data (defined by the user indirectly) are automatically imported from Geoeast
database at connection of a well (that is at a conclusion even by one log curve). If log
curves on a tablet are not present, the user can use any well.
2.1.8 Graphic primitives and text inserts.
These data are entered by the user online and stored directly in a file of data of a tablet.
On working space of a tablet there are some areas which can contain the text
information entered by the user, they are used both for storage of the service
information, and for necessary explanatory to the document ready for printing. Other
part of regions of working space can store drawn by the user graphic objects: text
inserts, polylines, ranges, circles, points-markers, etc.
2.1.9 Markers (formation bindings)
Data are determined by the user online and stored in a file of a tablet. Recalculation of a
mark of depths of a marker in a mark of time is made using data of hodograph from the
main MNO seismic field. If hodograph is not present (or it has been lost at change of a
wave field with a tablet) recalculation in marks of times are not made. The user himself
sets names of markers and their parameters of visualization.
2.2 Output data
2.2.1 Files of the kept adjustments of visualization (extension *.vspbridge).
The given files comprise necessary adjustments for display of one report drawing: all
visualization parameters of tablet elements, the references on Geoeast database
objects, graphic primitives, added by the user, and all their properties, i.e. given
palettes, thickness of lines, etc. Files of visualization options are stored in XML format.
2.2.2 Files of the kept display options of the program’s main window
(extension vspbridge.rc).
This service file is used for preservation of last user’s adjustments. It comprises
parameters of display of the main program’s window and last used context of work with
Geoeast database. The file is stored in XML format and used automatically. It is
intended for convenience of work with the program. In case of removal this file is
created anew. The file is stored in a home directory of the user, in the catalogue
$HOME/.qt/vspbridge.rc.
2.2.3. Files of a printing (extension *.cgm, *.png, *.jpg).
During the work the program is capable to generate graphic files which the user then
can print. These are final images of a tablet in a format *.cgm or *.jpg and *.png.
GeoEast-VSP project
© GEOVERS Ltd., BGP R&D Center, 2005
Bridge plot User’s Manual
11/28/2014Page 4 of 49
3 Windows descriptions
3.1 Main window
Fig. 1.1. The main working window of the program
The main working window of the program (see fig. 1.1) contains the menu, a status line,
panels of tools and area for drawing which is divided into some working areas.
3.2 Working areas
Working areas of a tablet are intended for storage of various data. Ones of them
contains seismic data, others contains log curves and one-dimensional models. In some
areas the service information (scales of depths/times, texts of explanatory, stratigraphy
column, etc) will be stirred. The part of working areas can contain not only data from
bases, but also user graphic primitives.
Display of working areas is made in view of the options, defined by user in the menu
“Layout-> Setup Layouts” (see fig. 1.2). The part of data can not be displayed on a
tablet (and accordingly to not be printed at a conclusion of figure on plotter device), but
thus to be kept in the file of the description of visualization options. I.e. the user can
remove/add the necessary parts of a tablet for display.
GeoEast-VSP project
© GEOVERS Ltd., BGP R&D Center, 2005
Bridge plot User’s Manual
11/28/2014Page 5 of 49
Fig. 1.2. Adjustments of visible working areas
The areas marked by ticks on dialogue “Layouts Composition” will be drawn on a tablet
and are accessible to editing from the menu.
The program menu is context-dependent for various working areas. Definition of current
accessible functions is made in view of current working area.
3.2.1. Active areas.
Two conditions differ, in a cat there can be such area: active and inactive. The active
area is allocated with a red framework, inactive – with gray (see fig. 1.3). When
document is printing, the frameworks are not drawn.
Fig. 1.3. Active area
is illuminated by a red framework
To make area “active”, user can just click mouse in its limits. During each moment of
time there only one area can be active. Depending on active area, the condition of some
menu items is checked. The part of items can be inaccessible for selected area.
GeoEast-VSP project
© GEOVERS Ltd., BGP R&D Center, 2005
Bridge plot User’s Manual
11/28/2014Page 6 of 49
Some menu items are accessible always. For example, all buttons of drawing graphic
primitives. It is important to note, that switching of current active area at active function
of drawing occurs automatically. If area allows input of graphic primitives (the cursor
above such area becomes cross-like), the user can begin drawing in the given area at
any moment, and this area will be made active at once.
3.2.2. Splitters.
On the purpose, working areas are separated in the groups divided by special narrow
interactive and movable areas: splitters (see fig. 1.4). Splitters allow changing
proportions of groups. The position of the tablet splitters is kept together with other
parameters in a file of visualization options.
Fig. 1.4. Splitters areas
To change splitter position, the user should move the mouse cursor on splitter area (the
cursor will change the icon), then to click the left button of the mouse and (not releasing
mouse button) to transfer splitter to new position. If interactivity of splitters did not
comfortable for working, their display can be switched-off in the menu “Layout-> Show
Splitters”.
When printing, a relative arrangement of working areas and their proportions will be
precisely same, as at work with a tablet. The splitters are not drawn at printed image.
GeoEast-VSP project
© GEOVERS Ltd., BGP R&D Center, 2005
Bridge plot User’s Manual
11/28/2014Page 7 of 49
3.2.3. Text areas.
The tablet can contain the text information: a name of number of a well, stamps,
heading, comments, the information on the author and so forth. For storage of such text
information the special areas (see fig. 1.5.a) are allocated.
Fig. 1.5.a. Text areas
To enter the text, it is necessary for user to double click inside text area or to choose
this area by one mouse click and then to activate menu “Layouts-> Edit Info Text”.
Feature of text areas is that they can contain nothing, except for the text. That is, in
these regions of a tablet it is forbidden for primitives drawing
After the user activates the chosen text area, it will be offered to fill the fields in the text
area properties dialog (see fig. 1.5.b).
GeoEast-VSP project
© GEOVERS Ltd., BGP R&D Center, 2005
Bridge plot User’s Manual
11/28/2014Page 8 of 49
Fig.1.5.b. Properties of text areas
Also the user can change parameters of the text: color, the size and a tracing of a font,
and also a way of alignment of the text inside of area. The text inside of area is drawn
by one font and the same color.
3.2.4. Areas of scales.
On a tablet there are two scales: depths and times (see fig. 1.6). They correspond to
depths and times of data displayed at the moment (i.e. to seismic data and log curves).
The user can set up both appearance of a scale, and a displayed range of data.
Fig. 1.6. Areas of scales
GeoEast-VSP project
© GEOVERS Ltd., BGP R&D Center, 2005
Bridge plot User’s Manual
11/28/2014Page 9 of 49
Adjustment of appearance of a scale is made after double a clicking by a mouse within
the limits of a scale (see fig. 1.6). In a dialogue window of scale option (see fig. 1.7) the
user can specify thickness and color of lines and notches of a scale, a font which marks
subscribe, and also amount of the basic and intermediate ticks on a scale.
Fig. 1.7. Adjustment of scale area
The amount of ticks on a scale defines quantity of grid lines. The basic notches, which
define a conclusion of inscriptions of readout and depths (and, accordingly, the basic
lines of a grid) can be certain both automatically, and manually. Intermediate ticks are
exposed manually (and can be absent at all if value of “Sub-ticks frequency” equal 0).
It is possible to set up a displayed part of data by another way: by using menu “Layout->
Setup Limits” (see fig. 1.8), or by editing properties of a displayed NMO seismic field (if
this field is already loaded using the menu ”Layout-> Seismic scales”).
Fig. 1.8. The common adjustment of scales
GeoEast-VSP project
© GEOVERS Ltd., BGP R&D Center, 2005
Bridge plot User’s Manual
11/28/2014Page 10 of 49
Dialogue of scale and grid settings allows adjusting a range of displayed data and a part
of drawing parameters for both scales, but contains smaller amount of adjusted graphic
parameters of visualization.
3.2.5. Scrollbars areas.
On a tablet two scrollbars (area of scrolling) correspond to two scales (depths and
times). They show, what part of real data is displayed currently (see fig. 1.9). Scrollbars
allow quickly change range of displayed data, but do not allow to scaling.
Fig. 1.9. Areas of scrolling
Areas of scrolling are displayed as a usual GUI-element. When printing they are absent.
Also scrollbars are not displayed, while on a tablet there are no data (at not loaded
seismic and absence of log curves).
Scrollbars are active always, and it imposes some features on their use. At drawing
graphic primitives, for example, scrollbar activation will lead to cleanup of data for
current entered primitive. User can use areas of scrolling when changing scales of the
image by zooming, but it is impossible when zooming by framework (zoom framework
will be cleaned each time that user click on scrollbars area).
3.2.6. Areas for seismic data.
Areas of seismic data display occupy all right part of a tablet (see fig. 1.10). All seismic
data on axis X as coordinate use time (in milliseconds). All of seismic fields are adhered
GeoEast-VSP project
© GEOVERS Ltd., BGP R&D Center, 2005
Bridge plot User’s Manual
11/28/2014Page 11 of 49
to one axis X; change of scale on X for one area will lead to immediate reduction of the
others conformity to new parameters. Bottom scrollbar of a tablet (see item 3.2.5) also
is adhered to this axis and allows to establish the necessary displacement on X for all
seismic fields simultaneously.
Fig. 1.10. Areas for user seismic data
For a conclusion of seismic fields on Y axis different words from headings are used.
Following areas from top to down settle down:
1. Fragment of CMP_VSP section before convolution. As Y-coordinate word
H_CMP_TRACE from heading is used.
2. Fragment of CMP_VSP section after convolution. As Y-coordinate word
H_CMP_TRACE from heading is used.
3. Primary reflections. The view of the prepared seismic file in which the seismic line
repeats the predefined amount of times (is used word H_CMP_ TRACE from heading)
is supposed.
4. VSP NMO seismic field (with double time hodograph). The user can choose what
word from heading of lines to use as Y-coordinate (see fig. 1.11.)
GeoEast-VSP project
© GEOVERS Ltd., BGP R&D Center, 2005
Bridge plot User’s Manual
11/28/2014Page 12 of 49
Fig. 1.11. Display options for a field of the NMO seismic field
Use of words H_GRPDEPTH or H_RECIEVER_ELEV from heading of lines is possible.
The way of drawing (calculation of coordinate) of seismic field accordingly varies: or
cable depth of the device or an altitude of a point of reception is used. Scrollbar on the
right of a wave field completely corresponds to the given Y-coordinate.
For definition of additional displacement of a wave field on Y-axis the user can specify
value “Coordinate shift”, distinct from zero. The hodograph also is drawn according to
the words of heading specified by user. The choice from H_FIRSTBREAK and
H_VSP_FISRT_PSCK is given; besides it is possible to not draw hodograph.
3.2.6.1. Loading seismic data. Loading seismic data can be made by usage of the
menu “Data-> Add seismic Data” (see fig. 1.12). User can choose the necessary
seismic file from all seismic structures (Surveys) of the current project.
Program VSPbridge does not make any assumes, display of this or that seismic file
chosen by the user in this or that working area is how much correct. Only the user
should keep up use of correct materials, otherwise display of seismic fields can seem
senseless.
For example, display of a wave field of double reflections means presence of hodograph
data, specified in fields H_FIRSTBREAK or H_VSP_FISRT_PSCK. In case of incorrect
filling the given fields of headings hodograph can be drawn incorrectly. That is the user
himself who should watch correctness of data and provide presence of the necessary
information with seismic files.
It is supposed by the programs, that all necessary seismic data is present and correct.
GeoEast-VSP project
© GEOVERS Ltd., BGP R&D Center, 2005
Bridge plot User’s Manual
11/28/2014Page 13 of 49
Fig. 1.12. Loading of seismic data
The note: the opportunity to load data from other project is absent, for this purpose it is
necessary to open the new document, having specified the necessary project directly at
creation.
3.2.6.2. Removal of seismic data. Already loaded seismic data can be removed by
means of the menu “Layout-> Remove Seismic”. The given action does not delete
seismic data from a database but only removes its display from a tablet.
Fig. 1.13. Confirmation of removal of seismic data
It is necessary to notice, that unlike “switching-off from display” (see item 3.2, fig. 1.2),
“Remove seismic” action deletes the user options about visualization of seismic data
from a tablet file.
3.2.6.3. Adjustment of parameters of visualization. The user can define own
parameters of visualization of wave fields for each area of a seismic data. It is made by
a call of the menu item “Layout-> Seismic Colors” (see fig. 1.14).
GeoEast-VSP project
© GEOVERS Ltd., BGP R&D Center, 2005
Bridge plot User’s Manual
11/28/2014Page 14 of 49
Fig. 1.14. Parameters of visualization of seismic data
This menu item is accessible only for seismic data, already loaded on a tablet. The
detailed description of dialogue of seismic view options can be found in “User's guide
under program VSP Seismic Data Editor”.
3.2.6.4. Adjustment of scales. The user can define which part of a seismic field must
be drawn on a tablet (by default, right after loadings, all available range of data is
displayed). It can be made by a menu command “Layout -> Setup limits” (see fig.
1.15.1).
Fig. 1.15.1. Scale parameters for seismic data
All areas of seismic data are coordinated among themselves axes X (and are
coordinated to area of scrolling on axis X). On axis Y it is allocated three groups, for a
primary reflections (has no scrollbar), for a wave field of double reflections (has
scrollbar), and for fragments of CMP_VSP section (haves no scrollbars). Areas for
GeoEast-VSP project
© GEOVERS Ltd., BGP R&D Center, 2005
Bridge plot User’s Manual
11/28/2014Page 15 of 49
fragments of CMP-VSP section before and after convolutions haves the common scale
and limits on axis Y. Change of parameters for one area mentions also the second.
It is necessary to notice, that adjustment of limits and scales for the main wave field of
double reflections influences all tablet (it is equivalent to a call of menu item “Layout->
Setup Limits”).
All the made changes are fixed in history of editing and can be cancelled/repeated by
commands “Undo/Redo”. About work areas scaling see also item 3.2.11.
3.2.6.5 Adjusting seismic data area proportions.
Three seismic areas (for CMP_VSP sections before and after convolution, and primary
reflections area) can haves different heights. The user may specify weights of area for
each fragment using program menu item “Layout - > CMP weights”.
Fig. 1.15.2. Proportion parameters for seismic data areas
Each value (figure 1.15.2) in adjusting dialog represents weight of area inside common
seismic area and defines height of this fragment. The sum of all values of all visible
fragments is assumed to be equal to 100 % of area (time’s scale area is not used for
common area calculations), but can be not equal to 100% preciously. For example, user
can specify weights as values 1.0, 1.0 and 2.0 (that will be treated by program as 25%,
25% and 50% correspondingly).
Non-visible fragments (see part 3.2 for adjusting of visibility of different layout areas) are
not used for area heights calculations, trough they still displayed in dialog (figure
1.15.2). The values of weights are stored inside template file and can be used later after
file saving and loading.
3.2.7. Log curves areas.
The tablet contains (see fig. 1.16) two panels for display log curve and one-dimensional
models in the form of curves (Well logs area), and also two panels corresponding them
for display of data under names of curves and scale of their display (Logs Info area).
Data on names of curves and to scales are filled automatically right after loadings by the
user of curves on a tablet.
GeoEast-VSP project
© GEOVERS Ltd., BGP R&D Center, 2005
Bridge plot User’s Manual
11/28/2014Page 16 of 49
Fig. 1.16. Log curves areas
Work with curves is probable if user specify as active area one of areas (panels) for log
curves. Adjustment of visualization options is accessible only after on the panel one
curve is added even.
Loading of data is made by using menu item “Data-> Add log curve” (see item 3.2.7.1)
or “Data-> Add 1D model” (see item 3.2.7.2) or by means of dialogue “Layout-> Logs
Layout” (see item 3.2.7.3).
Current active area defines on which of two panels data will be added (or curves of
which panel need to be edited).
3.2.7.1. Loading of log curves. The user is limited in a choice of log curves by one
well. The well is determined by the user at addition on a tablet even one curve (see fig.
1.17).
GeoEast-VSP project
© GEOVERS Ltd., BGP R&D Center, 2005
Bridge plot User’s Manual
11/28/2014Page 17 of 49
Fig. 1.17. Well selecting dialog
After the well is selected, dialogue of well selecting does not show at addition of new
curves on a tablet. A unique way to redefine a well is to remove from a tablet all curves.
Definition of a current well automatically causes loading images to stratigraphy and
lithology columns.
Well selecting dialogue shows not only names of wells, but also amount of the curves
accessible to each well (and their names). It is necessary to notice, that the user should
coordinate correctly a well and data of the seismic files. The program provides big
flexibility at drawing up of a composition of a tablet. But, the program does not check,
whether vertical profiling seismic data concern to a current well or are taken from any
others. Also, the program does not check communication between log curves and onedimensional models (which become attached not to a well, but to surveys).
When the well is already defined by the user, the opportunity to choose a curve from
materials available in a database (see fig. 1.18) is given.
The column “Curve name” in the dialog defines a name of a curve, a column “Code” and
“Version” allows determining a curve from all another available log curves (and
corresponding to data from Geoeast database). All of three parameters are used at
preservation of the reference to a curve in a file of the tablet that allows specifying the
necessary curve precisely.
GeoEast-VSP project
© GEOVERS Ltd., BGP R&D Center, 2005
Bridge plot User’s Manual
11/28/2014Page 18 of 49
Fig. 1.18. Definition of log curve
After the curve is chosen, it is added to the current active panel. Color of a curve is
automatically generated using curve name. The scale steals up so that the curve has
been optimum presented. Restrictions on depth at the added curve are not present. The
scale of tablet steals up so that the curve all has been presented by the depth axis.
If the user has refused a choice of a curve, the message on impossibility to draw a
curve (see fig. 1.19) is shown.
Fig. 1.19. Curve is not defined
As soon as the curve is added on the panel, it becomes accessible to editing properties
of visualization (see item 3.2.7.3).
3.2.7.2. Loading of the one-dimensional models. At loading one-dimensional models
the user is limited only by frameworks of the current project. Number (name) of a well
does not take into consideration, also as well as name Survey (the user can load onedimensional model from any survey). The user should to watch correct use of models.
At loading data of model (see fig. 1.20) the user can choose not only Survey, but also to
specify type of model (Vp or Vs). The one-dimensional model for a tablet represents
similarity of a log curve; therefore after definition to replace type (Vs/Vp) it is already
impossible.
GeoEast-VSP project
© GEOVERS Ltd., BGP R&D Center, 2005
Bridge plot User’s Manual
11/28/2014Page 19 of 49
Fig. 1.20. Definition of data of one-dimensional model
After the one-dimensional model is chosen, model curve is added to the current active
panel. Color is automatically generated using model name. The scale steals up so that
the model has been optimum presented. Restrictions on depth at model initially are not
certain, therefore the scale of all tablet steals up so that all the given models have been
presented on depth.
If the user has not specified any model, the corresponding warning (see fig. 1.21) is
shown.
Fig. 1.21. The one-dimensional model is not defined
As soon as the model is added on the panel, it becomes accessible to editing its
properties of visualization (see item 3.2.7.3).
3.2.7.3. Dialogue “Logs Layout”, the manager of curves. Editing of properties of
visualization of curve and one-dimensional models is possible with special dialogue; it is
accessible only when tablet already has loaded curves or models (see fig. 1.22).
GeoEast-VSP project
© GEOVERS Ltd., BGP R&D Center, 2005
Bridge plot User’s Manual
11/28/2014Page 20 of 49
Fig. 1.22. Dialogue of editing curves on the panel
The dialogue opens by using menu item “Layout-> Logs layout” for the chosen area
containing the curves, or by double clicking on the panel with already loaded curves
data.
In dialogue all curves and one-dimensional models from the current active panel are
presented. The column “Curve” contains a name of curve (model). The column “Type”
specifies type of data (curve/model). The column “Visible” determines whether curve
(model) is drawn currently. The column “Line Type” gives the minimal representation
about graphic properties of object.
Double click on a curve (or pressing of button "Properties" at the curve/model chosen in
the table) allows editing parameters of visualization for curve (see fig. 1.24 a, b).
Buttons “Add Curve/Add Model” allows to add a curve/model on the panel (see 3.2.7.1,
3.2.7.2).
Button "Hide/Show" allows switching-off the image of a curve on the panel (thus the
curve remains in a file of presentation, but invisible). The item “Delete” allows removing
a curve/model from the list.
Buttons "Up" and “Down” in dialogue “Logs Layout” allow to change a relative
positioning of curves and models in the list. It is represented, that all curve and onedimensional models on the panel are stored in the form of the list. Position of a
curve/model in the list defines an arrangement of their graphic display to panels
concerning other elements (see fig. 1.23).
All the made changes enter the name in history of editing and can be cancelled/are
repeated by commands “Undo/Redo”.
GeoEast-VSP project
© GEOVERS Ltd., BGP R&D Center, 2005
Bridge plot User’s Manual
11/28/2014Page 21 of 49
Fig. 1.23. The relative positioning of curves/models on the panel
depending on position in the list of curves
The first element in the list is displayed atop of all other curves, and the heading of a
curve/model in the field of Logs Info (parameters of scaling and a name of a curve) is
drawn by the uppermost.
Adjustment of properties of models and curves is made by the user by means of
corresponding dialogue (see fig. 1.24 a - d).
Fig. 1.24 a, b. Adjustment of drawing parameters for curves
and one-dimensional models
Adjustments of a tab “Pen” allow defining thickness, color and a tracing of a line of a
curve. Change of parameters of a bookmark “Scale” allows setting up scale of display of
a curve on axis X, setting the left and right value of a scale. The tag “Use logarithmic
scale” allows drawing a curve with use of logarithmic scale. The logarithmic scale is
inaccessible to models.
The button “Get min/max values” establishes the left and right value of a scale
according to data of a curve from a database, with reference to current restrictions of a
curve on axis Y (see fig. 1.24.c).
It is necessary to notice one special property, characteristic only for models. All models
of one type (Vs or Vp) within the limits of one panel are displayed in one scale. Change
GeoEast-VSP project
© GEOVERS Ltd., BGP R&D Center, 2005
Bridge plot User’s Manual
11/28/2014Page 22 of 49
of parameters of a scale for one model will immediately lead to redraw of all other
models of the same type inside of the given panel according to new scale.
Fig. 1.24 c, d. Adjustment of visualization parameters for curves
and one-dimensional models
Restriction of curve (model) on depth (the tab “Limits”) enables the user to not draw on
the panel all curve entirely, but only its part (a tag “Limit curve output by”). Restrictions
are accordingly specified in fields “Min/Max depth”. The button “Get Min/Max depth”
allows receiving these values directly from Geoeast database.
The specifying of value of displacement “Y-Shift” (which is distinct from zero) will lead to
shift of a curve or model downwards (upwards at negative value) on an axis of depths
on the corresponding value.
The tag “Title” allows setting the user defined name for curve and one-dimensional
models. By default, the shown name of a curve corresponds to a name of a curve in
Geoeast database, and the name of model in addition contains the type of model
(Vs/Vp) in square brackets. If such name by default is too long or non-informative, it is
possible to lead to a convenient kind.
Copying of a curve according to changed by the user properties is made only after
pressing button "Ok". Button "Cancel" leads to a canceling of all changes.
All the made changes are written in history of editing and can be cancelled/are repeated
by commands “Undo/Redo”.
3.2.8. The stratigraphy and lithology columns.
The tablet contains (see fig. 1.25) two panels for display of the additional information on
a well. It is stratigraphy and lithology columns.
GeoEast-VSP project
© GEOVERS Ltd., BGP R&D Center, 2005
Bridge plot User’s Manual
11/28/2014Page 23 of 49
Fig. 1.25. Area for stratigraphy and well lithology
The additional information on well (see fig. 1.26 a) is loaded automatically right after
how the user has chosen a well. The choice of a well can be made during log curve
definition (see item 3.2.7.1). If log curves still are not present, the user also can
determine a well by double click on area for lithology (or stratigraphy). If log curves
already are on a tablet, to change a well it is possible only after their removal.
The lithology column is drawn according to the designations established by
documentation Geoeast, the information on lithology is read out from Geoeast database
for a well. User can switch-off lithology display by removing corresponding item in
dialogue of adjustment of visible working areas (see item 3.2, fig. 1.2).
The stratigraphic column is drawn according to list of formation on a well from Geoeast
database (program VSPbridge uses names formation divisions and a mark of depths).
GeoEast-VSP project
© GEOVERS Ltd., BGP R&D Center, 2005
Bridge plot User’s Manual
Fig. 1.26 а. Hierarchically organized group
of stratigraphic divisions
11/28/2014Page 24 of 49
Fig 1.26 b. Dialog for Formation column
adjustment.
In case of mutual crossing several formations the program automatically makes an
attempt to construct hierarchical splitting set of layers into groups according to their
occurrences each other (see fig. 1.26а).
The formation column can be adjusted by mouse click, if stratigraphy’s data is already
loaded (see fig 1.26b).The user can specify pen’s width, color and style. Also, the font
for drawing formation names can be changed.
3.2.9. Areas for user markers.
The tablet can contain the user markers. These data are stored directly in a file of the
description of a tablet together with other adjustments. The image of markers is made
not on one panel, and at once on several (see fig. 1.27). The special role is played with
presence on a tablet of the loaded image of NMO seismic with hodograph.
Presence of hodograph determines not only a way of display of markers, but also their
input, and also display of their properties. At absent of hodograph there is inaccessible
an input of a marker on a mark of time, also data about this mark from properties of a
marker disappear. There is it because the basic characteristic of a marker for the
program is the depth, and the mark of times is recalculated automatically proceeding
from hodograph’s data. Thus, loading various wave fields, the user will receive various
marks of times for the same markers.
Accordingly, if the NMO field does not contain hodograph (or the field is not loaded), the
marker is not drawn on panels with seismic data (see fig. 1.28). Besides the marker is
not drawn on panels if they displaying is switched off in dialogue of adjustment of visible
working areas (see item 3.2, fig. 1.2).
GeoEast-VSP project
© GEOVERS Ltd., BGP R&D Center, 2005
Bridge plot User’s Manual
11/28/2014Page 25 of 49
Fig. 1.27. The areas containing the user markers
Fig. 1.28. The way of markers drawing depends on hodograph’s presence
The program keeps all the user markers in the form of the list (markers stock), change
of properties separate markers probably right after its creations (item 3.2.9.1) or using
dialogue of visualization properties of the list of markers (item 3.2.9.2).
3.2.9.1. Input of markers. Input of markers (see fig. 1.29) is carried out by the user by
means of a command of the menu “Data-> Add marker”. Addition of markers is also
probably from dialogue “Edit markers stock” (see item 3.2.9.2). The opportunity of
introduction of a marker on a mark of times is determined by presence of a wave field
with loaded hodograph data.
GeoEast-VSP project
© GEOVERS Ltd., BGP R&D Center, 2005
Bridge plot User’s Manual
11/28/2014Page 26 of 49
Fig. 1.29. Addition of a new marker
The user can enter a new marker in several ways:
• By input of value of depth in a field of input in dialogue of marker addition (fig. 1.29).
After such creation of a marker the user passes directly to editing of marker properties
(fig. 1.31).
• By input of a time value of a marker in a corresponding field of dialogue. The given
field is inaccessible at hodograph absence. After creation of a marker the user passes
to editing its properties (fig. 1.31).
• By direct indication of a marker depth using mouse. After pressing the button “Pick…”
in dialogue, the program passes in a mode of interactive input of a series of markers.
Having specified the necessary coordinate on a tablet for creation of a new marker, the
user can edit its properties, and then continue the further input of new markers. To stop
data input it is possible by pressing of button "Escape" (or by pressing of the button
“Select object” on the panel of tools, or by the beginning of another interactive water, for
example, by primitives drawing).
• By direct indication of time mark by mouse. Input of coordinates is made on a tablet
and is probable only at hodograph’s presence. Right after input of a new marker the
user determines its properties, and then continues input of markers. To stop input it is
possible button "Escape". Interactive input of such type is probable only on panels of
seismic fields (the cursor changes the form, turning in a cross, the possible mark of a
marker is drawn by a dark blue line within the limits of the panel).
3.2.9.2. Editing of markers properties.
Editing of markers already available on a tablet is accessible on a menu command
“Layout-> Edit markers”. Markers are described by several parameters (see fig. 1.28.a,
b): the name of a marker, its color, depth value. It is necessary to pay special attention
that the time value for a marker is calculated automatically and is not a constant. In
spite of the fact that the user can enter a marker the instruction of a time value (see
3.2.9.1), the program will operate with the counted value of a mark of depths when
drawing marker.
The marker can be invisible. It means that their depth value (and other properties) is
kept in a file of a tablet, but the image of marker is not drawn. Such markers are
checked in stock dialogue (see fig. 1.30) as “Visible: No”. To make a marker invisible it
is possible by using the button “Hide” in this dialog.
GeoEast-VSP project
© GEOVERS Ltd., BGP R&D Center, 2005
Bridge plot User’s Manual
11/28/2014Page 27 of 49
Fig. 1.30. Dialogue for editing marker properties
Completely removal of a marker is possible by using button "Delete". For adding new
marker button "Add" can be used. Editing of marker properties can be made by button
"Properties" (if marker is selected in the list).
The basic property of a marker (see fig. 1.30 a, b) is a depth value. Its change will lead
to immediate recalculation of a mark of times (in case of hodograph’s absence or
impossibility to count coordinate the field “Time” is set to “Undefined” value). The mark
also cannot be counted, if value of depth surpasses the maximal value in hodograph
data. In this case the marker will be drawn as a direct line (see fig. 1.28).
Fig. 1.30 a, b. Editing of marker properties
Additional properties of marker are color of a line, line thickness and their style. For
identification of a marker in the list the markers name is used (it is shown on a tablet if
option “Draw name at canvas” is specified). By default the name of a marker is formed
from depth value at creation of a marker.
All changes of properties of a marker become visible only at closing dialogue of
properties editing. The made changes can be cancelled by button "Undo" in menu of the
program.
GeoEast-VSP project
© GEOVERS Ltd., BGP R&D Center, 2005
Bridge plot User’s Manual
11/28/2014Page 28 of 49
3.2.10. Areas for user graphic primitives.
The user can render on tablet panels own graphic primitives and text notes. For this
purpose it is necessary to use the menu “Objects” or the corresponding toolboxes.
Not all areas are accessible to drawing (see fig. 1.31), but all buttons (and items of the
menu) remain active constantly irrespective of the fact which the area of a tablet is
active at the moment. Instead of buttons disabling another way is used: below areas
where primitive drawing is possible, the cursor changes the icon, turning in a cross. The
areas inaccessible to drawing do not change the cursor icon (it drawn as arrow).
Fig. 1.31. Areas of composition which can
contain graphic primitives
Graphic primitives are stored in a file of the visualization options in the form of separate
objects of data. Each object is adhered to the concrete panel of a tablet on which it has
been created, therefore it is possible to copy it from one file of a tablet in another
(through the clipboard buffer inside of the program), but it is impossible to copy object
from one panel in another.
In total there are eight kinds of graphic primitives (see fig. 1.32). Some primitives
properties are common (see item 3.2.10.10), and some of primitive types are extension
of other types (for example, "Label" is expansion of "Point"), but the replacing of
primitive type is impossible. The type of primitive is unequivocally determined at its
creation.
3.2.10.1. Input of user primitives. The user can enter primitives using the menu
“Objects” or corresponding toolbox. Having chosen the necessary type of primitive
(through the menu, or having pressed the corresponding button on the toolbox), the
user begins input of primitive’s coordinates. After end of input of coordinates the user
GeoEast-VSP project
© GEOVERS Ltd., BGP R&D Center, 2005
Bridge plot User’s Manual
11/28/2014Page 29 of 49
can adjust properties of entered object. After closing proper tie’s editing dialogue (see
3.2.10.2) the user continues input new graphic primitives the same type. To stop input it
is possible by pressing button "Escape", or the button “Select object” on the panel of
tools, or deactivating toolbox “ Draw…” button by secondary press.
Fig. 1.32. Graphic primitives
User can copy (or cut) already drawn primitives to the clipboard buffer by commands of
the menu “Edit-> Copy” (or “Edit-> Cut”). The object from the clipboard buffer can be
inserted into the same panel (the same to which belonged original primitive) by the
command “Edit-> Paste”.
Entered graphic primitives can be adhered to two various systems of coordinates,
relative or absolute. The absolute system of coordinates designates a binding primitive
to system of coordinates of seismic data and log curves. At zooming such primitive will
change the position and the sizes in the same way, as well and seismic data of a tablet.
The relative system of coordinates means system of coordinates of the panel, not
dependent on actions of the user on change of scale of the presented data. That is,
after zooming the primitive does not change position, and its proportions depend only
on the sizes of the panel.
By default, all entered primitives are adhered to "absolute" system of coordinates, i.e.
system of coordinates of tablet data. To change a binding it is possible for any type of
primitives at editing its properties, for this purpose on tab “Coords” it is necessary to
expose an option “Use relative cords”. In this case coordinates of a primitive will be
automatically recounted in new system.
Coordinates of a primitive can be changed easily by primitive dragging with clamped left
button of the mouse. For more exact change of coordinates it is necessary to take
advantage of editing of properties of object.
3.2.10.2. Editing of properties graphic primitives. For editing properties of object the
user must select it. Activation of “Selecting” mode can be made by pressing button
“Select Object”, located on the toolbox “Edit and Draw Tools”. Then the user can use
menu “Edit-> Object” (with selected object), or double click to specify necessary
primitive. The selected object is designated by a special frame in the form of small red
squares.
GeoEast-VSP project
© GEOVERS Ltd., BGP R&D Center, 2005
Bridge plot User’s Manual
11/28/2014Page 30 of 49
Depending on primitive type there will be openly corresponding dialogue window. It is
not possible to change type of already drawn primitive. Change of object properties is
made after closings of the editing dialog by button "Ok". All changes can be flushed by a
command “Edit-> Undo”.
3.2.10.2.a. "Point". The “Point” primitive (see fig. 1.33) represents the small painted
over circle keeping the sizes irrespective of current scale of presented data (unlike
“Circle”, for example).
Fig. 1.33. Editing of properties of a point
The user can change the sizes of a circle by specifying its exact radius (a tab “Coords”),
or by changing thickness of a line (a tab “Pen”). Color of a point develops of two
components: colors of a line, by which the circle is drawn (a tab “Pen”) and colors of the
brush used for circle filling (a tab “Fill”). The tracing of a point is determined by style of a
line, with which the circle is drawn (a tab “Pen”) and by a pattern of a brush (a tab “Fill”).
The user can specify an exact arrangement of a point, editing data of fields “X Coord”
and “Y Coords” at tab “Coords”. In the same place (tab “Coords”) the way of a binding of
coordinates of a point (see item 3.2.10.2) is defined.
3.2.10.2.b. "Box". It (see fig. 1.34) represents the rectangular area which has been
probably painted over. The user sets properties of a feather (a tab “Pen”) by which the
border of a rectangular is drawn, and properties of a brush for fill this rectangular (a tab
“Fill”).
Fig. 1.34. Editing of box properties
At creation of a box the user sets coordinates of two tops of a rectangular. Precisely
define coordinates of a rectangular the user can do on a tab “Coords”, setting an
arrangement of the top left corner of a rectangular area and its width with height. In the
same tab the way of a binding of coordinates of a point (see item 3.2.10.2) is defined.
GeoEast-VSP project
© GEOVERS Ltd., BGP R&D Center, 2005
Bridge plot User’s Manual
11/28/2014Page 31 of 49
3.2.10.2.c. "Polyline". This primitive (see fig. 1.35) is a set of the points consistently
connected among them. The user can set properties of a line (thickness of a feather,
color and a tracing) on a tab “Pen”.
Fig. 1.35. Editing of properties of a polyline
During creation of a polyline the user serially specifies coordinates of points. User can
finish process of creation of a polyline by two ways: a) to specify last point by double
click, this last point will be last point of a polyline; b) to press key “Enter”, already having
all point of a polyline drawn, in that case last drawn point will be considered last point of
polyline. Pressing of any other key will interrupt data input.
To edit coordinates of points of already entered polyline precisely it is possible at tab
“Coords”. All the made changes will be visible only after pressing button "Ok".
3.2.10.2.d. "Polygon". The “Polygon” primitive (see fig. 1.36) represents the closed
polyline. Input of range is similar to input of a polyline; last point is underlined or double
mouse click, or a key “Enter”.
Fig. 1.36 Editing of polygon properties
In addition to properties of a polyline (the line, color and style of a line on a tab “Pen”)
the polygon has color and style of a brush for filling. The filling properties can be
adjusted at tab “Fill”.
Coordinates of polygon vertexes can be edited on a tab “Coords”. Changes will be
made only after pressing button "Ok" and can be flushed by a command “Undo” the
basic menu of the program.
GeoEast-VSP project
© GEOVERS Ltd., BGP R&D Center, 2005
Bridge plot User’s Manual
11/28/2014Page 32 of 49
3.2.10.2.e. “Label”. The “Label” primitive (see fig. 1.37.a) differs from “Point” primitive
that the point noted by the user is subscribed.
Fig. 1.37a. Editing of properties of a text label;
properties of the text
The text displayed near the image of a point, is not limited by any frameworks (unlike
“Text”, see 3.2.10.2.f). The arrangement of the text concerning a point of an insert is
determined by parameters “Text placement” (a tab “Params”). The font, to which the
text is written, also is defined by the user on a tab “Params” and is identical for all text of
the label.
Graphic properties of a drawn marker (see fig. 1.37.b) are similar to properties of “Point”
primitive. The user sets thickness, color of a feather, a kind of a tracing of a line, by
which the circle of a marker is drawn, and also color and style of a feather for filling this
circle. All these parameters are set on tab “Marker”.
Fig. 1.37b. Editing of properties of a text label;
properties of a marker
Coordinates of a marker can be edited as its dragging by mouse, or are set precisely on
a tab “Coords” at editing primitive properties, the relative binding is supposed.
The edited properties inure after pressing the button “Ok” and can be cancelled by a
command “Undo” of the main menu of the program.
GeoEast-VSP project
© GEOVERS Ltd., BGP R&D Center, 2005
Bridge plot User’s Manual
11/28/2014Page 33 of 49
3.2.10.2.f. "Text". This primitive (see fig. 1.38.a, b) represents the text limited by a
rectangular framework (unlike “Label”). Accordingly, properties can be divided into
properties of the text (fig. 1.38.a) and properties of a framework (see fig. 1.38.b).
Fig. 1.38a. Editing of the “Text” primitive;
properties of the text.
On a tab “Text” the user enter actually shown text; on a tab “Params” user specify its
properties. Color and a tracing of a font concern to properties, and also a way of
alignment of the text inside of a framework-terminator, set by the user.
Fig. 1.38.b. Editing of the “Text” primitive;
properties of the framework.
Properties of a framework of the text are set on a tab “Frame” (a pen by which the
framework is drawn and properties of brush for filling framework). Coordinates of a
framework and its sizes can be set on a tab “Coords”. These characteristics and a way
of their definition “Text” primitive no differ not from “Box” primitive.
GeoEast-VSP project
© GEOVERS Ltd., BGP R&D Center, 2005
Bridge plot User’s Manual
11/28/2014Page 34 of 49
3.2.10.2.g. "Circle". The “Circle” (see fig. 1.39) is practically full analogue of “Ellipse”
primitive (see item 3.2.10.h) and differs only in the way of the coordinates definition.
Fig. 1.39. Editing of “Circle” primitive
In dialogue of properties editing user can change properties of a line by which the circle
(thickness of a feather, color, a line style on a tab “Pen”), properties of a brush with
which the circle id filled (a tab “Fill”). At the ”Coords” tab user can edit coordinates of the
center of a circle and its radius.
As it is possible to see on the image of a tab “Coords”, a circle has two radiuses (two
half-axis) instead of one radius. It occurs because actually this primitive represents an
ellipse defined by half-axis. As the circle (by means of the indication center point and of
radius) this object is created only.
3.2.10.2.h. "Ellipse". The “Ellipse” primitive (see fig. 1.40) is practically full analogue of
“Circle” (see item 3.2.10.g) and differs only in the way of the definition of coordinates.
As it is possible to see on the image of a tab “Coords”, the ellipse is set by the indication
of coordinates of the left right corner of a rectangular in which the ellipse is placed, and
also in the width and in height of this rectangular (unlike the center half-axis values,
defining “Circle”).
Fig. 1.40. “Ellipse” editing
In dialogue of properties editing the user also can change properties of a line by which
the ellipse is drawn (thickness of a feather, color, a line style on a tab “Pen”), and
properties of a brush with which the circle (a tab “Fill”) is filled in.
GeoEast-VSP project
© GEOVERS Ltd., BGP R&D Center, 2005
Bridge plot User’s Manual
11/28/2014Page 35 of 49
3.2.10.10. The common properties of graphic primitives. The most widespread are
properties of a feather, of filling and of a text font. Their definition is made in the
standardized dialogues.
Fig. 1.41. Definition of line type and type of a brush
Style of a line and style of a brush for primitive filling means use of the values standard
for library Qt (see fig. 1.41). At documents printing distance between strokes and the
way of fill shadings is defined by library “cgm” from Geoeast package.
The color definition (for any property) is made in standard dialogue Qt (see fig. 1.42).
Fig. 1.42. Definition of color by usage of Qt dialogue
GeoEast-VSP project
© GEOVERS Ltd., BGP R&D Center, 2005
Bridge plot User’s Manual
11/28/2014Page 36 of 49
For definition of a font the standardized dialogue of library Qt also is used.
Fig. 1.42. Definition of font properties by usage of Qt dialogue
Note: It is not necessary to set highly specialized fonts which can be absent by some
hosts, because when moving the document it can affect incorrect readership of the
document. It is better to use standard kinds of fonts.
The size of a font is set in standard units Qt (points). It is necessary to note especially,
that at a print version of the document (or at scaling by the user during work) the size of
a font does not become attached to current scale (or to scale of a print version). Font
size is all time constant (and it is equal to the exact value established by the user). That
is, if at huge scale the “Text” does not find room inside of a limiting framework, it is not
necessary to try to reduce immediately font size because at a print version the size of a
framework will appear absolutely another, and the text will be correctly printed.
3.2.11. The areas accessible to scaling (zooming).
Inside of working space of a tablet there are some working areas at which the user can
set the scale of the image necessary on axes X and Y. Within the limits of these areas
zoom commands can be used (fig. 1.43).
GeoEast-VSP project
© GEOVERS Ltd., BGP R&D Center, 2005
Bridge plot User’s Manual
11/28/2014Page 37 of 49
Fig. 1.43. The scalable areas
Zooming commands concern to “View” section in the main menu of the program (and to
buttons of the toolbox “Zoom Tools”). These commands allow to change as scale of the
image, and to move a displayed window of current visible area. The change of scales
inside of one working area affects all other, connected with it by one (or both) common
coordinate axis (see 3.2.4 and 3.2.5).
Zoom commands remain accessible to the user always, irrespective of current active
working area. For that definition, whether zoom is probably within the limits of working
area the mechanism of change of cursor appearance is used. When the command of
scaling is active, the cursor becomes a cross-like in those areas which are accessible
for zooming.
The activation of scale change occurs after pressing one of zoom commands in the
menu “View” or after usage of corresponding button on the toolbox “Zoom Tools”. The
mode will be active, while the user does not press button "Escape", or yet does not
deactivate (will wring out the corresponding button on the toolbox) a current active
command, or yet does not make active other command of the menu.
After change of scale of each working area it is possible to lead a canceling action by a
command “Undo”. At a print version of document this scale of working area (in view of
the scaling specified by the user in parameters of a printing) will be used for a
conclusion of the image of the given site of a tablet.
GeoEast-VSP project
© GEOVERS Ltd., BGP R&D Center, 2005
Bridge plot User’s Manual
11/28/2014Page 38 of 49
Fig. 1.48. Zoom commands
Accessible commands of scaling (see fig. 1.48) are:
3.2.11.1. Zoom. This command enables to make scaling by a choice of area (see fig.
1.49 a). Specifying coordinates of region, the user receives the image in the necessary
scale.
Fig. 1.48. a, b, c. Zoom by a framework and shift (pan).
It is necessary to note, that some areas can really change scale only on one axis (X or
Y), for example area for log curves. Scaling on an axis of depths is probably by means
of zoom commands, but changes of scale of curves thus will not be made. That is, really
scaling concerns only to axis Y in spite of the fact that at a choice of a window of scaling
the framework is used. Such areas (which haves only one axis to zoom) haves another
type of rubber frame of scaling zoom window (see fig 1.48 c).
3.2.11.2. Zoom In (centered). This command makes increase in a part of the image at
10 %. It occurs in that active area where the user specifies by mouse click. Zoomed
area is centered using user’s clicked point.
3.2.11.3. Zoom Out (centered). The command makes decrease scale at 10 %, it
occurs in that active area where the user specifies by mouse click. Zoomed area is
centered using user’s clicked point.
3.2.11.4. Zoom In. This command makes increase in a part of the image at 10 %. It
occurs in that active area where the user specifies by mouse click. Zoomed area is
centered using current center of the panel area.
3.2.11.5. Zoom Out. The command makes decrease scale at 10 %, it occurs in that
active area where the user specifies by mouse click. Zoomed area is centered using
current center of the panel area.
3.2.11.6. Zoom Axis. The command makes following action: within the limits of the
panel the axis (X or Y, or both, depending on their presence) along which change of
scale is possible gets out. Then program made viewing all objects given (the curve,
GeoEast-VSP project
© GEOVERS Ltd., BGP R&D Center, 2005
Bridge plot User’s Manual
11/28/2014Page 39 of 49
seismic fields, drawn user primitives) which are adhered to this axis (or to both) and
then made scaling so that all these objects becomes visible. I.e. this command does
“Zoom All” action, but only within the limits of the panel specified by the user, instead of
all panels for all tablet.
3.2.11.7. Pan. The “Pan” command makes shift of a visible part of the image of working
area in the panel in a direction specified by the user. The scale does not change. For
simplification of understanding process of shift is accompanied by drawing of an arrow
of displacement (fig. 1.48.b), the first point specified by the user designates a point,
"whence", the second is a point "where" the image should be displaced.
3.2.11.8. Zoom All. This command makes such change of scale of all working areas of
a tablet that all objects of Geoeast database and all user primitives from all panels
became visible.
3.3 Main window elements
Elements of a working window of the program (besides working areas of a tablet) also
are: the menu, panels of tools and a status line.
3.3.1 Menu bar
Fig. 1.49. The main menu of the program
The main menu of the program (fig. 1.49) is presented by items “File” (the basic
commands on work with a file of a tablet), “Edit” (commands “Undo” / ”Redo” and work
with the clipboard buffer), “View” (zooming tools), “Objects” (drawing of user primitives),
“Data” (an insert of Geoeast data objects), “Layout” (adjustment of displayed Geoeast
data objects) and “Help”.
3.3.1.1 File
The menu “File” contains following commands (see fig. 1.50):
Fig. 1.50. The menu “File”
Command “New”. This is a command for creation of the new document. After
registration of the user (see item 3.4.1) in Geoeast database, the new clean document
is created. At creation it is necessary for user to specify also a name of the project in
which he will work (see fig. 1.51). It is impossible to replace the project already after
creation of the new document.
GeoEast-VSP project
© GEOVERS Ltd., BGP R&D Center, 2005
Bridge plot User’s Manual
11/28/2014Page 40 of 49
Fig. 1.51. A choice of the active project
Without the specified active project creation of the new document will be stopped (fig.
1.52) and it will be informed to the user on an error (fig. 1.53).
Fig. 1.52. An error of a choice of the project
Fig. 1.53. An error of creation of the new document
Command “Open”. It is used for opening of the document. After necessary registration
of the user (see item 3.4.1) in database Geoeast, it is offered to the user to choose the
necessary file of a tablet (see fig. 1.54).
For a designation of files-documents of program VSPBridge files the extension
“.vspbridge” is used. In the event that extension of a file is another, the user can specify
a symbol of an asterisk (“*”) in line “File name” and then to load any file from the opened
list of all files of a directory.
GeoEast-VSP project
© GEOVERS Ltd., BGP R&D Center, 2005
Bridge plot User’s Manual
11/28/2014Page 41 of 49
Fig. 1.54. Opening of a file
If the document has been created by other user Geoeast, authorization (see item 3.4) is
required.
Command “Save”. It is used for file saving. Each change of a context of the document
is accompanied by preservation of the previous condition of the document in History (for
probable recoil by usage of commands “Undo”/”Redo”) and change of a title line of the
main program window. The name of a file in a title line at presence of the brought
changes is supplemented with a symbol of an asterisk (“*”). If the user will try to close
such file, he will accept the warning (see fig. 1.55).
Fig. 1.55. The warning about changed condition of a file
The file saving is made by its overwriting in a file with the same name (unlike “Save
as”). If file has not defined name yet, “Save as” command will be invoked.
Command “Save As”. It is used for file saving under other name. In the event that the
user wishes to keep a file under other name, he should take advantage of this menu
command. User can redefine a file name in standard dialogue Qt (see fig. 1.56).
GeoEast-VSP project
© GEOVERS Ltd., BGP R&D Center, 2005
Bridge plot User’s Manual
11/28/2014Page 42 of 49
Fig. 1.56. File saving
File extension (“.vspbridge”) is added automatically, it isn’t necessarily to specify it.
Command “Print”. The print version of a ready tablet is made by means of library
gecgm. Preliminary the user sets the demanded scale and/or the sizes of a printing for a
conclusion (see fig. 1.57).
Fig. 1.57. Dialogue of the document printing
More in detail about tinctures of a printing see “The User's guide under program VSP
Seismic Data Editor”.
GeoEast-VSP project
© GEOVERS Ltd., BGP R&D Center, 2005
Bridge plot User’s Manual
11/28/2014Page 43 of 49
Command “Exit”. This command of the menu allows carrying out an exit from the
program. If the document contains not kept changes, the user will be warned about this
by the corresponding message (see fig.1.55).
3.3.1.2 Edit
The menu “Edit” contains following commands (see fig. 1.58):
Fig. 1.58. The menu “Edit”
Command “Select object”. It allows to be switched in a mode of graphic primitive
editing. While the given mode is not activated, the user cannot choose graphic objects
by a mouse. The exit from a mode is carried out by secondary usage of this item of the
menu, or by pressing of "Escape" button.
Command “Properties”. If the user has chosen graphic primitive, this command
becomes accessible and allows to edit its properties (see item 3.2.10). The command
also becomes active after double click on the selected primitive object.
Command “Undo”. During work of the user all made changes are stored in History. At
any moment it is possible to make disposable recoil on the previous condition of the
edited document. Plural “Undo” by the program is not supported. If performance “Undo”
is impossible, the command is inaccessible.
Command “Redo”. This is a command that return program to state, saved before
“Undo” operation. After the user has undo action of the previous operation, it is possible
to repeat its action by “Redo”. Plural “Redo” are not stipulated by the program, unitary
performance is possible only. If operation “Redo” is impossible, the command of the
menu becomes inaccessible.
Command “Copy”. During work with graphic primitives, the user can copy current
chosen object in the clipboard buffer.
Command “Cut”. During work with graphic primitives, the user can move current
chosen object to the clipboard buffer by this command.
Command “Paste”. Any time, the object from the clipboard buffer can be inserted by
the “Paste” command on the same panel, as original (copied) graphic primitive.
Command “Delete”. It deletes current chosen graphic user primitive.
GeoEast-VSP project
© GEOVERS Ltd., BGP R&D Center, 2005
Bridge plot User’s Manual
11/28/2014Page 44 of 49
3.3.1.3 View
The menu “View” contains following commands (see fig. 1.59):
Fig. 1.59. The “View” menu
Command “Zoom”. Makes zooming by a framework (see item 3.2.11.1)
Command “ Zoom In (centered)”. Makes centered zoom by reduction of image scale
at the panel specified by the user (see item 3.2.11.2)
Command “ Zoom Out (centered)”. Makes centered zoom by increasing of scale at
the panel specified by the user (see item 3.2.11.3)
Command “ Zoom In ”. Makes zoom by reduction of image scale at the panel
specified by the user (see item 3.2.11.4)
Command “ Zoom Out ”. Makes zoom by increasing of scale at the panel specified by
the user (see item 3.2.11.5)
Command “ Zoom Axis ”. Makes zoom along coordinate axes available on the
specified panel (see item 3.2.11.6)
Command “Pan”. Makes shift of the image on the specified panel without change of
scale (see item 3.2.11.7)
Command “ Zoom All ”. Makes zoom on all panels of a tablet so that all graphic
objects and data became visible (see item 3.2.11.8)
Command “Splitters”. Switch on/off displaying of splitters (see part 3.2.2).
3.3.1.4 Objects
The menu “Objects” contains following commands (see fig. 1.60):
GeoEast-VSP project
© GEOVERS Ltd., BGP R&D Center, 2005
Bridge plot User’s Manual
11/28/2014Page 45 of 49
Fig. 1.60. The menu “Objects”
Command “Draw Point”. It starts (or switches off by repeated pressing) drawing of
primitives of “Point” type (see 3.2.10.1 and 3.2.10.2.a).
Command “Draw Box”. It starts (switches off by repeated pressing) drawing of
primitives of type “Box” (see 3.2.10.1 and 3.2.10.2.b).
Command “Draw Polyline”. It starts (or switches off by repeated pressing) drawing of
primitives of “Polyline” type (see 3.2.10.1 and 3.2.10.2.c).
Command “Draw Polygon”. It starts (or switches off by repeated pressing) drawing of
primitives of “Polygon” type (see 3.2.10.1 and 3.2.10.2.d).
Command “Draw Label”. It starts (or switches off by repeated pressing) drawing of
primitives of “Label” type (see 3.2.10.1 and 3.2.10.2.e).
Command “Draw Text”. It starts (or switches off by repeated pressing) drawing of
primitives of “Text” type (see 3.2.10.1 and 3.2.10.2.f).
Command “Draw Circle”. It starts (or switches off by repeated pressing) drawing of
primitives of “Circle” type (see 3.2.10.1 and 3.2.10.2.g).
Command “Draw Ellipse”. It starts (or switches off by repeated pressing) drawing of
primitives of “Ellipse” type (see 3.2.10.1 and 3.2.10.2.h).
3.3.1.5 Data
The menu “Date” contains following items (see fig. 1.61):
Fig. 1.61. The “Data” menu
Command “Add log curve”. Selects and adds on the current active panel one log
curve (see item 3.2.7.1).
Command “Add Model”. Selects and adds on the current active panel onedimensional model (see item 3.2.7.2).
Command “Seismic Data”. Adds on the current active panel selected seismic data
(see item 3.2.6.1).
Command “Add Marker”. Allows the user to enter markers (see item 3.2.9.1).
3.3.1.6 Layout
The menu “Layout” contains following commands (see fig. 1.62):
GeoEast-VSP project
© GEOVERS Ltd., BGP R&D Center, 2005
Bridge plot User’s Manual
11/28/2014Page 46 of 49
Fig. 1.62. The menu “Layout”
Command “Setup layouts”. Allows to switch on/off the image of various working areas
of a tablet (see item 3.2).
Command “CMP weights”. Allow to specify heights of seismic areas for CMP seismic
areas (see item 3.2.6.5).
Command “Setup Limits”. Establishes the common limits and scales for all tablet (see
item 3.2.4).
Command “Setup Grids”. This menu item invokes user dialog, which allows to setup
grid displaying settings (see fig 1.63).
Fig. 1.63. The “Grids properties” dialog
User can specify width of grid lines, a color and a pen style for line’s drawing. All grids
at all areas will be modified using single dialog.
Command “Logs Layout”. Allows changing a way of displaying for log curves and
one-dimensional models for the current active panel (see item 3.2.7.3).
Command “Seismic Scales”. Establishes limits of the image and scale for current
working area with seismic (see item 3.2.6.4).
Command “Seismic Layout”. Establishes the parameters of the data used for a
drawing of the NMO seismic (see item 3.2.6).
GeoEast-VSP project
© GEOVERS Ltd., BGP R&D Center, 2005
Bridge plot User’s Manual
11/28/2014Page 47 of 49
Command “Remove seismic”. Deletes the loaded seismic field for current working
area (see item 3.2.6.2).
Command “Seismic Colors”. Establishes parameters of visualization for current
working area with seismic field (see item 3.2.6.3).
Command “Edit Markers”. Allows the user to edit a way of a marker displaying (see
item 3.2.9.2).
Command “Edit Info Text”. Allows to edit a current active text field of a tablet (see
item 3.2.3).
3.3.1.7 Help
The menu “Help” contains following commands (see fig. 1.64):
Fig. 1.64. The menu “Help”
Command “About”. Display the current version of VSPBridge program.
3.3.2 Toolbar
Panels of tools are analogues of commands of the main menu. The program supports
four isolated panels which the user can switch on/off, and also adjust their place on the
screen.
3.3.2.1 Common tools
Fig. 1.65. The panel of tools “Common tools”
Contains commands on work with the document: creation, opening and saving the
document, and also a commands for working with History.
3.3.2.2 Data and layout tools
Fig. 1.66. The toolbox “Data and layout tools”
Contains commands of loading and adjustment of visualization parameters of objects
from Geoeast database (log curves, one-dimensional models and seismic data), and
also commands of addition and editing user markers.
3.3.2.3 Zoom tools
Fig. 1.67. The panel “Zoom tools”
Contains zooming tools (see item 3.3.1.3)
GeoEast-VSP project
© GEOVERS Ltd., BGP R&D Center, 2005
Bridge plot User’s Manual
11/28/2014Page 48 of 49
3.3.2.4 Edit and draw tools
Fig. 1.68. The toolbox “Edit and draw tools”
Contains commands for primitive drawing and editing (see item 3.3.1.4)
3.3.3 Status bar
The status line serves for a displaying of service messages, for example for a output of
the description of the chosen items in the menu.
3.4 Database context dialog. Authorization of the user.
At creation of the document, and also at its opening, the user should make connection
to database Geoeast. For this purpose it is necessary to specify a name of a database,
and also to enter authorization data: a name of the user of a database and the
password (see fig. 1.69).
Fig. 1.69. Dialogue of connection to Geoeast database
In case of incorrect filling data the connection will not be made, and the user will receive
the error message (see fig. 1.70).
Users data of the connection (except for the password) are kept inside of data of the
current document (tablet) and will be used for authorization at the subsequent opening
the given document.
To not enter anew data at connection or at creation of new documents, the user can
check item “Remember and use for all DB sessions” in dialog of connection. The
password thus is not kept.
Fig. 1.70. Authorization error
GeoEast-VSP project
© GEOVERS Ltd., BGP R&D Center, 2005
Bridge plot User’s Manual
11/28/2014Page 49 of 49
Without connection to a database the further work with the document is impossible (see
fig. 1.71). When user closes a program window, the action of an option “Remember and
use for all DB sessions” stops. For opening new documents in new session of work with
the program the user should be authorized anew.
Fig. 1.71. An error of document creation
If the user opens the document created by other user, he can specify own data for
connection to a database.
4 Using examples
N/A
GeoEast-VSP project
© GEOVERS Ltd., BGP R&D Center, 2005