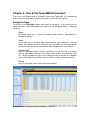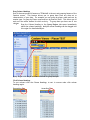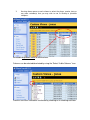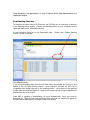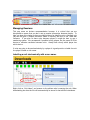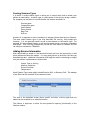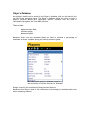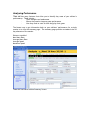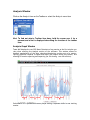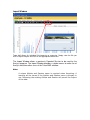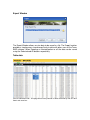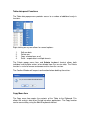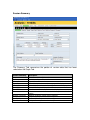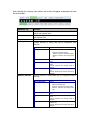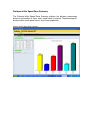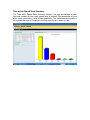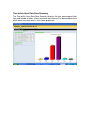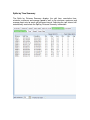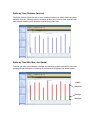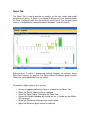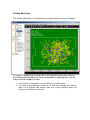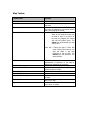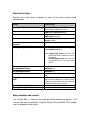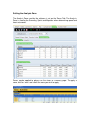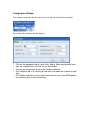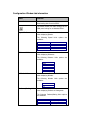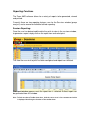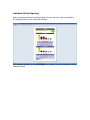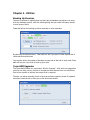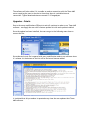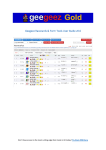
1
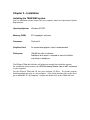
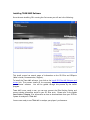
Copyright © 2001-2006 GPSports Systems.
GPSports TEAM Analysis User Manual
PN: 2005-12-24
March 2006
Version 1.5
GPSports Analysis is a trademark of GPSports Systems.
Postal Address:
GPSports Systems
GPO Box 2374
Canberra City
ACT 2601
Australia
Web :
Email :
http://www.gpsports.com
[email protected]
Chapter 1 - Introduction .........................................................................4
SPI Elite ........................................................................................... 4
TEAM AMS......................................................................................... 4
PerfectSession ................................................................................... 4
Chapter 2 – Installation ..........................................................................5
Installing the TEAM AMS system. .............................................................. 5
Installing TEAM AMS Software............................................................... 6
Chapter 3 - Tour of the Team AMS Environment............................................7
Navigation Panes.............................................................................. 7
Advanced reporting functions – 3 mouse clicks. ........................................10
Downloading Sessions ..........................................................................11
Managing Sessions ..............................................................................12
Labelling a unit electronically with a user name. ......................................12
Creating Sessions Types.....................................................................13
Adding Session Information ...................................................................13
Player’s Database ..............................................................................14
Analysing Performance ........................................................................15
Analysis Window ................................................................................16
Analysis Graph Window .....................................................................16
Import Window...............................................................................17
Export Window ...............................................................................18
Table data ....................................................................................18
Table data panel Functions ................................................................19
Copy Menu Item..............................................................................19
Session Summary.............................................................................20
Distance within Speed Zone Summary ....................................................22
Distance within Speed Zone Summary ....................................................22
Time within Speed Zone Summary ........................................................23
Time within Heart Rate Zone Summary ..................................................24
Splits by Time Summary ....................................................................25
Splits by Time (Distance Covered) ........................................................26
Splits by Time (Min, Max, Ave Speed) ....................................................26
Sprint Tab .......................................................................................27
Map Tab..........................................................................................28
Overlay Menu Item ..........................................................................29
Map Toolbar ..................................................................................30
Map Shortcut Keys ...........................................................................31
Map orientation and rotation ..............................................................31
Accelerometer Tab.............................................................................32
Body Load.....................................................................................33
Impacts........................................................................................34
Zones.............................................................................................35
Zone Tab ......................................................................................35
Zone Toolbar .................................................................................36
Speed Zones ..................................................................................36
Setting the Analysis Zone...................................................................37
Configuration Window ......................................................................38
Configuration Window tab information...................................................39
Reporting Functions............................................................................40
Session Reporting: ...........................................................................40
Individual Athlete Reporting ...............................................................41
Chapter 4 - Utilities............................................................................. 42
Backing Up Sessions ............................................................................42
Team AMS Upgrades............................................................................42
Upgrades – Details ...........................................................................43
Upgrading Firmware ...........................................................................44
Procedure for Upgrading Firmware in SPI Elite .........................................44
Glossary:.........................................................................................45
Chapter 1 - Introduction
GPSports has developed the SPI-Elite to allow coaches and conditioners to examine the
performance of their athletes with a view to ensuring their best performance on game
day. The SPI-Elite System can help you to identify over-training, record game style,
and allow you to ensure that your player is training appropriately for the way they
need to play the game. The SPI-Elite System allows you to accurately capture data
about athletes’ performance that previously was too difficult to collect. It ensures
that you know how far and how hard your athletes have run during training or during a
game so you can ensure they have appropriate recovery before their next game or
training session. It allows you to make sure your players are always fit and primed for
game day.
SPI Elite
The SPI Elite is a small device worn in a specially designed mini back pack under the
athlete’s top. It records position, time, body movements, impacts and heart rate
continuously. The information recorded can be analysed post game or session to
provide the coach or conditioner with detailed information about the session AND its
impact on the athlete.
The operation of the SPI Elite is simple. Once it is turned on it searches for satellites
to determine it’s position – this may take a few moments. Once it has established its
location the SPI Elite Beeps 3 times and it starts recording session information. It will
continue to collect session information until the unit is turned off. Because positional
information requires satellites it can only be used outdoors. With the exception of
turning the SPI Elite Units on when connected to the SPI Elite Docking Station please
avoid turning the units on indoors.
TEAM AMS
Team AMS is the software that manages and analyses session data collected from the
SPI Elite. This software will generate reports on your players and training sessions. It
allows you to compare sessions, athletes and to look at performance trends of your
players, look for signs of over or under training or stagnation. It will allow you to
deliver the promises of periodisation and have your players performing their best on
game day.
PerfectSession
PerfectSession is GPSports’ on line training software. It integrates with both the TEAM
Analysis software and the SPI Elite. This means that coaches can monitor the
performance of their athletes when the players are on tour. PerfectSession has many
of the basic features of TEAM AMS and is invaluable for keeping in touch with player
performance. For more detailed information on the features of PerfectSession please
visit www.perfectsession.com.
Chapter 2 – Installation
Installing the TEAM AMS system.
Prior to installation please ensure that you computer meets the Operational System
Requirements.
Operating System:
Windows XP SP2
Memory (RAM):
512 megabytes minimum
Processor:
Pentium IV
Graphics Card:
An accelerated graphics card is recommended
Disk space:
100 MB for initial installation.
Additional disk space is required to store the Athlete
and Analysis databases.
The GPSports TEAM AMS software will guide you through the installation process.
For installation please ensure your SPI Elite Docking Station Case is NOT connected
to your computer.
Put the GPSports TEAM AMS CD into your computer CD Drive. The install program
should automatically start in a few moments. If the install software fails to auto start
got to WINDOWS XP “My Computer” window and double click on the TEAM AMS icon.
Installing TEAM AMS Software
Once the auto installing CD is running the first screen you will see is the following:
This install screen has several pages of information on the SPI Elite and GPSports
(What’s Inside, Documentation, Support).
To install the Team AMS software, just click on the Install SPI Elite AMS Software and
drivers link. This process installs all the necessary software to manage and analyse
your athletes’ sessions. You will be guided through this process by the install
program.
Team AMS is now ready to use, you can now connect the Elite Docking Station and
access training information stored in your SPI Elite units. Please refer to the Quick
Start Guide or Chapter 3 for information on how to download data from your SPI Elite
System for analysis in TEAM AMS.
You are now ready to use TEAM AMS to analyse your players’ performance.
Chapter 3 - Tour of the Team AMS Environment
There are a few simple rules to remember when using Team AMS. By remembering
these rules you will be able to explore the features of the SPI Elite System.
Navigation Panes
To the left of the TEAM AMS window are 4 panes for navigation. If you want to go to a
particular area in TEAM AMS examine the options in the Navigation Panes. The panes
consist of;
Finder
This pane allows you to access information about Players, Downloading or
Analysis of Sessions.
Views
Views allow you to examine data using standard view templates. You can
modify our standard views to develop a view that allow you to access special
information that you need to understand what is happening to your athletes.
Custom Views
Once you have generated a view for reporting, you can save this as a custom
view by right mouse clicking in the Custom View window and selecting “Save
As”. You are prompted to type in the name you wish to use and this template
view is then added to this pane until you decide to either rename or remove.
History
A list of the 8 most recent views you have examined.
Navigation Panes to the left of main window in Team AMS
Drag Column Headings
One of the most powerful features of TEAM AMS is the sort and grouping feature of the
Sessions screen. This feature allows you to group data from any data set or
characteristic of your data. For example you can group by player name and sort by
session type. Or group by Player name and sort by exertion level. This allows you to
work out who works hardest at which activity. To group data you have one of two
choices:
1.
Drag the Column Heading to the Query Region (the space immediately
above the column headings). Multiple column headings can be dragged into
this region for detailed analysis.
Query Region with Player and Zone selected for group analysis.
Click Column Headings
To sort columns click the Column Headings, to sort in reverse order click column
headings again.
Descending files
Ascending Files
2.
Use drop down menus on each column to select the player, session, date or
any other variable(s) that you may wish to use to develop a printable
template.
Selectable drop down menu for each column.
Columns can be selected/deselected by using the “Select Visible Columns” icon.
Columns are either selected or unselected by checking or un-checking each box.
Advanced reporting functions – 3 mouse clicks.
Team AMS has the capability to develop advanced reports. They can be
developed by building multiple column comparisons using the Filter Builder. This
feature can be found by clicking on any of the down arrows and selecting the
Custom link.
Selecting Down
Arrow brings
up menu –
select
(Custom…)
to view Report
Builder.
This feature allows for the development of weekly reports comparing athlete to
athlete, position to position and session to session.
A template can be generated that automatically adds new sessions as they are
added to the database – allowing for updated reports to be easily generated each
week.
Once templates are generated it is only 3 mouse clicks from download to any
report you require.
Downloading Sessions
To download a session from a SPI Elite turn the SPI Elite unit on and place it securely
in the Docking station cradle. Connect the docking station to your computer via the
cable and start up the TEAM AMS software.
In the Navigation Pane go to the Downloads page.
Station” option is checked.
Ensure that “Enable Docking
Turn Elite Units On.
If you are downloading data from the SPI Elite Units they should be Turned On and
placed in the SPI Elite Docking Station. Units that are switched off will not be
recognised even though they are in the docking station. Units placed in the docking
station when the Docking Station is connected to power will be charged regardless of
whether the unit is ON or OFF.
Team AMS is capable of downloading all units automatically. Once you click on
Download All, Team AMS will then download each unit and the results will appear in
the pain below outlining date and time, player and session.
Download screen with most recent downloaded files and information of each session.
Managing Sessions
This may seem an obvious recommendation however it is critical that you are
disciplined to ensure that you don’t mix up session information between players. To
help you keep this simple we have provided stickers for labelling units, and each unit
can also be given a unique electronic name to identify the unit in the TEAM AMS
Software. If you plan to share units between players it might be best to use a
numbering system. We recommend if possible having players use the same SPI Elite
device to minimise confusion between units. Always note clearly which player has
which device.
If units are going to be used exclusively by a player it is good practice to label the unit
the player’s name or nick name.
Labelling a unit electronically with a user name.
Right click on “Unit Name” and rename to the athlete who is wearing the unit. When
downloading the data the file will automatically be stored in that athlete’s database.
Creating Sessions Types
It is useful to create session types to allow you to record what kind of session your
athlete is undertaking. A session type is a description of the activity during a session.
For example you may want to record whether the session recorded is a:
-
Practice game
Competition game
Speed Session
Power Session
Beep Test
Drill etc.
As above it is important to have consistency in assigning these descriptors to Sessions.
The most useful session type is one that describes the activity, and perhaps the
intensity. It is not generally useful to add a time element to the session type. For
example 20 minute speed session or 40 minute speed session are largely redundant
descriptors. Your SPI Elite automatically records the time aspect of sessions and this
can easily be reviewed in TEAM AMS.
Adding Session Information
After downloading a session in the download screen you have the opportunity to add
extra information about the session. It is very good practice to do this at the time you
download the data. Additional information that might be useful in obtaining an insight
into your athlete’s performance could include:
-
Session Type or Activity,
Weather conditions,
Ground Condition,
Temperature
Useful Session Type names might include Exertion Drill, or Recovery Drill. The makeup
of the Drills can be recorded in the comments field.
Tempo
Running
David
The area in the download screen where specific activities, activity types and unit
names can be attached to an individual session.
This feature is important to allow for more powerful reporting functionality in the
Sessions window.
Player’s Database
An athlete’s details can be stored in the Player’s database (link can be found in the
top left Finder navigation pane). The Player’s database allows the coach to input a
player’s personal details and importantly specific variables that are used in
calculations throughout the Team AMS software.
These include:
-
Maximum Heart Rate,
Athletes weight,
Maximum Speed.
Maximum heart rate and maximum speed are used to evaluate a percentage of
maximum for these variables during any training session or game.
Key data in each player’s database is used in
the calculation of certain functions in TeamAMS.
Weight is used in the calculation of body load and impacts,
Maximum Heart Rate is used in the calculation of percentage of maximum heart rate
when comparing athletes.
Analysing Performance
TEAM AMS has many features that allow you to identify key areas of your athlete’s
performance. These include:
Their strengths and weaknesses
Where they need to improve game performance
How they need to train for how they play their game
The fastest way to get information back on your athletes’ performance for a single
session is to view the summary page. The summary page provides a standard view of
key elements of the session.
Distance travelled
Max Heart Rate
Average Heart Rate
Average Speed
Maximum Speed
Team AMS Individual Athlete Summary Screen.
Analysis Window
Click on the Analysis item on the Toolbar or select the Analysis menu item
Hint: To find out what a Toolbar item does, hold the cursor over it for a
moment and a hint is displayed describing the function of the toolbar
item.
Analysis Graph Window
Team AMS displays the raw GPS/Heart Rate data of any session as the first window you
view when entering the Analysis section of the software. This window allows for
detailed manipulation of the data, selecting/deselecting certain parts of a session,
viewing graphical response to speed and heart rate output during any session, and
allowing for session exporting and importing (for file sharing – see next section).
Performance of a professional soccer player during 4 separate drills in one training
session.
Import Window
Team AMS allows for individual file importing or exporting. Simply view the file you
wish to import/export and click on the appropriate menu icon.
The Import Window allows a previously Exported Session to be used by the
Analysis program. The Import Window provides a simple means to make use of
Analysis data from other users of the Team AMS software.
Note:
A unique Athlete and Session name is required when Importing. A
warning will be issued if the Athlete and Session name is already in
use. Renaming the existing Athlete and Session will permit the Import
of the data.
Export Window
The Export Window allows session data to be saved in a file. The Export function
provides a simple means to exchange Analysis data with other users of the Team
AMS software. When Exporting a selected portion or all the data can be saved
using the Selected and All buttons respectively.
Table data
View of table data tab – this page shows every second of data collected by the GPS and
heart rate receiver.
Table data panel Functions
The Table data popup menu provides access to a number of additional analysis
functions.
Right clicking on any row allows for several options:
1.
2.
3.
4.
Edit row data
Delete row
Copy selected rows or all
Save – export data in multiple formats.
The Delete popup menu item and Delete keyboard shortcut allows both
individual and multiple entries to be deleted from the session data. The Delete
function is useful to remove extraneous entries from the session.
The Confirm Window will request confirmation before deleting the entries.
Copy Menu Item
The Copy menu item copies the contents of the Table to the Clipboard. This
allows the analysis data to be Pasted into other applications. The Copy function
can be accessed by using the Ctrl C keyboard shortcut.
Session Summary
The Summary Tab summarizes the portion of session data that has been
selected on the Graph Tab.
Session Summary
Description
Start
End
Interval
Speed
Heart Rate
Total Distance
Zonal Distance
Comments
Start date and time of the session
End date and time of the session
Elapsed time of the session
The minimum, maximum and average speed is displayed
The minimum, maximum and average heart rate is displayed
The total distance is displayed
The distance within the speed zones is displayed
Allows comments to be entered which maybe saved to that
session
Weather conditions maybe entered manually
Temperature may be entered manually
Track condition maybe entered manually
Track position maybe entered manually
Weather Conditions
Temperature
Track position
Track condition
After selecting the summary tab, another row of tabs will appear underneath the menu
bar and includes:
Summary Tab
Function
Distance
Displays distance and % of total distance within speed zones in
tabular and graphical form
Displays time and % of total time within speed zones in tabular
and graphical form
Displays time and % time within heart rate zones
Time
Heart Rate
Splits by Time
Displays summary of session data split by configurable time
intervals.
Summary Tab
Speed/Heart Rate
Function
Displays :
1.
2.
3.
Distance
Speed
Heart Rate
Splits by Distance
Split and cumulative distance
Minimum, maximum and average speed
Minimum, maximum and average heart
rate
Displays Distance-Time splits in graphical
format
Displays Speed-Time splits in graphical
format.
Minimum, Maximum and Average speed is
displayed
Displays Heart Rate-Time splits in graphical
form
Minimum, Maximum and Average heart rate is
displayed
Displays summary of session data split by configurable distance
intervals.
Summary Tab
Speed/Heart Rate
Function
Displays :
1.
2.
3.
Time
Speed
Heart Rate
Split and cumulative time
Minimum, maximum and average speed
Minimum, maximum and average heart
rate
Displays Time-Distance splits in graphical
format
Displays Speed-Distance splits in graphical
format.
Minimum, Maximum and Average speed is
displayed
Displays Heart Rate-Distance splits in
graphical form
Minimum, Maximum and Average heart rate is
displayed
Distance within Speed Zone Summary
The Distance within Speed Zone Summary displays the distance, percentage
distance and number of times each speed zone is entered. The percentage of
distance within each speed zone is also shown graphically.
Distance within Speed Zone Summary
Time within Speed Zone Summary
The Time within Speed Zone Summary displays the time, percentage of total
time and number of times each speed zone is entered. The percentage of time
within each speed zone is also shown graphically. The speed exertion number is
an accurate portrayal of the players running intensity for a given session.
Time within Heart Rate Zone Summary
The Time within Heart Rate Zone Summary displays the time, percentage of total
time and number of times a heart rate zone was entered. The percentage of time
within each heart rate zone is also shown graphically.
Splits by Time Summary
The Splits by Distance Summary displays the split time, cumulative time,
minimum, maximum and average speed as well as the minimum, maximum and
average heart rate for each split distance interval. Adjusting the split interval will
automatically recalculate the Split by Distance Summary information.
Splits by Time (Distance Covered)
The Splits feature allows the user to view a session broken into either time intervals or
distance intervals. Showing below is a session broken into 5 minute time intervals with
each interval detailing total distance covered during that time.
Splits by Time (Min, Max, Ave Speed)
The user can also view maximum, average and minimum speeds achieved for any time
period giving an indication of intensity of performance throughout the session/game.
SPEED
Maximum
Average
Minimum
Sprint Tab
The Sprint Tab is used to perform an analysis of the time, length and length
distribution of sprints. A Sprint is considered to be present if the speed exceeds
the Zone 4 setting for more than the minimum sprint interval. The minimum sprint
interval is configurable in second increments between 1 and 30 seconds.
Sprint Analysis is useful in determining training strategies for activities where
Sprint/Rest Intervals are present. The Sprint Interval Distribution graph instantly
shows the sprint requirements for the activity.
To perform a Sprint analysis for a session:
•
•
•
•
•
•
Ensure an appropriate Analysis Zone is selected on the Zones Tab
Adjust the Zone 4 Speed setting as required
Select the Sprint Tab by Clicking on the Sprint Tab
Expand the Athlete grouping by clicking on the + symbol on the AthleteSession panel
Select the Session by clicking on the session name
Adjust the Minimum Sprint Interval as required
The Sprint Analysis will be automatically updated when any changes to the
Minimum Sprint Interval are made.
Map Tab
This is one of the features of the Team AMS that is only capable due to the positioning
feature of GPS. This feature allows for the exact movements of a player to be shown
from a “birds eye view”.
The above image is of a professional soccer player playing one half of football. The
different colours on the image represent different speed zones (or heart rate zones).
For example, walking is displayed in yellow, jogging in blue, running in red and the
remainder are sprint performance.
Overlay Menu Item
The Overlay Menu Item is used to mark a session of data for use as an Overlay.
An overlay is displayed on the Map Tab in white behind all other data. Overlays
are used primarily to display the outlines or boundaries of playing fields, but can
also be used to compare sessions.
1. The Overlay is displayed in white behind the session data.
2. The map is automatically resized to fit both the Overlay and session
data. If the Overlay and session data are a large distance apart the
map will be difficult to interpret.
Map Toolbar
Toolbar Item
Function
Print
Reset Zoom
Prints the Analysis Window.
Reset the Zoom level to display the entire
map area.
Allow the map to be panned Left, Right, Up
and Down by holding the left mouse button
down and dragging the mouse
Zoom In – Places the map in ‘Zoom In’ mode.
When in this mode the mouse can
be used to zoom in a portion of
the map by dragging the mouse
with the left button down. The
Insert key will decrease the map
size by 25%.
Pan
Zoom In / Out
Zoom Out – Places the map in Zoom Out
mode. Clicking the mouse on the
map will result in the map
increasing in size by 25%. The
Delete Key also performs the
same function.
Ruler
Statistics
Rotate CW / CCW
Reset Rotation
Show / Hide Points
Show / Hide Overlay
Speed / HR
Zone 1 – 4
The Ruler toolbar item permits the
measurement of distances on the map by
drawing line segments on the screen.
Show the Statistics Window.
Rotates the map Clockwise (CW) and
Counter-clockwise (CCW).
Resets any rotation applied to the map data.
Shows or hides the data points on the map.
Shows or hides the overlay data points on
the map.
Selects the display of Speed or Heart Rate
data on the map.
Permits the information for individual zones
to be shown or hidden.
Map Shortcut Keys
Shortcut keys have been assigned for some of the more common map
manipulations.
Action
Shortcut keys
Panning Map Up, Down, Left, Right Use the Left, Right, Up and Down Arrow
keys to move the map centre point.
Aligning the Map to Overlay data.
Hold the Alt key down and press the Left,
Right, Up or Down Arrow keys.
Rotating the Map Clockwise
Hold the Shift key down and press the
Right Arrow key down.
Rotating the Map Counter-clockwise
Hold the Shift key down and press the Left
Arrow key down.
Removing one or more Ruler line Press the Backspace key.
segment
Removing all the Ruler line segments
Press the ESC key.
Moving the highlighted section
Hold the Control key down and press the
Left or Right Arrow keys.
Note: Control-Left Arrow will move the
highlighted section towards the end of
the session
Control-Right Arrow will move the
highlighted section to the start of the
session
Removing a segment from the start of Hold the Control key down and press the
the highlighted section
Backspace key
Removing a segment from the end of Hold the Shift key down and press the
the highlighted section
Backspace key
Showing/Hiding Zone data
Press 1, 2, 3 or 4 to show and hide zone
data
Toggling between Speed/Heart Rate Press S to switch between the display of
data
Speed and Heart Rate data. The Map Toolbar
will displaywhen Speed data is present and
♥ when Heart Rate data is present.
Showing/Hiding Overlay data
Press O to show or hide the overlay data
Showing/Hiding the data points
Press P to show or hide the data points
Map orientation and rotation
The session data is shown on the map with North upwards by default. The
session data may be rotated by using the Rotate CW and Rotate CCW Toolbar
items or keyboard shortcut keys.
Accelerometer Tab
The SPI Elite has the additional functionality of a Tri-Axis Accelerometer. This device
measures accelerations and decelerations of an athlete during any activity.
Team AMS is able to evaluate several outputs from this device and using data from the
Player’s database can supply the coach with very valuable information about an
athlete and how they are performing in a session or game.
Raw Accelerometer data output. The Red, Yellow and Green graphs are the raw
Accelerometer data in three planes (X, Y, Z), the blue graph is the summation of the
three axis.
GPSports is working closely with several clients to evaluate further valuable output
from this device – currently we are able to supply clients with two new variables that
have shown to supply new information on a player performance that has been
previously unattainable (See below).
Body Load
Taking into account a player’s weight, GPSports is able to measure an athlete’s “Body
Load”. This is the sum of all forces placed on an athlete during activities such as
accelerating, decelerating, changing directions & jumping (Measured in G-Forces).
This score is similar to the Speed Exertion score using in many sports with the SPI 10
GPS device, it allows for bench marks to be set for players, can be used in comparison
between players, positions, a single player over time and used as a measure of
workload (and subsequent recovery) between training sessions.
Body Load output from a team sport athlete. The loading is broken into zones and a
Total Body Load score is generated allowing for accurate analysis over time of an
athlete’s adaptability to training.
A key use of “Total Body Load” is setting total workloads for an athlete throughout a
training week. Once the athlete has achieved/exceeded this previously determined
value, the athlete is instructed to complete low intensity or recovery sessions for the
remainder of the week, this has reduced injury in players in many different codes of
football and has allowed the coaches to have an objective analysis of total intensity of
training sessions and training weeks.
Impacts
Recent research into impacts in contact sports has highlighted that there is much
greater muscle damage done to an athlete than previously thought. The level of
muscle damage affects the recovery time of an athlete and better understanding of
how much impact has taken place will allow coaching staff to develop more
appropriate training and recovery routines for their athletes.
GPSports SPI Elite is capable of measuring impact loads (in G-Forces) allowing coaches
to gain insight into the physical stress placed on each player during a session or game.
Impacts measured during a training session. Team AMS records the intensity (hardness)
of each impact and the total number of impacts sustained during any one session.
Both Body Load and Impacts are based on GPSports standard 6-Zone structure. Zones
can be individually set for each athlete or position. Team AMS inserts default zones
that can be easily modified (in the Zones tab).
Zones
Zones form the basis of the analysis performed by the Team AMS software. Zones allow
6 ranges of Speed and Heart Rate to be set and used for analysis.
Note: Setting an Analysis Zone that is not suited to the type of activity being analysed
may lead to misleading or confusing results. Make sure you select an appropriate
Analysis Zone with on the Zone Tab.
The Team AMS software allows the user to Insert, Delete and Modify the Zones.
Zone Tab
The user can set a variety of zones, speed, heart rate, exertion and accelerometer
zones to best customise the software for their needs.
GPSports has attempted to supply template zones for all major sports, these are to be
used as examples only and your own zones may need to be set to best reflect your
athlete output.
Zone Toolbar
Print
Insert
Report
Cancel
Delete
Save
Toolbar Item
Function
Print
Report
Prints the Zone window.
The Report Toolbar item will generate a
report of the zone configuration.
Inserts a new zone entry.
Delete the currently selected zone
Cancel any changes mode to the current
zone.
Save any changes made to the current zone.
Insert
Delete
Cancel
Save
The Team AMS software has been pre-configured with several set Zones (eg team
sports, cycling, running, walking etc). These zones may be adjusted to the user's
specific requirements or entirely new Zones added.
Speed Zones
The speed zones are supplied in km/h. If units other than km/h are used or you
frequently change speed units, it is suggested that new zones are added for each of
the units required. Appending the speed units to the end of the zone name such as
Rowing (km/h) or Rowing (m/s) is a simple method of keeping track of the different
speed zones.
Setting the Analysis Zone
The Analysis Zone used by the software is set on the Zones Tab. The Analysis
Zone is used by the Summary, Sprint and Map tabs when determining speed and
heart rate zones.
Zones maybe applied to players on the views or summary page. To apply a
zone, click on ‘zone’ and select the zone you wish to apply.
Configuration Window
This window is selected from the menu list at the top left of the software window
Once clicked the following window appears.
•
•
•
•
•
Click on the appropriate tab to select Units, Map or Sprint configuration items
Alter the required items and Click on the Save button
Click on the Close button to close the Configure Window
The Database tab is for setting up how often you would like to back up your
data
The Updates tab allows you to select auto check for new Team AMS updates
or manually check at your convenience.
Configuration Window tab information
Item
Function
Com Port
Set the COM Port to be used
downloading data from the SPI10.
when
The Search button will scan through the PC
COM ports looking for an attached SPI10.
Speed Units
Shows the measurement units to be used
when displaying Speeds.
The following
available:
Speed
Options
Km/h
m/s
Mph
Knots
Distance Units
Units
options
are
Description
Kilometres per hour
Metres per second
Miles per hour
Knots
Shows the measurement units to be used
when displaying Distances.
The following Distance Units options are
available:
Options
Metres
Kilometres
Yards
Miles
Furlongs
Metric Furlongs
Altitude Units
Shows the measurement units to be used
when displaying Altitude.
The following Altitude Units options are
available:
Options
Metres
Feet
Cadence/Rating Units
Shows the measurement units to be used
when displaying Cadence or Rating data
The following Cadence/Rating Units options
are available:
Options
Disabled
s/m
rpm
Description
Cadence/Rating not used
Strokes per minute
Revolutions per minute
Reporting Functions
The Team AMS software allows for a variety of reports to be generated, viewed
and printed.
Currently there are two reporting features, one for the Sessions window (group
analysis) and a second for individual athlete reporting.
Session Reporting:
Once the user has determined the data they wish to view in the sessions window,
to generate a report simply click on the report icon and select print.
The view the user wish to print has been configured and report icon selected.
The report window appears once the report icon is selected. A direct report can
be generated from this window.
Hint: To find out what a Toolbar item does, hold the cursor over it for a moment and a hint
is displayed describing the function of the toolbar item.
Individual Athlete Reporting
When reviewing an athlete’s individual data, the user can print from any window in
the Analysis feature of the Team AMS Software.
This is an example of a typical report page when printing from the Summary tab in the
Analysis window.
Chapter 4 - Utilities
Backing Up Sessions
The user is advised to regularly back up their data as database corruptions can occur
with any database system, with the resulting being that you could lose many months
or even years of data.
Team AMS allows for backing up either manually or auto reminders.
By selecting the backup button, Team AMS will ask if you want to back up and that it
could take several minutes.
You can also select the number of backups to keep and at the end of each week Team
AMS will ask you if you wish to back up your data.
Team AMS Upgrades
The Team AMS software is a continuous “Work in Progress”. With each new suggestion
given by our many clients, we aim to incorporate these features into our software as
soon as we are able to achieve the output that is required.
The user can either manually check or have the software regularly check for updates
and when found will ask to take you to the download window.
The software will also advise if it is unable to make a connection with the Team AMS
server requiring the user to check at a time when there is a suitable internet
connection. Typical download sizes are around 12-15 megabytes.
Upgrades – Details
Due to the many modifications GPSports is and will continue to make to our Team AMS
software – we supply the user with a feature update list with each update installed.
Once the update has been installed, the user can go to the following menu item to
access this file:
Once selected a text file is opened with every modification made to our software since
it’s release. At the bottom of the list will be the latest features added.
It is advised that this procedure is repeated every time the user updates their Team
AMS software.
Upgrading Firmware
Occasionally there may be the need to update/upgrade the software that runs the SPI
elite unit. In this case the updating of SPI Elite software (known as firmware) is a
follows:
Procedure for Upgrading Firmware in SPI Elite
1. Connect power to SPI Elite docking station and connect docking station to PC.
Start Team AMS application
2. Turn SPI Elite on and place in a docking station cradle.
3. Select ‘Downloads’ from the Navigation pane of the TEAM AMS window and
ensure that ‘enable docking station’ is checked. The software will go through
the auto find sequence.
4. Once SPI Elite units have appeared in the Docking Station Pane, click on the
“+” symbol to access the ‘configuration’ option and select it.
5. Right click on ‘version’ and select ‘upgrade’.
6. Using this Dialog, navigate to the upgrade file and click on open. The upgrade
file will be named something like eliteVxxx.hex
7. -Click YES to proceed with upgrade.
8. “Upgrade file copied successfully” will appear when transfer is complete. Click
OK and remove SPI Elite from docking station and turn SPI Elite off.
9. Press and hold the button on the SPI Elite until 5 lots of 3 beeps is sounded,
then release the button. The left power LED will now flash twice per second
indicating the upgrade is ready to proceed.
10. Press and hold the button on the SPI Elite until a double beep sounds and
then release. The left LED will flash RED quickly for a time. The SPI Elite will
sound a series of beeps before turning itself off.
To confirm upgrade, turn SPI Elite on and replace in docking station. Open
configuration folder and note firmware version number.
Glossary:
Body Load: The collation of all stresses placed upon an athlete during a session or
game. These stresses includes acceleration deceleration change of direction impacts
(players and foot strikes) and takes into account the athletes body weight.
Exertion Index (Heart Rate): The Heart Rate Exertion Index calculation is based on
the time spent in each Heart Rate zone weighted for each zone. This measure is an
effective way to perform comparative analysis between sessions of an individual
athlete or between athletes.
Exertion Index (Speed): The Speed Exertion Index calculation is based on the time
spent in each Speed Zone weighted for each zone. As with the Heart Rate Exertion
Index above it is an effective way to compare sessions of an individual athlete or
comparing athletes across a Session Type or Activity. It provides a clear indication of
the running intensity of the session.
Finder: The Finder is part of the Navigation Pane that allows you to access
information about; Sessions, Athletes, Analysis or Downloading Sessions.
Heart Rate: Heart Rate is a measure of the number of heart beats per minute. To
collect Heart Rate data using the SPI Elite the athlete must be wearing a GPSports
Heart Rate Strap or other PolarTM compatible Heart Rate Strap.
Heart Rate Zones: See Zones – Heart rate below.
History: History forms part of the Navigation Pane that allows you to easily access
your last 8 Views of data.
Impacts: The Impact measure in TEAM AMS reports on the number (count) of impacts
of various intensities experienced by the athlete. Impact intensity is broken up in
Zones. Impacts include all impacts experienced by the athletes during a session
including tackles, bumps, and foot strikes.
Impact Zones: See Zones – Impact Below.
Navigation Panes: The area on the left of TEAM AMS that allows you to navigate
through the various features of the TEAM AMS to analyse athlete performance.
Maps: Maps forms part of the Navigation Panes. It allows you to examine how your
athlete moves on the field or during exercise.
Sessions: A session is any single recorded set of data recorded by your SPI Elite
assigned to an athlete.
Session Type: The planned activity or game undertaken by your athlete and recorded
by your SPI Elite.
Speed Zones: See Zones – Speed below
Sprint Intervals: In TEAM AMS Sprint Interval generates a report on Zone 6 speed
data. TEAM AMS provides a count of how many times Zone 6 speeds were obtained
during a session and when they occurred. It also provides information on the time
spent in the highest speed zone, and the highest speed achieved.
Views: A view a way of creating a standard template to examine any set of data.
TEAM AMS comes with some standard Views and also allows you to create your own
custom views to suit your needs.
Right Click: Most computer mice have 2 buttons the left button performs a standard
click function and the right button provides quick access to other menu options.
Zones:
-
Heart Rate:
Impact:
Speed:
Zones in TEAM AMS are used to divide activity into 6 bands. Heart Rate, Impact, and
Speed data are all broken into 6 Zones. Zone 1 indicates the lowest effort or lowest
impacts; Zone 6 indicates the highest effort or the highest impacts. Zone details can
be used to assess or analyse a training session, they can also be used to compare
player performance or session intensity. Zones can be selected for various sports or
can be customised for your needs. For more information about Zones see chapter x.