1
Release 2.6
User Manual
Michael Kläs 27.06.2011
i
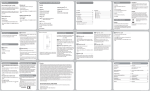
Table of Contents
A
A.1
A.2
The Installation
JAVA Runtime Environment Installation
COBRIX Installation
1
1
1
B
B.1
B.2
B.3
B.4
B.5
B.6
B.7
B.8
B.9
B.10
B.11
B.12
B.13
B.14
B.15
B.16
B.17
B.18
B.19
B.20
B.21
B.22
Usage of COBRIX
Starting COBRIX (CoBRA Project Selection Dialog)
Import CoBRA Project
Initialization of a New CoBRA Project
CoBRA Process Overview
Export CoBRA Project
Import Cost Factors
Synthesize Organization-Relevant Cost Factors
Export Cost Factors
Expert Management
Cost Factor Ranking by Experts
Choose Most Important Cost Factors
Build Causal Model
Collect Multiplier Data
Synthesize Multiplier Data
Choose Past Project Data Type
Elicitation of Past Project
Validation of the CoBRA Model
Enter New Project Data
Project Simulation
Estimate Project Cost
Analyze Project Cost Risk
Benchmark Projects
2
2
3
4
5
6
7
8
9
9
10
12
14
22
25
26
26
28
33
35
36
37
38
C
C.1
C.2
C.3
C.4
C.5
C.6
C.7
C.8
Configuration File
Causal Model Visualization
Predefined Scale Types
Predefined Cost Factor Categories
Change DB Server Settings
Debug Settings
Productivity Model
Project Simulation
Other Properties
40
40
40
41
41
42
42
43
43
A
The Installation
The following installation description assumes that you are using a Microsoft
Windows PC. If you are using another operating system, the procedure may
be slightly different. The installation of the CoBRATM Tool CoBRIX is very
simple, but to execute CoBRIX, you must have installed the newest version of the Java Runtime Environment (or at least version 6 or higher),
which is available from the website www.java.com.
A.1
JAVA Runtime Environment Installation
If you have not installed Java in version 6 or higher or if you are not sure
which version of Java is installed on your computer, please go to
www.java.com and follow the installation instructions you find there.
A.2
COBRIX Installation
The installation of the CoBRA
TM
Tool itself is very simple.
Just unzip the folder ' CoBRIX_R2.5.2' in the CoBRIX_R2.5.2.zip file to a directory on your hard disk, e.g., 'C:\Program Files\CoBRIX'.
Usage of COBRIX
Starting COBRIX (CoBRA Project Selection Dialog)
B
Usage of COBRIX
In this section, we provide a short introduction on how the CoBRA Tool can
be used to collect data, build and validate an estimation model, and how to
use it for cost estimation, risk analysis, and benchmarking. We start by explaining how a new CoBRA project can be created and how an old one can
be reloaded.
B.1
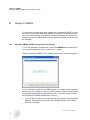
Starting COBRIX (CoBRA Project Selection Dialog)
To run the application, double click on the file 'COBRIX.exe', which can be
found on your hard disk in the 'COBRIX_R2.5.2' folder.
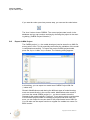
When you start the CoBRA Tool, a dialog similar to the one below appears:
You can choose to start a new CoBRA project (i.e., create a new model) by
pressing the 'New' button or continue working with an existing one by choosing the appropriate project and pressing 'Open', or you can import an XML
file containing a CoBRA model/project (‘Import’).
If you chose to work with an existing project, the project overview dialog
appears, showing the actual state of the CoBRA project (see CoBRA
Process Overview).
Copyright © Fraunhofer IESE 2011
2
Usage of COBRIX
Import CoBRA Project
B.2
If you chose to create a new CoBRA project, the first step is the project
initialization (see Initialization of a New CoBRA Project).
If you chose to import an XML file containing a CoBRA model, you can
select the XML in a file dialog (see Import CoBRA Project) and then return to the project selection dialog.
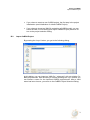
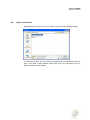
Import CoBRA Project
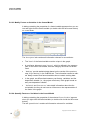
By pressing the 'Import' button, you get to the following dialog:
In this dialog, you can import an XML file ('.cobra.xml') with an existing CoBRA project/model. After choosing a file and pressing the 'Open' button, you
can choose a name for the imported CoBRA project/model. After a valid
name has been chosen, you return to the CoBRA Project Selection Dialog.
3
Usage of COBRIX
Initialization of a New CoBRA Project
B.3
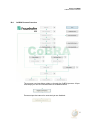
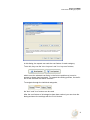
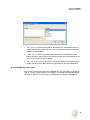
Initialization of a New CoBRA Project
First, you have to enter the project name. Then you can enter the context
(scope) of the CoBRA project. In addition, you should decide on the size,
cost, and experience metric you want to use.
The 'Ok' button brings us to the Process Overview Dialog.
Copyright © Fraunhofer IESE 2011
4
Usage of COBRIX
CoBRA Process Overview
B.4
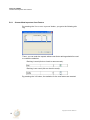
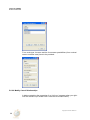
CoBRA Process Overview
The process overview dialog guides us through the CoBRA process. All process steps you can do next are shown as enabled buttons:
Process steps that cannot be executed yet are disabled:
5
Usage of COBRIX
Export CoBRA Project
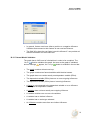
If you want do undo a previous process step, you can use the undo button:
The 'Done' button closes COBRIX. The current project state is safe in the
database and you can continue working by choosing the project in the starting dialog (‘CoBRA Project Selection’).
B.5
Export CoBRA Project
The CoBRA project, i.e., the model developed, can be stored in an XML file
at any point in time. This is especially useful after the validation of the model
is completed successfully. To export the current CoBRA project/model,
press the 'Export CoBRA Project' button. The following dialog appears:
In this dialog, you can export our model as a CoBRA Project XML file
(*.cobra.xml).
Remark: Modifications made during the different steps of model development are stored directly in the current model. Modifications also remain if
you leave the actual CoBRA project (i.e., you do not need to store the
changes in the model explicitly). However, if you want to store a certain state
of the CoBRA project/model or exchange a project/model with other persons, you can export the current state of the project/model as an XML file.
You can also use the export function to migrate our models to a newer CoBRIX version.
Copyright © Fraunhofer IESE 2011
6
Usage of COBRIX
Import Cost Factors
B.6
Import Cost Factors
By pressing the 'Import Cost Factor' button, you get to the following dialog:
In this process step, you can import a proposal list of predefined cost factors. If you want to start without using such a list, you can load 'empty.cff',
which contains no cost factors.
7
Usage of COBRIX
Synthesize Organization-Relevant Cost Factors
B.7
Synthesize Organization-Relevant Cost Factors
By pressing the 'Synthesize org. rel. CF' button, you get to the following dialog:
This dialog shows all cost factors that are mentioned as relevant in the
scope of the CoBRA project and should therefore be ranked by the experts.
When selecting a cost factor, its definition and its extreme case (worst case)
are shown.
You can remove cost factors that are not relevant in our context. In addition,
existing cost factors can be modified and new cost factors can be created.
Copyright © Fraunhofer IESE 2011
8
Usage of COBRIX
Export Cost Factors
B.8
Export Cost Factors
By pressing the 'Export Cost Factors' button, you get to the following dialog:
In this dialog, you can export our modified list of cost factors as a cost factor
file (*.cff) in XML format. You can reuse this modified list of cost factors, for
example, in later CoBRA projects.
B.9
Expert Management
By pressing the 'Add/Modify Expert' button, you get to the following dialog:
9
Usage of COBRIX
Cost Factor Ranking by Experts
This dialog allows managing the participating experts in our CoBRA project.
You can add new experts (with their experience level) to the CoBRA project,
you can modify existing experts, and you can remove them from the CoBRA
project.
Remark: You can only remove an expert from the project if the expert does
not participate in any CoBRA estimation activity, like the ranking of cost factors or multiplier estimation.
B.10
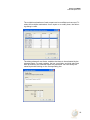
Cost Factor Ranking by Experts
By pressing the 'Ranking by Experts' button, you get to the following dialog:
Remark: If you have no expert in our project, you find an empty table. You
can add required experts in the Expert Management dialog.
In this process step, the experts can rank the organization-relevant cost factors. If an expert has completed his ranking, this is automatically marked by
a check:
The rankings can be modified or removed.
For experts who have not ranked the cost factors, you can start the ranking
process by pressing the 'Rank' button.
Copyright © Fraunhofer IESE 2011
10
Usage of COBRIX
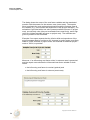
Cost Factor Ranking by Experts
In this dialog, the experts can rank the cost factors for each category.
To do this, they use the 'More Important' and 'Less Important' buttons,
which move the selected cost factor in the list one position up (more important) or down (less important). To support the ranking process, the definition of the selected cost factor is shown.
To navigate through the individual categories,
the 'Back' and 'Next' buttons can be used.
After the cost factors of all categories have been ranked, you can close the
dialog and store the rankings with the 'Finish' button.
11
Usage of COBRIX
Choose Most Important Cost Factors
B.11
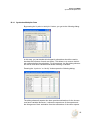
Choose Most Important Cost Factors
By pressing the 'Choose most important' button, you get to the following dialog:
There, you can mark the experts whose cost factor rankings should be used
to create the statistics.
Ranking is used (click on check to remove mark):
Ranking is not used (click on check to mark):
By pressing the 'Ok' button, the statistics for the cost factors are created:
Copyright © Fraunhofer IESE 2011
12
Usage of COBRIX
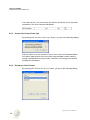
Choose Most Important Cost Factors
For each category, cost factors are sorted by their importance, with the most
important one on top. Ranking statistics are presented. They contain the
mean, the variance, the standard error, the minimum, the maximum, and the
range of the rankings provided by the previous selected experts.
In addition, the coefficient of concordance (Kendall) is computed, which allows checking whether the statistics are meaningful. Significance at .01 and
.05 is shown:
It is also shown if there is no significance:
You can select the most important cost factors that you want to use in our
CoBRA model:
13
Usage of COBRIX
Build Causal Model
To navigate through the individual categories,
the 'Back' and 'Next' buttons can be used.
When the most imported cost factors have been marked for all categories,
you can store our selection and close the dialog with the 'Finish' button.
B.12
Build Causal Model
By pressing the 'Build Causal Model' button, you start the CoBRIX Editor. It
allows us to create a graph representing the causal model you use for the
cost estimation. The vertexes of a graph are (cost) factors or variables and
the edges are so-called influence relationships, which model the dependencies between factors/variables.
B.12.1 Create New or Open Existing Causal Model
When starting the CoBRIX Editor, you have the option of either creating a
new graph or loading an existing graph. It is possible to open or create up to
10 different graphs. Each of them is stored in its individual tab.
The corresponding icons are located on the tool bar:
B.12.2 Causal Model Editing
After creating or opening a graph, you can see the following sections:
Copyright © Fraunhofer IESE 2011
14
Usage of COBRIX
Build Causal Model
1: Tool Box Section
In this section, you have the elements ‘Factor/Variable’ and ‘Influence’.
There are two option to add a new factor or variable to the graphical section
4: One can either select the box ‘Factor/Variable’ in section 1 and click on
any point of section 4, or one can drag and drop the box ‘Factor/Variable’ to
section 4.
As soon as at least two cost factors are in section 4, you can
connect them with an influence or an edge. For this, you need to select the
"Edge" or "Influence" button in section 1 and move the mouse cursor to the
center of the cost factor so that it is surrounded by green border lines. Press
the left mouse button and pull the line to the connecting factor. As soon as
the cost factor is also surrounded by a green border, you can release the left
mouse button. Now the two factors are connected by an influence relationship.
2: Cost Factor Section
This section presents the cost factors that were defined and ranked in the
previous stages of the CoBRIX tool. Each cost factor can be dragged and
dropped from section 2 to section 4.
At the top of section 2 in the combo box, you can select a specific category.
15
Usage of COBRIX
Build Causal Model
To remove a cost factor from the factor list, right-click on the
cost factor and select ‘Delete’. Some cost factors cannot be removed because they have been defined as important in the previous stages of the
CoBRIX tool. In those cases, you will get a warning in section 3.
3: Message Box Section
In the message box section, you can see all relevant information, warnings,
and exceptions of the current graph:
Simple activity information is preceded by the icon
Warnings are not critical but provide information if data is missing or activities are not possible. Warnings are preceded by the icon .
Exceptions are critical and indicated by the icon
.
.
4: Graphical Section
In the graphical section, you can design the graph. As mentioned above,
you can drag and drop important or new cost factors to the graph section.
Influences between the factors can be drawn by selecting the ‘Influence’ element in section 1.
Functions on the tool bar or/and menu bar
‘New’ creates a new graphical environment in a new tab. It is possible to
have up to 10 different tabs/graphs at one time.
‘Open’ loads a graph in a new tab and its graphical environment. In contrast to the ‘New’ function, the ‘Open’ function loads a graph from a file,
which contains factors and influences.
‘Check’: By pressing this button, the system verifies the designed graph
and informs you in sections 3 and 4 whether the graph is consistent with
syntactic modeling rules. In case of inconsistency, the warning icon(s)
appear(s). For more information about rules, see the chapter 'Validation'
below.
‘Accept’: The accept button is enabled only if you pressed the check button before and the graph does not violate any modeling rules. This means
Copyright © Fraunhofer IESE 2011
16
Usage of COBRIX
Build Causal Model
that the graph is a valid CoBRA causal model that can be stored in the database. By pressing the ‘Accept’ button, the necessary data regarding cost
factors, variables, and influences will be stored in the database, and the
CoBRIX Editor will be closed. In the CoBRIX tool, the step ‘Build Causal
Model’ will be marked as completed.
‘Save’: As soon as the graph has been modified, you can save the current graph to a file. If the graph was not saved before, the function ‘Save As’
will be used automatically.
‘Save As’ is similar to the ‘Save’ function but allows you to provide a file
name for the saved graph.
‘Page Setup’ allows choosing the page size and orientation as well as the
printing settings.
‘Print’ sends a print job to print the current graph.
‘Exit’ closes the CoBRIX Editor. Modifications will not be stored in the
database.
‘Cut’ cuts the selected cost factors or influences from the graph and
stores them on the clipboard.
‘Copy’ copies the selected cost factors or influences and stores them on
the clipboard.
‘Paste’ inserts all cost factors and influences stored on the clipboard into
the currently selected tab and its graphical environment.
‘Delete’ deletes the selected cost factors and influences.
‘Undo’ undoes the last activity/activities.
‘Redo’ restores the last undone activity/activities.
‘Select All’ selects all factors and influences of the current tab and its graphical environment.
‘Select None’ deselects all factors and influences.
‘Zoom In’ zooms into the graphical environment by 120%.
‘Zoom Out’ zooms out of the graphical environment by 120%.
‘Fit to Size’ resets the page to its visible and graphical page size.
17
Usage of COBRIX
Build Causal Model
B.12.3 Modify Factors or Variables in the Causal Model
A dialog containing the properties of a factor/variable appears when you select and right-click the factor/variable (or double-click the left mouse button)
on a cost factor.
The ‘Description’ tab contains all information relevant for a cost factor:
The ‘Name’ of the factor/variable must be unique in the graph.
A cost factor belongs to one ‘Category’, which is defined in the category
field. If the vertex is a variable, then the category field must not be defined.
‘Rankings’ provide statistical data based on the results of the previous
step ‘Expert Ranking’ in the CoBRIX tool. The information cannot be edited. Newly created cost factors/variables do not contain ranking data.
In the graph, we differentiate between cost factors, variables, and the
dependent variable (i.e., the project effort/cost). Each graph needs exactly one dependent variable.
‘Definition’ and ‘Extreme case’ store detail information about the factor/variable, but they do not have an influence on the representation of
the factor in the graph.
B.12.4 Quantify Factors or Variables in the Causal Model
A dialog containing the properties of the selected ‘Factor/Variable’ appears
when you right-click the factor/variable (or double-click it with the left mouse
button).
The tab ‘Quantification’ contains all information relevant for variables:
Copyright © Fraunhofer IESE 2011
18
Usage of COBRIX
Build Causal Model
The ‘Question’ provided here will be answered in a subsequent step for
each historical and new project in order to characterize the project with
respect to the variable.
‘Scale Type’ is used to provide predefined answer possibilities for the
stated question. According to the selected scale type, the predefined answer for an extreme case is shown.
The ‘Add’ and ‘Change’ buttons can be used to define new scale types or
modify existing ones. More details are provided in the next subsection.
B.12.5 Add/Modify Scale Types
If you need a scale type that is not available yet, you can add it by pressing
‘Add’ or ‘Change’ at the bottom of the dialog. The dialog that appears allows
choosing to add a new scale type or modifying/removing an existing one:
19
Usage of COBRIX
Build Causal Model
For a scale type, its name and the four answer possibilities (from nominal
case to extreme case) have to be provided:
B.12.6 Modify Causal Relationships
A dialog containing the properties of an ‘Influence’ appears when you rightclick the influence (or double-click it with the left mouse button).
Copyright © Fraunhofer IESE 2011
20
Usage of COBRIX
Build Causal Model
In general, factors must have either a positive or a negative influence.
Variables that connect to their factors do not need an influence.
The field ‘Why does the cost factor have this influence?’ can provide additional information for the model user.
B.12.7 Causal Model Validation
The graph has to fulfill a set of criteria/rules in order to be compliant. The
‘Check’
function validates the graph. As soon as the graph is validated
and no warnings
appear, the ‘Accept’
button is enabled in the tool bar.
The graph contains at least one loop.
The graph contains two factors/variables with identical names.
The graph does not contain exactly one dependent variable (Effort).
The dependent variable (Effort) has one or more outgoing influences.
The dependent variable (Effort) has no incoming influences.
A factor is not connected to the dependent variable or to an influence
that targets the dependent variable.
A variable does not have exactly one outgoing influence.
A variable contains one or more sub-variables.
A variable has an indirect influence.
A variable has no scale type selected.
An influence contains more than one indirect influence.
21
Usage of COBRIX
Collect Multiplier Data
B.13
Collect Multiplier Data
By pressing the 'Collect Multiplier Data' button, you get to the following dialog:
The dialog shows all experts and whether the experts already have estimated the influence of the cost factor variables (as multipliers):
Copyright © Fraunhofer IESE 2011
22
Usage of COBRIX
Collect Multiplier Data
The multiplier estimations of each expert can be modified and removed. To
collect the multiplier estimations for an expert or to modify them, the following dialog is used:
The dialog shows all cost factor variables that have to be estimated by the
selected expert. For each variable, the low, most likely, and high value that
were provided by the selected expert are presented. You can modify the
values by double clicking on the corresponding line:
23
Usage of COBRIX
Collect Multiplier Data
The dialog shows the name of the cost factor variable and the associated
question with the answer for the extreme case (worst case). The experts
have to estimate the cost overhead produced through the extreme case of
the variable (e.g., inferior skills and experience of the project manager). The
estimation is provided with a low value (lowest possible influence on project
cost), a most likely value (the cost overhead occurs most likely), and a high
value (the highest possible influence on project cost). The estimates are
given in percent of cost overhead.
Example: If an expert expects that the inferior skills and experience of the
project manager lead to a minimum 0% increase in project costs, most likely
leads to a 30% increase in project costs, and maximal to additional project
costs of 100%, he provides:
Moreover, if an influencing cost factor exists, its extreme case is presented
and the expert must estimate the influenced cost factor variable for both
cases:
the influencing cost factor is nominal (optimal) and
the influencing cost factor is extreme (worst case)
Copyright © Fraunhofer IESE 2011
24
Usage of COBRIX
Synthesize Multiplier Data
B.14
Synthesize Multiplier Data
By pressing the 'Synthesize Multiplier' button, you get to the following dialog:
In this step, you can decide which expert’s estimations should be used to
simulate the influence of each cost factor. This allows us to remove individual outliners before the calculation. For this purpose, the first dialog shows a
list with all cost factor variables and allows choosing a variable.
Pressing the ‘Synthesize’ or ‘Modify’ button opens the following dialog:
The dialog shows all experts who have provided estimations for the chosen
cost factor variable. Moreover, it shows the experience of the experts and
the divergence of their estimation from the estimations of the other experts.
25
Usage of COBRIX
Choose Past Project Data Type
In the last column, you can remove the check to avoid the use of the outlier
estimation in the cost overhead calculation:
B.15
Choose Past Project Data Type
By pressing the 'Past Project Data Type' button, you get to the following dialog:
With the check, you can choose to use or not to use cost overhead estimation data of past projects. Not using cost overhead data usually results in
strong overestimation of project costs. Therefore, we strongly recommend
keeping the checkmark.
B.16
Elicitation of Past Project
By pressing the 'Elicitate Past Project' button, you get to the following dialog:
Copyright © Fraunhofer IESE 2011
26
Usage of COBRIX
Elicitation of Past Project
In this dialog, you can manage our past project database. You can add additional past projects, modify existing ones, or remove them from the database.
For each past project, you have to enter the project name, project size, and
project cost. In addition, you have to answer the questions obtained from the
causal model quantification to determine the difficulty of the project:
Remark: In the actual version of CoBRIX, for each question, you can also
find a button named ‘Details’. The button allows us not only to select one of
the four answer possibilities, but also to provide probabilities for each answer possibility. For example, if you are not sure whether answer possibility
1 or 2 is correct for our project, you can press the ‘Details’ button and provide a ‘50’ percentage probability for both answer possibilities.
27
Usage of COBRIX
Validation of the CoBRA Model
B.17
Validation of the CoBRA Model
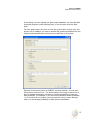
By pressing the 'Validate Model' button, you get to a dialog with several tabs.
‘Regression’ is optional and shown only if a regression model is used to determine productivity (see productivity models in configuration file section for
details):
The fist tab ‘Cross-Validation’ shows the results of a cross-validation performed with the past project data, i.e., each past project is estimated based
on an estimation model built with the remaining past projects. The results of
cross-validation are presented in a table and aggregated in a box plot of
their relative estimation errors. In the table column ‘Estimated’, the estimates
for the project cost can be found; the column ‘Actual’ presents the actual
project costs; the column ‘Residual’ contains the difference between estimated and actual project costs; and the column ‘Rel. Error’ shows the resulting
relative error (RE) of the estimate. The box plot is based on these relative
error values.
In this tab, you can also decide whether the model is accurate enough for
productive use, i.e., only if you checkmark ‘The model was validated and is considered as accurate enough’, the model can be used to simulate new projects
for the purpose of cost estimation, risk analysis, and benchmarking.
On the other hand, as long as the checkmark is set, you cannot modify the
model. To modify the model, you must remove the checkmark again.
Copyright © Fraunhofer IESE 2011
28
Usage of COBRIX
Validation of the CoBRA Model
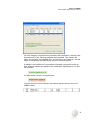
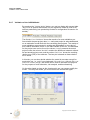
The second tab ‘Productivity’ shows the productivity estimation improvement
in figures as well as in a diagram. Here, improvement is understood as the
reduction of the derivation of calculated nominal productivity.
The dark blue bars in the diagram are the actual productivity values of the
historic projects based on their cost and size. The dark red dots are the corresponding calculated nominal productivity values. The magenta line is the
estimated (overall) nominal productivity based on the project data of all historic projects.
The third tab ‘P.Details’ contains a table of the relevant size, cost and
productivity data for each project; the table can be easily copied to Excel for
further analysis. Size is provided in the defined size unit, actual cost in the
defined cost unit, cost overhead in percentage, and actual and nominal
productivity in the cost unit / size unit.
29
Usage of COBRIX
Validation of the CoBRA Model
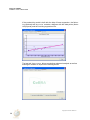
If the productivity model is built with the help of linear regression, the following (optional) tab ‘Regression’ contains a diagram with the data points (historical projects) and the resulting regression line.
The last tab ‘Improvement’ allows conducting advanced analysis as well as
starting an iteration to improve the existing model.
Copyright © Fraunhofer IESE 2011
30
Usage of COBRIX
Validation of the CoBRA Model
Pressing the ‘Leave-one-out Variable Validation’ allows comparing the influence of each single variable on the estimation results. The results of removing a certain variable from the model are presented by a box plot as well as
in figures. The figures show whether the removal of a certain variable decreases or increases model prediction accuracy.
Variables with a green table background improve model prediction accuracy,
whereas variables with a red table background decrease the accuracy of the
model prediction. The row with the results of the current model serves as a
reference to quantify the improvement potential by each variable.
Pressing the ‘Leave-one-out Expert Validation’ allows comparing the influence
of the estimations of each single expert on model prediction accuracy. The
results of removing all estimations of a certain expert from the model are
presented by a box plot as well as in figures. The figures show whether the
removal of all estimations provided by a certain expert decreases or increases model prediction accuracy.
31
Usage of COBRIX
Validation of the CoBRA Model
Variables with a green table background improve model prediction accuracy,
whereas variables with a red table background decrease the accuracy of the
model prediction. The line with the results of the current model serves as a
reference to quantify the improvement potentials by the estimations of each
expert.
Pressing the ‘Go for Iteration’ allows jumping back to the causal modelbuilding step, so you can modify and enhance the causal model and its
quantification to improve prediction accuracy. The modifications should consider the results of the advanced analysis performed (Leave-one-out Variable/Expert Validation).
Copyright © Fraunhofer IESE 2011
32
Usage of COBRIX
Enter New Project Data
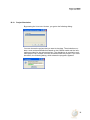
B.18
Enter New Project Data
By pressing the 'New Project Data' button, you get to the following dialog:
This dialog shows all projects that can be estimated with the help of our validated CoBRA model. You can move finished projects to the past projects to
extend the base for future estimations (and hopefully improve the model) by
pressing the ‘Move to Past Projects’ button. You can also add new projects to
the list, modify existing ones, or remove them.
To add a new project, you have to press the 'Add' button:
Before you enter data of a new project, you are asked to check whether the
project is or will be conducted in the previously defined context (scope) of
the CoBRA project.
After pressing 'Ok', you can enter the name of the project and its estimated
size. Additionally, you have to answer the questions derived from the quantification of the causal model:
33
Usage of COBRIX
Enter New Project Data
Remark: In the actual version of CoBRIX, for each question, you can also
find a button named ‘Details’. This button allows us not only to select one of
the four answer possibilities, but also to provide probabilities for each answer possibility. For example, if you are not sure whether answer possibility
1 or 2 is correct for the actual project, you can press the ‘Details’ button and
provide a ‘50’ percentage probability for both answer possibilities.
Copyright © Fraunhofer IESE 2011
34
Usage of COBRIX
Project Simulation
B.19
Project Simulation
By pressing the 'Simulation' button, you get to the following dialog:
You can choose the project that you want to simulate. The simulation creates a cost overhead distribution based on the CoBRA model and the information provided for the selected project. The distribution is required to estimate project cost, analyze cost risk, and benchmark the project. If you start
simulation, the following dialog, which shows the progress, appears:
35
Usage of COBRIX
Estimate Project Cost
B.20
Estimate Project Cost
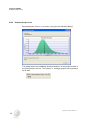
By pressing the 'Estimate Cost' button, you get to the following dialog:
The dialog shows the probability density distribution of the project's costs in
the given project cost unit. The mean (i.e., average) project cost is presented as well:
Copyright © Fraunhofer IESE 2011
36
Usage of COBRIX
Analyze Project Cost Risk
B.21
Analyze Project Cost Risk
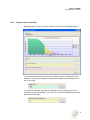
By pressing the 'Analyze Cost Risk' button, you get to the following dialog:
You can calculate the risk of being over budget or even of being 25% over
budget for every given budget by entering the budget and pressing the button on the right:
You can also calculate how high the budget has to be so that it is not exceeded by a given probability. To do this, you enter the probability and press
the button on the right:
37
Usage of COBRIX
Benchmark Projects
The diagram in the dialog gives a graphical interpretation of the results:
B.22
Benchmark Projects
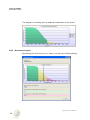
By pressing the 'Benchmark Projects' button, you get to the following dialog:
Copyright © Fraunhofer IESE 2011
38
Usage of COBRIX
Benchmark Projects
This dialog shows us how difficult in terms of cost overhead our new project
is. It is compared to the earlier projects (past projects) and can be significantly easier than the average, if it is in the green area (left area), or significantly harder, if it is in the red area (right area). It may also be of average
difficulty if it is located between the upper and lower quantile boundaries
(yellow area).
39
Configuration File
Causal Model Visualization
C
Configuration File
This chapter explains how to use the 'config.xml' file to customize the tool
behavior for one’s own special needs. The configuration file can be found in
the installation directory of the CoBRA Tool (e.g. 'C:\Program Files\COBRIX).
Generally, the settings provided by the default configuration cover most application scenarios. Therefore, only experienced users should change the
configuration file.
C.1
Causal Model Visualization
The property allows choosing the type of visualization for the presentation of
the causal model. A value of ‘0’ chooses the standard visualization. [Remark: The visualization of the causal model has not been officially released
yet].
<entry key="PRODUCTIVITY_MODEL">0</entry>
C.2
Predefined Scale Types
The answer possibilities on the question sheets that are needed for the elicitation of past and new projects are defined by the scale type of the respective question. The predefined scale types for new CoBRA projects are defined by the following properties in the configuration file. [Remark: Scale
types can be added, modified, and removed in each CoBRA project independently.]
For example:
<entry key='SCALE_TYPE3'>Frequency</entry>
<entry key='SCALE_TYPE3_AP0'>Most of the Time</entry>
<entry key='SCALE_TYPE3_AP1'>Occasionally</entry>
<entry key='SCALE_TYPE3_AP2'>Infrequently</entry>
<entry key='SCALE_TYPE3_AP3'>Rarely</entry>
Copyright © Fraunhofer IESE 2011
40
Configuration File
Predefined Cost Factor Categories
C.3
Predefined Cost Factor Categories
The cost factors can be categorized by default into 'Personal', 'Product',
'Process', and 'Project'. With the help of the property below, you can add
additional categories or modify existing ones.
For example, to add an additional category, insert:
<entry key="CF_CATEGORY5">Customer</entry>
Warning: The change of categories has an effect on all CoBRA projects.
C.4
Change DB Server Settings
The properties below allow you to access a DB Server on another computer
or with another username and password. This can be helpful if you want to
use an existing DB Server on a dedicated server machine. However, we
recommend using the integrated Derby DB provided.
This property names a database that is available on the server:
<entry key="DBMS_UNIDB"> DERBY_JDBC</entry>
This property names the database driver:
<entry key="DBMS_DRIVER">
org.apache.derby.jdbc.EmbeddedDriver</entry>
This property locates the database server:
<entry key="DBMS_URL">jdbc:derby:</entry>
This property names a database user with root rights:
<entry key="DBMS_USER">empty</entry>
This property provides the password for the named user:
<entry key="DBMS_PWD"></entry>
41
Configuration File
Debug Settings
C.5
Debug Settings
These properties are for developers who modify or debug CoBRIX. They allow printing exceptions and SQL statements on the console.
If this property is set to 'true', all exceptions are shown:
<entry key="PRINT_EXCEPTION">true</entry>
If this property is set to 'true', all SQL 'insets', 'update' and 'delete' statements
are shown:
<entry key="PRINT_SQL">true</entry>
If this property is set to 'true', all SQL 'select' statements are shown:
<entry key="PRINT_SQL_SELECT">true</entry>
C.6
Productivity Model
The tool allows choosing the productivity model that is applied to transform
calculated cost overhead into project cost. A value of ‘0’ chooses the standard model:
<entry key="PRODUCTIVITY_MODEL">0</entry>
If this property is set to ‘1’, the productivity model presented in the first CoBRA paper (Lionel et al., 1998) is used, i.e., cost = 1 / ( b1 ∙ co + b0 ) ∙ size.
If this property is set to ‘2’, the productivity model developed together with
the Tool is used, i.e., cost = ( b1 ∙ (co+100) + b0 ) ∙ size.
If this property is set to ‘3’, the productivity model developed for Web CoBRA
is used, i.e., cost = b1 ∙ (co+100) ∙ size.
If this property is set to ‘4’, the previous productivity model is used, i.e., cost
= b1 ∙ (co+100) ∙ size, but b1 is calculated as the median of inverse productivity to increase robustness.
If this property is set to ‘5’, the productivity model does not consider the influence of cost factors, i.e., cost = b1 ∙ size.
Copyright © Fraunhofer IESE 2011
42
Configuration File
Project Simulation
If this property is set to ‘7’, a productivity model with a definable fix cost value is used, i.e., cost = b1 ∙ (co+100) ∙ size + fix_cost, where the fix costs can
be defined by an additional property:
<entry key="FIX_COST">0</entry>
C.7
Project Simulation
These settings influence the project simulation in the 'Simulate Project' step,
which is responsible for sampling the cost overhead distribution.
This property allows choosing the simulation algorithm. The three available
algorithms are 'StdMonteCarlo', which is a standard Monte Carlo approach;
'LatinHypercube', an improved simulation approach, which, however, needs
more runtime per iteration; 'LatinHypercubePO', a runtime optimized version
of the Latin Hypercube algorithm, which is faster but needs more memory
and can be used only until 640000 iterations.
<entry key="SIMULATION_METHOD">StdMonteCarlo</entry>
The number of project simulation iterations performed by 'Simulate Project':
<entry key="SIMULATION_ITERATIONS">1000000</entry>
The property allows using an advanced simulation mode, where probabilities
of different answer possibilities are used to simulate uncertainty regarding a
certain project property:
<entry key="PROBABILITY4ANSWERS">true</entry>
C.8
Other Properties
The first property allows viewing UTF-8 chars in the application by overriding
system dependent font selection with Unicode fonts. This is helpful if using,
for example, Japanese characters.
<entry key="UTF-8">true</entry>
The second property allows choosing the language used in the CoBRIX dialogs. The possible values are ‘System’, ‘English’, ‘German’, and ‘Japanese’, with
43
Configuration File
Other Properties
‘System’ being the default value that automatically chooses the language of
the operation system as the language for the CoBRIX dialogs.
<entry key="LANGUAGE">System</entry>
The third property defines the maximum number of CoBRA projects that can
be stored in the database. A high number of projects can reduce application
start performance.
<entry key="MAX_PROJECTS">20</entry>
Copyright © Fraunhofer IESE 2011
44