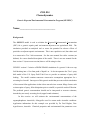
1
ZOL 814
Chemodynamics
Generic Expected Environmental Concentration Program (GENEEC)
Name:______________________________
Background:
The GENEEC model is used to calculate the Expected Environmental Concentration
(EEC) for a generic aquatic pond environment adjacent to an agricultural field. The
simulation provided an analytical tool to assess the potential for adverse effects of
pesticides on adjacent aquatic environments. This is not a predictive tool, but rather used
in a conservative Tier I risk assessment. See the users manual for earlier versions (on
diskette) for a more detailed description of the model. There is no user manual for the
beta version 1.3 (most recent version) that we will be using in class.
GENEEC version 1.3 mimics a PRZM/EXAMS simulation of a generic 10-ha row crop
field draining into a 1-ha farm pond of depth 1 m. It also incorporates the Tier 1 spray
drift model of the U.S. Spray Drift Task Force to provide an estimate of spray drift
loading.
The model contains numerous conservative assumptions appropriate for a
screening level model. One aspect of this generic model that prevents realistic simulation
of late-season foliar applications is that it does not take into account foliage factors such
as interception of spray, foliar dissipation prior to rainfall, or pesticide wash-off fraction.
The predicted generic concentrations should not be interpreted as accurate estimates;
instead they are merely screening levels (upper bound estimates).
In this exercise we will estimate the environmental concentrations of the
organophosphorus insecticide, chlorpyrifos used in cotton under Australia conditions.
Application information for this example was provided by Dr. Paul Hughes, Dow
AgroSciences, Australia. Chemical properties and environmental fate parameters were
1
taken from the United States Department of Agriculture Agricultural Research Service
Pesticide Properties Database.
This database has been subjected to peer review by
registrants but has not been updated recently. However, it is judged to be a reasonably
accurate compilation of data, and representative values provided in the database are based
on objective, unbiased selection procedures. Aquatic degradation half-lives for all the
processes accounted for in GENEEC (aerobic degradation, hydrolysis, and photolysis) are
not uniformly available for all of the compounds in the database. In this example fieldestimated lumped first-order dissipation from the water column was entered arbitrarily as
a rate for aerobic degradation. USEPA prefers laboratory values for individual processes.
Below you will find the individual screens that will appear when you execute the
model. Follow these and input the data into the model. When you have completed the
simulation, your instructors will assist you in interpreting the information and discuss
how it is used in a Tier I ecological risk assessment.
Use GENEEC to simulate the concentration of chlorpyrifos that would be expected to
occur in a pond near a cotton field treated with chlorpyrifos. The model can be found at
the course website: http://www.msu.edu/course/zol/814. Download the model onto your
computer. To run the model, get a dos prompt and type “GENEECX” at the prompt.
Below are the input screens that you will see when making inputs (parameterizing ) into
the model. After you run the model, answer the questions.
2
VERSION 1.3
ENVIRONMENTAL FATE AND EFFECTS DIVISION
OFFICE OF PESTICIDE PROGRAMS
U.S. ENVIRONMENTAL PROTECTION AGENCY
TIER ONE SCREENING MODEL
FOR AQUATIC PESTICIDE EXPOSURE
BETA TEST VERSION
PLEASE FAX COMMENTS TO:
RON PARKER (703) 305-6309
PLEASE CHOOSE THE LETTER OF THE APPLICATION YOU WISH TO USE:
A:
B:
C:
D:
ROW CROPS, ORCHARDS, GRASSES AND TURF
RICE
CRANBERRIES
DITCHBANKS AND RIGHTS-OF-WAY ---> A
GENEEC
FOR ROWCROPS, ORCHARDS AND TURF
ENVIRONMENTAL FATE AND EFFECTS DIVISION
OFFICE OF PESTICIDE PROGRAMS
U.S. ENVIRONMENTAL PROTECTION AGENCY
TIER ONE SCREENING MODEL
FOR AQUATIC PESTICIDE EXPOSURE
THIS IS A PROGRAM TO CALCULATE A SET OF GENERIC
ESTIMATED ENVIRONMENTAL CONCENTRATION (GEEC) VALUES
RESULTING FROM RUNOFF FROM A TEN HECTARE FIELD INTO
A ONE HECTARE BY TWO METER DEEP STATIC WATER BODY
ENTER A RUN NUMBER TO CONTINUE ---> 1
3
ENTER AN OUTPUT FILE NAME ---> Cotton1
ENTER CHEMICAL NAME ---> Chlorpyrifos
ENTER CROP NAME ---> Cotton
THE PROGRAM ASSUMES THAT RUNOFF IS SUFFICIENT TO REMOVE TEN
PERCENT OF THE DISSOLVED PESTICIDE FROM THE TEN HECTARE FIELD
THE FOLLOWING INFORMATION SHOULD BE TAKEN FROM THE MOST
CURRENT, ACCEPTED LABEL FOR THE USE SITE IN QUESTION
PLEASE ENTER APPLICATION RATE (IN POUNDS a.i. PER ACRE)---> 1.340
ENTER MAXIMUM NUMBER OF APPLICATIONS PERMITTED PER YEAR---> 2
ENTER INTERVAL BETWEEN APPLICATIONS (DAYS)---> 10
4
THE DISSOLVED PESTICIDE CONCENTRATION IS REDUCED BY
ADSORPTION OF THE PESTICIDE TO SOIL OR TO ORGANIC MATTER
THE ADSORBED FRACTION IS ESTIMATED BY THE SOIL/WATER
EQUILIBRIUM PARTITION COEFFICIENT (Kd)
PLEASE ENTER Kd VALUE (WITHOUT COMMAS)---> 115
THE DISSOLVED PESTICIDE CONCENTRATION IS ALSO REDUCED
BY DEGREDATION IN THE FIELD PRIOR TO A RAINFALL/RUNOFF
EVENT - THE PROGRAM ASSUMES DEGRADATION BY AEROBIC
METABOLISM FOR TWO DAYS AFTER THE FINAL APPLICATION
(IF STABLE TO AEROBIC METABOLISM OR IF DATA IS
UNAVAILABLE, PLEASE ENTER ZERO (0))
ENTER SOIL AEROBIC METABOLIC HALFLIFE (IN DAYS) ---> 30.5
5
SOME PESTICIDE LABELS REQUIRE THAT THE PESTICIDE BE
WETTED-IN EITHER THROUGH RAINFALL OR IRRIGATION:
IN THIS CASE, RUNOFF TO THE POND IS ASSUMED TO OCCUR
IMMEDIATELY RATHER THAN AFTER TWO DAYS
IS THIS PESTICIDE TO BE WETTED-IN ?
(Y or N) ---> N
THE DISSOLVED PESTICIDE CONCENTRATION MAY BE INCREASED
BY DIRECT DEPOSITION OF SPRAY DRIFT INTO THE POND
ENTER A, B or C TO SELECT METHOD OF APPLICATION:
A: AERIAL SPRAY
B: GROUND SPRAY
C: GRANULAR (NON-SPRAY) ---> A
6
SPRAY DRIFT TO THE POND MAY BE REDUCED BY A BUFFER ZONE
LOCATED BETWEEN THE TREATED FIELD AND THE WATER BODY
PLEASE ENTER THE WIDTH OF THE SPRAY DRIFT BUFFER (FEET)
(FOR NO BUFFER, ENTER ZERO (0) ---> 49.2
THE DISSOLVED PESTICIDE CONCENTRATION IN A WATER
BODY CANNOT EXCEED THE SOLUBILITY OF THE CHEMICAL
ENTER THE SOLUBILITY (IN PPM) ---> 1.2
7
CHRONIC GENERIC EEC VALUES ARE CALCULATED BY SUMMING
THE RATES OF THE AQUATIC DEGRADATION PATHWAYS
ENTER ANY OR ALL OF THE FOLLOWING WHICH ARE AVAILABLE:
(PLEASE ENTER ZERO (0) FOR ANY WHICH ARE STABLE OR
FOR WHICH VALUES ARE UNAVAILABLE)
AEROBIC AQUATIC METABOLIC HALFLIFE (DAYS) ---> 9
ENTER PHOTOLYSIS HALFLIFE (DAYS) ---> 0
RUN No.
1 FOR Chlorpyrifos
ON
Cotton
* INPUT VALUES *
-------------------------------------------------------------------RATE (#/AC)
APPLICATIONS SOIL SOLUBILITY BUFFER(FT) INCORP
ONE(MULT)
NO.-INTERVAL
Kd
(PPM )
% DRIFT
DEPTH(IN)
-------------------------------------------------------------------1.340( 2.408)
2
10
115.0
1.2
49.2- 11.1
0.0
FIELD AND STANDARD POND HALFLIFE VALUES (DAYS)
-------------------------------------------------------------------METABOLIC DAYS UNTIL HYDROLYSIS
PHOTOLYSIS
METABOLIC COMBINED
(FIELD)
RAIN/RUNOFF
(POND)
(POND-EFF)
(POND)
(POND)
-------------------------------------------------------------------30.50
2
N/A
0.000.00
9.00
9.00
GENERIC EECs (IN PPB )
-------------------------------------------------------PEAK
AVERAGE 4
AVERAGE 21
AVERAGE 56
GEEC
DAY GEEC
DAY GEEC
DAY GEEC
-------------------------------------------------------11.01
8.68
2.93
1.17
DO YOU WANT ANOTHER RUN (Y OR N) --->
8
Questions:
1)
What is the estimated What is the estimated environmental concentration
(EEC?
2)
If the No Observable Effect Concentration (NOEC) for chlorpyrifos is 5
ug/l would adverse effects be expected based on this scenario?
3)
Chlorpyriphos is an organo-phosphate insecticide that is acutely toxic by
depressing achetylcholinesterase (AchE) activity in the brain. It has a low
acute to chronic ration. For these reasons which of the EEC values
generated by GENEEC would be the most appropriate to which to
compare a threshold for effects concentration?
4)
What assumptions are made in this model?
5)
How accurate is the model?
9
6)
How generalized are the results?
7)
What are the most important parameters in the model?
10
8)
How could the model predictions be improved?
9)
Draw the structure of the model.
10)
Perform a sensitivity analysis for the Kd value. To do this, run several
simulations with a range of values for Kd. How sensitive is the model to
values used for Kd?
11
12