1
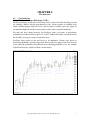
Kase StatWare Version 9.4D for NinjaTrader™ This manual was written for NinjaTrader 7® and refers to Version 9.4D of the StatWare indicators. Users of older versions of NinjaTrader™ may notice slight differences between the manual and the program. We make every effort to keep our manual up to date and accurate. If you have any questions or experience any problems, please contact our offices. Kase and Company, Inc. phone: 505-237-1600 fax: 866-526-2350 email: [email protected] Mission Statement: Trading is primarily a function of three tasks: entry, money management and exit. You will find that the Indicators in the Kase StatWare package will help you to perform all three tasks in a more efficient and successful manner. Where many older indicators are based on empirical observations, we now have the ability to derive indicators from the natural structure of the market itself. Patterns that were difficult to observe with primitive tools now emerge with computer-based statistical examination. This manual has been written to explain the StatWare indicators and to give traders an increased understanding of the markets in order to diminish risk and increase profits. Keep in mind that the Kase indicators are tools that support a methodology and not a “black box” system. A trader’s personality and experience will play a role in his or her experience in using Kase StatWare. Philosophy: It is Kase and Company Inc.’s philosophy to view the markets scientifically and accurately without making the procedure for doing so too complex. Through the application of statistics and mathematics a whole new generation of indicators has been made possible. It is our hope that using our piece of the future will be enjoyable and profitable for you. BEFORE GETTING STARTED Load NinjaTrader™ and go through its manual to become familiar with the basics. In this manual it is not our aim to explain NinjaTrader™, except where it is directly an issue regarding the use or the functionality of the Kase Indicators. For help with the functionality of NinjaTrader™ please email their technical support, as appropriate. Copyright 2004-2011 Kase and Company, Inc. All Rights Reserved. i Kase StatWare Version 9.4D TABLE OF CONTENTS Mission Statement Philosophy Before Getting Started i i i CHAPTER 1: Getting Started 1.1 - Manual Conventions 1.2 - What Have I Received? 1.3 - Installing the StatWare Indicators 1.4 - Activation and Deactivation of Indicators 1 1 2 2 CHAPTER 2: Setting Up Charts 2.1 - Setting Bar Length on Charts 2.2 - Time-Based Charts 2.3 - Tick Volume Charts 2.4 - Adding Indicators to Your Charts 2.5 - Formatting the Indicators 2.6 - Organizing Your Workspace 3 3 3 4 4 5 CHAPTER 3: Importing Password File Updates 3.1 - Passwords 3.2 - Importing New Password Files 6 6 CHAPTER 4: The Indicators 4.1 - Core Indicators 4.1.1 - The Kase DevStops (KDevStops_V94D) 4.1.1.1 - Inputs 4.1.1.2 - Explanation of Inputs 4.1.1.3 - Color and Style Defaults 4.1.2 - The Kase Easy Entry System (KEES_V94D) 4.1.2.1 - Inputs 4.1.2.2 - Color and Style Defaults for (KEES_V94D) 4.1.3 - Kase Momentum Indicators 4.1.3.1 - Inputs 4.1.3.2 - Explanation of Inputs 4.1.3.3 - Color and Style Defaults 4.1.3.4 - Explanation of Inputs 4.2 - Background Indicators 4.2.1.1 - Inputs 4.2.1.2 - Explanation of Inputs 4.2.1.3 - Color and Style Defaults 4.2.2 - The Kase Permission Screen (*KPermF_V94D) 4.2.2.1 - Inputs 7 7 8 8 9 9 9 9 10 11 12 13 13 13 13 13 13 14 14 Copyright 2004-2011 Kase and Company, Inc. All Rights Reserved. ii 4.2.2.2 - Color and Style Defaults 4.2.3 - KaseSwing (KaseSwing_V94D) 4.2.3.1 - Inputs 4.2.3.2 - Explanation of Inputs 4.2.3.3 - Color and Style Defaults for (KaseSwing_V94D 4.2.4 - The Kase Reversal Amounts (KRevAmounts_V94D) 4.2.4.1 – Inputs 4.2.4.2 - Explanation of Inputs 4.2.4.3 - Color and Style Defaults 4.3 - Candlestick Indicators 4.3.1 - Inputs 4.3.2 - Explanation of Inputs 4.3.3 - The Kase Engulfing Candlestick Lines (KaseEngulfing_V94D) 4.3.3.1 - Color and Style Defaults 4.3.4 - The Kase Evening & Morning Star Candlesticks (KaseEveMornStar_v94D) 4.3.4.1 - Color and Style Defaults 4.3.5 - The Kase Hammer and Hanging Man Patterns (KaseHamHang_V94D) 4.3.5.1 - Color and Style Defaults 4.3.6 - The Kase Harami Line and Stars (KaseHarami_V94D) 4.3.6.1 - Color and Style Defaults 4.3.7 - The Kase Piercing and Dark Cloud Cover Candlesticks (KasePiercing_v94D) 4.3.7.1 - Color and Style Defaults CHAPTER 5: Trading Guidelines 5.1 - Introduction to Trading with StatWare 5.2 - Setting Up Charts 5.3 - Entering a Trade 5.3.1 - Initiating a Trade From A Flat Position 5.3.2 - Re-Entry System 5.3.3 - Reversal Signals 5.4 - Placing and Managing Stops 5.5 - Scaling Up 5.6 - Exiting a Trade 5.6.1 - Exit Signal 1 - Divergence on PeakOscillator AND KaseCD 5.6.2.1 - Exit Signal 2A - Single Divergence on PeakOscillator OR KaseCD 5.6.2.2 - Exit Signal 2B - PeakOut Late In the Direction of Trend 5.6.3 - Exit Signal 3 - KCDpeak 5.6.4 - Exit Signal 4 - PeakOut Early In The Direction of Trend 5.6.5 - Exit Signal 5 - No Signal 5.6.6 - Inactivity Exit Guidelines 5.6.7 - Position Holders - Daily Chart Exit Rules and Stops 5.6.8 - “Choppy Market” Trading Guidelines 5.7 - Trading with the Kase Candlestick Indicators 5.7.1 - The Kase Engulfing Candlestick Lines (KaseEngulfing_V94D) or The Kase Piercing and Dark Cloud Cover Candlesticks (KasePiercing_v94D) Copyright 2004-2011 Kase and Company, Inc. All Rights Reserved. 14 14 16 17 17 17 17 17 17 18 18 18 18 18 18 19 19 19 20 20 20 20 21 21 21 21 22 22 23 23 24 25 26 26 26 27 27 27 28 28 28 28 iii 5.7.2 - The Kase Evening & Morning Star Candlesticks (KaseEveMornStar_v94D) 29 5.7.3 - The Kase Harami Line and Star (KaseHarami_V94D) 30 CHAPTER 6: Troubleshooting 6.1 – General Problems 6.2 - Indicators Coming Up Zero, Nothing Is Plotting 6.3 - Unable to See the Indicators Well 6.4 - My Indicators Take A Very Long Time To Initiate Copyright 2004-2011 Kase and Company, Inc. All Rights Reserved. 31 31 31 31 iv CHAPTER 1 Getting Started 1.1 Manual Conventions • Bold – Bold is used to identify indicator names • Bold - Bold Italic is used to identify menu names, command buttons, tabs, etc. • Courier – Courier is used to identify names of indicator inputs. 1.2 What Have I Received? You have received an email containing the StatWare Indicators and the validation key to use them. In this email, there will be one zipped file entitled “StatWare 9.zip” attached. This file must be unzipped using WinZip™ or a similar utility, many of which are available to download free of charge from the Internet. Even if you don’t think you have such a utility, it is possible that you do (it may have come pre-installed on your computer or as a part of your operating system). Before using the Internet to download the utility of your choice (such as WinZip from www.winzip.com), try double-clicking on the zip file. If you have a zip utility on your system, it should automatically run. Unzip the contents of this file to your Desktop or the folder of your choice, noting the location before continuing. Copyright 2004-2011 Kase and Company, Inc. All Rights Reserved. 1 1.3 Installing the StatWare Indicators Navigate to the folder where you saved the unzipped files. Double click on “StatWareV94D_NT7_Setup.exe” and an Installation Wizard will guide you through the setup process. When the Installation Wizard has completed a message will inform you to click Finish. If you have kept the run Kase StatWare option checked the Key Validation Tool will appear and prompt for your validation key. If not you must go to the start menu and under the Kase StatWareNT7 group run ValidationKey Update. Enter the key that was sent in the email into the key validation tool. The key validation tool should inform you of the expiration date of your key. Ensure that the key is valid before attempting to run the StatWare Indicators. If the Validation Key Tool throws an error message or the expiration date is in the past, please contact the Kase Call Center at 505-237-1600 for further instructions. 1.4 Activation and Deactivation of Indicators If you have been sent or given StatWare in a deactivated format at a conference or as part of a promotion and would like to activate your trial, please contact the Kase Call Center. If you are currently on a trial, the indicators will automatically deactivate at the end of your trial period unless you contact the Kase Call Center to commence a lease. If you are already leasing StatWare, a new validation key will be sent to you prior to the expiration of your current one. If for any reason, you do not receive a timely password file, please contact the Kase Call Center. Please refer to Chapter 3: Updating Your Validation Key for more information on how to prevent your indicators from deactivating. If you are upgrading from a previous version of StatWare, you may remove your old StatWare indicators by running the uninstaller in the Kase StatWareNT7 group under the start menu before running the installer for the new version. Copyright 2004-2011 Kase and Company, Inc. All Rights Reserved. 2 CHAPTER 2 Setting Up Charts 2.1 Setting Bar Length on Charts Kase’s philosophy is to “scale-up” from shorter-term to longer-term trades using three chart periods. For active traders, we recommend using charts roughly equivalent to 10 to 15 minutes, 20 to 30 minutes and 45 to 90 minutes depending on the level of activity and degree of trendiness. The more the market is trending, the longer the time frames, and the more choppy the market, the shorter the time frames. Also active traders may decide to scale up to longer time frames during well-established trends. We recommend less active traders hold trades for at least a few days to a number of weeks to look for long-term entry and exit signals on one-quarter to one-third day charts, half day charts, and daily charts. There are two ways Kase recommends to determine bar lengths. 2.2 Time-Based Charts The first type of bar chart uses time bars. In these charts, one bar forms for each time period that elapses, regardless of market activity. When using time bars, first determine the approximate number of minutes you wish to use and then determine the closest time bar length that divides evenly into the trading day. When using a longer number of minutes, such as 90, it’s ok to have shorter bar on the day’s close. So for example, in a five and one-half hour trading day, one could set the bars to five 60 minute and one 30 minute bar, or use six 55 minute, or five 66 minute bars. Using a slightly shorter bar at the end of the day emphasizes the late day activity going into the close. 2.3 Tick Volume Charts The second way to set up bar charts is using tick volume charts. Each "tick" a reported traded price. A tick volume bar of 200, for example, would contain the price activity over 200 price changes or trades. There are two ways to set up a tick volume chart. The first is to determine how many bars per day session are generated by the time bar you have been comfortable with, and set up a tick bar chart that generates a similar number of bars per day. The second is to use the Average True Range indicator to determine the average true range of the time bar you are comfortable with, and then use a tick bar length that generates a similar value. For tick volume bars less than 500, you might want to see if a Fibonacci number, such as 89 ticks per bar works for you. For tick volume bars larger than 500, the suggestion is to use round numbers. Copyright 2004-2011 Kase and Company, Inc. All Rights Reserved. 3 2.4 Adding Indicators to your Charts Now that your charts are set up, add the indicators to them. 1. Either click the Indicators button in the toolbar , select indicators in the right click context menu, or press Ctrl+I to bring up the Indicators window. 2. The available indicators are listed alphabetically in the selection list 3. All of the Kase StatWare indicators begin with a K. Available indicators are listed below: Core Indicators KDevStops_V94D KEES_V94D KasePO_V94D KaseCD_V94D Background Indicators KpermSto_V94D KPermFunction_V94D KaseSwing_V94D KrevAmounts_V94D Candlestick Indicators KaseEngulfing_V94D KaseEveMrnStar_V94D KaseHamHang_V94D KaseHarami_V94D KasePiercing_V94D Selecting an indicator name and clicking on the New button will add it to the bottom list. We suggest that you load at least the four core indicators. These four indicators comprise those used in the basic Kase approach to trading with StatWare. The other indicators might be placed on the chart as “hidden” or used on a secondary chart for reference. The Candlestick Indicators are normally only used on one-quarter day charts and higher. 2.5 Formatting the Indicators The indicators come preset with all the optimized defaults, so adjustments to their inputs are not required. Nevertheless, if you wish to change the indicator inputs, click on the Indicators button in the toolbar. The bottom list on the left shows the indicators currently applied to the chart. Selecting one of them allows their settings to be changed. The Parameters section contains settings used by the indicator to compute values, you may change the default settings for certain variables. The default settings have been set to their optimal values, so staying with the preset defaults is recommended except in a few special circumstances that will be described later in Chapter 5: The Indicators. The Data section contains options for how the indicator calculates the values in real-time, the input data series, and the maximum lookback length. Certain indicators by default are set to Calculate on bar close and some are not. Setting Calculate on bar close to false allows the indicator to update certain values in real-time as each tick stream from the server. This can be quite computationally intense and is not recommended on slower machines. Theoretically the input series could be changed which would allow for instance the data from Crude Oil to be plotted on a Heating Oil chart. If you choose to use this option do so at your own risk as this is neither condoned nor tested by Kase to be either stable or accurate. Kase recommends leaving these settings on their defaults. Copyright 2004-2011 Kase and Company, Inc. All Rights Reserved. 4 The Visual section contains options for plotting the underlying price data. Kase recommends leaving these settings on their defaults. The Plots section contains options for how sub-plots of certain indicators are displayed. For instance, on KaseCD there are three output data series that are plotted in a sub-graph below the main-price graph. Kase does not recommend changing any settings in this section unless color blindness is an issue. In that case the colors of the plots could be adjusted to the users liking. 2.6 Organizing Your Workspace Generally, four “core” indicators are set up as follows: • • • The entry indicator KEES_V94D as well as the KDevStops_V94D indicator are placed in sub-graph 1 along with, and scaled to, the price data. The KaseCD_V94D is placed in sub-graph 2, scaled to “screen”. The KasePO_V94Dis placed in sub-graph 3, also scaled to “screen”. With all four “core” indicators on the screen, your chart should appear as follows: Typical Kase StatWare Chart Set-Up Copyright 2004-2011 Kase and Company, Inc. All Rights Reserved. 5 CHAPTER 3 Updating Your Validation Key 3.1 Validation Keys Kase StatWare© is enabled with a validation key. If you are on a trial of StatWare©, when your trial password expires, please contact the Kase Call Center for a new password, or to sign up for a lease. When you sign up for a lease, or if your trial is extended, you will be sent a new validation key, which will need to be validated. 3.2 Validating the StatWare indicators 1. Under the Kase StatWareNT7 group in the Start menu launch the ValidationKey Update program. 2. Copy and paste the key received into the text box in the validation tool. 3. Click the OK button. 4. A message box should appear with your expiration date. If the date is in the past or an error is generated please call the Kase Call Center for assistance. Copyright 2004-2011 Kase and Company, Inc. All Rights Reserved. 6 CHAPTER 4 The Indicators 4.1 Core Indicators 4.1.1 The Kase DevStops (KDevStops_V94D) The Kase DevStops are the closest ideal stops can be, in the real world. DevStops account for volatility (which is directly proportional to risk), for the variance of volatility (how much volatility changes from bar to bar), and for positive volatility skew (the degree an asymmetrical right tail extends to more positive values than a normal distribution). For time and tick volume intervals, the DevStops place exit points at approximate probability levels that would be equal to 1, 2 and 3 standard deviations over the mean two bar (Double) average true range, corrected for skew DevStops allow profits to run and losses to be minimized. Setting stops based on statistical probabilities of being stopped out allows profit to be taken or losses to be cut at levels where the probability of a particular trade remaining profitable is low. An example of the Kase DevStops added to a chart is shown below. Copyright 2004-2011 Kase and Company, Inc. All Rights Reserved. 7 4.1.1.1 Inputs: The Kase DevStops Parameters are setup as follows: 4.1.1.2 Explanation of Inputs: NumBars is the number of bars used to calculate the average Double True Range (DTR) and its related standard deviation. Dev1Val, Dev2Val, and Dev3Val are three stop levels associated with reversals equivalent to the input Value against the highest high if long or lowest low if short. The default values of these variables are recommended most of the time. However large gaps or large changes in price during short periods can blow out the standard deviation, in which case, the stops may be narrowed to compensate for this by decreasing the “Value”. For example, Dev2 may be decreased from 2.2 to 1.7. During very choppy markets where stops may be hit due to erratic market activity, and not due to a statistically significant move, the stops may be widened. In this case, Dev2 might be increased from 2.2 to 2.8. FMALength and SMALength are the number of bars used in the calculation of fast and slow moving averages. These moving averages are used to default the DevStops to “long” when the FMA is above the SMA or “short” when the FMA is below the SMA. During very trending markets the moving average can be limited from “flipping” by lengthening the value settings, or during oscillating markets the moving averages can be made to flip sooner by shortening the value setting. Copyright 2004-2011 Kase and Company, Inc. All Rights Reserved. 8 4.1.1.3 Color and Style Defaults: Plot name Warning Dev1 Dev2 Dev3 Description Warning Line Stop First Level Stop Second Level Stop Third Level Stop Color: Dark Red Blue Blue Dark Blue Type: Solid Line Solid Dot Solid Dot Solid Dot 4.1.2 The Kase Easy Entry System (KEES_V94D) As the name implies, KEES is an easy to use entry system. It examines a combination of underlying momentum indicators, as well as embeds signals from the Kase Permission Screen and KaseSwing. KEES generates S’s for valid short entries and L’s for valid long entries, which means the signal takes place after a valid swing. For those wishing to have more information about the signals, KEES defines two types of signals, “first” class meaning that the signal is in the same direction as that of a higher bar length filter and “second class” meaning that the signal is not in the same direction as a higher bar length filter. Each bar has color-coded points to denote first or second-class long and short signals. Small points are used for bars that do not have the proper structure to allow an entry, for example, a first class buy bar with a down close, and a lower high and lower low. Large points are used for bars that do have the proper structure to allow an entry such as a first class buy bar that had a higher high, higher low and closed up, but do not follow a valid swing. 4.1.2.1 Inputs The KEES system has no inputs. 4.1.2.2 Color and Style Defaults for KEES_v94D Plot name L1 Ent L2 Ent L1 L2 Description Entry Long 1st Class Entry Long 2nd Class Permission Long 1st Class – No Entry Permission Long 2nd Class – No Entry Color: Blue Gray Blue Gray Copyright 2004-2011 Kase and Company, Inc. All Rights Reserved. Type: Hash Hash Cross Cross 9 Plot name S1 Ent S2 Ent S1 S2 Description Entry Short 1st Class Entry Short 2nd Class Permission Short 1st Class – No Entry Permission Short 2nd Class – No Entry Color: Magenta Red Magenta Red Type: Hash Hash Cross Cross 4.1.3 Kase Momentum Indicators – The Kase PeakOscillator (KasePO_V94D) and KaseCD (KaseCD_V94D) The PeakOscillator and KaseCD are momentum indicators derived from a mathematically sound, statistically based evaluation of trends and is used similar to traditional momentum indicators. The PeakOscillator and the KaseCD, which is derived from the PeakOscillator, automatically adapt for changes in dominant cycle length and volatility. These indicators signal the following. 1. Overbought or Oversold conditions. The Kase PeakOscillator and KaseCD indentify overbought and oversold conditions with “PeakOut” signals, shown by a green “P” for the PeakOscillator PeakOuts and a red “K” for the KaseCD PeakOuts. A PeakOut is a positive histogram peak above an overbought line or a negative histogram peak below an oversold line. 2. Momentum Divergence. The indictors generate standard bullish and bearish divergence signals. a. Bearish divergence takes place when prices have made a higher or equal high and a momentum indicator has made a lower or equal positive peak (see Graph 1). b. Bullish divergence takes place when prices have made a lower or equal low peak and a momentum indicator has made higher or equal (i.e. less negative) negative peaks (see Graph 2). Graph 1: Bearish Divergence Graph 2: Bullish Divergence Copyright 2004-2011 Kase and Company, Inc. All Rights Reserved. 10 The KaseCD is a sensitive, second derivative indicator, calculated in the same way as the MACD histogram is calculated from a moving average oscillator. Namely, the KaseCD is the difference between the PeakOscillator and its average, just as the MACD is the difference between an exponential moving average oscillator and its average. Because the KaseCD automatically adapts to changing market conditions, it can be seen to generate cleaner crossover signals and more reliable divergences than the MACD. Automated Divergence Function - The Kase PeakOscillator and KaseCD include an algorithm that automatically draws bullish and bearish divergences between peaks on the price chart. Divergences for the Kase PeakOscillator are defaulted to plot as green lines and for the KaseCD as red lines. 4.1.3.1 Inputs: The Kase PeakOscillator (left) and KaseCD (right) come set up with the default values pictured below: Copyright 2004-2011 Kase and Company, Inc. All Rights Reserved. 11 4.1.3.2 Explanation of Inputs: BridgeFilter: A bridging divergence is a divergence counter-trend. This setting adjusts the sensitivity of the bridging divergence filtering algorithm. The default value is five which indicates that at least one of the last five swings must be more extreme than the most extreme point within the range of the divergence. ShowAllDivs: Many times, after a divergence has taken place, additional divergences will form from the same starting peak. Setting ShowAllDivs to true will show all the divergences from a given starting peak. Setting ShowAllDivs to false will show only the most recent divergence from a given starting peak SlopeFilter: Rounded or insignificant histogram peaks can be filtered out by requiring a certain slope in terms of percent of the histogram value to be met. If that slope is less than slopeFilter, the peak is considered too shallow and is filtered out. A setting of 0 filters out no peaks. A filter of 0.01 filters out all peaks less than 1% higher than the surrounding data. LineOfSight: This input controls the tolerance for which the line of sight can be broken between the two price peaks of a divergence. The slope line (y = mx +b) between the two price points is adjusted up for bearish divergences or down for bullish divergences by this percent. The default and minimum is 0.05 or 5%. Should this adjusted line of sight be broken by any high for bearish divergences or low for bullish divergences, the divergence is considered invalid and not drawn. Tolerance: For divergences or PeakOuts to be valid, peaks in price and momentum must occur within a certain number of bars or “tolerance” of each other, but not necessarily on the same bar. The input variable tolerance represents the maximum number of bars allowed between price and histogram peaks for a valid divergence or PeakOut signal. A default of 3 is set based on optimization tests. Increasing tolerance will generate more signals and vice versa. NumBars: This is the maximum number of bars between the swing highs or lows used to determine divergence. So a setting of 40 means that divergence peaks that are within 40 bars of each other will show on the screen, and those farther apart will not. Increasing numBars will generate more signals and vice versa. PeakStdDev: This is the number of standard deviations of the local data used to calculate PeakOut levels. Increase the number of standard deviations to make the PeakOuts less sensitive, and take place less often, and vice versa. FixedPOLine: This is a baseline based on historical studies to calculate PeakOut levels. Increase this setting to make the PeakOuts less sensitive and vice versa. ShortCycle and LongCycle control the range of shortest and longest cycle lengths used to determine significant trend. During very trendy markets, lengthen the settings, and during choppy oscillating markets shorten them. Copyright 2004-2011 Kase and Company, Inc. All Rights Reserved. 12 4.1.3.3 Color and Style Defaults (KasePO_V94D): Plot name KPOPeak KPOHisto PeakOut Line Description Histogram Peak Histogram No Peak Overbought or oversold conditions Color: Black Green Blue Type: Histogram Histogram Line Color: Red Dark Green Magenta Type: Point Histogram Histogram 4.1.3.4 Color and Style Defaults (KaseCD_V94D): Plot name KCDPeak KCD PeakOut Line Description Histogram Peak Histogram Overbought or oversold conditions 4.2 Background Indicators 4.2.1 The Kase Permission Stochastic (KPermSto_V94D) Trades taken in the direction of the major trend tend to be more successful than trades against the trend. Thus, it’s good practice to screen trades with a longer bar length filter. However, this takes time and waiting for longer bars to complete can delay profitable entries. To address these difficulties, the Permission Stochastic was developed. The algorithm behind the indicator computes a synthetic longer bar length that updates upon the completion of each shorter bar, and calculates a moving Stochastic, that can be use to effectively screens trades on a longer bar length. 4.2.1.1 Inputs: The Kase Permission Stochastic has two inputs: multiplier and length. 4.2.1.2 Explanation of Inputs: multiplier determines the number of shorter bars included in the longer bar length used in the Permission Stochastic. Higher values result in more short bars being used in the calculation of the longer bars. For example, if using a 20 minute bar for trading, a setting of “3” would result in a longer bar length of 60 minutes. t. The longer the higherlevel filter multiplier, the less sensitive the indicator will be to shorter-term price action. The default input is 5. length is the number of longer bars used to calculate the Permission Stochastic. Its default value is 9. To slow the indicator and make it less sensitive, increase the Stochastic length by changing it from 9 to a higher value, such as 13. To speed up the indicator, do the opposite. 4.2.1.3 Color and Style Defaults: Plot name PermK PermD Definition Equivalent of Slow K Equivalent of Slow D Color: Dark magenta Black Copyright 2004-2011 Kase and Company, Inc. All Rights Reserved. Type: Broken line Solid line 13 4.2.2 The Kase Permission Screen (KPermF_V94D) The Permission Screen interprets the Permission Stochastic by simply displaying one color when the filter is in a status where long trades may be taken “Permission Long” and another for Permission Short using some simple rules that relate to the level of the K and D lines and their relationship. The user should note that this indicator is embedded in the entry indicators and is not necessary or even recommended to use in normal timer or position charts. If the Permission Screen histogram is green, long trades on the normal bar length chart may be taken. If the Permission Screen histogram is dashed dark magenta, then short trades on the normal bar length chart may be taken. 4.2.2.1 Inputs: The inputs are the same as for the Permission Stochastic. 4.2.2.2 Color and Style Defaults: Plot name PermLong PermShort Definition Equivalent of PermK Equivalent of PermD Color: Blue Pink Type: Histogram Broken histogram 4.2.3 KaseSwing (KaseSwing_v94D) KaseSwing is built into many of the Kase algorithms, including KEES, the KaseCD and the PeakOscillator to identify swings and highs and lows needed for determining valid entries and divergences. The indicator itself may be used by Kase to define both swing lines and waves. KaseSwing identifies each bar as either a falling or rising bar. A falling bar is defined as a bar that has a lower low than the previous bar, or a rising bar, which has a higher high than the last bar. Note that outside bars, those that make a higher high and lower low than the last bar, and are counted as both rising and falling bars. Inside bars, those that do not make a higher high or lower low that the last bar, are ignored. There are specific rules and settings for handling both outside and inside bars. A running count of rising and falling bars is kept and updated for each new bar. This count is used to find the detail or resolution of the swings and is controlled by an input called MinSize that controls the sensitivity of the swings drawn. This means that after a swing has formed, MinSize numbers of bars are needed to draw the next swing. As shown in the chart below, after a high swing formed, there was one falling bar and then one rising bar. Because MinSize = 1 a swing can be drawn at the low of the falling bar and the high of the rising bar. Copyright 2004-2011 Kase and Company, Inc. All Rights Reserved. 14 Drawing MinSize = 1 If the MinSize = 2 there must be two falling bars and two rising bars in order for a swing to be drawn, as shown in the right sketch. Otherwise, as shown on the left, if there is only one falling bar and then another rising bar no swing is drawn. Drawing MinSize = 2 For MinSize = 3 the same rules as above apply, but in this case there must be at least three rising or falling bars before a swing can be drawn. Drawing MinSize = 3 By default a Size of “2” is normally used, but “1” and “3” are commonly used as well. The lower the number the more detail the indicator shows. Copyright 2004-2011 Kase and Company, Inc. All Rights Reserved. 15 4.2.3.1 Inputs: The KaseSwing inputs are shown in the picture below Copyright 2004-2011 Kase and Company, Inc. All Rights Reserved. 16 4.2.3.2 Explanation of Inputs: MinSize: changes the tolerance for the number of bars that must take place between high and low swings. The most sensitive setting is 1. Settings of 2, which is the default, and 3 are also allowable. A setting of 3 is the least sensitive. ConsiderInsides: uses special inside bar rules when drawing swings. TextOn: turns swing labels on or off. LineOn: turns lines on or off. LineSytle: controls style of lines that are drawn between swings. 4.2.3.3 Color and Style Defaults for KaseSwing_v94D All colors and styles for KaseSwing are controlled by the inputs described above. 4.2.4 The Kase Reversal Amounts (KRevAmounts_V94D) KRev plots the absolute value of the stop amounts – the amount in dollars and/or cents of a reversal that must take place to hit the warning, Dev1, Dev2, and Dev3 lines. The standard deviation settings are the same as the DevStops. 4.2.4.1 Inputs: The inputs for KRev are the same as for the Kase DevStops. 4.2.4.2 Explanation of Inputs: NumBars, Dev1, Dev2, and Dev3 are all as described above for the Kase DevStops Indicator. 4.2.4.3 Color and Style Defaults: Plot name Warn Rev1 Rev2 Rev3 Description Warning Line Reversal First Level Reversal Second Level Reversal Third Level Reversal Color: Dark Red Blue Blue Dark Blue Copyright 2004-2011 Kase and Company, Inc. All Rights Reserved. Type: Solid line Solid line Solid line Solid line 17 4.3 Candlestick Indicators Kase color-codes five important candlestick patterns for easy identification. Candlestick patterns can be used to identify danger of possible turns, to confirm turns, determine support and resistance points, to accelerate exits. Given that meaningful reversals generally take place at the top or bottom of extended moves or trends, to filter out patterns occurring after less meaningful moves, Kase’s filters candlestick patterns with the Stochastic, only identify the patterns meeting “overbought” (bearish) or “oversold” (bullish) conditions. These patterns are especially significant when accompanied by divergences and/or PeakOut signals. 4.3.1 Inputs: There is only one input for each of the candlestick patterns, Thold. 4.3.2 Explanation of Inputs: Thold identifies the overbought and oversold thresholds used in the in the slow Stochastic filter. A default of 75 means that bearish formations will only be identified when the Stochastic is above 75 and bullish formations below 25. A Thold value of 90 would identify candlestick patterns only if the Stochastic is above 90 or below 10. The lower the setting, the fewer patterns will be filtered. Setting Thold to 0 turns the filter off so that all patterns are identified. 4.3.3 The Kase Engulfing Candlestick Lines (KaseEngulfing_V94D) Bullish and bearish engulfing lines entirely “engulf” the previous candlestick as shown below. The Engulfing line opens beyond the previous bar’s close and closes beyond the previous bar’s open. Bullish Engulfing Bearish Engulfing 4.3.3.1 Color and Style Defaults: Plot name Bullish engulf Bearish engulf Description Bullish Engulfing line Bearish Engulfing line Color: Dark blue Dark blue Copyright 2004-2011 Kase and Company, Inc. All Rights Reserved. Type: Cross below low Cross on high 18 4.3.4 The Kase Evening & Morning Star Candlesticks (KaseEveMornStar_v94D) This three-bar candlestick pattern includes a Harami line, which is a large body candlestick, in the direction of the original trend, a gap, which is usually an exhaustion gap, a star followed by another gap, usually a breakaway gap, and then another Harami line in the opposite direction. For this pattern to be considered complete the second Harami line must close at or beyond the midpoint of the initial Harami line’s body. Morning Star - Bullish Evening Star - Bearish 4.3.4.1 Color and Style Defaults: Plot name MorStar EveStar Description Morning Star Evening Star Color: Red Red Type: Cross below low Cross on high 4.3.5 The Kase Hammer and Hanging Man Patterns (KaseHamHang_V94D) These patterns are stars with long lower shadows. A hammer occurs after down moves and is bullish and the Hanging Man occurs after up moves and is bearish. Often these patterns are leading indicators that occur two or three bars prior to a reversal. Also, they are often found as components of larger patterns such as morning and evening stars. Hammer - Bullish Hanging Man - Bearish 4.3.5.1 Color and Style Defaults: Plot name Hammer HangingMan Description Bullish Hammer Bearish Hanging Man Color: Yellow Yellow Copyright 2004-2011 Kase and Company, Inc. All Rights Reserved. Type: Cross on low Cross on high 19 4.3.6 The Kase Harami Line and Stars (KaseHarami_V94D) A Harami line and star is a two bar pattern. It consists of a Harami line followed by a star, where the body of the star is within the body, the open close range, of the Harami line. Harami Line & Star - Bearish Harami Line & Star - Bullish 4.3.6.1 Color and Style Defaults: Plot name BearHarami BullHarami Description Marks pattern Marks pattern Color: Green Green Type: Cross below low Cross above High 4.3.7 The Kase Piercing and Dark Cloud Cover Candlesticks (KasePiercing_v94D) These patterns are similar to engulfing line, except here, the second Harami line only must close at or beyond the midpoint of the first Harami line’s body. A piercing pattern is similar to a bullish engulfing line, and a dark cloud cover similar to a bearish engulfing line. Piercing Pattern - Bullish Dark Cloud Cover - Bearish 4.3.7.1 Color and Style Defaults: Plot name Piercing DarkCld Description Bullish Piercing Pattern Dark Cloud Cover Color: Dark red Dark red Copyright 2004-2011 Kase and Company, Inc. All Rights Reserved. Type: Cross below low Cross above high 20 CHAPTER 5 Trading Guidelines 5.1 Introduction to Trading with StatWare StatWare is a set of trading indicators that can be combined in a systematic manner. The guidelines below are meant to give guidance as to how to put together an initial system to get started. Once comfortable with StatWare, you can modify our suggested guidelines to suit your individual style. The guidelines outlined revolve around three basic steps: Entering the trade, managing the trade and exiting the trade. 5.2 Setting Up Charts Initially charts should be setup according to the guidelines in Chapter 2, Sections 2.1 through 2.5. Once comfortable with the default chart setups, make sure the risk associated with the charts is consistent with your risk tolerance. For instance when trading the e-mini S&P 500 if you only want to risk 10 points per trade then you should set up your charts so that Dev3 (from KDevStops_V94D) on the chart you are using for exits, usually the normal monitor, is no larger than about 10 points. This can easily be assessed by using KRevAmounts_V94D to monitor the value of Rev3 (the amount of risk carried by Dev3). From this point you may refer back to Chapter 2 to setup your fast monitor and timing charts accordingly. If Dev3 on the normal monitor carries more than 10 points of risk then a shorter bar length is required. Once the normal monitor, fast monitor and timing chart have been chosen it is time to add indicators as outlined in Chapter 2, Sections 2.6 through 2.9. 5.3 Entering a Trade The KEES indicator shows entry signals. As described earlier in Section 4.1.2, small points are used on bars that do not have the proper structure to allow an entry, for example, a first class buy bar with a down close, or a lower high or low. Large points are used on bars that do have the proper structure to allow an entry such as a first class buy bar that had a higher high, higher low and closed up. Further the indicator marks first and second buy and sell signals to make identifying entries easier. A first signal is the initial instance of a long or short signal. A second buy signal is one that occurs after a pullback wherein the previous swing low is held. A second sell signal is one that occurs after a pullback wherein the previous swing high is held. Both first and second signals are also marked with an ‘L’ for buy signals and an ‘S’ for sell signals. Kase recommends waiting for second signals most of the time, however, valid entries can be used at any time when traders wish to exercise discretion. 5.3.1 Initiating a Trade From A Flat Position Entries are normally taken on the fast monitor chart. This is the shortest bar length chart and is the most active. Look for an L followed by an L or an S followed by an S, where the swing high or low holds the initial swing high or low. The chart below shows a first sell signal followed by a pullback and then a second sell signal. Copyright 2004-2011 Kase and Company, Inc. All Rights Reserved. 21 Second Buy Signal 5.3.2 Re-Entry System After an exit of any volume, if Dev3 has not been broken and there is a new valid entry with an ‘L’ or ‘S’ consecutive to an earlier L or S, get back in. In the example below a bearish divergence prompts an exit of 80% (see Section 5.6.2) and stops are pulled into Dev1 for the remaining 20%. A new “L” is generated, while Dev3 holds and the previous swing high holds. Upon this buy signal the position is re-entered fully. Re-Entry Signal 5.3.3 Reversal Signals Similar to the re-entry signal after a partial exit has been taken as described in Section 5.6, should there be second entry signal generated on the timing chart in the opposite direction of the original trade before stops are hit then a reversal can be taken. The chart below shows an 80% exit after a divergence (see Section 5.6.2), and then a second sell signal before Dev1 is hit. At this point the remainder of the long trade is exited and a short trade is established. Copyright 2004-2011 Kase and Company, Inc. All Rights Reserved. 22 Reversal Signal 5.4 Placing and Managing Stops After entering a trade, an “emergency” stop should always be placed at Dev3. The other stop levels, as well as stops based on candlesticks may then be used to manage the risk if exit setups and exit signals are triggered. These danger and exits signals, and the suggested stop levels should danger or exit signals take place, are set forth below in Section 5.6. 5.5 Scaling Up Once a trade has been entered and at stop placed at Dev3 monitor for exits as described in Section 5.6 on the timing chart. At the same time check the fast monitor for a confirming entry signal in the direction of the trade (i.e. long or short). Once a confirming signal is received on the longer bar length, the trade can be scaled up to that chart by moving the stop to the respective Dev3 for the fast monitor. The fast monitor may then be used to watch for exits. Now begin to look for a confirming entry signal on the normal monitor chart and repeat the scaling process. The goal is to continue scaling a trade to longer bar lengths so that premature exits or whipsaws can be avoided and profits can run as markets trend. More risk is taken when stops are moved to Dev3 on the longer bar lengths, but the confirming entry signals usually indicate the market is continuing to move in the profitable direction. If no confirming signal is triggered on the longer bar lengths and there is an exit signal generated, drop back to the flat position and monitor for a reentry as set forth in Section 5.3.1. The chart below shows a scaling situation where the confirming entry signal comes after a trade has been entered. A 15-minute chart is shown on top and the 45-minute chart on the bottom. Here a second sell signal triggered a short entry at 1:45 PM. On the next 45minute bar at 2:15 PM a confirming sell signal formed. Confirming signals must be designated by an ‘S’ for short and an ‘L’ for long, but can be first signals. At that point the trade is scaled to the 45-minute chart and the stop placed at Dev3, and accelerated thereafter as appropriate. Copyright 2004-2011 Kase and Company, Inc. All Rights Reserved. 23 Scaling Up – Confirmation Late The confirmation signal does not always come after the entry signal. As shown on the left below, the confirmation signal formed on the same bar as the second entry signal. In this case the trade can be scaled to the longer bar length upon entry. Scaling Up – Confirmation Same Scaling Up – Confirmation Early It is rare, but in some instances the confirmation signal will trigger before the second buy signal on the smaller bar length. This is shown in the chart on the right above. In this case, once the second buy has been triggered on the timing chart, and a trade entered long, it can be immediately scaled to the longer bar length. 5.6 Exiting a Trade For exits use of three Kase indicators is recommended. These indicators are the Kase PeakOscillator, the KaseCD, and the DevStops. The PeakOscillator and KaseCD are used to identify potential turns through divergences, PeakOuts and KCDpeaks. The DevStops are used to identify exit points. As discussed earlier, anytime a trade is entered a stop is placed at Dev3 by default. Tighter stops are used to manage risk when there are danger or exit signals present. Copyright 2004-2011 Kase and Company, Inc. All Rights Reserved. 24 There are five exit strategies that are normally used. These signals are listed below in order of importance (highest to lowest), and a higher strategy overrides a lower. For example a dual divergence with a KCDpeak calls for a 100% exit even though a KCDpeak alone only calls for 50%. If there is a KCDpeak and an early PeakOut, then 50% is exited right away even though the PeakOut only calls for one-third at Dev1. The Recommended Action column shows how much of a trade should be exited and what stop(s) should be used after the signal takes place. 1. 2. 3 4. 5. Signal Description Dual Divergence: on PeakOscillator AND KaseCD Divergence on PeakOscillator OR KaseCD OR PeakOut late in the direction of the dominant trend Any KCDpeak PeakOut early in the trend No Signal Recommended Action 100% 80% + Dev1 50% + Dev1 Dev1, 2 and 3 equally 100% at Dev3 5.6.1 Exit Signal 1 - Divergence on PeakOscillator AND KaseCD Whenever there is a dual divergence, that is divergences on the KaseCD AND the PeakOscillator, exit 100% of the trade. This is the strongest signal found in Kase’s studies. Dev1 has been hit 95% of the time following this signal. Exit Signal 1 - PeakOscillator AND KaseCD Divergence Copyright 2004-2011 Kase and Company, Inc. All Rights Reserved. 25 5.6.2.1 Exit Signal 2A – Single Divergence on PeakOscillator OR KaseCD Whenever there is a divergence on the KaseCD OR the PeakOscillator (but not both, as above), exit 80% of the trade and pull stops in to Dev1 for the remaining 20%. Dev1 has been hit 83% of the time following this type of signal. Exit Signal 2A - PeakOscillator OR KaseCD Divergence 5.6.2.2 Exit Signal 2B - PeakOut Late In the Direction of Trend Whenever there is a PeakOut late in the direction of the trend exit 80% of the trade and pull stops in to Dev1. Following this signal, Dev1 has been hit 79% of the time. Exit Signal 2B - PeakOut late in trend 5.6.3 Exit Signal 3 - KCDpeak Whenever there is a KCDpeak with no divergence exit 50% of the trade and pull stops in to Dev1. Following the KCDpeak, Dev1 is hit 52% of the time. Copyright 2004-2011 Kase and Company, Inc. All Rights Reserved. 26 Exit Signal 3 - KCDpeak 5.6.4 Exit Signal 4 - PeakOut Early In The Direction of Trend Whenever there is a PeakOut early in the direction of the trend (often following a sharp correction), stops are set to exit one third of the position at each of the three DevStops. In Kase’s study, Dev1 was hit only 37% of the time following this signal, so taking an exit will many times result in a reentry just a few bars later. By pulling in stops and scaling out at Dev1, 2 and 3, exits are consistent with the observed probability of turns. Exit Signal 4 - PeakOut early in trend 5.6.5 Exit Signal 5 – No Signal Though rare, there are times when the market will reverse direction without warning, i.e. a PeakOut, KCDpeak or divergence. When this happens a full exit is take at Dev3. 5.6.6 Inactivity Exit Guidelines At times the market will stagnate at which point an exit can be considered. If there is no profit in the trade after five to eight bars, an exit may be taken due to inactivity. 5.6.7 Position Holders - Daily Chart Exit Rules and Stops Copyright 2004-2011 Kase and Company, Inc. All Rights Reserved. 27 The guidelines outlined above pertain specifically to day traders. For the most part, these rules can also be applied to position holders (traders who hold a position for days to weeks), but with minor variations to placing stops and exits. Position holders can establish a trade by scaling up from the normal monitor to the daily chart using the same scaling rules outlined in Section 5.5. Position holders can also use half- and third-day charts to monitor for exits and warning signals. The list below outlines some of the slightly modified guidelines for position holders. 1. When there are no exit signal setups, set default stop to Dev 3 2. Use candlesticks to accelerate stops as necessary (outlined in Section 5.7 below) 3. If there is no profit in the trade after 3 to 5 bars, exit on inactivity. 5.6.8 “Choppy Market” Trading Guidelines Whenever the market is exhibiting corrective, sideways, or “coalescing” behavior, it is prudent to modify the standard trading guidelines as follows: 1. 2. 3. 4. Trade lighter volume, e.g., 50% vs 100%. Trade shorter bar lengths. Exit more aggressively, e.g., 100% instead of 80%. Default to Dev2 instead of Dev3. 5.7 Trading with the Kase Candlestick Indicators In addition to the DevStops, Kase Candlesticks may be added to the trading strategy to fine-tune exits. Usually, Kase Candlesticks are only incorporated in the strategy when the equivalent of 90-minute bars or longer are being used. Note that the hanging man and hammer patterns cannot be used by themselves for exits, and so are not included in the discussion below. The concept with the candlesticks is that if a candlestick pattern is forming, the initial stops, either the warning line or Dev1, can be shifted to either the completion point –the midpoint of the initial Harami line, or the confirmation point – the open of the initial Harami line. When accelerating exits, for example, if the midpoint of the initial Harami line is being used instead of Dev1, then Dev1 would be used instead of Dev2, etc. Candlestick patterns should be taken into consideration, especially, if the pattern is coincident with a KCDpeak or PeakOut and/or divergence or setup(s). 5.7.1 The Kase Engulfing Candlestick Lines (KaseEngulfing_v94D) or The Kase Piercing and Dark Cloud Cover Candlesticks (KasePiercing_v94D) There is no way before the close of either pattern to see if the bar will close beyond the initial bar’s open or only at or beyond the midpoint. When trading intra-day, with the exception of the last bar of the day, wait for the bar to complete to determine if the close satisfies candlestick pattern requirements. For the last bar of the day and for daily and Copyright 2004-2011 Kase and Company, Inc. All Rights Reserved. 28 longer bars, an assumption about the close a few minutes early in anticipation of the close may be made to accelerate exits. The example below shows a bullish piercing pattern. One would anticipate that the market was going to close above the completion point (red) and accelerate the exit by changing Dev1 to the price at that point. Then if Dev1 was above the confirmation point (blue), the confirmation point would become Dev2, otherwise Dev1 would take the place of Dev2, etc. Bullish Piercing Pattern Accelerated Stops 5.7.2 The Kase Evening & Morning Star Candlesticks (KaseEveMornStar_v94D) After the formation of the first two candles – the Harami line followed by the star above or below the body of the Harami line - use accelerated stops. Both the completion and confirmation points can be used as shown in the chart below. The completion point replaces Dev1 and if Dev1 is above the confirmation point, the confirmation point replaced Dev2, otherwise Dev1 becomes Dev2 and so forth. Evening Star Accelerated Stops Copyright 2004-2011 Kase and Company, Inc. All Rights Reserved. 29 5.7.3 The Kase Harami Line and Star (KaseHarami_V94D) In the case of the Harami Line and Stars, if the star’s close is not at or beyond the midpoint of the Harami line, use the completion point for an exit on the next bar to accelerate exits. If the body straddles the midpoint or is below the midpoint, use the confirmation point on the next bar to accelerate exits. In the first example on the left, the bearish Harami line and star is not complete because the midpoint of the Harami line has held on a closing basis. Therefore, stops can be placed at the completion point and/or the confirmation point to accelerate exits. Bearish Harami Line and Star Stops at Completion and Confirmation Bullish Harami Line and Star Stop at Confirmation The example on the right shows an instance where the Harami line and star is completed, but not yet confirmed. Dev1 would be accelerated to the completion point. Dev2 would become the lower of Dev1 or the confirmation point. Copyright 2004-2011 Kase and Company, Inc. All Rights Reserved. 30 CHAPTER 6 Troubleshooting 6.1 General Problems For problems not directly related to using Kase’s indicators, please check your NinjaTrader™ user’s manual or call NinjaTrader technical support, or the technical support line for your data vendor (FutureSource, S&P Comstock, BMI, Telerate, etc.). 6.2 Indicators Coming Up Zero, Nothing Is Plotting If all of your indicators in the entire package are coming up zero, then your Verification Key has most likely expired. Give the Kase Call Center a call at 505-237-1600 and an update of your Verification Key will be arranged, consistent with our contractual arrangements. See Chapter 4 to change your Key. Please be aware of the expiration date of your software. If any indicator is coming up zero while others are not, then you probably do not have enough data to initialize the indicator. Generally, the number of bars required to initialize an indicator is about 65. 6.3 Unable to See the Indicators Well Our indicators are designed for use with a white background and black bars. Either change your background to white and bars to black, or change the indicators to colors suitable for whatever background you are using. This is done through the Style selection in the Format Indicator dialog box for the indicators themselves and through the Inputs selection in the Format Indicator dialog box for custom programmed displays. Through the Style selection, you may also make the indicators bolder, or redesign the style altogether. See Chapter 2. 6.4 My Indicators Take A Very Long Time To Initiate Data Stream Too Long – For your normal monitor chart, you should most likely not need any more than about 50 days and for your timing chart, 20. If you have a long data stream, for example, 100 days of 5-minute bars, the computer needs to perform calculations for all 100 days. Too Many Workspaces – Try opening fewer workspaces at once. . Copyright 2004-2011 Kase and Company, Inc. All Rights Reserved. 31 All rights reserved. No part of this publication may be reproduced, stored in a retrieval system, or transmitted, in any form or by any means, electronic, mechanical, photocopying, recording, or otherwise, without the prior written permission of Kase and Company, Inc. CFTC Compliance Notice HYPOTHETICAL PERFORMANCE RESULTS HAVE MANY INHERENT LIMITATIONS, SOME OF WHICH ARE DESCRIBED BELOW. NO REPRESENTATION IS BEING MADE THAT ANY ACCOUNT WILL OR IS LIKELY TO ACHIEVE PROFITS OR LOSSES SIMILAR TO THOSE SHOWN. IN FACT, THERE ARE FREQUENTLY SHARP DIFFERENCES BETWEEN HYPOTHETICAL PERFORMANCE RESULTS AND THE ACTUAL RESULTS SUBSEQUENTLY ACHIEVED BY ANY PARTICULAR TRADING PROGRAM. ONE OF THE LIMITATIONS OF HYPOTHETICAL PERFORMANCE RESULTS IS THAT THEY ARE GENERALLY PREPARED WITH THE BENEFIT OF HINDSIGHT. IN ADDITION, HYPOTHETICAL TRADING DOES NOT INVOLVE FINANCIAL RISK, AND NO HYPOTHETICAL TRADING RECORD CAN COMPLETELY ACCOUNT FOR THE IMPACT OF FINANCIAL RISK IN ACTUAL TRADING. FOR EXAMPLE, THE ABILITY TO WITHSTAND LOSSES OR TO ADHERE TO A PARTICULAR TRADING PROGRAM IN SPITE OF TRADING LOSSES ARE MATERIAL POINTS WHICH CAN ALSO ADVERSELY AFFECT ACTUAL TRADING RESULTS. THERE ARE NUMEROUS OTHER FACTORS RELATED TO THE MARKETS IN GENERAL OR TO THE IMPLEMENTATION OF ANY SPECIFIC TRADING PROGRAM WHICH CANNOT BE FULLY ACCOUNTED FOR IN THE PREPARATION OF HYPOTHETICAL PERFORMANCE RESULTS AND ALL OF WHICH CAN ADVERSELY AFFECT ACTUAL TRADING RESULTS. THE RISK IN TRADING COMMODITIES OR DERIVATIVE PRODUCTS CAN BE SUBSTANTIAL. BOTH TRADERS AND HEDGERS CAN BE SUBJECT TO MARK-TO-MARKET LOSSES AND THE RESULTANT CALLS FOR ADDITIONAL MARGIN DEPOSITS, WHICH COULD POTENTIALLY EXCEED THE ORIGINAL DEPOSIT, MADE. ANYONE CONTEMPLATING THE USE OF SUCH INSTRUMENTS FOR EITHER SPECULATIVE OR HEDGING TRANSACTIONS SHOULD THEREFORE CAREFULLY CONSIDER WHETHER SUCH ACTIVITY IS SUITABLE BASED UPON COMMERCIAL REQUIREMENT AND THE FINANCIAL CONDITION OF THE PERSON OR ORGANIZATION SO ENGAGED. INFORMATION CONTAINED HEREIN IS NOT TO BE CONSIDERED AS AN OFFER TO SELL OR A SOLICITATION TO BUY COMMODITIES OR DERIVATIVES. KASE AND COMPANY, INC. MAKES NO GUARANTEES, EITHER EXPRESS OR IMPLIED, REGARDING THE APPLICATION OF EITHER ITS SOFTWARE OR ITS ADVICE. KASE WILL NOT BE RESPONSIBLE FOR ANY TYPOGRAPHICAL ERRORS. EXPRESSIONS OF OPINION ARE SUBJECT TO CHANGE WITHOUT NOTICE. National Futures Association Compliance Rule 2-29 Interpretive Notice Copyright 2004-2011 Kase and Company, Inc. All Rights Reserved. 32