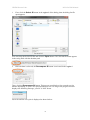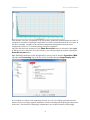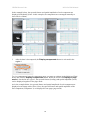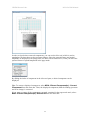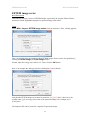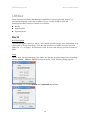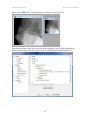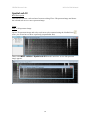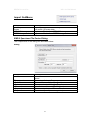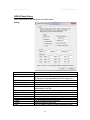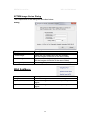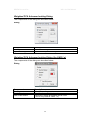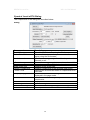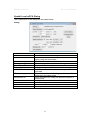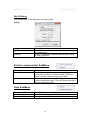
1
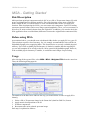
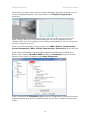
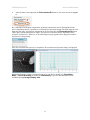
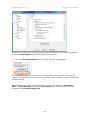
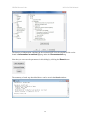
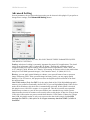
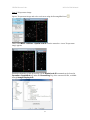
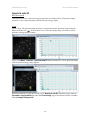
2015/July
MSA for DigitalMicrograph
Multivariate Statistical Analysis
Advanced Manipulation Tools
for Spectrum Images (SIs)
MSA User Manual v2.1
HREM Research Inc.
HREM Research Inc.
MSA for DM Manual
Contact Information
General enquiries on the MSA plug-in for DigitalMicropraph should be sent to:
HREM Research Inc.
14-48 Matsukazedai
Higashimatsuyama
Saitama 355-0055
Japan
Email:
Website:
[email protected]
http://www. hremresearch.com/
Enquiries on MSA of a technical nature should be directed to:
Dr. Masashi Watanabe
Department of Materials Science and Engineering/
Center for Advanced Materials and Nanotechnology
Lehigh University, Bethlehem, PA18015, USA
[email protected]
Email:
http://www.lehigh.edu/~maw3/index.html /
Acknowledgements
The scientific developer of this method (Dr. Masashi Watanabe.) would like to
acknowledge to all authors of the references cited in this manual for their
collaboration in the process of its application to the scientific problems presented in
these cited papers.
Copyright Statements
© Copyright 2008-2015 HREM Research Inc (Japan) and Lehigh University
All rights reserved. This manual is protected by international copyright laws and
treaties. Unauthorized reproduction and distribution of this manual, or any portion of it,
will be prosecuted to the maximum extent possible and may result in severe civil and
criminal penalties.
Portions of this document were prepared by HREM Research Inc. by editing the
materials supplied by Dr. Masashi Watanabe.
DigitalMicrograph is a trademark of Gatan Inc.
2
HREM Research Inc.
MSA for DM Manual
Conventions
The typographic conventions used in this manual are described below.
Convention
Bold
Menu...MenuOption
CAPS
Italics
Description
Used to denote specified elements of the user interface such as
buttons, field names, menus, and menu options.
For example, the New button.
Select the Menu from the Menu bar then select the Menu Option
from the Menu.
For example, File...Open would mean select the File Menu and
then the Open Option.
Used to denote the name of a key on the keyboard.
For example, the ENTER key.
Used to denote emphasis, captions and the result of an action in a
procedure.
3
HREM Research Inc.
MSA for DM Manual
Table of contents
Welcome to MSA
5
Software Requirements
Software Installation
6
6
MSA - Getting Started
7
Brief Description
Before using MSA
Usage
7
7
7
Local wPCA
16
16
17
19
Brief Description
Spectrally Local PCA
Spatially Local PCA
MSA - Advanced Topics
21
Output files
Advanced Setting
References related to the PCA process
Import functions
21
23
24
25
EMSA spectrum file series
XED-SI data
EFTEM image series
25
28
33
Utilities
34
Bin SI
Spatial sub SI
Spectral sub SI
34
36
38
Quick Reference Guide
40
4
HREM Research Inc.
MSA for DM Manual
Welcome to MSA
Welcome to MSA, the multivariate statistical analysis (MSA) plugin package for Gatan
DigitalMicrograph.
The current package version is 2.1, which consists of following functions:
!
Import
!
!
!
!
EMSA spectrum series import: import a series of EMSA spectra
XED-SI data import: import an x-ray SI data file
EFTEM image series import: import a series of EFTEM images
MSA
Weighted-PCA: apply weighted principal component analysis on SI
Local wPCA: apply weighted PCA on local regions of SI data
Utilities
! Bin SI: apply spatial/spectral binning on SI data
! Spatial sub SI: extract spatially partial SI data
! Spectral sub SI: extract spectrally partial SI data
! Extract component(s): extract a component(s) from a stacked component(s)
Release notes
!
!
!
!
These plugins should work in GMS version 1.7.1 or higher.
Information of the package version and available functions can be seen by selecting
MSA...About MSA
5
HREM Research Inc.
MSA for DM Manual
Software requirements
The following is a list of the software requirements necessary to run the MSA plug-in:
- DigitalMicrograph (GatanTM)
- USB Key Driver
- IPU Plug-in (freeware downloadable from www.hremresearch.com)
Software Installation
Installing USB Key Driver
The user key driver should be installed by following the instructions given by the key driver
installer. You can find the key driver installer at the plug-in page on HREM Research web
site.
Installing DigitalMicrograph Plug-ins
The DigitalMicrograph Plug-in will be provided as Gatan compiled script file(s) (.gtk) and
dynamic link library file(s) (.dll). All these files can be installed by copy-and-paste to the
folder “PlugIns.” (The PlugIns folder should exist under a normal installation of the
DigitalMicrograph).
When the DigitalMicrograph is launched after placing the plug-ins into the PlugIns folder, the
PlugIns will appear as a new menu or an addition to the standard tools.
Installing IPU Plug-in
The MSA plug-in uses some functions based on the Intel’ MKL (Math Kernel Library)
provided by the IPU plug-in. All the files relating the IPU plug-in can be installed by copyand-paste copy. The IPU plug-in will appear as under IPU menu. Please consult the ReadMe
file that comes with the IPU plug-in.
Installing MSA
DMMSA32(64).dll,
DMMSAUtils32(64).dll
and
DMMSA32(64).gtk can be installed by drag-and-copy to
the folder “PlugIns” (The PlugIns folder should exist
under a normal installation of the DigitalMicrograph.)
When the DigitalMicrograph is launched after placing the
plug-ins into the PlugIns folder, MSA menu commands
will appear.
New features of version 2
MSA 2.x is a major upgrade that includes local PCA analysis, which will reduce some
artifacts and substantially extend an area of application of the PCA.
6
HREM Research Inc.
MSA for DM Manual
MSA - Getting Started
Brief Description
MSA performs principal component analysis (PCA) to a 2D or 3D spectrum image (SI) with
proper weighting based on Poisson statistics. Since this function creates many result files
from a single SI file, it would be better to create a dedicated folder before you apply this
function. After decomposing the SI file, you can extract each component: a pair of a loading
spectrum (spectral feature) and a score image (spatial amplitude). Then, you can reconstruct a
noise-free (or noise-reduced) dataset from the original SI. In addition, you can also check the
PCA application from a residual data (difference between the original and reconstructed SIs).
Before using MSA
As mentioned above, you should create a dedicated folder before you apply PCA to your SI.
This technique requires a lot of memory. So, it is strongly recommended to close all files in
DigitalMicrograph prior to applying MSA. This function tries to use only available physical
memory. Even if the available physical memory is limited or smaller than the targeting SI,
you can still complete PCA as long as the SI can be opened in DigitalMicrograph. However,
if the available physical memory is smaller, it would take much longer for processing.
Usage
After closing all the opened files, select MSA…MSA…Weighted PCA from the menu bar.
Then, the following dialog appears.
The numbers in the blue boxes indicate the step you should follow in order to apply PCA.
Namely,
1. Select a 2D or 3D spectrum image in the Gatan dm3 (dm4 for GMS 2.x) format
2. Apply matrix decomposition to the SI
3. Evaluate components
4. Reconstruct the noise-reduced spectrum image
Each step is explained as follows:
7
HREM Research Inc.
1.
MSA for DM Manual
First, click the Select SI button in the region 1 of the dialog, then the dialog for file
open appears.
You can select the desired SI file and click the Open button. The selected file name appears
in the string filed with the absolute path
2.
Once the data is selected, the Decompose SI button is activated in the region 2.
Then, click the Decompose SI button. This process would take a few seconds to a few
minutes depending on your CPU speed and the data size. As long as the progress window
displays the following message, your PC is NOT frozen.
Just wait until the scree plot is displayed as shown below:
8
HREM Research Inc.
MSA for DM Manual
Note that the scree plot is logarithm of the eigenvalues graphically plotted against the index of
component. A number of principal components is usually evaluated based on the scree plot. In
the above example, a number of the principal components distinguished from the noise
components can be 6 or 7 from the primary principle component.
Once the data has been decomposed, the Show Scree plot button is activated in the region
2. When you have closed the scree plot window, you can open again the window clicking the
Show Scree plot button.
Tips: Detailed information of this Weighted PCA process can be found in Operation: MSA
tag under the Processing Tag of the Scree Plot, available through Image Display Info.
It is essential to evaluate each component in terms of a pair of a loading spectrum (spectral
feature) and a score image (spatial amplitude) in order to distinguish the principal components
from noise. The function of displaying components is one of main features of this plugin.
9
HREM Research Inc.
MSA for DM Manual
In the example below, the spectral feature and spatial amplitude of each component are
displayed individually (Note: in this example, the components are rearranged manually to
show all six of them).
3.
After the data is decomposed, the Display components button is activated in the
region 3.
To view components, input the component range you want to evaluate in the Initial and Final
boxes and click the Display components button. When the check box Display in page
mode is checked in the region 3, the spectral feature (loading) and spatial amplitude (score)
can be displayed together in the page mode.
As in the example below, the spectral feature and spatial amplitude of each component are
displayed as an image stack (Slice). Here, the spectral feature and spatial amplitude of the
first component (Component 1) are displayed in one page (page mode).
10
HREM Research Inc.
MSA for DM Manual
In order to check other extracted components, you can use the slice tool, which is used to
manipulate 3D data cubes such as spectrum images. Since the spectral feature and spatial
amplitude are displayed as an image stack, the slice tool becomes active, when you select the
spectral feature or spatial amplitude in the page mode.
By sliding the index of component in the slice-tool pane, a desired component can be
displayed.
Tips: To extract a displayed component, select MSA...Extract Component(s)...Current
Component from the menu bar. Then, the displayed component (both the loading spectrum
and score image) is extracted.
If you want to extract all the components currently contained in the page mode stack, select
MSA...Extract Component(s)...Extract All from the menu bar.
11
HREM Research Inc.
MSA for DM Manual
Alternatively, the image stacks of spectral features (loadings) and spatial amplitudes (scores)
can also be displayed separately (not a page mode), if the Display in page mode is
unchecked.
Again, using the slice tool, an individual loading and score of the components can be
evaluated. (The slices of the loading and score changes simultaneously, when you change one
of them by using the slice tool.)
In order to extract individual or all components, select MSA...Extract...Component(s)...
Current Component or MSA...Extract Component(s)...Extract All from the menu bar.
Again, detailed information of the individual components including this weighted PCA
process can be found in Operation: MSA tag under the Processing Tag of the Loading
spectra or Score images, available through Image Display Info.
It may be noted that the information (%) tag under the Component tag indicates the fraction
of information that this particular component (index 3 in the above example) contains in this
SI data.
12
HREM Research Inc.
4.
MSA for DM Manual
After the data is decomposed, the Reconstruct SI button is also activated in the region
4.
By evaluating of individual components, principal components can be distinguished from
noise components and it is possible to reconstruct the spectrum image data with reduced noise.
Input the last index of principal component in the box and click the Reconstruct SI button.
Then, data reconstruction process starts. This process could take longer depending on the
using PC and data size. However, if the following message appears in the progress window,
the process is progressing.
After the reconstruction process is completed, the reconstructed spectrum image is displayed.
Detailed information of the reconstruction process can also be found in in Operation:
MSA ... Reconstruction tag under the Processing Tag of the Reconstructed SI file,
available through Image Display Info.
13
HREM Research Inc.
MSA for DM Manual
The fraction of information contained in the reconstructed SI file over the original SI file can
be found in Information (%) tag under the Reconstruction tag.
5.
Now, the Show Residual SI button is finally activated in the region 5.
The residual SI is the difference between the original and reconstructed SIs. Therefore, the
validity of reconstruction can be confirmed by comparing the residual SI with the original and
reconstructed SIs.
Detailed information of the reconstruction process can also be found in in Operation:
MSA ... Reconstruction Tag under the Processing Tag of the Reconstructed SI file,
available through Image Display Info.
14
HREM Research Inc.
MSA for DM Manual
The fraction of information contained in the residual SI file over the original SI file can be
found in Information in residual (%) tag under the Reconstruction tag.
Note that you can reset the parameters in this dialog by clicking the Reset button
The summary of each step described above can be seen in the Result window.
15
HREM Research Inc.
MSA for DM Manual
Local PCA
Brief Description
PCA (Principal Component Analysis) of the MSA plug-in is briefly explained above. The
PCA approach tries to explain the data variation (variance) as much as possible using a small
number of components. If the variance in random surpasses any fluctuation of true signals, the
PCA may not successfully extract the signals as components. In the worst case, PCA might
induce unexpected artefacts. Such situations might arise when you are analysing SI datasets
containing minor or trace-level impurities in matrix, interface components, or weak signals in
a wide variation of the background:
In general, there may be two possible approaches to improve the PCA sensitivity: one is to
reduce random noise components in the SI datasets and other is to enhance true variations.
The former requires modifications in experimental conditions, e.g. higher currents and/or a
longer acquisition time to enhance signals (remember, more signal counts are always
beneficial even for PCA!). Conversely, the latter can be achieved by applying PCA treatment
to small segments divided from an original SI dataset. We provide this functionality in this
MSA plug-ins, which is now called the local PCA approach. The segments can be achieved
spatially and spectrally as shown below.
The spatially local PCA approach might enhance moderate signals, which are not repeated
very frequently in the SI datasets. For example, signals from interface segregant elements on
grain boundaries with relatively large grain components (Note: in this case, we also
recommend to extract a part of the SI dataset in the vicinity of the grain boundaries).
The spectrally local PCA is useful to enhance weak signals in a SI dataset, in which higher
signal intensities are also contained, e.g. characteristic edge-signals at a high energy-loss
region with lower energy-loss signals (i.e. most of EELS SIs!).
Both local PCA approaches are available in the MSA plug-in. Users can decide the division
direction (spatially or spectrally) and a number of divided segments prior to applying the local
PCA method. Then, all the local segments are processed sequentially, and component
evaluation and following data reconstruction of all the segments can be carried out together.
16
HREM Research Inc.
MSA for DM Manual
Spectrally Local wPCA
The dialog below corresponds to Spectrally Local weighted PCA. Most of the components of
this dialog are essentially similar to those in the regular weighted PCA dialog.
One of the major differences in the local PCA process is that the user must specify a data
folder (where all intermediate output files are saved in the local PCA process).
Furthermore, in this dialog you have to define a segment size by specifying either a number of
channels or an energy width in eV. In either case, you can convert one to the other by using
the Convert button. The odd channels will be included in the last segment. In the example
above, the original SI dataset will be divided spectrally into the segments of 300 channels
except the last one that contains 440 channels.
Simply by clicking the Decompose SI button, you can decompose all the local segments
one-by-one automatically.
After decomposition process is completed, you can check all Scree plots of individual
segments by using Show Scree Plots button, similar to the regular PCA.
Since the scree plot is independent at each local segment, you can obtain scree plots as many
as the number of segments. So, Show Scree Plots shows all the scree plots of local regions
as a 2D SI file shown above. Each horizontal line corresponds to the scree plot obtained from
a specific energy region.
Tips: You may see that a number of the scree plots is larger than a number of segments
defined in the dialog. This is because the local segments shifted halfway are also processed to
avoid a disruption at the boundary of each segment.
17
HREM Research Inc.
MSA for DM Manual
You can also evaluate loading and score of components at a selected local segment by using
Display Components in the similar way to the regular PCA.
Tips: From the pull-down to select a specific region you may find that the local segments
shifted halfway are also processed.
Using Reconstruct SI you can reconstruct the SI data using the specified number of the
components. In this version, the same number of the components is used for reconstruction at
all the local segments.
18
HREM Research Inc.
MSA for DM Manual
Spatially Local wPCA
The dialog below corresponds to Spatially Local weighted PCA. Most of the components of
this dialog are essentially similar to those of the regular PCA dialog.
One of the major differences in the local PCA process is that the user must specify a data
folder (where all intermediate output files are saved in the local PCA process).
Furthermore, in this dialog you have to define a segment area size by selecting a number of
pixels. The odd pixels will be included in the last segment. In the example above, the original
SI dataset will be divided spatially into the segments of 50 pixels in both x- and y-direction
except the last segment that contains 62 pixels in x-direction, and 58 pixels in y-direction.
Simply by clicking the Decompose SI button, you can decompose all the local segments
one-by-one automatically.
After decomposition process is completed, you can check all Scree plots of individual
segments by using Show Scree Plots button, similar to the regular PCA.
Since there is one scree plot for each local region, Show Scree Plots shows the scree plots
of all regions in a 3D image and a 2D image as shown below:
19
HREM Research Inc.
MSA for DM Manual
Since the scree plot is independent at each local segment, you can obtain scree plots as many
as the number of segments. So, Show Scree Plots shows all the scree plots of local regions
as 2D and 3D SI file shown above. In the 2D scree plots (left), each horizontal line
corresponds to the scree plot of a specific region. In the 3D Scree Plots (right), the direction
of the scree plot (i.e. the index of component) is z-direction, and you can use Spectrum
Picker tool
to select a specific scree plot, similar to a 3D SI file. The numbers of pixels
in x and y directions in the 3D scree-plot file correspond to the number of local segments in x
and y directions divided in the spatial local PCA process. Therefore, a scree plot at a certain
position in the 3D scree-plot file indicates that in the specific segment. It should be noted that
both the 2D and 3D scree-plot files represent the same result, but only the display style is
different.
Tips: You may see that a number of the scree plots is larger than a number of segments
defined in the dialog. This is because the local segments shifted halfway are also processed to
avoid a disruption at the boundary of each segment.
You can also evaluate loading and score of components at a selected local segment by using
Display Components in the similar way to the regular PCA.
Tips: From the pull-down to select a specific region you may find that the local segments
shifted halfway are also processed.
Using Reconstruct SI you can reconstruct the SI data using the specified number of the
components. In this version, the same number of the components is used for reconstruction at
all the local segments.
20
HREM Research Inc.
MSA for DM Manual
MSA – Advanced Topics
Output files
Many output files are generated from a single spectrum image by this PCA plugin. Here is the
summary:
If a spectrum image file in the dm3 format named foo.dm3 is processed, following files are
generated:
"
foo-org.raw: original data converted from the original dm3 file (8 byte real, binary)
"
foo-result.txt: summary of eigenvalues for scree plot (ascii)
"
"
foo-eigen.raw: full eigenvalues (8 byte real, binary)
foo-loading.raw: limited loading matrix (8 byte real, binary)
21
HREM Research Inc.
"
"
"
"
MSA for DM Manual
foo-score.raw: limited score matrix (8 byte real, binary)
foo-reconstructed.raw: reconstructed data matrix (4 byte real, binary)
foo-residual.raw: area15-residual.raw: difference between original and reconstructed data
matrices (4 byte, binary)
foo-reconstruction.log: summary of reconstruction (ascii)
22
HREM Research Inc.
MSA for DM Manual
Advanced Setting
Several parameters for pre-processing/processing can be chosen in this plugin. If you prefer to
change those settings, click Advanced Setting button.
Then, a sub dialog appears.
Caution: If you do not have any idea, DO NOT CHANGE THESE PARAMETERS (KEEP
THE DEFAULT SETTING)!
Scaling: selection of scaling is extremely important for proper PCA applications. The detail
can be seen in literature (R.N. Cochran & F.H. Home, "Statistically weighted principal
component analysis of rapid scanning wavelength kinetics experiments", Anal. Chem., 49
(1977) 846-853; M.R. Keenan, P.G. Kotula, "Accounting for Poisson noise in the multivariate
analysis of ToF-SIMS spectrum images", Surf. Interface Anal., 36 (2004) 203-212).
Binning: you can apply spatial binning to enhance your spectral features from a spectrum
image with many pixels. If the spectrum image has many pixels, you may apply spatial
binning of 2 or 4. However, this preprocess does not degrade spatial resolution in the final
decomposed data.
Use 64-bit routine (Only for GMS 1.x): the major limit of the 32-bit DigitalMicrograph is
memory size to allocate continually (about 2GB). If you use DigitalMicrograph 32bit version
under 64-bit Windows, this check box is automatically activated. If this option is checked,
this plugin uses a 64-bit PCA routine via a system call. This 64-bit routine can expand the
limitation up to whatever your PC has (now 4GB is just a standard in any 64-bit system).
Other than that, this 64-bit routine works exactly same as this plugin. If data size is larger than
2 GB, this 64-bit routine can process much faster than the 32-bit routine. If data size is larger
than 8 GB, this 64-bit routine is only way to process the data in this plugin. In the MSA
package for GMS 2.x, this option is no longer necessary because GMS 2,x 64bit is
available!
23
HREM Research Inc.
MSA for DM Manual
References related to the PCA process
General references related to the PCA process:
1. S.J. Gould, The Mismeasure of Man, Norton, New York, NY, (1996).
2. P. Geladi & H. Grahn, Multivariate Image Analysis, Wiley, West Sussex, UK, (1996).
3. J.T. Jolliffe, Principal Component Analysis, 2nd ed., Springer, New York, NY, (2002).
4. E.R. Malinowski, Factor Analysis in Chemistry, 3ed ed., Wiley, New York, NY, (2002).
Specific references of PCA applications for electron microscopy:
1. P. Trebbia & N. Bonnet, "EELS elemental mapping with unconventional methods I.
Theoretical basis: Image analysis with multivariate statistics and entropy concepts",
Ultramicrosc., 34 (1990) 165-178.
2. J.M. Titchmarsh & S. Dumbill, "Multivariate statistical analysis of FEG-STEM EDX
spectra", J. Microsc., 184 (1996) 195-207.
3. N. Bonnet, N. Brun & C. Colliex, "Extracting information from sequences of spatially
resolved EELS spectra using multivariate statistical analysis", Ultramicrosc., 77 (1999)
97-112.
4. J.M. Titchmarsh, "Detection of electron energy-loss edge shifts and fine structure
variations at grain boundaries and interfaces", Ultramicrosc., 78 (1999) 241-250.
5. P.G. Kotula, M.R. Keenan & J.R. Michael, "Automated analysis of SEM X-ray spectral
images: a powerful new microanalysis tool", Microsc. Microanal., 9 (2003) 1-17.
6. M.R. Keenan, P.G. Kotula, "Accounting for Poisson noise in the multivariate analysis of
ToF-SIMS spectrum images", Surf. Interface Anal., 36 (2004) 203-212.
7. M. Watanabe, D.B. Williams & M.G. Burke, "Atomic-Level Analytical Electron
Microscopy of Diffusional Phase", in Proc. Inter. Conf. on Solid-Solid Phase
Transformations in Inorganic Materials 2005 - Vol. 2, The Minerals, Metals and
Materials Society, Warrendale, PA, pp. 431-442 (2005).
8. M.G. Burke, M. Watanabe, D.B. Williams & J.M. Hyde, "Quantitative characterization of
nanoprecipitates in irradiated low alloy steels: advances in the application of FEG-STEM
quantitative analysis to real materials", J. Mater. Sci., 41 (2006) 4512.
9. M. Bosman, M. Watanabe, D.T.L. Alexander, and V.J. Keast, "Mapping chemical and
bonding information using multivariate analysis of electron energy-loss spectrum images",
Ultramicrosc., 106 (2006) 1024.
10. P.G. Kotula, M.R. Keenan, J.R. Michael, "Tomographic spectral imaging with
multivariate statistical analysis: comprehensive 3D microanalysis", Microsc Microanal.,
12 (2006) 36-48.
11. P.G. Kotula & M.R. Keenan, "Application of Multivariate statistical analysis to STEM
X-ray spectral images: interfacial analysis in microelectronics", Microsc Microanal., 12
(2006) 538-544.
12. M. Bosman, V.J. Keast, M. Watanabe, A.I. Maaroof & M.B. Cortie, "Mapping surface
plasmons at the nanometre scale with an electron beam", Nanotechnology, 18 (2007)
165505 (5pp).
13. T. Yaguchi, M. Konno, T. Kamino & M. Watanabe, "Observation of three-dimensional
elemental distributions of a Si-device using a 360-degree-rotation FIB/STEM system",
Ultramicrosc., 108 (2008) 1603-1615.
24
HREM Research Inc.
MSA for DM Manual
Import Functions
Three import functions are available in this plugin package. These functions import a series of
spectra/images and s spectrum image obtained from different software or acquisition systems,
and convert them as a single spectrum image in the dm3 format. Currently available functions
are as follows:
"
"
"
EMSA spectrum series import
XED-SI data import
EFTEM image series import
EMSA spectrum file series
Brief Description
This function imports a series of EMSA formatted X-ray spectra (i.e. a line profile) into Gatan
DigitalMicrograph as a 2D spectrum image.
Usage
Select MSA...Import...EMSA spectrum file series from the menu bar. Then, a dialog
appears.
First, you should select a folder, where a series of EMSA formatted X-ray spectra is saved, by
clicking the Select folder button.
Second, input the rootfile name and extension name into the fields. Note that the EMSA
formatted files must be named as foojjj.ext, where foo is the rootfile name, jjj is an index
number of the series and ext is the extension name. For example, Linescan4.emsa or
Spectrum10.txt. If there is a space between the rootfile name and an index number (e.g.
default output name from Oxford INCA system), add a space after the root name in the Root
filename box.
Third, input list of index numbers in the file numbers field, e.g. case 1: 1-100 (if you want to
import 100 spectra (#1 - #100) continuously) or case 2: 1-8, 10, 12, 14, 15-48, 51-78, 80 (if
25
HREM Research Inc.
MSA for DM Manual
you want to skip spectrum #9, #11, #13, #49, #50 and #79). You can set the range of spectra
to be imported just as setting of page range in the general print dialog.
Then, input the Step scale and Step Unit in the fields. For example, input 5.0 and nm into the
fields respectively if you measured the line profile with 5 nm step.
Finally, click the OK button.
Here is an example of the dialog just before clicking the Import button.
Example for case 1:
Example for case 2:
The imported file can be treated as a 2D spectrum image. So, individual spectra can be
displayed via Spectrum Picker tool
in the tool bar (after DigitalMicrograph version
3.11.1) or in the Basic Tools window (before version 3.11.1) as shown below:
26
HREM Research Inc.
MSA for DM Manual
27
HREM Research Inc.
MSA for DM Manual
XED-SI data
Brief Description
This function imports an X-ray energy dispersive spectrum-image (XED-SI) saved in a binary
format from your software for X-ray acquisition/analysis. Currently, this routine can load
"foo.raw" files from Oxford INCA system and "foo.spd" files from EDAX Genesis system
(where "foo" means the spectrum image file name). In addition, any "uncompressed" binary
3D data can be loaded if you can figure out the file format. You may need to consult the
original software manual or manufacture whether you can save X-ray spectrum images as a
regular binary file.
Usage
Select MSA...Import...XED-SI data from the menu bar. Then, a dialog appears.
First, should select your system for X-ray analysis by clicking the radio button.
28
HREM Research Inc.
MSA for DM Manual
Case 1: if you select Oxford INCA, several fields become gray out.
You do not fill the gray fields since this function will obtain the parameters from "foo.rpl" file,
which is saved with "foo.raw" file in INCA software (so, you must locate the "foo.rpl" file
with the "foo.raw" file in the same folder). Now, the most important thing is to input the Eaxis scale, which is the value of channel/keV. This is essential. If you leave this E-axis scale
field as 0.0, you will see an error message. Then, click the OK button and select a desired
"foo.raw" file.
29
HREM Research Inc.
MSA for DM Manual
Case 2: if you select EDAX Genesis, again several fields are gray out.
To obtain the parameters for a Genesis spectrum image, this function looks for "foo_SE1.txt"
file. When X-ray spectrum image was acquired in EDAX genesis system, an electron image
(such as bright-field STEM, annular dark-field STEM, or secondary electron image etc.), you
should save the image as a tiff file. The "foo_SE1.txt" file is automatically saved when you
save the image as tiff. You must put this "foo_SE1.txt" file into the same folder, where the
corresponding "foo.spd" file is saved. Then, click the OK button and select a desired
"foo.spd" file.
30
HREM Research Inc.
MSA for DM Manual
Case 3: if you select Bruker, several fields become gray out.
You do not fill the gray fields since this function will obtain the parameters from "foo.rpl"
file, which is saved with "foo.raw" file in Bruker software (so, you must locate the "foo.rpl"
file with the "foo.raw" file in the same folder). Now, the most important thing is to input the
E-axis scale, which is the value of channel/keV. This is essential. If you leave this E-axis
scale field as 0.0, you will see an error message. Then, click the OK button and select a
desired "foo.raw" file.
31
HREM Research Inc.
MSA for DM Manual
Case 4: if you do not have parameter files (for Oxford INCA or EDAX Genesis or Bruker),
you can still import your "uncompressed" binary spectrum-image data by filling all the
required parameters. Here is an example for EDAX Genesis "foo.spd" file.
Once you successfully import a binary spectrum-image data, you can treat it as a regular 3D
spectrum image.
32
HREM Research Inc.
MSA for DM Manual
EFTEM image series
Brief Description
This function imports a series of EFTEM images acquired by the Acquire Filtered Series
function in Gatan DigitalMicrograph as a spectrum image (data cube). .
Usage
Select MSA...Import...EFTEM image series from the menu bar. Then, a dialog appears.
First, you should select the initial and final EFTEM images from a series of acquisition by
clicking the Initial image and Final image buttons.
Second, input the energy step value in eV. Then, click the OK button.
Here is an example the dialog just before clicking the Convert button.
Note that the EFTEM image series must be named as foo [jjjeV].dm3, where foo is the
rootfile name, jjj is an energy-loss value of the particular image. For example, test 3
[12eV].dm3.
The imported file can be treated as a regular 3D spectrum image.
33
HREM Research Inc.
MSA for DM Manual
Utilities
These functions in Utilities add additional capabilities to process spectrum images, e.g.
pixel/channel binning (which are available in newer version of DM as well) and
spatial/spectral data extraction. Details are as follows:
"
Bin SI
"
Spatial sub SI
"
Spectral sub SI
Bin SI
Brief Description
This function applies spatial (x- and/or y-axis) and/or spectral (energy-axis) data binning to an
existing 2D or 3D spectrum image. Note that this function is available in recent version of
GMS (ver. 1.7.1 or higher). This function is only for users who still use previous versions of
GMS.
Usage
Open a 2D or 3D spectrum image, first. Make sure that the spectrum image is the front image,
and select MSA…Utilities…Bin SI from the menu bar. Then, following dialog appears.
Select binning 2 or 4 in the spatial and/or spectral popup fields.
34
HREM Research Inc.
MSA for DM Manual
Then, click the Ok button. The binned spectrum image will appear shortly.
Detailed information of this processing via the Bin SI plugin can be found in Binning tag
under the Processing Tag of the binned SI file, available through Image Display Info.
35
HREM Research Inc.
MSA for DM Manual
Spatial sub SI
Brief Description
This function extracts a selected area from an existing 2D or 3D spectrum image and shows
the selected sub area as a new spectrum image.
Usage
Case 1: 2D spectrum image
Open a 2D spectrum image and select a sub area to be extracted using the LineROI tool
(note: you do not have to draw a perfectly perpendicular line)
Then, select MSA...Utilities...Spatial sub SI from the menu bar. A new 2D spectrum
image appears.
36
HREM Research Inc.
MSA for DM Manual
Case 2: 3D spectrum image
Open a 3D spectrum image and select a sub area using the RectangleROI tool
Then, select MSA…Utilities…Spatial sub SI from the menu bar. A new 3D spectrum
image appears
Detailed information of this processing via the Spatial sub SI command can be found in
Operation: SpatialSub tag under the Processing Tag of the extracted SI file, available
through Image Display Info.
37
HREM Research Inc.
MSA for DM Manual
Spectral sub SI
Brief Description
This function extracts a selected energy region from an existing 2D or 3D spectrum image
and shows a new spectrum image with the selected energy region.
Usage
Open a 2D or 3D spectrum image and show a spectrum from the spectrum image using the
SpectrumPicker tool
in the tool bar. Next, select an energy range you want to extract
from the existing spectrum image.
Then, select MSA…Utilities…Spectral sub SI from the menu bar. A new spectrum image
with the selected energy range appears.
Detailed information of this processing via the Spectral sub SI command can be found in
Operation: SpectralSub tag under the Processing Tag of the extracted SI file, available
through Image Display Info.
38
HREM Research Inc.
MSA for DM Manual
39
HREM Research Inc.
MSA for DM Manual
Quick Reference Guide
The MSA Main Menu
The commands in the MSA menu are described below.
Command
Import
(see sub menus)
MSA
(see sub menus)
Bin SI
Spatial Sub SI
Spectral Sub SI
Extract Component(s)
(see sub menus)
Help
(see sub menus)
About MSA
Description
Imports an SI data from different software or
acquisition systems.
Executes wPCA methods.
Bins an SI data spectrally or spatially.
Extracts SI data spatially specified by a rectangular
ROI
Extracts SI data spectrally specified by a range ROI.
Extracts a single or all component data from a
stacked component data.
Opens MSA help
Displays “About MSA” dialog
40
HREM Research Inc.
MSA for DM Manual
Import SubMenu
Component
EMSA Spectrum File
Series
XED-SI Data
EFTEM Image Series
Description
Imports an SI data from EMSA spectrum file series (a
line profile (1D scan data).
Imports an SI data from XED-SI Data.
Imports an SI data from EFTEM Image Series.
EMSA Spectrum File Series Dialog
The components of the dialog are described below.
Dialog
Component
Select folder
File parameters
Root filename
Extension
File numbers
Step scale
Step unit
Description
Specifies the folder where EMSA formatted file is
saved.
Parameters for input files
The root file name (foo of foojjj.ext).
The extension (ext of foojjj.ext).
List of index numbers t (jjj of foojjj.ext).
The scan step size.
The scan step unit (nm or angstrom).
41
HREM Research Inc.
MSA for DM Manual
XED-SI Data Dialog
The components of the dialog are described below.
Dialog
Component
System
File configurations
Offset
Byte size
Swap data byte
Vector-wise format
SI size
X pixels / Y pixels
Channels
Calibration
X axis / Y axis / E axis
Scale
Origin
Unit
Description
Select the system type or Generic.
Specifies the format of files to be imported.
(If the input is not required then it will be gray out.)
Offset in byte before the data starts.
Size of each data value in byte.
If selected, the data byte order is swapped.
If selected, each spectrum has been saved
sequentially in the file.
Number of the image pixels along x-axis / y-axis
Number of data channels for spectrum.
Specifies Width / Height / Energy (Spectrum) axes
Scale of each pixels or channels
Starting value of each axis
Unit of Width / Height / Energy (Spectrum) axes
42
HREM Research Inc.
MSA for DM Manual
EFTEM Image Series Dialog
The components of the dialog are described below.
Dialog
Component
File parameters
Initial image
Final image
Energy step
Description
Select the first image using the file browser.
(All the images should be in the same folder)
Select the last image using the file browser.
(All the images should be in the same folder)
The energy step value in eV between the images.
MSA SubMenu
Component
Weighted PCA
Spectral Local wPCA
Spatial Local wPCA
Description
Executes Weighted PCA for a whole region.
Executes Weighted PCA for each spectrally local
region.
Executes Weighted PCA for each spatially local
region.
43
HREM Research Inc.
MSA for DM Manual
Weighted PCA Dialog
The components of the dialog are described below.
Dialog
Component
Select SI
Decompose SI
Show Scree plot
Component evaluation
Display components
Initial / Final
Display in page mode
Reconstruction
Select nth component
for reconstruction
Reconstruct SI
Show Residual SI
Show Original SI
Advanced Setting
Reset
Description
Specifies a 2D or 3D SI data file using the file
browser.
Starts decomposing.
Displays a scree plot.
Displays details of components (loadings and scores)
between Initial and Final indexes.
Specifies first and last index of components to be
evaluated.
If it is checked, then the loading and score will be
displayed in the page mode.
Specifies the number of components used for
reconstruction
Starts reconstruction.
Displays the residue of reconstruction.
Displays the original SI
Open advanced setting dialog (see the dialog below)
Clear inputs
44
HREM Research Inc.
MSA for DM Manual
Weighted PCA Advanced setting Dialog
The components of the dialog are described below.
Dialog
Component
Scaling
Spatial binning
Description
Select the scaling mode
Specifies the spatial binning size.
Weighted PCA Advanced setting Dialog (for GMS 1.x)
The components of the dialog are described below.
Dialog
Component
Scaling
Spatial binning
Use 64-bit routine
Description
Select the scaling mode
Specifies the spatial binning size.
If checked, the 64-bit module will be used.
(This is only valid for GMS 1.x.)
45
HREM Research Inc.
MSA for DM Manual
Spectral Local wPCA Dialog
The components of the dialog are described below.
Dialog
Component
Select SI
Select Data Folder
Local channel
Convert
Decompose SI
Show Scree Plot
Display Components
Initial / Final
Display in page mode
Reconstruct SI
Show Residual SI
Show Original SI
Advanced Setting
Reset
Description
Selects a 3D SI data file using the file browser.
Selects a folder to save the processed data for each
region using the file browser.
Specifies an energy range of each local spectrum in
channels or eV.
Convert the energy range between channels and eV.
Starts decomposition of all the local regions.
Displays all the scree plots.
Displays components of the selected local region.
Specifies the first and last index of components to be
evaluated.
If it is checked, then the loadings and scores will be
displayed in the page mode.
Starts reconstruction using the specified number of
components.
Displays the residue of reconstruction.
Opens the original SI
Open advanced setting dialog (same as regular PCA)
Clear inputs
46
HREM Research Inc.
MSA for DM Manual
Spatial Local wPCA Dialog
The components of the dialog are described below.
Dialog
Component
Select SI
Select Data Folder
Local Area
Decompose SI
Show Scree Plot
Display Components
Initial / Final
Display in page mode
Reconstruct SI
Show Residual SI
Show Original SI
Advanced Setting
Reset
Description
Selects a 3D SI data file using the file browser.
Selects the folder to save the processed data for each
region using the file browser.
Specifies the size of local area in pixels.
Starts decomposition of all the local regions.
Displays all the scree plots.
Displays components of the selected local region.
Specifies the first and last index of components to be
evaluated.
If it is checked, then the loadings and scores will be
displayed in the page mode.
Starts reconstruction using the specified number of
components.
Displays the residue of reconstruction.
Opens the original SI.
Open advanced setting dialog (same as regular PCA)
Clear inputs
47
HREM Research Inc.
MSA for DM Manual
Bin SI Dialog
The components of the dialog are described below.
Dialog
Component
Spatial
Spectral
Description
Bins an SI data with a selected binning factor along x
and y directions.
Bins an SI data with a selected binning factor along
an energy channel.
Extract component(s) SubMenu
Component
Current Component
Extract All
Description
Extract the current component data (loading and
score) from a stacked component data. (The front
image must be a stacked component data)
Extract all component data (loading and score) from a
stacked component data. (The front image must be a
stacked component data)
Help SubMenu
Component
Manual
Command Reference
Description
Displays the manual in pdf format.
Displays the Quick Reference Guide in chm format.
48