1
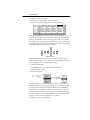
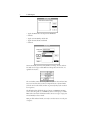
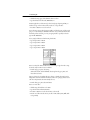
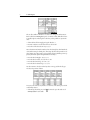
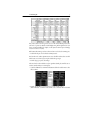
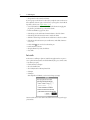
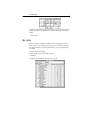
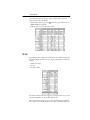
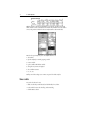
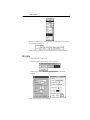
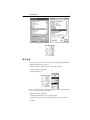
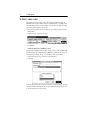
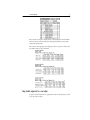
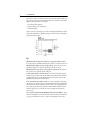
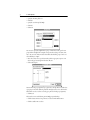
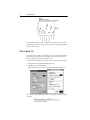
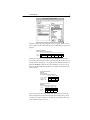
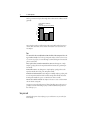
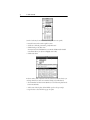
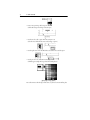
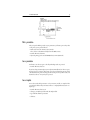
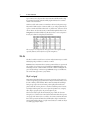
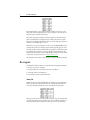
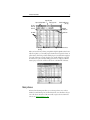
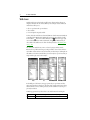
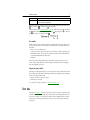
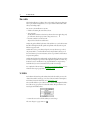
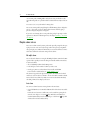
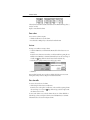
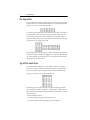
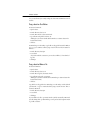
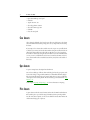
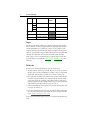
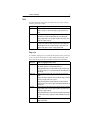
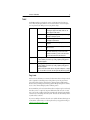
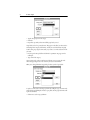
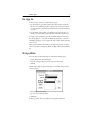
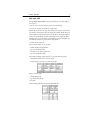
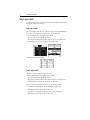
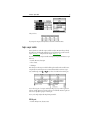
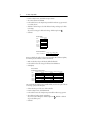
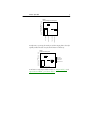
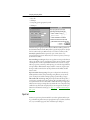
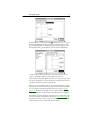
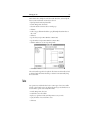
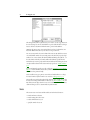
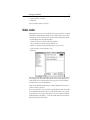
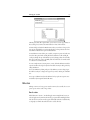
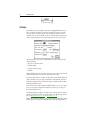
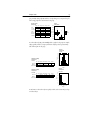
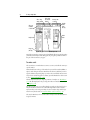
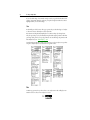
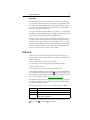
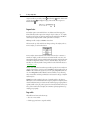
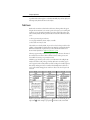
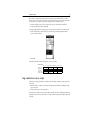
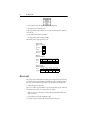
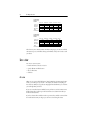
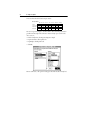
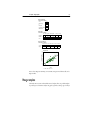
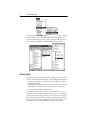
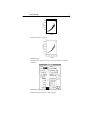
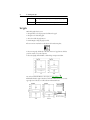
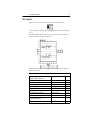
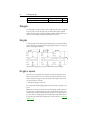
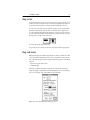
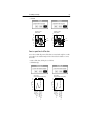
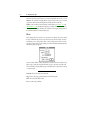
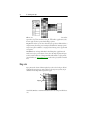
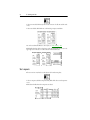
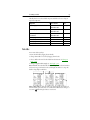
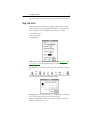
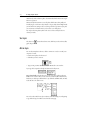
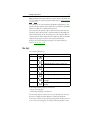
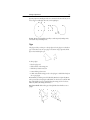
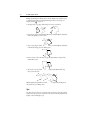
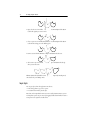
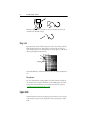
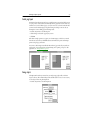
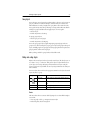
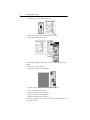
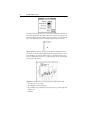
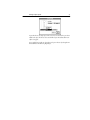
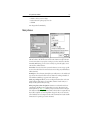
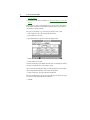
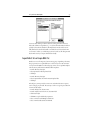
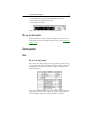
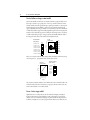
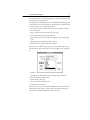
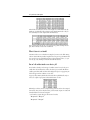
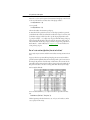
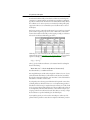
7 Customizing results Graphs Univariate Line Chart Univariate Line Chart Large Medium Medium Type Type Large Compact Compact Sporty Sporty Small Small 0 20 40 60 80 Observations Observations 100 Change legends Compound graphs—graphs that depict several variables or groups within a single axis frame—have legends that identify how each variable or group is distinguished. (See “Multiple and compound results,” p. 135.) A legend serves as a key to the graph, and you can use it to change how lines, points, bars, etc. are drawn in the interior of a graph. To change the overall format of a legend: • Click the legend to select it • Click Edit Display Layout Choose vertical, horizontal, or two-column orientation for the legend. Each are shown below: Small Sporty Compact Medium Small Sporty Compact Medium Large Small Sporty Compact Medium Large Large Frame Check options on and off to control whether and how the legend is framed. Possibilities are shown below.