1
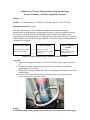
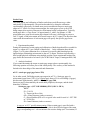
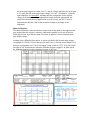
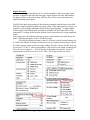
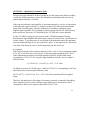
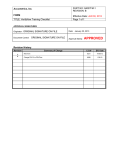
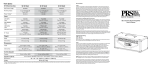
WHITE PAPER
Calibration Of Torque Measurements
Using Strain Gages, Torque Telemetry,
And Data Acquisition Systems
ACCUMETRICS
A PCB GROUP COMPANY
030515-NR
Visit us online at www.accumetrix.com
Toll-Free 888-684-0012
518-393-2200
Calibration of Torque Measurements using Strain Gages,
Torque Telemetry, and Data Acquisition Systems
Industry: All
Product: AT-5000 EasyApp, AT-4400, AT-4500 EasyApp, AT-7000, AT-7600
Parameters measured: Torque
This application note provides information regarding the calibration of torque
measurements using strain gages, digital torque telemetry, and data acquisition systems.
The intent is to provide a better understanding of how to obtain dependable torque
measurements by measuring torque via strain gages and digital rotor telemetry; wirelessly
transferring the signal off shaft; and providing the reconstructed signal to data acquisition
equipment for recording.
Strain Gaged Shaft
Torque Telemetry
Input mechanical Torque
Output mV/V Signal
Input mV/V Signal
Output High Level Voltage
(0 to 10V)
Data Acquisition
System
Input Voltage
Output Torque Display
and Data Storage
General Torque-Telemetry-Data Acquisition Block Diagram
Overview:
1) Apply a strain gage to the shaft, or use PCB’s Load & Torque organization to do
so.
2) Find the strain gage voltage output (in mV/volt of excitation) relationship to
applied torque (or use PCB).
3) Determine the telemetry output (in volts) corresponding to the torque (or use PCB
Load&Torque).
4) Enter the volts/torque engineering unit relationship into the data acquisition
system, and correct for any zero offset.
Figure 1
AT-5000 EasyApp (battery powered system) on driveshaft connected to strain gages
Strain Gages
The strain gaging and calibration of shafts can be done two different ways: either
analytically or experimentally. The preferred method is by doing the calibration
experimentally (physically) to obtain more precise mechanical torque to strain gage
output mV/V values. For torque measurements, the strain gages are set up for a full
bridge output (four resistive elements in a Wheatstone bridge configuration). Typically,
strain gages have a “Gage Factor” of approximately 2, where, for instance, a 1000
microstrain stress seen in each strain gage element will cause a full bridge to put out a
2mV/V signal; a 2000 microstrain stress would cause a 4mV/V signal. The data sheet that
comes with the manufacture of each strain gage will specify the specific gage factor
value.
1. Experimental method:
During the operation of strain gaging and calibration of shafts data should be recorded for
torque vs. output mV/V (see example of data below). In the calibration sheet below
(Figure 2), a 10 point calibration curve is shown for a specific shaft that displays the
applied torque relationship (microstrain) to the mV/V output. This data is produced by a
dead weight physical calibration using multiple weights. In an experimental method, the
gage factor does not need to be known. (See PCB Load & Torque, Farmington Hills, MI)
2. Analytical method:
If you cannot determine the torque to strain gage output values experimentally, the
following equation will allow you to find it analytically. The accuracy of this method is
limited to the knowledge of the materials and dimensions:
mV/V= strain per gage/(gage factor*250)
Or, in other words, Full bridge strain gage output (in mV/V) = Strain per gage (in
microstrain)/(gage factor *250). For a typical gage factor of 2 for a full bridge (4 gages),
this becomes approximately: mV/V = Strain per gage/ 500.
Strain per gage is determined by the metal shear properties, the torque, and the shaft
diameters, as follows:
Strain per gage = (8*T*OD*1000000)/(PI*G*(OD^4 - ID^4)
Where
PI = 3.14159
T = Torque (in-lbs or Nm)
OD = Outer Diameter (inches or meters)
G = Shear Modulus (PSI or Pa: a typical value used for steel is 1.15E7 PSI
or 7.93E10 Pa)
ID = Inner Diameter (inches or meters)
A note on “mV/V” specification meaning: When a strain gage is specified with a
2mV/V output (or some other similar value), this is the millivolt output of the strain
gage corresponding to a 1 volt excitation to the resistive bridge (mV/Vexcitation). If
the strain gage happens to output 2 mV/V, and the voltage applied to the strain gage
is 3.3 volts, then the strain gage output voltage is 6.6 mV. Accumetrics’ telemetry
input amplifiers are ratiometric, meaning that they compensate for the applied
voltage to the bridge (which is important for battery powered applications, but
useful for induction powered applications as well), so only the mV/V value is
important; the absolute value of the excitation voltage to the bridge is not
important).
Shunt Calibration:
The shunt calibration resistor simulates a torque/strain on the shaft by altering the strain
gage output when the resistor is remotely connected in parallel across one of the four
strain gage resistor legs. When a shunt cal resistor is applied, it causes a known strain
gage output voltage.
Looking at the calibration sheet below, it can be seen that a 600 Newton-meter output
corresponds to 1.293mV/Volt for this specific shaft. Also, a 100 kΩ resistor Shunt Cal is
shown to correspond to a 0.872mV/volt output. Using a ratio of (.872/1.293)*600 yields
an offset of 405 Newton-meters when the 100kohm resistor is applied. In other words,
the 100kohm shunt cal resistor simulates a torque of 405 N-m.
Figure 2
Digital Telemetry
A digital telemetry system simply acts as a wireless amplifier of the strain gage signal.
On rotor, it amplifies and filters the strain gage signal, digitizes the data, and transmits
the data wirelessly to the pick-up loop. Off rotor, the receiver converts the data to an
amplified analog output signal.
The Full Scale input (gain setting) of the telemetry transmitter should always exceed the
Full Scale output expected from the strain gage. (Note: If the input signal is too large, it is
possible to lose the higher amplitude portion of the signal (clipping). A clipped signal
will not supply useful information on signals beyond the Full Scale input limits of the
transmitter.) A voltage divider resistor network can be used to decrease a large amplitude
signal.
Gain setting varies for different telemetry systems; some systems have fixed factory set
gains—the following applies to the AT-5000 EasyApp:
AT-5000 EasyApp gain setting is done via a resistor on the EasyApp housing (see
AT-5000 User Manual, or contact Accumetrics for a list of gain selection resistor values).
For other systems, contact us for gain range settings. In Figure 3 below, the full scale can
be seen to be 3.37mV/V, which corresponds to a full scale receiver output. Nominally the
full scale receiver output is +/-10Volts, but this is adjustable (for instance, via the P1
potentiometer inside the receiver of an AT-5000. The P2 pot sets the zero value.)
Figure 3—AT-5000 EasyApp configuration document
Data Acquisition System
Input range: The Data Acquisition system will have a defined input voltage range. If the
inputs of the Data Acquisition system are capable of receiving a +/- 10 V signal, then no
settings need to be changed on the receiver or the data acquisition. However, if the data
acquisition system is not capable of handling an input voltage of +/- 10 V, then adjust the
receiver output to lower the output amplifier gain to provide a maximum range of +/- 5 V
max, or other appropriate value. Some receivers have dip switch settings that can
simulate a transmitter full scale output; removing power from the transmitter will result
in a lost signal that also causes the receiver to output either + or - 10 volts.
The next step is to find the data acquisition system’s input engineering unit conversion
information for a “Y = mX + b” style equation, thus allowing the user to translate AT5000 receiver output voltages to the scaled torque values to be recorded by the data
acquisition system.
Set the zero torque value:
With no torque applied to the strain gage, and with the telemetry operational, a small
output voltage level will typically be found on the telemetry receiver output. Set this
voltage value to zero torque in the Data Acquisition system dialog (see Figure 4 below).
Figure 4—data acquisition units conversion dialog screen—zero torque
Set the volts to torque conversion value:
The next step is to activate the shunt cal resistor at the transmitter. The telemetry output
voltage signal will now correspond to a certain change in torque value (for example: 100
KΩ resistance changes the torque by 405 Nm, which in turn causes an output voltage
change of 2.43 Volts). By setting this voltage to be equivalent to the torque (in this case,
2.43 V to 405 Nm), the relationship of receiver voltage output to torque has been found.
Figure 5—data acquisition units conversion dialog screen—torque to voltage
OPTIONAL-- Optimizing Transmitter Gain
The previous pages should be all that is needed to get from torque on a shaft to readings
recorded by a data acquisition system. The following is information that can assist in
optimizing the telemetry, if desired.
If the expected telemetry input amplifier’s measurement range is very low in comparison
to the maximum signal expected (i.e. perhaps less than 20% of the expected maximum
signal from the strain gage), it may be sometimes be desirable to change the input
amplifier gain if possible. For 16 bit high resolution systems like the AT-4400, this may
not be necessary, but for the AT-5000 and for the AT-7000, this is more desirable.
For the AT-5000 EasyApp, the gain resistor on the AT-5000 transmitter housing
determines the input amplifier maximum range (contact Accumetrics for a spread sheet of
resistor values). It is good practice to set the gain of the transmitter above the maximum
expected calibrated range in case any unforeseen ‘spikes’ in the signal occurs. This needs
to be done if the shunt cal value is small compared to the full scale level.
An example:
If the full scale range for the telemetry input is set for 3.6 mV/V, then a strain gage output
of 3.6 mV/V will cause the receiver to give a full scale output (nominally this is 10 V).
If the calibration data includes a full load applied of 600 Nm, and this shaft torque
corresponds to 1.293 mV/V for a specific gage installation, then the receiver output at
600 Nm will be
((1.293 mV/V) / (3.6 mV/V)) x 10 V = 3.59 Volts
If a Shunt cal resistor of 100 KΩ causes a shift of 0.873 mV/V corresponding to 405 Nm
(determined from a dead weight calibration), then
((0.873 mV/V) / (3.6 mV/V)) x 10 V = 2.43 Volts for the simulated 405 Nm applied
torque.
Therefore, the application of the shunt cal resistance (remotely or manually, depending
on the telemetry system) causes a 405Nm output shift from its current level, which
corresponds to the receiver output to shift a delta of 2.43 Volts.
R9
WHITE PAPER
What are divisions of PCB Piezotronics?
PCB Piezotronics, a member of the PCB Group families of companies, has five major divisions, all of which offer targeted sensor technologies. These divisions are supported by an active outside direct sales force of Field Application Engineers, as well as international
direct sales offices throughout the world. Individual PCB Piezotronics divisions, locations and their primary product specialties include:
Depew, NY, USA - www.pcb.com – Piezoelectric, ICP®, piezoresistive & capacitive
pressure, acoustic, force, torque, load, strain, shock & vibration sensors.
Depew, NY, USA - www.pcb.com/aerospace – Sensors & Instrumentation for
aerospace & defense applications, including air and spacecraft testing.
Farmington Hills, MI & Depew, NY, USA - www.pcb.com/auto – Sensors &
Instrumentation for automotive testing, including modal analysis; NVH; component
durability; powertrain testing; vehicle dynamics; safety and regulatory testing.
Depew, NY, USA - www.imi-sensors.com – Industrial vibration sensors, bearing fault
detectors, mechanical vibration switches, panel meters, cables & accessories for
predictive maintenance and equipment protection. Also providing pressure sensors
and accelerometers for precision measurement requirements in the power generation
and energy industries
Farmington Hills, MI & Provo, UT, USA www.larsondavis.com – Precision
microphones, sound level meters, noise dosimeters, audiometric calibration systems.
Farmington Hills, MI, USA - www.pcb.com/loadandtorque – High quality, precision
load cells, wheel force transducers, torque transducers, telemetry systems, and fastener
torque-tension test systems.
ACCUMETRICS
A PCB GROUP COMPANY
409 Front Street, Schenectady NY 12305 USA
Phone 518-393-2200 n Fax 716-684-0987
Email [email protected] n Website www.accumetrix.com