1
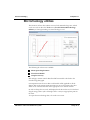
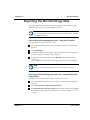
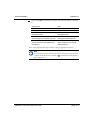
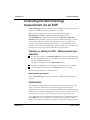
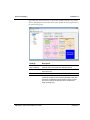
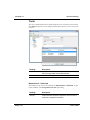
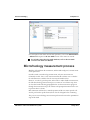
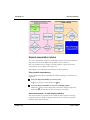
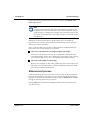
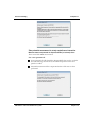
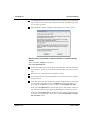
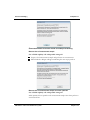
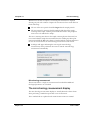
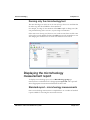
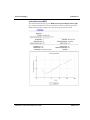
5 Microrheology This chapter gives an overview of the microrheology option in the Zetasizer software. It can be used with either a Zetasizer Nano ZS or ZSP. The microrheology option allows the measurement of the viscoelastic modulus of samples within the linear viscoelastic region. It describes how to connect, control and operate the microrheology optioned instrument to ensure reliable and consistent measurements. The new measurement protocol for the Zetasizer Nano ZS and ZSP has been called DLS Microrheology, as it is a cross over between DLS and rheology, and allows rheological measurements of low viscosity and weakly structured samples to be made. Advantages of DLS Microrheology are: Rheological characterization of low viscosity, weakly-structured samples. Via access to very high frequency (short time) dynamics which is highly relevant for dilute samples or weak structures. Very small sample volumes can be used (approx. 12 L). This is particularly suitable for precious protein samples. Provides rheological parameters - G', G'', *. Data can be verified using the same sample measured on a rotational rheometer where measurement ranges overlap. Data can be exported and used in the Malvern rSpace software. Zetasizer Nano accessories guide Page 5-1 5 Chapter 5 Microrheology Extends viscoelastic measurements into ranges inaccessible by mechanical rheometry techniques. Fast measurements are possible, with all frequencies effectively sampled simultaneously. Applications for viscosity of protein solutions and onset of protein aggregation. DLS Microrheology uses tracer probe particles to measure the relationship between stress and deformation. Both DLS and ELS measurements are done to ensure robust measurement methodology. A measurement consists of the 3 main measurement steps. Ensure suitable tracer particle surface chemistry Zeta potential measurement step to show no significant interaction between the tracer particles and measurement sample. The tracer is initially measured in the sample buffer/dispersant (or solvent) alone with no sample added. sample is then added and a second measurement performed. The two zeta potential results are then compared - a small relative change in zeta potential in the presence of the sample indicates minimal interaction between the sample and tracer particles. Ensure suitable concentration and dispersion of tracer particles Size measurement step for evaluation of appropriate scattering signal and PSD to meet this condition. A size measurement is run to see that tracer scattering dominates signal, and has a narrow monomodal Intensity PSD peak, i.e. tracers are dispersed properly. Measure Correlation function of tracer particles Perform a microrheology measurement and extract microrheology data from Mean Square Displacement (MSD) plot. Page 5-2 MAN 0487 Microrheology Chapter 5 The Zetasizer software has a utilities section for the Microrheology suite, which can be accessed via either the Tools menu (Tools-Utilities-Microrheology utilities) or from right clicking on a microrheology record. The following tab selections are available: Mean square displacement Viscoelastic Moduli Complex viscosity Each tab page contains controls that allow different models to be fitted to the microrheology data graph. It is important to note however that not all models will be applicable to all the datasets. Due to the measurement inconsistencies at very short timescales, there will be areas of the data that will not be appropriate to use with the models. In order to change the area used, and displayed in the Fit results area, left-click and drag the range pointers (the red triangles on the x axis) to an appropriate point on the chart. To export the microrheology data, refer to the next section. Zetasizer Nano accessories guide Page 5-3 Chapter 5 Microrheology On completion of the measurement the rheology data can be exported from the Zetasizer Nano software, saved as an .xml or a .csv file. The .csv file should be used if the results are to be imported into the Malvern rSpace software. To export the measurement data as a .csv file. Select a microrheology measurement record. The export will not work if this is not done. Select File-Export. A window is displayed requesting the export destination. Enter the destination and alter the parameters and settings as required. To export the data as a .csv file select the Browse button and alter the file extension. (Note: if Ok is pressed the data will be exported and saved as a text (.txt) file.) Refer also to the Exporting results section in the main user manual. To export the measurement data as either a .xml file or a .csv file. Select a microrheology measurement record. The export will not work if this is not done. Select Tools-Utilities- Microrheology utilities. The Microrheology data processing window will be displayed. Select Save and input the export destination. Alter the file extension to .xml file or .csv as required. Page 5-4 MAN 0487 Microrheology Chapter 5 On selecting OK, the data will be exported. The parameters that are exported are: These can be imported into rSpace software using an appropriate sequence. It is important to note that for the first release of microrheology, the time is exported from the Zetasizer software in s, and will be imported into the rSpace software in s. Zetasizer Nano accessories guide Page 5-5 Chapter 5 Microrheology A microrheology measurement follows the same SOP format as performed when doing a normal size measurement, with a few exceptions. When a microrheology measurement is chosen some extra dialogues Optimization and tracer - will be included in the SOP selections. The SOP Editor and setup is described in full in the Zetasizer Nano user manual. Most of the SOP sections are common to Measurement types, and these are described in the above manual. The other SOP sections are specific to the microrheology measurement being performed; these are described below. Also note that some of the other dialogue pages will alter slightly to accommodate extra parameters necessary to perform the microrheology measurement. To create a new SOP, select File-New SOP. This will open up the SOP Editor. The SOP Editor consists of several dialogues that can be stepped through by using the Next arrow button. (To edit an existing SOP, choose Open-SOP instead.) Complete the SOP Editor as described in the Zetasizer Nano user manual. Once the SOP has been created, press Finish and save the new SOP. The various SOP dialogues are described below. Select a microrheology measurement type then complete the SOP creation as required. The optimization SOP window is required for preparation (optimization) of the sample and measurements before the microrheology measurement proper. Optimization is the process of performing zeta potential and size measurements on the tracer particle and then subsequently on the measurement sample to ensure all requirements are met prior to performing the microrheology measurement. The zeta potential and size optimization measurements are configured by clicking on the Edit buttons - this will open the standard zeta potential and size SOP windows as described in the main user manual. This stage is not always necessary; Page 5-6 MAN 0487 Microrheology Chapter 5 depending upon the measurement setup and data available, both the zeta potential and size optimization measurements can be ignored, with the user going directly to the microrheology stage. Zetasizer Nano accessories guide Page 5-7 Chapter 5 Microrheology The Tracer SOP window shows details about the tracer used in the measurement. Press Select to open the tracer manager window where the tracer to be used can be selected. This window is the same as the standard size Measurement - Advanced, except for the addition of the Acceptable zeta ratio (%) setting. Page 5-8 MAN 0487 Microrheology Chapter 5 For a description of the other measurement parameters, refer to the Measurement - Advanced description in the size SOPs section of the main user manual. For all other microrheology SOP windows, refer to the size SOP section in the main user manual. With the cell loaded into the instrument, and the SOP configured, a measurement can be performed. Overall to make a microrheology measurement, only one measurement is technically needed - this is a size measurement that the software uses to calculate the relaxation times, and therefore the viscosity and moduli values. However, in order to get to this point, and in order to make reliable measurements, the full microrheology measurement process consists of several basic steps, these are described in the following paragraphs below. As the measurement progresses through the measurement steps, the software will prompt instructions for the user to perform where relevant. Each instruction will involve a manual operation and the user must open the cell area lid, perform the specified action, then close the lid again before continuing. The process a microrheology measurement performs is shown in the optimization stage of the SOP. Zetasizer Nano accessories guide Page 5-9 Chapter 5 Microrheology The correct preparation of the tracer and sample elements for the measurement is important to ensure that reliable and repeatable results are achieved. The concentration of tracer samples used will depend to a great extent on the concentration of your sample in the dispersant. Following are some important considerations for the preparation. For the initial tests of the zeta potential the following starting concentrations are suggested. Tracer in dispersant/buffer (or solvent) only 0.5 l tracer particles to 10ml sample (0.05 l/ml). Tracer in dispersant/buffer (or solvent) including sample Add 10-100 l of the tracer in dispersant to 1ml of the sample in dispersant. Start at the low end and increase the concentration if required. Size measurements are performed to check that the tracer particle's scattering completely hides the sample scattering; therefore the size of the tracer particle should be larger than the sample. Page 5-10 MAN 0487 Microrheology Chapter 5 The following starting concentrations are suggested. Tracer particles in measurement sample Start with a few l (up to about 5 l) of neat tracer to 1ml of sample. If more tracer is required to hide the sample scattering, add 1 l at a time. Alternatively; dilute 100 l in 1ml of buffer, filter using an appropriately sized filter and add 5 l at a time if more probes are required to hide the sample scattering. Filtering It is suggested that to get the most reproducible result, the tracers are filtered with appropriately sized (i.e. filter size larger than the tracers) filter. During the measurement the software makes a measurement of the sample size, then asks for tracer particles to be added. The size is re-measured and checked against the original sample size measurement. If the sample scattering is still visible. The software will encourage the user to add more tracer. If there is too much tracer in the sample, it will become turbid and measurement will be difficult. It is therefore important to use just enough tracer to mask the sample but not put in so much that the sample becomes turbid. The measured size of the tracer may not be correct. This is because of the viscosity of the sample and does not matter. The important point is that the scattering from the tracer should hide the scattering from the sample. Testing the difference in the zeta potential between the tracer and measurement sample is important because large changes would indicate that the tracer particle and the sample are interacting. With proteins, that could mean that the proteins are adhering to the tracer's surface and therefore not only changing the tracer's zeta potential but also the size of the tracer. The tracer then becomes part of the system and directly influences the rheology. Therefore to avoid this interaction the amount of sample added with respect to the tracer must be controlled. This is done by measuring the sample zeta potential measurement against the tracer zeta potential. The resultant measurement and comparison must show that the sample measurement is within a set percentage of the tracer measurement. This comparison is termed the acceptable zeta ratio. Zetasizer Nano accessories guide Page 5-11 Chapter 5 Microrheology For the microrheology measurement to measure reliably the acceptable zeta ratio is 25% or less. It is important to note that stable dispersion of the tracer particles in the sample may take some time. It has been noticed that with certain systems, gentle mixing (for example using a sample roller) will help to disperse the tracer particles, but that surface interactions can take several hours to manifest themselves. During the measurement this ratio is checked. If the ratio is acceptable the measurement will continue; if not and the zeta potential ratio is more than 25% different the software will advise. There are two possible causes for the zeta potential shows significant differences between the tracer and the sample / tracer systems. The tracer concentration is not high enough in the sample If the tracer concentration is too low, the zeta potential result will be dominated by the sample, not the tracer, adding more tracer particles and re-testing can show if the difference is due to concentration rather than interaction. The tracer and sample are interacting If the tracer and sample are interacting, adding more tracer won't improve the difference in zeta potential (unless so much is added that it completely dominates the zeta potential measurement). A full microrheology measurement consists of several steps. As the measurement progresses through the measurement steps, the software will display instructions examples are shown in the following text. On pressing the Start button a dialogue will appear indicating the first step to perform. Pressing Next in the measurement dialogues will then move the measurement onto the next step. Page 5-12 MAN 0487 Microrheology Chapter 5 This is termed the tracer measurement. Use a zeta potential cell. A zeta potential cell is filled with the dispersant/buffer, that is to be used in the later microrheology measurement, and a diluted suspension of the tracer particles is added. An initial measurement of the zeta potential and size of the tracer is then performed. Zetasizer Nano accessories guide Page 5-13 Chapter 5 Microrheology The tracer size measurement is used later in the microrheology measurement step. The tracer size needs to be measured to ensure the microrheology result is as accurate as possible. When finished a dialogue will appear indicating the next step to perform. This is termed the sample measurement. Use a zeta potential cell. Prepare the sample to be used for the measurement, then add small amount of tracer particles - do this at a concentration similar to that used in the previous step. Ensure the tracer and measurement sample are mixed. A measurement of the zeta potential of the tracer in the measurement sample is then performed. Once this measurement is complete the software compares the two measured zeta potential results and tests to see if sample measurement is within a set percentage of the tracer measurement - this is the acceptable zeta ratio. If the ratio is less than 25% the measurement process will continue to the next step otherwise with a dialogue appearing indicating the next step to perform. If the ratio is more than 25% the software will give sample preparation advice and advise on repeating steps 1 and 2. Refer to the zeta potential - acceptable zeta ratio section. Page 5-14 MAN 0487 Microrheology Chapter 5 Use a folded capillary cell or disposable sizing cell Prepare a fresh measurement sample and perform a size measurement. When finished a dialogue will appear indicating the next step to perform. Use a folded capillary cell or disposable sizing cell Add a quantity of tracer particles to the measurement sample. Once done perform a size measurement. Zetasizer Nano accessories guide Page 5-15 Chapter 5 Microrheology With the measurement is complete, an intensity plot should also be displayed showing one peak. The software compares the two measured size results and tests for the following: The size of the tracer particle should be larger than the sample particles The tracer particle's scattering should completely hide that of the sample scattering. If the sample scattering is still visible the software will prompt for more tracer to be added to the sample. The tracer scattering must obscure the sample scattering by more than 90%, but not so much that the sample becomes turbid, therefore making any subsequent measurement difficult. When the software is satisfied with the comparison between the two size measurements, the microrheology measurement can be started. A dialogue will appear indicating the next step (the microrheology measurement) can be performed. Press next to start the microrheology measurement automatically. This measurement is a single size measurement from which the MSD and rheological parameters are calculated. The microrheology measurement displays are virtually identical to those shown when performing a standard zeta potential or size measurement. These standard tabs are explained in the main Zetasizer Nano user manual. Page 5-16 MAN 0487 Microrheology Chapter 5 The microrheology test can be run on it's own as long as the user is confident that the other steps have been fulfilled to their satisfaction. For example, if a range of concentrations of the same sample are being tested, the zeta potential testing can be run once, on just a single concentration. If the same tracer is being used, the tracer size can be measured once and the same value can be set in the SOP by checking the edit box next to the nominal tracer size and changing the nominal tracer size to the size that has been measured. To display a microrheology report, select a Microrheology group type measurement record and then select the appropriate report tab. The report will show all appropriate measurement information for that record. Once a microrheology measurement is completed there are a number of standard reports available for reviewing the measurement results. Zetasizer Nano accessories guide Page 5-17 Chapter 5 Microrheology These are: Microrheology: Correlogram and MSD (mean squared displacement). Rheological properties: Eta (Complex viscosity), G (Moduli), Creep compliance. The mean squared displacement is a representation of the movement of the tracer particles within the sample. A purely viscous (Newtonian) sample will show a straight line. The correlogram shows the base data from which the microrheology result is calculated. The correlation function displayed is a measurement of the amount of movement the probe particles make within the test sample over a range of timescales. This report shows the relationship of the complex viscosity to the shear viscosity using the Cox-Merz rule. This rule is generally only fully applicable for simple systems, and that the differences between complex viscosity and shear viscosity increases as the sample structure becomes more complex. The Moduli tab shows the viscoelasticity of the sample, it shows two sets of data on the chart - G', the elastic (storage) component and G", the viscous (loss) component. In a microrheology measurement it is expected that the viscous component will be dominant for at least most of the measured frequency range. This is because the technique relies on the tracer particles being able to move and therefore produce a correlogram. For example; a gel system where the elastic component (G') is dominant for all of the frequency range, will hold the tracer particles still within the gel matrix, which means that the correlogram will be close to a flat line, and the MSD will be effectively 0. Creep compliance is another way of viewing the viscoelasticity of a sample. Page 5-18 MAN 0487 Microrheology Chapter 5 The standard microrheology report, MSD (mean squared displacement) (M), gives similar information as seen in a standard size and zeta potential report, plus additional information relating to the microrheology measurement itself. Zetasizer Nano accessories guide Page 5-19 Chapter 5 Microrheology Page 5-20 MAN 0487