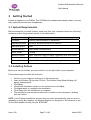
1
Podium Data Analysis Software
User Manual
SWIS10 Version
Issue 1.00
March 2003
Podium Data Analysis Software
User Manual
Contents
1 Introduction
1.1
What is Podium?
1.2
About This Manual
1.3
Typographical Conventions
1.4
Getting Technical Support
2 Getting Started
2.1
System Requirements
2.2
Installing Podium
2.3
Uninstalling Podium
2.4
Using Online Help
2.5
Starting Podium
2.6
Selecting Data Logger
2.7
Licences
2.8
Exiting Podium
3 Getting to Know Podium
3.1
Tour of the Podium User Interface
3.2
Main Menu
3.3
Main Toolbar
3.4
Lap Explorer
3.5
Cursor Values
3.6
Notes
3.7
Circuit Map
3.8
Graphs
3.9
Reports
3.10 Status Bar
3.11 Resizing Windows
3.12 Command Reference
4 Managing Session Data
4.1
Downloading Session Data
4.2
Changing the Beacon Position
4.3
Changing Session Details
5 Graphs
5.1
Setting the Current Lap
5.2
Adding Graphs
5.3
Removing Graphs
5.4
Setting the Reference Lap
5.5
Clearing the Reference Lap
5.6
Moving the Graph Cursor
6 Circuit Mapping
6.1
Creating a New Circuit Map
6.2
Map Segments
6.2.1
Adding Segments
6.2.2
Deleting Segments
6.2.3
Deleting All Segments
7 Reports
7.1
Min/Max Values Report
7.2
Speed Report
Issue 1.00
Page 2 of 45
5
5
5
6
6
7
7
7
8
8
8
8
9
9
10
10
11
11
12
13
13
14
15
16
16
16
17
19
19
20
21
22
22
22
22
23
23
23
24
24
25
25
27
28
29
29
29
March 2003
Podium Data Analysis Software
User Manual
7.3
Split Report
7.4
Removing Reports
8 Configuration
8.1
Data Logger
8.1.1
Reading Current Configuration
8.1.2
General
8.1.3
Lap Timing
8.1.4
Display
8.1.5
Gauges
8.1.6
Data Logging
8.1.7
Gear Indicator
8.1.8
Writing New Configuration
8.2
Show Setup For Session
8.3
Channels
8.3.1
Accelerometers
8.3.2
Fuel Level
8.3.3
User Channels
8.3.4
Filtering
8.4
Serial Port
8.5
Colours
8.5.1
Current Lap Graph
8.5.2
Reference Lap Graph
8.5.3
Circuit Map Outline
8.5.4
Circuit Map Segments
9 Troubleshooting
10
Glossary
Issue 1.00
Page 3 of 45
29
30
31
31
31
32
33
34
35
36
37
37
38
38
38
39
39
40
42
42
43
43
43
43
44
45
March 2003
Podium Data Analysis Software
User Manual
Table of Figures
Figure 1 - Select Data Logger Dialog
Figure 2 - Licence Details Dialog
Figure 3 - Add Licence Dialog
Figure 4 - Podium Main Screen
Figure 5 - Podium Main Menu
Figure 6 - Podium Main Toolbar
Figure 7 - Lap Explorer Window
Figure 8 - Cursor Values Window
Figure 9 - Notes Window
Figure 10 - Circuit Map Window
Figure 11 - Graphs Window
Figure 12 - Reports Window
Figure 13 - Podium Status Bar
Figure 14 - Session Data Download Dialog (Idle)
Figure 15 - Session Data Download Dialog (Downloading)
Figure 16 - Save Session Data Dialog
Figure 17 - Edit Beacon Position Dialog
Figure 18 - Edit Session Details Dialog
Figure 19 - New Circuit Map Dialog
Figure 20 - Edit Map Segments Dialog (No Segments)
Figure 21 - Edit Map Segments Dialog (Defining a Segment)
Figure 22 - Edit Map Segments Dialog (Segment Defined)
Figure 23 - Edit Map Segments Dialog (Deleting a Segment)
Figure 24 - Edit Map Segments Dialog (Segment Deleted)
Figure 25 - Edit Map Segments Dialog (Delete All Segments)
Figure 26 - Configuration Download Dialog
Figure 27 - Setup Data Logger Dialog (General Page)
Figure 28 - Setup Data Logger (Lap Timing Page)
Figure 29 - Setup Data Logger (Display Page)
Figure 30 - Setup Data Logger (Gauges Page)
Figure 31 - Setup Data Logger (Data Logging Page)
Figure 32 - Setup Data Logger (Gear Indicator Page)
Figure 33 - Configuration Upload Dialog
Figure 34 - Setup Channels Dialog (Accelerometers Page)
Figure 35 - Setup Channels Dialog (Fuel Level Page)
Figure 36 - Setup Channels Dialog (User Channel Page)
Figure 37 - Setup Channels Dialog (Filtering Page)
Figure 38 - Setup Serial Port Dialog
Figure 39 – Standard Colour Dialog
Issue 1.00
Page 4 of 45
8
9
9
10
11
11
12
13
13
14
15
16
16
19
19
20
21
21
24
25
26
26
27
28
28
31
32
33
34
35
36
37
37
38
39
40
40
42
42
March 2003
Podium Data Analysis Software
User Manual
1 Introduction
1.1 What is Podium?
PolyLogic’s Podium Data Analysis Software enables data logged by the Farringdon
Instruments SWIS10-3 steering wheel instrument system to be downloaded to a host PC
and analysed in a variety of ways. Podium also provides facilities for configuring the
steering wheel instrument system via the serial port of the host PC.
With PolyLogic’s Podium Data Analysis Software you can:
•
•
•
•
•
•
•
•
Download and store data logged by the Farringdon Instruments SWIS10-3
Group related data together under common headings
Display graphs of:
Wheel speed
Engine speed
Lateral acceleration
Longitudinal acceleration
Battery voltage
Fuel level
Oil pressure
Oil temperature
Water temperature
Two user channels
Overlay and compare lap data from different sessions
Create a track map for each circuit visited
Define segments for each circuit map
Produce reports of:
Minimum and maximum values logged for a lap
Minimum and maximum speeds for each segment for a lap
Split times for all laps in a session
Configure the SWIS10-3 via the serial port of the host PC
1.2 About This Manual
This User Manual is intended to complement the help files built into the Podium
application. The chapters are presented in an order intended to help new users
understand the program as quickly as possible. Be aware, however, that this manual and
the program’s help file assume that you are comfortable using the Microsoft Windows
98/2000/Me/NT4/XP operating system. If you are new to Windows you may find the
Windows Online Help file useful. To access Microsoft Windows Help choose Help from
the start menu on your Windows desktop.
Issue 1.00
Page 5 of 45
March 2003
Podium Data Analysis Software
User Manual
1.3 Typographical Conventions
Please be aware of the following typographical conventions when reading this manual:
•
Menu items that you are instructed to choose appear with an arrow (¨) symbol
separating each menu level. For example, if you if you are instructed to choose
the Download command in the File menu it will appear as File ¨ Download. If you
are instructed to select the Track command from the Map Colours sub-menu in
the Setup menu it will appear as Setup ¨ Map Colours ¨ Track.
•
Where a button or other control needs to be clicked the name of the button or
control will be shown in bold text.
1.4 Getting Technical Support
For technical support with Podium please contact:
[email protected]
In addition, there are pages dedicated to support issues with PolyLogic’s products on the
PolyLogic web site.
The table below lists the ways to contact PolyLogic:
Contact Method
Address or Number
Website:
www.polylogic.co.uk
Telephone:
+44 (0) 1462 621066
Fax:
+44 (0) 1462 621066
Mail:
PolyLogic Limited
21 Cambridge Road
Langford
Biggleswade
Bedfordshire
SG18 9PR
UK
Issue 1.00
Page 6 of 45
March 2003
Podium Data Analysis Software
User Manual
2 Getting Started
Podium is supplied on a CD-ROM. The CD-ROM also includes some sample data so you can
start exploring the software straightaway.
2.1 System Requirements
Before attempting to install Podium, make sure that your computer meets the following
minimum system requirements shown in the table below:
Component
Requirement
Processor
Pentium class processor or equivalent
Operating System
Microsoft Windows 98/Me/NT4/2000/XP
Hard Disk Space
10Mb
System Memory
32Mb (64Mb recommended)
Other Drives
CD-ROM
Monitor/Display
Super VGA (800 x 600) or higher resolution with 256 colours
Serial Port
One serial port or USB port with USB-serial adapter
Pointing Device
Microsoft Mouse or compatible pointing device
2.2 Installing Podium
Before you can run Podium you must install it on the hard disk of your computer.
Follow these steps to install the software:
•
•
•
•
•
•
•
Switch on your computer and log on in the normal way.
Insert the Podium CD into the CD drive. The Podium Setup Wizard dialog will
appear automatically.
Click Next.
Choose the installation folder for the software and click Next.
Click Next again to complete the installation.
Click Close once the installation is complete.
The installation process places shortcuts to Podium on the computer’s desktop
and Start menu.
NOTE: If the Podium installation process does not start automatically, you can start it
manually by using My Computer or Windows Explorer to navigate to the contents of the
CD and then double-clicking the file SETUP.EXE.
Issue 1.00
Page 7 of 45
March 2003
Podium Data Analysis Software
User Manual
2.3 Uninstalling Podium
Podium can be removed from your computer by selecting the Add and Remove
Programs option within Windows Control Panel. Find Podium in the list of installed
software, select it, and then click Remove.
This will remove the Podium software together with its shortcuts and configuration
entries but all logged data, including the sample data provided on the installation CD,
will remain on the hard disk of the computer.
2.4 Using Online Help
Once Podium is running you can view items in the Help menu at any time. To display the
online Help file press F1 or choose Help ¨ Topics.
2.5 Starting Podium
Start Podium by either double clicking the shortcut on the computer’s desktop or by
selecting Programs ¨ PolyLogic ¨ Podium from the Start button on the desktop’s
toolbar.
2.6 Selecting Data Logger
The first time that Podium is run, the Select Data Logger Dialog (Figure 1) is displayed.
Figure 1 - Select Data Logger Dialog
Select the Steering Wheel (SWIS10-3) option and then click OK.
Issue 1.00
Page 8 of 45
March 2003
Podium Data Analysis Software
User Manual
2.7 Licences
A licence is require to access certain features within Podium such as downloading data
from the data logger.
To enter the licence code supplied do the following:
1. Select Help ¨ Licences from the main menu, the Licence Details Dialog (Figure 2)
appears.
Figure 2 - Licence Details Dialog
2. Click Add to display the Add Licence Dialog (Figure 3), enter the licence code and
then click OK.
Figure 3 - Add Licence Dialog
2.8 Exiting Podium
You can exit Podium using either of the following methods:
•
Choose File ¨ Exit from the main menu, or
•
Click the close button ⌧ in the upper right corner of the title bar, or
•
Press the key combination Ctrl + Q, or
•
Press the key combination Alt + F4.
Issue 1.00
Page 9 of 45
March 2003
Podium Data Analysis Software
User Manual
3 Getting to Know Podium
This chapter provides an overview of the Podium user interface. It describes the main
windows, menu, toolbars and other important features. To help you better understand
the program and become familiar with its features, please review this chapter
thoroughly prior to analysing any data.
3.1 Tour of the Podium User Interface
When you start Podium the main program window appears. This window is your work
area and is divided up into sections where specific types of information are displayed.
The following screen shot shows the main program window during a typical session. The
Lap Explorer and Notes window are displayed on the right hand side with four overlay
graphs plotted on the left.
Figure 4 - Podium Main Screen
At the top of the main program window a menu and toolbar provide access to a majority
of the program’s features.
Issue 1.00
Page 10 of 45
March 2003
Podium Data Analysis Software
User Manual
A status bar at the bottom of the screen identifies the laps for which data is currently
being displayed.
3.2 Main Menu
Figure 5 - Podium Main Menu
The Main Menu (Figure 5), which is directly below the title bar, displays the menu
headings. Click a menu heading to open the menu and choose a command.
Use either of the following methods to choose a menu command:
•
Open the menu and click the command, or
•
Open the menu, use the Up arrow or Down arrow key to highlight a command, and
then press <Enter>.
In addition, each menu may be opened by pressing the <Alt> key and then pressing the
key associated with the required menu. Section 3.12 lists all the available menu
commands.
3.3 Main Toolbar
Figure 6 - Podium Main Toolbar
The Main Toolbar (Figure 6), which is located directly below the Main Menu, contains
buttons for accessing frequently used menu commands. To see the name of a button,
place the cursor over it without clicking.
To execute the command associated with a toolbar button click the button. If a button is
greyed out the command is not available. Section 3.12 lists the function of each of the
toolbar buttons.
Issue 1.00
Page 11 of 45
March 2003
Podium Data Analysis Software
User Manual
3.4 Lap Explorer
The Lap Explorer window (Figure 7) displays the
available data in a ‘tree’ or hierarchical manner.
This window is used to select the laps to be analysed.
Nodes are displayed for each circuit and session for
which data exists. To expand a node either click on the
next to the node or double click the node’s icon or
text.
Once a node has been expanded it can be collapsed by
either clicking on the next to the node or double
clicking the node’s icon or text again.
Figure 7 - Lap Explorer Window
If the Lap Explorer window is not currently visible it can be activated in any of the
following methods:
•
Click the Lap Explorer tab next to the Cursor Values tab, or
•
Click the Lap Explorer button
•
Choose View ¨ Lap Explorer from the main menu.
on the main toolbar, or
The content of the toolbar below the window’s title bar changes depending on the type
of node that is currently highlighted as shown below:
Toolbar
Highlighted Node
Root or circuit.
Session.
Lap.
To see the name of a button, place the cursor over it without clicking. To execute the
command associated with a toolbar button click the button. If a button is greyed out the
command is not available.
Downloads data from data logger.
Makes the highlighted lap the Reference Lap.
Removes the Reference Lap.
Makes the highlighted lap the Current Lap.
Refreshes the contents of the Lap Explorer window.
Makes the Notes window visible.
Issue 1.00
Page 12 of 45
March 2003
Podium Data Analysis Software
User Manual
3.5 Cursor Values
The Cursor Values window (Figure 8) displays the value
of each graph at the current cursor position.
This window is used to compare parameters at any point
on a lap.
The values change as the graph or map cursor are
moved.
Time and distance are always displayed with other
parameters being added when a graph for that
parameter is selected.
Removing a graph removes that parameter from the list
of parameters displayed in the Cursor Values window.
Figure 8 - Cursor Values Window
If the Cursor Values window is not currently visible it can be activated in any of the
following methods:
•
Click the Cursor Values tab next to the Lap Explorer tab, or
•
Click the Cursor Values button
•
Choose View ¨ Cursor Values from the main menu.
on the main toolbar, or
3.6 Notes
The Notes window (Figure 9) displays additional
information about the item currently highlighted in the
Lap Explorer window.
This window is used in conjunction with the Lap Explorer
window to identify the laps to be analysed.
The list of information displayed depends on the type of
node highlighted in the Lap Explorer node.
Figure 9 - Notes Window
If the Notes window is not currently visible it can be activated in any of the following
methods:
•
Click the Notes tab next to the Circuit Map tab, or
•
Click the Notes button
•
Choose View ¨ Notes from the main menu.
Issue 1.00
on the main toolbar, or
Page 13 of 45
March 2003
Podium Data Analysis Software
User Manual
3.7 Circuit Map
The Circuit Map window (Figure 10) displays a map of
the circuit for the Current Lap.
This window is used in conjunction with the Graphs
window to relate the graph cursor position to a specific
point on the lap.
Clicking on the map moves the map cursor to the point
on the track closest to the mouse click. This also moves
the graph cursor to the same point.
Figure 10 - Circuit Map Window
If the Circuit Map window is not currently visible it can be activated in any of the
following methods:
•
Click the Circuit Map tab next to the Notes tab, or
•
Click the Circuit Map button
•
Choose View ¨ Circuit Map from the main menu.
on the main toolbar, or
The buttons on the toolbar immediately below the title bar are enabled whenever a map
is displayed and they perform the following:
Shows/hides segments.
Allows the segments for the current circuit map to be edited.
To see the name of a button, place the cursor over it without clicking. To execute the
command associated with a toolbar button click the button. If a button is greyed out the
command is not available.
Issue 1.00
Page 14 of 45
March 2003
Podium Data Analysis Software
User Manual
3.8 Graphs
Figure 11 - Graphs Window
The Graphs window (Figure 11) displays logged values for a lap against either distance or
time. This window is used to plot data for the laps of interest and to compare two laps
from the same or different sessions.
Clicking on a graph moves the graph cursor to that point on the graph. This also moves
the map cursor to the same point. The values of the displayed parameters at the current
cursor position are displayed in the Cursor Values window.
Once a lap has been highlighted in the Lap Explorer window a graph of any of the logged
parameters is displayed using either of the following methods:
•
Activate the graphs drop down menu by clicking on the arrow b next to the
on the main toolbar and select the parameter to display, or
Graphs button
•
Choose View ¨ Graphs from the main menu and select the parameter required.
on either the main toolbar or the Lap Explorer toolbar will
Clicking the Graphs button
either display the current graphs for the highlighted lap or display a graph of wheel
speed against distance for the highlighted lap if no graphs are currently displayed.
Issue 1.00
Page 15 of 45
March 2003
Podium Data Analysis Software
User Manual
3.9 Reports
Figure 12 - Reports Window
The Reports window (Figure 12) displays tabular data for the currently selected laps or
session. This window is used to compare laps in more detail.
Once at least one graph is displayed in the Graphs window any of the available reports
can be selected using either of the following methods:
•
Activate the reports drop down menu by clicking on the arrow b next to the
Reports button
on the main toolbar and selecting the report to display, or
•
Choose View ¨ Reports from the main menu and select the report required.
3.10 Status Bar
Figure 13 - Podium Status Bar
The Status Bar (Figure 13) identifies the laps for which data is currently being displayed
together with the colours used.
3.11 Resizing Windows
The relative proportions of the various windows can be altered to suit the data being
displayed.
To adjust the position of the line dividing two windows do the following:
1. Move the mouse over the space between the two windows until the mouse pointer
changes shape.
2. Drag the dividing line to the required position. The windows either side of the
dividing line will be redrawn to fill their new boundaries when the mouse button
is released.
Issue 1.00
Page 16 of 45
March 2003
Podium Data Analysis Software
User Manual
3.12 Command Reference
The following commands are available:
Menu Command
File Menu
Keyboard Shortcut
Toolbar Button
Section
Alt + F
Download
-
4.1
Export
-
-
Page Setup
-
Print Preview
-
-
Print
Ctrl + P
-
Exit
Ctrl + Q
Edit Menu
Alt + E
-
-
-
2.7
Beacon Position
-
-
4.2
Session Details
-
-
4.3
View Menu
Alt + V
Zoom In
Ctrl + I
-
Zoom Out
Ctrl + O
-
Lap Explorer
-
3.4
Cursor Values
-
3.5
Notes
-
3.6
Circuit Map
-
3.7 & 6
Graphs
-
3.8 & 5
Reports
-
3.9 & 7
Histograms
-
-
X-Y Plots
-
-
Map Menu
Alt + M
New
-
Edit Segments
-
-
6.1
6.2
(On Circuit Map
toolbar)
Issue 1.00
Page 17 of 45
March 2003
Podium Data Analysis Software
User Manual
Menu Command
Setup Menu
Keyboard Shortcut
Toolbar Button
Section
Alt + S
Data Logger
-
-
8.1
Show Setup For Session
-
-
8.2
Channels
-
-
8.3
Serial Port
-
-
8.4
Graph Colours
-
-
8.5
Map Colours
-
-
8.5
Help Menu
Help Topics
Alt + H
-
F1
About PolyLogic Podium
-
-
-
Licences
-
-
2.7
Issue 1.00
Page 18 of 45
March 2003
Podium Data Analysis Software
User Manual
4 Managing Session Data
This chapter describes how Podium allows you to download and manage data logged by
the Farringdon Instruments SWIS10-3 steering wheel instrumentation system.
4.1 Downloading Session Data
Before any analysis can be performed, the logged data must be transferred from the
data logger to the hard disk of the host computer. This process, referred to as
downloading, is straightforward and is achieved in the following way:
on either the main toolbar or the Lap Explorer tool
1. Click the Download button
bar, or select File ¨ Download from the main menu. The Session Data Download
dialog (Figure 14) appears.
Figure 14 - Session Data Download Dialog (Idle)
2. Connect the data logger to the serial port of the host computer using the cable
provided and click OK. The process of transferring the data from the data logger
to the host computer will start.
Figure 15 - Session Data Download Dialog (Downloading)
3. When the data has been successfully transferred the Save Session Data dialog
(Figure 16) appears. Podium will populate the Session field with a unique
identifier for this session based on the current date. Other fields will be set to the
values used previously.
Issue 1.00
Page 19 of 45
March 2003
Podium Data Analysis Software
User Manual
Figure 16 - Save Session Data Dialog
4. Update the fields to reflect the prevailing conditions and add a comment if
necessary. Note that the Driver, Weather, Track, and Comment fields are all
optional but the Circuit and Session fields determine where the data is stored so
cannot be left blank. If the current circuit is not listed then the name can be
typed in. The optional fields can be changed at a later date using the Edit ¨
Session Details option from the main menu. See Section 4.3 for more
information.
5. When all the required information has been entered click Save and the data will
be stored on the hard disk of the host computer.
6. The Save Session Data Dialog closes and the new session appears highlighted and
expanded in the Lap Explorer window.
4.2 Changing the Beacon Position
When using a portable beacon it is not always possible to place the beacon at the same
location for each session at a particular track.
Podium provides a mechanism to move the position of the beacon on a session-by-session
basis so that all sessions for a track can have a common start point.
The beacon position for a session is changed in the following way:
1. Highlight the session (or any lap within the session) in the Lap Explorer window.
2. Select Edit ¨ Beacon Position from the main menu. The Edit Beacon Position
dialog (Figure 17) appears.
Issue 1.00
Page 20 of 45
March 2003
Podium Data Analysis Software
User Manual
Figure 17 - Edit Beacon Position Dialog
3. Enter the required beacon offset in m and indicate whether the beacon position is
to be moved forwards or backwards from its current point. Clicking Reset sets the
offset to zero.
4. Click Save to update the session. All laps in the session will now use the revised
beacon position. Click Cancel to leave the beacon offset unchanged.
4.3 Changing Session Details
The details associated with a session may be changed in the following way:
1. Highlight the session (or any lap within the session) in the Lap Explorer window.
2. Select Edit ¨ Session Details from the main menu. The Edit Session Details dialog
(Figure 18) appears.
Figure 18 - Edit Session Details Dialog
3. Enter the new details for the session.
4. Click Save to update the session or Cancel to leave the session details unchanged.
Issue 1.00
Page 21 of 45
March 2003
Podium Data Analysis Software
User Manual
5 Graphs
This chapter describes how graphs are produced from stored lap data and how graphs for
different laps can be compared.
Podium allows data to be plotted for up to two laps at any one time. One lap is
designated the Current Lap whilst the other is the Reference Lap. The Reference Lap is
typically the fastest lap for a particular session, driver, or circuit and is used as a
benchmark against which other laps completed at the same circuit are compared.
5.1 Setting the Current Lap
The Current Lap is set as follows:
1. Highlight the lap in the Lap Explorer window.
2. Click the Graphs button
on the Lap Explorer toolbar.
3. A graph of wheel speed vs distance is plotted in the Graphs window and the
session and lap details for the new Current Lap are displayed in the status bar. If
a circuit map has been defined for this circuit then this will appear in the Circuit
Map window.
The colour of the graph lines for the Current Lap can be changed via the Setup option of
the main menu. See Section 8.5.1 for more information.
5.2 Adding Graphs
Further graphs are added by either of the following methods:
•
Activate the graphs drop down menu by clicking on the arrow b next to the
on the main toolbar and select the graph to display, or
Graphs button
•
Choose View ¨ Graphs from the main menu and select the graph required.
5.3 Removing Graphs
Existing graphs are removed by either of the following methods:
•
Activate the graphs drop down menu by clicking on the arrow b next to the
Graphs button
on the main toolbar and select the graph to remove, or
•
Choose View ¨ Graphs from the main menu and select the graph no longer
required.
Issue 1.00
Page 22 of 45
March 2003
Podium Data Analysis Software
User Manual
5.4 Setting the Reference Lap
The Reference Lap is set as follows:
1. Select a Current Lap and plot data for it as described in Section 5.1.
2. Highlight the lap to use as a Reference Lap in the Lap Explorer.
on the Lap Explorer toolbar.
3. Click the Set Reference button
4. A new line is added to each graph showing the data for the new Reference Lap.
The session and lap details of the new Reference Lap are displayed in the status
bar.
The colour of the graph lines for the Reference Lap can be changed via the Setup option
of the main menu. See Section 8.5.2 for more information.
5.5 Clearing the Reference Lap
The Reference Lap is cleared as follows:
1. Highlight any lap in the Lap Explorer window.
2. Click the Clear Reference button
on the Lap Explorer toolbar.
3. The lines for the Reference Lap are removed from each graph in the Graphs
window and the details of the Reference Lap are removed from the status bar.
5.6 Moving the Graph Cursor
The graph cursor can be moved by clicking or dragging the mouse or by using the
following keys:
Action
Result
t
Moves the cursor one sample to the right.
s
Moves the cursor one sample to the left.
Ctrl + t
Moves the cursor 25 samples to the right.
Ctrl + s
Moves the cursor 25 samples to the left.
Home
Moves the cursor to the start of the graph.
End
Moves the cursor to the end of the graph.
Note that the cursor can only be moved using the keyboard when the Graphs window has
the input focus, i.e. immediately after it has been clicked.
Issue 1.00
Page 23 of 45
March 2003
Podium Data Analysis Software
User Manual
6 Circuit Mapping
Podium allows a track map to be produced for each circuit for which data has been
logged and stored. This chapter describes how circuit maps are produced and how they
may be divided up into segments that allow more detailed analysis to be performed.
6.1 Creating a New Circuit Map
A new circuit map is created in the following way:
1. Highlight the lap to use as the basis for the circuit map in the Lap Explorer
window.
2. Choose Map ¨ New from the main menu. The New Circuit Map dialog (Figure 19)
appears.
Figure 19 - New Circuit Map Dialog
3. The mapping process produces an approximate map based on the current zero and
gain values for the lateral accelerometer. Some adjustment may be necessary to
make the plotted map resemble the actual circuit.
4. To make an adjustment alter the zero or gain value and then click Draw Map. The
circuit map is redrawn using the new settings. Experiment with the zero and gain
settings until the map most closely matches the actual layout of the circuit.
5. Click Save to make this the default map for this circuit or Cancel to abandon any
changes made.
Issue 1.00
Page 24 of 45
March 2003
Podium Data Analysis Software
User Manual
6.2 Map Segments
Once a map has been created and stored for a circuit it can then be divided up into
segments.
6.2.1
Adding Segments
Segments are added to an existing circuit map in the following way:
1. Highlight the circuit (or any session or lap for the circuit) in the Lap Explorer
window.
2. Choose Map ¨ Edit Segments from the main menu. The Edit Map Segments dialog
(Figure 20) appears.
Figure 20 - Edit Map Segments Dialog (No Segments)
3. Mark the start point of the segment by clicking on the map and then clicking
Start. The start point of the segment is marked with a square drawn in a dashed
line (see Figure 21). The Start button is disabled and the End and Abandon
buttons are enabled.
Issue 1.00
Page 25 of 45
March 2003
Podium Data Analysis Software
User Manual
Figure 21 - Edit Map Segments Dialog (Defining a Segment)
4. If you want a segment to start at the end of another segment place the cursor
anywhere in the other segment before clicking Start.
5. Mark the end point of the segment by clicking on the map and then clicking End.
The portion of the map between the start and end points changes colour with
small bars marking the extents of the segment (see Figure 22). Clicking Abandon
before marking the end point of a segment allows the definition of the current
segment to be cancelled.
Figure 22 - Edit Map Segments Dialog (Segment Defined)
6. If you want a segment to end at the start of another segment place the cursor
anywhere in the other segment before clicking End.
7. Continue to define more segments if required.
8. Click Save to update the segments for the circuit map or Cancel to abandon any
changes made.
Issue 1.00
Page 26 of 45
March 2003
Podium Data Analysis Software
User Manual
The Edit Map Segments dialog can also be accessed using the Edit Segments button
the Circuit Map toolbar.
on
The colours for both the track and the segments can be changed via the Setup option of
the main menu. See Section 8.5 for more information.
6.2.2
Deleting Segments
Unwanted circuit map segments are deleted in the following way:
1. Highlight the circuit (or any session or lap for the circuit) in the Lap Explorer
window.
2. Choose Map ¨ Edit Segments from the main menu. The Edit Segments dialog
appears.
3. Place the cursor over the segment to be deleted by clicking the map anywhere in
the segment. The Delete button is enabled (see Figure 23).
Figure 23 - Edit Map Segments Dialog (Deleting a Segment)
4. Click Delete. The segment is removed from the map (see Figure 24).
Issue 1.00
Page 27 of 45
March 2003
Podium Data Analysis Software
User Manual
Figure 24 - Edit Map Segments Dialog (Segment Deleted)
5. Click Save to update the segments for the circuit map or Cancel to abandon any
changes made.
6.2.3
Deleting All Segments
All the segments for a circuit map are deleted in the following way:
1. Highlight the circuit (or any session or lap for the circuit) in the Lap Explorer
window.
2. Choose Map ¨ Edit Segments from the main menu. The Edit Segments dialog
appears.
3. Click Delete All. A message box is displayed which requests confirmation of the
delete operation (see Figure 25).
Figure 25 - Edit Map Segments Dialog (Delete All Segments)
4. Click Yes to delete all the map segments or No otherwise.
5. Click Save to update the segments for the circuit map or Cancel to abandon any
changes made.
Issue 1.00
Page 28 of 45
March 2003
Podium Data Analysis Software
User Manual
7 Reports
Reports are used to summarise important aspects of a specific lap or session. They are a
particularly useful way of comparing relative times and speeds when a circuit map has
been divided up into segments. This chapter describes how reports are produced from
stored data.
7.1 Min/Max Values Report
A min/max values report shows the minimum and maximum values attained for each
parameter for the currently selected lap or laps. If both a Current Lap and a Reference
Lap have been selected then the difference between each minimum and maximum value
is also displayed.
Use either of the following methods to produce a min/max values report:
•
Activate the reports drop down menu by clicking on the arrow b next to the
on the main toolbar and select Min/Max Values, or
Reports button
•
Choose View ¨ Reports from the main menu and select Min/Max Values.
7.2 Speed Report
A speed report shows the minimum and maximum speeds for each segment for the
currently selected lap or laps. If both a Current Lap and a Reference Lap have been
selected then the difference between each minimum and maximum value is also
displayed.
Use either of the following methods to produce a speed report:
•
Activate the reports drop down menu by clicking on the arrow b next to the
on the main toolbar and select Speed Report, or
Reports button
•
Choose View ¨ Reports from the main menu and select Speed Report.
7.3 Split Report
A split report shows the time taken to complete each segment for each lap in the
current session. The theoretical fastest lap time is calculated together with the fastest
rolling lap achieved in the session.
The theoretical fastest lap is made up of the fastest time for each segment and these
are highlighted in the report. The values of the segments making up the fastest rolling
lap are shown in a different text colour.
Issue 1.00
Page 29 of 45
March 2003
Podium Data Analysis Software
User Manual
Use either of the following methods to produce a split report:
•
Activate the reports drop down menu by clicking on the arrow b next to the
on the main toolbar and select Split Report, or
Reports button
•
Choose View ¨ Reports from the main menu and select Split Report.
7.4 Removing Reports
Use either of the following methods to remove a report:
•
Activate the reports drop down menu by clicking on the arrow b next to the
on the main toolbar and select the report to be removed, or
Reports button
•
Choose View ¨ Reports from the main menu and select the report to remove.
Issue 1.00
Page 30 of 45
March 2003
Podium Data Analysis Software
User Manual
8 Configuration
Podium provides facilities for the SWIS10 steering wheel instrumentation system to be
configured via the serial port.
The way in which Podium itself operates can also be configured to suit each particular
application or personal taste.
This chapter describes how this configuration is carried out.
8.1 Data Logger
The setup mode of the SWIS10 steering wheel instrumentation system allows a majority
of the configurable parameters to be accessed. Podium provides a means of accessing
these parameters, together with others not available via the steering wheel.
8.1.1
Reading Current Configuration
Before the configuration of the steering wheel can be changed the current configuration
must be downloaded to the host computer. This is achieved in the following way:
1. Choose Setup ¨ Data Logger from the main menu. The Configuration Download
Dialog (Figure 26) appears.
Figure 26 - Configuration Download Dialog
2. Connect the data logger to the serial port of the host computer using the cable
provided and click OK. The current configuration of the steering wheel is
transferred to the host computer and the Setup Data Logger Dialog (Figure 27)
appears.
The Setup Data Logger Dialog contains six pages which are described in the following
sections.
Note that any configuration changes made in the Setup Data Logger Dialog will only
come into effect when they have been transferred back to the steering wheel.
Refer to the SWIS10 User Manual for a more complete description of the purpose of each
of the configuration settings.
Issue 1.00
Page 31 of 45
March 2003
Podium Data Analysis Software
User Manual
8.1.2
General
Click the General tab to display the General page (Figure 27) of the Setup Data Logger
Dialog.
Figure 27 - Setup Data Logger Dialog (General Page)
The model, serial number and software revision of the steering wheel are displayed at
the top of the page.
Session
The steering wheel maintains a counter that it uses to identify each
session.
This counter is incremented each time the steering wheel passes the
beacon for the first time after being switched on.
The current session number is displayed.
To reset the session number to zero click Reset in the Session box.
Odometer
The current odometer reading is displayed.
To reset the odometer to zero click Reset in the Odometer box.
Tell Tale
The rpm tell tale records the maximum engine speed value attained in
much the same way as a recording tachometer does.
The current rpm tell tale value is displayed.
To reset the rpm tell tale click Reset in the Tell Tale box.
Disable Setup
Check this box if you want to disable the setup mode on the steering
wheel. With this option set the steering wheel configuration can only
be viewed and altered using Podium.
Issue 1.00
Page 32 of 45
March 2003
Podium Data Analysis Software
User Manual
8.1.3
Lap Timing
Click the Lap Timing tab to display the Lap Timing page (Figure 28) of the Setup Data
Logger Dialog.
Figure 28 - Setup Data Logger (Lap Timing Page)
Main
Channel
Type a number or use the up/down arrows to set the Main Channel
value.
IN Channel
Type a number or use the up/down arrows to set the IN Channel value.
Hold Time
Type a number or use the up/down arrows to set the Hold Time value.
Blank Time
Type a number or use the up/down arrows to set the Blank Time value.
Issue 1.00
Page 33 of 45
March 2003
Podium Data Analysis Software
User Manual
8.1.4
Display
Click the Display tab to display the Display page (Figure 29) of the Setup Data Logger
Dialog.
Figure 29 - Setup Data Logger (Display Page)
Performance Display
Check this box if you want to enable the performance display.
Metric Units
Check this box if you want speeds and distances to be displayed
in metric units.
Hours/Minutes
Check this box if you want the elapsed time displayed as hours
and minutes rather than minutes and seconds.
Tacho
Check this box if you want engine speed displayed in the lap
time window.
Speed Window
Choose the parameter you want to be displayed in the speed
window.
RPM Lights
Enter the engine speed at which each of the rpm lights should
illuminate.
Issue 1.00
Page 34 of 45
March 2003
Podium Data Analysis Software
User Manual
8.1.5
Gauges
Click the Gauges tab to display the Gauges page (Figure 30) of the Setup Data Logger
Dialog.
Figure 30 - Setup Data Logger (Gauges Page)
Fuel Minimum
Enter a number or use the up/down arrows to set the fuel level
warning value.
Oil Temperature
Maximum
Enter a number or use the up/down arrows to set the oil
temperature warning value.
Water
Temperature
Maximum
Enter a number or use the up/down arrows to set the water
temperature warning value.
Oil Pressure
Enter a number or use the up/down arrows to set the oil pressure
warning value.
Fuel Sensor
Check the Invert input box if the fuel level is at it’s highest when
the sensor reads zero.
Check the Delay warning box to delay the fuel warning until the
fuel level has been below the minimum value for five seconds.
Issue 1.00
Page 35 of 45
March 2003
Podium Data Analysis Software
User Manual
8.1.6
Data Logging
Click the Data Logging tab to display the Data Logging page (Figure 31) of the Setup
Data Logger Dialog.
Figure 31 - Setup Data Logger (Data Logging Page)
Number of Magnets
Enter a number or use the up/down arrows to set the number
of magnets fitted to the sensing wheel.
Wheel Turns Per
Sample
Enter a number or use the up/down arrows to set the number
of turns per sample value.
Wheel Circumference
Enter a number or use the up/down arrows to set the wheel
circumference value.
Engine Pulses
Enter a number or use the up/down arrows to set the number
of sensor pulses for two revolutions of the engine.
Enable Data Logging
Check the box to enable data logging.
Clear Memory
Check the box to clear the data logging memory.
Issue 1.00
Page 36 of 45
March 2003
Podium Data Analysis Software
User Manual
8.1.7
Gear Indicator
Click the Gear Indicator tab to display the Gear Indicator page (Figure 32) of the Setup
Data Logger Dialog.
Figure 32 - Setup Data Logger (Gear Indicator Page)
User Channel 2
Check this box if the gear indicator is driven from a sensor
connected to user channel 2 rather than being determined from
wheel speed and gear ratios.
Neutral Low
Check this box if the sensor output is low when neutral is selected.
Gear Ratios
Enter the user channel 2 reading for each gear or the ratio in mph
per 5000 rpm.
8.1.8
Writing New Configuration
Once all the required changes to the configuration of the steering wheel have been
made, click OK. The Configuration Upload Dialog (Figure 33) appears.
Figure 33 - Configuration Upload Dialog
Verify that the data logger is still connected to the host computer and click OK. The
updated configuration is transferred to the data logger.
Issue 1.00
Page 37 of 45
March 2003
Podium Data Analysis Software
User Manual
8.2 Show Setup For Session
To examine the data logger configuration used for a session do the following:
1. Highlight the session of interest, or any lap within it, in the Lap Explorer window.
2. Choose Setup ¨ Show Setup For Session from the main menu.
The configuration for the chosen session will be displayed using the Setup Data Logger
Dialog as described above.
8.3 Channels
Podium needs to know how the sensors connected to the SWIS10-3 are configured so that
logged data can be displayed correctly.
The sensors are setup (or calibrated) in the following way:
1. Choose Setup ¨ Channels from the main menu. The Setup Channels Dialog (Figure
34) appears.
2. Make the necessary changes and click Apply to update the current configuration.
Click Cancel to abandon any changes made.
The Setup Channels Dialog has five pages which are described in the following sections.
8.3.1
Accelerometers
The control box of the SWIS10-3 contains two accelerometers mounted at right angles to
each other. One accelerometer measures lateral acceleration and the other measures
longitudinal acceleration.
Click the Accelerometers tab to display the Accelerometers page (Figure 34) of the
Setup Channels Dialog.
Figure 34 - Setup Channels Dialog (Accelerometers Page)
Issue 1.00
Page 38 of 45
March 2003
Podium Data Analysis Software
User Manual
Channels
Swapped
Check this box if the control box has been mounted at right angles to it’s
preferred direction, i.e. the X arrow on the enclosure is aligned with the
direction of travel rather than being at right angles to it.
X Axis
Enter the zero and gain for the X axis accelerometer.
Y Axis
Enter the zero and gain for the Y axis accelerometer.
8.3.2
Fuel Level
Click the Fuel Level tab to display the Fuel Level page (Figure 35) of the Setup Channels
Dialog.
Figure 35 - Setup Channels Dialog (Fuel Level Page)
Units
Type in the units of measurement for the fuel sensor or pick an option
from the list.
Zero
Enter a number or use the up/down arrows to set the zero point of the
fuel sensor.
Gain
Enter a number or use the up/down arrows to set the gain of the fuel
sensor.
8.3.3
User Channels
The two user channels of the SWIS10-3 are configured in the same way so the pages used
to set them up are identical. Click the User Channel 1 tab to display the User Channel 1
page (Figure 36) and the User Channel 2 tab to display the User Channel 2 page.
Issue 1.00
Page 39 of 45
March 2003
Podium Data Analysis Software
User Manual
Figure 36 - Setup Channels Dialog (User Channel Page)
Name
Type the name for the user channel.
Units
Type in the units of measurement for the user channel or pick an option
from the list.
Zero
Enter a number or use the up/down arrows to set the zero point of the
sensor attached to the user channel.
Gain
Enter a number or use the up/down arrows to set the gain of the sensor
attached to the user channel.
8.3.4
Filtering
Click the Filtering tab to display the Filtering page (Figure 37) of the Setup Channels
Dialog.
Figure 37 - Setup Channels Dialog (Filtering Page)
Podium uses a simple, but effective, averaging filter to remove noise from logged data.
To filter data for a particular channel, check the box adjacent to the channel name on
the Filtering page.
Issue 1.00
Page 40 of 45
March 2003
Podium Data Analysis Software
User Manual
Note that filtering cannot compensate for poor quality data due to electrical noise or
poorly mounted sensors. If the data is excessively noisy then filtering may give
unpredictable results.
Issue 1.00
Page 41 of 45
March 2003
Podium Data Analysis Software
User Manual
8.4 Serial Port
To alter the serial port that Podium uses to communicate with the SWIS10-3 do the
following:
1. Choose Setup ¨ Serial Port from the main menu. The Setup Serial Port Dialog
(Figure 38) appears.
Figure 38 - Setup Serial Port Dialog
2. Select the new serial port from the list.
3. Click OK to update the serial port or Cancel to leave it unchanged.
8.5 Colours
The colours used to display the graphs and circuit map can be changed if required.
In each case, the standard colour dialog (Figure 39) is used to set the new colour. Fortyeight standard colours are available as well as an almost infinite number of user-defined
custom colours.
Figure 39 – Standard Colour Dialog
Issue 1.00
Page 42 of 45
March 2003
Podium Data Analysis Software
User Manual
8.5.1
Current Lap Graph
The colour used to display graphs for the Current Lap is changed in the following way:
1. Choose Setup ¨ Graph Colours ¨ Current Lap from the main menu. The Standard
Colour Dialog (Figure 39) appears.
2. Select the new colour for Current Lap graphs and click OK or click Cancel to leave
the colour unchanged.
8.5.2
Reference Lap Graph
The colour used to display graphs for the Reference Lap is changed in the following way:
1. Choose Setup ¨ Graph Colours ¨ Reference Lap from the main menu. The
Standard Colour Dialog (Figure 39) appears.
2. Select the new colour for Reference Lap graphs and click OK or click Cancel to
leave the colour unchanged.
8.5.3
Circuit Map Outline
The colour used to display the track outline for the circuit map is changed in the
following way:
1. Choose Setup ¨ Map Colours ¨ Track from the main menu. The Standard Colour
Dialog (Figure 39) appears.
2. Select the new colour for the track outline and click OK or click Cancel to leave
the colour unchanged.
8.5.4
Circuit Map Segments
The colour used to display the map segments for the circuit map is changed in the
following way:
1. Choose Setup ¨ Map Colours ¨ Segments from the main menu. The Standard
Colour Dialog (Figure 39) appears.
2. Select the new colour for the map segments and click OK or click Cancel to leave
the colour unchanged.
Issue 1.00
Page 43 of 45
March 2003
Podium Data Analysis Software
User Manual
9 Troubleshooting
Problem
I can’t download data from the steering wheel or read/write its
configuration.
Cause
The steering wheel is not powered up.
Action
Turn on the Master switch, and the ignition switch (if necessary).
Cause
The download lead is not connected.
Action
Connect the data logger to the serial port of the host computer using
the cable provided and try again.
Cause
The lead is not making a good connection.
Action
Ensure both connectors are fully home and that the lead is not
damaged in any way.
Cause
The serial port is not configured correctly.
Action
Choose Setup ¨ Serial Port from the main menu and select the correct
serial port.
Problem
The circuit map doesn’t match the track layout.
Cause
The control box has been installed in the correct orientation.
Action
Re-position the control box so that the Y arrow is aligned with the
direction of travel. If this is not possible, rotate the control box by 90º
and choose Setup ¨ Channels to check the Channels Swapped box on
the Accelerometers setup page.
Cause
The zero and gain values are incorrect.
Action
Enter the correct zero and gain values and try again.
Issue 1.00
Page 44 of 45
March 2003
Podium Data Analysis Software
User Manual
10 Glossary
Accelerometer
A sensor for measuring acceleration, or the rate of change of speed.
Calibration
The process of scaling logged data into engineering units.
Downloading
The process of transferring stored data from a data logger to a host
computer.
Filtering
A mathematical method for removing noise from a graph.
Gain (of sensor)
The relationship between the logged value (in bits) and the physical
value (in engineering units).
Lateral G
The sideways acceleration caused by cornering.
Longitudinal G
The fore-aft acceleration caused by accelerating and braking.
Session
Data stored for one or more track outing and downloaded to the host
computer.
Zero (of sensor)
The value logged by the data logger when the parameter being
measured by the sensor is zero.
Issue 1.00
Page 45 of 45
March 2003