1
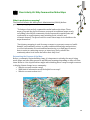
CULTURALLY SITUATED COMMUNITY SENSING A project by Rensselaer Polytechnic Institute Northern Arizona University: Summer Scholars July 24th-‐29th 2011 (Grades: 6-‐8 and 9-‐12) Acknowledgements This workbook was constructed over the period of Summer 2011 to assist in teaching a series of workshops on environmental sensing. These workshops were conducted on the Navajo Reservation in collaboration with: Diné College, Shiprock, NM Diné Environmental Institute, Topic: air quality monitoring and GIS July 5th-‐8th 2011 Northern Arizona University, Flagstaff AZ EEOP Summer Scholars Topic: climate change and youth activism July 24th-‐29th 2011 Significant portions of this workbook were adapted from existing educational materials made available by organizations to assist teachers in engaging students in topics of environmental studies. We would like to acknowledge the following sources and organizations for providing this content for public use. Additional sources for these materials are noted throughout the workbook: Environmental Sensing: • Clarkson University, SENSE IT program. This project is available at (http://www.senseit.org/). • University of Massachusetts, Lowell, iSENSE project. This project can be found at: (http://isense.cs.uml.edu/). • Georgia Institute of Technology and Carnegie Mellon University, Neighborhood Networks Project. This project can be found at (http://www.neighborhood-‐ networks.net/). • Burke, J., Estrin, D., Hansen, M., Parker, A., Ramanathan, N., Reddy, S. and Srivastava, M.B., SenSys, Participatory Sensing, ACM, 2006. Climate Change: • World Wildlife Fund, Curriculum for Teachers • The Cooperative College UK, Teacher Resources for Climate Change. • EPA About Global Warming and Climate Change: Back to Basics 2009 • EPA Climate Change and Ecosystems 2010 1 • NSF Digital Library for Earth Systems Education • Bristol Univ. School of Geographic Sciences • NASA Soil Moisture 1999: http://wwwghcc.msfc.nasa.gov/landprocess/ • GALAXY.NET and Explorelearning.com (humidity sensing activity) • GardenBot.com by Andrew Frueh and Botanicalls.com (soil moisture activity) Geographic Mapping and GIS: • USGS Exploring Maps teaching modules, 1993 • ArcGIS software user manual. Available at: http://www.arcgis.com • USGS How to Read a Topographic Map Teacher activity packet 2007 • Earth System Science Education program, University of Oklahoma 2001 • USGS Topographic Map Symbols Pamphlet, 1993. Pollution and Air Quality: • The American Lung Association guide to air quality, 1992 • Delaware Department of Natural Resources and Environmental Control, Why Study Air Pollution? High School and Middle School Air Quality Education Program, 2000. Participatory mapping: • International Fund for Agricultural Development, Good practices in participatory mapping, 2009. • Chaplan L. and Threkheld B. Indigenous Landscapes: A Study in Ethnocartography, 2001. • Rambaldi G. Participatory Three-‐Dimensional Modelling: Guiding Principles and Applications, 2010 Edition, ACP-‐EU Technical Centre for Agricultural and Rural Cooperation (CTA), 2010. • NOAA Coastal Services Center, Stakeholder Engagement Strategies for Participatory Mapping, 2010. 2 Table of Contents Acknowledgements ................................................................................................................. 1 Table of Contents .................................................................................................................... 3 Culturally Situated Community Sensing ................................................................................... 4 Worksheet #1: Climate Change Quiz ........................................................................................ 5 Class Activity #1: What is Climate Change? .............................................................................. 7 Class Activity #2: Predicting Climate Change .......................................................................... 10 Worksheet #2: Measuring Relative Humidity ........................................................................ 12 Worksheet #3: Measuring Soil Moisture ................................................................................ 14 Class Activity #3: Field Measurements and Sensors ............................................................... 17 Field Site Visit and Data Collection ........................................................................................ 18 Worksheet #4: Field Site Visit – RPI Sensor ............................................................................ 20 Field Site Evaluation Form ..................................................................................................... 21 Class Activity #4: Mapping Field Sites .................................................................................... 24 Worksheet #5: Reading Maps ................................................................................................ 25 Class Activity #5: How Data is Mapped .................................................................................. 28 Class Activity #6: Why Communities Make Maps ................................................................... 30 Worksheet #6: Why We Map? ............................................................................................... 32 Worksheet #7: Workshop Survey .......................................................................................... 33 Appendix A: Careers related to Climate Change .................................................................... 36 Appendix B: Climate Change Quiz – Answer Key ................................................................... 37 Appendix C: USGS Topographical Map Symbols ..................................................................... 39 Appendix D: Warranty and Licensing ..................................................................................... 42 Appendix E: Contact Us ......................................................................................................... 42 Appendix F: The RPI Community Sensor Team ....................................................................... 42 Classroom Fieldwork Computer Activity Activity Activity 3 Culturally Situated Community Sensing What is Climate Change? Many human activities release “greenhouse gases” into the atmosphere. The levels of these gases are increasing at a faster rate than at any time in hundreds of thousands of years. We know that greenhouse gases trap heat. If human activities continue to release greenhouse gases at or above the current rate, we will continue to increase average temperatures around the globe. Increases in global temperatures will most likely change our planet’s climate in ways that will have significant long-‐term effects on people and the environment. How do scientists measure and predict climate change? The Earth’s climate is very complex and involves the influences of air, land, and oceans on one another. Scientists use computer models to study these interactions. The models project future climate changes based on expected changes to the atmosphere. Though the models are not exact, they are able to simulate many aspects of the climate. Scientists reason that if the models can mimic currently observed features of the climate, then they are also most likely able to project future changes. Much of the information used in these computer models is collected using remote sensors, which take different measurements in our environment. Sources: EPA “About Global Warming and Climate Change: Back to Basics” 2009 What is the purpose of this workshop? Using environmental sensors often require the use of maps in order to make sense of sensor data. Mapping is also a gateway to thinking about how climate change can influence a community. Useful maps not only include things like statistics, but also locations of cultural and social value such as historical sites, nearby schools, and protected land. These kinds of maps have a number of advantages over generic maps. Not only are they made to answer certain questions about a community, but they also contain information that might otherwise not be included on generic maps. The workshops described in this booklet use environmental sensing and mapping to ask questions about what it means to survey our environment. These workshops include activities that use sensor technology but also rely on our observations of the environment. In these workshops we will learn how sensors work, how maps are constructed, and how data is collected. We will use a portable sensor unit call the RPI Community Sensor to collect this data. 4 Worksheet #1: Climate Change Quiz Participant’s Name(s): ______________________________________________________________________________ (Grades 6-‐12) DIRECTIONS: Check the correct answer for the following questions. 1. What effect traps heat next to the Earth? o The refrigeration effect o The greenhouse effect o The hothouse effect 2. Where do greenhouse gases trap energy? o In the atmosphere o In outer space o In the soil 3. What is the main man-‐made greenhouse gas? o Oxygen o Hydrogen o Carbon dioxide 4. What is the main way that carbon dioxide is made? o When it rains o When fuel is burnt o When there's a hurricane 5. What is the main way that carbon dioxide is used? o When plants use it to make food o When animals breathe it in o When fuel is burnt 6. What might happen if there is too much carbon dioxide in the atmosphere? o The temperature on Earth may go up, so there will be global warming o The temperature on Earth may go down, so there will be global cooling o The oceans may dry up, so there will be global drying 7. What do scientists study in order to learn more about past climate? o Soil sediments and rock formations o Ice layers o Tree rings o Past civilizations o All of the above 8. What do scientists study in order to learn about current and future climate? o Weather patterns o Seasonal temperatures o Rainfall o Greenhouse gases o All of the above 5 (Grades 9-‐12 only) DIRECTIONS: Circle true or false in each of the following questions. 1. The difference between climate and weather is that Earth’s climate is the average condition in a given place over many years, whereas, weather includes only the immediate conditions for a specific place. 2. The atmosphere is a relatively thin layer of gas that scientists divide into four sections based only on chemical composition. 3. Greenhouse gases (GHGs) act like a blanket in the atmosphere, trapping heat and warming the planet. 4. The following gases are not GHGs: nitrous oxide (N2O), methane (CH4), water vapor (H20) and chlorofluorocarbons (CFCs). 5. Climate change refers only to the increasing temperature of the earth’s surface. 6. Without the human race, GHGs would not exist. 7. Human-‐caused emissions of carbon come from both the burning of fossil fuels and from land-‐use changes such as deforestation and land-‐clearing. 8. The majority of human-‐caused carbon emissions come from the burning of fossil fuels. 9. Climate change is predicted to greatly affect the natural resources (such as water) that people depend on. 10. Individual actions, such as replacing all of your old light bulbs with Compact Fluorescent light bulbs, will help reduce the amount of GHGs in the atmosphere. TRUE / FALSE TRUE / FALSE TRUE / FALSE TRUE / FALSE TRUE / FALSE TRUE / FALSE TRUE / FALSE TRUE / FALSE TRUE / FALSE TRUE / FALSE Sources: World Wildlife Fund Curriculum for Teachers; The Cooperative College UK Teacher Resources for Climate Change. 6 Class Activity #1: What is Climate Change? The Greenhouse Effect The Earth’s greenhouse effect is a natural occurrence that helps regulate the temperature of our planet. When the Sun heats the Earth, some of this heat escapes back to space. The rest of the heat, also known as infrared radiation, is trapped in the atmosphere by clouds and greenhouse gases, such as water vapor and carbon dioxide. If all of these greenhouse gases were to suddenly disappear, our planet would be 60°F colder and would not support life as we know it. Human activities have enhanced the natural greenhouse effect by adding greenhouse gases to the atmosphere, very likely causing the Earth’s average temperature to rise. These additional greenhouse gases come from burning fossil fuels such as coal, natural gas, and oil to power our cars, factories, power plants, homes, offices, and schools. Cutting down trees, generating waste and farming also produce greenhouse gases. How much will the earth warm if emissions of greenhouse gases continue to rise? If humans continue to emit greenhouse gases at or above the current pace, we will probably see an average global temperature increase of 3 to 7°F by 2100, and greater warming after that. Even if we were to drastically reduce greenhouse gas emissions, returning them to year 2000 levels, the Earth would still warm about 1°F over the next 100 years. This is due to the long lifetime of many greenhouse gases and the slow cycling of heat from the ocean to the atmosphere. 7 How might climate change affect our world? Our Health: Longer, more intense and frequent heat waves may cause more heat-‐related death and illness. Declining air quality in cities can also worsen air pollution such as ozone, or smog. Climate change health effects are especially serious for the very young, very old, or for those with heart and respiratory problems. Agriculture and Forestry: The supply and cost of food may change as farmers and the food industry adapt to new climate patterns. A small amount of warming coupled with increasing Carbon Dioxide may benefit certain crops, plants and forests, although the impacts of vegetation depend also on the availability of water and nutrients. Water Resources: In a warming climate, extreme events like floods and droughts are likely to become more frequent. More frequent floods and droughts will affect water quality and availability. For example, increases in drought in some areas may increase the frequency of water shortages and lead to more restrictions on water usage. Energy Needs: Warmer temperatures may result in higher energy bills for air conditioning in summer, and lower bills for heating in winter. Energy usage is also connected to water needs. Energy is needed for irrigation, which will most likely increase due to climate change. Also, energy is generated by hydropower in some regions, which will also be impacted by changing precipitation patterns. 8 Wildlife: Warmer temperatures and precipitation changes will likely affect the habitats and migratory patterns of many types of wildlife. The range and distribution of many species will change, and some species that cannot move or adapt may face extinction. How might climate change impact the environment? What Is an Ecosystem? An ecosystem is an interdependent system of plants, animals, and microorganisms interacting with one another and with their physical environment. An ecosystem can be as large as the Mojave Desert or as small as a local pond. Ecosystems provide people with food, goods, medicines, and many other products. They also play a vital role in nutrient cycling, water purification, and climate moderation. Biodiversity: Climate change can have broad effects on biodiversity (the number and variety of plant and animal species in a particular location). Although species have adapted to environmental change for millions of years, a quickly changing climate could require adaptation on larger and faster scales than in the past. Those species that cannot adapt are at risk of extinction. Even the loss of a single species can have cascading effects because organisms are connected through food webs and other interactions. Habitat: Most plants and animals prefer to live in a particular habitat with a specific temperature range and amount of precipitation. Climate change will alter, and in some cases destroy, certain types of habitats. For example, melting sea ice is eliminating an important habitat for several Arctic species. Some species will be able to adapt to changing habitats—for example, by shifting their range northward or to higher altitudes in order to adjust to rising temperatures. Others, however, might not be able to adapt fast enough to keep pace with the rate of climate change. Sources: EPA “About Global Warming and Climate Change: Back to Basics” 2009; EPA “Climate Change and Ecosystems” 2010; NSF Digital Library for Earth Systems Education; Image: Bristol Univ. School of Geographic Sciences 9 Class Activity #2: Predicting Climate Change Why do scientists take measurements? The geographic ranges of plant and animal species are affected by climatic factors such as temperature, precipitation, soil moisture, humidity, and wind. A shift in the magnitude or variability of these factors in a given location due to global climate change will likely impact the organisms living there. Species sensitive to temperature may respond to a warmer climate by moving to cooler locations at higher latitudes or elevations. Others may not move to a new location but instead face extinction. Scientists study certain aspects of how our climate works to help make global and regional predictions more accurate and useful. Data is collected using instruments, and this data is then used to evaluate and improve the elements of Global Climate Models – large computer programs that simulate how the entire earth’s atmosphere behave. Data is often collected at different locations to make comparisons. Scientists gather and use the data from these sites to study the effects of sunlight, radiant heat, and clouds on temperature, weather, and climate. By having sites in very different locations we can learn how to improve the accuracy of the models and to understand the difference between weather and climate changes that take place in a local ecosystem. What kinds of measurements do scientists make? Temperature: Temperature is one of the most frequently measured quantities in science. The temperature of the air is directly related to the amount of energy that is derived from the sun's solar radiation. The higher the temperature, the higher the amount of energy in the air. Temperature is measured using a thermometer with units in degrees Celsius or Fahrenheit. Humidity: Humidity is a measure of amount of water vapor or moisture in actually in the air at a certain temperature. At higher temperatures air can hold more humidity. The amount of water vapor in the air varies. The percentage of water vapor in the air compared to what the air can hold at that certain temperature is called the relative humidity. Humidity is measured using an instrument called a hygrometer. A hygrometer measures the difference in temperature of the air and that of a dry thermometer to a wet thermometer. For clouds to for, and rain to start, the air has to reach 100% relative humidity, but only where the clouds are forming. þ Use Worksheet #2 (Measuring Relative Humidity) to complete this exercise 10 Soil Moisture: Soil moisture is the water that is held in the spaces between soil particles. Surface soil moisture is the water that is in the upper 10 cm of soil, whereas root zone soil moisture is the water that is available to plants, which is generally considered to be in the upper 200 cm of soil. Compared to other components of the hydrologic cycle, the volume of soil moisture is small; nonetheless, it of fundamental importance to many hydrological, biological and biogeochemical processes. Why is Measuring Soil Moisture Important? Soil moisture information is valuable to a wide range of groups concerned with weather and climate, flood control, drought, soil erosion and slope failure, reservoir management, and water quality. Soil moisture is a key variable in controlling the exchange of water and heat energy between the land surface and the atmosphere through evaporation and plant transpiration. As a result, soil moisture plays an important role in the development of weather patterns and the production of precipitation. Soil moisture also strongly affects the amount of precipitation that runs off into nearby streams and rivers. þ Use Worksheet #3 (Measuring Soil Moisture) to complete this exercise Sources: EPA “Climate Change and Ecosystems” 2010; NASA “Soil Moisture” 1999: http://wwwghcc.msfc.nasa.gov/landprocess/ 11 Name: ______________________________________ Date: ________________________ Worksheet #2: Measuring Relative Humidity Student Exploration: Relative Humidity (Recommended for grades 6-‐8) Participant’s Name(s): Vocabulary: condense, dew point, evaporate, humidity, psychrometer, relative humidity, ______________________________________________________________________________ saturated, water vapor, wet bulb depression How it works When you go outside on a hot summer day, usually your body begins to sweat. Why does Prior Knowledge Questions (Do these BEFORE using the Gizmo.) your body do this? 1. When you go outside on a hot summer day, usually your body begins to sweat. Why does your body do this? __________________________________________________________ _________________________________________________________________________ Humidity is the amount of moisture in the air. Do you think sweating cools you down more on a dry day or a humid day? 2. Humidity is the amount of moisture in the air. Do you think sweating cools you down more day or a humid day? _________________________________________________ on a dry When sweat evaporates, heat energy is removed from our skin Gizmo Warm-up When sweat heat energy our vskin and and oevaporates, ur bodies cool down. But tishe removed amount ofrom f water apor air our bodies down. But the ofowater vapor air ishas can cool hold is limited, so samount weat can nly evaporate if tcan he ahold ir still limited, so sweat can only evaporate if the air still has the capacity to the capacity to hold more water. If the humidity is high, less hold more water. humidity is thigh, less owater can evaporate from water can Ifethe vaporate from he sweat n your skin. the sweat on your skin. The amount of water vapor in the air compared to the maximum The amount of water vapor air compared tohthe maximum amount air can hold inis the known as relative umidity. In this amount air can hold is known as relative humidity. In the Relative activity TM you will use a psychrometer to determine relative Humidityhumidity. Gizmo , you will use a psychrometer to determine relative humidity. A psychrometer has two thermometers. The dry bulb thermometer measures air temperature. The second has A psychrometer has two thermometers. The dthermometer ry bulb a wet bulb. As water evaporates from the wet bulb, its temperature thermometer measures air temperature. The second decreases relative to the thermometer has air a wtemperature. et bulb. As water evaporates from the wet bulb, its temperature decreases relative to the air temperature. 1. Do you think the wet bulb will cool down more on a dry or humid day? _________________ Materials • 2 thermometers 2. Click Play ( ) and observe the thermometers for about 24 simulated hours. Describe • 1 rubber band some of the changes in temperature for both thermometers: • 1 cup of room temperature water • 1 paper towel _________________________________________________________________________ _________________________________________________________________________ Sources: GALAXY.NET and Explorelearning.com teacher resource guides _________________________________________________________________________ 12 Instructions 1. Wrap the paper towel around the bulb of one of the thermometers and hold it there with the rubber band. 2. Wet the paper towel in the cup of water. Wait 5 minutes. 3. There should be a difference in the temperatures of the two thermometers. 4. Record the two temperatures here: Dry Thermometer ___________ °F Wet Thermometer ___________ °F 5. Now subtract them to get the difference: Dry ___________ °F -‐ Wet 6. Use the chart below tMeasuring o estimate the relative humidity: Relative Humidity Difference Between Dry Bulb and Wet Bulb Temperatures Relative Humidity in Degrees Fahrenheit 1 2 3 4 The top numbers indicate dry bulb. 5 6 If the difference between wet and dry bulb is 7 6º F and the temperature is 72º F (dry bulb), 8 then the RH is 54%. 9 http://www.galaxy.net/~k12 60 64 68 72 76 80 84 88 90 80 71 61 53 44 91 82 73 65 57 49 91 83 74 66 59 51 92 83 76 68 61 54 92 84 77 69 62 56 92 85 78 71 65 58 93 86 79 72 66 60 93 86 80 73 67 61 36 41 44 47 49 52 54 56 27 34 37 40 43 47 49 51 20 27 31 34 37 41 43 45 Warm air is able to hold much CONCLUSION: more water vapor than cold air before it becomes saturated (100% relative humidity). ______________________________________________________________________ How would you expect the relative humidity of air to change as air warms up in the ______________________________________________________________________ morning? How would you expect it to change as air cools in the evening? CHALLENGE: Can you think of why the wet bulb temperature is less than the dry bulb temperature? ______________________________________________________________________ ______________________________________________________________________ 13 ______________________________________________________________________ Worksheet #3: Measuring Soil Moisture (Recommended for grades 9-‐12) Participant’s Name(s): ______________________________________________________________________________ How it works In this workshop you will be using a basic soil moisture sensor made from two nails, called probes, connected to wires. These wires are then connected to a multimeter which measures the electrical resistance between the nails. When soil is dry it is not possible for electricity to pass between the dirt particles to each of the probes. In electrical terms this means electronics cannot reach the probes because the soil “resists” their flow – this is called resistance. As water is added to the soil, more electrons can pass between the probes. This reduces the amount of resistance between the probes to the point. When the soil is fully saturated, the probes have virtually zero resistance. By using this range of values you can determine the amount of water that exists in your soil. Materials • • • • • • • 2 nails (galvanized exterior) 2 lengths of wire (with stripped ends) block of packaging foam, cardboard, or similar digital multimeter 1 cup of dry soil 1 cup of semi-‐wet soil 1 cup of very wet soil 14 Instructions 1. Cut two pieces of wire each about 12” long. 2. Strip about 1” of casing from each end of the two wires. 3. Score the tops of the nails with a file to make a clean area for connecting the wires. 4. Attach the wires to the nails by wrapping the wires tightly around the ends. 5. OPTIONAL: Cut a block out of packaging, thick cardboard or other material. Place two holes spaced evenly and insert the nails. 6. Set your digital multimeter to a resistance of 200k ohms (Ω) Sources: workshop instructions from GardenBot.com by Andrew Frueh and from Botanicalls.com] 15 Now your soil moisture sensor is built, let’s put it to use! 1. Insert the probes into the first cup of DRY soil. Record your reading here: Dry ___________ k ohms Soil 2. Insert the probes into the first cup of SEMI-‐WET soil. Record your reading here: Dry Soil ___________ k ohms 3. Insert the probes into the first cup of WET soil. Record your reading here: Dry Soil ___________ k ohms What weather factors might determine the moisture of soil? How might soil go from being wet to dry in an outdoor environment? Which of the three soil scenarios do you think would prevent wind from turning soil into dust particles? Why do you think this is the case? Which of the three soils scenarios do you think would best support heavy rainfall without creating runoff or flash floods? 16 Class Activity #3: Field Measurements and Sensors What is Environmental Sensing? A sensor is a device that detects or measures a physical quantity and converts the measurement into a signal that can be read in a different way. For example, a typical garden thermometer converts the measured temperature into a moving red-‐colored liquid that can be read on a glass tube. When we talk about the usefulness of a sensor, there are a few key terms we must understand: • Accuracy is the degree to which conformity of a measurement to its actual value. For example, if the temperature outside is 90°F but your thermometer reads 80°F, this is not accurate. • Precision is the degree to which a measuring device repeatedly gives the same result. For example, if the temperature outside is 90°F but your thermometer reads 80°F every time for 20 different tests, it might not be accurate but it is precise. This means a useful sensor will be both accurate and precise. This is often not the case with most sensors – which means they need to be calibrated to correlate the sensor’s readings with those of a known standard. • • Sensitivity refers to the minimum amount of change that can be measured by the device. For example, if you are measuring temperature with a thermometer that reads in increments of 1°F, then your sensitivity is 1°F. Range refers to the distance between the minimum and maximum reading possible by the sensor. For example, a typical kitchen thermometer might go from 40°F up to 200°F. It is important to choose a sensor that covers the sensitivity and range needed for your experiment. If you need to know the temperature of the air to the nearest 1°F, and your neighborhood can have temperatures ranging from -‐10°F up to 120°F, then it is wouldn’t make sense to use a thermometer accurate to 0.01°F but only works for temperatures between 0°F and 80°F. 17 Field Site Visit and Data Collection The purpose of this exercise is to visit field sites we imagine might represent a variety of different environmental characteristics. A series of tasks will be assigned to assist your group in exploring these areas. In our next classroom exercise, the data we gather in this exercise will be used to begin building a data map useful for thinking about climate change. The RPI Community Sensor For our field site visit we will be using the RPI Community Sensor to detect Temperature, Relative Humidity, and Soil Moisture. The sensor is also able to detect Carbon Monoxide and Volatile Organic Compounds, which are both measurements of air pollution. The RPI Community Sensor actually consists of two separate boxes. The first is the User Interface, which allows us to program the sensor and connect to a GPS satellite and find our location. The second is the Core Unit, which does all the computing work (like saving data and keeping track of the time) and runs the sensors. Global Positioning System (GPS) Each RPI Sensor is equipped with a Global Positioning System (GPS) device, which determines its exact location. Later we will place our data points on a map using GPS coordinates. GPS is a satellite-‐based navigation system made up of a network of 24 satellites. These satellites circle the earth twice a day and transmit signals to earth. GPS receivers take this information from three different satellites and use triangulation to calculate the GPS receiver’s location. 18 The GPS receiver then compares the time a signal was transmitted by a satellite with the time it was received. The time difference tells the GPS receiver how far away the satellite is. With the distance measurements from a few more satellites, the receiver can determine the user's position and display it on the unit's electronic map. Geographic Information Systems (GIS) As we collect sensor data and GPS coordinates for our various field sites for entering in the RPI online software, we begin to explore what it means to use Global Information Systems (GIS) technology to view data in different ways. ArcGIS, a leader in GIS software describes GIS: • GIS integrates hardware, software, and data for capturing, managing, analyzing, and displaying all forms of geographically referenced information. • GIS allows us to view, understand, question, interpret, and visualize data in many ways that reveal relationships, patterns, and trends in the form of maps, globes, reports, and charts. • GIS helps you answer questions and solve problems by looking at your data in a way that is quickly understood and easily shared. þ Use Worksheet #4 (Field site visit – RPI Sensor) to complete this exercise 19 Worksheet #4: Field Site Visit – RPI Sensor Introduction For this field site activity, we will be breaking the group up into small groups of 3 or 4 people. Each of these groups will be given: • Digital camera • A pen • A field site evaluation forms • A blank paper to draw a map of the field site Choosing your Field Sites Your instructor has given your team a certain amount of time to complete this assignment. In that time, visit 2 different locations at this field site. As you decide where you will will visit, try to find the following: • Where you expect to find an area with a high degree of soil moisture • Where you expect to find an area with a low degree of soil moisture Documenting the Field Sites For each of your field sites do the following: 1. Draw a map of what you think the larger field site area might look like 2. Inspect the area around your selected location at the field site 3. Fill out the field site evaluation form 4. Take a photograph of this part of the field site 5. Mark this part of the field site on your map of the bigger area Selecting Locations for the RPI Sensor Once all the teams have reported back with their field site evaluations, we will select 4 locations to place the RPI Community sensor. We will decide this based on which locations we think will give us the most interesting results in measuring temperature, relative humidity, and soil moisture. 20 Field Site Evaluation Form Participant’s Name(s): ______________________________________________________________________________ Date: _______________________ Time: _______________________ Field Site: _________________________ Step #1: Draw a map of the larger field site In the area below, draw a map of what you think the larger field site might look like. Since you haven’t seen the entire area you might need to make a best guess. Look at the horizon, nearby mountains, tree lines, roads, and drainage ditches for clues. 21 Step #2: Go to your FIRST location at the field site (high soil moisture) General Description of the site Inspect this location and write down your observations Weather information Current weather (circle one): CLEAR / PARTLY-‐CLOUDY / CLOUDY / FOG / RAIN Wind speeds (circle one): CALM / SLIGHT-‐BREEZE / MODERATE-‐BREEZE / WINDY Wind coming from which direction: NORTH / SOUTH / EAST / WEST Land use What sort of land use is within view (check all that apply): ______FARMS ______LIVESTOCK/FARMING ______HOUSES ______FACTORIES ______STORES ______PARKING LOT ______EMPTY LOT ______CARS _____TRUCKS ______CONSTRUCTION ______WALKWAY ______WOODS _____PLANTS ______HISTORIC SITE Do you think there is evidence of climate change at this site? YES / NO If YES, what do you think this might be? What do you think the RPI Sensor might detect here that is related to climate change? Step #3: Document and mark this field site location on the map þ Check off each as you go! ☐ Camera: using your digital camera, take 3 photographs of this field site ☐ Map: estimate your current location and mark it on the big map you drew above 22 Step #4: Go to your SECOND location at the field site (low soil moisture) General Description of the site Inspect this location and write down your observations Weather information Current weather (circle one): CLEAR / PARTLY-‐CLOUDY / CLOUDY / FOG / RAIN Wind speeds (circle one): CALM / SLIGHT-‐BREEZE / MODERATE-‐BREEZE / WINDY Wind coming from which direction: NORTH / SOUTH / EAST / WEST Land use What sort of land use is within view (check all that apply): ______FARMS ______LIVESTOCK/FARMING ______HOUSES ______FACTORIES ______STORES ______PARKING LOT ______EMPTY LOT ______CARS _____TRUCKS ______CONSTRUCTION ______WALKWAY ______WOODS _____PLANTS ______HISTORIC SITE Do you think there is evidence of climate change at this site? YES / NO If YES, what do you think this might be? What do you think the RPI Sensor might detect here that is related to climate change? Step #5: Document and mark this field site location on the map þ Check off each as you go! ☐ Camera: using your digital camera, take 3 photographs of this field site ☐ Map: estimate your current location and mark it on the map you drew above Sources: Field Site Form adapted from Clarkson University’s SENSE IT workshops 23 Class Activity #4: Mapping Field Sites What is a map? A map is a way of representing on a two-‐dimensional surface, (a paper, a computer monitor, etc.) any real-‐world location or object. Many maps only deal with the two-‐dimensional location of an object without taking into account its elevation. Topographic maps on the other hand do deal with the third dimension by using contour lines to show elevation change on the surface of the earth, (or below the surface of the ocean). Why are maps made? Some maps are made for general purposes and may show roads, towns and cities, rivers and lakes, parks, and State and local boundaries. Other maps are much more specific, conveying information primarily on a single topic. A map that depicts earthquake occurrences throughout the United States is a good example of a special-‐purpose map. Cartographers decide how to generalize and symbolize what they are trying to show. They select features to show and omit others. They often generalize the data, simplifying the information so that the map is easier to read. In choosing the scale, mapmakers determine how large an area they can map and how much detail they can show. The selection of symbols (which can include lines, patterns, and colors) also affects the legibility, aesthetics, and utility of the map. Sources: USGS “Exploring Maps” teaching modules, 1993 þ Use Worksheet #5 (Reading Maps) to complete this exercise 24 Worksheet #5: Reading Maps Participant’s Name(s): ______________________________________________________________________________ Topographic Maps Topographic maps have contour lines to show the shape and elevation of the land. They are sometimes called "level lines" because they show points that are at the same level. Here's how contour lines work: The top of this drawing is a contour map showing the hills that are illustrated at the bottom. On this map, the vertical distance between each contour line is 10 feet. 1. Which is higher, hill A or hill B? 2. Which is steeper, hill A or hill B? 3. How many feet of elevation are there between contour lines? 4. How high is hill A? 5. How high is hill B? 6. Are the contour lines closer together on hill A or hill B? 25 Look at this picture above. It shows a river valley and several nearby hills. On the illustration, locate the following things: • A bridge over the river • An oceanside cliff • A stream that flows into the main river • A hill that rises steeply on one side and more smoothly on the other. Here is a topographic map of the same place. Find the items you located on the illustration on the topographic map. 26 Above is the symbol legend for this topographical map. Answer the following: 1. On the topographic map above, put a square around the map symbol for a bridge. Now draw the symbol for a bridge here: 2. Put an X on the ocean side cliff. What is the elevation of the contour line at the top of that cliff? 3. Locate a stream that flows into the main river. Draw a pencil line down that stream. Put an X where the stream joins the main river. On a real topographic map, streams are shown in blue and contour lines are shown in brown. 4. Find the hill that rises steeply on one side and more smoothly on the other. On the topographic map, draw a path up the gentler slope of the hill to the highest point. (Hint: remember that when contour lines are close together, the ground is very steep.) Draw a path showing a very steep way up the hill. Sources: USGS Teacher activity packet “How to Read a Topographic Map” 2007 27 Class Activity #5: How Data is Mapped Data Maps Information that used to be collected little by little from ground observations can now be collected by remote sensing devices like the RPI Community Sensor. Cartographers now can gather spatial data and make maps faster than ever before —within hours—and the accuracy of these maps is excellent. Moreover, digital mapping enables mapmakers to experiment with a map's basic characteristics (for example, scale or projection), to combine and manipulate map data, to transmit entire maps electronically, and to produce unique maps on demand. Geographic information systems (GIS) Geographic information systems (GIS) are computer systems that store, manipulate, and display geographic information in layers, sets of data that can be combined with other layers or manipulated and analyzed individually. Results can be seen instantly on a computer screen, in some cases replacing the need for paper maps, freeing the cartographer to experiment with changes in the base map or in the spatial data. In addition to the information content, the map scale, symbols, colors, type, and overall layout can be changed quickly, greatly speeding the process of mapping. Sources: USGS “Exploring Maps” teaching modules, 1993; Image: ArcGIS layering 28 Viewing Your Sensor Data Now that we have collected all of the RPI Sensors from our field sites and returned to the computer lab, we can retrieve our data. Your instructor has already taken this data off the sensors for you and placed them on the RPI Community Sensor website for us to view. Here you will be able to view data collected from the various sensors. These include temperature, relative humidity, and soil moisture. Because the sensors used GPS when collecting data, we will also be able to view our data on a detailed map. A graph of temperature for example might look like this: The RPI site can be accessed at http://www.communitysensors.rpi.edu/ Your instructor will walk you through the process of viewing your data and entering the field site information. Follow instructions provided on the site for additional information. 29 Class Activity #6: Why Communities Make Maps What is participatory mapping? The National Oceanic and Atmospheric Administration (NOAA) defines participatory mapping as: “Techniques that can help communities make land use decisions. These maps go beyond the physical features portrayed in traditional maps; nearly everything valued by the community can be expressed in spatial terms and represented on a participatory map, including social, cultural, and economic features. The process used to create these maps is as valuable as the maps themselves.” “Participatory mapping is used for many reasons: to represent resources, health hazards, and community values; to gather traditional knowledge and practices; to collect information for environmental monitoring, or to find gaps in current data; to assist in conducting surveys or interviews; and to educate the community about local issues that affect their daily lives.” Determining the Purpose of the Map Before a community begins building a map, it is important to ask why the map is being made. Maps can have many purposes and different meanings depending on who will view them. Below is a list of questions we might ask in thinking about a map we might construct to display climate change in our community: • Why do we want to make a map? • What kind of information would be helpful on our map? • Who do we want to show it to? 30 Determining the Risks in Mapping When producing community resource maps with sensitive information, it is also important to identify some of the risks associated with mapping. For example, making valuable resources visible might allow others to exploit these resources. Or including information on maps that could aggravate groups involved in environmental or land disputes. Participants should discuss these issues in advance so that the information to be collected and included on the map can be tailored to avoid potentially negative consequences. • What are the risks associated with making maps? • Who decides on what is important? Practical Considerations Before Mapping Using the community’s maps to communicate information to decision-‐makers and other groups outside the community is perhaps the most significant component of the participatory mapping process. It is important that the completed maps are used to serve the intended purpose(s). • Who from the community will be involved in making the map? • What language will be used to represent the map and legend? • Will the map cover a large area or focus on areas of special significance? Ownership and Access Once a map has been created, it is often put into a public arena. It is important that the community is aware of this and develops rules for how the map is used and distributed: • Who owns the data? Who owns the maps? • Who benefits or is empowered by these changes and why? • Who loses or is disempowered by these changes and why? Sources: IFAD Good practices in participatory mapping; NOAA Coastal Services Center, Stakeholder Engagement Strategies for Participatory Mapping. þ Use Worksheet #6 (Why We Map?) to complete this exercise þ Please complete Worksheet #7 (Workshop Survey) at the end of this session 31 Worksheet #6: Why We Map? Participant’s Name(s): ______________________________________________________________________________ Part 1: Determining the Purpose of the Map Why do we want to make a map? What kind of information would be helpful on our map? Who do we want to show it to? Part 2: Determining the Risks in Mapping What are the risks associated with making maps? Who decides on what is important? Part 3: Practical Considerations Before Mapping Who from the community will be involved in making the map? What language will be used to represent the map and legend? Will the map cover a large area or focus on areas of special significance? Part 4: Ownership and Access Who owns the data? Who owns the maps? Who benefits or is empowered by these changes and why? Who loses or is disempowered by these changes and why? 32 Worksheet #7: Workshop Survey Participant’s Name(s): ______________________________________________________________________________ (Grades 6-‐12) DIRECTIONS: Answer the following questions about climate change. How concerned are you about the possibility of global climate changes? ( ) not concerned ( ) slightly concerned ( ) concerned ( ) very concerned When people talk about climate change, what kind of change do you think they are talking about? List the top 3 sources you believe could contribute to global climate change: These could be countries, organizations, businesses, industries, people, etc. 1. 2. 3. Where do you receive most of your information about the environment? Select three. Write a 1 by the most important, a 2 by the second most important, and 3 by the third most important source. ( ) Community information meetings ( ) Conversations with friends ( ) Environmental groups ( ) Newspaper or magazines ( ) Radio or television ( ) The Internet/World Wide Web ( ) Conversations with family members ( ) School 33 Who do you most trust to give you correct information about climate change? Rate on a scale of 1(least trusted) to 5 (most trusted) (1) (2) (3) (4) (5) ( ) ( ) ( ) ( ) ( ) Teachers ( ) ( ) ( ) ( ) ( ) Scientists ( ) ( ) ( ) ( ) ( ) Newspaper and magazines ( ) ( ) ( ) ( ) ( ) Radio and television ( ) ( ) ( ) ( ) ( ) The Internet/World Wide Web ( ) ( ) ( ) ( ) ( ) Government officials ( ) ( ) ( ) ( ) ( ) Environmental groups ( ) ( ) ( ) ( ) ( ) Friends ( ) ( ) ( ) ( ) ( ) Family members For each of the following statements, answer True or False: The term “Climate” means average weather: ( )True ( )False Climate often changes from year to year: ( )True ( )False Weather often changes from year to year: ( )True ( )False Climate means the same thing as weather: ( )True ( )False The earth's climate has been the same for millions of years: ( )True ( )False If global climate change does occur, how will it impact your way of life? Is there anything that you personally do in your life that could contribute to global climate change? ( ) Yes ( ) No ( ) I don't know If you answered "yes", what things were you thinking about? 34 (Grades 9-‐12 only) DIRECTIONS: Answer the following questions about climate change. When you think about climate change, what things are you most concerned about? Rate on a scale of 1(least concerned) to 5 (most concerned) (1) (2) (3) (4) (5) ( ) ( ) ( ) ( ) ( ) Global Warming ( ) ( ) ( ) ( ) ( ) Ozone depletion ( ) ( ) ( ) ( ) ( ) Deforestation and erosion ( ) ( ) ( ) ( ) ( ) Wildlife and species loss ( ) ( ) ( ) ( ) ( ) Pollution ( ) ( ) ( ) ( ) ( ) Overpopulation ( ) ( ) ( ) ( ) ( ) Natural disasters: flood, drought, tornados, etc. ( ) ( ) ( ) ( ) ( ) Air and water pollution How do you feel about current climate change issues? 1=strongly disagree 2=disagree X= not sure 4=agree 5=strongly agree ( ) Harm to the environment is justified if it brings an economic benefit ( ) It is important to preserve the environment for future generations ( ) There is nothing we can do to change environmental conditions ( ) Nature is fragile and we should be careful not to harm or disrupt it ( ) Technology will be able to make up for environmental harm ( ) People should lead simpler lives and use less technology harming the environment ( ) It is all right to sacrifice other species in order to satisfy human needs ( ) Government does a good job of protecting the environment ( ) We can trust scientists and experts to make the right decisions to protect the environment ( ) We can trust businesses to make the right decisions to protect the environment ( ) Small communities better protect the environment than large cities ( ) Industrialized nations have exploited non-‐industrialized nations ( ) Non-‐industrialized nations are not harming the environment Are you aware of any groups that are active on environmental issues on your area? ( ) Yes ( ) No ( ) I don't know If you answered “yes”, which groups were you thinking about? Do you participate in any of these groups? Sources: Adapted from Earth System Science Education, University of Oklahoma 2001 35 Appendix A: Careers related to Climate Change General Career Categories Activist Farmer Biologist Geologist Climatologist Lawyer Ecologist Marine biologist Economist Oceanographer Ornithologist Politician Sociologist Teacher Zoologist Environmental Engineering Careers Water resources management (watersheds, reservoirs, storm water management) Drinking water quality (arsenic, pharmaceuticals, pollution control systems) Water treatment (wastewater treatment, waterborne infectious disease remediation) Air quality management (pollution control systems, emissions, fate and transport) Remediation (Oil spill, hazardous material spill) Soil/land management (pollution control systems, remediation, Superfund sites, landfills) Hazardous chemicals treatment and disposal Environmental contaminant fate and transport Environmental monitoring networks Government agencies that monitor and regulate waste discharges University professor International agencies in developing world Environmental protection advocacy and policy Sources: Clarkson University’s SENSE IT workshops 36 Appendix B: Climate Change Quiz – Answer Key (Grades 6-‐12) 1. What effect traps heat next to the Earth? o The refrigeration effect o The greenhouse effect o The hothouse effect 2. Where do greenhouse gases trap energy? o In the atmosphere o In outer space o In the soil 3. What is the main man-‐made greenhouse gas? o Oxygen o Hydrogen o Carbon dioxide 4. What is the main way that carbon dioxide is made? o When it rains o When fuel is burnt o When there's a hurricane 5. What is the main way that carbon dioxide is used? o When plants use it to make food o When animals breathe it in o When fuel is burnt 6. What might happen if there is too much carbon dioxide in the atmosphere? o The temperature on Earth may go up, so there will be global warming o The temperature on Earth may go down, so there will be global cooling o The oceans may dry up, so there will be global drying 7. What do scientists study in order to learn more about past climate? o Soil sediments and rock formations o Ice layers o Tree rings o Past civilizations o All of the above 8. What do scientists study in order to learn about current and future climate? o Weather patterns o Seasonal temperatures o Rainfall o Greenhouse gases o All of the above 37 (Grades 9-‐12 only) 1. TRUE The difference between climate and weather is that Earth’s climate is the average condition in a given place over many years, whereas, weather includes only the immediate conditions for a specific place. 2. FALSE The atmosphere is a relatively thin layer of gas that scientists divide into four sections based only on chemical composition. 3. TRUE Greenhouse gases (GHGs) act like a blanket in the atmosphere, trapping heat and warming the planet. 4. FALSE The following gases are not GHGs: nitrous oxide (N2O), methane (CH4), water vapor (H20) and chlorofluorocarbons (CFCs). 5. FALSE Climate change refers only to the increasing temperature of the earth’s surface. 6. FALSE Without the human race, GHGs would not exist. 7. TRUE Human-‐caused emissions of carbon come from both the burning of fossil fuels and from land-‐use changes such as deforestation and land-‐clearing. 8. TRUE The majority of human-‐caused carbon emissions come from the burning of fossil fuels. 9. TRUE Climate change is predicted to greatly affect the natural resources (such as water) that people depend on. 10. TRUE Individual actions, such as replacing all of your old light bulbs with Compact Fluorescent light bulbs, will help reduce the amount of GHGs in the atmosphere. Sources: World Wildlife Fund Curriculum for Teachers; The Cooperative College UK Teacher Resources for Climate Change. 38 Appendix C: USGS Topographical Map Symbols 39 40 41 Appendix D: Warranty and Licensing There is no warranty, express or implied, included with the RPI sensor technology. While much of the text in this document has been borrowed from published teacher material as noted in the sources sections, the remainder is released as an Open Source initiative under a version of the Creative Commons License. For details, please contact us via our website: http://www.communitysensors.rpi.edu/?q=contact Appendix E: Contact Us For comments, complaints, and general help, please contact us via our website: http://www.communitysensors.rpi.edu/?q=contact For details regarding the RPI Environmental Sensing Group, and the NSF Triple Helix project, please contact Dr. Ron Eglash at [email protected]. For details regarding RPI-‐ES00 or the Manufacturing Design Lab at RPI, please contact Mark Anderson at [email protected]. Appendix F: The RPI Community Sensor Team Kirk Jalbert is a Ph.D. student in Science and Technology Studies at Rensselaer Polytechnic Institute. He received his M.F.A. in interactive media from the SMFA Boston, and his B.S. in Computer Science. His research uses participatory models for designing technologies to increasing public engagement in environmental sustainability. Kirk is primarily responsible for developing the workshops and can be contacted at [email protected]. Louis Gutierrez is a Ph.D. student in Computer Science at Rensselaer Polytechnic Institute where his research areas include using web and mobile technologies to interface with environmental sensors. Louis is working to help prepare students for careers in the Sciences and Engineering. Louis is primarily responsible for developing the RPI Sensor online software and can be contacted at [email protected]. Christopher Shing is a M.S. student in Electrical Engineering at Rensselaer Polytechnic Institute where he also received his B.S. As part of the Triple Helix Program, Chris works to encourage students to join the STEM fields. Chris is primarily responsible for designing the RPI Sensor and can be contacted at [email protected]. Mitch Sikapizye is a B.S. student in Mechanical Engineering student at Renselaer Polytechnic Institute and has been involved in several academic programs to promote and build interest in science and engineering among kids. Mitch is primarily responsible for constructing the RPI Sensor and can be contacted at [email protected]. Adrienne Wilson is an undergraduate RPI student conducting research and public outreach in sustainability and the environment. Adrienne is primarily responsible for the website graphic design work and can be contacted at [email protected]. 42